Attached files
| file | filename |
|---|---|
| EX-10.39 - EX-10.39 - Gannett Co., Inc. | d694452dex1039.htm |
| EX-10.37 - EX-10.37 - Gannett Co., Inc. | d694452dex1037.htm |
| EX-21 - EX-21 - Gannett Co., Inc. | d694452dex21.htm |
| EX-32.2 - EX-32.2 - Gannett Co., Inc. | d694452dex322.htm |
| EX-32.1 - EX-32.1 - Gannett Co., Inc. | d694452dex321.htm |
| EX-31.1 - EX-31.1 - Gannett Co., Inc. | d694452dex311.htm |
| EX-31.2 - EX-31.2 - Gannett Co., Inc. | d694452dex312.htm |
| EX-10.38 - EX-10.38 - Gannett Co., Inc. | d694452dex1038.htm |
Table of Contents
UNITED STATES
SECURITIES AND EXCHANGE COMMISSION
Washington, D.C. 20549
FORM 10-K
(Mark One)
| x | ANNUAL REPORT PURSUANT TO SECTION 13 OR 15(d) OF THE SECURITIES EXCHANGE ACT OF 1934 |
For the Fiscal Year Ended December 29, 2013
OR
| ¨ | TRANSITION REPORT PURSUANT TO SECTION 13 OR 15(d) OF THE SECURITIES EXCHANGE ACT OF 1934 |
For the transition period from to
Commission file number: 001-36097
New Media Investment Group Inc.
(Exact name of registrant as specified in its charter)
| Delaware |
38-3910250 | |
| (State or other jurisdiction of incorporation or organization) |
(I.R.S. Employer Identification No.) | |
| 1345 Avenue of the Americas, New York, New York |
10105 | |
| (Address of principal executive offices) | (Zip Code) | |
Telephone: (212) 479-3160
(Registrant’s telephone number, including area code)
Securities Registered Pursuant to Section 12(b) of the Act:
| Title of each class: |
Name of each exchange on which registered: | |
| Common stock, par value $0.01 per share | New York Stock Exchange |
Securities Registered Pursuant to Section 12(g) of the Act:
None
Indicate by check mark if the registrant is a well-known seasoned issuer, as defined in Rule 405 of the Securities Act. Yes ¨ No x
Indicate by check mark if the registrant is not required to file reports pursuant to Section 13 or Section 15(d) of the Act. Yes ¨ No x
Indicate by check mark whether the registrant: (1) has filed all reports required to be filed by Section 13 or 15(d) of the Securities Exchange Act of 1934 during the preceding 12 months (or for such shorter period that the registrant was required to file such reports), and (2) has been subject to such filing requirements for the past 90 days. Yes ¨ No x
Indicate by check mark whether the registrant has submitted electronically and posted on its corporate Web site, if any, every Interactive Data File required to be submitted and posted pursuant to Rule 405 of Regulation S-T (§232.405 of this chapter) during the preceding 12 months (or such shorter period that the registrant was required to submit and post such files). Yes ¨ No ¨
Indicate by check mark if disclosure of delinquent filers pursuant to Item 405 of Regulation S-K (§229.405 of this chapter) is not contained herein, and will not be contained, to the best of registrant’s knowledge, in definitive proxy or information statements incorporated by reference in Part III of this Form 10-K or any amendment to this Form 10-K. x
Indicate by check mark whether the registrant is a large accelerated filer, an accelerated filer, a non-accelerated filer, or a smaller reporting company. See definitions of “large accelerated filer”, “accelerated filer” and “smaller reporting company” in Rule 12b-2 of the Exchange Act.
| Large accelerated filer ¨ |
Accelerated filer ¨ | Non-accelerated filer x | Smaller reporting company ¨ |
Indicate by check mark whether the registrant is a shell company (as defined in Rule 12b-2 of the Exchange Act). Yes ¨ No x
The aggregate market value of the voting common equity held by non-affiliates on March 4, 2014 was $448,500,000. The Registrant was not a public company as of the last business day of its most recently completed second fiscal quarter and, therefore, cannot calculate the aggregate market value of its voting and non-voting common equity held by non-affiliates as of such date.
As of March 4, 2014, 30,000,000 shares of the registrant’s common stock were outstanding.
Table of Contents
NEW MEDIA INVESTMENT GROUP INC.
FORM 10-K
FOR THE YEAR ENDED DECEMBER 29, 2013
i
Table of Contents
CAUTIONARY NOTE REGARDING FORWARD LOOKING INFORMATION
Certain statements in this report on Form 10-K may constitute forward-looking statements within the meaning of the Private Securities Litigation Reform Act of 1995 that reflect our current views regarding, among other things, our future growth, results of operations, performance and business prospects and opportunities, as well as other statements that are other than historical fact. Words such as “anticipate(s),” “expect(s)”, “intend(s)”, “plan(s)”, “target(s)”, “project(s)”, “believe(s)”, “will”, “aim”, “would”, “seek(s)”, “estimate(s)” and similar expressions are intended to identify such forward-looking statements.
Forward-looking statements are based on management’s current expectations and beliefs and are subject to a number of known and unknown risks, uncertainties and other factors that could lead to actual results materially different from those described in the forward-looking statements. We can give no assurance that our expectations will be attained. Our actual results, liquidity and financial condition may differ from the anticipated results, liquidity and financial condition indicated in these forward-looking statements. These forward looking statements are not a guarantee of future performance and involve risks and uncertainties, and there are certain important factors that could cause our actual results to differ, possibly materially from expectations or estimates reflected in such forward-looking statements, including, among others:
| • | general economic, market and political conditions; |
| • | the potential adverse effects of the Restructuring (as defined below); |
| • | the risk that we may not realize the anticipated benefits of the Local Media Acquisition (as defined below) or potential future acquisitions; |
| • | the availability and cost of capital for future investments; |
| • | our ability to pay dividends; |
| • | our ability to realize the benefits of the Management Agreement (as defined below); |
| • | the competitive environment in which we operate; |
| • | our ability to grow our digital business and digital audience and advertiser base; |
| • | our ability to recruit and retain key personnel. |
Additional risk factors that could cause actual results to differ materially from our expectations include, but are not limited to, the risks identified by us under the heading “Risk Factors” in Item 1A of this report. Such forward-looking statements speak only as of the date on which they are made. Except to the extent required by law, we expressly disclaim any obligation to release publicly any updates or revisions to any forward-looking statements contained herein to reflect any change in our expectations with regard thereto or change in events, conditions or circumstances on which any statement is based.
ii
Table of Contents
| Item 1. | Business |
General Overview
New Media Investment Group Inc. (“New Media,” “Company,” “us,” or “we”), was formed as a Delaware corporation on June 18, 2013. Pursuant to the Restructuring (as defined below), Newcastle Investment Corp. (“Newcastle”) owned approximately 84.6% of New Media until February 13, 2014, upon which date Newcastle distributed the shares that it held in New Media to its shareholders on a prorata basis. New Media had no operations until November 26, 2013, when it assumed control of GateHouse Media, LLC (formerly known as GateHouse Media, Inc.) (“GateHouse” or “Predecessor”) and Local Media Group Holdings LLC (“Local Media Parent”). GateHouse was determined to be the predecessor to New Media, as the operations of GateHouse comprise substantially all of the business operations of the combined entities. Both New Media and Newcastle are externally managed and advised by an affiliate of Fortress Investment Group LLC (“Fortress”).
New Media is a newly listed company that owns, operates and invests in high quality local media assets. We have a particular focus on owning and acquiring strong local media assets in small to mid-size markets. With our collection of assets, we focus on two large business categories; consumers and small to medium size businesses (“SMBs”).
Our portfolio of media assets today spans across 352 markets and 24 states. Our products include 421 community print publications, 350 websites, 333 mobile sites and six yellow page directories. We reach over 12 million people per week and serve over 130,000 business customers.
We are focused on growing our consumer revenues primarily through our penetration into the local consumer market that values comprehensive local news and receives their news primarily from our products. We believe our rich local content, our strong media brands, and multiple platforms for delivering content will impact our reach into the local consumers leading to growth in subscription income. We also believe our local consumer penetration will lead to transaction revenues as we link consumers with local businesses. For our SMB business category, we focus on leveraging our strong local media brands, our in-market sales force and our high consumer penetration rates with a variety of products and services that we believe will help SMBs expand their marketing, advertising and other digital lead generation platforms.
Our business strategy is to be the preeminent provider of local news, information, advertising and digital services in the markets we operate in today. We aim to grow our business organically through what we believe are both our consumer and SMB strategies. We also plan to pursue strategic acquisitions of high quality local media assets at attractive valuation levels. Finally, we intend to periodically distribute a substantial portion of our free cash flow as a dividend to stockholders, subject to satisfactory financial performance, approval by our board of directors (the “Board of Directors”) and dividend restrictions in both the GateHouse Credit Facilities (as defined below) and Local Media Credit Facility (as defined below). The Board of Directors’ determinations regarding dividends will depend on a variety of factors, including the Company’s U.S. generally accepted accounting principles (“GAAP”) net income, free cash flow generated from operations or other sources, liquidity position and potential alternative uses of cash, such as acquisitions, as well as economic conditions and expected future financial results. The availability of free cash flow for the payment of dividends is also subject to restrictions in both the GateHouse and Local Media Credit Facilities.
We believe that our focus on owning and operating dominant local-content-oriented media properties in small to mid-size markets puts us in a position to better execute our strategy. We believe that being the dominant provider of local news and information in the markets in which we operate and distributing that content across multiple print and digital platforms, gives us an opportunity to grow our audiences and reach. Further, we believe our strong local media brands and our in-market sales presence gives us the opportunity to expand our advertising and lead generation products with local business customers.
1
Table of Contents
Central to our business strategy is our digital marketing services business called Propel Marketing (“Propel”). We launched the business in 2012 and have seen rapid growth since then. We believe Propel and its digital marketing service products will be a key component to our overall organic growth strategy.
We believe that Propel will allow us to capitalize on the following opportunities in the marketplace:
There are approximately 27 million SMBs in the U.S. according to the 2011 U.S. Census data. Of these, approximately 26.7 million have 20 employees or less.
Many of the owners and managers of these SMBs do not have the bandwidth, expertise or resources to navigate the fast evolving digital marketing sector, but are increasingly aware of the need to establish and maintain a digital presence in order to stay connected with current and future customers.
Propel is designed to offer a complete set of turn-key digital marketing services to SMBs that provides transparent results to the business owners. Propel provides four broad categories of services: building businesses a presence, helping businesses to be located by consumers online, engaging with consumers, and growing their customer base.
We believe our local media properties are uniquely positioned to sell these digital marketing services to local business owners. Our strong and trusted local brands, combined with our in-market sales presence give us a distinct advantage to sell these services, which are new and can be complicated to local business owners.
Our core products include:
| • | 85 daily newspapers with total paid circulation of approximately 736,000; |
| • | 240 weekly newspapers (published up to three times per week) with total paid circulation of approximately 300,000 and total free circulation of approximately 680,000; |
| • | 96 “shoppers” (generally advertising-only publications) with total circulation of approximately 1.9 million; |
| • | 350 locally focused websites and 333 mobile sites, which extend our businesses onto the internet and mobile devices with approximately 100 million page views per month; |
| • | six yellow page directories, with a distribution of approximately 432,000, that cover a population of approximately 1.1 million people; and |
| • | Propel digital marketing services. |
Our print and online products focus on the local community from a content, advertising, and digital marketing perspective. As a result of our focus on small and midsize markets, we are usually the primary, and sometimes, the sole provider of comprehensive and in-depth local market news and information in the communities we serve. Our content is primarily devoted to topics that we believe are highly relevant and of interest to our audience such as local news and politics, community and regional events, youth sports, opinion and editorial pages, local schools, obituaries, weddings and police reports.
More than 84% of our daily newspapers have been published for more than 100 years and 100% have been published for more than 50 years. We believe that the longevity of our publications demonstrates the value and relevance of the local information that we provide and has created a strong foundation of reader loyalty and a highly recognized media brand name in each community we serve. As a result of these factors, we believe that our publications have high local audience penetration rates in our markets, thereby providing advertisers with strong local market reach.
We believe the large number of publications we have, our focus on smaller markets, and our geographic diversity also provide the following benefits to our strategy:
| • | Diversified revenue streams, both in terms of customers and markets; |
2
Table of Contents
| • | Operational efficiencies realized from clustering of business assets; |
| • | Operational efficiencies realized from centralization of back office functions; |
| • | Ability to provide consistent management practices and ensure best practices; and |
| • | Less competition and high barriers to entry. |
The newspaper industry has experienced declining revenue and profitability dating back to 2007 due to, among other things, advertisers’ shift from print to digital media and general market conditions. Our Predecessor was affected by this trend and has experienced a history of net operating losses. For the fiscal year ended December 30, 2012, our Predecessor experienced a net loss of $29.8 million.
Our revenues derived from our SMB category come from a variety of print and digital advertising products, digital service products we offer through our Propel business, and commercial printing services. Our consumer category revenue comes primarily from subscription income as consumers pay for our deep, rich local contents, both in print and online, however primarily print today.
Our operating costs consist primarily of labor, newsprint, and delivery costs. Our selling, general and administrative expenses consist primarily of labor costs. Compensation represents just over 50% of our operating expenses. Over the last few years, we have worked to drive efficiencies through centralization of back office functions, outsourcing and leveraging our scale to purchase more effectively. Additionally, we have taken steps to cluster our operations, thereby increasing the usage of facilities and equipment while increasing the productivity of our labor force. We expect to continue to employ these steps as part of our business and clustering strategy.
Local Media Acquisition
Newcastle acquired Local Media Group Inc. (formerly known as Dow Jones Local Media Group, Inc.) (“Local Media”) on September 3, 2013 from News Corp. Inc. and contributed to New Media 100% of the stock of Local Media Parent (which owns all of Local Media’s stock) on GateHouse’s emergence from bankruptcy on November 26, 2013 (the “Effective Date”) of the Plan (as defined below). Local Media is the publisher of locally-based print and online media. Local Media publishes eight daily community newspapers and seventeen weekly papers in seven states in the New England, Mid-Atlantic and Pacific Coast regions of the United States. Local Media also publishes associated internet sites, magazines and other news and advertising niche publications and offers commercial print and household distribution services. During the period ended December 29, 2013, the Local Media portfolio of products had a combined average circulation of 195,000 daily, as well as 180,734 average daily unique visitors to its local websites. Local Media has five print production facilities which are located in Hyannis, Massachusetts; Middletown, New York; Medford, Oregon; Portsmouth, New Hampshire; and Stockton, California.
In exchange for the contribution of Local Media, Newcastle received shares of common stock, par value $0.01 per share, of New Media (“New Media Common Stock” or our “Common Stock”), equal in value to the cost of the acquisition of Local Media by Newcastle (“Local Media Acquisition”). Local Media Parent is now a wholly owned subsidiary of New Media.
GateHouse manages the assets of Local Media pursuant to a management and advisory agreement. The agreement has a two-year term, with automatic renewal for successive two-year periods unless terminated. While the agreement is in effect, GateHouse will receive an annual management fee of $1.1 million, subject to adjustments (up to a maximum annual management fee of $1.2 million), and an annual incentive compensation fee based on exceeding EBITDA targets of Local Media.
On the Effective Date, New Media entered into a management agreement with FIG LLC (the “Manager”) (the “Management Agreement”) pursuant to which the Manager will manage the operations of New Media. The annual management fee will be 1.50% of New Media’s gross equity as set forth in the Management Agreement and the Manager is eligible to receive incentive compensation.
3
Table of Contents
Restructuring and Spin-off from Newcastle Investment Corp.
We acquired our operations as part of the restructuring (the “Restructuring”) of our Predecessor, GateHouse. On September 27, 2013 (the “Petition Date”), GateHouse commenced the Restructuring in which it sought confirmation of its bankruptcy plan sponsored by Newcastle, as the holder of the majority of the Outstanding Debt (as defined as follows). The Plan relates to the Restructuring of our Predecessor’s obligations under the amended and restated credit agreement by and among certain affiliates of GateHouse, the lenders from time to time thereto and Cortland Products Group, as administrative agent, dated February 27, 2007 (as amended, the “2007 Credit Facility”) and certain interest rate swaps (collectively, the “Outstanding Debt”). The Bankruptcy Court confirmed the reorganization plan (the “Plan”) on November 6, 2013 and GateHouse consequently emerged from Chapter 11 protection on November 26, 2013.
Pursuant to the Restructuring, Newcastle offered to purchase the Outstanding Debt in cash and at 40% of (i) $1,167 million of principal claims under the 2007 Credit Facility, plus (ii) accrued and unpaid interest at the applicable contract non-default rate with respect thereto, plus (iii) all amounts, excluding any default interest, arising from transactions in connection with interest rate swaps secured under the 2007 Credit Facility (the “Cash-Out Offer”) on the Effective Date. The holders of the Outstanding Debt had the option of receiving, in satisfaction of their Outstanding Debt, their pro rata share of the (i) Cash-Out Offer and/or (ii) New Media Common Stock and net proceeds, if any, of the GateHouse Credit Facilities. All pensions, trade and all other unsecured claims will be paid in the ordinary course.
On the Effective Date (i) GateHouse became our wholly-owned subsidiary as a result of (a) the cancellation and discharge of the currently outstanding equity interests in GateHouse (the holders of which received warrants issued by New Media) and (b) the issuance of equity interests in the reorganized GateHouse to New Media; (2) Local Media Parent, which was a wholly-owned subsidiary of Newcastle, following the Local Media Acquisition became a wholly-owned subsidiary of New Media as a result of Newcastle’s transfer of Local Media Parent to New Media; (3) New Media entered into the Management Agreement with our Manager, (4) New Media entered into the GateHouse Management and Advisory Agreement (the “GateHouse Management Agreement”) with GateHouse; and (5) all of GateHouse’s Outstanding Debt was cancelled and discharged and the holders of the Outstanding Debt received, at their option, their pro rata share of the (i) Cash-Out Offer and/or (ii) New Media Common Stock and the net proceeds of the GateHouse Credit Facilities. Pursuant to the Cash-Out Offer, Newcastle offered to buy the claims of the holders of the Outstanding Debt. As a result of these transactions, Newcastle owned 84.6% of New Media as of the Effective Date.
On September 27, 2013, Newcastle announced that its board of directors unanimously approved a plan to spin-off our Company. Newcastle’s board of directors made the determination to spin-off our assets because it believed that our value can be increased over time through a strategy aimed at acquiring local media assets and organically growing our digital marketing business. In order to effect the separation and spin-off of our Company, we filed a registration statement on Form S-1, as amended, which was declared effective by the Securities and Exchange Commission (the “SEC”) on January 30, 2014.
Each share of Newcastle common stock outstanding as of 5:00 PM, Eastern Time, on February 6, 2014, the Record Date, entitled the holder thereof to receive 0.07219481485 shares of our Common Stock (the “Distribution” or the “spin-off”). The spin-off was completed on February 13, 2014, the Distribution Date. Immediately thereafter, we became publicly traded company independent from Newcastle trading on the New York Stock Exchange under the ticker symbol “NEWM.”
4
Table of Contents
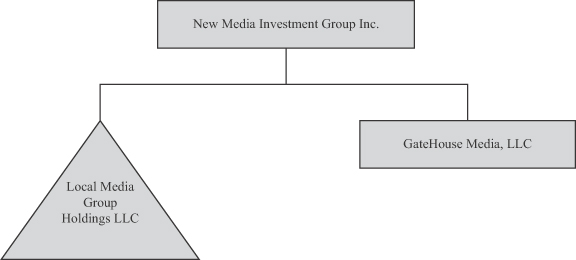
Corporate Entity Structure
The chart below sets forth our entity structure and that of our direct and indirect subsidiaries. This chart does not include all of our affiliates and subsidiaries and, in some cases, we have combined separate entities for presentation purposes.
Industry Overview
We operate in what is sometimes referred to as the “hyper-local” or community news market and market within the media industry. Media companies that serve this segment provide highly focused local content and advertising that is generally unique to each market they serve and is not readily obtainable from other sources. Local publications include community newspapers, websites, shoppers, traders, real estate guides, special interest magazines and directories. Due to the unique local nature of their content and audience, community publications compete for advertising customers with other forms of traditional media, including direct mail, directories, radio, television, and outdoor advertising. They also compete with new local and national digital and social media businesses for advertising, digital services and customers. We believe that local print and online publications in smaller markets are the most effective medium for local retail advertising, which emphasizes the price of goods in an effort to move inventory on a regular basis, in contrast to radio, broadcast and cable, television, and the internet, which are generally used for image or branding advertising. In addition, we believe local print and online publications generally have the highest local audience penetration rates, which allows local advertisers to get their message to a large portion of the local audience. Finally, national digital competitors tend to have no local in-market sales presence which we believe gives the local community publications an advantage when selling these types of products and services.
Locally focused media in small and midsize communities is distinct from national and urban media delivered through outlets such as television, radio, metropolitan and national newspapers and the internet. Larger media outlets tend to offer broad based information to a geographically scattered audience, which tends to be more of a commodity. In contrast, locally focused media delivers a highly focused product that is often the only source of local news and information in the market it serves. Our segment of the media industry is also characterized by high barriers to entry, both economic and social. Small and midsize communities can generally only sustain one newspaper. Moreover, the brand value associated with long-term reader and advertiser loyalty, and the high start-up costs associated with developing and distributing content and selling advertisements, help to limit competition.
We also believe there is a growing need among small to mid-size businesses to be able to generate leads and interact with consumers across all the digital platforms, which takes many forms including websites, mobile sites,
5
Table of Contents
tablets and social media. These local business owners and managers lack the time, expertise and resources to capitalize on the potential of these new consumer-reaching channels. National competitors in this category do not generally have a local in-market presence. We believe this represents a substantial opportunity for our local media business.
Advertising Market
The primary sources of advertising revenue for local publications are small businesses, corporations, government agencies and individuals who reside in the market that a publication serves. By combining paid circulation publications with total market coverage publications such as shoppers and other specialty publications (tailored to the specific attributes of a local community), local publications are able to reach nearly 100% of the households in a distribution area. As macroeconomic conditions in advertising change due to increasing internet and mobile usage and the wide array of available information sources, we have seen advertisers shift their focus to incorporate a digital advertising and services component into their overall local marketing strategy. To that end, in addition to printed products, the majority of our local publications have an online presence that further leverages the local brand, ensures higher penetration into the market, and provides a digital alternative for local advertisers to reach consumers. We also have a strong digital marketing services business, Propel.
Digital Media
The time spent online and on mobile devices each day by media consumers continues to grow and newspaper web and mobile sites offer a wide variety of content providing comprehensive, in-depth and up to the minute coverage of news and current events. The ability to generate, publish and archive more news and information than most other sources has allowed newspapers to produce some of the most visited sites on the internet. Newspaper websites have proven to be some of the most visited websites by online media news consumers.
We believe that our local publications are well positioned to capitalize on their existing market presence and grow their total audience base by publishing proprietary local content digitally: via the internet, mobile websites and mobile applications. Local digital media include traditional classifieds, directories of business information, local advertising, databases, audience-contributed content and mobile applications. We believe this additional community-specific content will further extend and expand both the reach and the brand of our publications with readers and advertisers. We believe that building a strong local digital business extends the core audience of a local publication.
The opportunity created by the digital extension of the core audience makes local digital advertising an attractive complement for existing print advertisers, while opening up opportunities to attract new local advertisers that have not previously advertised with local publications. In addition, we believe that national advertisers have an interest in reaching buyers on a hyper-local level and, although they historically have not been significant advertisers in community publications, we believe the digital media offers them a powerful medium to reach local audiences. This opportunity is further enhanced by our behavioral targeting products, which allow advertisers to reach specific demographics of our audience and follow that audience across multiple websites, delivering advertisements across the platforms. Further, digital marketing services businesses are poised to benefit from the rise in internet marketing spend, with newspaper digital marketing services revenue growing 11% between 2011 and 2012, and 208% between 2005 and June 30, 2013, according to the 2013 IAB Internet Advertising Revenue Report.
We believe that a strong digital business will enhance our revenues. In addition, we believe that we have the expertise and sales resource to help other businesses maximize their digital opportunities. Accordingly, we have launched our digital marketing services business, Propel, designed to help SMBs utilize the digital space to generate leads, interact with consumers and grow their businesses. New Media’s digital revenue derived from
6
Table of Contents
advertising circulation and other revenue have grown since the launch of Propel in 2012. New Media’s digital revenue was $48.6 million for the year ended December 29, 2013, a 22.4% growth as compared with the same period in 2012, which had digital revenue of $39.7 million. Of this, $6.4 million, or 13.2% of digital revenue for the year ended December 29, 2013 was attributable to Propel. See “Risk Factors—Risks Related to Our Business—We have invested in growing our digital business, but such investments may not be successful, which could adversely affect our results of operations.”
We anticipate that the digital marketing services sector will continue to grow as SMBs move from print to digital marketing in connection with consumers spending more time online. According to the 2011 U.S. Census data, there are approximately 27 million SMBs in the US, 26.7 million of the SMBs have 20 employees or less, and these businesses are expected to spend $24 billion on digital marketing by 2015 (according to the 2011 U.S. SMB Spending Forecast by BIA/Kelsey). Owners of these businesses often lack the bandwidth to navigate the digital marketing sector. Recent studies done by Google Places For Businesses in 2012 and the Small Business Sentiment Survey by Yodle in 2013 indicate that although 89% of consumers expect all businesses to have a website and 97% of consumers search for local businesses online, 52% of SMBs do not have a website and 90% do not have a mobile website. Further, 60% of SMBs with websites were found to not have a phone number on their website according to the 2012 BIA Kelsey. Propel offers SMBs digital services, including website design, search engine optimization, mobile websites, social media, retargeting and other advertising services. Our Predecessor believed, and we too believe, that Propel is well positioned to assist SMBs in the digital space and expects Propel to contribute meaningfully to future revenue growth. Propel is also able to leverage the more than 1,000 New Media sales representatives within the local markets served.
Circulation
Overall daily newspaper print circulation, including national and urban newspapers, has been declining slowly over the past several years. Small and midsize local market newspapers have generally had smaller declines and more stability in their paid print circulation volumes due to the relevant and unique hyper-local news they produce. In addition, this unique and valuable hyper-local content along with multiple delivery platforms now available will allow smaller market newspapers to continue to raise prices, leading to stable circulation revenues. Data and technology now available to newspapers allow them to target pricing more at the household level rather than purely by market. This will lead to more effective pricing strategies and enhance stability for circulation revenues. According to the Newspaper Association of America, pay meters and pricing helped the newspaper industry grow circulation revenue by 5% from 2011 to 2012.
Our Strengths
High Quality Assets with Leading Local Businesses. Our publications benefit from a long history in the communities we serve as one of the leading, and often sole, providers of comprehensive and in-depth local content. This has resulted in brand recognition for our publications, reader loyalty and high local audience penetration rates, which are highly valued by local advertisers. We continue to build on long-standing relationships with local advertisers and our in-depth knowledge of the consumers in our local markets.
Large Locally Focused Sales Force. We have large and well known “in-market” local sales forces in the markets we serve, consisting of over 1,000 sales representatives, including 35 dedicated to Propel and 14 third party sales affiliations. Our sales forces are generally among the largest locally oriented media sales forces in their respective communities. We have long-standing relationships with many local businesses and have the ability to be face to face with most local businesses due to these unique characteristics we enjoy. We believe our strong brands combined with our “in-market” presence give us a distinct advantage in selling and growing in the digital services sector given the complex nature of these products. We also believe that these qualities provide leverage for our sales force to grow additional future revenue streams in our markets.
Ability to Acquire and Integrate New Assets. We have created a national platform for consolidating local media businesses and have demonstrated an ability to successfully identify, acquire and integrate local media
7
Table of Contents
asset acquisitions. We have acquired over $1.7 billion of assets since 2006. We have acquired both traditional newspaper and directory businesses. We have a very scalable infrastructure and platform to leverage for future acquisitions.
Scale Yields Operating Profit Margins and Allows Us to Realize Operating Synergies. We believe we can generate higher operating profit margins than our publications could achieve on a stand-alone basis by leveraging our operations and implementing revenue initiatives, especially digital initiatives, across a broader local footprint in a geographic cluster and by centralizing certain back office production, accounting, administrative and corporate operations. We also benefit from economies of scale in the purchase of insurance, newsprint and other large strategic supplies and equipment. Finally, we have the ability to further leverage our centralized services and buying power to reduce operating costs when making future strategic accretive acquisitions.
Local Business Profile Generates Significant Cash Flow. Our local business profile will allow us to generate significant recurring cash flow due to our diversified revenue base, high operating profit margins and our low capital expenditure and working capital requirements. As a result of the Restructuring, which extinguished GateHouse’s Outstanding Debt, our interest and debt servicing expenses are significantly lower than GateHouse’s interest and debt servicing expenses. As of the Effective Date, our debt structure consists of the GateHouse Credit Facilities and the Local Media Credit Facility. We currently estimate that we will have significant available cash flow totaling $50 to $70 million in 2014 which we believe will create stockholder value through our investments in organic growth, investments in accretive acquisitions and the return of cash to stockholders in the form of dividends, subject to approval by our Board of Directors. We further believe the strong cash flows generated and available to be invested will lead to consistent future dividend growth.
Experienced Management Team. Our senior management team is made up of executives who have an average of over 20 years of experience in the media industry, including strong traditional and digital media expertise. Our executive officers have broad industry experience with regard to both growing new digital business lines and identifying and integrating strategic acquisitions. Our management team also has key strengths in managing wide geographically disbursed teams, including the sales force, and identifying and centralizing duplicate functions across businesses leading to reduced core infrastructure costs.
Our Strategy
We intend to create stockholder value through a variety of factors including organic growth driven by our consumer and SMB strategies, pursuing attractive strategic acquisitions of high quality local media assets, and through the distribution of a substantial portion of our free cash flow as a dividend. However, there is no guarantee that we will be able to accomplish any of these strategic initiatives.
Our strategy will be to acquire and operate traditional local media businesses and transform them from print-centric operations to dynamic multi-media operations through our existing online advertising and digital marketing services businesses. We will also leverage our existing platform to operate these businesses more efficiently. We believe all of these initiatives will lead to revenue and cash flow growth for New Media and will enable us to pay dividends to our stockholders. We expect to distribute a substantial portion of our free cash flow as a dividend to stockholders, subject to satisfactory financial performance and approval by our Board of Directors. The Board of Directors’ determinations regarding dividends will depend on a variety of factors, including the Company’s GAAP net income, free cash flow generated from operations or other sources, liquidity position and potential alternative uses of cash, such as acquisitions, as well as economic conditions and expected future financial results. The availability of free cash flow for the payment of dividends is also subject to restrictions in both the GateHouse Credit Facilities and Local Media Credit Facility. The key elements of our strategy include:
Maintain Our Leading Position in the Delivery of Proprietary Content in Our Communities. We seek to maintain our position as a leading provider of local content in the markets we serve and to leverage this position to strengthen our relationships with both readers and local businesses, thereby increasing penetration rates and
8
Table of Contents
market share. A critical aspect of this approach is to continue to provide local content that is not readily obtainable elsewhere and to be able to deliver that content to our customers across multiple print and digital platforms.
Grow Our New Digital Marketing Services Business. We plan to scale and expand our new recently created digital marketing services businesses, Propel. We believe Propel will allow us to sell digital marketing services to SMBs both in and outside existing New Media markets. The SMB demand for digital service solutions is great and represents a rapidly expanding opportunity. According to 2011 U.S. census data, there are approximately 27 million SMBs in the U.S. and, according to a 2011 U.S. SMB Spending forecast by BUIA/Kelsey, these businesses are expected to spend $24 billion on digital marketing by 2015. Owners of these businesses often lack the bandwidth to navigate the digital marketing sector, with 52% of SMBs not having a website and 90% not having mobile-friendly websites according to a Yodle Small Business Sentiment Survey in 2013.
Pursue Strategic Accretive Acquisitions. We intend to capitalize on the highly fragmented and distressed newspaper and directory industries which have greatly reduced valuation levels. We initially expect to focus our investments in the local newspaper and yellow page directory sectors, in small to mid-size markets. We believe we have a strong operational platform as well as a scalable digital marketing services business, Propel. This platform, along with deep industry specific knowledge and experience that our management team has can be leveraged to reduce costs, stabilize the core business and grow digital revenues at acquired properties. The size and fragmentation of the addressable newspaper and yellow page directory market place in the United States, the greatly reduced valuation levels that exist in these industries, and our deep experience make this an attractive place for our initial consolidation focus and capital allocation. Over the longer term we also believe there may be opportunity to diversify and acquire these types of assets internationally, as well as other traditional local media assets such as broadcast TV, out of home advertising (billboards) and radio, in the United States and internationally.
Stabilize Our Core Business Operations. We have four primary drivers in our strategic plans to stabilize our core business operations, including: (i) identifying permanent structural expense reductions in our traditional business cost infrastructure and re-deploying a portion of those costs toward future growth opportunities, primarily on the digital side of our business; (ii) accelerating the growth of both our digital audiences and revenues through improvements to current products, new product development, training, opportunistic changes in hiring to create an employee base with a more diversified skill set and sharing of best practices; (iii) accelerating our consumer revenue growth through subscription pricing increases, pay meters for digital content and growth in our overall subscriber base; and (iv) stabilizing our core print advertising revenues through improvements to pricing, packaging of products for customers that will produce the best results for them, and more technology and training for sales management and sales representatives.
The newspaper industry has experienced declining revenue and profitability over the past several years due to, among other things, advertisers’ shift from print to digital media following the consumer shift, and general market conditions. GateHouse, our Predecessor, was affected by this trend and experienced net losses of $160.8 million during the nine month period ended September 29, 2013 and $29.8 million during the fiscal year ended December 30, 2012. Total revenue decreased by 1.9% to $356.2 million for the nine months ended September 29, 2013 and 5.1% to $488.6 million for the year ended December 30, 2012. The Restructuring significantly reduced New Media’s interest expense. In addition, New Media intends to focus its business strategy on building its digital marketing business and growing its online advertising business, which we believe will offset many of the challenges experienced by GateHouse. With its new capital structure and digital focus, we believe that New Media will be able to create stockholder value given its strengths and strategy. However, there can be no assurance that we will be profitable. See “Risk Factors” under Item 1A of this Annual Report on Form 10-K.
9
Table of Contents
Challenges
We will likely face challenges commonly encountered by recently reorganized entities, including the risks that even under our new capital structure, we may not be profitable.
As a publisher of locally based print and online media, we face a number of additional challenges, including the risks that:
| • | the growing shift within the publishing industry from traditional print media to digital forms of publication may compromise our ability to generate sufficient advertising revenues; |
| • | investments in growing our digital business may not be successful, which could adversely affect our results of operations; and |
| • | our advertising and circulation revenues may decline if we are unable to compete effectively with other companies in the local media industry. |
For more information about New Media’s risks and challenges, see “Risk Factors” under Item 1A of this Annual Report on Form 10-K.
Products
Our product mix consists of four publication types: (i) daily newspapers, (ii) weekly newspapers, (iii) shoppers and (iv) niche publications. Most of these publications have a digital presence as discussed in the following table. Some of the key characteristics of each of these types of publications are also summarized in the table below.
| Daily Newspapers |
Weekly Newspapers |
Shoppers |
Niche Publications | |||||
| Cost: |
Paid | Paid and free | Paid and free | Paid and free | ||||
| Distribution: |
Distributed four to seven days per week | Distributed one to three days per week | Distributed weekly | Distributed weekly, monthly or on annual basis | ||||
| Format: |
Printed on newsprint, folded | Printed on newsprint, folded | Printed on newsprint, folded or booklet | Printed on newsprint or glossy, folded, booklet, magazine or book | ||||
| Content: |
50% editorial (local news and coverage of community events, some national headlines) and 50% ads (including classifieds) | 50% editorial (local news and coverage of community events, some national headlines for smaller markets which cannot support a daily newspaper) and 50% ads (including classifieds) | Almost 100% ads, primarily classifieds, display and inserts | Niche content and targeted ads (e.g., Chamber of Commerce city guides, tourism guides and special interest publications such as, seniors, golf, real estate, calendars and directories) | ||||
| Income: |
Revenue from advertisers, subscribers, rack/box sales | Paid: Revenue from advertising, subscribers, rack/box sales | Paid: Revenue from advertising, rack/box sales | Paid: Revenue from advertising, rack/box sales | ||||
| Free: Advertising revenue only, provide 100% market coverage. | Free: Advertising revenue only, provide 100% market coverage | Free: Advertising revenue only | ||||||
| Internet Availability: | Maintain locally oriented websites, mobile sites and mobile apps, for select locations | Major publications maintain locally oriented websites and mobile sites for select locations | Major publications maintain locally oriented websites | Selectively available online | ||||
10
Table of Contents
Overview of Operations
We operate in four publication groups: Small Community Newspapers, Metros, Large Daily Newspapers and Local Media. We also operate over 350 related websites and 333 mobile sites.
The following table sets forth information regarding our publications.
| Number of Publications | Circulation (1) | |||||||||||||||||||||||
| Operating Group |
Dailies | Weeklies | Shoppers | Paid | Free | Total Circulation |
||||||||||||||||||
| Small Community Newspapers |
58 | 103 | 69 | 290,514 | 1,150,795 | 1,441,309 | ||||||||||||||||||
| Metro Newspapers |
7 | 117 | 7 | 253,279 | 483,391 | 736,670 | ||||||||||||||||||
| Large Daily Newspapers |
12 | 3 | 12 | 255,299 | 550,491 | 805,790 | ||||||||||||||||||
| Local Media |
8 | 17 | 8 | 237,970 | 428,883 | 666,853 | ||||||||||||||||||
|
|
|
|
|
|
|
|
|
|
|
|
|
|||||||||||||
| Total |
85 | 240 | 96 | 1,037,062 | 2,613,560 | 3,650,622 | ||||||||||||||||||
| (1) | Circulation statistics are estimated by our management as of December 29, 2013. |
Small Community Newspaper Group. Our Small Community Newspaper group encompasses publications typically located in communities that have a population less than 35,000 people, in the states of Illinois, Missouri, Kansas, Michigan, California, Minnesota, Arkansas, New York, Louisiana, Pennsylvania, West Virginia, Colorado, Nebraska, Oklahoma, North Dakota, Tennessee, and Iowa. There are a total of 58 daily newspapers, 103 weekly newspapers and 69 shoppers. In addition to a good geographic mix, we benefit from a diverse economic and employment base across this group.
From the western shore of Lake Michigan to the eastern shore of the Mississippi River and running over 400 miles north to south, Illinois is a picture of manufacturing, agricultural and recreational diversity. Coupled with major daily newspapers from our Large Daily Newspaper Group in Rockford, Peoria, and the state capital of Springfield, we are the largest publishing company in Illinois. Twenty paid daily newspapers, 30 paid weekly newspapers, and 20 shoppers provide coverage across the state which, is supported by four print production facilities.
La Junta in the southeastern part of the state represents the Colorado properties. Along with La Junta we also serve Bent County and Fowler and produce the weekly agricultural newspaper, The Ag Journal.
We are represented in California by two daily newspapers in Ridgecrest and Yreka, five paid weekly papers in Dunsmuir, Mt. Shasta, Weed, Gridley and Taft, and three shoppers in Gridley, Mt. Shasta, Ridgecrest and Yreka. These publications reach from northern California through the southern desert and China Lake naval base in Ridgecrest.
The greatest concentration of circulation and market presence in Missouri is in the northern part of the state where we operate seven daily newspapers, four weekly newspapers and five shoppers. We serve the 22,000 square mile area from Hannibal, on the state’s eastern border, to the western border and from Columbia in the south to the Iowa border in the north. Local employers include the University of Missouri and other colleges, local and federal governments, State Farm Insurance and 3M.
Our southern Missouri operations are clustered around Lake of the Ozarks and Joplin. Located midway between Kansas City and St. Louis and approximately 90 miles from Springfield, Missouri, our three daily newspapers, seven weekly newspapers and three shoppers that serve the Lake of the Ozarks area reach approximately 165,000 people.
Located in southwest Missouri and southeast Kansas is our Joplin cluster with three daily and four weekly newspapers and four shoppers, serving a population of approximately 170,000. There are several colleges and universities in the area, a National Guard Fort, several large medical centers and a diverse mix of retail businesses, including the 120-store Northpark Mall.
11
Table of Contents
This group also includes our Kansas City cluster with six publications (two daily and two weekly newspapers and two shoppers) located in the eastern Kansas cities of Leavenworth and Lansing and on the Missouri side, Independence and Blue Springs. The Leavenworth Times was one of our original daily newspapers and the balance of the cluster was acquired afterward. In addition, we secured the military publication, The Fort Leavenworth Lamp, in Fort Leavenworth. The Kansas City cluster is home to several prominent companies, including Hallmark, H&R Block, Interstate Bakeries, and the University of Kansas.
The Wichita cluster consists of three dailies, six weeklies and three shoppers in the towns of Andover, Augusta, El Dorado, Pratt, Wellington, Newton and McPherson near Wichita, Kansas. The clustering of the small dailies in this area allows the group to sell advertisers a package providing access to multiple communities. Major aircraft manufacturers Boeing, Bombardier, Cessna and Raytheon have facilities nearby and McConnell Air Force Base is a major component of the local economy.
We also have clusters in and around Grand Forks, North Dakota (home to the Grand Forks Air Force Base and the University of North Dakota) and near Mason City, Iowa, where Cargill, ConAgra, Kraft, Winnebago and Fort Dodge Animal Health, a division of Wyeth, each maintain significant operations.
We are represented in southwestern Minnesota through seven paid weekly newspapers and four shoppers. St. James, Redwood Falls, Sleepy Eye, Granite Falls, Cottonwood, Wabasso, and Montevideo are all communities with populations of 10,000 and under. These papers represent the primary local news and information source for these communities.
In Louisiana, we have an operating cluster in the southwestern part of the state, located between Lake Charles and Alexandria. This cluster consists of five publications located in the cities of Leesville, Sulpher, DeRidder and Vinton. Local employers include major manufacturers such as Alcoa, Firestone, International Paper and Proctor & Gamble.
Our Baton Rouge cluster consists of four weeklies and three shoppers in the southeastern Louisiana cities of Donaldsville, Gonzales, and Plaquemine. Numerous petrochemical companies such as BASF, Exxon Mobil and Dow Chemical, plus universities including Louisiana State, support the local economies.
In southwestern New York, our operations are centered around five publications based in Steuben County. In Corning, The Leader, a 6,624 circulation daily newspaper, dominates the eastern half of the county and shares its hometown namesake with Corning Incorporated. The Hornell Evening Tribune circulates daily throughout the western half of the county. Situated directly between these two dailies in the county seat of Bath is the 10,850 circulation Steuben Courier, a free-distribution weekly. The Pennysaver Plus, a standalone shopper, solidifies this flagship group.
We also have a strong presence in the print advertising markets in three other New York counties that surround Steuben. In Allegany County to the west, the Wellsville Daily Reporter and its shopper, the Pennysaver Plus, cover most households. In Livingston County to the north, the Pennysaver Plus and the Genesee Country Express complement one another with combined circulation of 32,412. In Yates County to the north and east, The Chronicle-Express and Chronicle Ad-Visor shopper distribute weekly to nearly 14,000 households centered around the county seat of Penn Yan.
In nearby Chemung County, the 17,771 circulation Horseheads Shopper anchors our presence in this area. The majority of the southwestern New York cluster parallels Interstate 86 across the central southern tier of New York State, which is benefiting from continued improvement and expansion under an omnibus federal highway appropriations bill. Moreover, the cluster has several colleges and universities nearby, including Cornell University, Ithaca College, Elmira College and Houghton College.
Our Honesdale cluster, approximately 30 miles from Scranton, Pennsylvania, consists of seven publications in the cities of Carbondale, Honesdale and Hawley, Pennsylvania, along with Liberty, New York, located just
12
Table of Contents
across the Delaware River to the east. The cluster was created from our daily and shopper operations in Honesdale and later supplemented by our acquisition of weeklies and shoppers in Carbondale and Liberty. Local employers include General Dynamics, Blue Cross/Blue Shield, Commonwealth Telephone and various colleges and universities, medical centers and governmental agencies.
Our Pennsylvania/West Virginia cluster includes dailies in Waynesboro, Pennsylvania, Keyser and Ripley, West Virginia. We also have two weeklies throughout the group and a commercial printing operation in Ravenswood, West Virginia.
We have a strong presence in southern Michigan where five of our dailies, Adrian, Coldwater, Holland, Hillsdale and Sturgis, along with two weeklies and seven shoppers blanket the southern tier of the state and into Indiana. The 12,301 circulation Holland Sentinel is the flagship publication of the group. This area has several large employers, including Delphi, ConAgra, Tecumseh Products, Kellogg, JCI, Herman Miller, Hayworth, Gentex, Jackson State Prison, and a number of colleges and universities.
The communities we serve in the Small Community Newspaper group are largely rural but also support educational institutions, government agencies (including prisons and military bases), tourism, veterinary medicine and ethanol and agricultural chemical manufacturing. The area also includes automotive (including recreational vehicles), boat, home construction products and furniture manufacturing businesses.
The following table sets forth information regarding the number of publications and production facilities in the Small Community Newspaper Group:
| Publications | Production Facilities |
|||||||||||||||
| State of Operations |
Dailies | Weeklies | Shoppers | |||||||||||||
| Illinois |
15 | 30 | 13 | 2 | ||||||||||||
| Missouri |
12 | 15 | 12 | 5 | ||||||||||||
| Kansas |
5 | 8 | 7 | 1 | ||||||||||||
| Michigan |
8 | 2 | 10 | 4 | ||||||||||||
| California |
2 | 5 | 3 | 1 | ||||||||||||
| Minnesota |
1 | 8 | 6 | 0 | ||||||||||||
| Arkansas |
3 | 11 | 0 | 2 | ||||||||||||
| New York |
3 | 4 | 7 | 0 | ||||||||||||
| Louisiana |
1 | 8 | 4 | 1 | ||||||||||||
| Pennsylvania |
2 | 4 | 2 | 2 | ||||||||||||
| West Virginia |
1 | 2 | 2 | 2 | ||||||||||||
| Colorado |
1 | 3 | 0 | 1 | ||||||||||||
| Nebraska |
0 | 2 | 1 | 0 | ||||||||||||
| Oklahoma |
2 | 0 | 1 | 2 | ||||||||||||
| North Dakota |
1 | 0 | 1 | 1 | ||||||||||||
| Tennessee |
1 | 0 | 0 | 0 | ||||||||||||
| Iowa |
0 | 1 | 0 | 0 | ||||||||||||
|
|
|
|
|
|
|
|
|
|||||||||
| Total |
58 | 103 | 69 | 24 | ||||||||||||
Metro Newspaper Group. Our Metro Newspaper Group includes publications that are typically within 50 miles of a metropolitan area with total population greater than 1.0 million people in the states of Massachusetts, New York, and Delaware. We are one of the largest community newspaper publishers in Massachusetts by number of daily publications and also publish a large concentration of weekly newspapers, serving 113 communities in markets across eastern Massachusetts. The three largest daily newspapers in this region are: The Patriot Ledger (founded in 1837 with circulation of 28,770), the Enterprise (founded in 1880 with circulation of 17,890) and the MetroWest Daily News (founded in 1897 with circulation of 14,127). We also have over 160 web sites, with more than 4.8 million average combined monthly unique visitors in Massachusetts.
13
Table of Contents
Many of the towns within our Massachusetts footprint were founded in the 1600s and our daily and weekly newspapers in the region have long been institutions within these communities. In fact, our Massachusetts publications have 30 daily and weekly newspapers that are over 100 years old. The Boston designated market areas (“DMA”) is the eighth largest market in the United States with 2.5 million households and 6.5 million people, and ranks first nationally in concentration of colleges and universities. Massachusetts has more than 1.0 million households in the region earning greater than $75,000, and a substantial homeownership rate. We reach 1.4 million readers in the eastern Massachusetts market. Eastern Massachusetts is also an employment center for technology, biotechnology, healthcare and higher education.
In New York we operate and own a combination of 16 publications in Suburban Rochester that span four counties and have a combined circulation of 123,180. This market has a tourism industry and is known for boutique wineries and recreational activities. The flagship of Messenger Post Media is the 7,665 circulation Daily Messenger in Canandaigua.
The Delaware cluster publishes six weekly newspapers, one shopper, and various specialty papers that cover most of the state of Delaware, and range from suburban Wilmington in the north to Georgetown, Delaware at the southern end of the state. The weekly Express shopper serves nearly all of lower Delaware and a good portion of the Eastern Shore of Maryland. Circulation for the cluster is primarily free, and totals approximately 95,161 weekly.
The following table sets forth information regarding the number of publications and production facilities in the Metro Newspaper Group:
| Publications | Production Facilities |
|||||||||||||||
| State of Operations |
Dailies | Weeklies | Shoppers | |||||||||||||
| Massachusetts |
6 | 100 | 2 | 2 | ||||||||||||
| New York |
1 | 11 | 4 | 1 | ||||||||||||
| Delaware |
0 | 6 | 1 | 1 | ||||||||||||
|
|
|
|
|
|
|
|
|
|||||||||
| Total |
7 | 117 | 7 | 4 | ||||||||||||
Large Daily Newspaper Group. Our Large Daily Newspaper Group includes publication clusters in communities that typically have more than 35,000 people and are greater than 50 miles from a major metropolitan area. These publications are in Illinois, New York, Ohio, and Connecticut with a total of 12 daily newspapers, 3 weekly newspapers and 12 shoppers. In addition to a good geographic mix, we benefit from a diverse economic and employment base across this group.
Approximately 85 miles to the west of Chicago, Illinois is the Rockford Register Star supported by its 37,158 daily paid circulation base and its total market coverage (“TMC”) product The Weekly, with six zoned editions. The Rockford Register Star operates successful web sites that have more than 909,000 average monthly unique visitors.
The Journal (Freeport, IL) Standard is published Tuesdays through Sundays. The newspaper’s coverage area includes Caroll, Jo Daviess, Ogle and Stephenson counties. The newspaper has a daily circulation of 6,441 and a Sunday circulation of 8,109. The Journal Standard also publishes a website journalstandard.com and receives a monthly average of 918,000 page views and monthly unique visitors over 193,000.
The Peoria Journal Star with its daily paid circulation of 58,218 is the dominant newspaper in Peoria, Tazewell and Woodford Counties and is also distributed in an additional 17 surrounding counties. There are two shoppers—JS Shopper and Pekin Extra—which have a combined weekly circulation of 95,896. The Peoria facility provides print services to our neighboring New Media publications and commercial printing for Lee Enterprises’ The Pantagraph. The market includes manufacturing facilities for Caterpillar and Komatsu, and higher education at Bradley University, Illinois Central College and Midstate College. Peoria has a large medical
14
Table of Contents
community including OSF Healthcare, Methodist Medical Center, Proctor Hospital, University Of Illinois College Of Medicine and St. Jude Children’s Hospital Midwest Affiliate. It has agricultural facilities Archer Daniels Midland, LG Seeds and the USDA Ag Lab. The Journal Star has pjstar.com and pjstar.mobi with combined monthly average of page views of over 1.1 million per month. The combined average monthly unique visitors are over 1.0 million.
The Springfield State Journal-Register with a daily paid circulation of 31,563 and a Sunday paid circulation of 52,911 covers the state capital of Illinois. The daily paid circulation includes a branded edition of 2,901 of the Lincoln Courier. The State Journal-Register also has successful web sites with monthly unique visitors of more than 1.4 million.
The Ohio cluster is anchored in Canton, Ohio and covers Stark and Tuscarawas Counties. It is comprised of three daily newspapers, one weekly publication and two shoppers. The Repository is a 52,473 daily newspaper that covers the entire area of Stark County. The Dover New Philadelphia Times Reporter is a 16,535 daily publication located 40 miles south of Canton in Tuscarawas County. The Massillon Independent is an 8,397 circulation daily that circulates in western Stark County. The Suburbanite is a 32,600 weekly publication that circulates in the affluent northern Stark County area. The Ohio facility also provides commercial print services to the Akron Beacon Journal. The Ohio cluster has very successful web sites with more than 1.4 million combined monthly unique visitors. Together the newspapers and web sites dominate their local markets.
The Central New York cluster is anchored by the Observer-Dispatch in Utica, New York which has circulation of 25,505 Daily and 34,877 Sunday subscribers. The Utica operations include one daily and two shoppers and one weekly newspaper in Hamilton. Utica also has web sites with combined monthly unique visitors of more than 619,000. Other dailies in this group are located in Herkimer and Little Falls. The Utica and Herkimer County operations take advantage of numerous synergies in printing, circulation, and advertising.
Our Norwich, Connecticut publication diversifies the Large Daily Newspapers as the eastern Connecticut economy differs from the nation and New England markedly. Primary economic drivers include casinos, military submarine manufacture and pharmaceutical research. Major industrial employers in the region include General Dynamics, Pfizer, Dow Chemical, Dominion Resources and the United States Navy.
The following table sets forth information regarding the number of publications and production facilities in the Large Daily Newspaper Group:
| Publications | Production Facilities |
|||||||||||||||
| State of Operations |
Dailies | Weeklies | Shoppers | |||||||||||||
| Illinois |
5 | 0 | 7 | 2 | ||||||||||||
| New York |
3 | 2 | 2 | 0 | ||||||||||||
| Ohio |
3 | 1 | 2 | 2 | ||||||||||||
| Connecticut |
1 | 0 | 1 | 0 | ||||||||||||
|
|
|
|
|
|
|
|
|
|||||||||
| Total |
12 | 3 | 12 | 4 | ||||||||||||
Local Media Group. Local Media operates in five publication group clusters: the (1) New York/Pennsylvania Media Group, (2) Southeastern Massachusetts Media Group, (3) Seacoast Media Group (Coastal New Hampshire and Maine cluster), (4) San Joaquin Media Group (Stockton, California cluster) and (5) Southern Oregon Media Group.
New York/Pennsylvania Media Group. This cluster includes the Hudson Valley Media Group and the Pocono Mountains Media Group.
The Hudson Valley Media Group publishes one paid daily, two free weekly newspapers, and one shopper. The flagship publication of the Hudson Valley Media Group is the Times Herald-Record. The Times Herald-Record, with a daily circulation of 55,896, is the premier daily and Sunday local paper in Orange County, NY.
15
Table of Contents
The Pocono Mountains Media Group publishes one paid daily, one free weekly newspaper, and one shopper. The flagship publication of the Pocono Mountains Media Group is the Pocono Record. The Pocono Record, with a daily circulation of 15,572, is the premier daily and Sunday local paper in the Pocono Mountains area.
Southeastern Massachusetts Media Group. This cluster includes the Cape Cod Media Group, the Southcoast Media Group and the Nantucket Island Media Group.
The Cape Cod Media Group publishes one paid daily, one paid weekly newspaper and one shopper. The flagship publication of the Cape Cod Media Group is the Cape Cod Times. The Cape Cod Times, with a daily circulation of 36,323 is the premier daily and Sunday local paper on Cape Cod. The Barnstable Patriot, the paid weekly newspaper, has a weekly circulation of 2,294.
The Southcoast Media Group publishes one paid daily newspaper, four paid weekly newspapers, two shoppers and one free weekly newspaper. The flagship publication of the Southcoast Media Group is the Standard-Times. The Standard-Times, with a daily circulation of 21,807, is the premier daily and Sunday local paper in the New Bedford, MA area. The other paid weeklies, the Spectator, the Chronicle, the Middleboro Gazette and the Advocate, have weekly circulations of 3,522, 1,950, 3,443 and 706, respectively.
The Nantucket Island Media Group publishes The Inquirer and Mirror. With a weekly circulation of 7,039, it has the largest circulation of any island newspaper.
Seacoast Media Group. The Seacoast Media Group publishes one paid daily, one paid Sunday paper, two newspapers which are published three times a week and two paid weekly newspapers. The flagship publication of the Seacoast Media Group is the Portsmouth Herald. The Portsmouth Herald, with a daily circulation of 10,006, is the premier daily and Sunday local paper in coastal New Hampshire. Seacoast Sunday, the Sunday paper, has a Sunday circulation of 14,919. The Hampton Union and the Exeter News-Letter, the two newspapers published three times a week, have weekly circulations of 2,102 and 2,568, respectively. The two paid weekly newspapers, the York County Coast Star and the York Weekly, have weekly circulations of 2,415 and 1,577, respectively.
San Joaquin Media Group. The San Joaquin Media Group publishes one paid daily, one free weekly paper, and one shopper. The flagship publication of the San Joaquin Media Group is the Record. The Record, with a daily circulation of 32,846, is the premier daily and Sunday local paper in the Stockton, CA area.
Southern Oregon Media Group. The Southern Oregon Media Group publishes two paid daily papers and two shoppers. The flagship publication of the Southern Oregon Media Group is the Medford Mail Tribune. The Medford Mail Tribune, with a daily circulation of 21,778, is the premier daily and Sunday local paper in southern Oregon. The other paid daily paper, the Ashland Daily Tidings, has a daily circulation of 1,431.
The following table sets forth information regarding the number of publications and production facilities in the Local Media Group:
| Publications | Production Facilities |
|||||||||||||||
| State of Operations |
Dailies | Weeklies | Shoppers | |||||||||||||
| Massachusetts |
2 | 7 | 3 | 1 | ||||||||||||
| New Hampshire |
1 | 4 | 0 | 1 | ||||||||||||
| New York |
1 | 2 | 1 | 1 | ||||||||||||
| Oregon |
2 | 0 | 2 | 1 | ||||||||||||
| California |
1 | 1 | 1 | 1 | ||||||||||||
| Pennsylvania |
1 | 1 | 1 | 0 | ||||||||||||
| Maine |
0 | 2 | 0 | 0 | ||||||||||||
|
|
|
|
|
|
|
|
|
|||||||||
| Total |
8 | 17 | 8 | 5 | ||||||||||||
16
Table of Contents
Directories
The core of our directory portfolio is comprised of the three yellow page directories, which are located in and around the Sacramento, California area, primarily in Roseville, California. The three directories have an aggregate circulation of approximately 360,000 and service Roseville, Auburn/Grass Valley/Nevada City and Folsom/El Dorado/Placerville, reaching four counties within the Sacramento region.
Our SureWest Directories portfolio is highlighted by the Roseville directory. The Roseville directory is the incumbent (with a circulation of approximately 200,000) and has served the local Roseville community for over 100 years and has achieved more than 50% market share.
We also own three additional directories including two Michigan and Indiana phone guides servicing St. Joseph County, Michigan and LaGrange County, Indiana, and Branch County, Michigan and Steuben County, Indiana, respectively, and one yellow page directory based in Mt. Shasta, California.
Propel Marketing
Propel is our digital marketing services division with digital products designed for SMBs. We believe the digital services industry represents a large and expanding opportunity. Propel is a business we created to attack that opportunity.
There are approximately 27 million SMBs in the United States today and about 26.7 million have less than 20 employees. Although these businesses are increasingly beginning to recognize the need to establish and maintain a strategy for the digital space, most do not have the time, expertise or resources to handle this themselves.
Propel is a company that can become the outsourced digital marketing service department for those SMBs. Propel’s products help an SMB build a presence across digital platforms, help them get found by consumers, help them engage with and grow their customer base. We pull these products together for the SMB with a proprietary customer dashboard which integrates activity and results for all Propel products.
We also believe Propel gives us an opportunity to expand beyond our current geographic boundaries, as its product set could be of value to SMBs around the country.
Revenue
Our operations generate three primary types of revenue: (i) advertising, (ii) circulation (including home delivery subscriptions, single copy sales and digital subscriptions) and (iii) other (primarily commercial printing and digital marketing services). In 2013, these revenue streams accounted for approximately 63%, 29% and 8%, respectively, of our total revenue. The contribution of advertising, circulation and other revenue to our total revenue for New Media, known as the Successor Company for the two months ended December 29, 2013 and the Predecessor Company for the ten months ended November 6, 2013 and years ended December 30, 2012 and January 1, 2012 was as follows:
| Successor Company | Predecessor Company | |||||||||||||||||
| Two Months Ended December 29, 2013 |
Ten Months Ended November 6, 2013 |
Year Ended December 30, 2012 |
Year Ended January 1, 2012 |
|||||||||||||||
| (in thousands) | ||||||||||||||||||
| Revenue: |
||||||||||||||||||
| Advertising |
$ | 63,340 | $ | 265,078 | $ | 330,881 | $ | 357,134 | ||||||||||
| Circulation |
29,525 | 118,810 | 131,576 | 131,879 | ||||||||||||||
| Commercial printing and other |
10,366 | 29,402 | 26,097 | 25,657 | ||||||||||||||
|
|
|
|
|
|
|
|
|
|||||||||||
| Total revenue |
$ | 103,231 | $ | 413,290 | $ | 488,554 | $ | 514,670 | ||||||||||
|
|
|
|
|
|
|
|
|
|||||||||||
17
Table of Contents
Advertising
Advertising revenue, which includes revenue generated from online and mobile products, is the largest component of our revenue, accounting for approximately 63%, 68% and 69% of our total revenue in 2013, 2012 and 2011, respectively. We categorize advertising as follows:
| • | Local Retail—local retailers, local stores for national retailers, grocers, drug stores, department and furniture stores, local financial institutions, niche shops, restaurants and other consumer related businesses. |
| • | Local Classified—local legal, obituaries, employment, automotive, real estate and other advertising. |
| • | Online—banner, display, classified, behavioral targeting, audience extension, search and other advertising on websites or mobile devices. |
| • | National—national and major accounts such as wireless communications companies, airlines and hotels, generally placed with us through agencies. |
We believe that our advertising revenue tends to be less volatile than the advertising revenue of large metropolitan and national print media because we rely primarily on local, rather than national advertising and our classified revenue, tends to be more local market oriented (job listing for example). We generally derive 95% or more of our advertising revenue from local advertising (local retail, local classified and online) and less than 5% from national advertising. We believe that local advertising tends to be less sensitive to economic cycles than national advertising because local businesses generally have fewer effective advertising channels through which they may reach their customers.
Our advertising rate structures vary among our publications and are a function of various factors, including local market conditions, competition, circulation, readership and demographics. Management works with local newspaper management to set advertising rates and a portion of our publishers’ incentive compensation is based upon growing advertising revenue. Our sales compensation program emphasizes digital and new business growth. We share advertising concepts throughout our network of publishers and advertising directors including periodic special section programs, enabling them to utilize advertising products and sales strategies that are successful in other markets we serve.
Substantially all of our advertising revenue is derived from a diverse group of local retailers and local classified advertisers, resulting in very limited customer concentration. No single advertiser accounted for more than 1% of our total revenue in 2013, 2012 or 2011 and our 20 largest advertisers account for less than 10% of total revenue.
Our advertising revenue tends to follow a seasonal pattern, with higher advertising revenue in months containing significant events or holidays. Accordingly, our first quarter, followed by our third quarter, historically are our weakest quarters of the year in terms of revenue. Correspondingly, our second fiscal quarter, and fourth fiscal quarter, historically are our strongest quarters. We expect that this seasonality will continue to affect our advertising revenue in future periods.
We have experienced declines in advertising revenue over the past few years, due primarily to the secular pressures on the business as consumers and advertisers shift time and spend from traditional media to the internet. We continue to search for organic growth opportunities, specifically with digital advertising and ways to stabilize print revenue declines through strengthening local news product, value based pricing and training of sales staff.
Circulation
Our circulation revenue is derived from home delivery sales to subscribers, single copy sales at retail stores and vending racks and boxes, and digital subscriptions. We own 85 paid daily publications that range in
18
Table of Contents
circulation from approximately 500 to 57,000 and 168 paid weekly publications that range in circulation from approximately 100 to 10,000. Circulation revenue accounted for approximately 29%, 27% and 26% of our total revenue in 2013, 2012 and 2011, respectively.
Subscriptions are typically sold for three to twelve-month terms and often include promotions to extend the average subscription period or convert someone to become a subscriber. We also provide bundled print and digital subscriptions and employ pay meters for our website content at most of our daily publications. We implement marketing programs to increase readership through subscription and single copy sales, including company-wide and local circulation contests, direct mail programs, door-to-door sales and strategic alliances with local schools in the form of “Newspapers in Education” programs. In addition, since the adoption of the Telemarketing Sales Rule by the Federal Trade Commission in 2003, which created a national “do not call” registry, we have increased our use of “EZ Pay” programs, kiosks, sampling programs, in-paper promotions and online promotions to increase our circulation.
We encourage subscriber use of EZ Pay, a monthly credit card charge or direct bank debit payment program, which has led to higher retention rates for subscribers. We also use an active stop-loss program for all expiring subscribers. Additionally, in order to improve our circulation revenue and circulation trends, we periodically review the need for quality enhancements, such as:
| • | Increasing the amount of unique hyper-local content; |
| • | Increasing the use of color and color photographs; |
| • | Improving graphic design, including complete redesigns; |
| • | Developing creative and interactive promotional campaigns; |
| • | Improving customer service and company wide customer retention efforts; and |
| • | Better use of demographic data to specifically target pricing and customer acquisition opportunities. |
We believe that our unique and valuable hyper-local content allows us to continue to produce products of great relevance to our local market audiences. This allows us to be able to periodically raise prices, both for home delivery and on a single copy basis, resulting in increased circulation revenues. We also believe this unique hyper-local content will allow us to find ways to grow circulation revenues from our wide array of digital products.
Other
We provide commercial printing services to third parties on a competitive bid basis as a means to generate incremental revenue and utilize excess printing capacity. These customers consist primarily of other publishers that do not have their own printing presses and do not compete with our publications. We also print other commercial materials, including flyers, business cards and invitations. Additionally, this category includes Propel which provides internet marketing solutions for SMBs. Other sources of revenue, including commercial printing and Propel, accounted for approximately 8%, 5% and 5% of our total revenue in 2013, 2012 and 2011, respectively.
Printing and Distribution
We own and operate 37 print facilities. Our print facilities produce 10 publications on average and are generally located within 60 miles of the communities served. By clustering our production resources or outsourcing where cost beneficial, we are able to reduce the operating costs of our publications while increasing the quality of our small and midsize market publications that would typically not otherwise have access to high quality production facilities. We also believe that we are able to reduce future capital expenditure needs by having fewer overall pressrooms and buildings. We believe our superior production quality is critical to maintaining and enhancing our position as the leading provider of local news coverage in the markets we serve. As other print media businesses look to reduce costs, we believe we have the opportunity to leverage our unutilized press time to grow our commercial print customer base and revenue.
19
Table of Contents
The distribution of our daily newspapers is typically outsourced to independent, locally based, third-party distributors that also distribute a majority of our weekly newspapers and non-newspaper publications. We continuously evaluate lower cost options for newspaper delivery. In addition, certain of our shopper and weekly publications are delivered via the U.S. Postal Service.
Availability of Raw Materials for Our Business—Newsprint
The basic raw material for our publications is newsprint. We generally maintain only a 45 to 55-day inventory of newsprint.
Historically, the market price of newsprint has been volatile, reaching a high of approximately $823 per metric ton in 2008 and a low of $410 per metric ton in 2002. However, from 2010 to 2013 there was much less volatility in newsprint pricing and our Predecessor benefited from negotiating a fixed annual price for a majority of its newsprint. The average market price of newsprint during 2013 was approximately $643 per metric ton.
In 2012 our Predecessor consumed approximately 41,400 metric tons of newsprint (inclusive of commercial printing) and the cost of our newsprint consumption totaled approximately $27.7 million. In contrast, in 2013, we consumed approximately 42,800 metric tons of newsprint (inclusive of commercial printing) and the cost of our newsprint consumption totaled approximately $27.5 million. Our newsprint expense typically averages less than 10% of total revenue, which we believe generally compares favorably to larger, metropolitan newspapers.
For our 2012 and 2013 purchases of newsprint our Predecessor negotiated a fixed price for approximately 75% and 95%, respectively, of our newsprint tons which allowed our Predecessor to eliminate some of the volatility of the market price.
Competition
Each of our publications competes for advertising revenue to varying degrees with traditional media outlets such as direct mail, yellow pages, radio, outdoor advertising, broadcast and cable television, magazines, local, regional and national newspapers, shoppers and other print and online media sources, including local blogs. We also increasingly compete with new digital and social media companies for advertising revenue. However, we believe that barriers to entry remain high in many of the markets we serve in terms of being the preeminent source for local news and information therein, because our markets are generally not large enough to support a second newspaper and because our local news gathering infrastructures, sales networks and relationships would be time consuming and costly to replicate. We also have highly recognized local brand names and long histories in the towns we serve.
We also provide our readers with community-specific content, which is generally not available from other media sources. We believe that our direct and focused coverage of the market and our cost effective advertising rates relative to more broadly circulated metropolitan newspapers allow us to tailor an approach for our advertisers. As a result, our publications generally capture a large share of local advertising in the markets they serve.
The level of competition and the primary competitors we face vary from market to market. Competition tends to be based on market penetration, demographic and quality factors, as opposed to price factors. The competitive environment in each of our operating regions is discussed in greater detail below.
Small Community Newspaper Group. The Small Community Newspaper Group operates in 164 markets and we believe our publications are the dominant print advertising media in the vast majority of these markets. There are radio stations in or within 20 miles of every market in which we operate, but we do not believe that any of these radio station operators pose a significant competitive threat to our publications. Yellow page advertising is prevalent in all of our markets with either a local phone book or a regional phone book. We believe that, in most cases, yellow page advertising is geared more towards the professional services advertisers such as
20
Table of Contents
attorneys and doctors and not the local retail advertisers, as is the focus with our non-directory publications. Lee Enterprises publishes the Southern Illinoisan in Carbondale, which is a regional newspaper that competes with our dailies in Marion, Benton, West Frankfort and DuQuoin. In all four of these cases, we believe our publications are the dominant local daily, but do compete on a regional basis with the larger dailies. We also compete with shoppers or weekly newspapers. This competition comes from small independent operators and is not significant. We have very little television competition in this group because of our geographic location in relation to major markets. There are no local television affiliates in our markets.
In the southern regions of this group we believe our publications are generally the dominant media. Our major competition comes from regional daily newspapers, specifically: The Advocate in Baton Rouge, Louisiana; The American Press in Lake Charles, Louisiana; The Joplin Globe; and the Wichita Eagle. We also face competition from numerous other daily and weekly papers, local radio stations, shopping guides, directories and niche publications.
In the Northeast market we believe our publications are generally the dominant media. The competition we face in this region are from major newspaper companies: daily newspapers owned by Gannett Company, Inc. (The Star-Gazette in Elmira, NY and the Chambersburg (PA) Public-Opinion); Times-Shamrock Company’s Scranton (PA) The Times-Tribune and Towanda Daily/Sunday Review; Community Newspaper Holdings, Inc.’s Sunbury Daily Item; and Ogden-Nutting’s Williamsport Sun-Gazette. We believe our publications tend to be the dominant local publication in those markets.
In our Great Lakes markets we believe our publications are generally the dominant media in those markets. Our only significant competition comes from regional television stations in Adrian, Michigan. We also face competition from dozens of other competitors such as other local daily and weekly papers and niche publications, as well as radio and television stations, directories, direct mail and non-local internet websites, but none of these have proven to be significant.
Metro Newspaper Group. In the Metro Newspaper Group, the Boston Globe and boston.com, a metropolitan daily and website, respectively, owned by John Henry, compete with us throughout eastern Massachusetts. In addition, we compete in Massachusetts with more than 30 other weekly or daily newspaper companies (that publish a combined total of approximately 16 dailies and 50 weeklies), three major radio station operators, five local network television broadcasters, one cable company and numerous niche publications for advertising revenues. We believe that our publications generally deliver the highest household coverage in their respective markets.
Large Daily Newspaper Group. In our Large Daily Newspaper Group we believe our publications are generally the dominant media in those markets. Daily newspapers owned by Gannett Company, Inc. (Daily Sentinel in Rome, NY and The Dispatch in Oneida, NY) compete within the New York market. We also face competition from other major newspaper companies in other regional markets such as Newhouse Newspaper’s Syracuse Post-Standard. Our competitors also include numerous other daily and weekly newspapers, local radio stations, shopping guides, directories and niche publications. We believe our publications, many of which have an extensive history in the relevant market, tend to be the dominant local publication.
Local Media. Local Media operates in 14 local markets across the United States. We believe our publications in these markets are generally the dominant media and that each have an audience far larger than the competitors. Daily newspapers owned by Gannett Company, Inc. (Poughkeepsie Journal in Poughkeepsie, NY) and 21st Century Media, Inc. (Daily Freeman in Kingston, NY), compete within the New York market. Our Cape Cod and New Bedford, Massachusetts newspapers experience competition similar to the Metro Newspaper Group. Their territories border with the Boston Globe and boston.com, a metropolitan daily and website, respectively, but they remain dominant in their markets.
We face competition from other newspaper companies that include daily and weekly newspapers, local websites, local radio stations, local television stations, shopping guides, directories and niche publications. None
21
Table of Contents
of our competitors have proven to be significant. Our publications and websites have a rich history in our markets which we believe uniquely positions them for unmatched reach and relevancy in their local audiences.
Employees
As of December 29, 2013, we had approximately 4,992 full time equivalent employees, consisting of hourly and salaried employees. We employ union personnel at a number of our core publications representing approximately 719 full-time equivalent employees. As of December 29, 2013, there were 27 collective bargaining agreements covering union personnel. Most of our unionized employees work under collective bargaining agreements that expire in 2014. We believe that relations with our employees are generally good and we have had no work stoppages at any of our publications.
Environmental Matters
We believe that we are in substantial compliance with all applicable laws and regulations for the protection of the environment and the health and safety of our employees based upon existing facts presently known to us. Compliance with federal, state, and local environmental laws and regulations relating to the discharge of substances into the environment, the disposal of hazardous wastes and other related activities has had, and will continue to have, an impact on our operations, but has, since the incorporation of our Predecessor in 1997, been accomplished without having a material adverse effect on its operations. While it is difficult to estimate the timing and ultimate costs to be incurred due to uncertainties about the status of laws, regulations and technology, based on information currently known to us and insurance procured with respect to certain environmental matters, we do not expect environmental costs or contingencies to be material or to have a material adverse effect on our financial performance. Our operations involve risks in these areas, however, and we cannot assure you that we will not incur material costs or liabilities in the future which could adversely affect us.
Corporate Governance and Public Information
The address of New Media’s website is http://www.newmediainv.com/. Stockholders can access a wide variety of information on New Media’s website, under the “Investor Relations” tab, including news releases, SEC filings, information New Media is required to post online pursuant to applicable SEC rules, newspaper profiles and online links. New Media makes available via its website all filings it makes under the Securities and Exchange Act of 1934, as amended, including Forms 10-K, 10-Q and 8-K, and related amendments, as soon as reasonably practicable after they are filed with, or furnished to, the SEC. All such filings are available free of charge. Neither the content of New Media’s corporate website nor any other website referred to in this report are incorporated by reference into this report unless expressly noted. The public may read and copy any information New Media files with the SEC at the SEC’s public reference room at 100 F Street, NE, Washington, DC 20549. The public may obtain information on the operation of the public reference room by calling the SEC at 1-800-SEC-0330. The SEC also maintains a website (http://www.sec.gov) where New Media’s filings filed with the SEC are available free of charge.
22
Table of Contents
List of New Media’s Dailies, Weeklies, Shoppers, Websites and Directories
As of December 29, 2013, New Media’s dailies, weeklies, shoppers, websites and directories were as listed below. GateHouse and Local Media maintain registered trademarks in many of the masthead names listed below. Maintaining such trademarks allows us to exclusively use the masthead name to the exclusion of third parties.
Small Community Newspaper Group
| State |
City |
Masthead |
Circulation Type | |||
| Illinois | Benton | Benton Evening News www.bentoneveningnews.com |
Daily | |||
| Canton | Daily Ledger www.cantondailyledger.com |
Daily | ||||
| Carmi | The Carmi Times www.carmitimes.com |
Daily | ||||
| Du Quoin | Du Quoin Evening Call www.duquoin.com |
Daily | ||||
| El Dorado | El Dorado Daily Journal | Daily | ||||
| Galesburg | The Register-Mail www.galesburg.com |
Daily | ||||
| Harrisburg | Harrisburg Daily Register www.dailyregister.com |
Daily | ||||
| Kewanee | Star-Courier www.starcourier.com |
Daily | ||||
| Macomb | McDonough County Voice www.mcdonoughvoice.com |
Daily | ||||
| Marion | The Daily Republican www.dailyrepublicannews.com |
Daily | ||||
| Monmouth | Daily Review Atlas www.reviewatlas.com |
Daily | ||||
| Olney | The Olney Daily Mail www.olneydailymail.com |
Daily | ||||
| Pekin | Pekin Daily Times www.pekintimes.com |
Daily | ||||
| Pontiac | Daily Leader www.pontiacdailyleader.com |
Daily | ||||
| West Frankfort | Daily American www.dailyamericannews.com |
Daily | ||||
| Abingdon | Abingdon Argus-Sentinel www.eaglepublications.com |
Paid Weekly | ||||
| Aledo | The Times Record www.aledotimesrecord.com |
Paid Weekly | ||||
| Augusta | Augusta Eagle-Scribe www.eaglepublicatons.com |
Paid Weekly | ||||
| Cambridge | Cambridge Chronicle www.cambridgechron.com |
Paid Weekly | ||||
| Carmi | The Weekly Times | Paid Weekly | ||||
| Chester | Randolph County Herald Tribune www.randolphcountyheraldtribune.com |
Paid Weekly | ||||
| Christopher | The Progress | Paid Weekly | ||||
| Du Quoin | Du Quoin News | Paid Weekly |
23
Table of Contents
| State |
City |
Masthead |
Circulation Type | |||
| Du Quoin | Ashley News | Paid Weekly | ||||
| Fairbury | The Blade | Paid Weekly | ||||
| Flora | Clay County Advocate Press www.advocatepress.com |
Paid Weekly | ||||
| Galva | Galva News www.galvanews.com |
Paid Weekly | ||||
| Geneseo | The Geneseo Republic www.geneseorepublic.com |
Paid Weekly | ||||
| Murphysboro | Murphysboro American www.murphysboroamerican.com |
Paid Weekly | ||||
| Newton | Newton Press Mentor www.pressmentor.com |
Paid Weekly | ||||
| Oquawka | Oquawka Current | Paid Weekly | ||||
| Orion | Orion Gazette www.oriongazette.com |
Paid Weekly | ||||
| Roseville | Roseville Independent www.eaglepublications.com |
Paid Weekly | ||||
| Shawneetown | Ridgway News | Paid Weekly | ||||
| Shawneetown | Gallatin Democrat | Paid Weekly | ||||
| Steelville | The Steelville Ledger | Paid Weekly | ||||
| Teutopolis | Teutopolis Press-Deiterich Gazette www.teutopolispress.com |
Paid Weekly | ||||
| West Frankfort | SI Trader www.sitraders.com |
Paid Weekly | ||||
| Chillicothe | Chillicothe Times Bulletin www.chillicothetimesbulletin.com |
Free Weekly | ||||
| East Peoria | East Peoria Times-Courier www.eastpeoriatimescourier.com |
Free Weekly | ||||
| Galesburg | Knox County Neighbors www.galesburg.com |
Free Weekly | ||||
| Macomb | Daily Brief | Free Weekly | ||||
| Metamora | Woodford Times www.woodfordtimes.com |
Free Weekly | ||||
| Morton | Morton Times News www.mortontimesnews.com |
Free Weekly | ||||
| Washington | Washington Times Reporter www.washingtontimesreporter.com |
Free Weekly | ||||
| Aledo | Town Crier Advertiser | Shopper | ||||
| Canton | Fulton County Shopper | Shopper | ||||
| Carmi | White County Shopper News | Shopper | ||||
| Flora | CCAP Special | Shopper | ||||
| Galatia | Money Stretcher www.galatiamoneystretcher.com |
Shopper | ||||
| Geneseo | Henry County Advertizer/Shopper | Shopper | ||||
| Macomb | McDonough County Choice | Shopper | ||||
| Marion | This Week in Williamson County | Shopper | ||||
| Monmouth | Pennysaver | Shopper | ||||
| Olney | Richland County Shopper | Shopper | ||||
| Olney | Jasper County News Eagle | Shopper | ||||
| Pontiac | Livingston Shopping News | Shopper | ||||
| West Frankfort | Free Press | Shopper |
24
Table of Contents
| State |
City |
Masthead |
Circulation Type | |||
| Missouri | Camdenton | Lake Sun Leader www.lakenewsonline.com |
Daily | |||
| Carthage | The Carthage Press www.carthagepress.com |
Daily | ||||
| Chillicothe | Constitution Tribune www.chillicothenews.com |
Daily | ||||
| Hannibal | Hannibal Courier Post www.hannibal.net |
Daily | ||||
| Independence | The Examiner www.examiner.net |
Daily | ||||
| Kirksville | Kirksville Daily Express & News www.kirksvilledailyexpress.com |
Daily | ||||
| Macon | Chronicle Herald www.maconch.com |
Daily | ||||
| Mexico | The Mexico Ledger www.mexicoledger.com |
Daily | ||||
| Moberly | Moberly Monitor Index www.moberlymonitor.com |
Daily | ||||
| Neosho | Neosho Daily News www.neoshodailynews.com |
Daily | ||||
| Rolla | Rolla Daily News www.therolladailynews.com |
Daily | ||||
| Waynesville | The Daily Guide www.waynesvilledailyguide.com |
Daily | ||||
| Aurora | Aurora Advertiser www.auroraadvertiser.net |
Paid Weekly | ||||
| Boonville | Boonville Daily News www.boonvilledailynews.com |
Paid Weekly | ||||
| Brookfield | The Linn County Leader www.linncountyleader.com |
Paid Weekly | ||||
| Greenfield | The Vedette www.greenfieldvedette.com |
Paid Weekly | ||||
| St James | St James Leader Journal www.leaderjournal.com |
Paid Weekly | ||||
| Boonville | Weekly | Free Weekly | ||||
| Camdenton | West Side Star www.lakenewsonline.com |
Free Weekly | ||||
| Carthage | The Carthage Press Wednesday TMC | Free Weekly | ||||
| Hannibal | Salt River Journal | Free Weekly | ||||
| Neosho | The Neighborhood Showcase | Free Weekly | ||||
| Osage Beach | Lake Area News Focus | Free Weekly | ||||
| Osage Beach | Lake of the Ozarks Real Estate | Free Weekly | ||||
| Osage Beach | Tube Tab | Free Weekly | ||||
| Osage Beach | Vacation News | Free Weekly | ||||
| Rolla | Rolla Daily News “Plus” | Free Weekly | ||||
| Aurora | Big AA Shopper | Shopper | ||||
| Brookfield | Sho-Me Shopper | Shopper | ||||
| Camdenton | Penny Saver | Shopper | ||||
| Chillicothe | Chillicothe C-T Shopper | Shopper | ||||
| Greenfield | Lake Stockton Shopper | Shopper | ||||
| Joplin | Big Nickel | Shopper |
25
Table of Contents
| State |
City |
Masthead |
Circulation Type | |||
| Kirksville | Nemo Trader | Shopper | ||||
| Kirksville | Kirksville Crier | Shopper | ||||
| Macon | Macon Journal www.maconch.com |
Shopper | ||||
| Moberly | The Shopper | Shopper | ||||
| Osage Beach | Lake of the Ozarks Boats | Shopper | ||||
| Waynesville | Pulaski County Weekly | Shopper | ||||
| Kansas | Dodge City | Dodge City Daily Globe www.dodgeglobe.com |
Daily | |||
| Leavenworth | The Leavenworth Times www.leavenworthtimes.com |
Daily | ||||
| McPherson | McPherson Sentinel www.mcphersonsentinel.com |
Daily | ||||
| Newton | The Newton Kansan www.thekansan.com |
Daily | ||||
| Pittsburg | The Morning Sun www.morningsun.net |
Daily | ||||
| El Dorado | The Butler County Times-Gazette www.butlercountytimesgazette.com |
Paid Weekly | ||||
| Greensburg | Kiowa County Signal www.kiowacountysignal.com |
Paid Weekly | ||||
| Pratt | The Pratt Tribune www.pratttribune.com |
Paid Weekly | ||||
| St John | St John News www.sjnewsonline.com |
Paid Weekly | ||||
| Wellington | Wellington Daily News www.wellingtondailynews.com |
Paid Weekly | ||||
| Dodge City | La Estrella | Free Weekly | ||||
| Leavenworth | Lansing This Week | Free Weekly | ||||
| Leavenworth | The Fort Leavenworth Lamp www.ftleavenworthlamp.com |
Free Weekly | ||||
| Dodge City | Shoppers Weekly | Shopper | ||||
| El Dorado | Shoppers Guide | Shopper | ||||
| Hiawatha | Penny Press 4 | Shopper | ||||
| Leavenworth | Chronicle Shopper | Shopper | ||||
| McPherson/Newton | South Central Kansas Shoppers Guide | Shopper | ||||
| Pittsburg | The Sunland Shopper | Shopper | ||||
| Pratt | Sunflower Shopper | Shopper | ||||
| Michigan | Adrian | The Daily Telegram www.lenconnect.com |
Daily | |||
| Cheboygan | Cheboygan Daily Tribune www.cheboygannews.com www.mackinacjournal.com |
Daily | ||||
| Coldwater | The Daily Reporter www.thedailyreporter.com |
Daily | ||||
| Hillsdale | Hillsdale Daily News www.hillsdale.net |
Daily | ||||
| Holland | The Holland Sentinel www.hollandsentinel.com |
Daily | ||||
| Ionia | Sentinel-Standard www.sentinel-standard.com |
Daily |
26
Table of Contents
| State |
City |
Masthead |
Circulation Type | |||
| Sault Ste Marie | The Evening News www.sooeveningnews.com |
Daily | ||||
| Sturgis | Sturgis Journal www.sturgisjournal.com |
Daily | ||||
| Coldwater | Bronson Journal www.thebronsonjournal.com |
Paid Weekly | ||||
| Coldwater | Jonesville Independent | Paid Weekly | ||||
| Adrian | Adrian Access Shopper www.accessshoppersguide.com |
Shopper | ||||
| Allegan | Flashes Shopping Guide (Allegan/Lakeshore) www.flashespublishers.com |
Shopper | ||||
| Cheboygan | Shopper Fair | Shopper | ||||
| Coldwater | The Reporter Extra | Shopper | ||||
| Coldwater | Coldwater Shoppers Guide | Shopper | ||||
| Hillsdale | Tip Off Shopping Guide www.tipoffonline.com |
Shopper | ||||
| Holland | Flashes Shopping Guide (Holland/Zeeland) www.flashespublishers.com |
Shopper | ||||
| Ionia | Sentinel-Standard TMC | Shopper | ||||
| Sault Ste Marie | Tri County Buyers Guide | Shopper | ||||
| Sturgis | Sturgis Gateway Shopper | Shopper | ||||
| California | Ridgecrest | The Daily Independent www.ridgecrestca.com www.rocketeer2.com |
Daily | |||
| Yreka | Siskiyou Daily News www.siskiyoudaily.com |
Daily | ||||
| Gridley | Gridley Herald www.gridleyherald.com |
Paid Weekly | ||||
| Mt Shasta | Weed Press www.mtshastanews.com |
Paid Weekly | ||||
| Mt Shasta | Dunsmuir News www.mtshastanews.com |
Paid Weekly | ||||
| Mt Shasta | Mt Shasta Herald www.mtshastanews.com |
Paid Weekly | ||||
| Taft | Midway Driller www.taftmidwaydriller.com |
Paid Weekly | ||||
| Gridley | Gidley Shopping News www.gridleyherald.com |
Shopper | ||||
| Mt Shasta | Super Saver Advertiser | Shopper | ||||
| Ridgecrest | Super Tuesday | Shopper | ||||
| Minnesota | Crookston | Crookston Daily Times www.crookstontimes.com |
Daily | |||
| Cottonwood | Tri-County News | Paid Weekly | ||||
| Granite Falls | Granite Falls Advocate-Tribune www.granitefallsnews.com |
Paid Weekly | ||||
| Montevideo | Montevideo American News www.montenews.com |
Paid Weekly | ||||
| Redwood Falls | Redwood Gazette www.redwoodfallsgazette.com |
Paid Weekly | ||||
| Sleepy Eye | Sleepy Eye Herald Dispatch www.sleepyeyenews.com |
Paid Weekly |
27
Table of Contents
| State |
City |
Masthead |
Circulation Type | |||
| St James | St James Plaindealer www.stjamesnews.com |
Paid Weekly | ||||
| Wabasso | The Wabasso Standard | Paid Weekly | ||||
| Halstad | The Valley Journal | Free Weekly | ||||
| Crookston | Crookston Valley Shopper | Shopper | ||||
| Halstad | The Shopper | Shopper | ||||
| Montevideo | The Star Advisor www.montenews.com |
Shopper | ||||
| Redwood Falls | Redwood Falls Livewire | Shopper | ||||
| Sleepy Eye | Brown County Reminder | Shopper | ||||
| St James | Town and Country Shopper | Shopper | ||||
| Arkansas | Arkadelphia | Daily Siftings Herald www.siftingsherald.com |
Daily | |||
| Hope | Hope Star www.hopestar.com |
Daily | ||||
| Stuttgart | Stuttgart Daily Leader www.stuttgartdailyleader.com |
Daily | ||||
| Gurdon | Gurdon Times www.thegurdontimes.com |
Paid Weekly | ||||
| Heber Springs | The Sun Times www.thesuntimes.com |
Paid Weekly | ||||
| Helena | The Daily World www.helena-arkansas.com |
Paid Weekly | ||||
| Hope | Nevada County Picayune www.picayune-times.com |
Paid Weekly | ||||
| Newport | Newport Independent www.newportindependent.com |
Paid Weekly | ||||
| White Hall | The White Hall Journal www.whitehalljournal.com |
Paid Weekly | ||||
| Arkadelphia | Arkadelphia Extra www.siftingsherald.com |
Free Weekly | ||||
| Helena | Daily World TMC www.helena-arkansas.com |
Free Weekly | ||||
| Hope | Star Extra www.hopestar.com |
Free Weekly | ||||
| Stuttgart | The Xtra www.stuttgartdailyleader.com |
Free Weekly | ||||
| White Hall | The Arsenel Sentinel | Free Weekly | ||||
| New York | Corning | The Leader www.the-leader.com |
Daily | |||
| Hornell | Evening Tribune www.eveningtribune.com |
Daily | ||||
| Wellsville | Wellsville Daily Reporter www.wellsvilledaily.com |
Daily | ||||
| Dansville | Genesee Country Express www.dansvilleonline.com |
Paid Weekly | ||||
| Penn Yan | The Chronicle-Express www.chronicle-express.com |
Paid Weekly | ||||
| Saugerties | Saugerties Post Star www.poststarnews.com |
Paid Weekly |
28
Table of Contents
| State |
City |
Masthead |
Circulation Type | |||
| Bath | Steuben Courier-Advocate www.steubencourier.com |
Free Weekly | ||||
| Corning | Corning Pennysaver | Shopper | ||||
| Hornell | Pennysaver Plus | Shopper | ||||
| Horseheads | The Shopper | Shopper | ||||
| Liberty | Catskill Shopper | Shopper | ||||
| Penn Yan | Chronicle Ad-Visor | Shopper | ||||
| Saugerties | Saugerties Pennysaver | Shopper | ||||
| Saugerties | Mountain Pennysaver | Shopper | ||||
| Louisiana | Bastrop | The Bastrop Daily Enterprise www.bastropenterprise.com |
Daily | |||
| DeRidder | Beauregard Daily News www.beauregarddailynews.net |
Paid Weekly | ||||
| Donaldsonville | The Donaldsonville Chief www.donaldsonvillechief.com |
Paid Weekly | ||||
| Gonzales | Gonzales Weekly Citizen www.weeklycitizen.com |
Paid Weekly | ||||
| Leesville | Leesville Daily Leader www.leesvilledailyleader.com |
Paid Weekly | ||||
| Plaquemine | Post South www.postsouth.com |
Paid Weekly | ||||
| Sulphur | Southwest Daily News www.sulphurdailynews.com |
Paid Weekly | ||||
| Sulphur | Vinton News | Paid Weekly | ||||
| Sterlington | North Quachita Weekly | Free Weekly | ||||
| Gonzales | The Marketeer www.weeklycitizen.com |
Shopper | ||||
| Gonzales | Nickel Ads www.weeklycitizen.com |
Shopper | ||||
| Plaquemine | West Bank Shopper www.postsouth.com |
Shopper | ||||
| Sulphur | Calcasieu Shopper | Shopper | ||||
| Pennsylvania | Honesdale | The Wayne Independent www.wayneindependent.com |
Daily | |||
| Waynesboro | The Record Herald www.therecordherald.com |
Daily | ||||
| Carbondale | The Villager www.moscowvillager.com |
Paid Weekly | ||||
| Carbondale | Carbondale News www.thecarbondalenews.com |
Paid Weekly | ||||
| Greencastle | The Echo Pilot www.echo-pilot.com |
Paid Weekly | ||||
| Hawley | News Eagle www.neagle.com |
Paid Weekly | ||||
| Hawley | The Pike Pennysaver | Shopper | ||||
| Honesdale | The Independent Extra | Shopper | ||||
| West Virginia | Keyser | Mineral Daily News Tribune www.newstribune.info |
Daily | |||
| Ripley | The Jackson Herald www.jacksonnewspapers.com |
Paid Weekly |
29
Table of Contents
| State |
City |
Masthead |
Circulation Type | |||
| Ripley | The Jackson Star News www.jacksonnewspapers.com |
Paid Weekly | ||||
| Keyser | Today’s Shopper | Shopper | ||||
| Ravenswood | Star Herald Weekender www.jacksonnewspapers.com |
Shopper | ||||
| Colorado | LaJunta | LaJunta Tribune Democrat www.lajuntatribunedemocrat.com |
Daily | |||
| LaJunta | Ag Journal www.agjournalonline.com |
Paid Weekly | ||||
| LaJunta | Fowler Tribune www.fowlertribune.com |
Paid Weekly | ||||
| Las Pimas | Bent County Democrat www.bcdemocratonline.com |
Paid Weekly | ||||
| Nebraska | Nebraska City | Nebraska City News Press www.ncnewspress.com |
Paid Weekly | |||
| Syracuse | Syracuse Journal Democrat www.journaldemocrat.com |
Paid Weekly | ||||
| Nebraska City | Penny Press 1 | Shopper | ||||
| Oklahoma | Ardmore | The Daily Ardmoreite www.ardmoreite.com |
Daily | |||
| Shawnee | The Shawnee News-Star www.news-star.com |
Daily | ||||
| Ardmore | Entertainment Spotlight | Shopper | ||||
| North Dakota | Devils Lake | Devils Lake Daily Journal www.devilslakejournal.com |
Daily | |||
| Devils Lake | The Country Peddler | Shopper | ||||
| Tennessee | Oak Ridge | The Oak Ridger www.oakridger.com |
Daily | |||
| Iowa | Hamburg | Hamburg Reporter www.hamburgreporter.com |
Paid Weekly |
30
Table of Contents
Metro Newspaper Group
| State |
City |
Masthead |
Circulation Type | |||
| Massachusetts | Brockton | The Enterprise www.enterprisenews.com |
Daily | |||
| Fall River | The Herald News www.heraldnews.com |
Daily | ||||
| Framingham | The Metrowest Daily News www.metrowestdailynews.com |
Daily | ||||
| Milford | The Milford Daily News www.milforddailynews.com |
Daily | ||||
| Quincy | Patriot Ledger www.patriotledger.com |
Daily | ||||
| Taunton | Taunton Daily Gazette www.tauntongazette.com |
Daily | ||||
| Abington | Abington Mariner www.wickedlocal.com/abington |
Paid Weekly | ||||
| Acton/Roxborough | The Beacon www.wickedlocal.com/acton |
Paid Weekly | ||||
| Allston | Allston/Brighton Tab www.wickedlocal.com/allston |
Paid Weekly | ||||
| Arlington | The Arlington Advocate www.wickedlocal.com/arlington |
Paid Weekly | ||||
| Bedford | Bedford Minuteman www.wickedlocal.com/bedford |
Paid Weekly | ||||
| Belmont | Belmont Citizen-Herald www.wickedlocal.com/belmont |
Paid Weekly | ||||
| Beverly | Beverly Citizen www.wickedlocal.com/beverly |
Paid Weekly | ||||
| Billerica | Billerica Minuteman www.wickedlocal.com/billerica |
Paid Weekly | ||||
| Boxford | Tri-Town Transcript www.wickedlocal.com/boxford |
Paid Weekly | ||||
| Braintree | Braintree Forum www.wickedlocal.com/braintree |
Paid Weekly | ||||
| Brewster | The Cape Codder www.wickedlocal.com/capecod |
Paid Weekly | ||||
| Burlington | Burlington Union www.wickedlocal.com/burlington |
Paid Weekly | ||||
| Cambridge | Cambridge Chronicle & Tab www.wickedlocal.com/cambridge |
Paid Weekly | ||||
| Carver | Carver Reporter www.wickedlocal.com/carver |
Paid Weekly | ||||
| Chelmsford | Chelmsford Independent www.wickedlocal.com/chelmsford |
Paid Weekly | ||||
| Cohasset | Cohasset Mariner www.wickedlocal.com/cohasset |
Paid Weekly | ||||
| Concord | The Concord Journal www.wickedlocal.com/concord |
Paid Weekly | ||||
| Danvers | Danvers Herald www.wickedlocal.com/danvers |
Paid Weekly |
31
Table of Contents
| State |
City |
Masthead |
Circulation Type | |||
| Dedham | Dedham Transcript www.wickedlocal.com/dedham |
Paid Weekly | ||||
| Dover | Dover/Sherborn Press www.wickedlocal.com/dover |
Paid Weekly | ||||
| Easton | Easton Journal www.wickedlocal.com/easton |
Paid Weekly | ||||
| Framingham | Westwood Press www.wickedlocal.com/westwood |
Paid Weekly | ||||
| Georgetown | Georgetown Record www.wickedlocal.com/georgetown |
Paid Weekly | ||||
| Hamilton | Hamilton-Wenham Chronicle www.wickedlocal.com/hamilton |
Paid Weekly | ||||
| Hanover | Hanover Mariner www.wickedlocal.com/hanover |
Paid Weekly | ||||
| Hingham | The Hingham Journal www.wickedlocal.com/hingham |
Paid Weekly | ||||
| Holbrook | Holbrook Sun www.wickedlocal.com/holbrook |
Paid Weekly | ||||
| Hopkinton | Hopkinton Crier www.wickedlocal.com/hopkinton |
Paid Weekly | ||||
| Hudson | Hudson Sun www.wickedlocal.com/hudson |
Paid Weekly | ||||
| Hyannis | The Register www.wickedlocal.com/barnstable |
Paid Weekly | ||||
| Ipswich | Ipswich Chronicle www.wickedlocal.com/ipswich |
Paid Weekly | ||||
| Kingston | Kingston Reporter www.wickedlocal.com/kingston |
Paid Weekly | ||||
| Lexington | Lexington Minuteman www.wickedlocal.com/lexington |
Paid Weekly | ||||
| Lincoln | Lincoln Journal www.wickedlocal.com/lincoln |
Paid Weekly | ||||
| Littleton | Littleton Independent www.wickedlocal.com/littleton |
Paid Weekly | ||||
| Malden | Malden Observer www.wickedlocal.com/malden |
Paid Weekly | ||||
| Mansfield | Mansfield News www.wickedlocal.com/mansfield |
Paid Weekly | ||||
| Marblehead | Marblehead Reporter www.wickedlocal.com/marblehead |
Paid Weekly | ||||
| Marion | The Sentinel www.wickedlocal.com/marion |
Paid Weekly | ||||
| Marlborough | Marlborough Enterprise www.wickedlocal.com/marlborough |
Paid Weekly | ||||
| Marshfield | Marshfield Mariner www.wickedlocal.com/marshfield |
Paid Weekly | ||||
| Maynard/Stow | The Beacon-Villager www.wickedlocal.com/maynard |
Paid Weekly | ||||
| Medfield | Medfield Press www.wickedlocal.com/medfield |
Paid Weekly |
32
Table of Contents
| State |
City |
Masthead |
Circulation Type | |||
| Medford | Medford Transcript www.wickedlocal.com/medford |
Paid Weekly | ||||
| Melrose | Melrose Free Press www.wickedlocal.com/melrose |
Paid Weekly | ||||
| Natick | Natick Bulletin & Tab www.wickedlocal.com/natick |
Paid Weekly | ||||
| North Andover | North Andover Citizen www.wickedlocal.com/northandover |
Paid Weekly | ||||
| Northborough/Southborough | The Northborough/Southborough Villager www.wickedlocal.com/northborough |
Paid Weekly | ||||
| Norwell | Norwell Mariner www.wickedlocal.com/norwell |
Paid Weekly | ||||
| Norwood | Norwood Transcript & Bulletin www.wickedlocal.com/norwood |
Paid Weekly | ||||
| Pembroke | Pembroke Mariner & Express www.wickedlocal.com/pembroke |
Paid Weekly | ||||
| Plymouth | Old Colony Memorial www.wickedlocal.com/plymouth |
Paid Weekly | ||||
| Provincetown | The Provincetown Banner www.wikedlocal.com/provincetown |
Paid Weekly | ||||
| Reading | The Reading Advocate www.wickedlocal.com/reading |
Paid Weekly | ||||
| Rockland | Rockland Mariner www.wickedlocal.com/rockland |
Paid Weekly | ||||
| Roslindale | Roslindale Transcript www.wickedlocal.com/roslindale |
Paid Weekly | ||||
| Saugus | Saugus Advertiser www.wickedlocal.com/saugus |
Paid Weekly | ||||
| Scituate | Scituate Mariner www.wickedlocal.com/scituate |
Paid Weekly | ||||
| Sharon | Sharon Advocate www.wickedlocal.com/sharon |
Paid Weekly | ||||
| Shrewsbury | Shrewsbury Chronicle www.wickedlocal.com/shrewsbury |
Paid Weekly | ||||
| Somerville | Somerville Journal www.wickedlocal.com/somerville |
Paid Weekly | ||||
| Stoughton | Stoughton Journal www.wickedlocal.com/stoughton |
Paid Weekly | ||||
| Sudbury | The Sudbury Town Crier www.wickedlocal.com/sudbury |
Paid Weekly | ||||
| Swampscott | Swampscott Reporter www.wickedlocal.com/swampscott |
Paid Weekly | ||||
| Tewksbury | Tewksbury Reporter www.wickedlocal.com/tewksbury |
Paid Weekly | ||||
| Wakefield | Wakefield Observer www.wickedlocal.com/wakefield |
Paid Weekly | ||||
| Walpole | The Walpole Times www.wickedlocal.com/walpole |
Paid Weekly | ||||
| Waltham | Waltham News Tribune www.wickedlocal.com/waltham |
Paid Weekly |
33
Table of Contents
| State |
City |
Masthead |
Circulation Type | |||
| Wareham | Wareham Courier www.wickedlocal.com/wareham |
Paid Weekly | ||||
| Watertown | Watertown Tab & Press www.wickedlocal.com/watertown |
Paid Weekly | ||||
| Wayland | The Wayland Town Crier www.wickedlocal.com/wayland |
Paid Weekly | ||||
| Wellesley | The Wellesley Townsman www.wickedlocal.com/wellesley |
Paid Weekly | ||||
| West Roxbury | West Roxbury Transcript www.wickedlocal.com/west-roxbury |
Paid Weekly | ||||
| Westborough | Westborough News www.wickedlocal.com/westborough |
Paid Weekly | ||||
| Westford | Westford Eagle www.wickedlocal.com/westford |
Paid Weekly | ||||
| Weston | The Weston Town Crier www.wickedlocal.com/weston |
Paid Weekly | ||||
| Weymouth | Weymouth News www.wickedlocal.com/weymouth |
Paid Weekly | ||||
| Winchester | The Winchester Star www.wickedlocal.com/winchester |
Paid Weekly | ||||
| Bellingham | County Gazette www.wickedlocal.com/franklin |
Free Weekly | ||||
| Boston | Boston Homes www.linkbostonhomes.com |
Free Weekly | ||||
| Bourne | Bourne Courier www.wickedlocal.com/bourne |
Free Weekly | ||||
| Bridgewater | Bridgewater Independent www.wickedlocal.com/bridgewater |
Free Weekly | ||||
| Brookline | Brookline Tab www.wickedlocal.com/brookline |
Free Weekly | ||||
| Canton | Canton Journal www.wickedlocal.com/canton |
Free Weekly | ||||
| Danvers | North Shore Sunday | Free Weekly | ||||
| Fall River | OJornal www.ojournal.com |
Free Weekly | ||||
| Falmouth | Falmouth Bulletin www.wickedlocal.com/falmouth |
Free Weekly | ||||
| Framingham | Framingham Tab www.wickedlocal.com/framingham |
Free Weekly | ||||
| Gloucester | Cape Ann Beacon | Free Weekly | ||||
| Needham | Needham Times www.wickedlocal.com/needham |
Free Weekly | ||||
| Newburyport | The Newburyport Current www.wickedlocal.com/newburyport |
Free Weekly | ||||
| Newton | Newton Tab www.wickedlocal.com/newton |
Free Weekly | ||||
| North Attleborough | The North Attleborough Free Press www.wickedlocal.com/northattleborough |
Free Weekly | ||||
| Randolph | Randolph Herald www.wickedlocal.com/randolph |
Free Weekly |
34
Table of Contents
| State |
City |
Masthead |
Circulation Type | |||
| Raynham | Raynham Call www.wickedlocal.com/raynham |
Free Weekly | ||||
| Salem | Salem Gazette www.wickedlocal.com/salem |
Free Weekly | ||||
| Sandwich | Sandwich Broadsider | Free Weekly | ||||
| Stoneham | Stoneham Sun www.wickedlocal.com/stoneham |
Free Weekly | ||||
| Wilmington | Wilmington Advocate www.wickedlocal.com/wilmington |
Free Weekly | ||||
| Woburn | Woburn Advocate www.wickedlocal.com/woburn |
Free Weekly | ||||
| Fall River | South Coast Life | Shopper | ||||
| Taunton | Yellow Jacket | Shopper | ||||
| Amesbury | www.wickedlocal.com/amesbury | On-line Only | ||||
| Ashland | www.wickedlocal.com/ashland | On-line Only | ||||
| Avon | www.wickedlocal.com/avon | On-line Only | ||||
| Bellingham | www.wickedlocal.com/bellingham | On-line Only | ||||
| Berkley | www.wickedlocal.com/berkley | On-line Only | ||||
| Bolton | www.wickedlocal.com/bolton | On-line Only | ||||
| Boxborough | www.wickedlocal.com/boxborough | On-line Only | ||||
| Brewster | www.wickedlocal.com/brewster | On-line Only | ||||
| Brockton | www.wickedlocal.com/brockton | On-line Only | ||||
| Chatham | www.wickedlocal.com/chatham | On-line Only | ||||
| Clinton | www.wickedlocal.com/clinton | On-line Only | ||||
| Dennis | www.wickedlocal.com/dennis | On-line Only | ||||
| Dighton | www.wickedlocal.com/dighton | On-line Only | ||||
| Duxbury | www.wickedlocal.com/duxbury | On-line Only | ||||
| East Bridgewater | www.wickedlocal.com/bridgewatereast | On-line Only | ||||
| Eastham | www.wickedlocal.com/eastham | On-line Only | ||||
| Essex | www.wickedlocal.com/essex | On-line Only | ||||
| Fall River | www.wickedlocal.com/fall-river | On-line Only | ||||
| Foxborough | www.wickedlocal.com/foxborough | On-line Only | ||||
| Gloucester | www.wickedlocal.com/gloucester | On-line Only | ||||
| Halifax | www.wickedlocal.com/halifax | On-line Only | ||||
| Hanson | www.wickedlocal.com/hanson | On-line Only | ||||
| Harvard | www.wickedlocal.com/harvard | On-line Only | ||||
| Harwich | www.wickedlocal.com/harwich | On-line Only | ||||
| Holliston | www.wickedlocal.com/holliston | On-line Only | ||||
| Hopedale | www.wickedlocal.com/hopedale | On-line Only | ||||
| Hull | www.wickedlocal.com/hull | On-line Only | ||||
| Lakeville | www.wickedlocal.com/lakeville | On-line Only | ||||
| Lancaster | www.wickedlocal.com/lancaster | On-line Only | ||||
| Manchester | www.wickedlocal.com/manchester | On-line Only | ||||
| Mashpee | www.wickedlocal.com/mashpee | On-line Only | ||||
| Mattapoisett | www.wickedlocal.com/mattapoisett | On-line Only | ||||
| Medway | www.wickedlocal.com/medway | On-line Only | ||||
| Mendon | www.wickedlocal.com/mendon | On-line Only | ||||
| Middleborough | www.wickedlocal.com/middleborough | On-line Only | ||||
| Middleton | www.wickedlocal.com/middleton | On-line Only | ||||
| Milford | www.wickedlocal.com/milford | On-line Only | ||||
| Millis | www.wickedlocal.com/millis | On-line Only |
35
Table of Contents
| State |
City |
Masthead |
Circulation Type | |||
| Milton | www.wickedlocal.com/milton | On-line Only | ||||
| Nantucket | www.wickedlocal.com/nantucket | On-line Only | ||||
| Norfolk | www.wickedlocal.com/norfolk | On-line Only | ||||
| North Boston | www.wickedlocal.com/northofboston | On-line Only | ||||
| Norton | www.wickedlocal.com/norton | On-line Only | ||||
| Orleans | www.wickedlocal.com/orleans | On-line Only | ||||
| Plainville | www.wickedlocal.com/plainville | On-line Only | ||||
| Plympton | www.wickedlocal.com/plympton | On-line Only | ||||
| Quincy | www.wickedlocal.com/quincy | On-line Only | ||||
| Rehoboth | www.wickedlocal.com/rehoboth | On-line Only | ||||
| Rochester | www.wickedlocal.com/rochester | On-line Only | ||||
| Rockport | www.wickedlocal.com/rockport | On-line Only | ||||
| Sandwich | www.wickedlocal.com/sandwich | On-line Only | ||||
| Sherborn | www.wickedlocal.com/sherborn | On-line Only | ||||
| Somerset | www.wickedlocal.com/somerset | On-line Only | ||||
| Southborough | www.wickedlocal.com/southborough | On-line Only | ||||
| Stow | www.wickedlocal.com/stow | On-line Only | ||||
| Swansea | www.wickedlocal.com/swansea | On-line Only | ||||
| Taunton | www.wickedlocal.com/taunton | On-line Only | ||||
| Topsfield | www.wickedlocal.com/topsfield | On-line Only | ||||
| Truro | www.wickedlocal.com/truro | On-line Only | ||||
| Upton | www.wickedlocal.com/upton | On-line Only | ||||
| Wellfleet | www.wickedlocal.com/wellfleet | On-line Only | ||||
| Wenham | www.wickedlocal.com/wenham | On-line Only | ||||
| West Bridgewater | www.wickedlocal.com/bridgewaterwest | On-line Only | ||||
| West Port | www.wickedlocal.com/westport | On-line Only | ||||
| Whitman | www.wickedlocal.com/whitman | On-line Only | ||||
| Wrentham | www.wickedlocal.com/wrentham | On-line Only | ||||
| Yarmouth | www.wickedlocal.com/yarmouth | On-line Only | ||||
| New York | Canandaigua | Daily Messenger www.mpnnow.com www.mpnnow.com/commercialprinting |
Daily | |||
| Newark/Palmyra | Wayne Post www.waynepost.com |
Paid Weekly | ||||
| Brighton/Pittsford | Brighton-Pittsford Post www.brightonpittsfordpost.com |
Free Weekly | ||||
| Canandaigua | Canandaigua Community Post | Free Weekly | ||||
| Fairport | Fairport-ER Post www.fairport-erpost.com |
Free Weekly | ||||
| Gates/Chili | Gates-Chili Post www.gateschilipost.com |
Free Weekly | ||||
| Greece | Greece Post www.greecepost.com |
Free Weekly | ||||
| Henrietta | Henrietta Post www.henriettapost.com |
Free Weekly | ||||
| Irondequoit | Irondequoit Post www.irondequiotpost.com |
Free Weekly | ||||
| Penfield | Penfield Post www.penfieldpost.com |
Free Weekly | ||||
| Victor | Victor Post www.victorpost.com |
Free Weekly |
36
Table of Contents
| State |
City |
Masthead |
Circulation Type | |||
| Webster | Webster Post www.websterpost.com |
Free Weekly | ||||
| Lyons | Lyons Shopping Guide | Shopper | ||||
| Newark | Newark Pennysaver | Shopper | ||||
| Sodus | Sodus Pennysaver | Shopper | ||||
| Wayne County | Timesaver | Shopper | ||||
| Delaware | Dover | Smyrna/Clayton Sun Times www.scsuntimes.com |
Paid Weekly | |||
| Dover | The Middletown Transcript www.middletowntranscript.com |
Paid Weekly | ||||
| Dover | The Sussex Countian www.sussexcountian.com |
Paid Weekly | ||||
| Dover | Dover Post www.doverpost.com |
Free Weekly | ||||
| Dover | Community Publication www.communitypub.com |
Free Weekly | ||||
| Dover | Milford Beacon www.milfordbeacon.com |
Free Weekly | ||||
| Dover | The Express www.delmarvaexpress.com |
Shopper |
37
Table of Contents
Large Daily Newspapers
| State |
City |
Masthead |
Circulation Type | |||
| Illinois | Freeport | The Journal Standard www.journalstandard.com |
Daily | |||
| Lincoln | The Courier www.lincolncourier.com |
Daily | ||||
| Peoria | Journal Star www.pjstar.com |
Daily | ||||
| Rockford | Rockford Register Star www.rrstar.com www.rockfordwoman.com www.rockfordparent.com |
Daily | ||||
| Springfield | The State Journal-Register www.sj-r.com |
Daily | ||||
| Freeport | The Scene | Shopper | ||||
| Lincoln | Logan County Shopper | Shopper | ||||
| Peoria | JS Shopper | Shopper | ||||
| Peoria | Pekin Extra | Shopper | ||||
| Rockford | The Weekly | Shopper | ||||
| Springfield | Springfield Advertiser | Shopper | ||||
| Springfield | Springfield Shopper | Shopper | ||||
| New York | Herkimer | The Evening Telegram www.herkimertelegram.com |
Daily | |||
| Little Falls | The Evening Times www.littlefallstimes.com |
Daily | ||||
| Utica | Utica Observer-Dispatch www.uticaod.com |
Daily | ||||
| Hamilton | Mid-York Weekly | Free Weekly | ||||
| Utica | The Pennysaver | Free Weekly | ||||
| Herkimer | Your Valley | Shopper | ||||
| Rome | Rome Pennysaver | Shopper | ||||
| Ohio | Canton | The Repository www.cantonrep.com |
Daily | |||
| Dover/New Philadelphia | The Times-Reporter www.timesreporter.com |
Daily | ||||
| Massillon | The Independent www.indeonline.com |
Daily | ||||
| Green | The Suburbanite www.thesuburbanite.com |
Free Weekly | ||||
| Canton | The Wrap | Shopper | ||||
| Dover/New Philadelphia | TMC-ExTRa | Shopper | ||||
| Ohio | www.fridaynightohio.com | On-line Only | ||||
| Connecticut | Norwich | The Bulletin www.norwichbulletin.com |
Daily | |||
| Norwich | Bulletin Deals | Shopper |
38
Table of Contents
Local Media
| State |
City |
Masthead |
Circulation Type | |||
| Massachusetts | Hyannis | Cape Cod Times www.CapeCodOnline.com |
Daily | |||
| New Bedford | The Standard-Times www.southcoasttoday.com |
Daily | ||||
| Hyannis | Barnstable Patriot www.barnstablepatriot.com |
Paid Weekly | ||||
| Middleboro | Middleboro Gazette www.southcoasttoday.com |
Paid Weekly | ||||
| Nantucket | Nantucket Inquirer & Mirror www.ack.net www.discovernantucket.com |
Paid Weekly | ||||
| New Bedford | Advocate www.southcoasttoday.com |
Paid Weekly | ||||
| New Bedford | Chronicle www.southcoasttoday.com |
Paid Weekly | ||||
| New Bedford | Spectator www.southcoasttoday.com |
Paid Weekly | ||||
| Fall River | Fall River Spirit www.southcoasttoday.com |
Free Weekly | ||||
| Hyannis | DollarSaver/TMC | Shopper | ||||
| Middleboro | Middleboro Gazette www.southcoasttoday.com |
Shopper | ||||
| New Bedford | SouthCoast MarketPlace/TMC | Shopper | ||||
| New Hampshire | Portsmouth | Portsmouth Herald www.seacoastonline.com |
Daily | |||
| Exeter | Exeter News-Letter www.seacoastonline.com |
Paid Weekly | ||||
| Hampton | Hampton Union www.seacoastonline.com |
Paid Weekly | ||||
| Portsmouth | Seacoast Sunday www.seacoastonline.com |
Paid Weekly | ||||
| Hampton | Beachcomber www.seacoastonline.com |
Free Weekly | ||||
| New York | Middletown | Times Herald-Record www.recordonline.com |
Daily | |||
| Middletown | The Gazette www.hudsonvalley.com |
Free Weekly | ||||
| Middletown | Pointer View www.pointerview.com |
Free Weekly | ||||
| Middletown | Extra/TMC | Shopper | ||||
| Oregon | Medford | Ashland Daily Tidings www.dailytidings.com |
Daily | |||
| Medford | Mail Tribune www.mailtribune.com |
Daily | ||||
| Medford | A la Carte/TMC | Shopper | ||||
| Medford | Nickel www.medfordnickel.com |
Shopper | ||||
| California | Stockton | The Stockton Record www.recordnet.com |
Daily |
39
Table of Contents
| State |
City |
Masthead |
Circulation Type | |||
| Stockton | VIDA | Free Weekly | ||||
| Stockton | The Valley Marketplace/TMC www.valleymarketplace.com |
Shopper | ||||
| Pennsylvania | Stroudsburg | Pocono Record www.poconorecord.com |
Daily | |||
| Stroudsburg | Pike & Monroe Life | Free Weekly | ||||
| Stroudsburg | Plus/TMC | Shopper | ||||
| Maine | Kennebunk | York County Coast Star www.seacoastonline.com |
Paid Weekly | |||
| York | York Weekly www.seacoastonline.com |
Paid Weekly |
40
Table of Contents
| Item 1A. | Risk Factors |
You should carefully consider the following risks and other information in this Annual Report in evaluating us and our common stock. Any of the following risks could materially and adversely affect our results of operations or financial condition. The risk factors generally have been separated into the following groups: Risks Related to Our Business, Risks Related to Our Manager, and Risks Related to Our Common Stock.
Risks Related to Our Business
We depend to a great extent on the economies and the demographics of the local communities that we serve, and we are also susceptible to general economic downturns, which have had, and could continue to have, a material and adverse impact on our advertising and circulation revenues and on our profitability.
Our advertising revenues and, to a lesser extent, circulation revenues, depend upon a variety of factors specific to the communities that our publications serve. These factors include, among others, the size and demographic characteristics of the local population, local economic conditions in general and the economic condition of the retail segments of the communities that our publications serve. If the local economy, population or prevailing retail environment of a community we serve experiences a downturn, our publications, revenues and profitability in that market could be adversely affected. Our advertising revenues are also susceptible to negative trends in the general economy, like the economic downturn recently experienced, that affect consumer spending. The advertisers in our newspapers and other publications and related websites are primarily retail businesses that can be significantly affected by regional or national economic downturns and other developments. Continuing or deepening softness in the U.S. economy could also significantly affect key advertising revenue categories, such as help wanted, real estate and automotive.
Uncertainty and adverse changes in the general economic conditions of markets in which we participate may negatively affect our business.
Current and future conditions in the economy have an inherent degree of uncertainty. As a result, it is difficult to estimate the level of growth or contraction for the economy as a whole. It is even more difficult to estimate growth or contraction in various parts, sectors and regions of the economy, including the markets in which we participate. Adverse changes may occur as a result of weak global economic conditions, rising oil prices, wavering consumer confidence, unemployment, declines in stock markets, contraction of credit availability, declines in real estate values, or other factors affecting economic conditions in general. These changes may negatively affect the sales of our products, increase exposure to losses from bad debts, increase the cost and decrease the availability of financing, or increase costs associated with publishing and distributing our publications.
Our ability to generate revenues is correlated with the economic conditions of two geographic regions of the United States.
Our Company primarily generates revenue in two geographic regions: the Northeast and the Midwest. During the year ended December 29, 2013, approximately 36% of our total revenues (and those of our Predecessor) were generated in two states in the Northeast: Massachusetts and New York. During the same period, approximately 34% of our total revenues were generated in two states in the Midwest: Illinois and Ohio. As a result of this geographic concentration, our financial results, including advertising and circulation revenue, depend largely upon economic conditions in these principal market areas. Accordingly, adverse economic developments within these two regions in particular could significantly affect our consolidated operations and financial results.
Our indebtedness and any future indebtedness may limit our financial and operating activities and our ability to incur additional debt to fund future needs or dividends.
As of December 29, 2013, GateHouse’s outstanding indebtedness included the First Lien Credit Facility (as defined below) consisting of term loans in the aggregate principal amount of $75 million and a revolving credit
41
Table of Contents
facility in an aggregate principal amount of up to $40 million (of which $25 million was funded on November 26, 2013) and a Second Lien Credit Facility (as defined below) consisting of a term loan in the aggregate principal amount of $50 million. Additionally, Local Media Parent entered into the Local Media Credit Facility, which consists of a $33 million senior secured term loan, which was funded on September 3, 2013, and a senior secured asset-based revolving credit facility in an aggregate principal amount of up to $10 million, whose full availability was activated on October 25, 2013. This indebtedness and any future indebtedness we incur could:
| • | require us to dedicate a portion of cash flow from operations to the payment of principal and interest on indebtedness, including indebtedness we may incur in the future, thereby reducing the funds available for other purposes, including dividends or other distributions; |
| • | subject us to increased sensitivity to increases in prevailing interest rates; |
| • | place us at a competitive disadvantage to competitors with relatively less debt in economic downturns, adverse industry conditions or catastrophic external events; or |
| • | reduce our flexibility in planning for or responding to changing business, industry and economic conditions. |
In addition, our indebtedness could limit our ability to obtain additional financing on acceptable terms or at all to fund future acquisitions, working capital, capital expenditures, debt service requirements, general corporate and other purposes, which would have a material effect on our business and financial condition. Our liquidity needs could vary significantly and may be affected by general economic conditions, industry trends, performance and many other factors not within our control.
The Local Media Credit Facility and GateHouse Credit Facilities contain covenants that restrict our operations and may inhibit our ability to grow our business, increase revenues and pay dividends to our stockholders.
The Local Media Credit Facility and GateHouse Credit Facilities contain various restrictions, covenants and representations and warranties. If we fail to comply with any of these covenants or breach these representations or warranties in any material respect, such noncompliance would constitute a default under the Local Media Credit Facility and GateHouse Credit Facilities, as applicable (subject to applicable cure periods), and the lenders could elect to declare all amounts outstanding under the agreements related thereto to be immediately due and payable and enforce their respective interests against collateral pledged under such agreements.
The covenants and restrictions in the Local Media Credit Facility and GateHouse Credit Facilities generally restrict our ability to, among other things:
| • | incur or guarantee additional debt; |
| • | make certain investments or acquisitions; |
| • | transfer or sell assets; |
| • | make distributions on common stock; |
| • | create or incur liens; and |
| • | enter into transactions with affiliates. |
The restrictions described above may interfere with our ability to obtain new or additional financing or may affect the manner in which we structure such new or additional financing or engage in other business activities, which may significantly limit or harm our results of operations, financial condition and liquidity. A default and any resulting acceleration of obligations could also result in an event of default and declaration of acceleration under our other existing debt agreements. Such an acceleration of our debt would have a material adverse effect on our liquidity and our ability to continue as a going concern. A default could also significantly limit our
42
Table of Contents
alternatives to refinance both the debt under which the default occurred and other indebtedness. This limitation may significantly restrict our financing options during times of either market distress or our financial distress, which are precisely the times when having financing options is most important.
We may not generate a sufficient amount of cash or generate sufficient funds from operations to fund our operations, pay dividends or repay our indebtedness.
Our ability to make payments on our indebtedness as required depends on our ability to generate cash flow from operations in the future. This ability, to a certain extent, is subject to general economic, financial, competitive, legislative, regulatory and other factors that are beyond our control.
If we do not generate sufficient cash flow from operations to satisfy our debt obligations, including interest payments and the payment of principal at maturity, we may have to undertake alternative financing plans, such as refinancing or restructuring our debt, selling assets, reducing or delaying capital investments or seeking to raise additional capital. We cannot provide assurance that any refinancing would be possible, that any assets could be sold, or, if sold, of the timeliness and amount of proceeds realized from those sales, that additional financing could be obtained on acceptable terms, if at all, or that additional financing would be permitted under the terms of our various debt instruments then in effect. Furthermore, our ability to refinance would depend upon the condition of the finance and credit markets. Our inability to generate sufficient cash flow to satisfy our debt obligations, or to refinance our obligations on commercially reasonable terms or on a timely basis, would materially affect our business, financial condition or results of operations.
We may not be able to pay dividends in accordance with our announced intent or at all.
We have announced our intent to pay a substantial portion of our free cash flow as a dividend to our stockholders, subject to satisfactory financial performance and approval by our Board of Directors. The Board of Directors’ determinations regarding dividends will depend on a variety of factors, including the Company’s GAAP net income, free cash flow generated from operations or other sources, liquidity position and potential alternative uses of cash, such as acquisitions, as well as economic conditions and expected future financial results. Our ability to declare future dividends will depend on our future financial performance, which in turn depends on the successful implementation of our strategy and on financial, competitive, regulatory, technical and other factors, general economic conditions, demand and selling prices for our products and other factors specific to our industry or specific projects, many of which are beyond our control. Therefore, our ability to generate free cash flow depends on the performance of our operations and could be limited by decreases in our profitability or increases in costs, capital expenditures or debt servicing requirements.
Our Predecessor suspended the payments of dividends commencing with the second quarter of 2008. We own substantially all of our Predecessor’s assets, and our Predecessor experienced revenue and cash flow declines in the past. In addition, we may acquire additional companies with declining cash flow as part of a strategy aimed at stabilizing cash flow through expense reduction and digital expansion. If our strategy is not successful, we may not be able to pay dividends.
As a holding company, we are also dependent on our subsidiaries being able to pay dividends to us. Our subsidiaries are subject to restrictions on the ability to pay dividends under the various instruments governing their indebtedness. If our subsidiaries incur additional debt or losses, such additional indebtedness or loss may further impair their ability to pay dividends or make other distributions to us. In addition, our ability to pay dividends will be substantially affected by the ability of our subsidiaries to provide cash to us. The ability of our subsidiaries to declare and pay dividends to us will also be dependent on their cash income and cash available and may be restricted under applicable law or regulation. Under Delaware law, approval of the Board of Directors is required to approve any dividend, which may only be paid out of surplus or net profit for the applicable fiscal year. We may not be able to pay dividends in accordance with our announced intent or at all.
43
Table of Contents
The collectability of accounts receivable under adverse economic conditions could deteriorate to a greater extent than provided for in our financial statements and in our projections of future results.
Adverse economic conditions in the United States have increased our exposure to losses resulting from financial distress, insolvency and the potential bankruptcy of our advertising customers. Our accounts receivable are stated at net estimated realizable value and our allowance for doubtful accounts has been determined based on several factors, including receivable agings, significant individual credit risk accounts and historical experience. If such collectability estimates prove inaccurate, adjustments to future operating results could occur.
Our Predecessor experienced declines in its credit ratings, and filed a voluntary petition to reorganize under Chapter 11 of the U.S. Bankruptcy Code, which could adversely affect our ability to obtain new financing to fund our operations and strategic initiatives or to refinance our existing debt at attractive rates.
During 2008, GateHouse’s credit rating was downgraded to below investment grade by both Standard & Poor’s and Moody’s Investors Service. GateHouse’s credit rating was further downgraded in 2009 and 2010. Furthermore, on September 27, 2013, GateHouse filed a voluntary petition to reorganize under Chapter 11 of the U.S. Bankruptcy Code (and emerged from Chapter 11 protection on November 26, 2013). These downgrades and events may negatively affect our cost of financing and subject us to more restrictive covenants than those that might otherwise apply. As a result, our financing options may be limited. Any future downgrades in our credit ratings could further increase our borrowing costs, subject us to more onerous terms and reduce or eliminate our borrowing flexibility in the future. Such limitations on our financing options may adversely affect our ability to refinance existing debt and incur new debt to fund our operations and strategic initiatives.
If there is a significant increase in the price of newsprint or a reduction in the availability of newsprint, our results of operations and financial condition may suffer.
The basic raw material for our publications is newsprint. We generally maintain only a 45 to 55-day inventory of newsprint, although our participation in a newsprint-buying consortium has helped ensure adequate supply. An inability to obtain an adequate supply of newsprint at a favorable price or at all in the future could have a material adverse effect on our ability to produce our publications. Historically, the price of newsprint has been volatile, reaching a high of approximately $823 per metric ton in 2008 and experiencing a low of almost $410 per metric ton in 2002. The average price of newsprint for 2013 was approximately $643 per metric ton. Recent and future consolidation of major newsprint suppliers may adversely affect price competition among suppliers. Significant increases in newsprint costs for properties and periods not covered by our newsprint vendor agreement could have a material adverse effect on our financial condition and results of operations.
Our Predecessor experienced declines in advertising revenue, and further declines, which could adversely affect our results of operations and financial condition, may occur.
Our Predecessor experienced declines in advertising revenue over the past few years, due primarily to the economic recession and advertisers’ shift from print to digital media. Advertising revenue decreased by $26.2 million, or 7.4%, in the year ended December 30, 2012, as compared to the year ended January 1, 2012. Advertising revenue decreased by $29.6 million, or 9.0%, in the year ended December 29, 2013, as compared to the year ended December 30, 2012 for total company excluding Local Media (“GateHouse Standalone”). We continue to search for organic growth opportunities, including in our digital advertising business, and for ways to stabilize print revenue declines through new product launches and pricing. However, there can be no assurance that our advertising revenue will not continue to decline. Further declines in advertising revenue could adversely affect our results of operations and financial condition.
We compete with a large number of companies in the local media industry; if we are unable to compete effectively, our advertising and circulation revenues may decline.
Our business is concentrated in newspapers and other print publications located primarily in small and midsize markets in the United States. Our revenues primarily consist of advertising and paid circulation.
44
Table of Contents
Competition for advertising revenues and paid circulation comes from direct mail, directories, radio, television, outdoor advertising, other newspaper publications, the internet and other media. For example, as the use of the internet and mobile devices has increased, we have lost some classified advertising and subscribers to online advertising businesses. Competition for advertising revenues is based largely upon advertiser results, advertising rates, readership, demographics and circulation levels. Competition for circulation is based largely upon the content of the publication and its price and editorial quality. Our local and regional competitors vary from market to market and many of our competitors for advertising revenues are larger and have greater financial and distribution resources than us. We may incur increased costs competing for advertising expenditures and paid circulation. We may also experience a decline of circulation or print advertising revenue due to alternative media, such as the internet. If we are not able to compete effectively for advertising expenditures and paid circulation, our revenues may decline.
We are undertaking strategic process upgrades that could have a material adverse financial impact if unsuccessful.
We are implementing strategic process upgrades of our business. Among other things we are implementing the standardization and centralization of systems and processes, the outsourcing of certain financial processes and the use of new software for our circulation, advertising and editorial systems. As a result of ongoing strategic evaluation and analysis, we have made and will continue to make changes that, if unsuccessful, could have a material adverse financial impact.
We have invested in growing our digital business, but such investments may not be successful, which could adversely affect our results of operations.
We continue to evaluate our business and how we intend to grow our digital business. Internal resources and effort are put towards this business and key partnerships have been entered into to assist with our digital business. We continue to believe that our digital businesses offer opportunities for revenue growth to support and, in some cases, offset the revenue trends we have seen in our print business. There can be no assurances that the partnerships we have entered into or the internal strategy being employed will result in generating or increasing digital revenues in amounts necessary to stabilize or offset trends in print revenues. In addition, we have a limited history of operations in this area and there can be no assurances that past performance will be indicative of future performance or future trends. If our digital strategy is not as successful as we anticipate, our financial condition, results of operations and ability to pay dividends could be adversely affected.
If we are unable to retain and grow our digital audience and advertiser base, our digital businesses will be adversely affected.
Given the ever-growing and rapidly changing number of digital media options available on the internet, we may not be able to increase our online traffic sufficiently and retain or grow a base of frequent visitors to our websites and applications on mobile devices.
Accordingly, we may not be able to create sufficient advertiser interest in our digital businesses and to maintain or increase the advertising rates of the inventory on our websites.
In addition, the ever-growing and rapidly changing number of digital media options available on the internet may lead to technologies and alternatives that we are not able to offer or about which we are not able to advise. Such circumstances could directly and adversely affect the availability, applicability, marketability and profitability of the suite of SMB services and the private ad exchange we offer as a significant part of our digital business.
Technological developments and any changes we make to our business strategy may require significant capital investments. Such investments may be restricted by our current or future credit facilities.
45
Table of Contents
Our business is subject to seasonal and other fluctuations, which affects our revenues and operating results.
Our business is subject to seasonal fluctuations that we expect to continue to be reflected in our operating results in future periods. Our first fiscal quarter of the year tends to be our weakest quarter because advertising volume is at its lowest levels following the December holiday season. Correspondingly, our second and fourth fiscal quarters tend to be our strongest because they include heavy holiday and seasonal advertising. Other factors that affect our quarterly revenues and operating results may be beyond our control, including changes in the pricing policies of our competitors, the hiring and retention of key personnel, wage and cost pressures, distribution costs, changes in newsprint prices and general economic factors.
We could be adversely affected by declining circulation.
Overall daily newspaper circulation, including national and urban newspapers, has declined in recent years. For the year ended December 30, 2012, our Predecessor’s circulation revenue decreased by $0.3 million, or 0.2%, as compared to the year ended January 1, 2012. There can be no assurance that our circulation revenue will not decline again in the future. Our Predecessor has been able to maintain its annual circulation revenue from existing operations in recent years through, among other things, increases in per copy prices. However, there can be no assurance that we will be able to continue to increase prices to offset any declines in circulation. Further declines in circulation could impair our ability to maintain or increase our advertising prices, cause purchasers of advertising in our publications to reduce or discontinue those purchases and discourage potential new advertising customers, all of which could have a material adverse effect on our business, financial condition, results of operations, cash flows and ability to pay a dividend.
The increasing popularity of digital media could also adversely affect circulation of our newspapers, which may decrease circulation revenue and cause more marked declines in print advertising. If we are not successful in offsetting such declines in revenues from our print products, our business, financial condition and prospects will be adversely affected.
Our Predecessor had a history of losses and we may not be able to maintain profitable operations in the future.
Our Predecessor experienced losses from continuing operations of approximately $27.5 million and $21.0 million in 2012 and 2011, respectively. Our results of operations in the future will depend on many factors, including our ability to execute our business strategy and realize efficiencies through our clustering strategy. Our failure to achieve profitability in the future could adversely affect the trading price of our Common Stock and our ability to pay dividends and raise additional capital for growth.
The value of our intangible assets may become impaired, depending upon future operating results.
As a result of the Restructuring, which was considered a triggering event for the non-amortizable intangibles, our Predecessor performed a valuation analysis to determine if an impairment existed as of September 29, 2013. The fair values of our Predecessor’s reporting units for goodwill and newspaper mastheads were estimated using the expected present value of future cash flows, recent industry transaction multiples and using estimates, judgments and assumptions that their management believed were appropriate in the circumstances and were consistent with the terms of the Plan. The estimates and judgments used in the assessment included multiples for revenue and EBITDA, the weighted average cost of capital and the terminal growth rate. Given the Restructuring, our Predecessor determined that discounted cash flows provided the best estimate of the fair value of its reporting units. The estimated fair value of the Large Daily reporting unit exceeded its carrying value and Step 2 of the analysis was not necessary. The Small Community reporting unit failed the Step 1 goodwill impairment analysis. Our Predecessor performed Step 2 of the analysis using consistent assumptions, as discussed above, and determined an impairment was not present for this reporting unit. The estimated fair value of each reporting unit’s mastheads exceeded their carrying values, using consistent assumptions as discussed above. The masthead fair value was estimated using the relief from royalty valuation method. For further information on goodwill and intangible assets, see Note 8 “Goodwill and Intangible Assets” to the consolidated financial statements.
46
Table of Contents
Due to reductions in our Predecessor’s operating projections during the third quarter in conjunction with the Restructuring, an impairment charge of $68.6 million was recognized for advertiser relationships within the Predecessor’s Metro and Small Community reporting units, an impairment charge of $19.1 million was recognized for subscriber relationships within the Company’s Metro and Small Community reporting units, an impairment charge of $2.1 million was recognized for customer relationships within the Company’s Metro reporting unit and an impairment charge of $1.8 million was recognized for trade names and publication rights within the Directories business unit. Refer to Note 19 “Fair Value Measurement” for additional information on the impairment charge. For further information on our Predecessor’s impairment charge and its effect on the Company financial statements, see Note 19 “Fair Value Measurement” to the consolidated financial statements.
The newspaper industry and more specifically, our Predecessor have experienced declining same store revenue and profitability in the past. Should general economic, market or business conditions decline, and have a negative impact on estimates of future cash flow and market transaction multiples, the Company may be required to record additional impairment charges in the future.
At December 29, 2013 the carrying value of our goodwill is $125.9 million, mastheads is $45.9 million, and amortizable intangible assets is $99.6 million.
We are subject to environmental and employee safety and health laws and regulations that could cause us to incur significant compliance expenditures and liabilities.
Our operations are subject to federal, state and local laws and regulations pertaining to the environment, storage tanks and the management and disposal of wastes at our facilities. Under various environmental laws, a current or previous owner or operator of real property may be liable for contamination resulting from the release or threatened release of hazardous or toxic substances or petroleum at that property. Such laws often impose liability on the owner or operator without regard to fault and the costs of any required investigation or cleanup can be substantial. Although in connection with certain of our Predecessor’s acquisitions we have rights to indemnification for certain environmental liabilities, these rights may not be sufficient to reimburse us for all losses that we might incur if a property acquired by us has environmental contamination.
Our operations are also subject to various employee safety and health laws and regulations, including those pertaining to occupational injury and illness, employee exposure to hazardous materials and employee complaints. Environmental and employee safety and health laws tend to be complex, comprehensive and frequently changing. As a result, we may be involved from time to time in administrative and judicial proceedings and investigations related to environmental and employee safety and health issues. These proceedings and investigations could result in substantial costs to us, divert our management’s attention and adversely affect our ability to sell, lease or develop our real property. Furthermore, if it is determined that we are not in compliance with applicable laws and regulations, or if our properties are contaminated, it could result in significant liabilities, fines or the suspension or interruption of the operations of specific printing facilities.
Future events, such as changes in existing laws and regulations, new laws or regulations or the discovery of conditions not currently known to us, may give rise to additional compliance or remedial costs that could be material.
Sustained increases in costs of employee health and welfare benefits may reduce our profitability. Moreover, our pension plan obligations are currently underfunded, and we may have to make significant cash contributions to our plans, which could reduce the cash available for our business.
In recent years, our Predecessor experienced significant increases in the cost of employee medical benefits because of economic factors beyond its control, including increases in health care costs. At least some of these factors may continue to put upward pressure on the cost of providing medical benefits. Although we have actively sought to control increases in these costs, there can be no assurance that we will succeed in limiting cost increases, and continued upward pressure could reduce the profitability of our businesses.
47
Table of Contents
Our pension and postretirement plans were underfunded by $10.2 million at December 29, 2013. Our pension plan invests in a variety of equity and debt securities, many of which were affected by the disruptions in the credit and capital markets in 2009 and 2010. Future volatility and disruption in the stock markets could cause further declines in the asset values of our pension plans. In addition, a decrease in the discount rate used to determine minimum funding requirements could result in increased future contributions. If either occurs, we may need to make additional pension contributions above what is currently estimated, which could reduce the cash available for our businesses.
We may not be able to protect intellectual property rights upon which our business relies and, if we lose intellectual property protection, our assets may lose value.
Our business depends on our intellectual property, including, but not limited to, our titles, mastheads, content and services, which we attempt to protect through patents, copyrights, trade laws and contractual restrictions, such as confidentiality agreements. We believe our proprietary and other intellectual property rights are important to our success and our competitive position.
Despite our efforts to protect our proprietary rights, unauthorized third parties may attempt to copy or otherwise obtain and use our content, services and other intellectual property, and we cannot be certain that the steps we have taken will prevent any misappropriation or confusion among consumers and merchants, or unauthorized use of these rights. If we are unable to procure, protect and enforce our intellectual property rights, we may not realize the full value of these assets, and our business may suffer. If we must litigate to enforce our intellectual property rights or determine the validity and scope of the proprietary rights of third parties, such litigation may be costly and divert the attention of our management from day-to-day operations.
We depend on key personnel and we may not be able to operate or grow our business effectively if we lose the services of any of our key personnel or are unable to attract qualified personnel in the future.
The success of our business is heavily dependent on our ability to retain our management and other key personnel and to attract and retain qualified personnel in the future. Competition for senior management personnel is intense and we may not be able to retain our key personnel. Although our Predecessor entered into employment agreements with certain of our key personnel, these agreements do not ensure that our key personnel will continue in their present capacity with us for any particular period of time. We do not have key man insurance for any of our current management or other key personnel. The loss of any key personnel would require our remaining key personnel to divert immediate and substantial attention to seeking a replacement. An inability to find a suitable replacement for any departing executive officer on a timely basis could adversely affect our ability to operate or grow our business.
A shortage of skilled or experienced employees in the media industry, or our inability to retain such employees, could pose a risk to achieving improved productivity and reducing costs, which could adversely affect our profitability.
Production and distribution of our various publications requires skilled and experienced employees. A shortage of such employees, or our inability to retain such employees, could have an adverse impact on our productivity and costs, our ability to expand, develop and distribute new products and our entry into new markets. The cost of retaining or hiring such employees could exceed our expectations which could adversely affect our results of operations.
A number of our employees are unionized, and our business and results of operations could be adversely affected if current or additional labor negotiations or contracts were to further restrict our ability to maximize the efficiency of our operations.
As of December 29, 2013, we employed approximately 5,576 employees, of whom approximately 784 (or approximately 14.1%) were represented by 27 unions. 90% of the unionized employees are in three states: Massachusetts, Illinois and Ohio and represent 24%, 41% and 25% of all our union employees, respectively. Most of our unionized employees work under collective bargaining agreements that expire in 2014.
48
Table of Contents
Although our newspapers have not experienced a union strike in the recent past nor do we anticipate a union strike to occur, we cannot preclude the possibility that a strike may occur at one or more of our newspapers at some point in the future. We believe that, in the event of a newspaper strike, we would be able to continue to publish and deliver to subscribers, which is critical to retaining advertising and circulation revenues, although there can be no assurance of this.
Our potential inability to successfully execute cost control measures could result in greater than expected total operating costs.
We and our Predecessor have implemented general cost control measures, and we expect to continue such cost control efforts in the future. If we do not achieve expected savings as a result of such measures or if our operating costs increase as a result of our growth strategy, our total operating costs may be greater than expected. In addition, reductions in staff and employee benefits could affect our ability to attract and retain key employees.
We may not realize all of the anticipated benefits of the synergies between GateHouse and Local Media or potential future acquisitions, which could adversely affect our business, financial condition and results of operations.
Our ability to realize the anticipated benefits of the synergies between GateHouse and Local Media or potential future acquisitions of assets or companies will depend, in part, on our ability to scale-up to appropriately integrate the businesses of Local Media and GateHouse and other such acquired companies with our business. The process of acquiring assets or companies may disrupt our business and may not result in the full benefits expected. Additionally, we may not be successful in identifying acquisition opportunities, assessing the value, strengths and weaknesses of these opportunities and consummating acquisitions on acceptable terms. Furthermore, suitable acquisition opportunities may not even be made available or known to us. In addition, valuations of potential acquisitions may rise materially, making it economically unfeasible to complete identified acquisitions. The risks associated with integrating the operations of GateHouse and Local Media and potential future acquisitions include, among others:
| • | uncoordinated market functions; |
| • | unanticipated issues in integrating the operations and personnel of the acquired businesses; |
| • | the incurrence of indebtedness and the assumption of liabilities; |
| • | the incurrence of significant additional capital expenditures, transaction and operating expenses and non-recurring acquisition-related charges; |
| • | unanticipated adverse impact on our earnings from the amortization or write-off of acquired goodwill and other intangible assets; |
| • | not retaining key employees, vendors, service providers, readers and customers of the acquired businesses; and |
| • | the diversion of management’s attention from ongoing business concerns. |
If we are unable to successfully implement our acquisition strategy or address the risks associated with integrating the operations of GateHouse and Local Media or potential future acquisitions, or if we encounter unforeseen expenses, difficulties, complications or delays frequently encountered in connection with the integration of acquired entities and the expansion of operations, our growth and ability to compete may be impaired, we may fail to achieve acquisition synergies and we may be required to focus resources on integration of operations rather than other profitable areas. Moreover, the success of any acquisition will depend upon our ability to effectively integrate the acquired assets or businesses. The acquired assets or businesses may not contribute to our revenues or earnings to any material extent, and cost savings and synergies we expect at the time of an acquisition may not be realized once the acquisition has been completed. Furthermore, if we incur
49
Table of Contents
indebtedness to finance an acquisition, the acquired business may not be able to generate sufficient cash flow to service that indebtedness. Unsuitable or unsuccessful acquisitions could adversely affect our business, financial condition, results of operations, cash flow and ability to pay dividends.
Our financial results were affected by the adoption of fresh start reporting and may not reflect historical trends.
Pursuant to the Plan, we acquired substantially all of the assets of our Predecessor. The Restructuring resulted in us becoming a new reporting entity and adopting fresh start accounting. As required by fresh start accounting, our Predecessor’s assets and liabilities were adjusted to measured value, and we recognized certain assets and liabilities not previously recognized in our Predecessor’s financial statements. Accordingly, our financial condition and results of operations from and after the Effective Date are not comparable to the financial condition and results of operations reflected in our Predecessor’s historical consolidated financial statements, including those presented herein.
We cannot be certain that the Restructuring will not adversely affect our operations going forward.
We cannot provide assurance that the Restructuring will not adversely affect our future operations. Our suppliers and vendors could stop providing supplies or services to us or provide such supplies or services only on unfavorable terms such as “cash on delivery,” “cash on order” or other terms that could have an adverse impact on our short-term cash flows. In addition, the Restructuring may adversely affect our ability to retain existing readers and advertisers, attract new readers and advertisers and maintain contracts that are critical to our operations.
Risks Related to Our Manager
We are dependent on our Manager and may not find a suitable replacement if our Manager terminates the Management Agreement.
We are externally managed by our Manager. Our Manager does not have any prior experience directly managing our Company or media-related assets. We are completely reliant on our Manager, which has significant discretion as to the implementation of our operating policies and strategies, to conduct our business. We are subject to the risk that our Manager will terminate the Management Agreement and that we will not be able to find a suitable replacement for our Manager in a timely manner, at a reasonable cost or at all. Furthermore, we are dependent on the services of certain key employees of our Manager whose compensation is partially or entirely dependent upon the amount of incentive or management compensation earned by our Manager and whose continued service is not guaranteed, and the loss of such services could adversely affect our operations.
There may be conflicts of interest in our relationship with our Manager, including with respect to corporate opportunities.
We have entered into a Management Agreement with an affiliate of Fortress pursuant to which our management team will not be required to exclusively dedicate their services to us and will provide services for other entities affiliated with our Manager.
Our amended and restated certificate of incorporation and amended and restated bylaws provide that if Fortress or any of their officers, directors or employees acquire knowledge of a potential transaction that could be a corporate opportunity, they have no duty, to the fullest extent permitted by law, to offer such corporate opportunity to us, our stockholders or our affiliates. In the event that any of our directors and officers who is also a director, officer or employee of Fortress acquires knowledge of a corporate opportunity or is offered a corporate opportunity, provided that this knowledge was not acquired solely in such person’s capacity as a
50
Table of Contents
director or officer of the Company and such person acts in good faith, then to the fullest extent permitted by law such person is deemed to have fully satisfied such person’s fiduciary duties owed to us and is not liable to us if Fortress, or its affiliates, pursues or acquires the corporate opportunity or if such person did not present the corporate opportunity to us.
The ability of our Manager and its officers and employees to engage in other business activities, subject to the terms of our Management Agreement with our Manager, may reduce the amount of time our Manager, its officers or other employees spend managing us. In addition, we may engage in material transactions with our Manager or another entity managed by our Manager or one of its affiliates that present an actual, potential or perceived conflict of interest. It is possible that actual, potential or perceived conflicts could give rise to investor dissatisfaction, litigation or regulatory enforcement actions. Appropriately dealing with conflicts of interest is complex and difficult, and our reputation could be damaged if we fail, or appear to fail, to deal appropriately with one or more potential, actual or perceived conflicts of interest. Regulatory scrutiny of, or litigation in connection with, conflicts of interest could have a material adverse effect on our reputation, which could materially adversely affect our business in a number of ways, including causing an inability to raise additional funds, a reluctance of counterparties to do business with us, a decrease in the prices of our equity securities and a resulting increased risk of litigation and regulatory enforcement actions.
The management compensation structure that we have agreed to with our Manager, as well as compensation arrangements that we may enter into with our Manager in the future (in connection with new lines of business or other activities), may have unintended consequences for us. We have agreed to pay our Manager a management fee that is not tied to our performance. The management fee may not sufficiently incentivize our Manager to generate attractive risk-adjusted returns for us. In addition, our Manager may be eligible to receive incentive compensation, which may incentivize our Manager to invest in high risk investments. In evaluating investments and other management strategies, the opportunity to earn incentive compensation may lead our Manager to place undue emphasis on the maximization of such measures at the expense of other criteria, such as preservation of capital, in order to achieve higher incentive compensation. Investments with higher yield potential are generally riskier or more speculative than lower-yielding investments. Moreover, because our Manager receives compensation in the form of options in connection with the completion of our common equity offerings, our Manager may be incentivized to cause us to issue additional Common Stock, which could be dilutive to existing stockholders. See “Description of Our Capital Stock—Corporate Opportunity.”
We may compete with affiliates of our Manager, which could adversely affect our and their results of operations.
Affiliates of our Manager are not restricted in any manner from competing with us. Affiliates of our Manager may decide to invest in the same types of assets that we invest in. See “—Risks Related to Our Manager—There may be conflicts of interest in our relationship with our Manager, including with respect to corporate opportunities.”
It would be difficult and costly to terminate our Management Agreement with our Manager.
It would be difficult and costly for us to terminate our Management Agreement with our Manager. The Management Agreement may only be terminated annually upon (i) the reasonable affirmative vote of a majority of at least two-thirds of our independent directors, or by a vote of the holders of a simple majority of the outstanding shares of our Common Stock, that there has been unsatisfactory performance by our Manager that is materially detrimental to us or (ii) a determination by a simple majority of our independent directors that the management fee payable to our Manager is not fair, subject to our Manager’s right to prevent such a termination by accepting a mutually acceptable reduction of fees. Our Manager will be provided 60 days’ prior notice of any termination and will be paid a termination fee equal to the amount of the management fee earned by the Manager during the twelve month period preceding such termination. In addition, following any termination of the Management Agreement, our Manager may require us to purchase its right to receive incentive compensation at a
51
Table of Contents
price determined as if our assets were sold for their fair market value (as determined by an appraisal, taking into account, among other things, the expected future value of the underlying investments) or otherwise we may continue to pay the incentive compensation to our Manager. These provisions may increase the effective cost to us of terminating the Management Agreement, thereby adversely affecting our ability to terminate our Manager without cause. In addition, our independent directors may not vigorously enforce the provisions of our Management Agreement against our Manager. For example, our independent directors may refrain from terminating our Manager because doing so could result in the loss of key personnel. Furthermore, we are dependent on our Manager and may not find a suitable replacement if our Manager terminates the Management Agreement.
Our Manager will not be liable to us for any acts or omissions performed in accordance with the Management Agreement, including with respect to the performance of our investments.
Pursuant to our Management Agreement, our Manager will not assume any responsibility other than to render the services called for thereunder in good faith and will not be responsible for any action of our Board in following or declining to follow its advice or recommendations. Our Manager, its members, managers, officers and employees will not be liable to us or any of our subsidiaries, to our Board, or our or any subsidiary’s stockholders or partners for any acts or omissions by our Manager, its members, managers, officers or employees, except by reason of acts constituting bad faith, willful misconduct, gross negligence or reckless disregard of our Manager’s duties under our Management Agreement. We shall, to the full extent lawful, reimburse, indemnify and hold our Manager, its members, managers, officers and employees and each other person, if any, controlling our Manager harmless of and from any and all expenses, losses, damages, liabilities, demands, charges and claims of any nature whatsoever (including attorneys’ fees) in respect of or arising from any acts or omissions of an indemnified party made in good faith in the performance of our Manager’s duties under our Management Agreement and not constituting such indemnified party’s bad faith, willful misconduct, gross negligence or reckless disregard of our Manager’s duties under our Management Agreement.
Our Manager’s due diligence of business opportunities or other transactions may not identify all pertinent risks, which could materially affect our business, financial condition, liquidity and results of operations.
Our Manager intends to conduct due diligence with respect to each business opportunity or other transaction it pursues. It is possible, however, that our Manager’s due diligence processes will not uncover all relevant facts, particularly with respect to any assets we acquire from third parties. In these cases, our Manager may be given limited access to information about the business opportunity and will rely on information provided by the target of the business opportunity. In addition, if business opportunities are scarce, the process for selecting bidders is competitive, or the timeframe in which we are required to complete diligence is short, our ability to conduct a due diligence investigation may be limited, and we would be required to make business decisions based upon a less thorough diligence process than would otherwise be the case. Accordingly, business opportunities and other transactions that initially appear to be viable may prove not to be over time, due to the limitations of the due diligence process or other factors.
Risks Related to our Common Stock
There can be no assurance that the market for our stock will provide you with adequate liquidity.
A “when-issued” trading market for New Media’s Common Stock on the New York Stock Exchange began on February 4, 2014 and “regular-way” trading of New Media’s Common Stock began on February 14, 2014. There can be no assurance that an active trading market for our common stock will develop or be sustained in the future, and the market price of our common stock may fluctuate widely, depending upon many factors, some of which may be beyond our control. These factors include, without limitation:
| • | our business profile and market capitalization may not fit the investment objectives of any stockholder; |
| • | a shift in our investor base; |
52
Table of Contents
| • | our quarterly or annual earnings, or those of other comparable companies; |
| • | actual or anticipated fluctuations in our operating results; |
| • | changes in accounting standards, policies, guidance, interpretations or principles; |
| • | announcements by us or our competitors of significant investments, acquisitions or dispositions; |
| • | the failure of securities analysts to cover our Common Stock after the Distribution; |
| • | changes in earnings estimates by securities analysts or our ability to meet those estimates; |
| • | the operating and stock price performance of other comparable companies; |
| • | overall market fluctuations; and |
| • | general economic conditions. |
Stock markets in general have experienced volatility that has often been unrelated to the operating performance of a particular company. These broad market fluctuations may adversely affect the trading price of our Common Stock.
Sales or issuances of shares of our common stock could adversely affect the market price of our Common Stock.
Sales of substantial amounts of shares of our Common Stock in the public market, or the perception that such sales might occur, could adversely affect the market price of our Common Stock. Stockholders that received shares of our Common Stock in the spin-off may sell our Common Stock because our business profile or market capitalization as an independent company does not fit their investment objectives or because our Common Stock is not included in certain indices after the Distribution. The issuance of our common stock in connection with property, portfolio or business acquisitions or the settlement of awards that may be granted under our Incentive Plan or otherwise could also have an adverse effect on the market price of our Common Stock.
Failure to maintain effective internal control over financial reporting in accordance with Section 404 of the Sarbanes-Oxley Act could have a material adverse effect on our business and stock price.
As a public company, we are required to maintain effective internal control over financial reporting in accordance with Section 404 of the Sarbanes-Oxley Act of 2002. Internal control over financial reporting is complex and may be revised over time to adapt to changes in our business, or changes in applicable accounting rules. We cannot assure you that our internal control over financial reporting will be effective in the future or that a material weakness will not be discovered with respect to a prior period for which we had previously believed that internal controls were effective. If we are not able to maintain or document effective internal control over financial reporting, our independent registered public accounting firm will not be able to certify as to the effectiveness of our internal control over financial reporting. Matters impacting our internal controls may cause us to be unable to report our financial information on a timely basis, or may cause us to restate previously issued financial information, and thereby subject us to adverse regulatory consequences, including sanctions or investigations by the SEC, or violations of applicable stock exchange listing rules. There could also be a negative reaction in the financial markets due to a loss of investor confidence in us and the reliability of our financial statements. Confidence in the reliability of our financial statements is also likely to suffer if we or our independent registered public accounting firm reports a material weakness in our internal control over financial reporting. This could materially adversely affect us by, for example, leading to a decline in our share price and impairing our ability to raise capital, if and when desirable.
The percentage ownership of existing shareholders in New Media may be diluted in the future.
We may issue equity in order to raise capital or in connection with future acquisitions and strategic investments, which would dilute investors’ percentage ownership in New Media. In addition, your percentage ownership may be diluted if we issue equity instruments such as debt and equity financing.
53
Table of Contents
The percentage ownership of existing shareholders in New Media may also be diluted in the future as result of the issuance of ordinary shares in New Media upon the exercise of 10-year warrants, collectively representing the right to acquire, in the aggregate, equity equal to 5% of the issued and outstanding shares of New Media (the “New Media Warrants”). The New Media Warrants collectively represent the right to acquire New Media Common Stock, which in the aggregate are equal to 5% of New Media Common Stock as of the Effective Date (calculated prior to dilution from shares of New Media Common Stock issued pursuant to Newcastle’s contribution of Local Media Parent and assignment of related stock purchase agreement to New Media (the “Local Media Contribution”)) at a strike price of $46.35 calculated based on a total equity value of New Media prior to the Local Media Contribution of $1.2 billion as of the Effective Date. As a result, New Media Common Stock may be subject to dilution upon the exercise of such New Media Warrants.
Furthermore, the percentage ownership in New Media may be diluted in the future because of equity awards that we expect will be granted to our Manager pursuant to our Management Agreement. Upon the successful completion of an offering of shares of our Common Stock or any shares of preferred stock, we will grant our Manager options equal to 10% of the number of shares being sold in the offering (excluding the shares issued to Newcastle in the Local Media Contribution), with an exercise price equal to the offering price per share paid by the public or other ultimate purchaser. The board of directors of New Media approved a Nonqualified Stock Option and Incentive Award Plan (the “Incentive Plan”) which provides for the grant of equity and equity-based awards, including restricted stock, stock options, stock appreciation rights, performance awards, restricted stock units, tandem awards and other equity-based and non-equity based awards, in each case to our Manager, to the directors, officers, employees, service providers, consultants and advisors of our Manager who perform services for us, and to our directors, officers, employees, service providers, consultants and advisors. Any future grant would cause further dilution. We have initially reserved 15 million shares of our Common Stock for issuance under the Incentive Plan; on the first day of each fiscal year beginning during the ten-year term of the Incentive Plan and in and after calendar year 2015, that number will be increased by a number of shares of our Common Stock equal to 10% of the number of shares of our Common Stock newly issued by us during the immediately preceding fiscal year (and, in the case of fiscal year 2014, after the effective date of the Incentive Plan).
Provisions in our amended and restated certificate of incorporation and amended and restated bylaws and of Delaware law may prevent or delay an acquisition of our company, which could decrease the trading price of our Common Stock.
Our amended and restated certificate of incorporation, amended and restated bylaws and Delaware law contain provisions that are intended to deter coercive takeover practices and inadequate takeover bids by making such practices or bids unacceptably expensive to the raider and to encourage prospective acquirers to negotiate with our Board rather than to attempt a hostile takeover. These provisions provide for:
| • | a classified board of directors with staggered three-year terms; |
| • | amendment of provisions in our amended and restated certificate of incorporation and amended and restated bylaws regarding the election of directors, classes of directors, the term of office of directors, the filling of director vacancies and the resignation and removal of directors only upon the affirmative vote of at least 80% of the then issued and outstanding shares of our capital stock entitled to vote thereon (provided, however, that for so long as Newcastle and certain other affiliates of Fortress and permitted transferees (collectively, the “Fortress Stockholders”) beneficially own at least 20% of our issued and outstanding Common Stock, such provisions may be amended with the affirmative vote of a majority of the voting interest of stockholders entitled to vote or by a majority of the entire Board of Directors); |
| • | amendment of provisions in our amended and restated certificate of incorporation regarding corporate opportunity only upon the affirmative vote of at least 80% of the then issued and outstanding shares of our capital stock entitled to vote thereon; |
| • | removal of directors only for cause and only with the affirmative vote of at least 80% of the voting interest of stockholders entitled to vote in the election of directors (provided, however, that for so long |
54
Table of Contents
| as the Fortress Stockholders beneficially own at least 20% of our issued and outstanding Common Stock, directors may be removed with or without cause with the affirmative vote of a majority of the voting interest of stockholders entitled to vote); |
| • | our Board to determine the powers, preferences and rights of our preferred stock and to issue such preferred stock without stockholder approval; |
| • | provisions in our amended and restated certificate of incorporation and amended and restated bylaws prevent stockholders from calling special meetings of our stockholders (provided, however, that for so long as the Fortress Stockholders beneficially own at least 20% of our issued and outstanding Common Stock, Fortress Stockholders may call special meetings of our stockholders); |
| • | advance notice requirements applicable to stockholders for director nominations and actions to be taken at annual meetings; |
| • | a prohibition, in our amended and restated certificate of incorporation, stating that no holder of shares of our Common Stock will have cumulative voting rights in the election of directors, which means that the holders of majority of the issued and outstanding shares of our Common Stock can elect all the directors standing for election; and |
| • | action by our stockholders outside a meeting, in our amended and restated certificate of incorporation and our amended and restated bylaws, only by unanimous written consent (provided, however, that for so long as the Fortress Stockholders beneficially own at least 20% of our issued and outstanding Common Stock, our stockholders may act without a meeting by written consent of a majority of the voting interest of stockholders entitled to vote). |
Public stockholders who might desire to participate in these types of transactions may not have an opportunity to do so, even if the transaction is considered favorable to stockholders. These anti-takeover provisions could substantially impede the ability of public stockholders to benefit from a change in control or a change in our management and Board and, as a result, may adversely affect the market price of our Common Stock and your ability to realize any potential change of control premium.
| Item 1B. | Unresolved Staff Comments |
Not applicable.
| Item 2. | Properties |
We own and operate 37 print facilities across the United States. GateHouse’s print facilities range in size from approximately 500 to 82,000 square feet (combined printing and office space). GateHouse’s executive offices are located in Fairport, New York, where we lease approximately 15,000 square feet under a lease terminating in June 2014. Local Media’s executive offices are in a 47,000 square feet owned building in Middletown, New York.
We maintain our properties in good condition and believe that our current facilities are adequate to meet the present needs of our business. We do not believe any individual property is material to our financial condition or results of operations.
| Item 3. | Legal Proceedings |
We become involved from time to time in claims and lawsuits incidental to the ordinary course of our business, including such matters as libel, invasion of privacy, intellectual property infringement, wrongful termination actions and complaints alleging discrimination. In addition, we are involved from time to time in governmental and administrative proceedings concerning employment, labor, environmental and other claims.
55
Table of Contents
Insurance coverage mitigates potential loss for certain of these matters. Historically, such claims and proceedings have not had a material adverse effect upon our consolidated results of operations or financial condition. While we are unable to predict the ultimate outcome of any currently outstanding legal actions, we believe that it is not a likely possibility that the disposition of these matters would have a material adverse effect upon our consolidated results of operations, financial condition or cash flow.
On September 4, 2013, our Predecessor, GateHouse, and its affiliated debtors (the “Debtors”) announced that our Predecessor the Administrative Agent (as defined below), Newcastle and other lenders (the “Participating Lenders”) under the 2007 Credit Facility entered into the Restructuring Support Agreement, effective September 3, 2013 (the “Support Agreement”), in which the parties agreed to support, subject to the terms and conditions of the Support Agreement, the Restructuring pursuant to the consummation of the Plan. The Support Agreement relates to the Restructuring of our Predecessor’s obligations under its Outstanding Debt and our Predecessor’s equity pursuant to the Plan.
Pursuant to the Restructuring, Newcastle made the Cash-Out Offer. The holders of the Outstanding Debt had the option of receiving, in satisfaction of their Outstanding Debt, their pro rata share of the (i) Cash-Out Offer and/or (ii) New Media Common Stock and the net proceeds, if any, of the GateHouse Credit Facilities. On the Effective Date, November 26, 2013, Newcastle received its pro rata share of New Media Common Stock and the net proceeds of the GateHouse Credit Facilities for all Outstanding Debt it holds, including Outstanding Debt purchased in the Cash-Out Offer. All pensions, trade and all other unsecured claims will be paid in the ordinary course.
On September 20, 2013, our Predecessor commenced a pre-packaged solicitation of the Plan (the “Solicitation”). On September 27, 2013, our Predecessor filed voluntary petitions for relief under Chapter 11 of the United States Bankruptcy Code, case number 13-12503. Under the Support Agreement, which terminated on the Effective Date, each of the Participating Lenders agreed to (a) support and take any reasonable action in furtherance of the Restructuring, (b) timely vote their Outstanding Debt to accept the Plan and not change or withdraw such vote, (c) support approval of the Disclosure Statement (defined below) and confirmation of the Plan, as well as certain relief to be requested by Debtors from the Bankruptcy Court, (d) refrain from taking any action inconsistent with the confirmation or consummation of the Plan, and (e) not propose, support, solicit or participate in the formulation of any plan other than the Plan. Holders of Outstanding Debt sufficient to meet the requisite threshold of 67% in amount and majority in number (calculated without including any insider) necessary for acceptance of the Plan under the Bankruptcy Code voted to accept the Plan in the Solicitation. 100% of the holders of the Outstanding Debt voted to accept the Plan under the terms of the Support Agreement. As a result, Debtors commenced Chapter 11 cases and sought approval of the disclosure statement for the Plan (the “Disclosure Statement”) and confirmation of the Plan therein. The Plan was confirmed by the Bankruptcy Court on November 6, 2013 and our Predecessor effected the transactions contemplated by the Plan to emerge from bankruptcy protection on November 26, 2013. See additional discussion in Note 2 to our consolidated financial statements, “Voluntary Reorganization Under Chapter 11.”
| Item 4. | Mine Safety Disclosures |
Not applicable.
56
Table of Contents
| Item 5. | Market for Registrant’s Common Equity, Related Stockholder Matters and Issuer Purchases of Equity Securities |
Market Information
New Media Common Stock trades on the New York Stock Exchange (“NYSE”) under the trading symbol “NEWM” since the spin-off from Newcastle. A “when-issued” trading market for New Media’s Common Stock on the NYSE began on February 4, 2014 and “regular-way” trading of New Media Common Stock began on February 14, 2014. Prior to February 4, 2014, there was no public market for New Media Common Stock. Set forth in the table below for the periods presented are the high and low sale prices for New Media Common Stock as reported on the NYSE.
| HIGH | LOW | |||||||
| Fiscal Year Ending December 28, 2014: |
||||||||
| First Quarter (Since February 4, 2014 through March 4, 2014) |
$ | 15.25 | $ | 10.35 | ||||
From the most recent available Company information, on March 4, 2014 there were approximately 56 holders of record.
Dividends
New Media currently intends to distribute a substantial portion of free cash flow as a dividend, subject to satisfactory financial performance and Board approval. The Board of Directors’ determinations regarding dividends will depend on a variety of factors, including the Company’s GAAP net income, free cash flow generated from operations or other sources, liquidity position and potential alternative uses of cash, such as acquisitions, as well as economic conditions and expected future financial results. The availability of free cash flow for the payment of dividends is also subject to restrictions in both the GateHouse Credit Facilities and Local Media Credit Facility.
Unregistered Sales of Equity Securities
In connection with the restructuring of GateHouse, on the Effective Date New Media issued 30,000,000 shares New Media Common Stock pursuant the Plan in accordance with Section 1145(a)(1) of the U.S. Bankruptcy Code (the “Bankruptcy Code”).
Additionally, on the Effective Date, New Media issued 1,362,479 10-year warrants at a strike price of $46.35 per share to the former equity holders of GateHouse pursuant to the Plan, in accordance with Section 1145(a)(2) of the Bankruptcy Code.
57
Table of Contents
| Item 6. | Selected Financial Data |
The following table presents our selected historical financial data as of and for each of the years in the five year period ended December 29, 2013. The information in this table should be read in conjunction with the information under “Management’s Discussion and Analysis of Financial Condition and Results of Operations”, “Business” and our historical consolidated financial statements and the related notes thereto included elsewhere in this report.
| Successor Company | Predecessor Company | |||||||||||||||||||||||||
| Two Months Ended December 29, 2013 |
Ten Months Ended November 6, 2013 |
Year Ended December 30, 2012(2) |
Year Ended January 1, 2012 |
Year Ended December 31, 2010 |
Year Ended December 31, 2009 |
|||||||||||||||||||||
| (in thousands, except per share data) | ||||||||||||||||||||||||||
| Statement of Operations Data: |
||||||||||||||||||||||||||
| Revenues: |
||||||||||||||||||||||||||
| Advertising |
$ | 63,340 | $ | 265,078 | $ | 330,881 | $ | 357,134 | $ | 385,579 | $ | 398,927 | ||||||||||||||
| Circulation |
29,525 | 118,810 | 131,576 | 131,879 | 133,192 | 138,233 | ||||||||||||||||||||
| Commercial printing and other |
10,366 | 29,402 | 26,097 | 25,657 | 25,967 | 30,960 | ||||||||||||||||||||
|
|
|
|
|
|
|
|
|
|
|
|
|
|||||||||||||||
| Total revenues |
103,231 | 413,290 | 488,554 | 514,670 | 544,738 | 568,120 | ||||||||||||||||||||
| Operating costs and expenses: |
||||||||||||||||||||||||||
| Operating costs |
56,614 | 232,066 | 268,222 | 281,884 | 296,974 | 324,263 | ||||||||||||||||||||
| Selling, general and administrative |
28,749 | 136,832 | 145,020 | 146,295 | 154,516 | 159,197 | ||||||||||||||||||||
| Depreciation and amortization |
6,588 | 33,409 | 39,888 | 42,426 | 45,080 | 54,237 | ||||||||||||||||||||
| Integration and reorganization costs |
1,758 | 1,577 | 4,393 | 5,884 | 2,324 | 1,857 | ||||||||||||||||||||
| Impairment of long-lived assets |
— | 91,599 | — | 1,733 | 430 | 193,041 | ||||||||||||||||||||
| Loss (gain) on sale of assets |
27 | 1,163 | 1,238 | 455 | 1,551 | (418 | ) | |||||||||||||||||||
| Goodwill and mastheads impairment |
— | — | — | 385 | — | 273,914 | ||||||||||||||||||||
|
|
|
|
|
|
|
|
|
|
|
|
|
|||||||||||||||
| Operating income (loss) |
9,495 | (83,356 | ) | 29,793 | 35,608 | 43,863 | (437,971 | ) | ||||||||||||||||||
| Interest expense, amortization of deferred financing costs, gain on early extinguishment of debt, (gain) loss on derivative instruments, reorganization items, net, and other |
1,798 | (871,399 | ) | 57,463 | 58,361 | 69,520 | 72,502 | |||||||||||||||||||
|
|
|
|
|
|
|
|
|
|
|
|
|
|||||||||||||||
| Income (loss) from continuing operations before income taxes |
7,697 | 788,043 | (27,670 | ) | (22,753 | ) | (25,657 | ) | (510,473 | ) | ||||||||||||||||
| Income tax expense (benefit) |
491 | (197 | ) | (207 | ) | (1,803 | ) | (155 | ) | 342 | ||||||||||||||||
|
|
|
|
|
|
|
|
|
|
|
|
|
|||||||||||||||
| Income (loss) from continuing operations |
7,206 | 788,240 | (27,463 | ) | (20,950 | ) | (25,502 | ) | (510,815 | ) | ||||||||||||||||
| Loss from discontinued operations, net of income taxes |
— | (1,034 | ) | (2,340 | ) | (699 | ) | (542 | ) | (19,287 | ) | |||||||||||||||
|
|
|
|
|
|
|
|
|
|
|
|
|
|||||||||||||||
| Net income (loss) |
7,206 | 787,206 | (29,803 | ) | (21,649 | ) | (26,044 | ) | (530,102 | ) | ||||||||||||||||
| Net loss attributable to noncontrolling interest |
— | 208 | — | — | — | — | ||||||||||||||||||||
|
|
|
|
|
|
|
|
|
|
|
|
|
|||||||||||||||
| Net income (loss) attributable to New Media |
$ | 7,206 | $ | 787,414 | $ | (29,803 | ) | $ | (21,649 | ) | $ | (26,044 | ) | $ | (530,102 | ) | ||||||||||
|
|
|
|
|
|
|
|
|
|
|
|
|
|||||||||||||||
| Basic net income (loss) from continuing operations attributable to New Media per share |
$ | 0.24 | $ | 13.58 | $ | (0.47 | ) | $ | (0.36 | ) | $ | (0.46 | ) | $ | (8.93 | ) | ||||||||||
| Diluted income (loss) from continuing operations attributable to New Media per share |
$ | 0.24 | $ | 13.58 | $ | (0.47 | ) | $ | (0.36 | ) | $ | (0.46 | ) | $ | (8.93 | ) | ||||||||||
| Basic net income (loss) attributable to New Media common stockholders per share |
$ | 0.24 | $ | 13.56 | $ | (0.51 | ) | $ | (0.37 | ) | $ | (0.45 | ) | $ | (9.24 | ) | ||||||||||
| Diluted net income (loss) attributable to New Media common stockholders per share |
$ | 0.24 | $ | 13.56 | $ | (0.51 | ) | $ | (0.37 | ) | $ | (0.45 | ) | $ | (9.24 | ) | ||||||||||
| Other Data: |
||||||||||||||||||||||||||
| Adjusted EBITDA (1) |
$ | 16,096 | $ | 988,265 | $ | 69,766 | $ | 80,547 | $ | 89,511 | $ | 82,571 | ||||||||||||||
| Cash interest paid |
$ | 925 | $ | 43,606 | $ | 55,976 | $ | 58,225 | $ | 59,317 | $ | 67,950 | ||||||||||||||
| (1) | We define Adjusted EBITDA as net income (loss) from continuing operations before income tax expense (benefit), interest/financing expense, depreciation and amortization and non-cash impairments. Adjusted EBITDA is not a measurement of financial performance under |
58
Table of Contents
| GAAP and should not be considered in isolation or as an alternative to income from operations, net income (loss), cash flow from continuing operating activities or any other measure of performance or liquidity derived in accordance with GAAP. We believe this non-GAAP measure, as we have defined it, is helpful in identifying trends in our day-to-day performance because the items excluded have little or no significance in our day-to-day operations. This measure provides an assessment of controllable expenses and affords management the ability to make decisions which are expected to facilitate meeting current financial goals as well as achieve optimal financial performance. Adjusted EBITDA provides an indicator for management to determine if adjustments to current spending decisions are needed. |
Adjusted EBITDA provides us with a measure of financial performance, independent of items that are beyond the control of management in the short-term, such as depreciation and amortization, taxation and interest expense associated with our capital structure. This metric measures our financial performance based on operational factors that management can impact in the short-term, namely our cost structure or expenses of the organization. Adjusted EBITDA is one of the metrics used by senior management and the board of directors to review the financial performance of our business on a monthly basis.
Not all companies calculate Adjusted EBITDA using the same methods; therefore, the Adjusted EBITDA figures set forth herein may not be comparable to Adjusted EBITDA reported by other companies. A substantial portion of our Adjusted EBITDA must be dedicated to the payment of interest on our outstanding indebtedness and to service other commitments, thereby reducing the funds available to us for other purposes. Accordingly, Adjusted EBITDA does not represent an amount of funds that is available for management’s discretionary use. See “Management’s Discussion and Analysis of Financial Condition and Results of Operations” in Item 7 of this report.
| (2) | The year ended December 30, 2012 included a 53rd week of operations for approximately 60% of the business. |
The table below shows the reconciliation of income (loss) from continuing operations to Adjusted EBITDA for the periods presented:
| Successor Company | Predecessor Company | |||||||||||||||||||||||||
| Two Months Ended December 29, 2013 |
Ten Months Ended November 6, 2013 |
Year Ended December 30, 2012(3) |
Year Ended January 1, 2012 |
Year Ended December 31, 2010 |
Year Ended December 31, 2009 |
|||||||||||||||||||||
| (in thousands) | ||||||||||||||||||||||||||
| Income (loss) from continuing operations |
$ | 7,206 | $ | 788,240 | $ | (27,463 | ) | $ | (20,950 | ) | $ | (25,502 | ) | $ | (510,815 | ) | ||||||||||
| Income tax expense (benefit) |
491 | (197 | ) | (207 | ) | (1,803 | ) | (155 | ) | 342 | ||||||||||||||||
| Loss (gain) on derivative instruments (1) |
— | 14 | (1,635 | ) | (913 | ) | 8,277 | 12,672 | ||||||||||||||||||
| Gain on early extinguishment of debt (2) |
— | — | — | — | — | (7,538 | ) | |||||||||||||||||||
| Amortization of deferred financing costs |
171 | 842 | 1,255 | 1,360 | 1,360 | 1,360 | ||||||||||||||||||||
| Write-off of financing costs |
— | — | — | — | — | 743 | ||||||||||||||||||||
| Interest expense |
1,640 | 74,358 | 57,928 | 58,309 | 60,021 | 64,615 | ||||||||||||||||||||
| Impairment of long-lived assets |
— | 91,599 | — | 1,733 | 430 | 193,041 | ||||||||||||||||||||
| Depreciation and amortization |
6,588 | 33,409 | 39,888 | 42,426 | 45,080 | 54,237 | ||||||||||||||||||||
| Goodwill and mastheads impairment |
— | — | — | 385 | — | 273,914 | ||||||||||||||||||||
|
|
|
|
|
|
|
|
|
|
|
|
|
|||||||||||||||
| Adjusted EBITDA from continuing operations |
$ | 16,096 | (a) | $ | 988,265 | (b) | $ | 69,766 | (c) | $ | 80,547 | (d) | $ | 89,511 | (e) | $ | 82,571 | (f) | ||||||||
|
|
|
|
|
|
|
|
|
|
|
|
|
|||||||||||||||
| (a) | Adjusted EBITDA for the two months ended December 29, 2013 included net expenses of $4,828, which are one time in nature or non-cash compensation. Included in these net expenses of $4,828 are non-cash compensation and other expenses of $3,043, integration and reorganization costs of $1,758 and a $27 loss on the sale of assets. |
| (b) | Adjusted EBITDA for the ten months ended November 6, 2013 included net income of $(930,229), which are one time in nature or non-cash compensation. Included in these net expenses of $(930,229) are non-cash compensation and other expenses of $(932,969), integration and reorganization costs of $1,577 and a $1,163 loss on the sale of assets. |
Adjusted EBITDA also does not include $123 of EBITDA generated from our discontinued operations.
| (c) | Adjusted EBITDA for the year ended December 30, 2012 included net expenses of $11,264, which are one time in nature or non-cash compensation. Included in these net expenses of $11,264 are non-cash compensation and other expenses of $5,378, integration and reorganization costs of $4,393 and a $1,238 loss on the sale of assets. |
Adjusted EBITDA also does not include $255 of EBITDA generated from our discontinued operations.
59
Table of Contents
| (d) | Adjusted EBITDA for the year ended January 1, 2012 included net expenses of $10,565, which are one time in nature or non-cash compensation. Included in these net expenses of $10,565 are non-cash compensation and other expenses of $4,226, integration and reorganization costs of $5,884 and a $455 loss on the sale of assets. |
Adjusted EBITDA also does not include $432 of EBITDA generated from our discontinued operations.
| (e) | Adjusted EBITDA for the year ended December 31, 2010 included net expenses of $8,880, which are one time in nature or non-cash compensation. Included in these net expenses of $8,880 are non-cash compensation and other expenses of $5,005, integration and reorganization costs of $2,324 and a $1,551 loss on the sale of assets. |
Adjusted EBITDA also does not include $463 of EBITDA generated from our discontinued operations.
| (f) | Adjusted EBITDA for the year ended December 31, 2009 included net expenses of $10,071, which are one time in nature or non-cash compensation. Included in these net expenses of $10,071 are non-cash compensation and other expenses of $8,632, integration and reorganization costs of $1,857 and a $418 gain on the sale of assets. |
Adjusted EBITDA also does not include $(855) of EBITDA generated from our discontinued operations.
| (1) | Non-cash (gain) loss on derivative instruments is related to interest rate swap agreements which are financing related and are excluded from Adjusted EBITDA. |
| (2) | Non-cash write-off of deferred financing costs are similar to interest expense and amortization of financing fees and are excluded from Adjusted EBITDA. |
| (3) | The year ended December 30, 2012 included a 53rd week of operations for approximately 60% of the business. |
| As of | ||||||||||||||||||||||
| Successor Company | Predecessor Company | |||||||||||||||||||||
| December 29, 2013 |
December 30, 2012 |
January 1, 2012 |
December 31, 2010 |
December 31, 2009 |
||||||||||||||||||
| (in thousands) | ||||||||||||||||||||||
| Balance Sheet Data: |
||||||||||||||||||||||
| Total assets |
$ | 689,953 | $ | 469,766 | $ | 510,802 | $ | 546,327 | $ | 591,929 | ||||||||||||
| Total long-term obligations, including current maturities |
187,119 | 1,177,298 | 1,185,212 | 1,197,347 | 1,222,102 | |||||||||||||||||
| Stockholders’ equity (deficit) |
395,362 | (834,159 | ) | (805,632 | ) | (792,121 | ) | (753,576 | ) | |||||||||||||
60
Table of Contents
| Item 7. | Management’s Discussion and Analysis of Financial Condition and Results of Operations |
The following discussion of our financial condition and results of operations should be read in conjunction with our historical consolidated financial statements and notes to those statements appearing in this report. The discussion and analysis below includes certain forward-looking statements that are subject to risks, uncertainties and other factors under the heading “Risk Factors” and elsewhere in this report that could cause our actual future growth, results of operations, performance and business prospects and opportunities to differ materially from those expressed in, or implied by, such forward-looking statements. See “Cautionary Note Regarding Forward-Looking Information” at the beginning of this report.
Comparability of Information
As a result of the restructuring of GateHouse Media, LLC (formerly known as GateHouse Media, Inc.) (“GateHouse” or “Predecessor”) (the “Restructuring”), all GateHouse debt, including derivative liabilities and deferred financing assets, was eliminated on November 6, 2013, the confirmation date (the “Confirmation Date”) of the pre-packaged plan under Chapter 11 of title 11 of the United States Bankruptcy Code (the “Plan”). Fresh start accounting also led to changes in the basis of our assets and liabilities including property, plant and equipment and intangible assets that will impact future depreciation and amortization expense levels. As a result of the adoption of fresh start accounting, New Media’s (“New Media,” “Company,” “us,” or “we”) reorganized company post-emergence financial statements will generally not be comparable with the financial statements of GateHouse prior to emergence, including historical financial information in this Annual Report on Form 10-K.
Overview
New Media a newly listed company that owns, operates and invests in high quality local media assets. We have a particular focus on owning and acquiring strong local media assets in small to mid-size markets. With our collection of assets, we focus on two large business categories; consumers and small to medium size businesses (“SMBs”).
Our portfolio of media assets today spans across 352 markets and 24 states. Our products include 421 community print publications, 350 websites, 333 mobile sites and six yellow page directories. We reach over 12 million people per week and serve over 130,000 business customers.
We are focused on growing our consumer revenues primarily through our penetration into the local consumer market that values comprehensive local news and receives their news primarily from our products. We believe our rich local content, our strong media brands, and multiple platforms for delivering content will impact our reach into the local consumers leading to growth in subscription income. We also believe our local consumer penetration will lead to transaction revenues as we link consumers with local businesses. For our SMB business category, we focus on leveraging our strong local media brands, our in-market sales force and our high consumer penetration rates with a variety of products and services that we believe will help SMBs expand their marketing, advertising and other digital lead generation platforms.
Our business strategy is to be the preeminent provider of local news, information, advertising and digital services in the markets we operate in today. We aim to grow our business organically through what we believe are both our consumer and SMB strategies. We also plan to pursue strategic acquisitions of high quality local media assets at attractive valuation levels. Finally, we intend to periodically distribute a substantial portion of our free cash flow as a dividend to stockholders, subject to satisfactory financial performance and approval by our Board of Directors and dividend restrictions in both the GateHouse Credit Facilities (as defined below) and Local Media Credit Facility (as defined below). The Board of Directors’ determinations regarding dividends will depend on a variety of factors, including the Company’s U.S. generally accepted accounting principles (“GAAP”) net income, free cash flow generated from operations or other sources, liquidity position and potential alternative uses of cash, such as acquisitions, as well as economic conditions and expected future financial results. The availability of free cash flow for the payment of dividends is also subject to restrictions in both the GateHouse and Local Media Credit Facilities.
61
Table of Contents
Our focus on owning and operating dominant local content oriented media properties in small to mid-size markets, we believe, puts us in a position to better execute on our strategy. We believe that being the dominant provider of local news and information in the markets in which we operate, and distributing that content across multiple print and digital platforms, gives us an opportunity to grow our audiences and reach. Further, we believe our strong local media brands and our in-markets presence gives us the opportunity to expand our advertising and lead generation products with local business customers.
Central to our business strategy is our digital marketing services business called Propel Marketing (“Propel”). We launched the business in 2012 and have seen rapid growth since then. We believe Propel and its digital marketing service products will be a key component to our overall organic growth strategy.
The opportunity Propel looks to seize upon is as follows:
There are approximately 27 million SMBs in the U.S. Of these, approximately 26.7 million have 20 employees or less.
Many of the owners and managers of these SMBs do not have the bandwidth, expertise or resource to navigate the fast evolving digital marketing sector, but they increasingly know they have to be present there to stay connected with current and future customers. Propel is designed to offer a complete set of digital marketing services to SMBs that are turn-key with results that are transparent to the business owners. Propel provides four broad categories of services: building businesses a presence, helping businesses to be located by consumers online, engaging with consumers, and growing their customer base.
We believe our local media properties are uniquely positioned to sell these digital marketing services to local business owners. Our strong and trusted local brands, combined with our in-market sales presence give us a distinct advantage to sell these services, which are new and can be complicated to local business owners.
Our core products include:
| • | 85 daily newspapers with total paid circulation of approximately 736,000; |
| • | 240 weekly newspapers (published up to three times per week) with total paid circulation of approximately 300,000 and total free circulation of approximately 680,000; |
| • | 96 “shoppers” (generally advertising-only publications) with total circulation of approximately 1.9 million; |
| • | 350 locally focused websites and 333 mobile sites, which extend our businesses onto the internet and mobile devices with approximately 100 million page views per month; |
| • | six yellow page directories, with a distribution of approximately 432,000, that covers a population of approximately 1.1 million people; and |
| • | Propel digital marketing services. |
Our advertising revenue tends to follow a seasonal pattern, with higher advertising revenue in months containing significant events or holidays. Accordingly, our first quarter, followed by our third quarter, historically are our weakest quarters of the year in terms of revenue. Correspondingly, our second and fourth fiscal quarters, historically, are our strongest quarters. We expect that this seasonality will continue to affect our advertising revenue in future periods.
Our Predecessor has experienced on-going declines in print advertising revenue streams and increased volatility of operating performance, despite our geographic diversity, well-balanced portfolio of products, broad customer base and reliance on smaller markets. We may experience additional declines and volatility in the future. These declines in print advertising revenue have come with the shift from traditional media to the internet for consumers and businesses. We believe our local advertising tends to be less sensitive to economic cycles than
62
Table of Contents
national advertising because local businesses generally have fewer advertising channels through which to reach their target audience. We are making investments in digital platforms, such as Propel, as well as online, and mobile applications, to support our print publications in order to capture this shift as witnessed by our Predecessor’s digital advertising revenue growth, which doubled between 2009 and 2012.
Our operating costs consist primarily of labor, newsprint, and delivery costs. Our selling, general and administrative expenses consist primarily of labor costs.
Compensation represents just over 50% of our operating expenses. Over the last few years, we have worked to drive efficiencies and centralization of work throughout our Company. Additionally, we have taken steps to cluster our operations thereby increasing the usage of facilities and equipment while increasing the productivity of our labor force. We expect to continue to employ these steps as part of our business and clustering strategy.
The Company’s operating segments (Large Community Newspapers, Small Community Newspapers, Local Media Newspapers and Directories) are aggregated into one reportable business segment.
Recent Developments
Industry
The newspaper industry and our Predecessor have experienced declining same store revenue and profitability over the past several years. As a result, we previously implemented plans to reduce costs and preserve cash flow. We have also invested in potential growth opportunities, primarily in the digital space. We believe the cost reductions and the new digital initiatives, together with the Restructuring described below, will provide the appropriate capital structure and financial resources necessary to invest in the business and ensure our future success and provide sufficient cash flow to enable us to meet our commitments for the next year.
General economic conditions, including declines in consumer confidence, continued high unemployment levels, declines in real estate values, and other trends, have also impacted the markets in which we operate. Additionally, media companies continue to be impacted by the migration of consumers and businesses to an internet and mobile-based, digital medium. These conditions may continue to negatively impact print advertising and other revenue sources as well as increase operating costs in the future, even after an economic recovery. We expect that we will have adequate capital resources and liquidity to meet our working capital needs, borrowing obligations and all required capital expenditures for at least the next twelve months.
We periodically perform testing for impairment of goodwill and newspaper mastheads in which the fair value of our reporting units for goodwill impairment testing and individual newspaper mastheads were estimated using the expected present value of future cash flows and recent industry transaction multiples, using estimates, judgments and assumptions, that we believe were appropriate in the circumstances. Should general economic, market or business conditions decline, and have a negative impact on estimates of future cash flow and market transaction multiples, we may be required to record additional impairment charges in the future.
Restructuring
On September 4, 2013, our Predecessor, GateHouse, and its affiliated debtors (the “Debtors”) announced that our Predecessor, the Administrative Agent (as defined below), Newcastle Investment Corp. (“Newcastle”) and other lenders (the “Participating Lenders”) under the Amended and Restated Credit Agreement by and among certain affiliates of our Predecessor, the lenders from time to time party thereto and Cortland Products Corp., as administrative agent (the “Administrative Agent”), dated February 27, 2007 (the “2007 Credit Facility”) entered into the Restructuring Support Agreement, effective September 3, 2013 (the “Support Agreement”), in which the parties agreed to support, subject to the terms and conditions of the Support Agreement, the Restructuring pursuant to the consummation of the Plan. The Support Agreement relates to the Restructuring of our Predecessor’s obligations under the 2007 Credit Facility and certain interest rate swaps secured thereunder (collectively, the “Outstanding Debt”) and our Predecessor’s equity pursuant to the Plan.
63
Table of Contents
On September 20, 2013, our Predecessor commenced a pre-packaged solicitation of the Plan (the “Solicitation”). Under the Support Agreement, which terminated on the Effective Date (as defined below), each of the Participating Lenders agreed to (a) support and take any reasonable action in furtherance of the Restructuring, (b) timely vote their Outstanding Debt to accept the Plan and not change or withdraw such vote, (c) support approval of the Disclosure Statement (defined below) and confirmation of the Plan, as well as certain relief to be requested by Debtors from the Bankruptcy Court, (d) refrain from taking any action inconsistent with the confirmation or consummation of the Plan, and (e) not propose, support, solicit or participate in the formulation of any plan other than the Plan. Holders of Outstanding Debt sufficient to meet the requisite threshold of 67% in amount and majority in number (calculated without including any insider) necessary for acceptance of the Plan under the Bankruptcy Code voted to accept the Plan in the Solicitation. 100% of the holders of the Outstanding Debt voted to accept the Plan under the terms of the Support Agreement. As a result, Debtors commenced Chapter 11 cases and sought approval of the disclosure statement for the Plan (the “Disclosure Statement”) and confirmation of the Plan therein. The Plan was confirmed by the Bankruptcy Court on November 6, 2013 and our Predecessor effected the transactions contemplated by the Plan to emerge from bankruptcy protection on November 26, 2013. On the Effective Date (as defined below), Newcastle owned 84.6% of New Media’s total equity.
On September 27, 2013, our Predecessor filed voluntary petitions for relief under Chapter 11 of the United States Bankruptcy Code, case number 13-12503. On November 6, 2013 the Bankruptcy Court confirmed the Plan. Our Predecessor effected the transactions contemplated by the Plan and emerged from Chapter 11 protection on November 26, 2013 (the “Effective Date”).
The Plan discharged claims and interests against our Predecessor primarily through the (a) issuance of shares of common stock in a new holding company, New Media (“New Media Common Stock” or our “Common Stock”) and/or payment of cash to holders of claims in connection with the 2007 Credit Facility and related interest rate swaps, (b) reinstatement of certain claims, (c) entry into the Management Agreement (as defined below), (d) issuance of warrants by New Media to former equity holders in our Predecessor and (e) entry into the GateHouse Credit Facilities (as defined below) the net proceeds of which were distributed to holders that elected to receive New Media Common Stock. See Note 2 to the consolidated financial statements, “Voluntary Reorganization Under Chapter 11.”
Pursuant to the Restructuring, Newcastle purchased the Outstanding Debt claims in cash and at 40% of (i) $1,167 million of principal of claims under the 2007 Credit Facility, plus (ii) accrued and unpaid interest at the applicable contract non-default rate with respect thereto, plus (iii) all amounts, excluding any default interest, arising from transactions in connection with interest rate swaps secured under the 2007 Credit Facility (the “Cash-Out Offer”) on the Effective Date. The holders of the Outstanding Debt had the option of receiving, in satisfaction of their Outstanding Debt, their pro rata share of the (i) Cash-Out Offer and/or (ii) New Media Common Stock and the net proceeds, if any, of new debt facilities GateHouse Credit Facilities (as defined below). Newcastle received its pro rata share of New Media Common Stock and the $149 million in net proceeds of the GateHouse Credit Facilities (as defined below) for all Outstanding Debt it holds, including Outstanding Debt purchased in the Cash-Out Offer. All pensions, trade and all other unsecured claims will be paid in the ordinary course.
On the Effective Date, New Media entered into a management agreement with FIG LLC (the “Manager”) (“Management Agreement”) pursuant to which the Manager will manage the operations of New Media. The annual management fee will be 1.50% of New Media’s gross equity as set forth in the Management Agreement and is eligible to receive incentive compensation.
On August 27, 2013, our Predecessor entered into a management agreement (the “Local Media Management Agreement”) with and among Local Media Group Holdings LLC (“Local Media Parent”) to manage the operations of its direct subsidiary Local Media. The Company has determined that the Local Media Management Agreement results in Local Media being a variable interest entity (“VIE”) and has consolidated Local Media’s financial position and results of operations from September 3, 2013. On September 3, 2013, Local Media Parent
64
Table of Contents
completed its acquisition of thirty three publications from News Corp Inc. Local Media was not part of the bankruptcy filing. However, as part of the Plan, Newcastle agreed to contribute 100% of the stock of Local Media Parent to New Media as of the Effective Date. The contribution was made to New Media to assign Newcastle’s rights under the stock purchase agreement to which it acquired Local Media as of the Effective Date. Consideration received by Newcastle was the New Media Common Stock collectively equal to the cost of the acquisition of Local Media by Newcastle (as adjusted pursuant to the Plan) upon emergence from Chapter 11 on the Effective Date. The Company accounted for the consolidation of Local Media under the purchase method of accounting in accordance with Accounting Standards Codification (“ASC”) Topic 805, “Business Combinations”, as New Media received a controlling financial interest in Local Media as of the Effective Date.
Upon emergence from Chapter 11, New Media adopted fresh start reporting in accordance with ASC Topic 852, “Reorganizations” (“ASC 852”). Under fresh start accounting, a new entity is deemed to have been created on the Effective Date for financial reporting purposes and our Predecessor’s recorded amounts of assets and liabilities will be adjusted to reflect their estimated fair values. As a result of the adoption of fresh start accounting, New Media’s reorganized company post-emergence financial statements will generally not be comparable with the financial statements of our Predecessor prior to emergence, including the historical financial information in this report. See Notes 2 and 3 to the consolidated financial statements, “Voluntary Reorganization Under Chapter 11” and “Fresh Start Accounting.”
Spin-off from Newcastle
On February 13, 2014, Newcastle completed the spin-off of the Company. Each share of Newcastle common stock outstanding as of 5:00 PM, Eastern Time, on February 6, 2014, the Record Date, entitled the holder thereof to receive 0.07219481485 shares of New Media Common Stock (the “Distribution” or the “spin-off”). On February 14, 2014 New Media became a separate, publicly traded company trading on the NYSE under the ticker symbol “NEWM”. As a result of the spin-off, the fees included in the management agreement with the Manager became effective.
Critical Accounting Policy Disclosure
The preparation of financial statements in conformity with GAAP requires management to make decisions based on estimates, assumptions and factors it considers relevant to the circumstances. Such decisions include the selection of applicable principles and the use of judgment in their application, the results of which could differ from those anticipated. Due to the bankruptcy filing, we have applied debtor-in-possession accounting and fresh start accounting as described in ASC 852 for the applicable periods of 2013. The following accounting policies require significant estimates and judgments.
Goodwill and Long-Lived Assets
The application of the purchase method of accounting for business combinations and fresh start accounting related to reorganization require the use of significant estimates and assumptions in the determination of the fair value of assets and liabilities in order to properly allocate the purchase price consideration or enterprise value between assets that are depreciated and amortized from goodwill. Our estimates of the fair values of assets and liabilities are based upon assumptions believed to be reasonable, and when appropriate, include assistance from independent third-party valuation firms. Refer to Note 3, “Fresh Start Accounting, and Note 4, “Local Media Acquisition.”
As a result of the application of fresh start accounting we have a significant amount of goodwill. Goodwill at December 29, 2013 was $125.9 million. We assess the potential impairment of goodwill and intangible assets with indefinite lives on an annual basis as of the end or our second fiscal quarter in accordance with the provisions of Financial Accounting Standards Board (“FASB”) ASC Topic 350 “Intangibles—Goodwill and Other.” We perform our impairment analysis on each of our reporting units. The reporting units have discrete financial information and are regularly reviewed by management. The fair value of the applicable reporting unit
65
Table of Contents
is compared to its carrying value. Calculating the fair value of a reporting unit requires us to make significant estimates and assumptions. We estimate fair value by applying third-party market value indicators to projected cash flows and/or projected earnings before interest, taxes, depreciation, and amortization. In applying this methodology, we rely on a number of factors, including current operating results and cash flows, expected future operating results and cash flows, future business plans, and market data. If the carrying value of the reporting unit exceeds the estimate of fair value, we calculate the impairment as the excess of the carrying value of goodwill over its implied fair value.
We account for long-lived assets in accordance with the provisions of ASC Topic 360, “Property, Plant and Equipment” (“ASC 360”). We assess the recoverability of our long-lived assets, including property, plant and equipment and definite lived intangible assets, whenever events or changes in business circumstances indicate the carrying amount of the assets, or related group of assets, may not be fully recoverable. Factors leading to impairment include significant under-performance relative to historical or projected results, significant changes in the manner of use of the acquired assets or the strategy for our overall business and significant negative industry or economic trends. The assessment of recoverability is based on management’s estimates by comparing the sum of the estimated undiscounted cash flows generated by the underlying asset, or other appropriate grouping of assets, to its carrying value to determine whether an impairment existed at its lowest level of identifiable cash flows. If the carrying amount of the asset is greater than the expected undiscounted cash flows to be generated by such asset, an impairment is recognized to the extent the carrying value of such asset exceeds its fair value.
The fair values of our reporting units for goodwill impairment testing and individual newspaper mastheads are estimated using the expected present value of future cash flows, recent industry transaction multiples and using estimates, judgments and assumptions that management believes are appropriate in the circumstances.
The sum of the fair values of the reporting units are reconciled to our current market capitalization (based upon the stock market price) plus an estimated control premium.
Significant judgment is required in determining the fair value of our goodwill and long-lived assets to measure impairment, including the determination of multiples of revenue and Adjusted EBITDA and future earnings projections. The estimates and judgments that most significantly affect the future cash flow estimates are assumptions related to revenue, and in particular, potential changes in future advertising (including the impact of economic trends and the speed of conversion of advertising and readership to online products from traditional print products); trends in newsprint prices; and other operating expense items.
We performed annual impairment testing of goodwill and indefinite lived intangible assets during the second quarter of 2013, 2012 and 2011. Additionally, we performed impairment testing of goodwill and indefinite lived intangibles during the first quarter of 2012 and the fourth quarter of 2011 due to operational management changes. As a result, impairment charges related to goodwill were recorded in fiscal 2012 and 2011, see additional information in Note 8 to the consolidated financial statements “Goodwill and Intangible Assets.”
Newspaper mastheads (newspaper titles and website domain names) are not subject to amortization and are tested for impairment annually, or more frequently if events or changes in circumstances indicate that the asset might be impaired. The impairment test consists of a comparison of the fair value of each group of mastheads with their carrying amount. We used a relief from royalty approach which utilizes a discounted cash flow model to determine the fair value of each newspaper masthead. Our judgments and estimates of future operating results in determining the reporting unit fair values are consistently applied in determining the fair value of mastheads. We performed impairment tests on newspaper mastheads as of June 30, 2013, July 1, 2012, April 1, 2012, January 1, 2012 and June 26, 2011. See Note 8 to the consolidated financial statements, “Goodwill and Intangible Assets,” for a discussion of the impairment charges taken.
Intangible assets subject to amortization (primarily advertiser and subscriber lists) are tested for recoverability whenever events or change in circumstances indicate that their carrying amounts may not be
66
Table of Contents
recoverable. The carrying amount of each asset group is not recoverable if it exceeds the sum of the undiscounted cash flows expected to result from the use of such asset group. We performed impairment tests on long lived assets (including intangible assets subject to amortization) as of September 29, 2013, June 30, 2013, July 1, 2012 and June 26, 2011. Due to reductions in the Company’s operating projections during the third quarter of 2013 in conjunction with the bankruptcy process, an impairment charge was recognized for intangible assets subject to amortization. See Note 8 to the consolidated financial statements, “Goodwill and Intangible Assets,” for a discussion of the impairment charges taken.
The newspaper industry and our Predecessor have experienced declining same store revenue and profitability over the past several years. Should general economic, market or business conditions decline, and have a negative impact on estimates of future cash flow and market transaction multiples, we may be required to record additional impairment charges in the future.
Derivative Instruments
The bankruptcy filing was a termination event under our Predecessor’s interest rate swap agreements and all derivative discussions below relate to our Predecessor. We record all of our derivative instruments on our balance sheet at fair value pursuant to ASC Topic 815, “Derivatives and Hedging” (“ASC 815”) and ASC Topic 820 “Fair Value Measurements and Disclosures.” Fair value is based on counterparty quotations adjusted for our credit related risk. Our derivative instruments are measured using significant unobservable inputs and they represent all liabilities measured at fair value. To the extent a derivative qualifies as a cash flow hedge under ASC 815, unrealized changes in the fair value of the derivative are recognized in accumulated other comprehensive income. However, any ineffective portion of a derivative’s change in fair value is recognized immediately in earnings. Fair values of derivatives are subject to significant variability based on market conditions, such as future levels of interest rates. This variability could result in a significant increase or decrease in our accumulated other comprehensive income and/or earnings but will generally have no effect on cash flows, provided the derivative is carried through to full term. We also assess the capabilities of our counterparties to perform under the terms of the contracts. A change in the assessment could have an impact on the accounting and economics of our derivatives.
Revenue Recognition
Advertising revenue is recognized upon publication of the advertisement. Circulation revenue from subscribers is billed to customers at the beginning of the subscription period and is recognized on a straight-line basis over the term of the related subscription. Circulation revenue from single copy sales is recognized based on date of publication, net of provisions for related returns. Revenue for commercial printing is recognized upon delivery. Directory revenue is recognized on a straight-line basis over the period in which the corresponding directory is distributed.
Income Taxes
We account for income taxes under the provisions of ASC Topic 740, “Income Taxes” (“ASC 740”). Under this method, deferred tax assets and liabilities are determined based on the difference between the financial statement and tax bases of assets and liabilities using tax rates in effect for the year in which the differences are expected to affect taxable income. The assessment of the realizability of deferred tax assets involves a high degree of judgment and complexity. Valuation allowances are established when necessary to reduce deferred tax assets to the amounts that are expected to be realized. When we determine that it is more likely than not that we will be able to realize our deferred tax assets in the future in excess of our net recorded amount, an adjustment to the deferred tax asset would be made and reflected either in income or as an adjustment to goodwill. This determination will be made by considering various factors, including our expected future results, that in our judgment will make it more likely than not that these deferred tax assets will be realized.
67
Table of Contents
FASB issued Interpretation No. 48, “Accounting for Uncertainty in Income Taxes, an interpretation of SFAS No. 109” and now codified as ASC 740. ASC 740 prescribes a comprehensive model for how a company should recognize, measure, present and disclose in its financial statements uncertain tax positions that a company has taken or expects to take on a tax return. Under ASC 740, the financial statements will reflect expected future tax consequences of such positions presuming the taxing authorities’ full knowledge of the position and all relevant facts, but without considering time values.
Pension and Postretirement Liabilities
ASC Topic 715, “Compensation—Retirement Benefits” requires recognition of an asset or liability in the consolidated balance sheet reflecting the funded status of pension and other postretirement benefit plans such as retiree health and life, with current-year changes in the funded status recognized in the statement of stockholders’ equity.
The determination of pension plan obligations and expense is based on a number of actuarial assumptions. Two critical assumptions are the expected long-term rate of return on plan assets and the discount rate applied to pension plan obligations. For other postretirement benefit plans, which provide for certain health care and life insurance benefits for qualifying retired employees and which are not funded, critical assumptions in determining other postretirement benefit obligations and expense are the discount rate and the assumed health care cost-trend rates.
Our only pension plan has assets valued at $20.3 million and the plan’s benefit obligation is $24.3 million resulting in the plan being 83% funded.
To determine the expected long-term rate of return on pension plan’s assets, we consider the current and expected asset allocations, as well as historical and expected returns on various categories of plan assets, input from the actuaries and investment consultants, and long-term inflation assumptions. We used an assumption of 8.0% for its expected return on pension plan assets for 2013. If we were to reduce its rate of return by 50 basis points then the expense for 2013 would have increased approximately $0.1 million.
The assumed health care cost-trend rate also affects other postretirement benefit liabilities and expense. A 100 basis point increase in the health care cost trend rate would result in an increase of approximately $0.4 million in the December 29, 2013 postretirement benefit obligation and a 100 basis point decrease in the health care cost trend rate would result in a decrease of approximately $0.3 million in the December 29, 2013 postretirement benefit obligation.
Self-Insurance Liability Accruals
We maintain self-insured medical and workers’ compensation programs. We purchase stop loss coverage from third parties which limits our exposure to large claims. We record a liability for healthcare and workers’ compensation costs during the period in which they occur as well as an estimate of incurred but not reported claims.
68
Table of Contents
Results of Operations
The following table summarizes our historical results of operations for New Media, otherwise known as the Successor Company for the two months ended December 29, 2013 and the Predecessor Company for the ten months ended November 6, 2013 and for the years ended December 30, 2012 and January 1, 2012. We believe the comparison of combined results for the year ended December 29, 2013 versus the years ended December 30, 2012 and January 1, 2012, respectively, provides the best analysis of our results of operations, while the adoption of fresh start accounting presents the results of operations of a new reporting entity, the only consolidated statement of operations items impacted by the bankruptcy reorganization under Chapter 11 are depreciation and amortization expense, interest expense, and reorganization items. Those effects of fresh start accounting are discussed in more detail in the respective sections below.
| Combined | Successor Company | Predecessor Company | ||||||||||||||||||||
| Year Ended December 29, 2013 |
Two Months Ended December 29, 2013 |
Ten Months Ended November 6, 2013 |
Year Ended December 30, 2012(2) |
Year Ended January 1, 2012 |
||||||||||||||||||
| (in thousands) | ||||||||||||||||||||||
| Revenues: |
||||||||||||||||||||||
| Advertising |
$ | 328,418 | $ | 63,340 | $ | 265,078 | $ | 330,881 | $ | 357,134 | ||||||||||||
| Circulation |
148,335 | 29,525 | 118,810 | 131,576 | 131,879 | |||||||||||||||||
| Commercial printing and other |
39,768 | 10,366 | 29,402 | 26,097 | 25,657 | |||||||||||||||||
|
|
|
|
|
|
|
|
|
|
|
|||||||||||||
| Total revenues |
516,521 | 103,231 | 413,290 | 488,554 | 514,670 | |||||||||||||||||
| Operating costs and expenses: |
||||||||||||||||||||||
| Operating costs |
288,680 | 56,614 | 232,066 | 268,222 | 281,884 | |||||||||||||||||
| Selling, general and administrative |
165,581 | 28,749 | 136,832 | 145,020 | 146,295 | |||||||||||||||||
| Depreciation and amortization |
39,997 | 6,588 | 33,409 | 39,888 | 42,426 | |||||||||||||||||
| Integration and reorganization costs |
3,335 | 1,758 | 1,577 | 4,393 | 5,884 | |||||||||||||||||
| Impairment of long-lived assets |
91,599 | — | 91,599 | — | 1,733 | |||||||||||||||||
| Loss on sale of assets |
1,190 | 27 | 1,163 | 1,238 | 455 | |||||||||||||||||
| Goodwill and mastheads impairment |
— | — | — | — | 385 | |||||||||||||||||
|
|
|
|
|
|
|
|
|
|
|
|||||||||||||
| Operating income (loss) |
(73,861 | ) | 9,495 | (83,356 | ) | 29,793 | 35,608 | |||||||||||||||
| Interest expense |
75,998 | 1,640 | 74,358 | 57,928 | 58,309 | |||||||||||||||||
| Amortization of deferred financing costs |
1,013 | 171 | 842 | 1,255 | 1,360 | |||||||||||||||||
| Loss (gain) on derivative instruments |
14 | — | 14 | (1,635 | ) | (913 | ) | |||||||||||||||
| Other (income) expense |
991 | (13 | ) | 1,004 | (85 | ) | (395 | ) | ||||||||||||||
| Reorganization items, net |
(947,617 | ) | — | (947,617 | ) | — | — | |||||||||||||||
|
|
|
|
|
|
|
|
|
|
|
|||||||||||||
| Income (loss) from continuing operations before income taxes |
795,740 | 7,697 | 788,043 | (27,670 | ) | (22,753 | ) | |||||||||||||||
| Income tax expense (benefit) |
294 | 491 | (197 | ) | (207 | ) | (1,803 | ) | ||||||||||||||
|
|
|
|
|
|
|
|
|
|
|
|||||||||||||
| Income (loss) from continuing operations |
$ | 795,446 | $ | 7,206 | $ | 788,240 | $ | (27,463 | ) | $ | (20,950 | ) | ||||||||||
|
|
|
|
|
|
|
|
|
|
|
|||||||||||||
Year Ended December 29, 2013 Compared To Year Ended December 30, 2012
Revenue. Total revenue for the year ended December 29, 2013 increased by $28.0 million, or 5.7%, to $516.5 million from $488.5 million for the year ended December 30, 2012. The increase in total revenue was comprised of a $2.5 million, or 0.7%, decrease in advertising revenue which was offset by a $16.8 million, or 12.7%, increase in circulation revenue and a $13.7 million, or 52.4%, increase in commercial printing and other revenue. Advertising revenue includes $27.2 million from Local Media in 2013 while total company excluding Local Media (“GateHouse Standalone”) declines were $29.6 million or 9.0%. Advertising revenue declines were primarily driven by declines on the print side of our business in the local retail and classified categories, which were partially offset by growth in digital advertising. The local retail print declines reflect both secular pressures and a continuing uncertain and economic environment. These secular trends and economic conditions have also led to a decline in our print circulation volumes which have been slightly offset by price increases in certain locations. Our circulation revenue was also impacted by approximately $1.4 million for a net to gross accounting
69
Table of Contents
change at two of our larger locations in 2013. The increase in circulation revenue was primarily due to circulation revenue from Local Media of $16.4 million. The increase in commercial printing and other revenue was primarily due to commercial printing and other revenue from growth of our small business marketing services at Propel combined with Local Media commercial print and other revenue of $9.7 million.
Operating Costs. Operating costs for the year ended December 29, 2013 increased by $20.5 million, or 7.6%, to $288.7 million from $268.2 million for the year ended December 30, 2012. The increase in operating costs primarily relates to operating costs from Local Media of $32.0 million and by an increase in GateHouse Standalone outside service expenses of $4.7 million. These increases in operating costs were partially offset by a decrease in GateHouse Standalone compensation expenses, newsprint expenses, professional and consulting fees, supplies, repairs and maintenance, and travel expenses of $6.2 million, $4.5 million, $3.5 million, $0.9 million, $0.4 million, and $0.4 million, respectively. These GateHouse Standalone decreases are the result of permanent cost reductions as we continue to work to consolidate operations and improve the productivity of our labor force.
Selling, General and Administrative. Selling, general and administrative expenses for the year ended December 29, 2013 increased by $20.6 million, or 14.2%, to $165.6 million from $145.0 million for the year ended December 30, 2012. The increase in selling, general and administrative expenses primarily relates to selling, general and administrative expenses from Local Media of $12.9 million and an increase in GateHouse Standalone outside services and professional and consulting fees of $8.5 million and $1.4 million respectively. These increases in selling, general and administrative expenses were partially offset by a decrease in compensation expenses of $2.0 million. The increase in GateHouse Standalone outside services is primarily from legal expenses of $6.5 million related to reorganization costs prior to filing bankruptcy.
Depreciation and Amortization. Depreciation and amortization expense for the year ended December 29, 2013 increased by $0.1 million to $40.0 million from $39.9 million for the year ended December 30, 2012. Depreciation and amortization expense increased due to depreciation expense of Local Media of $3.8 million, which was offset by a reduction in depreciation expense due to the sale and disposal of assets. The application of fresh start accounting did not have a material impact on depreciation and amortization.
Integration and Reorganization Costs. During the year ended December 29, 2013 and December 30, 2012, we recorded integration and reorganization costs of $3.3 million and $4.4 million, respectively, primarily resulting from severance costs related to the continued consolidation of our operations resulting from our ongoing implementation of our plans to reduce costs and preserve cash flow.
Impairment of Long-Lived Assets. During the year ended December 29, 2013 we incurred a charge of $91.6 million related to the impairment on our advertiser relationships, subscriber relationships, customer relationships and other intangible assets due to reductions in our operating projections within our various reporting units. There were no such charges during the year ended December 30, 2012.
Interest Expense. Interest expense for the year ended December 29, 2013 increased by $18.1 million to $76.0 million from $57.9 million for the year ended December 30, 2012, which primarily resulted from the reclassifications out of accumulated other comprehensive income of $26.3 million related to the dedesignation of the hedging relationship related to swap agreements in connection with the bankruptcy filing. The 2013 interest expense was also impacted by there being no interest on the GateHouse debt in November and significantly lower debt balance in December.
Loss (Gain) on Derivative Instruments. During the year ended December 30, 2012, we recorded a net gain on derivative instruments of $1.6 million, which was comprised of reclassifications of accumulated other comprehensive income amortization related to swaps terminated in 2008 that were partially offset by the impact of the ineffectiveness of our remaining swap agreements. The accumulated other comprehensive income reclassification for swaps terminated in 2008 was fully amortized in 2012 and the 2013 loss on derivative instruments relates only to the ineffectiveness of our remaining swaps.
70
Table of Contents
Reorganization Items, Net. Costs directly attributable to the bankruptcy filing are reported as reorganization items, net during the predecessor ten month period ending November 6, 2013. Reorganization items, net primarily relates to the gain on extinguishment of debt of $722.8 million and the revaluation of assets of $246.2 million which were partially offset by $11.6 million of third party bankruptcy fees and a $6.8 million credit agreement amendment fee.
Income Tax Expense (Benefit). During the year ended December 29, 2013, we recorded an income tax expense of $0.3 million due to the state tax related to the bankruptcy filing. During the year ended December 30, 2012, we recorded an income tax benefit of $0.2 million due to a reduction in uncertain tax positions which was partially offset by a tax expense due to the elimination of the tax effect related to the expiration of a previously terminated swap that could be fully recognized for tax purposes in the current year.
Net Income (Loss) from Continuing Operations. Net income from continuing operations for the year ended December 29, 2013 was $795.4 million and net loss from continuing operations for the year ended December 30, 2012 was $27.5 million. Our net income from continuing operations increased due to the factors noted above.
Year Ended December 30, 2012 Compared To Year Ended January 1, 2012
Comparisons to the prior year were impacted by two factors around the number of days in the reporting period. First, there was a 53rd week in 2011 for approximately 60% of the business already on a 52 week (5-4-4 quarterly) reporting cycle. Also in 2011, the remaining 40% of the Company changed its reporting cycle from a calendar year to a 52 week reporting cycle in order to be consistent with the rest of the Company. We estimate the 53rd week in 2011 resulted in $4.8 million of revenue and $3.8 million of operating and selling, general and administrative expense. Comparisons below have not been adjusted for this calendar change.
Revenue. Total revenue for the year ended December 30, 2012 decreased by $26.1 million, or 5.1%, to $488.5 million from $514.6 million for the year ended January 1, 2012. The difference between same store revenue and GAAP revenue for the current period is immaterial, therefore, further revenue discussions will be limited to GAAP results. The decrease in total revenue was comprised of a $26.2 million, or 7.4%, decrease in advertising revenue and a $0.3 million, or 0.2%, decrease in circulation revenue which was partially offset by a $0.4 million, or 1.7%, increase in commercial printing and other revenue. Advertising revenue declines were primarily driven by declines on the print side of our business in the local retail and classified categories, which were partially offset by growth in digital advertising. The local retail print declines reflect both secular pressures and an uncertain and weak economic environment. These secular trends and economic conditions have also led to a decline in our print circulation volumes which have been offset by price increases in select locations. Our circulation revenue was also impacted by approximately $1.5 million for a net to gross accounting change due to a change from a carrier to a distributor model at one of our largest locations in 2012. The $0.4 million increase in commercial printing and other revenue is primarily the result of the launch of our small business marketing services and the stabilizing of our commercial printing operations during 2012.
Operating Costs. Operating costs for the year ended December 30, 2012 decreased by $13.7 million, or 4.8%, to $268.2 million from $281.9 million for the year ended January 1, 2012. The decrease in operating costs was primarily due to a decrease in compensation expenses, newsprint and ink, delivery and utility expenses of $12.4 million, $6.5 million, $3.3 million and $0.8 million, respectively, which were partially offset by an increase in outside services of $9.1 million. This decrease is the result of permanent cost reductions as we continue to work to consolidate operations and improve the productivity of our labor force.
Selling, General and Administrative. Selling, general and administrative expenses for the year ended December 30, 2012 decreased by $1.3 million, or 0.9%, to $145.0 million from $146.3 million for the year ended January 1, 2012. The decrease in selling, general and administrative expenses was primarily due to a decrease in compensation of $1.6 million. We expect that the majority of these reductions will be permanent in nature.
71
Table of Contents
Depreciation and Amortization. Depreciation and amortization expense for the year ended December 30, 2012 decreased by $2.5 million to $39.9 million from $42.4 million for the year ended January 1, 2012. The decrease in depreciation and amortization expense was primarily due to the sale and disposal of assets in 2011 and 2012, which reduced depreciation expense.
Integration and Reorganization Costs. During the years ended December 30, 2012 and January 1, 2012, we recorded integration and reorganization costs of $4.4 million and $5.9 million, respectively, primarily resulting from severance costs related to the consolidation of certain print and other operations.
Impairment of Long-Lived Assets. During the year ended January 1, 2012 we incurred an impairment charge of $1.7 million related to the consolidation of our print operations and property, plant and equipment which were classified as held for sale. There were no such charges during the year ended December 30, 2012.
Goodwill and Mastheads Impairment. During the year ended January 1, 2012, we recorded a $0.4 million impairment on our goodwill due to an operational management change in the fourth quarter of 2011 which transferred a goodwill balance of $0.4 million to a reporting unit that previously did not have a goodwill balance. A similar operational change occurred in the first quarter of 2012 and resulted in a $0.2 million impairment that was subsequently reclassified to discontinued operations.
Interest Expense. Total interest expense for the year ended December 30, 2012 decreased by $0.4 million, or 0.7%, to $57.9 million from $58.3 million for the year ended January 1, 2012. The decrease was due to declines in interest rates and their related impact on the unhedged position or our debt and a slight decrease in our total outstanding debt.
Loss (Gain) on Derivative Instruments. During the years ended December 30, 2012 and January 1, 2012, we recorded a net gain of $1.6 million and $0.9 million, respectively, which was comprised of reclassifications of accumulated other comprehensive income amortization related to swaps terminated in 2008 that were partially offset by the impact of the ineffectiveness of our remaining swap agreements.
Income Tax Expense (Benefit). During the year ended December 30, 2012, we recorded an income tax benefit of $0.2 million due to a reduction in uncertain tax positions which was partially offset by a tax expense due to the elimination of the tax effect related to the expiration of a previously terminated swap that could be fully recognized for tax purposes in the current year. During the year ended January 1, 2012, we recorded an income tax benefit of $1.8 million primarily due to the elimination of the tax effect related to the expiration of a previously terminated swap that could be fully recognized for tax purposes in the current year.
Net Loss from Continuing Operations. Net loss from continuing operations for the year ended December 30, 2012 was $27.5 million. Net loss from continuing operations for the year ended January 1, 2012 was $21.0 million. Our net loss from continuing operations increased due to the factors noted above.
Liquidity and Capital Resources
Our primary cash requirements are for working capital, debt obligations and capital expenditures. We have no material outstanding commitments for capital expenditures. We expect our 2014 capital expenditure to total approximately between $5.5 million and $6.5 million. Our long term debt and debt service obligations were significantly reduced following the Restructuring. For more information on our long term debt and debt service obligations, see Note 11 of consolidated financial statements. Our principal sources of funds have historically been, and are expected to continue to be, cash provided by operating activities.
As a holding company, we have no operations of our own and accordingly we have no independent means of generating revenue, and our internal sources of funds to meet our cash needs, including payment of expenses, are dividends and other permitted payments from our subsidiaries.
72
Table of Contents
In the future, we expect to fund our operations through cash provided by operating activities, the incurrence of debt or the issuance of additional equity securities. The Company expects that it will have adequate capital resources and liquidity to meet its working capital needs, borrowing obligations and all required capital expenditures for at least the next twelve months.
Our leverage may adversely affect our business and financial performance and restricts our operating flexibility. The level of our indebtedness and our on-going cash flow requirements may expose us to a risk that a substantial decrease in operating cash flows due to, among other things, continued or additional adverse economic developments or adverse developments in our business, could make it difficult for us to meet the financial and operating covenants contained in our credit facilities. In addition, our leverage may limit cash flow available for general corporate purposes such as capital expenditures and our flexibility to react to competitive, technological and other changes in our industry and economic conditions generally.
GateHouse Credit Facilities
The Revolving Credit, Term Loan and Security Agreement (the “First Lien Credit Facility”) dated November 26, 2013 by and among GateHouse, GateHouse Media Intermediate Holdco, LLC formerly known as GateHouse Media Intermediate Holdco, Inc. (“GMIH”), certain wholly-owned subsidiaries of GMIH (collectively with GMIH and GateHouse, the “Loan Parties”), PNC Bank, National Association, as the administrative agent, Crystal Financial LLC, as term loan B agent, and each of the lenders party thereto provides for (i) a term loan A in the aggregate principal amount of $25 million, (ii) a term loan B in the aggregate principal amount of $50 million, and (iii) a revolving credit facility in an aggregate principal amount of up to $40 million (of which $25 million was funded on the Effective Date). The Term Loan and Security Agreement (the “Second Lien Credit Facility” and together with the First Lien Credit Facility, the “GateHouse Credit Facilities”) dated November 26, 2013 by and among the Loan Parties, Mutual Quest Fund and each of the lenders party thereto provides for a term loan in an aggregate principal amount of $50 million.
The GateHouse Credit Facilities impose upon GateHouse certain financial and operating covenants, including, among others, requirements that GateHouse satisfy certain financial tests, including a minimum fixed charge coverage ratio of not less than 1.0 to 1.0, a maximum leverage ratio of not greater than 3.25 to 1.0, a minimum EBITDA and a limitation on capital expenditures, and restrictions on GateHouse’s ability to incur additional debt, incur liens and encumbrances, consolidate, amalgamate or merge with any other person, pay dividends, dispose of assets, make certain restricted payments, engage in transactions with affiliates, materially alter the business it conducts and taking certain other corporate actions. As of December 29, 2013, GateHouse was in compliance with all applicable covenants and could draw on the revolving credit facility under the First Lien Credit Facility if it chose to do so.
Refer to “Indebtedness” section below for further discussion of the GateHouse Credit Facilities.
Local Media Credit Facility
Certain of Local Media’s subsidiaries (together, the “Borrowers”) and Local Media entered into a Credit Agreement, dated as of September 3, 2013, with a syndicate of financial institutions with Credit Suisse AG, Cayman Islands Branch, as administrative agent (the “Local Media Credit Facility”). The Local Media Credit Facility provided for: (a) a $33 million term loan facility that matures on September 4, 2018; and (b) a $10 million revolving credit facility (subject to the activation condition that Credit Suisse Loan Funding LLC (“CS”), as lead arranger, assigns the revolving loan commitment to an unaffiliated lender), with a $3 million sub-limit for letters of credit and a $4 million sub-limit for swing loans, that matures on September 4, 2018. On October 25, 2013, CS assigned the revolving loan commitment to Capital One Business Corp and the revolving credit facility was activated.
The Local Media Credit Facility contains financial covenants that require Local Media and the Borrowers to maintain (a) a Leverage Ratio of not more than 2.5 to 1.0 and a Fixed Charge Coverage Ratio (as defined in the
73
Table of Contents
Local Media Credit Facility) of at least 2.0 to 1.0, each measured at the end of each fiscal quarter for the four-quarter period then ended. The Local Media Credit Facility contains affirmative and negative covenants applicable to Local Media and the Borrowers customarily found in loan agreements for similar transactions, including, but not limited to, restrictions on their ability to incur indebtedness, create liens on assets, engage in certain lines of business, engage in mergers or consolidations, dispose of assets, make investments or acquisitions, engage in transactions with affiliates, pay dividends or make other restricted payments. The Local Media Credit Facility contains customary events of default, including, but not limited to, defaults based on a failure to pay principal, interest, fees or other obligations, subject to specified grace periods (other than with respect to principal); any material inaccuracy of representation or warranty; breach of covenants; default in other material indebtedness; a Change of Control (as defined in the Local Media Credit Facility); bankruptcy and insolvency events; material judgments; certain ERISA events; and impairment of collateral. As of December 29, 2013, Local Media is in compliance with all of the covenants and obligations under the Local Media Credit Facility. The Local Media Credit Facility was amended on October 17, 2013 and on February 28, 2014. The October 17, 2013 amendment corrected a typographical mistake. The February 28, 2014 amendment provided that among other things, sales of real property collateral and reinvestment of the proceeds from such sales could only be made with the consent of the Administrative Agent, modified the properties included in the real property collateral, and set forth in detail the documentary post-closing requirements with respect to the real property collateral.
Refer to “Indebtedness” section below for further discussion of the Local Media Credit Facility.
Cash Flows
The following table summarizes our historical cash flows.
| Successor Company | Predecessor Company | |||||||||||||||||
| Two Months Ended December 29, 2013 |
Ten Months Ended November 6, 2013 |
Year Ended December 30, 2012 |
Year Ended January 1, 2012 |
|||||||||||||||
| (in thousands) | ||||||||||||||||||
| Cash provided by (used in) operating activities |
$ | 16,160 | $ | (5,972 | ) | $ | 23,499 | $ | 22,439 | |||||||||
| Cash used in investing activities |
(1,377 | ) | (2,799 | ) | (1,044 | ) | (731 | ) | ||||||||||
| Cash used in financing activities |
(3,690 | ) | (5,038 | ) | (7,140 | ) | (11,249 | ) | ||||||||||
Cash Flows from Operating Activities. Net cash provided by operating activities for the two months ended December 29, 2013 was $16.2 million. The net cash provided by operating activities resulted from net income of $7.2 million, depreciation and amortization of $6.6 million, a net increase in cash provided by working capital of $2.2 million, and amortization of deferred financing costs of $0.2 million. The increase in cash provided by working capital primarily resulted from an increase accrued expenses and accounts payable offset by an increase in accounts receivable.
Net cash used in operating activities for the ten months ended November 6, 2013 was $6.0 million. The net cash used in operating activities resulted from non-cash reorganization items, net of $954.6 million and an increase funding of pension and other post-retirement obligations of $1.1 million, partially offset by net income of $787.2 million, an impairment of long-lived assets of $91.6 million, an increase in non-cash interest related to unrealized losses upon dedesignation of cash flow hedges of $26.3 million, depreciation and amortization of $33.5 million, a net increase in cash provided by working capital of $8.0 million, a $2.3 million loss on the sale of assets, and amortization of deferred financing costs of $0.8 million. The increase in cash provided by working capital primarily resulted from an increase in accrued expenses.
Net cash provided by operating activities for the year ended December 30, 2012 was $23.5 million. The net cash provided by operating activities resulted from a depreciation and amortization of $40.6 million, a net increase in cash provided by working capital of $10.3 million, an impairment of long-lived assets of $2.1 million,
74
Table of Contents
a $1.3 million loss on the sale of assets, amortization of deferred financing costs of $1.2 million, a goodwill impairment charge of $0.2 million, and non-cash compensation of $0.1 million, partially offset by a net loss of $29.8 million, a gain of $1.6 million on derivative instruments, and an increase funding of pension and other post-retirement obligations of $0.9 million. The increase in cash provided by working capital primarily resulted from a decrease in prepaid expenses related to a newsprint pricing agreement that required a prepayment of $10 million in fiscal 2011. No such prepayment was required in fiscal 2012.
Net cash provided by operating activities for the year ended January 1, 2012 was $22.4 million. The net cash provided by operating activities resulted from a depreciation and amortization of $43.4 million, an impairment of long-lived assets of $2.1 million, amortization of deferred financing costs of $1.4 million, a $0.8 million loss on the sale of assets, non-cash compensation of $0.5 million, a goodwill impairment charge of $0.4 million, partially offset by a net loss of $21.6 million, an increase funding of pension and other post-retirement obligations of $1.9 million, a net decrease in cash provided by working capital of $1.6 million, and a gain of $0.9 million on derivative instruments. The decrease in cash provided by working capital primarily resulted from a decrease in accrued expenses and an increase in prepaid expenses related to a newsprint pricing agreement that allowed for fixed pricing in 2012 below market rates from December 31, 2010 to January 1, 2012 offset by a decrease in accounts receivable and an increase in accounts payable.
Cash Flows from Investing Activities. Net cash used in investing activities for the two months ended December 29, 2013 was $1.4 million. During the two months ended December 29, 2013, we used $1.5 million for capital expenditures, which was offset by 0.1 million received from the sale of publications, other assets and insurance proceeds.
Net cash used in investing activities for the ten months ended November 6, 2013 was $2.8 million. During the ten months ended November 6, 2013, we used $3.6 million for capital expenditures, which was offset by $0.8 million received from the sale of publications, other assets and insurance proceeds.
Net cash used in investing activities for the year ended December 30, 2012 was $1.0 million. During the year ended December 30, 2012, we used $4.6 million for capital expenditures, which was offset by $3.6 million received from the sale of publications, other assets and insurance proceeds.
Net cash used in investing activities for the year ended January 1, 2012 was $0.7 million. During the year ended January 1, 2012, we used $3.3 million for capital expenditures, which was offset by $2.6 million received from the sale of publications, other assets and insurance proceeds.
Cash Flows from Financing Activities. Net cash used in financing activities for the two months ended December 29, 2013 was $3.7 million due to the payment of dividends of $149.0 million and the payment of debt issuance costs of $3.7 million offset by borrowings under the GateHouse Credit Facilities of $149.0 million.
Net cash used in financing activities for the ten months ended November 6, 2013 was $5.0 million due to a repayment under the 2007 Credit Facility of $6.6 million which was offset by additional paid-in capital of $1.6 million related to the VIE Local Media.
Net cash used in financing activities for the year ended December 30, 2012 was $7.1 million due to repayments under the 2007 Credit Facility.
Net cash used in financing activities for the year ended January 1, 2012 was $11.2 million due to a repayment under the 2007 Credit Facility.
Changes in Financial Position
The discussion that follows highlights significant changes in our financial position and working capital from December 29, 2013 to December 30, 2012.
75
Table of Contents
Accounts Receivable. Accounts receivable increased $16.7 million from December 30, 2012 to December 29, 2013. This increase was due to $14.3 million of receivables related to the Local Media acquisition during the third quarter of 2013, which was partially offset by the timing of cash collections and lower revenue recognized in 2013 compared to 2012.
Inventory. Inventory increased $1.7 million from December 30, 2012 to December 29, 2013, which primarily relates to the Local Media acquisition during the third quarter of 2013.
Prepaid Expenses. Prepaid expenses increased $2.2 million from December 30, 2012 to December 29, 2013, which primarily relates to the Local Media acquisition during the third quarter of 2013.
Property, Plant, and Equipment. Property, plant, and equipment increased $153.6 million during the period from December 30, 2012 to December 29, 2013, of which $97.5 million relates to fresh start accounting adjustments, $73.7 million relates to the Local Media consolidation in the third quarter of 2013, and $5.2 million that was related to capital expenditures. These increases in property, plant, and equipment were partially offset by $20.7 of depreciation and $2.2 million relates to assets sold, classified as held for sale and discontinued operations.
Goodwill. Goodwill increased $112.2 million from December 30, 2012 to December 29, 2013, of which $111.0 million relates to fresh start accounting adjustments and $1.2 million from the Local Media contribution and consolidation.
Intangible Assets. Intangible assets decreased $73.6 million from December 30, 2012 to December 29, 2013, of which $91.6 million relates to an impairment charge in the third quarter and $19.3 million of amortization, which were offset by an increase of $33.3 million of fresh start accounting adjustments and $4.1 million from the Local Media consolidation in the third quarter of 2013.
Deferred Financing Costs, Net. Deferred financing costs, net increased $6.6 million from December 30, 2012 to December 29, 2013, of which $8.5 million relates to the payment and accrual related to our new debt facilities, which was offset by $1.0 million of amortization of deferred financing costs and the write-off of deferred financing costs of $0.9 million on our former debt.
Current Portion of Long-term Debt. Current portion of long-term debt decreased $2.3 million from December 30, 2012 to December 29, 2013, due to a $6.6 million principal payment as required by the 2007 Credit Facility, as amended, which represented 50% of the Excess Cash Flow related to the fiscal year ended December 30, 2012, which was offset by $3.5 million in borrowings under the GateHouse Credit Facilities and $0.8 million in borrowings under the Local Media Credit Facility.
Accounts Payable. Accounts payable increased $1.6 million from December 30, 2012 to December 29, 2013, of which $1.3 million relates to Local Media consolidation during the third quarter of 2013 and $1.0 million primarily relates to the timing of vendor payments, which was partially offset by $0.7 million from the disposal of a non wholly owned subsidiary in Chicago, Illinois.
Accrued Expenses. Accrued expenses increased $28.7 million from December 30, 2012 to December 29, 2013, which primarily resulted from $16.6 million from the Local Media contribution and consolidation during the third quarter of 2013 and the $14.5 million accrual of professional and legal fees that were not paid as of December 29, 2013.
Accrued Interest. Accrued interest decreased $3.8 million from December 30, 2012 to December 29, 2013, which primarily resulted from the reduction of our outstanding debt balances in connection with the bankruptcy filing.
Long-term Debt. Long-term debt decreased $989.7 million from December 30, 2012 to December 29, 2013, of which $1,167.5 million resulted from the elimination of the 2007 Credit Facility in connection with the bankruptcy filing, which was offset by $145.5 million in borrowings under the GateHouse Credit Facilities and $32.2 million in borrowings under the Local Media Credit Facility.
76
Table of Contents
Derivative Instruments. Derivative instrument liability decreased $45.7 million from December 30, 2012 to December 29, 2013, of which $19.3 million was due to changes in the fair value measurement of our interest rate swaps and $26.3 million resulted from the elimination of the derivative instrument liability in connection with the bankruptcy filing.
Pension and Other Postretirement Benefit Obligations. Pension and other postretirement benefit obligations decreased $5.3 million from December 30, 2012 to December 29, 2013, of which $3.3 million relates to fresh start accounting adjustments and a $2.0 million change to the Company’s pension and postretirement plans throughout the year.
Additional Paid-In Capital. Additional paid-in capital decreased $443.9 million from December 30, 2012 to December 29, 2013, of which $831.4 million relates to fresh start accounting adjustments and $149.0 million payment of dividends. These decreases were offset by additional paid-in capital of $536.4 million related to the issuance of new common stock, warrants, and the contribution of Local Media in connection with emergence from Chapter 11 of the Bankruptcy.
Accumulated Other Comprehensive Income (Loss). Accumulated other comprehensive income increased $53.1 million from December 30, 2012 to December 29, 2013, of which $26.3 million resulted from a release of accumulated other comprehensive loss related to the termination of the derivative agreements, $19.3 resulted from the change in fair value of the interest rate swaps, $6.9 million relates to the elimination of the Predecessor accumulated other comprehensive loss as part of the fresh start accounting, and a $0.5 million change to the Company’s pension and postretirement plans.
Retained Earnings (Accumulated Deficit). Accumulated deficit decreased $1,618.1 million from December 30, 2012 to December 29, 2013, due to plan effects and fresh start accounting adjustments of $1,792.7 million that reset accumulated deficit to zero, and Successor net income of $7.2 million which was partially offset by Predecessor net loss of $181.8 million during the period from December 31, 2012 through November 6, 2013.
Noncontrolling Interest. Noncontrolling interest decreased $2.2 million from December 30, 2012 to December 29, 2013 due to $2.2 million related to the disposal of a non wholly owned subsidiary.
Indebtedness
As part of the Restructuring, our Predecessor’s previous long-term debt was extinguished pursuant to the Support Agreement on the Effective Date of the Plan.
GateHouse Credit Facilities
The First Lien Credit Facility provides for (i) a term loan A in the aggregate principal amount of $25 million, a term loan B in the aggregate principal amount of $50 million, and a revolving credit facility in an aggregate principal amount of up to $40 million (of which $25 million was funded on the Effective Date). Borrowings under the First Lien Credit Facility bear interest at a rate per annum equal to (i) with respect to the revolving credit facility, the applicable Revolving Interest Rate (as defined the First Lien Credit Facility), (ii) with respect to the term loan A, the Term Loan A Rate (as defined in the First Lien Credit Facility), and (iii) with respect to the term loan B, the Term Loan B Rate (as defined in the First Lien Credit Facility). Amounts outstanding under the term loans and revolving credit facility will be fully due and payable on November 26, 2018.
The Second Lien Credit Facility provides for a term loan in an aggregate principal amount of $50 million. Borrowings under the Second Lien Credit Facility bear interest, at the Loan Parties’ option, equal to (i) the LIBOR Rate (as defined in the Second Lien Credit Facility) plus 11.00% or (ii) the Alternate Base Rate (as defined in the Second Lien Credit Facility) plus 10.00%. The outstanding principal will be fully due and payable on the maturity date of November 26, 2019.
77
Table of Contents
No principal payments are due on the revolving credit facility until the maturity date. Principal amounts outstanding under Term Loan A and Term Loan B of the First Lien Credit Facility will be payable in quarterly installments as follows: (I) four consecutive quarterly installments each in the amount of $0.9 million, commencing on January 1, 2014, (II) four consecutive quarterly installments each in the amount of $1.3 million, commencing on January 1, 2015, and (III) twelve consecutive quarterly installments each in the amount $2.0 million, commencing on January 1, 2016, followed by a final payment of all unpaid principal, accrued and unpaid interest and all unpaid fees and expenses which will be fully due and payable on November 26, 2018. The principal payments will be applied against Term Loan A until fully paid, and then to Term Loan B. The outstanding principal of the Second Lien Credit Facility will be fully due and payable on the maturity date of November 26, 2019. Only interest payments are due under the Second Lien Credit Facility until maturity. The Loan Parties are required to prepay borrowings under the GateHouse Credit Facilities in an amount equal to: (i) 100% of Excess Cash Flow (as defined in the GateHouse Credit Facilities) earned during any fiscal year quarter if the Leverage Ratio (as defined in the GateHouse Credit Facilities) as of the end of such fiscal quarter was greater than or equal to 2.75 to 1.0; (ii) 50% of Excess Cash Flow earned during any fiscal quarter if the Leverage Ratio of the Loan Parties as of the end of such fiscal quarter was less than 2.75 to 1.0 and greater than or equal to 2.5 to 1.0; and (iii) 0% of Excess Cash Flow earned during any fiscal quarter if the Leverage Ratio of the Loan Parties as of the end of such fiscal quarter was not more than 2.5 to 1.0. In addition, in the event of certain asset sales, borrowings or casualty events, the GateHouse Credit Facilities require the Loan Parties to prepay borrowings with the proceeds.
The GateHouse Credit Facilities impose upon GateHouse certain financial and operating covenants, including, among others, requirements that GateHouse satisfy certain financial tests, including a minimum fixed charge coverage ratio of not less than 1.0 to 1.0, a maximum leverage ratio of not greater than 3.25 to 1.0, a minimum EBITDA and a limitation on capital expenditures, and restrictions on GateHouse’s ability to incur additional debt, incur liens and encumbrances, consolidate, amalgamate or merge with any other person, pay dividends, dispose of assets, make certain restricted payments, engage in transactions with affiliates, materially alter the business it conducts and taking certain other corporate actions. As of December 29, 2013, GateHouse was in compliance with all applicable covenants and could draw on the revolving credit facility under the First Lien Credit Facility if it chose to do so.
Pursuant to the Plan, holders of the Outstanding Debt who elected to receive New Media Common Stock received their pro rata share of the Proceeds of the GateHouse Credit Facilities, net of certain transaction expenses (the “Net Proceeds”). The Net Proceeds distributed to holders of the Outstanding Debt totaled $149 million. The proceeds of additional drawings of the revolving credit facility under the First Lien Credit Facility after the Effective Date will be applied towards ongoing working capital needs, general corporate purposes, capital expenditures and potential acquisitions.
New Media distributed to each holder of New Media Common Stock, including Newcastle on account of the Cash-Out Offer, its pro rata share of $149 million in Net Proceeds of the GateHouse Credit Facilities net of certain transaction costs. GateHouse’s entry into the GateHouse Credit Facilities was not a condition to the effectiveness of the Plan.
Local Media Credit Facility
The Local Media Credit Facility provided for: (a) a $33 million term loan facility that matures on September 4, 2018; and (b) a $10 million revolving credit facility (which was activated on October 25, 2013 when CS, as lead arranger, assigned the revolving loan commitment to an unaffiliated lender), with a $3 million sub-limit for letters of credit and a $4 million sub-limit for swing loans, that matures on September 4, 2018. On October 25, 2013, CS assigned the revolving loan commitment to Capital One Business Corp and the revolving credit facility was activated.
Borrowings under the Local Media Credit Facility bear interest, at the borrower’s option, equal to the LIBOR Rate (as defined in the Local Media Credit Facility) plus 6.5% per annum for a LIBOR Rate Loan (as
78
Table of Contents
defined in the Local Media Credit Facility), or the Base Rate (as defined in the Local Media Credit Facility) plus 5.5% per annum for a Base Rate Loan (as defined in the Local Media Credit Facility). Under the revolving credit facility, the Borrowers will also pay a monthly commitment fee of 0.75% per annum on the unused portion of the revolving credit facility and a fee of 6.0% on the aggregate amount of outstanding letters of credit. No principal payments are due on the revolving credit facility until the maturity date. Under the revolving credit facility, the Company will also pay a monthly commitment fee of 0.75% per annum on the unused portion of the revolving credit facility and a fee of 6.0% on the aggregate amount of outstanding letters of credit. Principal payments are due on the term loan facility as follows: (a) $0.2 million at the end of each fiscal quarter beginning with the fiscal quarter ending December 31, 2013 through the fiscal quarter ending September 30, 2015; and (b) $0.4 million beginning with the fiscal quarter ending December 31, 2015 and at the end of each fiscal quarter thereafter with the remaining balance of principal becoming fully due and payable on the maturity date. The Borrowers are required to prepay borrowings under the Local Media Credit Facility in amounts and under circumstances as set forth in the Local Media Credit Facility.
The Borrowers are required to prepay borrowings under the Local Media Credit Facility in an amount equal to: (i) 100% of expected Excess Cash Flow (as defined in the Local Media Credit Facility) with respect to a fiscal quarter if the Leverage Ratio (as defined in the Local Media Credit Facility) of Local Media and the Borrowers as of the end of such fiscal quarter was greater than or equal to 2.0 to 1.0; (ii) 50% of expected Excess Cash Flow with respect to a fiscal quarter if the Leverage Ratio of Local Media and the Borrowers as of the end of such fiscal quarter was less than 2.0 to 1.0 and greater than or equal to 1.75 to 1.0; and (iii) 0% of expected Excess Cash Flow with respect to a fiscal quarter if the Leverage Ratio of Local Media and the Borrowers as of the end of such fiscal quarter was less than 1.75 to 1.0, in each case subject to an annual audit adjustment. In addition, the Borrowers are required to prepay borrowings under the Local Media Credit Facility with (A) net cash proceeds of certain asset dispositions, (B) 100% of Extraordinary Receipts (as defined in the Local Media Credit Facility), (C) 100% of net cash proceeds of funded indebtedness (other than indebtedness permitted by the Local Media Credit Facility), and (D) 100% of all Specified Equity Contributions (as defined in the Local Media Credit Facility) to Local Media.
The Local Media Credit Facility contains financial covenants that require Local Media and the Borrowers to maintain (a) a Leverage Ratio of not more than 2.5 to 1.0 and a Fixed Charge Coverage Ratio (as defined in the Local Media Credit Facility) of at least 2.0 to 1.0, each measured at the end of each fiscal quarter for the four-quarter period then ended. The Local Media Credit Facility contains affirmative and negative covenants applicable to Local Media and the Borrowers customarily found in loan agreements for similar transactions, including, but not limited to, restrictions on their ability to incur indebtedness, create liens on assets, engage in certain lines of business, engage in mergers or consolidations, dispose of assets, make investments or acquisitions, engage in transactions with affiliates, pay dividends or make other restricted payments. The Local Media Credit Facility contains customary events of default, including, but not limited to, defaults based on a failure to pay principal, interest, fees or other obligations, subject to specified grace periods (other than with respect to principal); any material inaccuracy of representation or warranty; breach of covenants; default in other material indebtedness; a Change of Control (as defined in the Local Media Credit Facility); bankruptcy and insolvency events; material judgments; certain ERISA events; and impairment of collateral. As of December 29, 2013, Local Media is in compliance with all of the covenants and obligations under the Local Media Credit Facility. The Local Media Credit Facility was amended on October 17, 2013 and on February 28, 2014. The October 17, 2013 amendment corrected a typographical mistake. The February 28, 2014 amendment provided that among other things, sales of real property collateral and reinvestment of the proceeds from such sales could only be made with the consent of the Administrative Agent, modified the properties included in the real property collateral, and set forth in detail the documentary post-closing requirements with respect to the real property collateral.
79
Table of Contents
Summary Disclosure About Contractual Obligations and Commercial Commitments
The following table reflects a summary of our contractual cash obligations, including estimated interest payments where applicable, as of December 29, 2013:
| 2014 | 2015 | 2016 | 2017 | 2018 | Thereafter | Total | ||||||||||||||||||||||
| (In Thousands) | ||||||||||||||||||||||||||||
| Debt obligations |
$ | 19,086 | $ | 20,518 | $ | 25,005 | $ | 26,602 | $ | 118,159 | $ | 56,280 | $ | 265,650 | ||||||||||||||
| Noncompete payments |
286 | 250 | 200 | 200 | 200 | — | 1,136 | |||||||||||||||||||||
| Operating lease obligations |
4,320 | 3,594 | 3,277 | 3,205 | 2,299 | 1,895 | 18,590 | |||||||||||||||||||||
| Letters of credit |
5,182 | — | — | — | — | — | 5,182 | |||||||||||||||||||||
|
|
|
|
|
|
|
|
|
|
|
|
|
|
|
|||||||||||||||
| Total |
$ | 28,874 | $ | 24,362 | $ | 28,482 | $ | 30,007 | $ | 120,658 | $ | 58,175 | $ | 290,558 | ||||||||||||||
|
|
|
|
|
|
|
|
|
|
|
|
|
|
|
|||||||||||||||
The table above excludes future cash requirements for pension and postretirement obligations. The periods in which these obligations will be settled in cash are not readily determinable and are subject to numerous future events and assumptions. We estimate cash requirements for these obligations in 2014 totaling approximately $1,913. See Note 16 of the Notes to consolidated financial statements, included herein.
We do not have any off-balance sheet arrangements reasonably likely to have a current or future effect on our financial statements.
Contractual Commitments
Credit Amendment
On or around September 4, 2013, GateHouse and certain lenders (including Newcastle) constituting the “Required Lenders” under the 2007 Credit Agreement entered into Amendment Agreement to the 2007 Credit Agreement effective September 3, 2013 ( the “Credit Amendment”). Pursuant to the terms of the Credit Amendment, GateHouse obtained the following improvement in terms: a clarified and expanded definition of “Eligible Assignee”; an increase in the base amount in the formula used to calculate the “Permitted Investments” basket from $35 million to a base of $50 million; the removal of the requirement that GateHouse’s annual financial statements not have a “going concern” or like qualification to the audit; the removal of a cross default from any Secured Hedging Agreement to the 2007 Credit Agreement; the removal of a Bankruptcy Default, as defined therein, arising from actions in furtherance of or indicating consent to the specified actions; and a waiver of any prior Default or Event of Default, as defined therein, including without limitation from the negotiation, entry into, or performance of the Support Agreement or the investment commitment letter entered into in connection with the Restructuring pursuant to which the Plan Sponsor agreed to purchase the Cash-Out Offer claims.
In consideration of the changes described above, GateHouse agreed to pay each of the lenders party to the Credit Amendment that timely executed and delivered its signature to the Credit Amendment and the Support Agreement, an amendment fee equal to 3.5% multiplied by the aggregate outstanding amount of the loans held (including through trades pending settlement) by such lender, unless waived in writing. Newcastle and certain other lenders elected to waive their amendment fee pursuant to the Credit Amendment. Newcastle indemnified other lenders with respect to their entry into the Credit Amendment, subject to the limitations set forth in the Credit Amendment. Such fee amounted to $6.8 million.
Derivative Instruments
The bankruptcy filing on September 27, 2013, was a termination event under our Predecessor’s interest rate swap agreements. For more detailed information on our interest rate swap agreements, See item 7A in this Annual Report on Form 10-K.
80
Table of Contents
No other material changes were made to our contractual commitments during the period from December 30, 2012 to December 29, 2013.
Recently Issued Accounting Pronouncements
In July 2013, the FASB issued ASU No. 2013-11, “Presentation of an Unrecognized Tax Benefit When a Net Operating Loss Carryforward, a Similar Tax Loss, or a Tax Credit Carryforward Exists” which requires an unrecognized tax benefit to be presented as a reduction to a deferred tax asset for a net operating loss carryforward, a similar tax loss or a tax credit carryforward that the entity intends to use as of the reporting date. The Company will adopt the provisions of ASU No. 2013-11 in fiscal 2014. Adoptions of ASU No. 2013-11 are not expected to have a material impact on the financial statements.
Non-GAAP Financial Measures
A non-GAAP financial measure is generally defined as one that purports to measure historical or future financial performance, financial position or cash flows, but excludes or includes amounts that would not be so adjusted in the most comparable GAAP measure. In this report, we define and use Adjusted EBITDA, a non-GAAP financial measure, as set forth below.
Adjusted EBITDA
We define Adjusted EBITDA as follows:
Income (loss) from continuing operations before:
| • | Income tax expense (benefit); |
| • | interest/financing expense; |
| • | depreciation and amortization; and |
| • | non-cash impairments. |
Management’s Use of Adjusted EBITDA
Adjusted EBITDA is not a measurement of financial performance under GAAP and should not be considered in isolation or as an alternative to income from operations, net income (loss), cash flow from continuing operating activities or any other measure of performance or liquidity derived in accordance with GAAP. We believe this non-GAAP measure, as we have defined it, is helpful in identifying trends in our day-to-day performance because the items excluded have little or no significance on our day-to-day operations. This measure provides an assessment of controllable expenses and affords management the ability to make decisions which are expected to facilitate meeting current financial goals as well as achieve optimal financial performance. We believe that it also provides an indicator for management to determine if adjustments to current spending decisions are needed.
Adjusted EBITDA provides us with a measure of financial performance, independent of items that are beyond the control of management in the short-term, such as depreciation and amortization, taxation and interest expense associated with our capital structure. This metric measures our financial performance based on operational factors that management can impact in the short-term, namely the cost structure or expenses of the organization. Adjusted EBITDA is one of the metrics used by senior management and New Media’s Board of Directors to review the financial performance of the business on a monthly basis.
Limitations of Adjusted EBITDA
Adjusted EBITDA has limitations as an analytical tool. It should not be viewed in isolation or as a substitute for GAAP measures of earnings or cash flows. Material limitations in making the adjustments to our earnings to
81
Table of Contents
calculate Adjusted EBITDA and using this non-GAAP financial measure as compared to GAAP net income (loss), include: the cash portion of interest/financing expense, income tax (benefit) provision and charges related to gain (loss) on sale of facilities represent charges (gains), which may significantly affect our financial results.
Readers of our financial statements may find this item important in evaluating our performance, results of operations and financial position. We use non-GAAP financial measures to supplement our GAAP results in order to provide a more complete understanding of the factors and trends affecting our business.
Adjusted EBITDA is not an alternative to net income, income from operations or cash flows provided by or used in operations as calculated and presented in accordance with GAAP. Readers of our financial statements should not rely on Adjusted EBITDA as a substitute for any such GAAP financial measure. We strongly urge readers of our financial statements to review the reconciliation of income (loss) from continuing operations to Adjusted EBITDA, along with our consolidated financial statements included elsewhere in this report. We also strongly urge readers of our financial statements to not rely on any single financial measure to evaluate our business. In addition, because Adjusted EBITDA is not a measure of financial performance under GAAP and is susceptible to varying calculations, the Adjusted EBITDA measure, as presented in this report, may differ from and may not be comparable to similarly titled measures used by other companies.
We use Adjusted EBITDA as a measure of our core operating performance, which is evidenced by the publishing and delivery of news and other media and excludes certain expenses that may not be indicative of our core business operating results. We consider the unrealized (gain) loss on derivative instruments and the (gain) loss on early extinguishment of debt to be financing related costs associated with interest expense or amortization of financing fees. Accordingly, we exclude financing related costs such as the early extinguishment of debt because they represent the write-off of deferred financing costs and we believe these non-cash write-offs are similar to interest expense and amortization of financing fees, which by definition are excluded from Adjusted EBITDA. Additionally, the non-cash gains (losses) on derivative contracts, which are related to interest rate swap agreements to manage interest rate risk, are financing costs associated with interest expense. Such charges are incidental to, but not reflective of, our core operating performance and it is appropriate to exclude charges related to financing activities such as the early extinguishment of debt and the unrealized (gain) loss on derivative instruments which, depending on the nature of the financing arrangement, would have otherwise been amortized over the period of the related agreement and does not require a current cash settlement.
82
Table of Contents
The table below shows the reconciliation of income (loss) from continuing operations to Adjusted EBITDA for the periods presented:
| Combined | Successor Company |
Predecessor Company | ||||||||||||||||||||||||||||
| Year Ended December 29, 2013 |
Two Months Ended December 29, 2013 |
Ten Months Ended November 6, 2013 |
Year Ended December 30, 2012(3) |
Year Ended January 1, 2012 |
Year Ended December 31, 2010 |
Year Ended December 31, 2009 |
||||||||||||||||||||||||
| (in thousands) | ||||||||||||||||||||||||||||||
| Loss from continuing operations |
$ | 795,446 | $ | 7,206 | $ | 788,240 | $ | (27,463 | ) | $ | (20,950 | ) | $ | (25,502 | ) | $ | (510,815 | ) | ||||||||||||
| Income tax expense (benefit) |
294 | 491 | (197 | ) | (207 | ) | (1,803 | ) | (155 | ) | 342 | |||||||||||||||||||
| (Gain) loss on derivative instruments (1) |
14 | — | 14 | (1,635 | ) | (913 | ) | 8,277 | 12,672 | |||||||||||||||||||||
| Gain on early extinguishment of debt (2) |
— | — | — | — | — | — | (7,538 | ) | ||||||||||||||||||||||
| Amortization of deferred financing costs |
1,013 | 171 | 842 | 1,255 | 1,360 | 1,360 | 1,360 | |||||||||||||||||||||||
| Write-off of financing costs |
— | — | — | — | — | — | 743 | |||||||||||||||||||||||
| Interest expense |
75,998 | 1,640 | 74,358 | 57,928 | 58,309 | 60,021 | 64,615 | |||||||||||||||||||||||
| Impairment of long-lived assets |
91,599 | — | 91,599 | — | 1,733 | 430 | 193,041 | |||||||||||||||||||||||
| Depreciation and amortization |
39,997 | 6,588 | 33,409 | 39,888 | 42,426 | 45,080 | 54,237 | |||||||||||||||||||||||
| Goodwill and mastheads impairment |
— | — | — | — | 385 | — | 273,914 | |||||||||||||||||||||||
|
|
|
|
|
|
|
|
|
|
|
|
|
|
|
|||||||||||||||||
| Adjusted EBITDA from continuing operations |
$ | 1,004,361 | $ | 16,096 | (a) | $ | 988,265 | (b) | $ | 69,766 | (c) | $ | 80,547 | (d) | $ | 89,511 | (e) | $ | 82,571 | (f) | ||||||||||
|
|
|
|
|
|
|
|
|
|
|
|
|
|
|
|||||||||||||||||
| (a) | Adjusted EBITDA for the two months ended December 29, 2013 included net expenses of $4,828, which are one time in nature or non-cash compensation. Included in these net expenses of $4,828 are non-cash compensation and other expenses of $3,043, integration and reorganization costs of $1,758 and a $27 loss on the sale of assets. |
| (b) | Adjusted EBITDA for the ten months ended November 6, 2013 included net income of $(930,229), which are one time in nature or non-cash compensation. Included in these net expenses of $(930,229) are non-cash compensation and other expenses of $(932,969), integration and reorganization costs of $1,577 and a $1,163 loss on the sale of assets. |
Adjusted EBITDA also does not include $123 of EBITDA generated from our discontinued operations.
| (c) | Adjusted EBITDA for the year ended December 30, 2012 included net expenses of $11,264, which are one time in nature or non-cash compensation. Included in these net expenses of $11,264 are non-cash compensation and other expenses of $5,378, integration and reorganization costs of $4,393 and a $1,238 loss on the sale of assets. |
Adjusted EBITDA also does not include $255 of EBITDA generated from our discontinued operations.
| (d) | Adjusted EBITDA for the year ended January 1, 2012 included net expenses of $10,565, which are one time in nature or non-cash compensation. Included in these net expenses of $10,565 are non-cash compensation and other expenses of $4,226, integration and reorganization costs of $5,884 and a $455 loss on the sale of assets. |
Adjusted EBITDA also does not include $432 of EBITDA generated from our discontinued operations.
| (e) | Adjusted EBITDA for the year ended December 31, 2010 included net expenses of $8,880, which are one time in nature or non-cash compensation. Included in these net expenses of $8,880 are non-cash compensation and other expenses of $5,005, integration and reorganization costs of $2,324 and a $1,551 loss on the sale of assets. |
Adjusted EBITDA also does not include $463 of EBITDA generated from our discontinued operations.
| (f) | Adjusted EBITDA for the year ended December 31, 2009 included net expenses of $10,071, which are one time in nature or non-cash compensation. Included in these net expenses of $10,071 are non-cash compensation and other expenses of $8,632, integration and reorganization costs of $1,857 and a $418 gain on the sale of assets. |
83
Table of Contents
Adjusted EBITDA also does not include $(855) of EBITDA generated from our discontinued operations.
| (1) | Non-cash (gain) loss on derivative instruments is related to interest rate swap agreements which are financing related and are excluded from Adjusted EBITDA. |
| (2) | Non-cash write-off of deferred financing costs are similar to interest expense and amortization of financing fees and are excluded from Adjusted EBITDA. |
| (3) | The year ended December 30, 2012 included a 53rd week of operations for approximately 60% of the business. |
| Item 7A. | Quantitative and Qualitative Disclosures About Market Risk |
We are exposed to market risk from changes in interest rates and commodity prices. Changes in these factors could cause fluctuations in earnings and cash flow. In the normal course of business, exposure to certain of these market risks is managed as described below.
Interest Rates
On September 27, 2013, we filed for bankruptcy and on November 26, 2013, we emerged from bankruptcy with a new capital structure. The interest rate discussion below is based on our capital structure and interest rates pre-filing and post emergence.
Pre Bankruptcy Filing
The pre-filing discussion is based on our Predecessor’s average long-term debt of $1,171.2 million and interest rate swaps totaling $625.0 million during the pre-filing period.
On August 18, 2008, we terminated interest rate swaps with a total notional amount of $570.0 million. At September 27, 2013, after consideration of the interest rate swaps described below, $542.5 million of the remaining principal amount of our term loans were subject to floating interest rates.
The bankruptcy filing on September 27, 2013, was a termination event under our Predecessor’s interest rate swap agreements. Our Predecessor’s debt structure and interest rate risks were primarily managed through the use of floating rate debt and interest rate swaps.
On February 27, 2007, we executed an interest rate swap in the notional amount of $100.0 million with a forward starting date of February 28, 2007. The interest rate swap has a term of seven years. Under this swap, we pay an amount to the swap counterparty representing interest on a notional amount at a rate of 5.14% and receive an amount from the swap counterparty representing, interest on the notional amount at a rate equal to the one month LIBOR.
On April 4, 2007, we executed an additional interest rate swap in the notional amount of $250.0 million with a forward starting date of April 13, 2007. The interest rate swap has a term of seven years. Under this swap, we pay an amount to the swap counterparty representing interest on a notional amount at a rate of 4.971% and receive an amount from the swap counterparty representing interest on the notional amount at a rate equal to one month LIBOR.
On April 13, 2007, we executed an additional interest rate swap in the notional amount of $200.0 million with a forward starting date of April 30, 2007. The interest rate swap has a term of seven years. Under this swap, we pay an amount to the swap counterparty representing interest on a notional amount at a rate of 5.079% and receive an amount from the swap counterparty representing interest on the notional amount at a rate equal to one month LIBOR.
On September 18, 2007, we executed an additional interest rate swap based on a notional amount of $75.0 million with a forward starting date of September 18, 2007. The interest rate swap has a term of seven years. Under the swap, we pay an amount to the swap counterparty representing interest on a notional amount at a rate of 4.941% and receive an amount from the swap counterparty representing interest on the notional amount at a rate equal to one month LIBOR.
84
Table of Contents
Post Emergence
The post emergence discussion is based on average long-term debt of $183.0 million during the post emergence period. There were no interest rate swaps in place during this period.
Our debt structure has multiple tranches with variable rates plus a fixed margin. We have $108.0 million of debt with minimum variable rates ranging from 0.75% to 1.00%. The fixed margin on our debt ranges from 3.25% to 11.0% with a weighted average fixed margin of 7.39%. Our primary exposure is to LIBOR. A 100 basis point change in LIBOR would change our income from continuing operations before income taxes on an annualized basis by approximately $1.1 million, based on average pro forma floating rate debt outstanding during 2013, and average amounts outstanding under the revolving credit facility during 2013.
Commodities
Certain materials we use are subject to commodity price changes. We manage this risk through instruments such as purchase orders, membership in a buying consortium, fixed pricing agreements for certain newsprint purchases and continuing programs to mitigate the impact of cost increases through identification of sourcing and operating efficiencies. Primary commodity price exposures are newsprint, energy costs and, to a lesser extent, ink.
A $10 per metric ton newsprint price change would result in a corresponding annualized change in our income from continuing operations before income taxes of $0.4 million based on newsprint usage for the year ended December 29, 2013 of approximately 42,800 metric tons. In 2014, 95% of the companies’ newsprint is fixed through a pricing agreement, therefore only 5% of the usage would be impacted by a price increase.
85
Table of Contents
| Item 8. | Financial Statements and Supplementary Data |
NEW MEDIA INVESTMENT GROUP INC. AND SUBSIDIARIES
| Page | ||||
| Consolidated Financial Statements: |
||||
| 87 | ||||
| 88 | ||||
| 89 | ||||
| 90 | ||||
| 91 | ||||
| 92 | ||||
86
Table of Contents
REPORT OF INDEPENDENT REGISTERED PUBLIC ACCOUNTING FIRM
The Board of Directors and Stockholders of
New Media Investment Group Inc.
We have audited the accompanying consolidated balance sheets of New Media Investment Group Inc. and subsidiaries (formerly known as GateHouse Media, Inc.) as of December 29, 2013 (Successor) and December 30, 2012 (Predecessor), and the related consolidated statements of operations and comprehensive income (loss), stockholders’ equity (deficit), and cash flows for the period from November 7, 2013 to December 29, 2013 (Successor), the period from December 31, 2012 through November 6, 2013 (Predecessor), and for each of the two years in the period ended December 30, 2012 (Predecessor). Our audits also included the financial statement schedule listed in the Index at Item 15(a). These financial statements and schedule are the responsibility of the Company’s management. Our responsibility is to express an opinion on these financial statements and schedule based on our audits.
We conducted our audits in accordance with the standards of the Public Company Accounting Oversight Board (United States). Those standards require that we plan and perform the audit to obtain reasonable assurance about whether the financial statements are free of material misstatement. We were not engaged to perform an audit of the Company’s internal control over financial reporting. Our audits included consideration of internal control over financial reporting as a basis for designing audit procedures that are appropriate in the circumstances, but not for the purpose of expressing an opinion on the effectiveness of internal control over financial reporting. Accordingly, we express no such opinion. An audit also includes examining, on a test basis, evidence supporting the amounts and disclosures in the financial statements, assessing the accounting principles used and significant estimates made by management, and evaluating the overall financial statement presentation. We believe that our audits provide a reasonable basis for our opinion.
As discussed in Note 1, 2 and 3 to the consolidated financial statements on November 6, 2013, the Bankruptcy Court entered an order confirming the plan of reorganization, which became effective November 26, 2013. Accordingly, the accompanying consolidated financial statements have been prepared in conformity with Accounting Standards Codification 852-10, “Reorganizations”, for the Successor Company as a new entity with assets, liability and a capital structure having carrying amounts not comparable with prior periods as described in Note 1, 2 and 3.
In our opinion, the financial statements referred to above present fairly, in all material respects, the consolidated financial position of New Media Investment Group Inc. and subsidiaries at December 29, 2013 (Successor) and December 30, 2012 (Predecessor), and the consolidated results of their operations and their cash flows for the period from November 7, 2013 to December 29, 2013 (Successor), the period from December 31, 2012 through November 6, 2013 (Predecessor), and for each of the two years in the period ended December 30, 2012 (Predecessor), in conformity with U.S. generally accepted accounting principles. Also, in our opinion, the related financial statement schedule, when considered in relation to the basic financial statements taken as a whole, presents fairly in all material respects the information set forth therein.
| /s/ Ernst & Young LLP |
| Rochester, New York |
| March 19, 2014 |
87
Table of Contents
NEW MEDIA INVESTMENT GROUP INC. AND SUBSIDIARIES
(In thousands, except share data)
| Successor Company December 29, 2013 |
Predecessor Company December 30, 2012 |
|||||||||
| ASSETS | ||||||||||
| Current assets: |
||||||||||
| Cash and cash equivalents |
$ | 31,811 | $ | 34,527 | ||||||
| Restricted cash |
6,477 | 6,467 | ||||||||
| Accounts receivable, net of allowance for doubtful accounts of $349 and $2,456 at December 29, 2013 and December 30, 2012, respectively |
71,401 | 54,692 | ||||||||
| Inventory |
7,697 | 6,019 | ||||||||
| Prepaid expenses |
7,986 | 5,815 | ||||||||
| Other current assets |
11,799 | 8,215 | ||||||||
|
|
|
|
|
|||||||
| Total current assets |
137,171 | 115,735 | ||||||||
| Property, plant, and equipment, net of accumulated depreciation of $5,539 and $128,208 at December 29, 2013 and December 30, 2012, respectively |
270,187 | 116,510 | ||||||||
| Goodwill |
125,911 | 13,742 | ||||||||
| Intangible assets, net of accumulated amortization of $1,049 and $196,878 at December 29, 2013 and December 30, 2012, respectively |
145,401 | 218,981 | ||||||||
| Deferred financing costs, net |
8,297 | 1,719 | ||||||||
| Other assets |
2,363 | 2,605 | ||||||||
| Assets held for sale |
623 | 474 | ||||||||
|
|
|
|
|
|||||||
| Total assets |
$ | 689,953 | $ | 469,766 | ||||||
|
|
|
|
|
|||||||
| LIABILITIES AND STOCKHOLDERS’ EQUITY (DEFICIT) | ||||||||||
| Current liabilities: |
||||||||||
| Current portion of long-term liabilities |
$ | 699 | $ | 853 | ||||||
| Current portion of long-term debt |
4,312 | 6,648 | ||||||||
| Accounts payable |
10,973 | 9,396 | ||||||||
| Accrued expenses |
54,990 | 26,258 | ||||||||
| Accrued interest |
828 | 4,665 | ||||||||
| Deferred revenue |
30,620 | 25,217 | ||||||||
|
|
|
|
|
|||||||
| Total current liabilities |
102,422 | 73,037 | ||||||||
| Long-term liabilities: |
||||||||||
| Long-term debt |
177,703 | 1,167,450 | ||||||||
| Long-term liabilities, less current portion |
4,405 | 2,347 | ||||||||
| Derivative instruments |
— | 45,724 | ||||||||
| Pension and other postretirement benefit obligations |
10,061 | 15,367 | ||||||||
|
|
|
|
|
|||||||
| Total liabilities |
294,591 | 1,303,925 | ||||||||
|
|
|
|
|
|||||||
| Stockholders’ equity (deficit): |
||||||||||
| Common stock, $0.01 par value, 2,000,000,000 and 150,000,000 shares authorized at December 29, 2013 and December 30, 2012, respectively; 30,000,000 and 58,313,868 issued, and 30,000,000 and 58,077,031 outstanding at December 29, 2013 and December 30, 2012, respectively |
300 | 568 | ||||||||
| Additional paid-in capital |
387,398 | 831,344 | ||||||||
| Accumulated other comprehensive income (loss) |
458 | (52,642 | ) | |||||||
| Retained earnings (accumulated deficit) |
7,206 | (1,610,917 | ) | |||||||
| Treasury stock, at cost, 0 and 236,837 shares at December 29, 2013 and December 30, 2012, respectively |
— | (310 | ) | |||||||
|
|
|
|
|
|||||||
| Total New Media stockholders’ equity (deficit) |
395,362 | (831,957 | ) | |||||||
| Noncontrolling interest |
— | (2,202 | ) | |||||||
|
|
|
|
|
|||||||
| Total stockholders’ equity (deficit) |
395,362 | (834,159 | ) | |||||||
|
|
|
|
|
|||||||
| Total liabilities and stockholders’ equity (deficit) |
$ | 689,953 | $ | 469,766 | ||||||
|
|
|
|
|
|||||||
See accompanying notes to consolidated financial statements.
88
Table of Contents
NEW MEDIA INVESTMENT GROUP INC. AND SUBSIDIARIES
CONSOLIDATED STATEMENTS OF OPERATIONS AND COMPREHENSIVE INCOME (LOSS)
(In thousands, except per share data)
| Successor Company |
Predecessor Company | |||||||||||||||||
| Two
Months Ended December 29, 2013 |
Ten
Months Ended November 6, 2013 |
Year Ended December 30, 2012 |
Year Ended January 1, 2012 |
|||||||||||||||
| Revenues: |
||||||||||||||||||
| Advertising |
$ | 63,340 | $ | 265,078 | $ | 330,881 | $ | 357,134 | ||||||||||
| Circulation |
29,525 | 118,810 | 131,576 | 131,879 | ||||||||||||||
| Commercial printing and other |
10,366 | 29,402 | 26,097 | 25,657 | ||||||||||||||
|
|
|
|
|
|
|
|
|
|||||||||||
| Total revenues |
103,231 | 413,290 | 488,554 | 514,670 | ||||||||||||||
| Operating costs and expenses: |
||||||||||||||||||
| Operating costs |
56,614 | 232,066 | 268,222 | 281,884 | ||||||||||||||
| Selling, general, and administrative |
28,749 | 136,832 | 145,020 | 146,295 | ||||||||||||||
| Depreciation and amortization |
6,588 | 33,409 | 39,888 | 42,426 | ||||||||||||||
| Integration and reorganization costs |
1,758 | 1,577 | 4,393 | 5,884 | ||||||||||||||
| Impairment of long-lived assets |
— | 91,599 | — | 1,733 | ||||||||||||||
| Loss on sale of assets |
27 | 1,163 | 1,238 | 455 | ||||||||||||||
| Goodwill impairment |
— | — | — | 385 | ||||||||||||||
|
|
|
|
|
|
|
|
|
|||||||||||
| Operating income (loss) |
9,495 | (83,356 | ) | 29,793 | 35,608 | |||||||||||||
| Interest expense |
1,640 | 74,358 | 57,928 | 58,309 | ||||||||||||||
| Amortization of deferred financing costs |
171 | 842 | 1,255 | 1,360 | ||||||||||||||
| Loss (gain) on derivative instruments |
— | 14 | (1,635 | ) | (913 | ) | ||||||||||||
| Other (income) expense |
(13 | ) | 1,004 | (85 | ) | (395 | ) | |||||||||||
| Reorganization items, net |
— | (947,617 | ) | — | — | |||||||||||||
|
|
|
|
|
|
|
|
|
|||||||||||
| Income (loss) from continuing operations before income taxes |
7,697 | 788,043 | (27,670 | ) | (22,753 | ) | ||||||||||||
| Income tax expense (benefit) |
491 | (197 | ) | (207 | ) | (1,803 | ) | |||||||||||
|
|
|
|
|
|
|
|
|
|||||||||||
| Income (loss) from continuing operations |
7,206 | 788,240 | (27,463 | ) | (20,950 | ) | ||||||||||||
| Loss from discontinued operations, net of income taxes |
— | (1,034 | ) | (2,340 | ) | (699 | ) | |||||||||||
|
|
|
|
|
|
|
|
|
|||||||||||
| Net income (loss) |
7,206 | 787,206 | (29,803 | ) | (21,649 | ) | ||||||||||||
| Net loss attributable to noncontrolling interest |
— | 208 | — | — | ||||||||||||||
|
|
|
|
|
|
|
|
|
|||||||||||
| Net income (loss) attributable to New Media |
$ | 7,206 | $ | 787,414 | $ | (29,803 | ) | $ | (21,649 | ) | ||||||||
|
|
|
|
|
|
|
|
|
|||||||||||
| Income (loss) per share: |
||||||||||||||||||
| Basic and Diluted: |
||||||||||||||||||
| Income (loss) from continuing operations attributable to New Media |
$ | 0.24 | $ | 13.58 | $ | (0.47 | ) | $ | (0.36 | ) | ||||||||
| Net income (loss) attributable to New Media |
$ | 0.24 | $ | 13.56 | $ | (0.51 | ) | $ | (0.37 | ) | ||||||||
| Other comprehensive income: |
||||||||||||||||||
| Derivative instrument items: |
||||||||||||||||||
| Gain on derivative instruments, net of income taxes of $0 |
$ | — | $ | 19,339 | $ | 4,364 | $ | 11,052 | ||||||||||
| Reclassification of accumulated other comprehensive loss related to derivative instruments, net of income taxes of $0 |
— | 26,313 | — | — | ||||||||||||||
|
|
|
|
|
|
|
|
|
|||||||||||
| Total derivative items, net of income taxes of $0 |
— | 45,652 | 4,364 | 11,052 | ||||||||||||||
| Pension and other postretirement benefit items: |
||||||||||||||||||
| Net actuarial gain (loss) |
458 | 69 | (2,530 | ) | (2,663 | ) | ||||||||||||
| Amortization of net actuarial loss |
— | — | 383 | 83 | ||||||||||||||
| Amortization of prior service credit |
— | — | (457 | ) | (457 | ) | ||||||||||||
| Other adjustment |
— | — | (43 | ) | 240 | |||||||||||||
|
|
|
|
|
|
|
|
|
|||||||||||
| Total pension and other postretirement benefit items, net of income taxes of $0 |
458 | 69 | (2,647 | ) | (2,797 | ) | ||||||||||||
|
|
|
|
|
|
|
|
|
|||||||||||
| Other comprehensive income, net of tax |
458 | 45,721 | 1,717 | 8,255 | ||||||||||||||
|
|
|
|
|
|
|
|
|
|||||||||||
| Comprehensive income (loss) |
7,664 | 832,927 | (28,086 | ) | (13,394 | ) | ||||||||||||
| Comprehensive loss attributable to noncontrolling interest |
— | (208 | ) | — | — | |||||||||||||
|
|
|
|
|
|
|
|
|
|||||||||||
| Comprehensive income (loss) attributable to New Media |
$ | 7,664 | $ | 833,135 | $ | (28,086 | ) | $ | (13,394 | ) | ||||||||
|
|
|
|
|
|
|
|
|
|||||||||||
See accompanying notes to consolidated financial statements.
89
Table of Contents
NEW MEDIA INVESTMENT GROUP INC. AND SUBSIDIARIES
CONSOLIDATED STATEMENTS OF STOCKHOLDERS’ EQUITY (DEFICIT)
(In thousands, except share data)
| Common stock | Additional paid-in capital |
Accumulated
other comprehensive income (loss) |
Retained earnings (accumulated deficit) |
Treasury stock | Non- controlling interest in subsidiary |
|||||||||||||||||||||||||||||||
| Shares | Amount | Shares | Amount | Total | ||||||||||||||||||||||||||||||||
| Balance at December 31, 2010, Predecessor Company |
58,313,868 | $ | 568 | $ | 830,787 | $ | (62,614 | ) | $ | (1,559,465 | ) | 235,261 | $ | (310 | ) | $ | (1,087 | ) | $ | (792,121 | ) | |||||||||||||||
| Net loss |
— | — | — | — | (21,649 | ) | — | — | (579 | ) | (22,228 | ) | ||||||||||||||||||||||||
| Gain on derivative instruments, net of income taxes of $0 |
— | — | — | 11,052 | — | — | — | — | 11,052 | |||||||||||||||||||||||||||
| Net actuarial loss and prior service cost, net of income taxes of $0 |
— | — | — | (2,797 | ) | — | — | — | — | (2,797 | ) | |||||||||||||||||||||||||
| Non-cash compensation expense |
— | — | 462 | — | — | — | — | — | 462 | |||||||||||||||||||||||||||
| Purchase of treasury stock |
— | — | — | — | — | 1,576 | — | — | — | |||||||||||||||||||||||||||
|
|
|
|
|
|
|
|
|
|
|
|
|
|
|
|
|
|
|
|||||||||||||||||||
| Balance at January 1, 2012, Predecessor Company |
58,313,868 | $ | 568 | $ | 831,249 | $ | (54,359 | ) | $ | (1,581,114 | ) | 236,837 | $ | (310 | ) | $ | (1,666 | ) | $ | (805,632 | ) | |||||||||||||||
|
|
|
|
|
|
|
|
|
|
|
|
|
|
|
|
|
|
|
|||||||||||||||||||
| Net loss |
— | — | — | — | (29,803 | ) | — | — | (536 | ) | (30,339 | ) | ||||||||||||||||||||||||
| Gain on derivative instruments, net of income taxes of $0 |
— | — | — | 4,364 | — | — | — | — | 4,364 | |||||||||||||||||||||||||||
| Net actuarial loss and prior service cost, net of income taxes of $0 |
— | — | — | (2,647 | ) | — | — | — | — | (2,647 | ) | |||||||||||||||||||||||||
| Non-cash compensation expense |
— | — | 95 | — | — | — | — | — | 95 | |||||||||||||||||||||||||||
|
|
|
|
|
|
|
|
|
|
|
|
|
|
|
|
|
|
|
|||||||||||||||||||
| Balance at December 30, 2012, Predecessor Company |
58,313,868 | $ | 568 | $ | 831,344 | $ | (52,642 | ) | $ | (1,610,917 | ) | 236,837 | $ | (310 | ) | $ | (2,202 | ) | $ | (834,159 | ) | |||||||||||||||
|
|
|
|
|
|
|
|
|
|
|
|
|
|
|
|
|
|
|
|||||||||||||||||||
| Net income (loss) |
— | — | — | — | 787,414 | — | — | (208 | ) | 787,206 | ||||||||||||||||||||||||||
| Gain on derivative instruments, net of income taxes of $0 |
— | — | — | 19,339 | — | — | — | — | 19,339 | |||||||||||||||||||||||||||
| Reclassification of accumulated other comprehensive loss related to derivative instruments, net of income taxes of $0 |
— | — | — | 26,313 | — | — | — | — | 26,313 | |||||||||||||||||||||||||||
| Net actuarial loss and prior service cost, net of income taxes of $0 |
— | — | — | 69 | — | — | — | — | 69 | |||||||||||||||||||||||||||
| Non-cash compensation expense |
— | — | 25 | — | — | — | — | — | 25 | |||||||||||||||||||||||||||
| Disposal of non wholly owned subsidiary |
— | — | — | — | — | — | — | 2,202 | 2,202 | |||||||||||||||||||||||||||
| Cancellation of Predecessor Company common stock, net of fair value of new warrants of $995 |
(58,313,868 | ) | (568 | ) | (830,374 | ) | — | 830,632 | (236,837 | ) | 310 | — | — | |||||||||||||||||||||||
| Elimination of Predecessor Company accumulated deficit and accumulated other comprehensive income |
— | — | — | 6,921 | (7,129 | ) | — | — | 208 | — | ||||||||||||||||||||||||||
| Issuance of new common stock and contribution of Local Media in connection with emergence from Chapter 11 of the Bankruptcy Code |
30,000,000 | 300 | 535,403 | — | — | — | — | — | 535,703 | |||||||||||||||||||||||||||
|
|
|
|
|
|
|
|
|
|
|
|
|
|
|
|
|
|
|
|||||||||||||||||||
| Balance at November 6, 2013, Predecessor Company |
30,000,000 | $ | 300 | $ | 536,398 | $ | — | $ | — | — | $ | — | $ | — | $ | 536,698 | ||||||||||||||||||||
|
|
|
|
|
|
|
|
|
|
|
|
|
|
|
|
|
|
|
|||||||||||||||||||
| Net income |
— | — | — | — | 7,206 | — | — | — | 7,206 | |||||||||||||||||||||||||||
| Net actuarial gain and prior service cost, net of income taxes of $0 |
— | — | — | 458 | — | — | — | — | 458 | |||||||||||||||||||||||||||
| Common stock cash dividends |
— | — | (149,000 | ) | — | — | — | — | — | (149,000 | ) | |||||||||||||||||||||||||
|
|
|
|
|
|
|
|
|
|
|
|
|
|
|
|
|
|
|
|||||||||||||||||||
| Balance at December 29, 2013, Successor Company |
30,000,000 | $ | 300 | $ | 387,398 | $ | 458 | $ | 7,206 | — | $ | — | $ | — | $ | 395,362 | ||||||||||||||||||||
|
|
|
|
|
|
|
|
|
|
|
|
|
|
|
|
|
|
|
|||||||||||||||||||
See accompanying notes to consolidated financial statements.
90
Table of Contents
NEW MEDIA INVESTMENT GROUP INC. AND SUBSIDIARIES
Consolidated Statements of Cash Flows
(In thousands)
| Successor Company |
Predecessor Company | |||||||||||||||||
| Two Months Ended December 29, 2013 |
Ten Months Ended November 6, 2013 |
Year ended December 30, 2012 |
Year ended January 1, 2012 |
|||||||||||||||
| Cash flows from operating activities: |
||||||||||||||||||
| Net income (loss) |
$ | 7,206 | $ | 787,206 | $ | (29,803 | ) | $ | (21,649 | ) | ||||||||
| Adjustments to reconcile net income (loss) to net cash provided by (used in) operating activities: |
||||||||||||||||||
| Depreciation and amortization |
6,588 | 33,466 | 40,627 | 43,393 | ||||||||||||||
| Amortization of deferred financing costs |
171 | 842 | 1,255 | 1,360 | ||||||||||||||
| Loss (gain) on derivative instruments |
— | 14 | (1,635 | ) | (913 | ) | ||||||||||||
| Non-cash compensation expense |
— | 25 | 95 | 462 | ||||||||||||||
| Non-cash interest expense |
15 | — | — | — | ||||||||||||||
| Non-cash reorganization costs, net |
— | (954,605 | ) | — | — | |||||||||||||
| Non-cash interest related to unrealized losses upon designation of cash flow hedges |
— | 26,313 | — | — | ||||||||||||||
| Loss on sale of assets |
27 | 2,318 | 1,270 | 806 | ||||||||||||||
| Pension and other postretirement benefit obligations |
— | (1,137 | ) | (939 | ) | (1,859 | ) | |||||||||||
| Impairment of long-lived assets |
— | 91,599 | 2,128 | 2,051 | ||||||||||||||
| Goodwill impairment |
— | — | 216 | 385 | ||||||||||||||
| Changes in assets and liabilities: |
||||||||||||||||||
| Accounts receivable, net |
(7,075 | ) | 4,210 | 3,448 | 2,478 | |||||||||||||
| Inventory |
(247 | ) | 105 | (2 | ) | 1,714 | ||||||||||||
| Prepaid expenses |
173 | (1,594 | ) | 9,605 | (4,977 | ) | ||||||||||||
| Other assets |
232 | (2,498 | ) | (1,903 | ) | (585 | ) | |||||||||||
| Accounts payable |
726 | 243 | 1,322 | 2,311 | ||||||||||||||
| Accrued expenses |
8,277 | 4,852 | (1,789 | ) | (1,731 | ) | ||||||||||||
| Accrued interest |
656 | 4,283 | 1,789 | 71 | ||||||||||||||
| Deferred revenue |
(665 | ) | (868 | ) | (1,597 | ) | (177 | ) | ||||||||||
| Other long-term liabilities |
76 | (746 | ) | (588 | ) | (701 | ) | |||||||||||
|
|
|
|
|
|
|
|
|
|||||||||||
| Net cash provided by (used in) operating activities |
16,160 | (5,972 | ) | 23,499 | 22,439 | |||||||||||||
|
|
|
|
|
|
|
|
|
|||||||||||
| Cash flows from investing activities: |
||||||||||||||||||
| Purchases of property, plant, and equipment |
(1,536 | ) | (3,632 | ) | (4,687 | ) | (3,330 | ) | ||||||||||
| Proceeds from sale of publications, other assets and insurance |
159 | 833 | 3,643 | 2,599 | ||||||||||||||
|
|
|
|
|
|
|
|
|
|||||||||||
| Net cash used in investing activities |
(1,377 | ) | (2,799 | ) | (1,044 | ) | (731 | ) | ||||||||||
|
|
|
|
|
|
|
|
|
|||||||||||
| Cash flows from financing activities: |
||||||||||||||||||
| Payment of debt issuance costs |
(3,690 | ) | — | — | — | |||||||||||||
| Net borrowings under credit facilities |
149,000 | — | — | — | ||||||||||||||
| Capital contribution to Local Media |
— | 1,610 | — | — | ||||||||||||||
| Repayments under current portion of long-term debt |
— | (6,648 | ) | (4,600 | ) | (11,249 | ) | |||||||||||
| Repayments under long-term debt |
— | — | (2,540 | ) | — | |||||||||||||
| Payment of dividends |
(149,000 | ) | — | — | — | |||||||||||||
|
|
|
|
|
|
|
|
|
|||||||||||
| Net cash used in financing activities |
(3,690 | ) | (5,038 | ) | (7,140 | ) | (11,249 | ) | ||||||||||
|
|
|
|
|
|
|
|
|
|||||||||||
| Net increase (decrease) in cash and cash equivalents |
11,093 | (13,809 | ) | 15,315 | 10,459 | |||||||||||||
| Cash and cash equivalents at beginning of period |
20,718 | 34,527 | 19,212 | 8,753 | ||||||||||||||
|
|
|
|
|
|
|
|
|
|||||||||||
| Cash and cash equivalents at end of period |
$ | 31,811 | $ | 20,718 | $ | 34,527 | $ | 19,212 | ||||||||||
|
|
|
|
|
|
|
|
|
|||||||||||
| Supplemental disclosures on cash flow information: |
||||||||||||||||||
| Cash interest paid |
$ | 925 | $ | 43,606 | $ | 55,976 | $ | 58,225 | ||||||||||
See accompanying notes to consolidated financial statements.
91
Table of Contents
NEW MEDIA INVESTMENT GROUP INC. AND SUBSIDIARIES
NOTES TO CONSOLIDATED FINANCIAL STATEMENTS
(In thousands, except share data)
(1) Description of Business, Basis of Presentation and Summary of Significant Accounting Policies
(a) Description of Business
New Media Investment Group Inc. (“New Media,” “Company,” “us,” or “we”), formerly known as GateHouse Media, Inc. (“GateHouse” or “Predecessor”), was formed as a Delaware corporation on June 18, 2013. New Media was capitalized and issued 1,000 common shares to Newcastle Investment Corp. (“Newcastle”). Newcastle owned approximately 84.6% of New Media until February 13, 2014, upon which date Newcastle distributed the shares that it held in New Media to its shareholders on a prorata basis. New Media had no operations until November 26, 2013, when it assumed control of GateHouse and Local Media Group Holdings LLC (“Local Media Parent”). The Company’s Predecessor and certain of its subsidiaries (collectively, the “Debtors”) filed voluntary petitions under Chapter 11 of title 11 of the U.S. Bankruptcy Code (the “Bankruptcy Code”), in the U.S. Bankruptcy Court for the District of Delaware (the “Bankruptcy Court”) on September 27, 2013. On November 6, 2013 (the “Confirmation Date”), the Bankruptcy Court confirmed the plan of reorganization (the “Plan” or “Plan of Reorganization”) and on November 26, 2013 (the “Effective Date”), the Debtors emerged from Chapter 11.
GateHouse was determined to be the predecessor to New Media, as the operations of GateHouse comprise substantially all of the business operations of the combined entities. As such, the consolidated financial statements presented herein for all periods prior to November 6, 2013 reflect the historical consolidated financial statements of GateHouse and its subsidiaries. Further, the Reorganization Value, as defined below, of GateHouse at the Confirmation Date, as defined below, approximated fair value as of November 26, 2013. The Company is a leading U.S. publisher of local newspapers and related publications that are generally the dominant source of local news and print advertising in their markets. As of December 29, 2013, the Company owned and operated 421 publications located in 24 states. The majority of the Company’s paid daily newspapers have been published for more than 100 years and are typically the only paid daily newspapers of general circulation in their respective nonmetropolitan markets. The Company’s publications generally face limited competition as a result of operating in small and midsized markets that can typically support only one newspaper. The Company has strategically clustered its publications in geographically diverse, nonmetropolitan markets in the Midwest and Northeast United States, which limits its exposure to economic conditions in any single market or region.
The Company’s operating segments (Large Community Newspapers, Small Community Newspapers, Local Media Newspapers and Directories) are aggregated into one reportable business segment.
(b) Basis of Presentation
The consolidated financial statements include the accounts of New Media and its subsidiaries. All significant intercompany accounts and transactions have been eliminated.
As discussed in Note 2, the Debtors emerged from Chapter 11 protection and adopted fresh start accounting in accordance with Financial Accounting Standards Board (“FASB”) Accounting Standards Codification (“ASC”), Topic 852, “Reorganizations” (“ASC 852”). The adoption of fresh start accounting resulted in the Company becoming a new entity for financial reporting purposes as of November 6, 2013. Accordingly, the consolidated financial statements on November 7, 2013 and subsequent periods are not comparable, in various material respects, to the Company’s consolidated financial statements prior to that date.
Fresh start accounting requires resetting the historical net book value of assets and liabilities to fair value by allocating the entity’s reorganization value (“Reorganization Value”) to its assets and liabilities pursuant to ASC
92
Table of Contents
Topic 805, “Business Combinations” (“ASC 805”). The excess reorganization value over the fair value of tangible and identifiable intangible assets is recorded as goodwill on the consolidated balance sheet. Deferred taxes are determined in conformity with ASC Topic 740, “Income Taxes” (“ASC 740”).
In addition, ASC 852 requires that financial statements, for periods including and subsequent to a Chapter 11 filing, distinguish transactions and events that are directly associated with the reorganization proceedings and the ongoing operations of the business, as well as additional disclosures. Effective September 27, 2013, expenses, gains and losses directly associated with the reorganization proceedings were reported as reorganization items in the accompanying consolidated statements of operations. In addition, liabilities subject to compromise in the Chapter 11 cases were distinguished from liabilities not subject to compromise and from post-petition liabilities. Liabilities subject to compromise were reported at amounts allowed or expected to be allowed under Chapter 11 bankruptcy proceedings.
The “Company,” when used in reference to the period subsequent to the application of fresh start accounting on November 6, 2013, refers to the “Successor Company,” and when used in reference to periods prior to fresh start accounting, refers to the “Predecessor Company.” Further, references to the “Ten months ended November 6, 2013” refer to the period from December 31, 2012 to November 6, 2013 and references to the “Two months ended December 29, 2013” refer to the period from November 7, 2013 to December 29, 2013.
(c) Recent Developments
The newspaper industry and our Predecessor have experienced declining same store revenue and profitability over the past several years. As a result, the Company’s Predecessor previously implemented, and the Company continues to implement, plans to reduce costs and preserve cash flow. This includes cost reduction programs and the sale of non-core assets. The Company believes these initiatives will provide it with the financial resources necessary to invest in the business and provide sufficient cash flow to enable the Company to meet its commitments for the next year.
(d) Use of Estimates
The preparation of financial statements in conformity with U.S. generally accepted accounting principles (“GAAP”) requires management to make estimates and assumptions that affect the reported amounts of assets and liabilities and disclosure of contingent assets and liabilities at the date of the financial statements and the reported amounts of revenues and expenses during the reporting period. Actual results could differ from those estimates.
Examples of significant estimates include fresh start accounting, pension and postretirement benefit obligation assumptions, income taxes and valuation of intangible assets. Actual results could differ from those estimates.
(e) Fiscal Year
The Company’s fiscal year is a 52 week operating year ending on the Sunday closest to December 31. The Company’s 2013 fiscal year ended on December 29, 2013 and encompassed a 52-week period. In 2012 a portion of the Company had 364 days of operations compared to 366 days in 2011. The Company’s 2012 fiscal year ended on December 30, 2012 and encompassed a 53-week period for approximately 60% of the Company.
(f) Accounts Receivable
Accounts receivable are stated at amounts due from customers, net of an allowance for doubtful accounts. The Company’s allowance for doubtful accounts is based upon several factors including the length of time the receivables are past due, historical payment trends and current economic factors. The Company generally does not require collateral.
93
Table of Contents
(g) Inventory
Inventory consists principally of newsprint, which is valued at the lower of cost or market. Cost is determined using the first-in, first-out (“FIFO”) method. In 2012 and 2013 the Company purchased approximately 75% and 95%, respectively, of its newsprint from one vendor. In 2014 the Company expects to purchases approximately 95% of newsprint from the same vendor.
(h) Property, Plant and Equipment
Property, plant and equipment are recorded at cost. Routine maintenance and repairs are expensed as incurred.
Depreciation is calculated under the straight-line method over the estimated useful lives, principally 10 to 30 years for buildings and improvements, 2 to 13 years for machinery and equipment, and 2 to 5 years for furniture, fixtures and computer software. Leasehold improvements are amortized under the straight-line method over the shorter of the lease term or estimated useful life of the asset.
(i) Goodwill, Intangible, and Long-Lived Assets
Intangible assets consist of advertiser, subscriber and customer relationships, mastheads, trade names and publication rights. The excess of acquisition costs over the estimated fair value of tangible and identifiable intangible net assets acquired is recorded as goodwill.
Goodwill is not amortized pursuant to ASC Topic 350 “Intangibles—Goodwill and Other” (“ASC 350”). Mastheads are not amortized because it has been determined that the useful lives of such mastheads are indefinite.
In accordance with ASC 350, goodwill and intangible assets with indefinite lives are tested for impairment annually or when events indicate that an impairment could exist which may include an economic downturn in a market, a change in the assessment of future operations or a decline in the Company’s stock price. The Company performs an annual impairment assessment on the last day of its fiscal second quarter. As required by ASC 350, the Company performs its impairment analysis on each of its reporting units. The reporting units have discrete financial information which are regularly reviewed by management. The fair value of the applicable reporting unit is compared to its carrying value. Calculating the fair value of a reporting unit requires significant estimates and assumptions by the Company. The Company estimates fair value by applying third-party market value indicators to projected cash flows and/or projected earnings before interest, taxes, depreciation, and amortization. In applying this methodology, the Company relies on a number of factors, including current operating results and cash flows, expected future operating results and cash flows, future business plans, and market data. If the carrying value of the reporting unit exceeds the estimate of fair value, the Company calculates the impairment as the excess of the carrying value of goodwill over its implied fair value.
Refer to Note 8 for additional information on the impairment testing of goodwill and indefinite lived intangible assets.
The Company accounts for long-lived assets in accordance with the provisions of ASC Topic 360, “Property, Plant and Equipment” (“ASC 360”). The Company assesses the recoverability of its long-lived assets, including property, plant and equipment and definite lived intangible assets, whenever events or changes in business circumstances indicate the carrying amount of the assets, or related group of assets, may not be fully recoverable. Impairment indicators include significant under performance relative to historical or projected future operating losses, significant changes in the manner of use of the acquired assets or the strategy for the Company’s overall business, and significant negative industry or economic trends. The assessment of recoverability is based on management’s estimates by comparing the sum of the estimated undiscounted cash flows generated by the underlying asset, or other appropriate grouping of assets, to its carrying value to
94
Table of Contents
determine whether an impairment existed at its lowest level of identifiable cash flows. If the carrying amount of the asset is greater than the expected undiscounted cash flows to be generated by such asset, an impairment is recognized to the extent the carrying value of such asset exceeds its fair value.
(j) Revenue Recognition
Advertising revenue is recognized upon publication of the advertisement. Circulation revenue from subscribers is billed to customers at the beginning of the subscription period and is recognized on a straight-line basis over the term of the related subscription. Circulation revenue from single-copy income is recognized based on date of publication, net of provisions for related returns. Revenue for commercial printing is recognized upon delivery. Directory revenue is recognized on a straight-line basis over the period in which the corresponding directory is distributed.
(k) Income Taxes
Income taxes are accounted for under the asset and liability method. Deferred tax assets and liabilities are recognized for the future tax consequences attributable to differences between the financial statement carrying amounts of existing assets and liabilities and their respective tax bases and operating loss and tax credit carryforwards. Deferred tax assets and liabilities are measured using enacted tax rates expected to apply to taxable income in the years in which those temporary differences are expected to be recovered or settled. The effect on deferred tax assets and liabilities of a change in tax rates is recognized in income in the period that includes the enactment date.
The Company has determined that it is more likely than not that its existing deferred tax assets will not be realized, and accordingly has provided a full valuation allowance. Any changes in the scheduled reversals of deferred taxes may require an additional valuation allowance against the remaining deferred tax assets. Any increase or decrease in the valuation allowance could result in an increase or decrease in income tax expense in the period of adjustment.
The Company accounts for uncertain tax positions under the provisions of ASC 740. The Company does not anticipate significant increases or decreases in our uncertain tax positions within the next twelve months. The Company recognizes penalties and interest relating to uncertain tax positions in tax expense.
(l) Fair Value of Financial Instruments
The carrying value of the Company’s cash equivalents, accounts receivable, accounts payable, and accrued expenses approximate fair value due to the short maturity of these instruments. An estimate of the fair value of the Company’s debt is disclosed in Note 11.
The Company accounts for derivative instruments in accordance with ASC Topic 815, “Derivatives and Hedging” (“ASC 815”) and ASC Topic 820 “Fair Value Measurements and Disclosures” (“ASC 820”). These standards require an entity to recognize all derivatives as either assets or liabilities in the consolidated balance sheet and measure those instruments at fair value. Additionally, the fair value adjustments will affect either accumulated other comprehensive loss or net loss depending on whether the derivative instrument qualifies as an effective hedge for accounting purposes and, if so, the nature of the hedging activity. The fair value of the Company’s derivative financial instruments is disclosed in Note 12.
(m) Cash Equivalents
Cash equivalents represent highly liquid certificates of deposit which have original maturities of three months or less.
95
Table of Contents
(n) Deferred Financing Costs
Deferred financing costs consist of costs incurred in connection with debt financings. Such costs are amortized on a straight-line basis, which approximates the effective interest method, over the estimated remaining term of the related debt.
(o) Advertising
Advertising costs are expensed in the period incurred. The Company incurred total advertising expenses for the Successor Company for the two months ended December 29, 2013, the Predecessor Company for the ten months ended November 6, 2013 and for the years ended December 30, 2012 and January 1, 2012 of $808, $2,693, $3,419 and $2,620, respectively.
(p) Earnings (loss) per share
Basic earnings (loss) per share is computed as net income (loss) available to common stockholders divided by the weighted average number of common shares outstanding for the period. Diluted earnings per share reflects the potential dilution that could occur from common shares issued through common stock equivalents.
(q) Stock-based Employee Compensation
ASC Topic 718, “Compensation—Stock Compensation” (“ASC 718”) requires that all share-based payments to employees, including grants of employee stock options, be recognized in the consolidated financial statements over the service period (generally the vesting period) based on fair values measured on grant dates.
(r) Pension and Postretirement Liabilities
ASC Topic 715, “Compensation—Retirement Benefits” (“ASC 715”) requires recognition of an asset or liability in the consolidated balance sheet reflecting the funded status of pension and other postretirement benefit plans such as retiree health and life, with current-year changes in the funded status recognized in accumulated other comprehensive loss. For the Successor Company for the two months ended December 29, 2013, the Predecessor Company for the ten months ended November 6, 2013 and for the years ended December 30, 2012 and January 1, 2012, a total of $458, $6,990, $(2,647) and $(2,797) net of taxes of $0, $0, $0 and $0, respectively, was recognized in other comprehensive loss (see Note 16).
(s) Self-Insurance Liability Accruals
The Company maintains self-insured medical and workers’ compensation programs. The Company purchases stop loss coverage from third parties which limits our exposure to large claims. The Company records a liability for healthcare and workers’ compensation costs during the period in which they occur as well as an estimate of incurred but not reported claims.
(t) Reclassifications
Certain amounts in the prior periods consolidated financial statements have been reclassified to conform to the current year presentation.
(u) Recently Issued Accounting Pronouncements
In July 2013, the FASB issued ASU No. 2013-11, “Presentation of an Unrecognized Tax Benefit When a Net Operating Loss Carryforward, a Similar Tax Loss, or a Tax Credit Carryforward Exists” which requires an unrecognized tax benefit to be presented as a reduction to a deferred tax asset for a net operating loss carryforward, a similar tax loss or a tax credit carryforward that the entity intends to use as of the reporting date. The Company will adopt the provisions of ASU No. 2013-11 in fiscal 2014. The amendments in this Update are not expected to have a material impact on the financial statements.
96
Table of Contents
(v) Accumulated Other Comprehensive Income (Loss)
The changes in accumulated other comprehensive income (loss) by component for the years ended December 30, 2012 and December 29, 2013 are outlined below.
| Gain (loss) on derivative instruments |
Net actuarial loss and prior service cost(1) |
Total | ||||||||||
| Balance at January 1, 2012, Predecessor Company |
$ | (50,017 | ) | $ | (4,342 | ) | $ | (54,359 | ) | |||
|
|
|
|
|
|
|
|||||||
| Other comprehensive income before reclassifications |
(24,405 | ) | (2 | ) | (24,407 | ) | ||||||
| Amounts reclassified from accumulated other comprehensive loss |
28,771 | (2,647 | ) | 26,124 | ||||||||
|
|
|
|
|
|
|
|||||||
| Net current period other comprehensive income, net of taxes |
4,366 | (2,649 | ) | 1,717 | ||||||||
|
|
|
|
|
|
|
|||||||
| Balance at December 30, 2012, Predecessor Company |
$ | (45,651 | ) | $ | (6,991 | ) | $ | (52,642 | ) | |||
|
|
|
|
|
|
|
|||||||
| Other comprehensive income before reclassifications |
(1,109 | ) | 1 | (1,108 | ) | |||||||
| Amounts reclassified from accumulated other comprehensive loss |
46,760 | 69 | 46,829 | |||||||||
|
|
|
|
|
|
|
|||||||
| Net current period other comprehensive income, net of taxes |
45,651 | 70 | 45,721 | |||||||||
| Elimination of Predecessor Company accumulated other comprehensive income |
— | 6,921 | 6,921 | |||||||||
|
|
|
|
|
|
|
|||||||
| Balance at November 6, 2013, Predecessor Company |
$ | — | $ | — | $ | — | ||||||
|
|
|
|
|
|
|
|||||||
| Other comprehensive income before reclassifications |
— | 458 | 458 | |||||||||
|
|
|
|
|
|
|
|||||||
| Net current period other comprehensive income, net of taxes |
— | 458 | 458 | |||||||||
|
|
|
|
|
|
|
|||||||
| Balance at December 29, 2013, Successor Company |
$ | — | $ | 458 | $ | 458 | ||||||
|
|
|
|
|
|
|
|||||||
| (1) | This accumulated other comprehensive income (loss) component is included in the computation of net periodic benefit cost. See Note 16. |
The following table presents reclassifications out of accumulated other comprehensive income (loss) for the Successor Company for the two months ended December 29, 2013, the Predecessor Company for the ten months ended November 6, 2013 and for the years ended December 30, 2012 and January 1, 2012.
| Amounts Reclassified from Accumulated Other Comprehensive Income (Loss) |
Affected Line Item in the Consolidated Statements of Operations and Comprehensive Income (Loss) | |||||||||||
| Two months ended December 29, 2013 |
|
Ten months ended November 6, 2013 |
||||||||||
| Loss on interest rate swap agreements, designated as cash flow hedges |
$ | — | $ | 20,447 | Interest expense | |||||||
| Amortization of prior service cost |
— | (383 | )(1) | |||||||||
| Amortization of unrecognized loss |
— | 452 | (1) | |||||||||
| Reclassification of unrealized losses upon dedesignation of cash flow hedges |
— | 26,313 | Interest expense | |||||||||
|
|
|
|
|
|
||||||||
| Amounts reclassified from accumulated other comprehensive loss |
— | 46,829 | Loss from continuing operations before income taxes | |||||||||
| Income tax benefit |
— | — | Income tax benefit | |||||||||
|
|
|
|
|
|
||||||||
| Amounts reclassified from accumulated other comprehensive loss, net of taxes |
$ | — | $ | 46,829 | Net income (loss) | |||||||
|
|
|
|
|
|
||||||||
97
Table of Contents
| (1) | This accumulated other comprehensive income (loss) component is included in the computation of net periodic benefit cost. See Note 16. |
(2) Voluntary Reorganization Under Chapter 11
Our Predecessor and certain of its subsidiaries commenced voluntary Chapter 11 bankruptcy proceedings in the Bankruptcy Court on September 27, 2013 (the “Petition Date”). Concurrent with the bankruptcy filing, our Predecessor filed and requested confirmation of the Plan. On September 4, 2013, our Predecessor entered into a restructuring support agreement (“RSA”) with Cortland Products Corp., as administrative agent (the “Administrative Agent”) and certain of the lenders under the 2007 Credit Facility (as defined below), including Newcastle and its affiliates.
Pursuant to its RSA, the Company solicited votes on the Plan from holders of claims under the Company’s 2007 Credit Facility and certain related interest rate swaps. The Plan was accepted by the only impaired class of creditors entitled to vote on it. Specifically, 100% of holders of secured debt voted to accept the Plan. No creditors voted to reject the Plan.
Pension, trade and all other unsecured creditors of the Company were not impaired under the prepackaged Plan, and their votes were not solicited. The Company’s common stock was canceled under the Plan, and holders of secured debt had the option of receiving a cash distribution equal to 40% of their claims, or stock in New Media, a holding company that owns GateHouse and Local Media Parent, as described below.
The key terms of the Plan were as follows:
The Plan proposed a restructuring of the Company pursuant to a pre-packaged restructuring under Chapter 11 of the Bankruptcy Code whereby each Creditor (as defined below) had the option of exchanging its holdings in the Outstanding Debt (as defined below) for either its pro rata share of cash or common stock in New Media (such common stock, “New Media Common Stock”) with ownership interests in the reorganized Company (such reorganized Company, “New GateHouse”).
The Plan included the restructuring of the following indebtedness of the Company (the “Outstanding Debt”):
(a) Indebtedness under the 2007 Credit Facility, consisting of a “Revolving Credit Facility,” a “Term Loan Facility,” a “Delayed Draw Term Loan Facility” and an “Incremental Term Loan Facility” (collectively, the “2007 Credit Facility Claims”). The 2007 Credit Facility Claims consisted of a (i) Revolving Credit Facility of $0 and $0 at December 30, 2012 and September 27, 2013, respectively, (ii) Term Loan Facility of $658,281 and $654,554 at December 30, 2012 and September 27, 2013, respectively, (iii) Delayed Draw Term Loan Facility of $245,627 and $244,236 at December 30, 2012 and September 27, 2013, respectively and (iv) Incremental Term Loan Facility of $270,190 and $268,660 at December 30, 2012 and September 27, 2013, respectively.
(b) Swap Liability, including (i) $100,000 notional amount executed February 27, 2007, (ii) $250,000 notional amount executed April 4, 2007, (iii) $200,000 notional amount executed April 13, 2007 and (iv) $75,000 notional amount executed September 18, 2007. As of December 31, 2012 and September 27, 2013, the carrying value of the Swap Liability totaled $45,724 and $28,440, respectively.
Holders of the Outstanding Debt are referred to herein as “Creditors.”
The Plan restructured the Outstanding Debt as follows:
(a) Each Creditor of the Outstanding Debt received, in full and final satisfaction of its respective claim, at its election (with respect to all or any portion of its claims) to be made in connection with solicitation of the Plan, its pro rata share of:
98
Table of Contents
i. Cash pursuant to the Cash-Out Offer (described below under “Cash-Out Offer”) (the “Cash-Out Option”); and/or
ii. (A) New Media Common Stock (subject to dilution as discussed herein) and (B) the Net Proceeds (as defined below), net of certain transaction costs (collectively, the “New Media Equity Option”).
Creditors that did not make an election during the Solicitation Period (as defined below) with respect to their claims were deemed to have elected the Cash-Out Option.
(b) Pension, trade and all other unsecured claims were unimpaired by the Plan.
(c) The interest of holders of equity interests in the Company, including warrants, rights and options to acquire such equity interests (“Former Equity Holders”), were cancelled, and Former Equity Holders received 10-year warrants, collectively representing the right to acquire, in the aggregate, equity equal to 5% of the issued and outstanding shares of New Media (the “New Media Warrants”) (subject to dilution) as of the Effective Date, with the strike price per share of $46.35 calculated based on a total equity value of New Media prior to the Local Media Contribution (as defined below) of $1,200,000 as of the Effective Date. New Media Warrants do not have the benefit of antidilution protections, other than customary protections including for stock splits and stock dividends.
Cash-Out Offer
In connection with the Plan, Newcastle (“Plan Sponsor”) (or its designated affiliates) offered to purchase, in cash, an amount equal to 40% of the sum of (a) $1,167,450 of principal of the claims under the 2007 Credit Facility, plus (b) accrued and unpaid interest at the applicable contract non-default rate with respect thereto, plus (c) all amounts due under and subject to the terms of the interest rate swaps secured under the 2007 Credit Facility (for the avoidance of doubt, excluding any default interest) on the Effective Date of the Plan. The Cash-Out Offer was coterminous with the Solicitation Period (as defined below).
Registration Rights
As of the Effective Date of the Plan, New Media entered into a registration rights agreement with certain holders of the Outstanding Debt that received 10% or more of the New Media Common Stock, to provide customary registration rights.
New Media Equity Option
Instead of the Cash-Out Offer, each Creditor could have elected to receive in satisfaction of its claims, a pro rata share of New Media Common Stock and the Net Proceeds (as defined below), net of certain transaction costs. New Media listed New Media Common Stock (the “Listing”) on the New York Stock Exchange (“NYSE”) on February 14, 2014 and may raise additional equity capital. The Listing was not a condition precedent to the effectiveness of the Plan. Under the Plan, New Media did not impose any transfer restrictions on New Media Common Stock.
Financing
The Company was to use commercially reasonable efforts based on market conditions and other factors, to raise up to $165,000 of new debt, including a $150,000 facility to fund distributions and other payments under the Plan (the “Financing”). The distribution was made to holders of New Media Common Stock, including Plan Sponsor (or its designated affiliates) on account of the Cash-Out Offer, on the Effective Date (the “Net Proceeds”). The Net Proceeds distributed to holders of the Outstanding Debt totaled $149,000. The Financing was not a condition precedent to the effectiveness of the Plan.
99
Table of Contents
Contribution of Local Media Group Holdings LLC
The Plan Sponsor acquired Local Media Group, Inc. (“Local Media”), a publisher of weekly newspaper publications, on September 3, 2013. Subject to the terms of the Plan, the Plan Sponsor contributed Local Media Parent and assigned its rights under the related stock purchase agreement to New Media on the Effective Date (the “Local Media Contribution”) in exchange for shares of New Media Common Stock equal in value to the cost of the Local Media Acquisition (as defined below) (as adjusted pursuant to the Plan) based upon the equity value of New Media as of the Effective Date prior to the contribution.
Management Agreement
On the Effective Date, New Media entered into a management agreement with FIG LLC (the “Manager”) (the “Management Agreement”) pursuant to which the Manager manages the operations of New Media. The annual management fee is 1.50% of New Media’s gross equity as set forth in the Management Agreement and is eligible to receive incentive compensation.
Releases
To the fullest extent permitted by applicable law, the restructuring included a full release from liability of the Company, Plan Sponsor, the Administrative Agent, the Creditors, and all current and former direct and indirect members, partners, subsidiaries, affiliates, funds, managers, managing members, officers, directors, employees, advisors, principals, attorneys, professionals, accountants, investment bankers, consultants, agents, and other representatives (including their respective members, partners, subsidiaries, affiliates, funds, managers, managing members, officers, directors, employees, advisors, principals, attorneys, professionals, accountants, investment bankers, consultants, agents, and other representatives) by the Company, Plan Sponsor and the Creditors from any claims or causes of action related to or arising out of the Company, the Outstanding Debt or the Restructuring on or prior to the Effective Date, except for any claims and causes of action for fraud, gross negligence or willful misconduct.
Confirmation of the Plan
On November 6, 2013, the Bankruptcy Court confirmed the Plan.
Investment Commitment Letter
On September 4, 2013 the Plan Sponsor and the Company entered into an investment commitment letter in connection with the restructuring, pursuant to which Plan Sponsor agreed to purchase the Cash-Out Offer claims, described above. The investment commitment letter provides that, on account of the claims purchased in the Cash-Out Offer on the Effective Date of the Plan, Plan Sponsor will receive its pro rata share of (a) New Media Common Stock and (b) Net Proceeds, net of transaction expenses associated with transactions under the Plan.
Liabilities Subject to Compromise
In accordance with ASC 852, the amount of liabilities subject to compromise represents certain liabilities of the Debtors pre-petition claims addressed in connection with the bankruptcy proceedings. Such liabilities are reported at the Debtors’ allowed claim amount, even though they may be settled for lesser amounts.
100
Table of Contents
Liabilities subject to compromise for the Predecessor Company were as follows:
| Predecessor Company November 6, 2013 |
||||
| Accrued interest |
$ | 8,769 | ||
| Lease termination liability |
886 | |||
| Long-term debt |
1,167,450 | |||
| Derivative instruments |
28,440 | |||
|
|
|
|||
| Liabilities subject to compromise |
$ | 1,205,545 | ||
|
|
|
|||
The Plan effects only the Company’s 2007 Credit Facility and derivative instruments. Refer to Note 11 for additional information. Pension, trade and other unsecured claims were not impaired under the Plan.
Reorganization Items, Net
In accordance with ASC 852 the Company has segregated reorganization items related to the Plan in its consolidated statement of operations and comprehensive income (loss). A summary of reorganization items, for the Predecessor Company is presented in the following table:
| Predecessor Company Ten Months Ended November 6, 2013 |
||||
| Write-off of deferred financing costs |
$ | 948 | ||
| Credit agreement amendment fees |
6,790 | |||
| Bankruptcy fees |
11,643 | |||
| Net gain on reorganization adjustments |
(722,796 | ) | ||
| Net gain on fresh start adjustments |
(246,243 | ) | ||
| Adjustment to the allowed claim for derivative instruments |
2,041 | |||
|
|
|
|||
| Reorganization items, net |
$ | (947,617 | ) | |
|
|
|
|||
For the Predecessor Company for the ten months ended November 6, 2013, the Company paid approximately $6,988 for reorganization items.
(3) Fresh Start Accounting
Upon confirmation of the Plan by the Bankruptcy Court on November 6, 2013, the Company satisfied the remaining material conditions to complete the implementation of the Plan, and as a result, the Company adopted fresh start accounting as (i) the reorganization value of the assets of the Successor Company immediately before the date of confirmation of the Plan was less than the total of all post-petition liabilities and allowed claims and (ii) the holders of the Predecessor Company’s voting shares immediately before confirmation of the Plan received less than 50% of the voting shares of the emerging entity.
The Bankruptcy Court confirmed the Plan based upon an estimated enterprise value of the Company between $385,000 and $515,000, which was estimated using various valuation methods, including (i) a comparison of the Company and its projected performance to the market values of comparable companies; (ii) a review and analysis of several recent transactions of companies in similar industries to the Company; and (iii) a calculation of the present value of the future cash flows of the Company based on its projections. The Company concluded the enterprise value was $489,931 based upon the Cash-Out Offer and equity distribution plus estimated transaction fees.
101
Table of Contents
The determination of the estimated reorganization value was based on a discounted cash flow analysis. This value was reconciled to the transaction value as outlined within the Plan and was within a reasonable range of comparable market multiples. The assumptions used in the calculations for the discounted cash flow analysis included projected revenue, costs, and cash flows through 2016 and represented the Company’s best estimates at the time the analysis was prepared. The discounted cash flow method reflects the following assumptions: (i) terminal value, which was determined using a growth model that applied a long-term growth rate of 0.0% to GateHouse’s projected cash flows beyond 2016. The long-term growth rate was based on GateHouse’s internal projections as well as industry growth prospects; (ii) discount rates that considered various factors including bond yields, risk premiums, and tax rates to determine a weighted-average cost of capital (“WACC”), which represents a company’s cost of debt and equity weighted by the percentage of debt and equity in a company’s target capital structure. A WACC of 15% was used; and (iii) an effective tax rate of 39.15% and an assumed carry-over tax basis of $683,200 for fixed assets and intangibles. A deferred tax asset is not reflected within the fresh start opening balances given GateHouse’s history of losses. While the Company considers such estimates and assumptions reasonable, they are inherently subject to significant business, economic and competitive uncertainties, many of which are beyond the Company’s control and, therefore, may not be realized.
Upon adoption of fresh start accounting, the recorded amounts of assets and liabilities were adjusted to reflect their estimated fair values. Accordingly, the reported historical financial statements of the Predecessor Company prior to the adoption of fresh start accounting for periods ended on or prior to November 6, 2013 are not comparable to those of the Successor Company.
In applying fresh start accounting, the Company followed these principles:
The Reorganization Value, which represents the concluded enterprise value plus excess cash and cash equivalents and non-interesting bearing liabilities, of the Predecessor was allocated to the entity’s net assets in conformity with ASC 805. The Reorganization Value exceeded the sum of the fair value assigned to assets and liabilities. This excess was recorded as Successor Company goodwill as of November 6, 2013.
Each liability existing as of the fresh start accounting date, other than deferred taxes, has been stated at the fair value, and determined at appropriate risk adjusted interest rates. Deferred taxes were reported in conformity with applicable income tax accounting standards, principally ASC 740.
102
Table of Contents
The following table identifies the adjustments recorded to the Predecessor’s November 6, 2013 consolidated statement of financial position as a result of implementing the Plan and applying fresh start accounting:
| Predecessor November 6, 2013 |
Effects of Plan Adjustments |
Fresh Start Adjustments |
Successor November 6, 2013 |
|||||||||||||
| ASSETS | ||||||||||||||||
| Current Assets |
||||||||||||||||
| Cash and cash equivalents |
$ | 20,718 | $ | — | $ | — | $ | 20,718 | ||||||||
| Restricted cash |
6,716 | — | — | 6,716 | ||||||||||||
| Accounts receivable |
64,315 | — | — | 64,315 | ||||||||||||
| Inventory |
7,450 | — | — | 7,450 | ||||||||||||
| Prepaid expenses |
9,420 | — | — | 9,420 | ||||||||||||
| Other current assets |
10,533 | — | — | 10,533 | ||||||||||||
|
|
|
|
|
|
|
|
|
|||||||||
| Total Current Assets |
119,152 | — | — | 119,152 | ||||||||||||
| Property, plant, and equipment |
$ | 176,644 | — | 97,475 | (g) | 274,119 | ||||||||||
| Goodwill |
14,204 | 725 | (a) | 110,982 | (h) | 125,911 | ||||||||||
| Intangible assets |
113,130 | — | 33,320 | (h) | 146,450 | |||||||||||
| Deferred financing costs, net |
2,061 | — | — | 2,061 | ||||||||||||
| Other assets |
2,373 | — | — | 2,373 | ||||||||||||
| Assets held for sale |
474 | — | — | 474 | ||||||||||||
|
|
|
|
|
|
|
|
|
|||||||||
| Total Assets |
$ | 428,038 | $ | 725 | $ | 241,777 | $ | 670,540 | ||||||||
|
|
|
|
|
|
|
|
|
|||||||||
| LIABILITIES AND STOCKHOLDERS’ EQUITY (DEFICIT) | ||||||||||||||||
| Current Liabilities: |
||||||||||||||||
| Current portion of long-term liabilities |
698 | $ | — | $ | (322 | )(i) | $ | 376 | ||||||||
| Current portion of long-term debt |
813 | — | — | 813 | ||||||||||||
| Accounts payable |
10,247 | — | — | 10,247 | ||||||||||||
| Accrued expenses |
45,788 | 886 | (b) | 239 | (i,j) | 46,913 | ||||||||||
| Accrued interest |
172 | — | — | 172 | ||||||||||||
| Deferred revenue |
31,348 | — | — | 31,348 | ||||||||||||
|
|
|
|
|
|
|
|
|
|||||||||
| Total Current Liabilities |
89,066 | 886 | (83 | ) | 89,869 | |||||||||||
| Long-term Liabilities: |
||||||||||||||||
| Long-term debt |
32,188 | — | — | 32,188 | ||||||||||||
| Long-term liabilities, less current portion |
2,047 | — | (1,105 | )(j) | 942 | |||||||||||
| Derivative instruments |
— | — | — | — | ||||||||||||
| Pension and other postretirement benefit obligations |
14,120 | — | (3,277 | )(i) | 10,843 | |||||||||||
| Liabilities subject to compromise |
1,205,545 | (1,205,545 | )(c) | — | — | |||||||||||
|
|
|
|
|
|
|
|
|
|||||||||
| Total Liabilities |
1,342,966 | (1,204,659 | ) | (4,465 | ) | 133,842 | ||||||||||
| Stockholders’ Equity (Deficit): |
||||||||||||||||
| Predecessor common stock |
568 | — | (568 | )(k) | — | |||||||||||
| Successor common stock |
— | 300 | (d) | — | 300 | |||||||||||
| Additional paid-in capital |
831,369 | 536,398 | (a,d,e) | (831,369 | )(k) | 536,398 | ||||||||||
| Accumulated other comprehensive loss |
(6,921 | ) | — | 6,921 | (k) | — | ||||||||||
| Accumulated deficit |
(1,792,749 | ) | 721,801 | (f) | 1,070,948 | (k) | — | |||||||||
| Treasury stock, at cost |
(310 | ) | — | 310 | (k) | — | ||||||||||
|
|
|
|
|
|
|
|
|
|||||||||
| Total New Media stockholders’ equity (deficit) |
(968,043 | ) | 1,258,499 | 246,242 | 536,698 | |||||||||||
| Noncontrolling interest |
53,115 | (53,115 | )(a) | — | — | |||||||||||
| Total Stockholders’ Equity (Deficit) |
(914,928 | ) | 1,205,384 | 246,242 | 536,698 | |||||||||||
|
|
|
|
|
|
|
|
|
|||||||||
| Total Liabilities and Stockholders’ Equity (Deficit) |
$ | 428,038 | $ | 725 | $ | 241,777 | $ | 670,540 | ||||||||
|
|
|
|
|
|
|
|
|
|||||||||
103
Table of Contents
Effects of Plan Adjustments
| (a) | As part of the Plan, the Plan Sponsor agreed to contribute 100% of the stock of Local Media Parent to New Media and assign its rights under the related stock purchase agreement to New Media in exchange for shares of New Media Common Stock, collectively equal in value to the cost of the Local Media Acquisition (as adjusted pursuant to the Plan) upon the Effective Date. The Company accounted for the consolidation of Local Media under the purchase method of accounting in accordance with ASC 805. Accordingly, the assets acquired and liabilities assumed were recorded at their acquisition date fair values. Any excess of the acquisition value over the fair value of assets acquired and liabilities assumed were allocated to goodwill. |
On the Effective Date, the noncontrolling interest of $53,115 is eliminated and recorded as additional paid-in capital as New Media obtained controlling financial interest in Local Media. The adjustment to goodwill results from New Media’s application of ASC 805 on the Effective Date as compared to the previously recognized goodwill recognized by GateHouse upon the consolidation of Local Media on September 3, 2013.
| (b) | The adjustment reclassifies $886 related to rejected lease obligations previously recorded as liabilities subject to compromise (see note (c)). These rejected lease obligations are to be paid by the Successor Company in subsequent periods. |
| (c) | The adjustment to liabilities subject to compromise relates to the extinguishment of the Outstanding Debt and allowed claim on rejected leases. The holders of the Outstanding Debt received a settlement of New Media Common Stock and the allowed claim on rejected leases will be paid in full and has been reclassified to current payables (see note (b)). |
| (d) | This adjustment reflects the Successor Company’s common stock and additional paid-in capital resulting from the exchange of the Outstanding Debt at 40% for New Media Common Stock with a par value of $0.01 plus the value of the contribution of Local Media Parent for a total issuance of 30,000 shares of New Media Common Stock. The issuance of New Media Warrants as described in note (e) to the Former Equity Holders is also included within the additional paid-in capital as follows: |
| Exchange by Plan Sponsor of $549,000 Outstanding Debt acquired other than in the Cash-Out Offer for New Media Common Stock |
$ | 219,125 | ||
| Exchange by Plan Sponsor of $442,000 Outstanding Debt acquired in the Cash-Out Offer for New Media Common Stock |
176,615 | |||
| Exchange by debt holders other than Plan Sponsor of $215,000 Outstanding Debt for New Media Common Stock |
86,123 | |||
| Contribution by Plan Sponsor of Local Media for New Media Common Stock |
53,840 | |||
| New Media Warrants issued to Former Equity Holders |
995 | |||
| Impact of classification of issuance of warrants within additional paid in capital |
(995 | ) | ||
|
|
|
|||
| Net impact of stockholders’ equity (deficit) |
$ | 535,703 | ||
|
|
|
| (e) | Former Equity Holders received New Media Warrants representing the right to acquire equity equal to 5.0% of the issued and outstanding shares of New Media as of the Effective Date of the Plan, with the strike price for such warrants calculated based on a total equity value of New Media, prior to the Local Media contribution, of $1,204,659 as of the Effective Date, subject to adjustment. Existing Predecessor equity values were cancelled under the Plan. The New Media Warrants were valued at $0.73 per share using the Black-Scholes valuation model. Significant assumptions used in determining the fair value of such warrants at issuance included an assumed dividend yield of 6.9%, share price volatility of 41.7% and a risk-free rate of return of 2.7% with a 10 year term. The dividend yield and volatility assumption were based on the implied volatility and historical realized volatility and historical yield for comparable companies. The risk-free rate assumption was based on 10-year U.S. Treasury bond yields. On the Effective Date, Former Equity Holders were deemed to have been issued 1,362,479 New Media Warrants with a value of $995. The New Media Warrants have a strike price of $46.35 per share and expire on November 26, 2023. |
104
Table of Contents
| (f) | This adjustment reflects the net effect of the transaction related to the consummation of the Plan on Predecessor’s accumulated deficit and accumulated other comprehensive loss. The table below provides a summary of the adjustments to accumulated deficit as it pertains to the Plan: |
| Liabilities subject to compromise eliminated: |
||||
| Secured indebtedness of $1,167,450 and accrued interest outstanding of $8,769 |
$ | 1,176,219 | ||
| Derivative instrument liability |
28,440 | |||
| Rejected lease claim |
886 | |||
|
|
|
|||
| Total liabilities subject to compromise eliminated |
1,205,545 | |||
| Consideration given: |
||||
| Issuance of New Media common stock |
(481,863 | ) | ||
| Lease claim accrual |
(886 | ) | ||
|
|
|
|||
| Gain on extinguishment of debt |
722,796 | |||
| Issuance of New Media Warrants |
(995 | ) | ||
|
|
|
|||
| Total adjustment to accumulated deficit |
$ | 721,801 | ||
|
|
|
Fresh Start Adjustments
| (g) | An adjustment of $97,475 was recorded to adjust the net book value of property, plant and equipment to fair value. The Company obtained third party independent appraisals to assist in the determination of the fair values of property, plant and equipment. The property, plant and equipment appraisal included an analysis of recent comparable sales and offerings of land parcels in each of the subject’s markets. The appraised value used the standard accepted appraisal practices and valuation procedures. Uniform Standards of Professional Appraisal Practice require that the appraiser consider three basic approaches to value: the cost approach (used for equipment where an active secondary market is not available and building improvements), the direct sales comparison (market) approach (used for land and equipment where an active market is available), and the income approach (used for intangibles). These approaches are based on the cost to reproduce assets, market exchanges for comparable assets and the capitalization of income. |
| (h) | Adjustment eliminated the balance of goodwill, mastheads, and other unamortized intangible assets of the Predecessor Company and records Successor Company intangible assets, including the reorganization value of assets in excess of amounts allocated to identified tangible and intangible assets, also referred to as Successor Company goodwill. |
| GateHouse business enterprise value |
$ | 489,931 | ||
| Less: Transaction fees |
(7,073 | ) | ||
| Add: Local Media contribution |
53,840 | |||
| Add: Fair value of liabilities excluded from enterprise value |
133,842 | |||
| Less: Fair value of tangible assets |
(398,179 | ) | ||
| Less: Fair value of identified intangible assets |
(146,450 | ) | ||
|
|
|
|||
| Reorganization value of assets in excess of amounts allocated to identified tangible and intangible assets (Successor company goodwill) |
$ | 125,911 | ||
|
|
|
The following represent the methodologies and significant assumptions used in determining the fair value of intangible assets, other than goodwill.
The Company valued the following intangible assets using the income approach, specifically the excess earnings method: subscriber relationships, advertiser relationships and customer relationships. In determining the fair value of these intangible assets, the excess earnings approach values the intangible asset at the present value of the incremental after-tax cash flows attributable only to the asset after deducting contributory asset charges. The incremental after-tax cash flows attributable to the subject intangible asset are then discounted to their present value. A static pool approach using historical attrition rates was used to
105
Table of Contents
estimate attrition rates of 5.0% to 7.5% for advertiser relationships, subscriber relationships and customer relationships. The growth rate was estimated to be 0.0% and the discount rates were estimated to range from 14.5% to 17.0% for advertiser relationships and 14.5% to 15.5% for subscriber and customer relationships.
The Company valued mastheads using the income approach, specifically the relief from royalty method. Under this method, the asset values were determined by estimating the hypothetical royalties that would have been paid if the mastheads were not owned. Key assumptions utilized in this valuation include revenue projections, royalty rates of 1.3% to 2.0%, a long term growth rate of 0.0% and discount rates of 14.5% to 16.5%.
| (i) | A decrease of $3,719 was recorded to measure the pension and post-retirement obligations at fair value. This adjustment primarily reflects the difference between the expected return on plan assets as compared to the fair value of the plan assets and the change in the duration weighted discount rate associated with the payment of the benefit obligations from prior measurement date and the Effective Date. The weighted average discount rate for the pension plan is 4.85% and the postretirement medical plan is 4.3%. |
| (j) | As prescribed in ASC 805, lease arrangements are recognized at fair value as of the Effective Date. This adjustment reflects the elimination of Predecessor leases with escalating payment terms of $1,428. Also reflected is an unfavorable lease of $682. As part of the fresh start valuation, leases were reviewed to determine if terms were favorable or unfavorable. Based on a comparison of contractual lease terms and current market lease rates, eight leases were identified as unfavorable. |
| (k) | The Predecessor Company’s accumulated deficit and accumulated other comprehensive income is eliminated in conjunction with the adoption of fresh start accounting. Also, pursuant to the Plan, Predecessor Company’s common stock and related additional paid in capital were eliminated as all Predecessor Company equity interests were cancelled. The Predecessor Company recognized a $246,242 gain related to the fresh start accounting adjustments as follows: |
| Establishment of Successor Company’s goodwill |
$ | (125,911 | ) | |
| Elimination of Predecessor Company’s goodwill |
14,204 | |||
| Add-back Local Media goodwill adjustment |
725 | |||
| Establishment of Successor Company’s other intangible assets |
(146,450 | ) | ||
| Elimination of Predecessor Company’s other intangible assets |
113,130 | |||
| Property, plant and equipment fair value adjustments |
(97,475 | ) | ||
| Pension and postretirement fair value adjustments |
(3,719 | ) | ||
| Rent and unfavorable lease fair value adjustments |
(746 | ) | ||
|
|
|
|||
| Gain on fresh start accounting adjustments |
$ | (246,242 | ) | |
|
|
|
The net effect of the above adjustments on additional paid in capital was $830,374 net of the impact of the classification of the warrants within additional paid in capital of $995.
(4) Local Media Acquisition
On September 3, 2013, Newcastle acquired Local Media. GateHouse entered into a management and advisory agreement with Local Media Parent, which was assigned to Local Media, to manage the operations of Local Media. In return, GateHouse receives compensation including an annual fee and is eligible to earn an annual incentive pay out equal to 12.5% of the EBITDA of Local Media in excess of budget. Although Newcastle owned 100.0% of the equity of Local Media, GateHouse manages the daily operations of Local Media. GateHouse determined that the management and advisory agreement resulted in Local Media being a variable interest entity and GateHouse has the power to direct the activities that most significantly affect the economic performance of the entity. As a result, GateHouse is the primary beneficiary and therefore consolidated Local Media’s financial position and results of operations beginning on September 3, 2013. As 100% of Local Media was owned by Newcastle, the net income (loss) of Local Media was reflected in noncontrolling interest through the Confirmation Date as Newcastle contributed the net assets of Local Media Parent to New Media as part of the Plan, refer to fresh start accounting discussion in Note 3 above.
106
Table of Contents
The Predecessor accounted for the consolidation of Local Media under the purchase method of accounting. Accordingly, the net assets, including noncontrolling interest, were recorded at their fair values. The transaction costs were incurred by Newcastle not GateHouse. The net assets, including goodwill of Local Media were recorded in the consolidated balance sheet at their estimated fair value in accordance with ASC 805. The value allocated in consolidating Local Media, was approximately $83,060 and $2,089 of acquisition related costs were recognized. Local Media Parent contributed a net amount of $53,323 of equity and Local Media entered into a long-term debt agreement for $33,000. Local Media consists of eight daily and fifteen weekly newspapers as well as ten shopper publications, serving areas of New York, Massachusetts, California, Pennsylvania, Oregon and New Hampshire. The results of operations for Local Media were included in the Predecessor’s consolidated financial statements from September 3, 2013.
The following table summarizes estimated the fair values of the Local Media assets and liabilities as of September 3, 2013:
| Current assets |
$ | 18,673 | ||
| Property, plant and equipment |
73,718 | |||
| Mastheads |
4,100 | |||
| Goodwill |
462 | |||
|
|
|
|||
| Total assets |
96,953 | |||
| Current liabilities |
13,893 | |||
|
|
|
|||
| Total liabilities |
13,893 | |||
|
|
|
|||
| Net assets |
$ | 83,060 | ||
|
|
|
The Predecessor obtained third party independent appraisals to assist in the determination of the fair values of property, plant and equipment and intangible assets. The property, plant and equipment appraisal included an analysis of recent comparable sales and offerings of land parcels in each of the subject’s markets. The appraised value is supported with consideration and use of standard accepted appraisal practices and valuation procedures. The appraiser used the three basic approaches to value: the cost approach (used for equipment where an active secondary market is not available and building improvements), the direct sales comparison (market) approach (used for land and equipment where an active secondary market is available) and the income approach (used for intangible assets). These approaches used are based on the cost to reproduce assets, market exchanges for comparable assets and the capitalization of income. Useful lives range from 1 to 7 years for personal property and 17 to 38 years for real property.
The appraisal utilized a relief from royalty method, an income approach, to determine the fair value of mastheads. Key assumptions utilized in this valuation include revenue projections, a royalty rate of 1.5%, long term growth rate of 0%, tax rate of 39.2% and discount rate of 25.0%. Based on estimated discount rates, attrition levels and other available data, the advertiser and subscriber relationships were determined to have a fair value of $0.
Trade accounts receivable, having an estimated fair value of $13,427, were included in the acquired assets. The gross contractual amount of these receivables was $14,937 and the contractual cash flows not expected to be collected was estimated at $1,510 as of the acquisition date.
Local Media accounted for inventory using a weighted cost methodology, which was deemed to approximate fair value. The FIFO valuation method is used and is consistent with the Company’s inventory valuation. The difference between the weighted average and FIFO methodology does not have a material effect on the results of operations.
For the period from the date of acquisition through November 6, 2013 and for the period from November 7, 2013 through December 29, 2013 Local Media had revenues of $24,661 and $28,578, and net income (loss) of ($208) and $2,353, respectively.
107
Table of Contents
For tax purposes, the amount of goodwill that is expected to be deductible is $1,187 as of December 29, 2013.
The estimated fair values are preliminary pending the finalization of the valuation of the assets acquired, primarily working capital adjustments. The estimated fair values assigned to the net assets of Local Media upon consolidation as of September 3, 2013 approximated their estimated fair values as of the date Local Media was contributed by Newcastle to New Media.
Pro-Forma Results
The unaudited pro forma condensed consolidated statement of operations information for 2013, set forth below, presents the results of operations as if the consolidation of the newspapers from Local Media had occurred on January 2, 2012. The unaudited pro forma condensed consolidated statement of operations information for 2012, set forth below, presents the results of operations as if the consolidation of the Local Media had occurred on January 2, 2012. These amounts are not necessarily indicative of future results or actual results that would have been achieved had the acquisitions occurred as of the beginning of such period.
| Successor Company |
Predecessor Company | |||||||||||||
| Two Months ended December 29, 2013 |
Ten months ended November 6, 2013 |
Twelve months ended December 30, 2012 |
||||||||||||
| Revenues |
$ | 103,231 | $ | 516,919 | $ | 653,266 | ||||||||
| Income (loss) from continuing operations |
$ | 7,206 | $ | 747,637 | $ | (213,519 | ) | |||||||
| Income (loss) from continuing operations per common share: |
||||||||||||||
| Basic |
$ | 0.24 | $ | 12.87 | $ | (3.68 | ) | |||||||
| Diluted |
$ | 0.24 | $ | 12.87 | $ | (3.68 | ) | |||||||
(5) Share-Based Compensation
As of November 6, 2013, all compensation cost for share-based payments have been recognized.
(a) Restricted Share Grants (“RSGs”)
Prior to the Predecessor’s Initial Public Offering (“IPO”) in 2006, the Predecessor had issued 792,500 RSGs to certain management investors pursuant to each investor’s management stockholder agreement (each, a “Management Stockholder Agreement”). Under the Management Stockholder Agreements, RSGs vest by one-third on each of the third, fourth and fifth anniversaries from the grant date. Following the adoption of the GateHouse Media, Inc. Omnibus Stock Incentive Plan (the “RSG Plan”) in October 2006, an additional 268,680 RSGs were granted during the year ended December 31, 2006 to the Predecessor’s directors, management, and employees. During the year ended December 31, 2007 an additional 198,846 RSGs were granted to the Predecessor’s directors, management and employees, 105,453 of which were both granted and forfeited. During the year ended December 31, 2009 an additional 266,795 RSGs were granted to the Predecessor’s directors, management and employees, 42,535 of which were both granted and forfeited. During the year ended December 31, 2010 an additional 100,000 RSGs were granted to the Predecessor’s management. The majority of the RSGs issued under the RSG Plan vest in increments of one-third on each of the first, second and third anniversaries of the grant date. In the event a grantee of an RSG is terminated by the Predecessor without cause, a number of unvested RSGs immediately vest that would have vested under the normal vesting period on the next succeeding anniversary date following such termination. In the event an RSG grantee’s employment with the Predecessor is terminated without cause within twelve months after a change in control as defined in the applicable award agreement, all unvested RSGs become immediately vested at the termination date. During the period prior to the lapse and removal of the vesting restrictions, a grantee of an RSG will have all of the rights of a stockholder, including without limitation, the right to vote and the right to receive all dividends or other distributions. With respect to the Predecessor employees, the value of the RSGs on the date of issuance is
108
Table of Contents
recognized as employee compensation expense over the vesting period or through the grantee’s eligible retirement date, if shorter, with an increase to additional paid-in-capital. The Company recognized $25, $95 and $462 for the Predecessor Company for the ten months ended November 6, 2013 and for the years ended December 30, 2012 and January 1, 2012, respectively in share-based compensation expense related to RSGs and is recognized in the consolidated statement of operations and comprehensive income (loss). All RSGs vested prior to the Petition Date and, as a result, all amounts relate to the Predecessor only.
As of November 6, 2013, December 30, 2012, and January 1, 2012 there were 0, 25,424, and 84,181 RSGs, respectively, issued and outstanding with a weighted average grant date fair value of $0.00, $6.04, and $3.67, respectively.
RSG activity was as follows:
| Predecessor Company | ||||||||||||||||||||||||
| Ten Months Ended November 6, 2013 |
Year Ended December 30, 2012 |
Year Ended January 1, 2012 |
||||||||||||||||||||||
| Number of RSGs |
Weighted-Average Grant Date Fair Value |
Number of RSGs |
Weighted-Average Grant Date Fair Value |
Number of RSGs |
Weighted-Average Grant Date Fair Value |
|||||||||||||||||||
| Unvested at beginning of year |
25,424 | $ | 6.04 | 84,181 | $ | 3.67 | 299,560 | $ | 8.89 | |||||||||||||||
| Granted |
— | — | — | — | — | — | ||||||||||||||||||
| Vested |
(25,424 | ) | 6.04 | (58,757 | ) | 2.65 | (215,379 | ) | 10.93 | |||||||||||||||
| Forfeited |
— | — | — | — | — | — | ||||||||||||||||||
|
|
|
|
|
|
|
|||||||||||||||||||
| Unvested at end of year |
— | $ | — | 25,424 | $ | 6.04 | 84,181 | $ | 3.67 | |||||||||||||||
|
|
|
|
|
|
|
|||||||||||||||||||
As part of the Plan discussed in Note 2, all Predecessor share-based awards were cancelled. Refer to Note 24 for new stock plans adopted in 2014.
(6) Restructuring
Over the past several years, and in furtherance of the Company’s cost reduction and cash preservation plans outlined in Note 1, the Company has engaged in a series of individual restructuring programs, designed primarily to right size the Company’s employee base, consolidate facilities and improve operations. These initiatives impact all of the Company’s geographic regions and are often influenced by the terms of union contracts within the region. All costs related to these programs, which primarily reflect involuntary severance expense, are accrued at the time of announcement.
Information related to restructuring program activity for the Successor Company for the two months ended December 29, 2013, the Predecessor Company for the ten months ended November 6, 2013 and for the year ended December 30, 2012 is outlined below.
| Severance and Related Costs |
Other Costs(1) |
Total | ||||||||||
| Balance at January 1, 2012, Predecessor Company |
$ | 900 | $ | 426 | $ | 1,326 | ||||||
| Restructuring provision included in Integration and Reorganization (2) |
3,610 | 800 | 4,410 | |||||||||
| Cash payments |
(3,826 | ) | (1,062 | ) | (4,888 | ) | ||||||
|
|
|
|
|
|
|
|||||||
| Balance at December 30, 2012, Predecessor Company |
$ | 684 | $ | 164 | $ | 848 | ||||||
| Restructuring provision included in integration and reorganization |
1,539 | 38 | 1,577 | |||||||||
| Cash payments |
(1,738 | ) | (207 | ) | (1,945 | ) | ||||||
| Balance at November 6, 2013, Predecessor Company |
$ | 485 | $ | (5 | ) | $ | 480 | |||||
| Restructuring provision included in Integration and Reorganization |
1,758 | — | 1,758 | |||||||||
| Cash payments |
(501 | ) | — | (501 | ) | |||||||
|
|
|
|
|
|
|
|||||||
| Balance at December 29, 2013, Successor Company |
$ | 1,742 | $ | (5 | ) | $ | 1,737 | |||||
|
|
|
|
|
|
|
|||||||
109
Table of Contents
| (1) | Other costs primarily included costs to consolidate operations. |
| (2) | Included above are amounts that were initially recognized in integration and reorganization and were subsequently reclassified to discontinued operations expense at the time the operations ceased. |
The restructuring reserve balance as of December 29, 2013, for all programs was $1,737, which is expected to be paid out over the next twelve months.
The following table summarizes the costs incurred and cash paid in connection with these restructuring programs for the Successor Company for the two months ended December 29, 2013, the Predecessor Company for the ten months ended November 6, 2013 and for the year ended December 30, 2012.
| Successor Company | Predecessor Company | |||||||||||||
| Two months ended December 29, 2013 |
Ten months ended November 6, 2013 |
Year Ended December 30, 2012 |
||||||||||||
| Severance and related costs (2) |
$ | 1,758 | $ | 1,539 | $ | 3,610 | ||||||||
| Other costs (1) |
— | 38 | 800 | |||||||||||
| Cash payments |
(501 | ) | (1,945 | ) | (4,888 | ) | ||||||||
| (1) | Other costs primarily included costs to consolidate operations. |
| (2) | Included above are amounts that were initially recognized in integration and reorganization and were subsequently reclassified to discontinued operations expense at the time the operations ceased. |
(7) Property, Plant and Equipment
Property, plant and equipment consisted of the following:
| Successor Company December 29, 2013 |
Predecessor Company December 30, 2012 |
|||||||||
| Land |
$ | 23,087 | $ | 19,384 | ||||||
| Buildings and improvements |
110,941 | 84,028 | ||||||||
| Machinery and equipment |
129,269 | 118,907 | ||||||||
| Furniture, fixtures, and computer software |
11,713 | 20,673 | ||||||||
| Construction in progress and other non-depreciating assets |
716 | 1,726 | ||||||||
|
|
|
|
|
|||||||
| 275,726 | 244,718 | |||||||||
| Less: accumulated depreciation and amortization |
(5,539 | ) | (128,208 | ) | ||||||
|
|
|
|
|
|||||||
| Total |
$ | 270,187 | $ | 116,510 | ||||||
|
|
|
|
|
|||||||
Depreciation expense for the Successor Company for the two months ended December 29, 2013, for the Predecessor Company for the ten months ended November 6, 2013 and for the years ended December 30, 2012 and January 1, 2012 was $5,539, $15,163, $16,305 and $18,550, respectively.
110
Table of Contents
(8) Goodwill and Intangible Assets
Goodwill and intangible assets consisted of the following:
| Successor Company December 29, 2013 | ||||||||||||
| Gross Carrying Amount |
Accumulated Amortization |
Net Carrying Amount |
||||||||||
| Amortized intangible assets: |
||||||||||||
| Advertiser relationships |
$ | 58,520 | $ | 610 | $ | 57,910 | ||||||
| Customer relationships |
5,690 | 59 | 5,631 | |||||||||
| Subscriber relationships |
36,120 | 375 | 35,745 | |||||||||
| Trade name |
270 | 5 | 265 | |||||||||
|
|
|
|
|
|
|
|||||||
| Total |
$ | 100,600 | $ | 1,049 | $ | 99,551 | ||||||
|
|
|
|
|
|
|
|||||||
| Nonamortized intangible assets: |
||||||||||||
| Goodwill |
$ | 125,911 | ||||||||||
| Mastheads |
45,850 | |||||||||||
|
|
|
|||||||||||
| Total |
$ | 171,761 | ||||||||||
|
|
|
|||||||||||
| Predecessor Company December 30, 2012 | ||||||||||||
| Gross Carrying Amount |
Accumulated Amortization |
Net Carrying Amount |
||||||||||
| Amortized intangible assets: |
||||||||||||
| Noncompete agreements |
$ | 4,970 | $ | 4,839 | $ | 131 | ||||||
| Advertiser relationships |
278,543 | 145,878 | 132,665 | |||||||||
| Customer relationships |
8,940 | 3,597 | 5,343 | |||||||||
| Subscriber relationships |
82,280 | 39,226 | 43,054 | |||||||||
| Trade name |
5,493 | 3,204 | 2,289 | |||||||||
| Publication rights |
345 | 134 | 211 | |||||||||
|
|
|
|
|
|
|
|||||||
| Total |
$ | 380,571 | $ | 196,878 | $ | 183,693 | ||||||
|
|
|
|
|
|
|
|||||||
| Nonamortized intangible assets: |
||||||||||||
| Goodwill |
$ | 13,742 | ||||||||||
| Mastheads |
35,288 | |||||||||||
|
|
|
|||||||||||
| Total |
$ | 49,030 | ||||||||||
|
|
|
|||||||||||
As of December 29, 2013, the weighted average amortization periods for amortizable intangible assets are 15.9 years for advertiser relationships, 16.0 years for customer relationships, 16.0 years for subscriber relationships and 10.0 years for trade names. The weighted average amortization period in total for all amortizable intangible assets is 15.9 years.
111
Table of Contents
Amortization expense for the Successor Company for the two months ended December 29, 2013, the Predecessor Company for the ten months ended November 6, 2013 and for the years ended December 30, 2012 and January 1, 2012 was $1,049, $18,246, $23,583 and $23,876, respectively. Estimated future amortization expense as of December 29, 2013, is as follows:
| For the years ending the Sunday closest to December 31: |
||||
| 2014 |
$ | 6,292 | ||
| 2015 |
6,292 | |||
| 2016 |
6,292 | |||
| 2017 |
6,292 | |||
| 2018 |
6,292 | |||
| Thereafter |
68,091 | |||
|
|
|
|||
| Total |
$ | 99,551 | ||
|
|
|
The changes in the carrying amount of goodwill for the years ended December 29, 2013 and December 30, 2012 are as follows:
| Gross balance at January 1, 2012 |
$ | 886,843 | ||
| Accumulated impairment losses |
(872,885 | ) | ||
|
|
|
|||
| Net balance at January 1, 2012, Predecessor Company |
13,958 | |||
| Goodwill impairment from divestitures (1) |
(216 | ) | ||
|
|
|
|||
| Balance at December 30, 2012, Predecessor Company |
13,742 | |||
| Gross balance at December 30, 2012 |
886,843 | |||
| Accumulated impairment losses |
(873,101 | ) | ||
|
|
|
|||
| Net balance at December 30, 2012, Predecessor Company |
13,742 | |||
| Consolidation of Local Media |
462 | |||
| Elimination of Predecessor goodwill |
(14,204 | ) | ||
| Reorganization Plan effects and Fresh Start adjustments |
125,911 | |||
|
|
|
|||
| Balance at November 6, 2013, Successor Company |
125,911 | |||
|
|
|
|||
| Net balance at December 29, 2013, Successor Company |
$ | 125,911 | ||
|
|
|
| (1) | Goodwill impairment was initially recognized in continuing operations and was subsequently reclassified to discontinued operations expense at the time the operations were classified as held for sale. |
As of December 29, 2013 and December 30, 2012, goodwill in the amount $567,086 and $606,013, respectively, was deductible for income tax purposes.
The Company’s annual impairment assessment is made on the last day of its fiscal second quarter.
As part of the annual impairment assessment, as of June 26, 2011, the fair values of the Company’s reporting units for goodwill impairment testing and newspaper mastheads were performed and resulted in no impairment being identified.
Due to an operational management change in the fourth quarter of 2011, certain properties having an allocated goodwill balance of $385 were transferred to a reporting unit that previously did not have a goodwill balance. The Company performed a Step 1 analysis for this reporting unit and determined that its carrying value exceeded fair value. As a result of the Step 2 analysis, the entire $385 of goodwill was impaired. The fair value of this reporting unit for impairment testing purposes was estimated using the expected present value of future cash flows, recent industry transaction multiples and using estimates, judgments and assumptions that
112
Table of Contents
management believed were appropriate in the circumstances. The estimates and judgments used in the assessment included multiples for revenue and EBITDA, the weighted average cost of capital and the terminal growth rate. Given the then current market conditions, the Company determined that recent transactions provided the best estimate of the fair value of this reporting unit. The Company performed further analysis of this reporting unit’s intangible and long-lived assets and determined that impairments of these assets were not present as of January 1, 2012.
During the first quarter of 2012, the Company reorganized its management structure to align with its publication types. The fair value of goodwill was allocated to each of the new reporting units: Small Community Newspapers, Large Daily Newspapers and Metro Newspapers. The Company determined that impairment indicators were present for the Metro Newspaper reporting unit, which had a goodwill balance of $216. As of April 1, 2012 the Company performed a Step 1 analysis for this reporting unit and determined that its carrying value exceeded fair value. As a result of the Step 2 analysis, the entire $216 of goodwill was impaired and this amount was subsequently reclassified to discontinued operations, see Note 22. The fair value of this reporting unit for impairment testing purposes was estimated using the expected present value of future cash flows, recent industry transaction multiples and using estimates, judgments and assumptions that management believed were appropriate in the circumstances. The estimates and judgments used in the assessment included multiples for revenue and EBITDA, the weighted average cost of capital and the terminal growth rate. Given the then current market conditions, the Company determined that recent transactions provided the best estimate of the fair value of this reporting unit. The Company performed further analysis of this reporting unit’s intangible and long-lived assets and determined that impairments of these assets were not present.
As part of the annual impairment assessments, as of June 30, 2013 and July 1, 2012, the fair values of the Company’s reporting units for goodwill impairment testing and newspaper mastheads were estimated using the expected present value of future cash flows, recent industry transaction multiples and using estimates, judgments and assumptions that management believed were appropriate in the circumstances. The estimates and judgments used in the assessment included multiples for revenue and EBITDA, the weighted average cost of capital and the terminal growth rate. Given the then current market conditions, the Company determined that recent transactions provided the best estimate of the fair value of its reporting units. As a result of the annual assessments performed no impairment of goodwill was identified. Additionally, the estimated fair value exceeded carrying value for all mastheads. The total Company’s estimate of fair value was reconciled to its then market capitalization (based upon the stock market price and fair value of debt) plus an estimated control premium.
The bankruptcy filing was considered a triggering event for the non amortizable intangibles and the Company performed a valuation analysis to determine if an impairment existed as of September 29, 2013. The fair values of the Company’s reporting units for goodwill and newspaper mastheads were estimated using the expected present value of future cash flows, recent industry transaction multiples and using estimates, judgments and assumptions that management believed were appropriate in the circumstances and were consistent with the terms of the Plan. The estimates and judgments used in the assessment included multiples for revenue and EBITDA, the weighted average cost of capital and the terminal growth rate. Given the current bankruptcy Plan, the Company determined that discounted cash flows provided the best estimate of the fair value of its reporting units. The estimated fair values of the Large Daily and the Small Community reporting units exceeded their carrying value and Step 2 of the analysis was not necessary. The estimated fair value of each reporting unit’s mastheads exceeded their carrying values, using consistent assumptions as discussed above. The masthead fair value was estimated using the relief from royalty valuation method.
The Company considered the impairment analysis for goodwill and mastheads, triggered by the bankruptcy filing, to be an indicator of impairment under ASC 360, and performed an analysis of its undiscounted cash flows for amortizable intangibles. For any groups where the carrying value exceeded the undiscounted cash flows a discounted cash flow analysis was performed to determine the amount of the impairment. Key assumptions within this analysis included earnings projections, discount rates, attrition rates, long term growth rates, and effective tax rate that the Company considers appropriate. Earnings projections reflected continued declines in print advertising revenue of 5.0% to 9.0% per year, which is expected to moderate in later years, growth in
113
Table of Contents
circulation revenue of up to 2.0% per year, and expense declines of up to 4.0% per year. Discount rates ranged from 14.5% to 17.0%, attrition rates ranged from 5.0% to 7.5%, the long term growth rate was 0% and the effective tax rate was 39.15%. The resulting cash flows were reconciled to the projections supporting the Plan.
Due to reductions in the Company’s operating projections during the third quarter in conjunction with the bankruptcy process, an impairment charge of $68,573 was recognized for advertiser relationships within the Company’s Metro and Small Community reporting units, an impairment charge of $19,149 was recognized for subscriber relationships within the Company’s Metro and Small Community reporting units, an impairment charge of $2,077 was recognized for customer relationships within the Company’s Metro reporting unit and an impairment charge of $1,800 was recognized for trade names and publication rights within the Directories business unit. These impairment charges were recorded in the caption “impairment of long-lived assets” on the consolidated statement of operations and comprehensive income (loss). Refer to Note 19 for additional information on the impairment charge. The increase in the fair value of the intangible assets pursuant to fresh start accounting primarily relates to the Company’s Large Dailies reporting unit based on the valuation methodologies, operational outlook, growth rates, discount rates and attrition rates as described above.
As of December 29, 2013, a review of impairment indicators was performed with the Company noting that its financial results and forecast had not changed materially since the fresh start accounting on November 6, 2013 and it was determined that no indicators of impairment were present.
The newspaper industry and the Company have experienced declining same store revenue and profitability over the past several years. Should general economic, market or business conditions decline, and have a negative impact on estimates of future cash flow and market transaction multiples, the Company may be required to record additional impairment charges in the future.
(9) Accrued Expenses
Accrued expenses consisted of the following:
| Successor Company December 29, 2013 |
Predecessor Company December 30, 2012 |
|||||||||
| Accrued payroll |
$ | 5,235 | $ | 4,305 | ||||||
| Accrued bonus |
4,011 | 2,219 | ||||||||
| Accrued vacation |
1,355 | 959 | ||||||||
| Accrued insurance |
6,646 | 6,903 | ||||||||
| Accrued legal and professional fees |
16,058 | 141 | ||||||||
| Accrued other (1) |
21,685 | 11,731 | ||||||||
|
|
|
|
|
|||||||
| $ | 54,990 | $ | 26,258 | |||||||
|
|
|
|
|
|||||||
| (1) | December 29, 2013 includes $4,626 accrual for Local Media to fund a pension liability that was retained by the seller. The cash was received prior to December 29, 2013 while payment was not made by Local Media until fiscal 2014. |
114
Table of Contents
(10) Lease Commitments
The future minimum lease payments related to the Company’s non-cancelable operating lease commitments as of December 29, 2013 are as follows:
| For the years ending the Sunday closest to December 31: |
||||
| 2014 |
$ | 4,320 | ||
| 2015 |
3,594 | |||
| 2016 |
3,277 | |||
| 2017 |
3,205 | |||
| 2018 |
2,299 | |||
| Thereafter |
1,895 | |||
|
|
|
|||
| Total minimum lease payments |
$ | 18,590 | ||
|
|
|
Rental expense under operating leases for the Successor Company for the two months ended December 29, 2013, the Predecessor Company for the ten months ended November 6, 2013 and for the years ended December 30, 2012 and January 1, 2012 was $1,121, $4,685, $5,009 and $5,382, respectively.
In addition to minimum lease payments, certain leases require payment of the excess of various percentages of gross revenue or net operating income over the minimum rental payments. The leases generally require the payment of taxes assessed against the leased property and the cost of insurance and maintenance. The majority of lease terms range from 1 to 10 years, and typically, the leases contain renewal options. Certain leases include minimum scheduled increases in rental payments at various times during the term of the lease. These scheduled rent increases are recognized on a straight-line basis over the term of the lease, resulting in an accrual, which is included in accrued expenses, for the amount by which the cumulative straight-line rent exceeds the contractual cash rent.
(11) Indebtedness
Successor Company
GateHouse Credit Facilities
The Revolving Credit, Term Loan and Security Agreement (the “First Lien Credit Facility”) dated November 26, 2013 by and among GateHouse, GateHouse Media Intermediate Holdco, LLC formerly known as GateHouse Media Intermediate Holdco, Inc. (“GMIH”), certain wholly-owned subsidiaries of GMIH, all of which are wholly owned subsidiaries of New Media (collectively with GMIH and GateHouse, the “Loan Parties”), PNC Bank, National Association, as the administrative agent, Crystal Financial LLC, as term loan B agent, and each of the lenders party thereto provides for (i) a term loan A in the aggregate principal amount of $25,000, a term loan B in the aggregate principal amount of $50,000, and a revolving credit facility in an aggregate principal amount of up to $40,000 (of which $25,000 was funded on the Effective Date). Borrowings under the First Lien Credit Facility bear interest at a rate per annum equal to (i) with respect to the revolving credit facility, the applicable Revolving Interest Rate (as defined the First Lien Credit Agreement), (ii) with respect to the term loan A, the Term Loan A Rate (as defined in the First Lien Credit Agreement), and (iii) with respect to the term loan B, the Term Loan B Rate (as defined in the First Lien Credit Agreement). Amounts outstanding under the term loans and revolving credit facility will be fully due and payable on November 26, 2018.
The Term Loan and Security Agreement (the “Second Lien Credit Facility” and together with the First Lien Credit Facility, the “GateHouse Credit Facilities”) dated November 26, 2013 by and among the Loan Parties, Mutual Quest Fund and each of the lenders party thereto provides for a term loan in an aggregate principal amount of $50,000. Borrowings under the Second Lien Credit Facility bear interest, at the Loan Parties’ option, equal to (i) the LIBOR Rate (as defined in the Second Lien Credit Facility) plus 11.00% or (ii) the Alternate Base Rate (as defined in the Second Lien Credit Facility) plus 10.00%. The outstanding principal will be fully due and
115
Table of Contents
payable on the maturity date of November 26, 2019. The GateHouse Credit Facilities are secured by a first and second priority security interest in substantially all assets of Loan Parties. In addition, the loans and other obligations of the Loan Parties under the GateHouse Credit Facilities are guaranteed by GateHouse Media, LLC. Under the revolving credit facility, the borrowers will also pay a quarterly commitment fee of 0.50% per annum on the unused portion of the revolving credit facility.
No principal payments are due on the revolving credit facility until the maturity date. Principal amounts outstanding under Term Loan A and Term Loan B of the First Lien Credit Facility will be payable in quarterly installments as follows: (I) four consecutive quarterly installments each in the amount of $875, commencing on January 1, 2014, (II) four consecutive quarterly installments each in the amount of $1,250, commencing on January 1, 2015, and (III) twelve consecutive quarterly installments each in the amount $2,000, commencing on January 1, 2016, followed by a final payment of all unpaid principal, accrued and unpaid interest and all unpaid fees and expenses which will be fully due and payable on November 26, 2018. The principal payments will be applied against Term Loan A until fully paid, and then to Term Loan B. The outstanding principal of the Second Lien Credit Facility will be fully due and payable on the maturity date of November 26, 2019. Only interest payments are due under the Second Lien Credit Facility until maturity. The Loan Parties are required to prepay borrowings under the GateHouse Credit Facilities in an amount equal to: (i) 100% of Excess Cash Flow (as defined in the GateHouse Credit Facilities) earned during any fiscal year quarter if the Leverage Ratio (as defined in the GateHouse Credit Facilities) as of the end of such fiscal quarter was greater than or equal to 2.75 to 1.0; (ii) 50% of Excess Cash Flow earned during any fiscal quarter if the Leverage Ratio of the Loan Parties as of the end of such fiscal quarter was less than 2.75 to 1.0 and greater than or equal to 2.5 to 1.0; and (iii) 0% of Excess Cash Flow earned during any fiscal quarter if the Leverage Ratio of the Loan Parties as of the end of such fiscal quarter was not more than 2.5 to 1.0. In addition, in the event of certain asset sales, borrowings or casualty events, the GateHouse Credit Facilities require the Loan Parties to prepay borrowings with the proceeds.
The GateHouse Credit Facilities impose upon GateHouse certain financial and operating covenants, including, among others, requirements that GateHouse satisfy certain financial tests, including a minimum fixed charge coverage ratio of not less than 1.0 to 1.0, a maximum leverage ratio of not greater than 3.25 to 1.0, a minimum EBITDA and a limitation on capital expenditures, and restrictions on GateHouse’s ability to incur additional debt, incur liens and encumbrances, consolidate, amalgamate or merge with any other person, pay dividends, dispose of assets, make certain restricted payments, engage in transactions with affiliates, materially alter the business it conducts and taking certain other corporate actions. As of December 29, 2013, GateHouse was in compliance with all applicable covenants and could draw on the revolving credit facility under the First Lien Credit Facility if it chose to do so.
Pursuant to the Plan, holders of the Outstanding Debt who elected to receive New Media Common Stock received their pro rata share of the Proceeds of the GateHouse Credit Facilities, net of certain transaction expenses (the “Net Proceeds”). The Net Proceeds distributed to holders of the Outstanding Debt totaled $149,000. The proceeds of additional drawings of the revolving credit facility under the First Lien Credit Facility after the Effective Date will be applied towards ongoing working capital needs, general corporate purposes, capital expenditures and potential acquisitions. As of December 29, 2013 the revolving credit facility had a weighted average interest rate of 3.42%.
New Media distributed to each holder of New Media Common Stock, including Newcastle on account of the Cash-Out Offer, its pro rata share of the $149,000 in Net Proceeds of the GateHouse Credit Facilities net of certain transaction costs. GateHouse’s entry into the GateHouse Credit Facilities was not a condition to the effectiveness of the Plan.
As of December 29, 2013, GateHouse is in compliance with all of the covenants and obligations under the GateHouse Credit Facilities.
116
Table of Contents
Local Media Credit Facility
Certain of Local Media’s subsidiaries (together, the “Borrowers”) and Local Media entered into a Credit Agreement, dated as of September 3, 2013, with a syndicate of financial institutions with Credit Suisse AG, Cayman Islands Branch, as administrative agent (the “Local Media Credit Facility”).
The Local Media Credit Facility provided for: (a) a $33,000 term loan facility that matures on September 4, 2018; and (b) a $10,000 revolving credit facility (subject to the activation condition that Credit Suisse Loan Funding LLC, as lead arranger, assigns the revolving loan commitment to an unaffiliated lender), with a $3,000 sub-facility for letters of credit and a $4,000 sub-facility for swing loans, that matures on September 4, 2018. The revolving credit facility was activated on October 25, 2013. The Borrowers used the proceeds of the Local Media Credit Facility to (a) fund a portion of the acquisition of Dow Jones Local Media Group, Inc., a Delaware corporation (the “Local Media Acquisition”), (b) provide for working capital and other general corporate purposes of the Borrowers and (c) fund certain fees, costs and expenses associated with the transactions contemplated by the Local Media Credit Facility and consummation of the Local Media Acquisition. The Local Media Credit Facility is secured by a first priority security interest in substantially all assets of the Borrowers and Local Media. In addition, the loans and other obligations of the Borrowers under the Local Media Credit Facility are guaranteed by Local Media Group Holdings LLC.
Borrowings under the Local Media Credit Facility bear interest, at the borrower’s option, equal to the LIBOR Rate (as defined in the Local Media Credit Facility) plus 6.5% per annum for a LIBOR Rate Loan (as defined in the Local Media Credit Facility), or the Base Rate (as defined in the Local Media Credit Facility) plus 5.5% per annum for a Base Rate Loan (as defined in the Local Media Credit Facility). Under the revolving credit facility, the Borrowers will also pay a monthly commitment fee of 0.75% per annum on the unused portion of the revolving credit facility and a fee of 6.0% on the aggregate amount of outstanding letters of credit. As of December 29, 2013, the revolving credit facility had a weighted average interest rate of 7.5%.
No principal payments are due on the revolving credit facility until the maturity date. Principal payments are due on the term loan facility as follows: (a) $203 at the end of each fiscal quarter beginning with the fiscal quarter ending December 31, 2013 through the fiscal quarter ending September 30, 2015; and (b) $406 beginning with the fiscal quarter ending December 31, 2015 and at the end of each fiscal quarter thereafter with the remaining balance of principal becoming fully due and payable on the maturity date. The Borrowers are required to prepay borrowings under the Local Media Credit Facility in an amount equal to: (i) 100% of expected Excess Cash Flow (as defined in the Local Media Credit Facility) with respect to a fiscal quarter if the Leverage Ratio (as defined in the Local Media Credit Facility) of Local Media and the Borrowers as of the end of such fiscal quarter was greater than or equal to 2.0 to 1.0; (ii) 50% of expected Excess Cash Flow with respect to a fiscal quarter if the Leverage Ratio of Local Media and the Borrowers as of the end of such fiscal quarter was less than 2.0 to 1.0 and greater than or equal to 1.75 to 1.0; and (iii) 0% of expected Excess Cash Flow with respect to a fiscal quarter if the Leverage Ratio of Local Media and the Borrowers as of the end of such fiscal quarter was less than 1.75 to 1.0, in each case subject to an annual audit adjustment. In addition, the Borrowers are required to prepay borrowings under the Local Media Credit Facility with (A) net cash proceeds of certain asset dispositions, (B) 100% of Extraordinary Receipts (as defined in the Local Media Credit Facility), (C) 100% of net cash proceeds of funded indebtedness (other than indebtedness permitted by the Local Media Credit Facility), and (D) 100% of all Specified Equity Contributions (as defined in the Local Media Credit Facility) to Local Media.
The Local Media Credit Facility contains financial covenants that require Local Media and the Borrowers to maintain (a) a Leverage Ratio of not more than 2.5 to 1.0 and a Fixed Charge Coverage Ratio (as defined in the Local Media Credit Facility) of at least 2.0 to 1.0, each measured at the end of each fiscal quarter for the four-quarter period then ended. The Local Media Credit Facility contains affirmative and negative covenants applicable to Local Media and the Borrowers customarily found in loan agreements for similar transactions, including, but not limited to, restrictions on their ability to incur indebtedness, create liens on assets, engage in certain lines of business, engage in mergers or consolidations, dispose of assets, make investments or
117
Table of Contents
acquisitions, engage in transactions with affiliates, pay dividends or make other restricted payments. The Local Media Credit Facility contains customary events of default, including, but not limited to, defaults based on a failure to pay principal, interest, fees or other obligations, subject to specified grace periods (other than with respect to principal); any material inaccuracy of representation or warranty; breach of covenants; default in other material indebtedness; a Change of Control (as defined in the Local Media Credit Facility); bankruptcy and insolvency events; material judgments; certain ERISA events; and impairment of collateral. As of December 29, 2013, Local Media is in compliance with all of the covenants and obligations under the Local Media Credit Facility. The Local Media Credit Facility was amended on October 17, 2013 and February 28, 2014. The October 17, 2013 amendment corrected a typographical mistake. The February 28, 2014 amendment provided that among other things, sales of real property collateral and reinvestment of the proceeds from such sale could only be made with the consent of the Administrative Agent, modified the properties included in the real property collateral, and set forth in detail the documentary post-closing requirements with respect to the real property collateral.
Fair Value
The fair value of long-term debt under the GateHouse Credit Facilities was estimated at $150,000 as of December 29, 2013, based on discounted future contractual cash flows and a market interest rate adjusted for necessary risks, including the Company’s own credit risk as there are no rates currently observable in publically traded debt markets of risk with similar terms and average maturities. Accordingly, the Company’s long-term debt under the GateHouse Credit Facilities is classified within Level 3 of the fair value hierarchy.
The fair value of long-term debt under the Local Media Credit Facility was estimated at $33,000 as of December 29, 2013, based on discounted future contractual cash flows and a market interest rate adjusted for necessary risks, including the Company’s own credit risk as there are no rates currently observable in publically traded debt markets of risk with similar terms and average maturities. Accordingly, the Company’s long-term debt under the Local Media Credit Facility is classified within Level 3 of the fair value hierarchy.
Payment Schedule
As of December 29, 2013, scheduled principal payments of outstanding debt are as follows:
| 2014 |
4,312 | |||
| 2015 |
5,813 | |||
| 2016 |
9,625 | |||
| 2017 |
10,031 | |||
| 2018 |
103,219 | |||
| 2019 |
50,000 | |||
|
|
|
|||
| $ | 183,000 | |||
| Less: Short-term debt |
4,312 | |||
| Less: Remaining original issue discount |
985 | |||
|
|
|
|||
| Long-term debt |
$ | 177,703 | ||
|
|
|
Predecessor Company
As part of the Restructuring, our Predecessor’s previous long term debt was extinguished pursuant to the Support Agreement on the Effective Date of the Plan.
2007 Credit Facility
GateHouse Media Operating, Inc. (“Operating”), an indirect wholly-owned subsidiary of the Company, GateHouse Media Holdco, Inc. (“Holdco”), an indirect wholly-owned subsidiary of the Company, and certain of
118
Table of Contents
their subsidiaries (together, the “Borrowers”) entered into an Amended and Restated Credit Agreement, dated as of February 27, 2007, with a syndicate of financial institutions with Wells Fargo Bank, N.A., successor-by-merger to Wachovia Bank, National Association (“Wells Fargo Bank”), as administrative agent (the “2007 Credit Facility”).
The 2007 Credit Facility, prior to execution of the Second Amendment (defined below), provided for: (a) a $670,000 term loan facility which would have matured on August 28, 2014; (b) a delayed draw term loan facility of up to $250,000 which would have matured on August 28, 2014, and (c) a revolving credit facility with a $40,000 aggregate loan commitment amount available, including a $15,000 sub-facility for letters of credit and a $10,000 swingline facility, which would have matured on February 28, 2014. The Borrowers used the proceeds of the 2007 Credit Facility to refinance existing indebtedness and for working capital and other general corporate purposes, including, without limitation, financing acquisitions permitted under the 2007 Credit Facility. The 2007 Credit Facility was secured by a first priority security interest in: (a) all present and future capital stock or other membership, equity, ownership or profits interest of Operating and all of its direct and indirect domestic restricted subsidiaries; (b) 65% of the voting stock (and 100% of the nonvoting stock) of all present and future first-tier foreign subsidiaries; and (c) substantially all of the tangible and intangible assets of Holdco, Operating and their present and future direct and indirect domestic restricted subsidiaries. In addition, the loans and other obligations of the Borrowers under the 2007 Credit Facility were guaranteed, subject to specified limitations, by Holdco, Operating and their present and future direct and indirect domestic restricted subsidiaries.
Borrowings under the 2007 Credit Facility bear interest, at the borrower’s option, equal to the LIBOR Rate for a LIBOR Rate Loan (as defined in the 2007 Credit Facility), or the Alternate Base Rate for an Alternate Base Rate Loan (as defined in the 2007 Credit Facility), plus an applicable margin. The applicable margin for the LIBOR Rate term loans and Alternate Base Rate term loans, as amended by the First Amendment (defined below), were 2.00% and 1.00%, respectively. The applicable margin for revolving loans was adjusted quarterly based upon Holdco’s Total Leverage (defined as the ratio of Holdco’s Consolidated Indebtedness (as defined in the 2007 Credit Facility) on the last day of the preceding quarter to Consolidated EBITDA (as defined in the 2007 Credit Facility) for the four fiscal quarters ending on the date of determination). The applicable margin ranges from 1.50% to 2.00%, in the case of LIBOR Rate Loans and, 0.50% to 1.00% in the case of Alternate Base Rate Loans. Under the revolving credit facility, GateHouse Media was also required to pay a quarterly commitment fee on the unused portion of the revolving credit facility ranging from 0.25% to 0.50% based on the same ratio of Consolidated Indebtedness to Consolidated EBITDA and a quarterly fee equal to the applicable margin for LIBOR Rate Loans on the aggregate amount of outstanding letters of credit. In addition, GateHouse Media was required to pay a ticking fee at the rate of 0.50% of the aggregate unfunded amount available to be borrowed under the delayed draw term facility.
No principal payments were due on the term loan facilities or the revolving credit facility until the applicable maturity date. The Borrowers were required to prepay borrowings under the term loan facilities in an amount equal to 50.0% of Holdco’s Excess Cash Flow (as defined in the 2007 Credit Facility) earned during the previous fiscal year, except that no prepayments were required if the Total Leverage Ratio (as defined in the 2007 Credit Facility) was less than or equal to 6.0 to 1.0 at the end of such fiscal year. In addition, the Borrowers were required to prepay borrowings under the term loan facilities with asset disposition proceeds in excess of specified amounts to the extent necessary to cause Holdco’s Total Leverage Ratio to be less than or equal to 6.25 to 1.00, and with cash insurance proceeds and condemnation or expropriation awards, in excess of specified amounts, subject, in each case, to reinvestment rights. The Borrowers were required to prepay borrowings under the term loan facilities with the net proceeds of equity issuances by GateHouse Media in an amount equal to the lesser of (a) the amount by which 50.0% of the net cash proceeds exceeds the amount (if any) required to repay any credit facilities of GateHouse Media or (b) the amount of proceeds required to reduce Holdco’s Total Leverage Ratio to 6.0 to 1.0. The Borrowers were also required to prepay borrowings under the term loan facilities with 100% of the proceeds of debt issuances (with specified exceptions), except that no prepayment was required if Holdco’s Total Leverage Ratio was less than 6.0 to 1.0. If the term loan facilities have been paid in full, mandatory prepayments were applied to the repayment of borrowings under the swingline facility and revolving credit facilities and the cash collateralization of letters of credit.
119
Table of Contents
The 2007 Credit Facility contained a financial covenant that required Holdco to maintain a Total Leverage Ratio of less than or equal to 6.5 to 1.0 at any time an extension of credit was outstanding under the revolving credit facility. The 2007 Credit Facility contained affirmative and negative covenants applicable to Holdco, Operating and their restricted subsidiaries customarily found in loan agreements for similar transactions, including restrictions on their ability to incur indebtedness (which GateHouse Media was generally permitted to incur so long as it satisfied an incurrence test that required it to maintain a pro forma Total Leverage Ratio of less than 6.5 to 1.0), create liens on assets, engage in certain lines of business, engage in mergers or consolidations, dispose of assets, make investments or acquisitions, engage in transactions with affiliates, enter into sale leaseback transactions, enter into negative pledges or pay dividends or make other restricted payments, except that Holdco was permitted to (a) make restricted payments (including quarterly dividends) so long as, after giving effect to any such restricted payment, Holdco and its subsidiaries have a Fixed Charge Coverage Ratio (as defined in the 2007 Credit Facility) equal to or greater than 1.0 to 1.0 and would be able to incur an additional $1.00 of debt under the incurrence test referred to above and (b) make restricted payments of proceeds of asset dispositions to GateHouse Media to the extent such proceeds were not required to prepay loans under the 2007 Credit Facility and/or cash collateralize letter of credit obligations and such proceeds were used to prepay borrowings under acquisition credit facilities of GateHouse Media. The 2007 Credit Facility also permitted the borrowers, in certain limited circumstances, to designate subsidiaries as “unrestricted subsidiaries” which were not subject to the covenant restrictions in the 2007 Credit Facility. The 2007 Credit Facility contained customary events of default, including defaults based on a failure to pay principal, reimbursement obligations, interest, fees or other obligations, subject to specified grace periods; any material inaccuracy of a representation or warranty; breach of covenant; failure to pay other indebtedness and cross-accelerations; a Change of Control (as defined in the 2007 Credit Facility); events of bankruptcy and insolvency; material judgments; failure to meet certain requirements with respect to ERISA; and impairment of collateral.
First Amendment to 2007 Credit Facility
On May 7, 2007, the Borrowers entered into the First Amendment to the 2007 Credit Facility (“the First Amendment”). The First Amendment provided an incremental term loan facility under the 2007 Credit Facility in the amount of $275,000. As amended by the First Amendment, the 2007 Credit Facility included $1,195,000 of term loan facilities and $40,000 of a revolving credit facility. The incremental term loan facility amortized at the same rate and matured on the same date as the existing term loan facilities under the 2007 Credit Facility. Interest on the incremental term loan facility accrued at a rate per annum equal to, at the option of the borrower, (a) adjusted LIBOR plus a margin equal to (i) 2.00%, if the corporate family ratings and corporate credit ratings of Operating by Moody’s Investors Service Inc. and Standard & Poor’s Rating Services, were at least B1, and B+, respectively, in each case with stable outlook or (ii) 2.25%, otherwise or (b) the greater of the prime rate set by Wells Fargo Bank, or the federal funds effective rate plus 0.50%, plus a margin 1.00% lower than that applicable to adjusted LIBOR-based loans. Any voluntary or mandatory repayment of the First Amendment term loans made with the proceeds of a new term loan entered into for the primary purpose of benefiting from a margin that is less than the margin applicable as a result of the First Amendment was subject to a 1.00% prepayment premium. The First Amendment term loans were subject to a “most favored nation” interest provision that granted the First Amendment term loans an interest rate margin that was 0.25% less than the highest margin of any future term loan borrowings under the 2007 Credit Facility.
As previously noted, the First Amendment also modified the interest rates applicable to the term loans under the 2007 Credit Facility. Term loans thereunder accrued interest at a rate per annum equal to, at the option of the Borrower, (a) adjusted LIBOR plus a margin equal to 2.00% or (b) the greater of the prime rate set by Wells Fargo Bank, or the federal funds effective rate plus 0.50%, plus a margin equal to 1.00%. The terms of the previously outstanding borrowings were also modified to include a 1.00% prepayment premium corresponding to the prepayment premium applicable to the First Amendment term loans and a corresponding “most favored nation” interest provision.
120
Table of Contents
Second Amendment to 2007 Credit Facility
On February 3, 2009, the Company entered into the Second Amendment to the 2007 Credit Facility (the “Second Amendment”).
Among other things, the Second Amendment reduced the aggregate principal amounts available under the 2007 Credit Facility, as follows: (a) for revolving loans, from $40,000 to $20,000; (b) for the letter of credit subfacility, from $15,000 to $5,000; and (c) for the swingline loan subfacility, from $10,000 to $5,000.
In addition, the Second Amendment provided that Holdco may not incur additional term debt under the 2007 Credit Facility unless the Senior Secured Incurrence Test (as defined in the Second Amendment) was less than 4.00 to 1.00 and the current Incurrence Test (as defined in the Second Amendment) was satisfied.
Agency Amendment to 2007 Credit Facility
On April 1, 2011, the Borrowers entered into an Agency Succession and Amendment Agreement, dated as of March 30, 2011, to the 2007 Credit Facility (the “Agency Amendment”).
Pursuant to the Agency Amendment, among other things, (a) Wells Fargo Bank resigned as administrative agent and (b) Gleacher Products Corp. was appointed as administrative agent. In addition, the Agency Amendment effected certain amendments to the 2007 Credit Facility that provided that (x) the administrative agent need not be a lender under the 2007 Credit Facility and (y) the lenders holding a majority of the outstanding term loans and loan commitments under the 2007 Credit Facility have (i) the right, in their discretion, to remove the administrative agent and (ii) the right to make certain decisions and exercise certain powers under the 2007 Credit Facility that had previously been within the discretion of the administrative agent.
Fourth Amendment to 2007 Credit Facility
On September 4, 2013, the Company entered into the Fourth Amendment to the Credit Facility (the “Fourth Amendment”). Pursuant to the terms of the Fourth Amendment, the Company obtained the following improvement in terms: a clarified and expanded definition of “Eligible Assignee”; an increase in the base amount in the formula used to calculate the “Permitted Investments” basket from $35,000 to a base of $50,000; the removal of the requirement that the Company’s annual financial statements not have a “going concern” or like qualification to the audit; the removal of a cross default from any Secured Hedging Agreement to the 2007 Credit Facility; the removal of a Bankruptcy Default, as defined therein, arising from actions in furtherance of or indicating consent to the specified actions; and a waiver of any prior Default or Event of Default, as defined therein.
In consideration of the changes described above, the Company agreed to pay each of the lenders party to the Fourth Amendment that timely executed and delivered its signature to the Fourth Amendment and the RSA, an amendment fee equal to 3.5% multiplied by the aggregate outstanding amount of the Loans held (including through trades pending settlement) by such lender, unless waived in writing. Newcastle and certain other lenders elected to waive their amendment fee pursuant to the Fourth Amendment. Newcastle indemnified other Lenders with respect to their entry into the Fourth Amendment, subject to the limitations set forth in the Fourth Amendment for a total amendment fee paid of approximately $6,790.
2007 Credit Facility Excess Cash Flow Payment and Outstanding Balance
As required by the 2007 Credit Facility, as amended, on March 26, 2013 and March 15, 2012, the Company made principal payments of $6,648 and $4,600, respectively, which represented 50% of the Excess Cash Flow related to the fiscal years ended December 30, 2012 and January 1, 2012, respectively. As of December 29, 2013, a total of $0 was outstanding under the 2007 Credit Facility.
121
Table of Contents
Bankruptcy or Receivership
On September 27, 2013, the Debtors commenced voluntary Chapter 11 proceedings under the Bankruptcy Code in the Bankruptcy Court. Concurrently with the commencement of the Chapter 11 Cases, the Debtors filed and requested confirmation of the Plan.
The Debtors solicited votes of holders of claims under the 2007 Credit Facility and certain interest rate swaps secured thereunder (collectively, the “Outstanding Debt”), including certain affiliates of the Debtors. The Plan was accepted by the only impaired class of creditors entitled to vote on the Plan. Specifically, 100% of holders of the Outstanding Debt voted to accept the Plan.
Pension, trade and all other unsecured claims of the Company were not impaired under the Plan and their votes were not solicited. The Company’s common stock was canceled under the Plan.
Pursuant to a support agreement executed by the administrative agent and lenders constituting the “Required Lenders” under the 2007 Credit Facility, the parties thereto agreed that the commencement of the Chapter 11 Cases in furtherance of the Debtors’ obligations under the support agreement shall not be deemed to constitute a default under the 2007 Credit Facility. Absent such agreement, the commencement of the Chapter 11 Cases would have constituted an event of default under the 2007 Credit Facility. On November 6, 2013, the Bankruptcy Court held a hearing and entered the Confirmation Order confirming the Plan. On November 26, 2013, the Debtors successfully emerged from bankruptcy.
(12) Derivative Instruments
The Company used certain derivative financial instruments to hedge the aggregate risk of interest rate fluctuations with respect to its borrowings under the 2007 Credit Facility, which required payments based on a variable interest rate index. These risks included: increases in debt rates above the earnings of the encumbered assets, increases in debt rates resulting in the failure of certain debt ratio covenants, increases in debt rates such that assets can no longer be refinanced, and earnings volatility.
In order to reduce such risks, the Company primarily used interest rate swap agreements to change floating-rate long-term debt to fixed-rate long-term debt. This type of hedge was intended to qualify as a “cash-flow hedge” under ASC 815. For these instruments, the effective portion of the change in the fair value of the derivative was recorded in accumulated other comprehensive loss in the consolidated statement of stockholders’ equity (deficit) and recognized in the consolidated statement of operations and comprehensive income (loss) in the same period in which the hedged transaction impacts earnings. The ineffective portion of the change in the fair value of the derivative was immediately recognized in earnings.
The restructuring process resulted in the dedesignation of the hedging relationship as it was not probable that the forecasted transaction would occur according to the original strategy, any related amounts previously recorded in accumulated other comprehensive income (loss), net were recognized into earnings of the Predecessor Company as of the Petition Date. The derivative liability balances were classified as liabilities subject to compromise at the allowed claim amount. The remaining amount of other comprehensive income totaling $26,313 was recognized through earnings for the Predecessor Company for the ten months ended November 6, 2013.
122
Table of Contents
Fair Values of Derivative Instruments
| Liability Derivatives | ||||||||||||||||||
| Successor
Company December 29, 2013 |
Predecessor
Company December 30, 2012 |
|||||||||||||||||
| Balance
Sheet Location |
Fair Value | Balance
Sheet Location |
FairValue | |||||||||||||||
| Derivative designed as hedging instruments under ASC 815 |
||||||||||||||||||
| Interest rate swaps |
Derivative instruments | $ | — | Derivative instruments | $ | 45,724 | ||||||||||||
|
|
|
|
|
|||||||||||||||
| Total derivatives |
$ | — | $ | 45,724 | ||||||||||||||
|
|
|
|
|
|||||||||||||||
Predecessor Company
The Effect of Derivative Instruments on the Statement of Operations and Comprehensive Income (Loss)
for the Ten Months Ended November 6, 2013, and Years Ended December 30, 2012 and January 1, 2012
| Derivatives in ASC 815 Relationships |
Location of Gain or (Loss) |
Amount of Gain or (Loss) Recognized in Income on Derivative |
||||||||||||
| 2013 |
2012 |
2011 |
||||||||||||
| Interest rate swaps |
(Loss) gain on derivative instruments | $ | (14 | ) | $ | 1,635 | $ | 913 | ||||||
| Derivatives in ASC 815 Fair Value Hedging |
Amount of Gain or (Loss) on Derivative (Effective Portion) |
Location of Gain or (Loss) Reclassified from Accumulated OCI into Income (Effective Portion) |
Amount of Gain or (Loss) OCI into Income (Effective Portion) |
Location of Gain or (Loss) Recognized in Income on Derivative (Ineffective Portion and Amount Excluded from Effectiveness Testing) |
Amount of Gain or (Loss) Recognized in Income on Derivative (Ineffective Portion) (1) |
|||||||||||||||||||||||||||||||||||
| 2013 | 2012 | 2011 | 2013 | 2012 | 2011 | 2013 | 2012 | 2011 | ||||||||||||||||||||||||||||||||
| Interest rate swaps |
$ | 19,339 | $ | 5,832 | $ | 13,829 | Interest (income)/ expense |
$ | 46,760 | $ | 28,771 | $ | 29,560 | Gain (loss) on derivative instruments |
$ | (14) | $ | 20 | $ | 85 | ||||||||||||||||||||
| Reorganization items, net |
$ | (2,041) | $ | — | $ | — | ||||||||||||||||||||||||||||||||||
| (1) | During the quarter ended September 29, 2013, the Predecessor recognized $2,041 in reorganization items, net to adjust the fair value of derivatives to the allowed claim. |
On June 23, 2005, the Predecessor entered into and designated an interest rate swap based on a notional amount of $300,000, which matured in June 2012, as a cash flow hedge. Under the swap agreement, the Predecessor received interest equivalent to one month LIBOR and paid a fixed rate of 4.135%, with settlements that occurred monthly. On February 20, 2006, the Predecessor redesignated the same interest rate swap as a cash flow hedge for accounting purposes. At December 31, 2006, the swap no longer qualified as an effective hedge. Therefore, the balance in accumulated other comprehensive income was reclassified into earnings over the life of the hedged item. On January 1, 2007, the Predecessor redesignated the same interest rate swap as a cash flow hedge for accounting purposes. On August 18, 2008, the Predecessor terminated the swap and entered into a settlement agreement with Goldman Sachs in the aggregate amount of $18,947, which also included the termination of the swap having a notional value of $270,000. The balance in accumulated other comprehensive income was reclassified into earnings over the remaining life of the item previously hedged. As of November 6, 2013, all amounts in accumulated other comprehensive income were reclassified into earnings.
In connection with financing obtained in 2006, the Predecessor entered into and designated an interest rate swap based on a notional amount of $270,000, which matured in July 2011, as a cash flow hedge. Under the swap agreement, the Predecessor received interest equivalent to one month LIBOR and paid a fixed rate of 5.359%, with settlements occurring monthly. On January 1, 2007, the swap was redesignated. Therefore, the balance in accumulated other comprehensive income was reclassified into earnings over the life of the hedged
123
Table of Contents
item. On August 18, 2008, the Predecessor terminated the swap and entered into a settlement agreement with Goldman Sachs in the aggregate amount of $18,947 which also included the termination of the swap having a notional value of $300,000. The balance in accumulated other comprehensive income was reclassified into earnings over the remaining life of the item previously hedged. As of November 6, 2013, all amounts in accumulated other comprehensive income were reclassified into earnings.
In connection with the 2007 Credit Facility, the Predecessor entered into and designated an interest rate swap based on a notional amount of $100,000 which would have matured on September 2014, as a cash flow hedge. Under the swap agreement, the Predecessor received interest equivalent to one month LIBOR and paid a fixed rate of 5.14%, with settlements that occurred monthly. For the Predecessor Company during the ten months ended November 6, 2013, the fair value of the swap increased by $2,835, of which $0 was recognized through earnings, an increase of $3,166 was recognized through accumulated other comprehensive income, and a decrease of $331 was recognized in reorganization items.
In connection with the 2007 Credit Facility, the Predecessor entered into and designated an interest rate swap based on a notional amount of $250,000 which would have matured on September 2014, as a cash flow hedge. Under the swap agreement, the Predecessor received interest equivalent to one month LIBOR and paid a fixed rate of 4.971%, with settlements that occurred monthly. For the Predecessor Company during the ten months ended November 6, 2013, the fair value of the swap increased by $6,837, of which an increase of $2 was recognized through earnings, an increase of $7,635 was recognized through accumulated other comprehensive income, and a decrease of $800 was recognized in reorganization items.
In connection with the First Amendment to the 2007 Credit Facility, the Predecessor entered into and designated an interest rate swap based on a notional amount of $200,000 which would have matured on September 2014, as a cash flow hedge. Under the swap agreement, the Predecessor received interest equivalent to one month LIBOR and paid a fixed rate of 5.079% with settlements that occurred monthly. For the Predecessor Company during the ten months ended November 6, 2013, the fair value of the swap increased by $5,597, of which a decrease of $16 was recognized through earnings, an increase of $6,268 was recognized through accumulated other comprehensive income, and a decrease of $655 was recognized in reorganization items.
In connection with the First Amendment to the 2007 Credit Facility, the Predecessor entered into and designated an interest rate swap based on a notional amount of $75,000 which would have matured on September 2014, as a cash flow hedge. Under the swap agreement, the Predecessor received interest equivalent to one month LIBOR and paid a fixed rate of 4.941% with settlements that occurred monthly. For the Predecessor Company during the ten months ended November 6, 2013, the fair value of the swap increased by $2,015, of which $0 was recognized through earnings, an increase of $2,270 was recognized through accumulated other comprehensive income, and a decrease of $255 was recognized in reorganization items.
The aggregate amount of unrealized loss related to derivative instruments recognized in other comprehensive loss as of December 29, 2013 and December 30, 2012 was $0 and $45,651, respectively.
124
Table of Contents
(13) Income Taxes
Income tax expense (benefit) on loss from continuing operations for the periods shown below consisted of:
| Current | Deferred | Total | ||||||||||
| Two months ended December 29, 2013, Successor Company: |
||||||||||||
| U.S. Federal |
$ | — | $ | — | $ | — | ||||||
| State and local |
491 | — | 491 | |||||||||
|
|
|
|
|
|
|
|||||||
| $ | 491 | — | $ | 491 | ||||||||
|
|
|
|
|
|
|
|||||||
| Ten months ended November 6, 2013, Predecessor Company: |
||||||||||||
| U.S. Federal |
$ | — | $ | (158 | ) | $ | (158 | ) | ||||
| State and local |
— | (39 | ) | (39 | ) | |||||||
|
|
|
|
|
|
|
|||||||
| $ | — | (197 | ) | $ | (197 | ) | ||||||
|
|
|
|
|
|
|
|||||||
| Year ended December 30, 2012, Predecessor Company: |
||||||||||||
| U.S. Federal |
$ | 149 | $ | — | $ | 149 | ||||||
| State and local |
(356 | ) | — | (356 | ) | |||||||
|
|
|
|
|
|
|
|||||||
| $ | (207 | ) | — | $ | (207 | ) | ||||||
|
|
|
|
|
|
|
|||||||
| Year ended January 1, 2012, Predecessor Company: |
||||||||||||
| U.S. Federal |
$ | (1,368 | ) | $ | — | $ | (1,368 | ) | ||||
| State and local |
(435 | ) | — | (435 | ) | |||||||
|
|
|
|
|
|
|
|||||||
| $ | (1,803 | ) | — | $ | (1,803 | ) | ||||||
|
|
|
|
|
|
|
|||||||
Income tax expense (benefit) differed from the amounts computed by applying the U.S. federal income tax rate of 34% to income (loss) from continuing operations before income taxes as a result of the following:
| Successor Company | Predecessor Company | |||||||||||||||||
| Two Months Ended December 29, 2013 |
Ten Months Ended November 6, 2013 |
Year Ended December 30, 2012 |
Year Ended December 31, 2010 |
|||||||||||||||
| Computed “expected” tax expense (benefit) |
$ | 2,617 | $ | 267,934 | $ | (9,303 | ) | $ | (8,171 | ) | ||||||||
| Increase (decrease) in income tax benefit resulting from: |
||||||||||||||||||
| State and local income taxes, net of federal benefit |
491 | (39 | ) | 20 | (367 | ) | ||||||||||||
| Net nondeductible meals, entertainment, and other expenses |
54 | (173 | ) | 393 | 358 | |||||||||||||
| Return to provision adjustment |
— | (489 | ) | 288 | 6 | |||||||||||||
| Impairment of non-deductible goodwill |
— | — | — | 51 | ||||||||||||||
| Change in valuation allowance |
(1,704 | ) | (53,913 | ) | 8,462 | 6,183 | ||||||||||||
| (Decrease) increase to provision for unrecognized tax benefits |
— | — | (356 | ) | 120 | |||||||||||||
| Cancellation of indebtedness and original issue discount |
(967 | ) | (213,517 | ) | — | — | ||||||||||||
| Other |
— | — | 289 | 17 | ||||||||||||||
|
|
|
|
|
|
|
|
|
|||||||||||
| $ | 491 | $ | (197 | ) | $ | (207 | ) | $ | (1,803 | ) | ||||||||
|
|
|
|
|
|
|
|
|
|||||||||||
125
Table of Contents
The tax effects of temporary differences that give rise to significant portions of the deferred tax assets as of December 29, 2013 and December 30, 2012 are presented below:
| Successor Company December 29, 2013 |
Predecessor Company December 30, 2012 |
|||||||||
| Current deferred tax assets: |
||||||||||
| Accounts receivable |
$ | 936 | $ | 962 | ||||||
| Accrued expenses |
13,204 | 12,077 | ||||||||
| Inventory capitalization |
3,014 | 2,356 | ||||||||
|
|
|
|
|
|||||||
| Gross current deferred tax assets |
17,154 | 15,395 | ||||||||
| Less valuation allowance |
(13,708 | ) | (15,395 | ) | ||||||
|
|
|
|
|
|||||||
| Net current deferred tax assets |
3,446 | — | ||||||||
|
|
|
|
|
|||||||
| Non-current deferred tax assets: |
||||||||||
| Derivative instruments |
— | 17,870 | ||||||||
| Pension and other postretirement benefit obligation |
3,920 | 8,922 | ||||||||
| Definite and indefinite lived intangible assets |
97,760 | 156,593 | ||||||||
| Fixed assets |
— | 3,538 | ||||||||
| Net operating losses |
87,346 | 242,272 | ||||||||
|
|
|
|
|
|||||||
| Gross non-current deferred tax assets |
189,026 | 429,195 | ||||||||
| Less valuation allowance |
(151,061 | ) | (429,195 | ) | ||||||
|
|
|
|
|
|||||||
| Net non-current deferred tax assets |
37,965 | — | ||||||||
| Non-current deferred tax liabilities: |
||||||||||
| Fixed assets |
41,411 | — | ||||||||
|
|
|
|
|
|||||||
| Gross non-current deferred tax liabilities |
41,411 | — | ||||||||
|
|
|
|
|
|||||||
| Net deferred tax assets |
— | — | ||||||||
|
|
|
|
|
|||||||
In assessing the realizability of deferred tax assets, management considers whether it is more likely than not that some portion or all of the deferred tax assets will not be realized. The ultimate realization of deferred tax assets is dependent upon the generation of future taxable income during the periods in which those temporary differences become deductible.
During the year ended January 1, 2012, the valuation allowance increased by $10,980, of which $5,617 was charged to earnings and $5,363 was recorded through accumulated other comprehensive income. During the year ended December 30, 2012, the valuation allowance increased by $2,707 of which $6,551 was charged to earnings and $3,844 was recorded as a reduction through accumulated other comprehensive income. During the ten months ended November 6, 2013, the valuation allowance decreased by $277,679, of which $59,839 was a benefit to earnings, $370 was charged to discontinued operations, and $20,412 was recorded as a benefit through accumulated other comprehensive income, and a reduction of $197,748 was attributable to the reduction of tax attributes related to the cancellation of indebtedness and other fresh start adjustments. During the two months ended December 29, 2013, the valuation allowance decreased by $2,142, all of which was a benefit to earnings.
At December 29, 2013, the Company had net operating loss carryforwards for federal and state income tax purposes of approximately $223,108, which are available to offset future taxable income, if any. These federal and state net operating loss carryforwards begin to expire on various dates from 2019 through 2033. The majority of the operating losses are subject to the limitations of Internal Revenue Code (the “Code”) Section 382. This section provides limitations on the availability of net operating losses to offset current taxable income if significant ownership changes have occurred for Federal tax purposes.
At December 29, 2013, the Company had uncertain tax positions of $1,109 which, if recognized, would impact the effective tax rate. The Company did not record significant amounts of interest and penalties related to uncertain tax positions for the Successor Company for two months ended December 29, 2013 and the Predecessor Company for the ten months ended November 6, 2013.
126
Table of Contents
A reconciliation of the beginning and ending amount of uncertain tax positions for the years ended December 29, 2013, December 30, 2012 and January 1, 2012 are as follows:
| Balance as of January 1, 2011 |
$ | 4,913 | ||
| Increases based on tax positions prior to 2011 |
120 | |||
|
|
|
|||
| Uncertain tax positions as of January 1, 2012 |
$ | 5,033 | ||
| Decreases based on tax positions prior to 2012 |
(399 | ) | ||
| Increases based on tax positions prior to 2012 |
43 | |||
|
|
|
|||
| Uncertain tax positions as of December 30, 2012, Predecessor Company |
$ | 4,677 | ||
| Decreases based on tax positions prior to 2013 and tax attribute reductions |
(3,568 | ) | ||
|
|
|
|||
| Uncertain tax positions as of December 29, 2013, Successor Company |
$ | 1,109 | ||
|
|
|
The Company does not anticipate significant increases or decreases in our uncertain tax positions within the next twelve months. The Company recognizes penalties and interest relating to uncertain tax positions in the provision for income taxes. During the period, the Company did not recognize any accrued interest or penalties. At December 29, 2013, the accrual for uncertain tax positions, included $320 of interest and penalties.
The Company files a U.S. federal consolidated income tax return for which the statute of limitations remains open for the 2010 tax year and beyond. U.S. state jurisdictions have statute of limitations generally ranging from 3 to 6 years.
(14) Earnings (Loss) Per Share
The following table sets forth the computation of basic and diluted earnings (loss) per share (“EPS”):
| Successor Company | Predecessor Company | |||||||||||||||||
| Two Months Ended December 29, 2013 |
Ten Months Ended November 6, 2013 |
Year Ended December 30, 2012 |
Year Ended January 1, 2012 |
|||||||||||||||
| Numerator for earnings per share calculation: |
||||||||||||||||||
| Income (loss) from continuing operations attributable to New Media |
$ | 7,206 | $ | 788,448 | $ | (27,463 | ) | $ | (20,950 | ) | ||||||||
| Loss from discontinued operations, attributable to New Media, net of income taxes |
— | (1,034 | ) | (2,340 | ) | (699 | ) | |||||||||||
|
|
|
|
|
|
|
|
|
|||||||||||
| Net income (loss) attributable to New Media |
$ | 7,206 | $ | 787,414 | $ | (29,803 | ) | $ | (21,649 | ) | ||||||||
| Denominator for earnings per share calculation: |
||||||||||||||||||
| Basic weighted average shares outstanding |
30,000,000 | 58,069,272 | 58,041,907 | 57,949,815 | ||||||||||||||
| Diluted weighted average shares outstanding |
30,000,000 | 58,069,272 | 58,041,907 | 57,949,815 | ||||||||||||||
| Income (loss) per share—basic and diluted: |
||||||||||||||||||
| Income (loss) from continuing operations attributable to New Media |
$ | 0.24 | $ | 13.58 | $ | (0.47 | ) | $ | (0.36 | ) | ||||||||
| Loss from discontinued operations, attributable to New Media, net of taxes |
— | (0.02 | ) | (0.04 | ) | (0.01 | ) | |||||||||||
|
|
|
|
|
|
|
|
|
|||||||||||
| Net income (loss) attributable to New Media |
$ | 0.24 | $ | 13.56 | $ | (0.51 | ) | $ | (0.37 | ) | ||||||||
127
Table of Contents
During the two months ended December 29, 2013 the Successor Company excluded 1,362,479 common stock warrants from the computation of diluted income per share because their effect would have been antidilutive. For the Predecessor Company for the ten months ended November 6, 2013, and the years ended December 30, 2012 and January 1, 2012, 0, 25,424 and 84,181 RSGs, respectively, were excluded from the computation of diluted loss per share because their effect would have been antidilutive.
(15) Employee Benefit Plans
For the year ended December 29, 2013, the Company maintained the GateHouse Media, Inc. Retirement Savings Plan (the “GateHouse 401(k) Plan”), which is intended to be a qualified defined contribution plan with a cash or deferred arrangement under Section 401(k) of the Code. In general, eligible employees of the Company and participating affiliates who satisfy minimum age and service requirements are eligible to participate. Eligible employees can contribute amounts up to 100% of their eligible compensation to the GateHouse 401(k) Plan, subject to IRS limitations. The GateHouse 401(k) Plan also provides for discretionary matching and nonelective contributions that can be made in separate amounts among different allocation groups. The Company implemented a Companywide matching contribution on January 1, 2008 and discontinued offering such matching contribution across the Company on January 1, 2009. Effective January 2, 2012 the Company reinstated the matching contribution across the entire Company. During 2011 the Company only offered a matching contribution to certain groups of the Company’s employees. For the Successor Company for the two months ended December 29, 2013, the Predecessor Company for the ten months ended November 6, 2013, and for the year ended December 30, 2012, when the Company offered a matching contribution across the entire Company, the Company’s matching contributions to the GateHouse 401(k) Plan were $146, $845, and $117, respectively. During the year ended January 1, 2012, when the Company did not offer a matching contribution across the entire Company, the Company’s matching contributions to the GateHouse 401(k) Plan was $102. The Company did not make nonelective contributions for the reported years. Effective January 1, 2014, sponsorship of the GateHouse 401(k) Plan was transferred to New Media Investment Group, Inc. and the name of the Plan was changed to be the New Media Retirement Savings Plan.
For the year ended December 29, 2013, Local Media sponsored the Local Media Group, Inc. 401(k) Savings Plan (the “Local Media 401(k) Plan”), which also is intended to be a qualified defined contribution plan with a cash or deferred arrangement under Section 401(k) of the Code. In general, eligible employees of Local Media and participating affiliates who satisfied minimum age and service requirements were eligible to participate. Eligible employees were able to contribute amounts up to 25% of their eligible compensation to the Local Media 401(k) Plan, subject to IRS limitations. The Local Media 401(k) Plan also provided for a matching contribution up to 3.5% of a participant’s gross eligible compensation (based on an employee deferral election of at least 6% of eligible compensation). The Local Media 401(k) Plan did not provide for employer nonelective contributions and was frozen with respect to all new eligibility and contributions effective after December 31, 2013. Effective January 1, 2014, sponsorship of the Local Media 401(k) Plan was transferred to New Media.
The Company maintains three nonqualified deferred compensation plans, as described below, for certain of its employees.
The Company maintains the GateHouse Media, Inc. Publishers’ Deferred Compensation Plan (“Publishers Plan”), a nonqualified deferred compensation plan for the benefit of certain designated publishers of the Company’s newspapers. Under the Publishers Plan, the Company credits an amount to a bookkeeping account established for each participating publisher pursuant to a pre-determined formula, which is based upon the gross operating profits of each such publisher’s newspaper. The bookkeeping account is credited with earnings and losses based upon the investment choices selected by the participant. The amounts credited to the bookkeeping account on behalf of each participating publisher vest on an installment basis over a period of 15 years. A participating publisher forfeits all amounts under the Publishers Plan in the event that the publisher’s employment with the Company is terminated for “cause”, as defined in the Publishers Plan. Amounts credited to a participating publisher’s bookkeeping account are distributable upon termination of the publisher’s employment with the Company and will be made in a lump sum or installments as elected by the publisher. The
128
Table of Contents
Publisher’s Plan was frozen effective as of December 31, 2006, and all accrued benefits of participants under the terms of the Publisher’s Plan became 100% vested. The Company recorded $0, $0, $0 and $0 of compensation expense related to the Publishers Plan for the Successor Company for the two months ended December 29, 2013, the Predecessor Company for the ten months ended November 6, 2013, and for the years ended December 30, 2012 and January 1, 2012, respectively.
The Company maintains the GateHouse Media, Inc. Executive Benefit Plan (“Executive Benefit Plan”), a nonqualified deferred compensation plan for the benefit of certain key employees of the Company. Under the Executive Benefit Plan, the Company credits an amount, determined at the Company’s sole discretion, to a bookkeeping account established for each participating key employee. The bookkeeping account is credited with earnings and losses based upon the investment choices selected by the participant. The amounts credited to the bookkeeping account on behalf of each participating key employee vest on an installment basis over a period of 5 years. A participating key employee forfeits all amounts under the Executive Benefit Plan in the event that the key employee’s employment with the Company is terminated for “cause”, as defined in the Executive Benefit Plan. Amounts credited to a participating key employee’s bookkeeping account are distributable upon termination of the key employee’s employment with the Company, and will be made in a lump sum or installments as elected by the key employee. The Executive Benefit Plan was frozen effective as of December 31, 2006, and all accrued benefits of participants under the terms of the Executive Benefit Plan became 100% vested. The Company recorded $0, $0, $0 and $0 of compensation expense related to the Publishers Plan for the Successor Company for the two months ended December 29, 2013, the Predecessor Company for the ten months ended November 6, 2013, and for the years ended December 30, 2012 and January 1, 2012, respectively.
The Company maintains the GateHouse Media, Inc. Executive Deferral Plan (“Executive Deferral Plan”), a nonqualified deferred compensation plan for the benefit of certain key employees of the Company. Under the Executive Deferral Plan, eligible key employees may elect to defer a portion of their compensation for payment at a later date. Currently, the Executive Deferral Plan allows a participating key employee to defer up to 100% of his or her annual compensation until termination of employment or such earlier period as elected by the participating key employee. Amounts deferred are credited to a bookkeeping account established by the Company for this purpose. The bookkeeping account is credited with earnings and losses based upon the investment choices selected by the participant. Amounts deferred under the Executive Deferral Plan are fully vested and non-forfeitable. The amounts in the bookkeeping account are payable to the key employee at the time and in the manner elected by the key employee.
(16) Pension and Postretirement Benefits
As a result of the Enterprise News Media, LLC and Copley Press, Inc. acquisitions, the Company maintains a pension plan and postretirement medical and life insurance plans which cover certain employees. The Company uses the accrued benefit actuarial method and best estimate assumptions to determine pension costs, liabilities and other pension information for defined benefit plans.
The Enterprise News Media, LLC pension plan was amended to freeze all future benefit accruals as of December 31, 2008, except for a select group of union employees whose benefits were frozen during 2009. Also, during 2008 the medical and life insurance benefits were frozen and the plan was amended to limit future benefits to a select group of active employees under the Enterprise News Media, LLC postretirement medical and life insurance plan.
129
Table of Contents
The following provides information on the pension plan and postretirement medical and life insurance plan as of December 29, 2013 for the Successor Company and as of November 6, 2013 and December 30, 2012 for the Predecessor Company, for the Successor Company for the two months ended December 29, 2013 and for the Predecessor Company for the ten months ended November 6, 2013 and December 30, 2012.
| Pension | Pension | Pension | Postretirement | Postretirement | Postretirement | |||||||||||||||||||||||
| Successor | Predecessor | Successor | Predecessor | |||||||||||||||||||||||||
| Two
Months Ended December 29, 2013 |
Ten
Months Ended November 6, 2013 |
Year
Ended December 30, 2012 |
Two Months Ended December 29, 2013 |
Ten Months Ended November 6, 2013 |
Year Ended December 30, 2012 |
|||||||||||||||||||||||
| Change in projected benefit obligation: |
||||||||||||||||||||||||||||
| Benefit obligation at beginning of period |
$ | 24,651 | $ | 27,126 | $ | 23,926 | $ | 6,015 | $ | 6,666 | $ | 6,461 | ||||||||||||||||
| Service cost |
48 | 252 | 300 | 6 | 32 | 40 | ||||||||||||||||||||||
| Interest cost |
187 | 913 | 1,203 | 41 | 188 | 273 | ||||||||||||||||||||||
| Actuarial (gain) loss |
(408 | ) | (2,111 | ) | 3,422 | 176 | (596 | ) | 187 | |||||||||||||||||||
| Benefits and expenses paid |
(163 | ) | (1,529 | ) | (1,725 | ) | (29 | ) | (261 | ) | (282 | ) | ||||||||||||||||
| Participant contributions |
— | — | — | 2 | 12 | 14 | ||||||||||||||||||||||
| Employer implicit subsidy fulfilled |
— | — | — | (5 | ) | (26 | ) | (27 | ) | |||||||||||||||||||
|
|
|
|
|
|
|
|
|
|
|
|
|
|||||||||||||||||
| Projected benefit obligation at end of period |
$ | 24,315 | $ | 24,651 | $ | 27,126 | $ | 6,206 | $ | 6,015 | $ | 6,666 | ||||||||||||||||
|
|
|
|
|
|
|
|
|
|
|
|
|
|||||||||||||||||
| Change in plan assets: |
||||||||||||||||||||||||||||
| Fair value of plan assets at beginning of period |
$ | 19,981 | $ | 18,241 | $ | 16,498 | $ | — | $ | — | $ | — | ||||||||||||||||
| Actual return on plan assets |
472 | 2,121 | 2,353 | — | — | — | ||||||||||||||||||||||
| Employer contributions |
— | 1,148 | 1,115 | 27 | 249 | 268 | ||||||||||||||||||||||
| Employer implicit subsidy contribution |
— | — | — | 5 | 26 | 27 | ||||||||||||||||||||||
| Participant contributions |
— | — | — | 2 | 12 | 14 | ||||||||||||||||||||||
| Employer implicit subsidy fulfilled |
— | — | — | (5 | ) | (26 | ) | (27 | ) | |||||||||||||||||||
| Benefits paid |
(123 | ) | (1,324 | ) | (1,402 | ) | (29 | ) | (261 | ) | (282 | ) | ||||||||||||||||
| Expenses paid |
(40 | ) | (205 | ) | (323 | ) | — | — | — | |||||||||||||||||||
|
|
|
|
|
|
|
|
|
|
|
|
|
|||||||||||||||||
| Fair value of plan assets at end of period |
$ | 20,290 | $ | 19,981 | $ | 18,241 | $ | — | $ | — | $ | — | ||||||||||||||||
|
|
|
|
|
|
|
|
|
|
|
|
|
|||||||||||||||||
| Reconciliation of funded status: |
||||||||||||||||||||||||||||
| Benefit obligation at end of period |
$ | (24,315 | ) | $ | (24,651 | ) | $ | (27,126 | ) | $ | (6,206 | ) | $ | (6,015 | ) | $ | (6,666 | ) | ||||||||||
| Fair value of assets at end of period |
20,290 | 19,981 | 18,241 | — | — | — | ||||||||||||||||||||||
| Funded status |
(4,025 | ) | (4,670 | ) | (8,885 | ) | (6,206 | ) | (6,015 | ) | (6,666 | ) | ||||||||||||||||
| Unrecognized prior service cost |
— | — | — | — | — | (1,525 | ) | |||||||||||||||||||||
| Unrecognized actuarial (gain) loss |
(634 | ) | — | 8,294 | 176 | — | 220 | |||||||||||||||||||||
|
|
|
|
|
|
|
|
|
|
|
|
|
|||||||||||||||||
| Net accrued benefit cost |
$ | (4,659 | ) | $ | (4,670 | ) | $ | (591 | ) | $ | (6,030 | ) | $ | (6,015 | ) | $ | (7,971 | ) | ||||||||||
|
|
|
|
|
|
|
|
|
|
|
|
|
|||||||||||||||||
130
Table of Contents
| Pension | Pension | Pension | Postretirement | Postretirement | Postretirement | |||||||||||||||||||||||
| Successor | Predecessor | Successor | Predecessor | |||||||||||||||||||||||||
| Two
Months Ended December 29, 2013 |
Ten
Months Ended November 6, 2013 |
Year
Ended December 30, 2012 |
Two Months Ended December 29, 2013 |
Ten Months Ended November 6, 2013 |
Year Ended December 30, 2012 |
|||||||||||||||||||||||
| Balance sheet presentation: |
||||||||||||||||||||||||||||
| Accrued liabilities |
$ | — | $ | — | $ | — | $ | 403 | $ | 79 | $ | 423 | ||||||||||||||||
| Pension and other postretirement benefit obligations |
4,025 | 4,670 | 8,885 | 5,803 | 5,936 | 6,243 | ||||||||||||||||||||||
| Accumulated other comprehensive income |
634 | — | (8,294 | ) | (176 | ) | — | 1,305 | ||||||||||||||||||||
|
|
|
|
|
|
|
|
|
|
|
|
|
|||||||||||||||||
| Net accrued benefit cost |
$ | 4,659 | $ | (4,670 | ) | $ | 591 | $ | 6,030 | $ | 6,015 | $ | 7,971 | |||||||||||||||
|
|
|
|
|
|
|
|
|
|
|
|
|
|||||||||||||||||
| Comparison of obligations to plan assets: |
||||||||||||||||||||||||||||
| Projected benefit obligation |
$ | 24,315 | $ | 24,651 | $ | 27,126 | $ | 6,206 | $ | 6,015 | $ | 6,666 | ||||||||||||||||
| Accumulated benefit obligation |
24,315 | 24,651 | 27,126 | 6,206 | 6,015 | 6,666 | ||||||||||||||||||||||
| Fair value of plan assets |
20,290 | 19,981 | 18,241 | — | — | — | ||||||||||||||||||||||
131
Table of Contents
| Pension | Postretirement | |||||||||||||||||||||||||||||||||||
| Successor | Predecessor | Successor | Predecessor | |||||||||||||||||||||||||||||||||
| Two
Months Ended December 29, 2013 |
Ten
Months Ended November 6, 2013 |
Year
Ended December 30, 2012 |
Year Ended January 1, 2012 |
Two Months Ended December 29, 2013 |
Ten
Months Ended November 6, 2013 |
Year
Ended December 30, 2012 |
Year Ended January 1, 2012 |
|||||||||||||||||||||||||||||
| Components of net periodic benefit cost: |
||||||||||||||||||||||||||||||||||||
| Service cost |
$ | 48 | $ | 252 | $ | 300 | $ | 200 | $ | 6 | $ | 32 | $ | 40 | $ | 42 | ||||||||||||||||||||
| Interest cost |
187 | 913 | 1,203 | 1,238 | 41 | 188 | 273 | 303 | ||||||||||||||||||||||||||||
| Expected return on plan assets |
(246 | ) | (1,140 | ) | (1,275 | ) | (1,324 | ) | — | — | — | — | ||||||||||||||||||||||||
| Amortization of prior service cost |
— | — | — | — | — | (383 | ) | (457 | ) | (457 | ) | |||||||||||||||||||||||||
| Amortization of unrecognized (gain) loss |
— | 432 | 382 | 82 | — | — | — | — | ||||||||||||||||||||||||||||
|
|
|
|
|
|
|
|
|
|
|
|
|
|
|
|
|
|||||||||||||||||||||
| Net periodic benefit cost |
$ | (11 | ) | $ | 457 | $ | 610 | $ | 196 | $ | 47 | $ | (163 | ) | $ | (144 | ) | $ | (112 | ) | ||||||||||||||||
|
|
|
|
|
|
|
|
|
|
|
|
|
|
|
|
|
|||||||||||||||||||||
| Other changes in plan assets and benefit obligations recognized in other comprehensive income: |
||||||||||||||||||||||||||||||||||||
| Net actuarial (gain) loss |
$ | (634 | ) | $ | (7,843 | ) | $ | 2,343 | $ | 2,640 | $ | 176 | $ | 922 | $ | 187 | $ | 23 | ||||||||||||||||||
| Amortization of net actuarial loss |
— | (452 | ) | (383 | ) | (83 | ) | — | — | — | — | |||||||||||||||||||||||||
| Amortization of prior service credit |
— | — | — | — | — | 383 | 457 | 457 | ||||||||||||||||||||||||||||
| Other adjustment |
— | — | 43 | (240 | ) | — | — | — | — | |||||||||||||||||||||||||||
|
|
|
|
|
|
|
|
|
|
|
|
|
|
|
|
|
|||||||||||||||||||||
| Total recognized in other comprehensive income |
$ | (634 | ) | $ | (8,295 | ) | $ | 2,003 | $ | 2,317 | $ | 176 | $ | 1,305 | $ | 644 | $ | 480 | ||||||||||||||||||
|
|
|
|
|
|
|
|
|
|
|
|
|
|
|
|
|
|||||||||||||||||||||
The following assumptions were used in connection with the Company’s actuarial valuation of its defined benefit pension and postretirement plans:
| Pension | Postretirement | |||||||||||||||||||||||||||
| Successor | Predecessor | Successor | Predecessor | |||||||||||||||||||||||||
| Two
Months Ended December 29, 2013 |
Ten
Months Ended November 6, 2013 |
Year
Ended December 30, 2012 |
Two
Months Ended December 29, 2013 |
Ten
Months Ended November 6, 2013 |
Year
Ended December 30, 2012 |
|||||||||||||||||||||||
| Weighted average discount rate |
5.0 | % | 4.85 | % | 4.1 | % | 4.5 | % | 4.3 | % | 3.6 | % | ||||||||||||||||
| Rate of increase in future compensation levels |
— | — | — | — | — | — | ||||||||||||||||||||||
| Expected return on assets |
8.0 | % | 8.0 | % | 7.75 | % | — | — | — | |||||||||||||||||||
| Current year trend |
— | — | — | 7.8 | % | 7.8 | % | 7.7 | % | |||||||||||||||||||
| Ultimate year trend |
— | — | — | 4.8 | % | 4.8 | % | 4.8 | % | |||||||||||||||||||
| Year of ultimate trend |
— | — | — | 2025 | 2025 | 2022 | ||||||||||||||||||||||
132
Table of Contents
The following assumptions were used to calculate the net periodic benefit cost for the Company’s defined benefit pension and postretirement plans:
| Pension | Postretirement | |||||||||||||||||||||||||||||||||||
| Successor | Predecessor | Successor | Predecessor | |||||||||||||||||||||||||||||||||
| Two
Months Ended December 29, 2013 |
Ten
Months Ended November 6, 2013 |
Year
Ended December 30, 2012 |
Year Ended January 1, 2012 |
Two
Months Ended December 29, 2013 |
Ten
Months Ended November 6, 2013 |
Year
Ended December 30, 2012 |
Year Ended January 1, 2012 |
|||||||||||||||||||||||||||||
| Weighted average discount rate |
5.0 | % | 4.85 | % | 5.1 | % | 5.7 | % | 4.3 | % | 3.6 | % | 4.4 | % | 5.3 | % | ||||||||||||||||||||
| Rate of increase in future compensation levels |
— | — | — | — | — | — | — | — | ||||||||||||||||||||||||||||
| Expected return on assets |
8.0 | % | 8.0 | % | 7.75 | % | 7.75 | % | — | — | — | — | ||||||||||||||||||||||||
| Current year trend |
— | — | — | — | 7.8 | % | 7.7 | % | 8.1 | % | 8.5 | % | ||||||||||||||||||||||||
| Ultimate year trend |
— | — | — | — | 4.8 | % | 4.8 | % | 4.8 | % | 4.8 | % | ||||||||||||||||||||||||
| Year of ultimate trend |
— | — | — | — | 2025 | 2022 | 2022 | 2021 | ||||||||||||||||||||||||||||
To determine the expected long-term rate of return on pension plan assets, the Company considers the current and expected asset allocations, as well as historical and expected returns on various categories of plan assets, input from the actuaries and investment consultants, and long-term inflation assumptions. The expected allocation of pension plan assets is based on a diversified portfolio consisting of domestic and international equity securities and fixed income securities. This expected return is then applied to the fair value of plan assets. The Company amortizes experience gains and losses, including the effects of changes in actuarial assumptions and plan provisions over a period equal to the average future service of plan participants.
Amortization of prior service costs was calculated using the straight-line method over the average remaining service periods of the employees expected to receive benefits under the plan.
| Postretirement | Postretirement | |||||||
| Successor 2013 | Predecessor 2012 | |||||||
| Effect of 1% increase in health care cost trend rates |
||||||||
| APBO |
$ | 6,611 | $ | 7,092 | ||||
| Dollar change |
$ | 405 | $ | 426 | ||||
| Percent change |
6.5 | % | 6.4 | % | ||||
| Effect of 1% decrease in health care cost trend rates |
||||||||
| APBO |
$ | 5,863 | $ | 6,308 | ||||
| Dollar change |
$ | (343 | ) | $ | (358 | ) | ||
| Percent change |
(5.5 | )% | (5.4 | )% | ||||
Fair Value of plan assets are measured on a recurring basis using quoted market prices in active markets for identical assets, Level 1 input. The pension plan’s assets by asset category are as follows:
| Successor | Predecessor | |||||||||||||||||||||||||
| Two Months Ended December 29, 2013 |
Ten Months Ended November 6, 2013 |
December 30, 2012 | ||||||||||||||||||||||||
| Dollar | Percent | Dollar | Percent | Dollar | Percent | |||||||||||||||||||||
| Equity mutual funds |
$ | 14,738 | 73 | % | $ | 14,676 | 74 | % | $ | 12,299 | 67 | % | ||||||||||||||
| Fixed income mutual funds |
4,021 | 20 | % | 4,074 | 20 | % | 5,320 | 29 | % | |||||||||||||||||
| Cash and cash equivalents |
803 | 4 | % | 645 | 3 | % | 575 | 3 | % | |||||||||||||||||
| Other |
728 | 3 | % | 586 | 3 | % | 47 | 1 | % | |||||||||||||||||
|
|
|
|
|
|
|
|
|
|
|
|
|
|||||||||||||||
| Total |
$ | 20,290 | 100 | % | $ | 19,981 | 100 | % | $ | 18,241 | 100 | % | ||||||||||||||
|
|
|
|
|
|
|
|
|
|
|
|
|
|||||||||||||||
Plan fiduciaries of the George W. Prescott Publishing Company LLC Pension Plan set investment policies and strategies for the pension trust. Objectives include preserving the funded status of the plan and balancing risk against return. The
133
Table of Contents
general target allocation is 70% in equity funds and 30% in fixed income funds for the plan’s investments. To accomplish this goal, each plan’s assets are actively managed by outside investment managers with the objective of optimizing long-term return while maintaining a high standard of portfolio quality and proper diversification. The Company monitors the maturities of fixed income securities so that there is sufficient liquidity to meet current benefit payment obligations.
The following benefit payments, which reflect expected future services, as appropriate, are expected to be paid as follows:
| Pension | Postretirement | |||||||
| 2014 |
$ | 1,461 | $ | 412 | ||||
| 2015 |
1,508 | 410 | ||||||
| 2016 |
1,536 | 410 | ||||||
| 2017 |
1,545 | 379 | ||||||
| 2018 |
1,565 | 390 | ||||||
| 2019-2023 |
8,126 | 1,584 | ||||||
| Employer contribution expected to be paid during the year ending December 31, 2014 |
$ | 1,501 | $ | 412 | ||||
The postretirement plans are not funded.
The aggregate amount of net actuarial loss and prior service cost related to the Company’s pension and postretirement plans recognized in other comprehensive income as of December 29, 2013 was $458 of which $0 is expected to be amortized in 2014.
Multiemployer Plans
The Company is a participant in three multi-employer pension plans covering certain employees with Collective Bargaining Agreements (“CBAs”) in Ohio, Massachusetts and Illinois. The risks of participating in these multi-employer plans are different from single-employer plans in the following aspects:
| • | The Company plays no part in the management of plan investments or any other aspect of plan administration. |
| • | Assets contributed to the multi-employer plan by one employer may be used to provide benefits to employees of other participating employers. |
| • | If a participating employer stops contributing to the plan, the unfunded obligations of the plan may be borne by the remaining participating employers. |
| • | If the Company chooses to stop participating in some of its multi-employer plans, the Company may be required to pay those plans an amount based on the unfunded status of the plan, referred to as withdrawal liability. |
The Company’s participation in these plans for the year ended December 29, 2013, is outlined in the table below. The “EIN/Pension Plan Number” column provides the Employee Identification Number (EIN) and the three-digit plan number. Unless otherwise noted, the two most recent Pension Protection Act (PPA) zone statuses available are for the plan’s for the years ended December 29, 2013 and December 30, 2012, respectively. The zone status is based on information that the company received from the plan and is certified by the plan’s actuary. Among other factors, plans in the red zone are generally less than 65% funded; plans in the orange zone are both a) less than 80% funded and b) have an accumulated/expected funding deficiency in any of the next six plan years, net of any amortization extensions; plans in the yellow zone meet either one of the criteria mentioned in the orange zone; and plans in the green zone are at least 80% funded. The “FIP/RP Status Pending/Implemented” column indicates plans for which a financial improvement plan (FIP) or a rehabilitation plan (RP) is either pending or has been implemented. The last column lists the expiration date(s) of the collective-bargaining agreement(s) to which the plans are subject.
134
Table of Contents
The Company makes all required contributions to these plans as determined under the respective CBAs. For each of the plans listed below, the Company’s contribution represented less than 5% of total contributions to the plan.
| Pension Plan Name |
EIN Number/ Plan Number |
Zone Status |
FIP/RP Status Pending/ Implemented |
Contributions (in thousands) |
Surcharge Imposed |
Expiration Dates of CBAs | ||||||||||||||||||||||||||||
| 2013 | 2012 | 2013 | 2012 | 2011 | ||||||||||||||||||||||||||||||
| CWA/ITU Negotiated Pension Plan |
13-6212879/001 | Red | Red | Implemented | $ | 12 | $ | 13 | $ | 9 | No | 5/31/17 | ||||||||||||||||||||||
| GCIU—Employer Retirement Benefit Plan (1)(2) |
91-6024903/001 | Red | Red | Implemented | 91 | 89 | 87 | No | 11/14/2014 | |||||||||||||||||||||||||
| The Newspaper Guild International Pension Plan (1) |
52-1082662/001 | Red | Red | Implemented | 39 | 49 | 130 | No | 09/30/2014 | |||||||||||||||||||||||||
|
|
|
|
|
|
|
|||||||||||||||||||||||||||||
| Total |
$ | 142 | $ | 151 | $ | 226 | ||||||||||||||||||||||||||||
|
|
|
|
|
|
|
|||||||||||||||||||||||||||||
| (1) | This plan has elected to utilize special amortization provisions provided under the Preservation of Access to Care for Medicare Beneficiaries and Pension Relief Act of 2010. |
| (2) | During the fiscal year 2012 the Company accrued $1,185 related to this plan due to the discontinuance of press operations at its Suburban Chicago location. |
(17) Stock Compensation Plans
Omnibus Stock Incentive Plan
On October 5, 2006, the Predecessor adopted a new equity incentive plan for its employees, the RSG Plan and presented the RSG Plan to the Predecessor’s stockholders’ for approval, which was received on October 6, 2006. The RSG Plan provided for the issuance of stock options, stock appreciation rights, restricted shares, deferred shares, performance shares, unrestricted shares and other stock-based awards. A total of 2,000,000 shares of the Predecessor’s common stock were initially reserved for issuance under the RSG Plan, provided however, that commencing on the first day of each fiscal year beginning in calendar year 2007, the number of shares reserved and available for issuance was increased by an amount equal to 100,000. All such shares of the Predecessor’s common stock that were available for the grant of awards under the RSG Plan may be granted as incentive stock options. Section 162(m) of the Code states that the maximum aggregate number of shares that was subject to stock options or stock appreciation rights that may be granted to any individual during any fiscal year was 400,000 and the maximum aggregate number of shares that was subject to awards of restricted stock, deferred shares, unrestricted shares or other stock-based awards that may be granted to any individual during any fiscal year was 400,000.
The RSG Plan was administered by the Predecessor’s board of directors, although it may be administered by either the board of directors or any committee of the board of directors including a committee that complies with the applicable requirements of Section 162(m) of the Code, Section 16 of the Exchange Act and any other applicable legal or stock exchange listing requirements.
Except as otherwise provided by the RSG Plan administrator, on the first business day after the Predecessor’s annual meeting of stockholders and each such annual meeting thereafter during the term of the RSG Plan, each of the Predecessor’s independent directors who is serving following such annual meeting was automatically granted under the RSG Plan a number of unrestricted shares of common stock having a fair market value of $15 as of the date of grant; however, those of the Predecessor’s independent directors who were granted restricted common stock upon the consummation of the IPO will not be eligible to receive these automatic annual grants.
135
Table of Contents
The terms of the RSG Plan provided that the board of directors may amend, alter or discontinue the RSG Plan, but no such action may impair the rights of any participant with respect to outstanding awards without the participant’s consent. The RSG Plan administrator, however, reserves the right to amend, modify, or supplement an award to either bring it into compliance with Section 409A of the Code, or to cause the award to not be subject to such section. The RSG Plan was terminated on November 26, 2013 as a result of the bankruptcy filing.
As of December 29, 2013 and December 30, 2012, a total of 0 and 25,424 RSGs were outstanding under the RSG Plan, respectively. Refer to Note 5 for further discussion of our RSG Plan.
(18) Assets Held for Sale
As of December 29, 2013 and December 30, 2012, the Company intended to dispose of various assets which are classified as held for sale on the consolidated balance sheet in accordance with ASC 360. The following table summarizes the major classes of assets and liabilities held for sale at December 29, 2013 and December 30, 2012:
| Successor Company | Predecessor Company | |||||||||
| December 29, 2013 | December 30, 2012 | |||||||||
| Long-term assets held for sale: |
||||||||||
| Property, plant and equipment, net |
$ | 623 | $ | 474 | ||||||
|
|
|
|
|
|||||||
| Total long-term assets held for sale |
$ | 623 | $ | 474 | ||||||
|
|
|
|
|
|||||||
These assets are real property and no publication related assets are included. The carrying value and fair value of the assets were insignificant as of December 29, 2013 and December 30, 2012.
During the year ended December 30, 2012 the Company recorded an impairment charge in the amount of $2,128 related to property, plant and equipment and certain intangible assets which were classified as held for sale, refer to Note 19 for fair value measurement discussion. No such impairment charges were recorded during the year ended December 29, 2013.
(19) Fair Value Measurement
The Company measures and records in the accompanying consolidated financial statements certain assets and liabilities at fair value on a recurring basis. ASC 820 establishes a fair value hierarchy for those instruments measured at fair value that distinguishes between assumptions based on market data (observable inputs) and the Company’s own assumptions (unobservable inputs).
These inputs are prioritized as follows:
| • | Level 1: Observable inputs such as quoted prices in active markets for identical assets or liabilities; |
| • | Level 2: Inputs other than quoted prices included within Level 1 that are observable, either directly or indirectly, such as quoted prices for similar assets or liabilities or market corroborated inputs; and |
| • | Level 3: Unobservable inputs for which there is little or no market data and which require us to develop our own assumptions about how market participants price the asset or liability. |
The valuation techniques that may be used to measure fair value are as follows:
| • | Market approach—Uses prices and other relevant information generated by market transactions involving identical or comparable assets or liabilities; |
| • | Income approach—Uses valuation techniques to convert future amounts to a single present amount based on current market expectation about those future amounts; |
| • | Cost approach—Based on the amount that currently would be required to replace the service capacity of an asset (replacement cost). |
136
Table of Contents
The following table provides information for the Company’s major categories of financial assets and liabilities measured or disclosed at fair value on a recurring basis:
| Fair Value Measurements at Reporting Date Using | ||||||||||||||||||||
| Quoted Prices in Active Markets for Identical Assets (Level 1) |
Significant Other Observable Inputs (Level 2) |
Significant Unobservable Inputs (Level 3) |
Total Fair Value Measurements |
Valuation Technique |
||||||||||||||||
| Predecessor, as of December 30, 2012 |
||||||||||||||||||||
| Assets |
||||||||||||||||||||
| Cash and cash equivalents |
$ | 34,527 | $ | — | $ | — | $ | 34,527 | Income | |||||||||||
| Restricted cash |
6,467 | — | — | 6,467 | Income | |||||||||||||||
| Liabilities |
||||||||||||||||||||
| Derivatives (1) |
$ | — | $ | — | $ | 45,724 | $ | 45,724 | Income | |||||||||||
| Predecessor, as of November 6, 2013 |
||||||||||||||||||||
| Assets |
||||||||||||||||||||
| Cash and cash equivalents |
$ | 20,718 | $ | — | $ | — | $ | 20,718 | Income | |||||||||||
| Restricted cash |
6,716 | — | — | 6,716 | Income | |||||||||||||||
| Liabilities |
||||||||||||||||||||
| Derivatives (1)(2) |
$ | — | $ | — | $ | — | $ | — | Income | |||||||||||
| Successor, as of December 29, 2013 |
||||||||||||||||||||
| Assets |
||||||||||||||||||||
| Cash and cash equivalents |
$ | 31,811 | $ | — | $ | — | $ | 31,811 | Income | |||||||||||
| Restricted cash |
6,477 | — | — | 6,477 | Income | |||||||||||||||
| (1) | The Predecessor Company’s fair value of its interest-rate swaps was determined using a discounted cash flow method and the following significant inputs: the remaining term of the swap, the notional amount of the swap (ranging from $75,000 to $250,000), discount rates interpolated based on the one month LIBOR swap curves, the rate on the fixed leg of the swap, and a credit value adjustment to consider the likelihood of the Company’s nonperformance. The pricing model used was consistently applied and reflected the contractual terms of the derivatives as described above. In determining an appropriate spread to reflect its credit standing, the Predecessor Company considered credit default swap pricing on debt with similar credit risks and maturities. Therefore, the Predecessor Company’s interest-rate swaps are classified within Level 3 of the fair value hierarchy. An increase in the one month LIBOR and/or an increase in the credit default swap price would result in a decrease to fair value. A decrease in the one month LIBOR curve and/or a decrease in the credit default swap price would result in an increase to fair value. |
| (2) | The Company recognized $2,041 in reorganization items, net to adjust the fair value of derivatives to the allowed claim. |
The following tables reflect the activity of our derivative liabilities measured at fair value using significant unobservable inputs (Level 3) for year ended December 29, 2013:
| Derivative Liabilities |
||||
| Balance as of December 30, 2012, Predecessor Company |
$ | 45,724 | ||
| Total (gains) losses, net: |
||||
| Included in earnings |
14 | |||
| Included in other comprehensive income |
(19,339 | ) | ||
| Included in reorganization items, net |
2,041 | |||
|
|
|
|||
| Balance as of November 6, 2013, Predecessor Company |
$ | 28,440 | ||
| Reclassification to liabilities subject to compromise |
(28,440 | ) | ||
|
|
|
|||
| Balance as of December 29, 2013, Successor Company |
$ | — | ||
|
|
|
|||
137
Table of Contents
Certain assets are measured at fair value on a nonrecurring basis; that is, the instruments are not measured at fair value on an ongoing basis but are subject to fair value adjustments only in certain circumstances (for example, when there is evidence of impairment). During the quarter ended April 1, 2012, goodwill was written down to implied fair value using Level 3 inputs. The valuation techniques and significant inputs and assumptions utilized to measure fair value are discussed in Note 8.
During the twelve months ended December 30, 2012, the Company recorded an impairment charge in the amount of $2,128 related to property, plant and equipment and certain intangible assets which were classified as held for sale. The Company used assessed values and current market data, Level 2 inputs, to determine the fair value.
During the quarter ended September 29, 2013, the Company consolidated the assets and liabilities of Local Media under the purchase method of accounting. Accordingly, the assets acquired and liabilities assumed were recorded at their fair value. Property plant and equipment was valued using Level 2 inputs and mastheads and goodwill were valued using Level 3 inputs. Refer to Note 4 for discussion of the valuation techniques and significant inputs and assumptions utilized and the fair value recognized.
During the quarter ended September 29, 2013, certain intangible assets were written down to their implied fair value using Level 3 inputs. The valuation techniques and significant inputs and assumptions utilized to measure fair value are discussed in Note 8. The fair value of select advertiser relationships was $19,120, subscriber relationships $5,310, customer relationships $270, trade names was $270, and publication rights was $0 at September 29, 2013.
During the quarter ended December 29, 2013, the Company applied fresh start accounting which resulted in its assets and liabilities being recorded at their fair values utilizing Level 3 inputs as of November 6, 2013. The valuation techniques and significant inputs and assumptions utilized to measure fair value are discussed in Note 3.
Refer to Note 11 for the discussion on the fair value of the Company’s total long-term debt.
Refer to Note 16 for the discussion on the fair value of the Company’s pension plan.
(20) Commitments and Contingencies
The Company becomes involved from time to time in claims and lawsuits incidental to the ordinary course of its business, including with respect to such matters as libel, invasion of privacy, intellectual property infringement, wrongful termination actions, and complaints alleging employment discrimination. In addition, the Company is involved from time to time in governmental and administrative proceedings concerning employment, labor, environmental and other claims. Insurance coverage maintained by the Company mitigates potential loss for certain of these matters. Historically, such claims and proceedings have not had a material effect upon the Company’s consolidated results of operations or financial condition. While the Company is unable to predict the ultimate outcome of any currently outstanding legal actions, it is the opinion of the Company’s management that it is a remote possibility that the disposition of these matters would have a material adverse effect upon the Company’s consolidated results of operations, financial condition or cash flow.
Restricted cash at December 29, 2013 and December 30, 2012, in the aggregate amount of $6,477 and $6,467, respectively, is used to collateralize standby letters of credit in the name of the Company’s insurers in accordance with certain insurance policies and as cash collateral for certain business operations.
(21) Related-Party Transactions
As of December 29, 2013, Newcastle (an affiliate of FIG LLC (“Fortress”)) beneficially owned approximately 84.6% of the Company’s outstanding common stock.
138
Table of Contents
In addition, the Company’s Chairman, Wesley Edens, is also the Co-Chairman of the board of directors of FIG LLC. The Company does not pay Mr. Edens a salary or any other form of compensation.
Our Chief Operating Officer owns an interest in a company that we received $117 during 2013 for commercial printing services which is included in commercial printing and other on the consolidated statement of operations and comprehensive income (loss).
Our Chief Executive Officer and Chief Financial Officer are employees of Fortress and their salaries are paid by Fortress.
Management Agreement
On the Effective Date, we entered into a Management Agreement with our Manager. Our Management Agreement requires our Manager to manage our business affairs subject to the supervision of our Board of Directors.
Our Management Agreement has an initial three-year term and will be automatically renewed for one-year terms thereafter unless terminated either by us or our Manager. From the commencement date of our Common Stock trading on the “regular way” market on a major U.S. national securities exchange (the “Listing”), our Manager is (a) entitled to receive from us a management fee, (b) eligible to receive incentive compensation that is based on our performance and (c) eligible to receive options to purchase New Media Common Stock upon the successful completion of an offering of shares of our Common Stock or any shares of preferred stock with an exercise price equal to the price per share paid by the public or other ultimate purchaser in the offering. In addition, we are obligated to reimburse certain expenses incurred by our Manager. Our Manager is also entitled to receive a termination fee from us under certain circumstances.
GateHouse Management and Advisory Agreement
On November 26, 2013, New Media entered into the GateHouse Management and Advisory Agreement (the “GateHouse Management Agreement”) with GateHouse, pursuant to which New Media will manage the assets and the day-to-day operations of GateHouse. New Media will be responsible for, among other things (i) the purchase and sale of GateHouse’s investments (ii) the financing of GateHouse’s investments and (iii) investment advisory services. Such services may be performed by the Manager.
The GateHouse Management Agreement has an initial three-year term and will be automatically renewed for one-year terms thereafter unless terminated by New Media or Gate House. The GateHouse Management Agreement will automatically terminate if the Management Agreement between New Media and the Manager is terminated.
Commencing from the Listing, New Media is (a) entitled to receive a management fee equal to 1.50% per annum of GateHouse’s Total Equity (as defined in the GateHouse Management Agreement) and (b) eligible to receive incentive compensation that is based on GateHouse’s performance. In addition, GateHouse is obligated to reimburse certain expenses incurred by New Media in connection with the performance of its duties under the agreement. These fees eliminate in consolidation.
Local Media Management and Advisory Agreement
On August 27, 2013, GateHouse entered into the Local Media Management Agreement with Local Media Parent, which was substantially assigned to Local Media, to manage the operations of Local Media. Local Media Parent was a subsidiary of Newcastle (an affiliate of Fortress) prior to the Effective Date.
The agreement has a two-year term, with automatic renewal for successive two-year periods unless terminated. While the agreement is in effect, GateHouse will receive an annual management fee of $1,100, subject to adjustments (up to a maximum annual management fee of $1,200), and an annual incentive compensation fee based on exceeding EBITDA targets of Local Media. These fees eliminate in consolidation.
139
Table of Contents
Registration Rights Agreement with Omega
New Media entered into a registration rights agreement with Omega Advisors, Inc. and its affiliates (collectively, “Omega”). Under the terms of the registration rights agreement, subject to customary exceptions and limitations, New Media will be required to use commercially reasonable efforts to file a registration statement (the “Registration Statement”) providing for the registration and sale by Omega of its New Media Common Stock acquired pursuant to the Plan (the “Registrable Securities”) as soon as reasonably practicable, but not prior to the earlier of (i) 120 days following the Effective Date and (ii) 14 days after the required financials are completed in the ordinary course of business. During the first 12 months following the Listing, subject to customary exceptions and limitations, Omega may request one demand right with respect to some or all of the Registrable Securities under the Registration Statement (the “Demand Registration”).
Once New Media is eligible to use Form S-3, New Media will be required to use commercially reasonable efforts to file a resale shelf registration statement providing for the registration and sale on a continuous or delayed basis by Omega of its Registrable Securities (the “Shelf Registration”), subject to customary exceptions and limitations. Omega is entitled to initiate up to three offerings or sales with respect to some or all of the Registrable Securities pursuant to the Shelf Registration.
Omega may only exercise its right to request the Demand Registration and any Shelf Registrations if the Registrable Securities eligible to be sold pursuant to such Registration Statement or Shelf Registration are at least 3% of the then-outstanding New Media Common Stock. This description is a summary and is subject to, and qualified in its entirety by, the provisions of the Registration Rights Agreement filed as an exhibit hereto.
(22) Discontinued Operations
In May 2013, the Company disposed of a non wholly owned subsidiary in Chicago, Illinois. As a result, the asset, liability and noncontrolling interest carrying amounts of this subsidiary were derecognized. A loss of $1,146 was recognized in discontinued operations.
During the year ended December 30, 2012, the Company sold 22 publications in Suburban Chicago, Illinois for an aggregate purchase price of approximately $2,800. As a result, an impairment loss of $1,922 is included in loss from discontinued operations on the consolidated statement of operations and comprehensive income (loss) for this period. Additionally, an impairment loss of $206 is included in loss from discontinued operations net of income taxes on the consolidated statement of operations and comprehensive income (loss) for this period related to previously discontinued operations. The financial position and results of operations of the publications in Suburban Chicago, Illinois are reflected as discontinued operations for all periods presented.
During the year ended January 1, 2012, the Company discontinued a publication in New York. An impairment loss of $404 is included in discontinued operations on the consolidated statement of operations and comprehensive income (loss) for this period for the aforementioned discontinued operation and previously sold and discontinued operations.
The net revenue for the Successor Company for the two months ended December 29, 2013, for the Predecessor Company for the ten months ended November 6, 2013 and for the years ended December 30, 2012 and January 1, 2012 for the aforementioned discontinued operations was $0, $394, $8,722 and $11,123, respectively. Loss, net of income taxes of $0, for the Successor Company for the two months ended December 29, 2013, for the Predecessor Company for the ten months ended November 6, 2013 and for the years ended December 30, 2012 and January 1, 2012 for the aforementioned discontinued operations was $0, $1,034, $2,340 and $699, respectively.
140
Table of Contents
(23) Quarterly Results (unaudited)
| Predecessor | Predecessor | Predecessor | Predecessor | Successor | ||||||||||||||||||
| Quarter Ended March 31 |
Quarter Ended June 30 |
Quarter Ended September 29 |
One Month
Ended November 6 |
Two Months Ended December 29 |
||||||||||||||||||
| Year Ended December 29, 2013 |
||||||||||||||||||||||
| Revenues |
$ | 110,582 | $ | 119,597 | $ | 125,992 | $ | 57,119 | $ | 103,231 | ||||||||||||
| Operating income |
(2,461 | ) | 2,283 | (90,143 | ) | 6,965 | 9,495 | |||||||||||||||
| Income (loss) before income taxes |
(17,428 | ) | (13,175 | ) | (140,896 | ) | 959,542 | 7,697 | ||||||||||||||
| Net income (loss) |
(17,515 | ) | (14,122 | ) | (129,153 | ) | 948,204 | 7,206 | ||||||||||||||
| Basic income (loss) per share |
$ | (0.30 | ) | $ | (0.25 | ) | $ | (2.22 | ) | $ | 16.33 | $ | 0.24 | |||||||||
| Diluted income (loss) per share |
$ | (0.30 | ) | $ | (0.25 | ) | $ | (2.22 | ) | $ | 16.33 | $ | 0.24 | |||||||||
| Predecessor | Predecessor | Predecessor | Predecessor | |||||||||||||
| Quarter Ended April 1 |
Quarter Ended July 1 |
Quarter Ended September 30 |
Quarter Ended December 30 |
|||||||||||||
| Year Ended December 30, 2012 |
||||||||||||||||
| Revenues |
$ | 117,211 | $ | 125,970 | $ | 119,980 | $ | 125,393 | ||||||||
| Operating income (loss) |
936 | 11,644 | 6,881 | 10,332 | ||||||||||||
| Income (loss) before income taxes |
(13,072 | ) | (2,342 | ) | (7,944 | ) | (4,312 | ) | ||||||||
| Net income (loss) |
(13,241 | ) | (2,690 | ) | (9,313 | ) | (4,559 | ) | ||||||||
| Basic income (loss) per share |
$ | (0.23 | ) | $ | (0.05 | ) | $ | (0.16 | ) | $ | (0.08 | ) | ||||
| Diluted income (loss) per share |
$ | (0.23 | ) | $ | (0.05 | ) | $ | (0.16 | ) | $ | (0.08 | ) | ||||
(24) Subsequent Events
Stock Option and Incentive Award Plan
On February 3, 2014, the Board of Directors (the “Board”) of New Media Investment Group Inc. (“New Media”) adopted the New Media Investment Group Inc. Nonqualified Stock Option and Incentive Award Plan (the “Incentive Plan”).
On the same date, the Board adopted a form of the New Media Investment Group Inc. Non-Officer Director Restricted Stock Grant Agreement (the “Form Grant Agreement”) to govern the terms of awards of restricted stock (“Restricted Stock”) granted under the Incentive Plan to directors who are not officers or employees of New Media (the “Non-Officer Directors”). The Form Grant Agreement provides for the grant of Restricted Stock that vests in equal annual installments on each of the first, second and third anniversaries of the grant date, subject to the Non-Officer Director’s continued service as a member of the Board, and immediate vesting in full upon his or her death or disability. If the Non-Officer Director’s service terminates for any other reason, all unvested shares of Restricted Stock will be forfeited. Any dividends or other distributions that are declared with respect to the shares of Restricted Stock will be paid to the Non-Officer Director at the time such shares vest. On March 14, 2014, a grant of restricted shares totaling 15,870 was made to the Company’s Non-Officer Directors.
Spin-off
On February 13, 2014, Newcastle completed the spin-off of the Company. On February 14, 2014 New Media became a separate, publicly traded company trading on the NYSE under the ticker symbol “NEWM”. As a result of the spin-off, the fees included in the Management Agreement with our Manager became effective.
Acquisition
On February 28, 2014, the Company completed its acquisition of five publications from Freedom Communications for an aggregate purchase price of $8,000. The acquisition includes two daily and three weekly publications serving Southern California with an aggregate circulation of approximately 56.
Interest Rate Swap Agreement
On February 25, 2014, the Company entered into an interest rate swap agreement with PNC Bank in the notional amount of $6,250. The agreement swaps one month LIBOR, includes a fixed rate of 1.5% and terminates on November 26, 2018.
141
Table of Contents
| Item 9. | Changes in and Disagreements with Accountants on Accounting and Financial Disclosure |
Not applicable.
| Item 9A. | Controls and Procedures |
Conclusion Regarding the Effectiveness of Disclosure Controls and Procedures
Our management, with the participation of our Chief Executive Officer (principal executive office) and Chief Financial Officer (principal financial officer), has evaluated the effectiveness of our disclosure controls and procedures (as such term is defined in Rules 13a-15(e) and 15d-15(e) under the Securities and Exchange Act of 1934 (the “Exchange Act”), as of the end of the period covered by this report. Based on such evaluation, our Chief Executive Officer and Chief Financial Officer concluded that, as of December 29, 2013, our disclosure controls and procedures were effective.
Changes in Internal Controls Over Financial Reporting
There have not been any changes in our internal control over financial reporting (as such term is defined in Rule 13a-15(f) under the Exchange Act) during the fourth quarter of the fiscal year covered by this report that have materially affected, or are reasonably likely to materially affect, our internal control over financial reporting.
Management’s Annual Report on Internal Control Over Financial Reporting
This annual report does not include a report of management’s assessment regarding internal control over financial reporting or an attestation report of the company’s registered public accounting firm due to a transition period established by rules of the Securities and Exchange Commission (the “SEC”) for newly public companies.
| Item 9B. | Other Information |
Not applicable.
142
Table of Contents
| Item 10. | Directors, Executive Officers and Corporate Goverance |
MANAGEMENT
Officers of New Media
The following individuals serve as the officers of New Media:
Michael E. Reed, age 47, is our Chief Executive Officer. He became our Chief Executive Officer at the Effective Date. Previously he had been GateHouse’s Chief Executive Officer since January of 2006 and served in this position when GateHouse filed voluntary petitions for relief under Chapter 11 of the United States Bankruptcy Code on September 27, 2013. He was a member of the board of directors of our Predecessor GateHouse since October 2006. He was formerly the President and Chief Executive Officer of Community Newspaper Holdings, Inc., or “CNHI,” a leading publisher of local news and information and had served in that capacity since 1999. Mr. Reed served as CNHI’s Chief Financial Officer from 1997 to 1999. Prior to that, he worked for Park Communications, Inc., a multimedia company, located in Ithaca, New York. Mr. Reed formerly served on the Board of Directors for the Newspaper Association of America. He currently serves on the Board of Directors for the Minneapolis Star Tribune, on which he has served since 2009. Mr. Reed formerly served as a director of the Associated Press and Chairman of the Audit Committee for the Associated Press. Mr. Reed was also a member of the Board of Visitors of the University of Alabama’s College of Communication and Information Sciences and was a member of the Grady College Journalism School’s Board of Advisors. Mr. Reed has a deep understanding of our operations, strategy and people, as well as our industry, serving as GateHouse’s Chief Executive Officer for over seven years. He has also served in senior executive capacities with other companies in the newspaper and publishing industries. Mr. Reed also has extensive corporate board experience.
Gregory Freiberg, age 47, is our Chief Financial Officer and Chief Accounting Officer. He became New Media’s Chief Financial Officer in January of 2014. He was formerly the Executive Vice President and Chief Financial Officer of Dex One Corporation, a leading marketing solutions provider and had served in that capacity from September 2011 to April 2013. Mr. Freiberg was the Executive Vice President and Chief Financial Officer of Dex One Corporation when Dex One Corporation filed voluntary petitions for relief under Chapter 11 of the United States Bankruptcy Code on March 18, 2013. Prior to that, he served as Senior Vice President and Chief Financial Officer of Savvis, Inc. from April 2009 to August 2011, a global leader in cloud and managed solutions. Mr. Freiberg served as Senior Vice President and Chief Financial Officer of XO Holdings, Inc. and XO Communications, LLC from April 2006 to March 2009. Mr. Freiberg received his Bachelor of Science in Business Administration from the University of South Dakota, holds a CPA Certificate from the State of Nebraska, and served in the United States Army National Guard from 1986-1995.
Kirk Davis, age 52, is our Chief Operating Officer. He became our Chief Operating Officer and the Chief Executive Officer of GateHouse in January of 2014. He became the President and Chief Operating Officer of GateHouse, in January 2009 and still serves as its President. Mr. Davis was the President and Chief Operating Officer of GateHouse when GateHouse filed voluntary petitions for relief under Chapter 11 of the United States Bankruptcy Code on September 27, 2013. Mr. Davis has been an employee of GateHouse since 2006, when he served as the Chief Executive Officer of GateHouse Media New England. Prior to joining GateHouse, Mr. Davis served as the Chief Executive Officer of Enterprise NewsMedia, LLC, also known as the South of Boston Media Group, from 2004 to 2006. Prior to that, Mr. Davis served as Vice President of Publishing for Turley Publications, Inc., a publishing and printing company, from 2002 to 2004. In 2001, Mr. Davis formed Cracked Rock Media, Inc. and began acquiring newspapers in Central Massachusetts. Mr. Davis still owns Cracked Rock Media, but has no day-to-day operational involvement. Prior to that, Mr. Davis served as President of Community Newspaper Company (“CNC”) from 1998 to 2001. Mr. Davis also served as President of a newspaper group in the Boston area (TAB Newspapers), which was part of CNC, from 1996 to 1998. Mr. Davis also served as a Publisher and managed newspaper companies in Pennsylvania, Massachusetts and California
143
Table of Contents
from 1990 to 1996. Mr. Davis also served as Vice President of Circulation and Marketing for Ingersoll Publications from 1985 to 1990. Mr. Davis attended Wright State University and Ohio University. He is past chairman of the board for the Suburban Newspapers of America (“SNA”) and as well as past chairman of the SNA Foundation. In 2007, Mr. Davis was elected to the Board of Directors of the Alliance for Audited Media.
Directors of New Media
In accordance with the terms of our Amended and Restated Certificate of Incorporation, from and after the date of the first meeting of the Board of New Media following the Listing, the Board of New Media is divided into three classes of directors (designated Class I, Class II and Class III) of the same or nearly the same number to the extent practicable. At each annual meeting of stockholders, one class of directors will be elected for a three-year term to succeed the directors of the same class whose terms are then expiring. As a result, absent extenuating circumstances, a portion of the Board will be elected each year.
Our Amended and Restated Certificate of Incorporation authorizes a Board consisting of at least three, but no more than eleven, members, with the exact number of directors to be fixed from time to time by a resolution of the majority of the Board (or by a duly adopted amendment to the Amended and Restated Certificate of Incorporation). Any additional directorships resulting from an increase in the number of directors will be distributed among the three classes so that, as nearly as possible, each class will consist of one-third of the directors. The division of the Board into classes with staggered three-year terms may delay or prevent a change of management or a change in control. The initial terms of the Class I, Class II, and Class III directors will expire on the dates of the first, second and third annual meetings of stockholders held after the Listing, respectively. Mr. Tarica will serve as a Class I director, Messrs. Janulis and Reed will each serve as a Class II director and Messrs. Edens and Sheehan will each serve as a Class III director. All officers serve at the discretion of the Board.
| Name, Position, Age |
Description | |
| Wesley R. Edens Chairman and Director Age: 51 |
Mr. Edens is Chairman of our Board and served in this position when GateHouse filed voluntary petitions for relief under Chapter 11 of the United States Bankruptcy Code on September 27, 2013. Mr. Edens is Co-Founder, Principal and Co-Chairman of the board of directors of Fortress, an affiliate of our Manager. He is also Chairman of the board of directors of Florida East Coast Railway Corp., Nationstar Mortgage Holdings Inc., Springleaf Holdings, Inc., Newcastle Investment Corp. and Mapeley Limited, and a director of GAGFAH S.A., Brookdale Senior Living Inc., Gaming and Leisure Properties Inc., Springleaf Finance Corporation and Springleaf Finance Inc. Mr. Edens was the Chairman of the board of directors of GateHouse since June 2005. Mr. Edens serves or has served on the boards of the following publicly traded companies and registered investment companies: Aircastle Limited from August 2006 to August 2012; RailAmerica Inc. from November 2006 to November 2012; Crown Castle Investment Corp. (merged with Global Signal Inc.) from January 2007 to July 2007; Eurocastle Investment Limited, from August 2003 to November 2011; Fortress Brookdale Investment Fund LLC, from August 2000 (deregistered with the SEC in March 2009); Fortress Pinnacle Investment Fund, from July 2002 (deregistered with the SEC in March 2008); Fortress Pinnacle Investment Trust II, from July 2002 (deregistered with the SEC in January 2011); GateHouse, from June 2005 (deregistered with the SEC in November 2013); and RIC Coinvestment Fund LP, from May 2006 (deregistered with the SEC in June 2009). Prior to forming Fortress Investment Group LLC, Mr. Edens was a partner and |
144
Table of Contents
| Name, Position, Age |
Description | |
| a managing director of BlackRock Financial Management Inc., where he headed BlackRock Asset Investors, a private equity fund. In addition, Mr. Edens was formerly a partner and a managing director of Lehman Brothers. Mr. Edens received a B.S. in Finance from Oregon State University. Mr. Eden’s extensive credit, private equity finance and management expertise, extensive experience as an officer and director of public companies and his deep familiarity with our Company led our Board of Directors to conclude that Mr. Edens should be elected to serve as our Chairman and director. | ||
| Michael E. Reed Director Age: 47 |
For Mr. Reed’s biography, see “—Officers of New Media.” | |
| Kevin Sheehan Director Age 59 |
Mr. Sheehan was a member of the board of directors of our Predecessor, GateHouse, from October 2006 through the Effective Date and served in this position when GateHouse filed voluntary petitions for relief under Chapter 11 of the United States Bankruptcy Code on September 27, 2013. Mr. Sheehan currently serves as Chief Executive Officer of Norwegian Cruise Line, which he joined in 2007. Previously, Mr. Sheehan provided consulting services to Cerebrus Capital Management LP (2006-2007) and provided consulting services to Clayton Dubilier & Rice from 2005 until 2006. Prior thereto, Mr. Sheehan was Chairman and Chief Executive Officer of Cendant Corporation’s Vehicle Services Division (included responsibility for Avis Rent A Car, Budget Rent A Car, Budget Truck, PHH Fleet Management and Wright Express) from January 2003 until May 2005. From March 2001 until May 2003, Mr. Sheehan served as Chief Financial Officer of Cendant Corporation. From August 1999 to February 2001, Mr. Sheehan was President—Corporate and Business Affairs and Chief Financial Officer of Avis Group Holdings, Inc. and a director of that company from June 1999 until February 2001. From August 2005 to January 2008, Mr. Sheehan served on the faculty of Adelphi University as a Distinguished Visiting Professor—Accounting, Finance and Economics. Mr. Sheehan currently serves on the Boards of Dave & Busters and XOJETS. Mr. Sheehan is a graduate of Hunter College and New York University Graduate School of Business, and is a Certified Public Accountant.
Mr. Sheehan has significant experience in a senior management capacity for large corporations. Specifically, his experience as the Chief Financial Officer of several large corporations provide him with important experience and skills, as well as an understanding of the complexities of our current economic environment. Mr. Sheehan also brings significant financial expertise to our Board. | |
| Theodore P. Janulis Director Age 54 |
Mr. Janulis joined CRT Greenwich LLC in 2014 as Chief Executive Officer. CRT Greenwich LLC is the parent company of CRT Capital Group LLC, an institutionally focused broker-dealer that provides research and trade execution services. Prior to that, Mr. Janulis served as CEO of Aurora Bank FSB. Before Aurora, he spent 23 years at Lehman Brothers in various senior management roles including Global Head of Mortgage Capital, Global Head of the Investment Management Division, which included Neuberger Berman, and Global Co-Head of Fixed | |
145
Table of Contents
| Name, Position, Age |
Description | |
| Income. He also served on the firm’s Executive Committee. Mr. Janulis earned his Master of Business Administration from Columbia University Graduate Business School and A.B. from Harvard College. Mr. Janulis’s knowledge, skill, expertise and experience, including his extensive senior management experience, his service as Chief Executive Officer of two companies and his significant financial background, as evidenced by his professional and educational history, led our Board of Directors to conclude that he should serve as a director. | ||
| Laurence Tarica Director Age 64 |
Mr. Tarica currently serves as President of Jimlar Corporation (“Jimlar”), a member of the Li and Fung Group. Jimlar was privately held until it was acquired by the Li and Fung Group in 2010. Mr. Tarica joined Jimlar in 1971 and served in leadership roles in sourcing, design, development, sales and marketing. He became President and Chief Operating Officer of Jimlar in 1991. Jimlar is one of the oldest footwear import companies in America. Mr. Tarica also serves on the Board of Directors of D’Addario and Company, the leading manufacturer of musical instrument accessories, and on the Advisory Board of Stuart Levine and Associates, a management consulting firm. Mr. Tarica earned his Bachelor of Science in Economics from the University of Pennsylvania, Wharton School of Business. Mr. Tarica’s knowledge, skill, expertise and experience, specifically his experiences in a variety of business divisions, including sales and marketing, his development of Jimlar’s digital services and social media strategy and his over 20 years of operational and leadership experience as the President and Chief Operating Officer of Jimlar, led our Board of Directors to conclude that he should serve as a director. | |
Corporate Governance Principles and Board Matters
New Media is committed to maintaining high standards of business conduct and corporate governance, which we believe are essential to running our business efficiently, serving our stockholders well and maintaining our integrity in the marketplace. To that end, we have adopted a Code of Business Conduct and Ethics for our directors, officers and employees, including a separate Code of Ethics for our Chief Executive Officer and senior financial officers. In addition, we have adopted the Corporate Governance Guidelines of New Media (our “Corporate Governance Guidelines”), which, in conjunction with our Amended and Restated Articles of Incorporation, Amended and Restated Bylaws, Audit Committee charter, Nominating and Corporate Governance Committee charter and Compensation Committee charter form the framework for our corporate governance. All of our corporate governance materials, including the Audit Committee charter, Nominating and Corporate Governance Committee charter, Compensation Committee charter and the Code of Ethics for Executive Officers, are available under the Investors tabs on our website at www.newmediainv.com.
These materials also are available in print to any stockholder upon request. The Board regularly reviews corporate governance developments and makes modifications as warranted.
Board and Board Committee Independence
The Board has determined that each of Theodore P. Janulis, Kevin Sheehan and Laurence Tarica have no material relationship with us and are independent in accordance with our Corporate Governance Guidelines and the New York Stock Exchange listing standards.
146
Table of Contents
Executive Sessions
The Board meets at least once a year in executive session with non-management directors and without members of management or our Manager’s employees present, whether or not they are directors. The presiding director of these sessions will rotate among the chair of each of the Nominating and Corporate Governance Committee, the Audit Committee and the Compensation Committee.
Board Structure and Committee Composition
As of the date of this report on Form 10-K, the Board has five directors, a standing Audit Committee, Nominating and Corporate Governance Committee and Compensation Committee. The committees’ memberships and functions are described below. The Audit Committee, Nominating and Corporate Governance Committee and Compensation Committee operate under written charters adopted by the Board.
Board Leadership Structure
Although we currently have no policy against combining the two roles, we currently split the roles of Chairman of the Board and Chief Executive Officer. The Board believes that separating these two positions allows each person to focus on their individual responsibilities and enhances the accountability of our Chief Executive Officer to the Board. Under this structure, our Chief Executive Officer can focus his attention on the day-to-day operations and performance of our Company and on implementing our longer-term strategic direction. At the same time, our Chairman of the Board can focus his attention on longer term strategic issues, setting the agenda for and on providing insight and guidance to our Chief Executive Officer. We currently believe that the separation of the roles of Chairman of the Board and Chief Executive Officer is appropriate, however, our Corporate Governance Guidelines do not require the separation of the offices of the Chairman of the Board and the Chief Executive Officer. The Board is free to choose its Chairman of the Board in any way that it deems best at any given point in time.
The Board’s Role in Risk Oversight
The Board is responsible for enterprise risk management, including risks associated with our corporate governance, such as board organization, membership, structure and leadership succession planning, as well as the management of risks arising from our executive compensation policies and programs. While the Board retains responsibility for the general oversight of risks, it has delegated financial oversight to our Audit Committee, which focuses on financial risk, including those that could arise from our accounting and financial reporting processes and our consolidated financial statement audits.
The Board and the Audit Committee work together to provide enterprise-wide oversight of our management and handling of risk. These responsibilities are satisfied through periodic reports from the Audit Committee chairman regarding the risk considerations within its area of expertise, as well as through periodic reports to the Board, or the Audit Committee, from our management team on areas of material risk to the Company, including operational, financial, legal, regulatory and strategic risks. The Board, or the Audit Committee with respect to risks within its scope, reviews these reports to enable it to understand our risk identification, risk management and risk mitigation strategies. The Audit Committee chairman will report to the Board at subsequent Board meetings regarding particular risks within the scope of the Audit Committee, enabling the Board and the Audit Committee to coordinate the risk oversight role.
Committees of the Board
We have established the following committees of our Board:
147
Table of Contents
Audit Committee
The Audit Committee:
| • | reviews the audit plans and findings of our independent registered public accounting firm and our internal audit and risk review staff, as well as the results of regulatory examinations, and tracks management’s corrective action plans where necessary; |
| • | reviews our financial statements, including any significant financial items and/or changes in accounting policies, with our senior management and independent registered public accounting firm; |
| • | reviews our financial risk and control procedures, compliance programs and significant tax, legal and regulatory matters; and |
| • | has the sole discretion to appoint annually our independent registered public accounting firm, evaluate its independence and performance and set clear hiring policies for employees or former employees of the independent registered public accounting firm. |
The members of the Audit Committee are Kevin Sheehan (chair), Theodore P. Janulis and Laurence Tarica. Each member of the Audit Committee is “independent,” as defined under the rules of the NYSE and Rule 10A-3 of the Exchange Act. Our Board of Directors has determined that each director appointed to the Audit Committee is financially literate, and the Board of Directors has determined that Kevin Sheehan is our Audit Committee financial expert.
Nominating and Corporate Governance Committee
The Nominating and Corporate Governance Committee:
| • | reviews the performance of our Board of Directors and makes recommendations to the Board of Directors regarding the selection of candidates, qualification and competency requirements for service on the Board of Directors and the suitability of proposed nominees as directors; |
| • | advises the Board of Directors with respect to the corporate governance principles applicable to us; |
| • | oversees the evaluation of the Board of Directors and management; |
| • | reviews and approves in advance any related party transaction, other than those that are pre-approved pursuant to pre-approval guidelines or rules established by the committee; and |
| • | recommends guidelines or rules to cover specific categories of transactions. |
The members of the Nominating and Corporate Governance Committee are Laurence Tarica (chair), Kevin Sheehan and Theodore P. Janulis. Each member of our Nominating and Corporate Governance Committee is independent, as defined under the rules of the NYSE.
Compensation Committee
The Compensation Committee:
| • | reviews and recommends to the Board of Directors the salaries, benefits and equity incentive grants for all employees, consultants, officers, directors and other individuals we compensate; and |
| • | oversees our compensation and employee benefit plans. |
The members of the Compensation Committee are Theodore P. Janulis (chair), Laurence Tarica and Kevin Sheehan. Each member of our Compensation Committee is independent, as defined under the rules of the NYSE. The “independent” directors that are appointed to the Compensation Committee are also “non-employee” directors as defined in Rule 16b-3(b)(3) under the Exchange Act and “outside” directors within the meaning of Section 162(m)(4)(c)(i) of the Internal Revenue Code.
148
Table of Contents
Section 16(A) Beneficial Ownership Reporting Compliance, our Predecessor
Section 16(a) of the Exchange Act required that our Predecessor’s directors and executive officers, as well as each person or group holding more than 10% of our Predecessor’s common stock, to file reports of ownership and changes in ownership of our Predecessor’s equity securities with the SEC. During 2013, all of our Predecessor’s directors, executive officers and persons or groups holding more than 10% of our Predecessor’s common stock complied in a timely manner with the filing requirements of Section 16(a) of the Exchange Act. In making this statement, our Predecessor relied solely on the written representations of its directors, executive officers and persons or groups holding more than 10% of its common stock and copies of the reports that they have filed with the SEC.
Our common stock was not registered under the Securities Exchange Act of 1934, as amended, until January 30, 2014 and, consequently, there were no Section 16 filing requirements to be satisfied during fiscal year 2013.
| Item 11. | Executive Compensation |
EXECUTIVE COMPENSATION
Executive Compensation of New Media
In fiscal year 2013, our Chief Executive Officer, Michael E. Reed did not receive any compensation in respect of his service as our executive officer. Effective as of January 14, 2014, Mr. Reed resigned as our interim Chief Financial Officer and interim Chief Accounting Officer and Gregory Freiberg was appointed as our Chief Financial Officer and Chief Accounting Officer. In addition, effective as of January 14, 2014, Kirk A. Davis was appointed as our Chief Operating Officer. Following the date of the Listing, Mr. Reed’s compensation for service as our Chief Executive Officer and Mr. Freiberg’s compensation for service as our Chief Financial Officer and Chief Accounting Officer will be paid by the Manager pursuant to the terms of our Management Agreement. The specific terms of Mr. Reed’s compensation following the date of the Listing, however, have not yet been determined. Our Management Agreement generally provides that our Manager is responsible for managing our affairs. Mr. Freiberg, in his capacity as an employee of our Manager, will devote such portion of his time to our affairs as is necessary to enable us to operate our business. Mr. Freiberg will not receive any compensation from us for serving as our officer.
Executive Compensation of GateHouse, our Predecessor
All references to “we,” “our,” “us” and the “Company” refer to GateHouse, our Predecessor
In keeping with our disclosure of business, financial and other information regarding our Predecessor elsewhere in this report on Form 10-K, we have included information in this report on Form 10-K regarding the compensation of our Predecessor’s Named Executive Officers (as defined below).
Compensation Discussion and Analysis
The GateHouse board of directors is responsible for establishing, implementing and monitoring our executive compensation philosophy and objectives. The GateHouse board of directors’ focus is to establish compensation at levels necessary to attract, retain and motivate the best possible executive talent. Historically, our board of directors has developed our executive compensation programs based on input from our Chief Executive Officer, the officers’ current compensation, our financial condition, our operating results and individual performance.
The following Compensation Discussion and Analysis describes the material elements of compensation for our Chief Executive Officer, Chief Financial Officer and the three other executive officers identified in the
149
Table of Contents
Summary Compensation Table included below (“Named Executive Officers”), as well as the role and involvement of various parties in executive compensation analysis and decisions, and provides a discussion of the process and rationale for our board of directors’ decisions to compensate our Named Executive Officers with specific types and amounts of compensation. We have not established an extensive or complicated executive compensation program. Instead, we believe that we have a fairly simple executive compensation program that is intended to provide appropriate compensation for our Named Executive Officers, as determined by the GateHouse board of directors. As this Compensation Discussion and Analysis explains in greater detail, our executive compensation program currently has three key elements: (a) base salary; (b) an annual incentive in the form of an annual bonus; and (c) periodic long-term equity incentives, such as restricted share grants.
Executive Summary of Compensation Actions
Based on the global economic conditions, the performance of GateHouse stock and other factors, the key decisions made by our board of directors with respect to the executive compensation program in early 2013 and 2012:
| • | 2013 and 2012 base salaries for the Named Executive Officers were frozen at 2008 levels; |
| • | No awards of equity compensation were granted in 2013 and 2012; and |
| • | On December 26, 2012, the GateHouse board of directors elected to pay discretionary annual bonuses to our Named Executive Officers for certain performance factors achieved in 2012 and as an incentive to remain in our employment. The 2013 discretionary annual bonuses were declared and paid to our Named Executive Officers in 2014. |
Our board of directors believes that our executive compensation program has been tailored to promote the creation of value for our stockholders because we structure the executive compensation program to: (a) focus the executives’ performance on building long-term value through the achievement of short-term and long-term objectives; and (b) permit us to recruit, retain and motivate highly qualified executives by offering competitive compensation and rewarding superior performance.
At our 2013 Annual Meeting, we held our first stockholder advisory vote on our executive compensation program (the “Vote”) and our stockholders approved our fiscal year 2012 executive compensation program. Our board of directors has considered the results of the Vote and concluded that the executive compensation program continues to promote the creation of value for our stockholders, and therefore made no significant changes to the executive compensation program during the year.
Objectives of Our Compensation Program
The primary objective of our executive compensation program is to attract and retain executives with the requisite skills and experience to help us achieve our business mission and develop, expand and execute business opportunities to improve long-term stockholder value. The impact of the continuing global recession on the print and online advertising industries continues to create a challenging operating environment and to drive significant and rapid change. However, this economic environment has not changed the primary objectives of our executive compensation program of attracting and retaining talented executives. In fact, the weaknesses in the economy generally, and the financial markets specifically, has intensified the demand for exceptional leadership. We believe that a capable, experienced and highly motivated executive management team is critical to our success and to the creation of long-term stockholder value. In assessing the ability of our executive compensation program to meet these objectives, the board of directors evaluates both company and individual performance as well as market compensation. Through this evaluation, the board of directors works to help ensure that we maintain our ability to attract and retain superior employees in key positions and that compensation provided to key employees remains competitive relative to the compensation paid to similarly situated executives of peer companies.
150
Table of Contents
Key Elements of Our Executive Compensation Program
We seek to achieve the objectives for our executive compensation program through three key compensation elements:
| • | a base salary; |
| • | an annual incentive in the form of an annual bonus paid at GateHouse’s board of directors’ discretion, based on its evaluation of short-term company and individual performance; and |
| • | periodic long-term equity incentives, such as restricted share grants, to align the interests of our Named Executive Officers with those of our stockholders. |
Compensation Setting Process
Role of the GateHouse Board of Directors and Executive Officers
The GateHouse board of directors is primarily responsible for overseeing compensation of our executive officers, including Named Executive Officers. Since December 19, 2008, the board of directors, with the exception of our Chief Executive Officer, has assumed the functions previously carried out by the Compensation Committee. The board of directors, with the exception of our Chief Executive Officer, annually approves the compensation for our Named Executive Officers.
Independent Compensation Consultants
On June 8, 2012, the Company retained, on an ad hoc basis, Towers Watson & Co (“Towers Watson”), an independent compensation consultant with particular expertise in compensation matters for the media, publishing and newspaper industries, to provide ad hoc compensation consulting services with respect to: (a) managing senior executives via potential change-in-control for both incentive opportunities and stability; and (b) developing a retention plan for key executives (collectively, the “Services”).
As authorized by the GateHouse board of directors, Towers Watson reported directly to the Ad Hoc Committee (the “Committee”), which had the authority to engage Towers Watson and to approve fee arrangements for work performed. Towers Watson was authorized to interact with: (a) the Company’s management, as needed, in connection with the Services; and (b) the Committee’s outside legal counsel, when applicable, on matters being brought to the Committee for consideration.
It is the Committee’s policy that the Chair of the Committee or the full Committee pre-approve any additional services provided by Towers Watson to the Company. In fiscal year 2012, Towers Watson only performed the Services for the Committee. Towers Watson did not perform any services for the Committee in fiscal year 2013. The Committee has assessed the independence of Towers Watson pursuant to SEC Rules and Regulations and concluded that Towers Watson’s work for the Company does not raise any conflict of interest.
Benchmarking Data
The GateHouse board of directors believes that each element of the compensation program should establish compensation levels taking into account current market practices. As such, the members of our board of directors may familiarize themselves with compensation trends and competitive conditions through the review of non-customized market surveys, data and other information about relevant market compensation practices. However, market compensation levels and practices are only one of the factors used by the board of directors in making executive compensation decisions. The GateHouse board of directors does not target a specific percentile within this market data and instead uses the comparative data solely as a validation after having determined the types and amount of compensation based on its own evaluation. Other factors considered in the board of directors’ evaluation may include the individual Named Executive Officer’s level of responsibility, the individual Named Executive Officer’s performance, historical company practices, long-term market trends, internal pay equity and expectations regarding the individual’s future contributions, our own performance, budget considerations and succession planning and retention strategies.
151
Table of Contents
Executive Compensation Program
Our practices with respect to each of the three key compensation elements identified above, as well as other elements of compensation, are set forth below.
Base Salary
Each Named Executive Officer is paid a base salary providing him or her with a guaranteed income stream which does not vary with our performance. Each Named Executive Officer’s base salary is based on his or her job responsibilities, leadership and experience and value to, and length of service with, our Company. The salaries of our Named Executive Officers named in the Summary Compensation Table are determined by the board of directors. Such salaries may be reflected either in an employment agreement (described below in the section entitled “Employment Agreements”) or an offer letter. Decisions regarding adjustments to base salaries are made at the discretion of the GateHouse board of directors, and are influenced by, among other factors determined by the board of directors in its sole discretion, each Named Executive Officer’s current base salary and the base salaries paid to other executives performing substantially similar functions at similar companies with a market capitalization similar to ours.
For both 2013 and 2012, in light of the current economic environment and considering other factors, the board of directors elected to freeze the base salaries of our Named Executive Officers (other than Mr. Davis) at their 2008 levels.
Annual Bonus Incentives for Named Executive Officers
Each of our Named Executive Officers is entitled to a discretionary annual bonus. The annual bonus incentives are used to ensure that a portion of our Named Executive Officer’s compensation is at risk, and that each Named Executive Officer has the opportunity to receive a variable amount of compensation based on the board of directors’ evaluation of our and the individual’s performance. The bonus is payable in our common stock or cash or a combination thereof, as determined by the GateHouse board of directors, in its sole discretion. Any bonus that is payable in common stock (a “Restricted Stock Bonus”) vests over a specified period.
While the amount, if any, of an annual bonus is determined by our board of directors in its sole discretion, the board of directors looks at many factors in its decision-making process relating to the amount, if any, of the annual bonus for our Named Executive Officers. The factors generally involve the following:
| • | Reviewing Company performance. Throughout the year, the GateHouse board of directors reviews all aspects of financial and operational performance of the Company, and also assesses Company performance in relation to the Company’s business direction, as determined by the board of directors, taking into account changing economic and market environments. |
| • | Individual performance. The GateHouse board of directors also evaluates individual performance beyond purely financial measures, including, generally, one or any combination of the following: (i) exceptional performance of each individual’s functional responsibilities; (ii) leadership; (iii) creativity; (iv) innovation; (v) collaboration; (vi) development and implementation of growth initiatives; and (vii) other activities that are critical to driving long-term value for stockholders. |
| • | Setting a target bonus. Our board of directors establishes a target bonus amount for certain Named Executive Officers. The target bonus takes into account all of the Company and individual factors that the board of directors deems relevant, however, no one factor by itself is determinative of the target bonus amount. For each of 2013 and 2012, Mr. Reed’s target bonus was $200,000, Ms. Janik’s target bonus was $137,500 and Mr. Maring’s target bonus was $140,000. Neither Mr. Davis nor Ms. Sack had a target bonus amount for 2013 or 2012. |
| • | Measuring performance. After the end of the fiscal year, our board of directors reviews Company and individual performance of each of our Named Executive Officers. The board of directors does not |
152
Table of Contents
| apply a rigid set of rules for determining the relative importance of the factors discussed above. Our board of directors may emphasize or weight particular factors differently for each Named Executive Officer and differently for each fiscal year. |
The GateHouse board of directors considered the above general factors, as well the specific accomplishments listed below, in awarding discretionary cash bonuses to our Named Executive Officers as follows:
Michael E. Reed: As our Chief Executive Officer, in 2012 Mr. Reed provided the leadership and direction necessary for our transformation to a truly multi-media enterprise. Mr. Reed played a critical role in conceptualizing and implementing our digital business initiatives while maintaining our supportive efforts for our traditional print business. On December 26, 2012, in light of these achievements and the above referenced general factors, our board of directors awarded Mr. Reed a discretionary bonus of $800,000 for 2012. On January 29, 2014, in light of the above referenced general factors and Mr. Reed’s strong leadership role in exploring strategic alternatives regarding the restructuring of our balance sheet and negotiating, achieving and implementing the Restructuring and our GateHouse Credit Facilities and effecting the Distribution, our board of directors awarded Mr. Reed a discretionary bonus of $200,000 for 2013.
Melinda A. Janik: As our Senior Vice President and Chief Financial Officer, in 2012 Ms. Janik played a critical role in designing operational metrics and reporting for our new digital ventures and new organizational structure. Ms. Janik also helped design and implement new compensation plans which were more closely aligned with our new goals and initiatives as part of our transformation to a multi-media enterprise. On December 26, 2012, in light of these achievements and the above referenced general factors, our board of directors awarded Ms. Janik a discretionary bonus of $125,000 for 2012. On February 20, 2014, in light of the above referenced factors and Ms. Janik’s oversight of and involvement with accounting matters related to the Restructuring, the acquisition and management of Local Media, and compliance with the terms of our GateHouse Credit Facilities as well as the Local Media Credit Facility, our board of directors awarded Ms. Janik a discretionary bonus of $70,000 for 2013.
Kirk A. Davis: As our President and Chief Operating Officer, in 2012 Mr. Davis played a crucial leadership role in implementing our new digital initiatives to grow our company and in executing the operational reorganization of GateHouse. On December 26, 2012, in light of these achievements and the above referenced general factors, our board of directors awarded Mr. Davis a discretionary bonus of $350,000 for 2012. On January 29, 2014, in light of the above referenced general factors and Mr. Davis’ strong leadership role in scaling our digital initiatives and overseeing the integration and operation of Local Media, our board of directors awarded Mr. Davis a discretionary bonus of $125,000 for 2013.
Polly Grunfeld Sack: As our Senior Vice President, General Counsel and Secretary, in 2012 Ms. Sack provided the legal advice, oversight and infrastructure necessary to formulate and implement our digital business and other new business initiatives, as well as providing the legal framework for our cost reduction initiatives. Ms. Sack also led our efforts to restructure and enhance our human resources function. On December 26, 2012, in light of these achievements and the above referenced general factors, our board of directors awarded Ms. Sack a discretionary bonus of $140,000 for 2012. On February 20, 2014, in light of the above referenced general factors and Ms. Sack’s legal leadership role in the implementation of the Restructuring and the negotiation and oversight of our GateHouse Credit Facilities and the Local Media Credit Facility, our board of directors awarded Ms. Sack a discretionary bonus of $70,000 for 2013.
Mark Maring: As our Vice President, Investor Relations and Strategic Development and Treasurer, in 2012 Mr. Maring played a crucial role in implementing our cost cutting measures and liaising with our lenders during the period that preceded the Restructuring. On December 26, 2012, in light of these achievements and the above referenced general factors, our board of directors awarded Mr. Maring a discretionary bonus of $80,000 for 2012. On February 20, 2014, in light of the above referenced general factors and Mr. Maring’s expanded role and his oversight of the financial modeling and analytics throughout the restructuring, our board of directors awarded Mr. Maring a discretionary bonus of $40,000 for 2013.
153
Table of Contents
Periodic Long-Term Equity Incentive Compensation
The periodic long-term equity incentive program provides a periodic award (typically annual) of equity compensation under the GateHouse Omnibus Stock Incentive Plan (the “Equity Plan”). The objective of the program is to directly align compensation for our Named Executive Officers over a multi-year period with the interests of our stockholders by motivating and rewarding creation and preservation of long-term stockholder value. The level of long-term incentive compensation is determined based on an evaluation of competitive factors in conjunction with total compensation provided to our Named Executive Officers and the goals of the compensation program described above.
During 2013 and 2012, following our board of directors’ evaluation of our performance, and after consideration of any other appropriate factors determined by the board of directors in its sole discretion, the board of directors determined not to grant our Named Executive Officers any awards of long-term equity compensation. In making this decision, the GateHouse board of directors considered that Mr. Reed and Ms. Sack each previously entered into a management stockholder agreement (the “Management Stockholder Agreements”) pursuant to which they were awarded restricted share grants. Under the Management Stockholder Agreements, the restricted share grants are subject to a five-year vesting schedule, with one-third of the shares vesting on each of the third, fourth and fifth anniversaries from the grant date. In addition, Mr. Reed also purchased additional restricted shares of our common stock which are also subject to the Management Stockholder Agreements.
Following the adoption of the Equity Plan in October 2006, additional restricted share grants were awarded to certain of our Named Executive Officers under the Equity Plan in each of 2006, 2007 and 2008. The majority of the restricted share grants granted under the Equity Plan vest in one-third increments on each of the first, second and third anniversaries of the grant date. During 2013 and 2012, following our board of directors’ evaluation of our performance, and after consideration of any other appropriate factors determined by the GateHouse board of directors in its sole discretion, our board of directors determined not to grant our Named Executive Officers any awards of restricted share grants.
During the applicable vesting period, our Named Executive Officers holding restricted share grants have all the rights of a stockholder, including, without limitation, the right to vote and the right to receive all dividends or other distributions (at the same rate and on the same terms as all other stockholders). As of December 29, 2013 no equity awards to our Named Executive Officers were outstanding.
Benefits and Perquisites
The GateHouse board of directors supports providing benefits and perquisites to our Named Executive Officers that are substantially the same as those offered to our other executive officers, including vacation, sick time, participation in our medical, dental and insurance programs, all in accordance with the terms of such plans and programs in effect from time to time.
Policy With Respect to the $1 Million Deduction Limit
Section 162(m) of the Internal Revenue Code generally disallows a tax deduction to public corporations for compensation greater than $1 million paid for any fiscal year to the corporation’s Chief Executive Officer and the three other most highly compensated executive officers as of the end of any fiscal year, other than the Chief Financial Officer. However, certain forms of performance-based compensation are excluded from the $1 million deduction limit if certain requirements are met. Our board of directors designs certain components of Named Executive Officer compensation, including awards granted under the Equity Plan, to permit, but not require, full deductibility. The GateHouse board of directors believes, however, that our stockholder interests are best served by not restricting its discretion and flexibility in crafting compensation programs, even though such programs may result in certain non-deductible compensation expenses. Accordingly, we have granted and may continue to grant awards such as time-based restricted share grants and/or enter into compensation arrangements under which payments are not deductible under Section 162(m) in the event that the GateHouse board of directors determines that such non-deductible arrangements are otherwise in the best interests of our stockholders.
154
Table of Contents
Risk and Compensation Policies
In considering the risks to the Company and its business that may be implied by our compensation plans and programs, our board of directors considers the design, operation and mix of the plans and programs at all levels of the Company. Our compensation program is designed to mitigate the potential to reward excessive risk-taking that may produce short-term results that appear in isolation to be favorable, but that may undermine the successful execution of our long-term business strategy and erode shareholder value.
2013 Summary Compensation Table
The table below summarizes the total compensation paid or earned by each of the Named Executive Officers for the fiscal years 2013, 2012 and 2011, ending December 29, 2013, December 30, 2012 and January 1, 2012, respectively.
| Name and Principal Position |
Year | Salary ($) | Bonus ($) | Change in Pension Value and Nonqualified Deferred Compensation Earnings ($) |
Total ($)(5) | |||||||||||||||
| Michael E. Reed |
2013 | $ | 500,000 | $ | 200,000 | (1) | $ | 0 | $ | 700,000 | ||||||||||
| —Chief Executive Officer |
2012 | 500,000 | 800,000 | (2) | 0 | 1,300,000 | ||||||||||||||
| 2011 | 500,000 | 800,000 | (3) | 0 | 1,300,000 | |||||||||||||||
| Melinda A. Janik |
2013 | 275,000 | 70,000 | (1) | 0 | 345,000 | ||||||||||||||
| —Senior Vice President and Chief Financial Officer |
2012 | 275,000 | 125,000 | (2) | 0 | 400,000 | ||||||||||||||
| 2011 | 275,000 | 125,000 | (3) | 0 | 400,000 | |||||||||||||||
| Kirk Davis |
2013 | 479,001 | 125,000 | (1) | 0 | (4) | 604,001 | |||||||||||||
| —President and Chief Operating Officer |
2012 | 461,261 | 350,000 | (2) | 15,117 | (4) | 826,378 | |||||||||||||
| 2011 | 461,261 | 350,000 | (3) | 8,527 | (4) | 819,788 | ||||||||||||||
| Polly Grunfeld Sack |
2013 | 260,000 | 70,000 | (1) | 0 | 330,000 | ||||||||||||||
| —Senior Vice President, General Counsel and Secretary |
2012 | 260,000 | 140,000 | (2) | 0 | 400,000 | ||||||||||||||
| 2011 | 260,000 | 140,000 | (3) | 0 | 400,000 | |||||||||||||||
| Mark Maring |
2013 | 200,000 | 40,000 | (1) | 0 | 240,000 | ||||||||||||||
| —Vice President, Investor Relations and Strategic Development and Treasurer |
2012 | 200,000 | 80,000 | (2) | 0 | 280,000 | ||||||||||||||
| 2011 | 200,000 | 80,000 | (3) | 0 | 280,000 | |||||||||||||||
| (1) | This amount reflects the bonus amount that was earned in 2013 and paid in 2014. |
| (2) | This amount reflects the bonus amount earned and paid in 2012. |
| (3) | This amount reflects the bonus amount earned in 2011 and paid in 2012. |
| (4) | The amount in this column represents the aggregate change in the actuarial present value of Mr. Davis’ accumulated benefit under the George W. Prescott Publishing Company Pension Plan, which was frozen effective December 31, 2008. |
Employment Agreements
On March 6, 2012, our board of directors approved and we entered into an amendment to the existing employment agreement with each of our Named Executive Officers, other than Ms. Janik and Mr. Maring. These amendments provide for enhanced severance benefits upon the executive’s involuntary termination of employment without “cause” or voluntary termination of employment for “good reason,” in each case, within 18 months of the earlier to occur of the commencement of any discussion with any individual or entity that ultimately results in a “change in control” (as defined in the Equity Plan) or the occurrence of a change in control transaction. The amendments also added voluntary termination of employment for “good reason” as an event that would entitle the executive to non-enhanced severance that is unrelated to a change of control. The amendments also clarify our
155
Table of Contents
approach to compliance with Section 409A of the Internal Revenue Code of 1986, as amended, and make conforming and clarifying changes to each of such executive’s restrictive covenants (such as non-competition, confidentiality and non-solicitation). No other changes were made to the existing employment agreements.
“Cause” is defined as: (a) a conviction of, guilty plea concerning or confession of any felony; (b) any act of dishonesty in connection with our business; (c) any uncured material breach by the executive of his or her employment agreement; (d) any material breach of any reasonable and lawful rule or directive from us; (e) the gross or willful neglect of duties or gross misconduct by the executive; or (f) the habitual use of drugs or habitual, excessive use of alcohol to the extent that any of such uses materially interferes with the performance of the executive’s duties under his or her employment agreement.
“Good reason” is defined as the occurrence of any one or more of the following at any time during the executive’s employment without the executive’s written consent: (a) the failure to maintain the executive in the same or better position with us which the executive held immediately prior to a change in control, or the removal of Executive as a member of the board of directors; (b) a significant adverse change in the nature or scope of the executive’s authorities, powers, functions, responsibilities or duties immediately prior to the change in control; (c) a reduction in the aggregate of the executive’s base salary or annual cash bonus; (d) a reduction in the executive’s long-term incentive compensation opportunity; (e) the termination or denial of the executive’s rights to retirement or welfare benefits or a reduction in the scope or value of such benefits (other than any a reduction that is generally applicable to all employees); (f) any change of the executive’s principal place of employment to a location more than 50 miles from the executive’s principal place of employment immediately prior to a change in control; (g) any uncured failure to pay the executive any compensation when due; (h) the delivery to the executive of a written notice of the intent to terminate the executive’s employment for any reason, other than cause or disability, regardless of when such termination is intended to become effective; or (i) any failure by us to comply with any provision of the executive’s employment agreement.
The enhanced severance benefit consists of: (a) a monthly payment for a specified period (27 months for Mr. Reed, 24 months for Mr. Davis and 21 months for Ms. Sack) equal to the executive’s monthly base salary and average monthly bonus (the average of the last three annual cash bonuses, or, if three annual cash bonuses have not been paid to the executive, the average of such bonuses that have been paid to the executive, in each case, divided by 12); (b) a pro-rated annual cash bonus for the year that the executive’s employment is terminated; (c) the accelerated vesting of any restricted stock awards that are unvested as of the date that the executive’s employment is terminated; (d) up to six months of outplacement services immediately following the executive’s termination of employment; and (e) up to 12 months of continued healthcare coverage.
The above description of the amendments is qualified in its entirety by the text of each respective amendment, which are attached as Exhibits 10.22, 10.23 and 10.25 to our Annual Report on Form 10-K filed on March 8, 2012.
Also on March 6, 2012, our board of directors approved and we entered into an employment agreement with Ms. Janik, our Senior Vice President and Chief Financial Officer. This employment agreement generally embodies the terms of that certain offer letter, dated December 23, 2008, filed as Exhibit 10.19 to our Annual Report on Form 10-K filed on March 13, 2009.
Under the employment agreement, Ms. Janik has the title of Senior Vice President and Chief Financial Officer and is entitled to continue to receive her current base salary at the annual rate of $275,000. Ms. Janik is eligible to receive each fiscal year a bonus (for each such fiscal year, a “Bonus”), based on the achievement, as determined by the GateHouse board of directors, of certain performance standards as agreed to by Ms. Janik and the GateHouse board of directors. Such Bonus is payable in such combination of cash and shares of common stock of the Company (“GateHouse Common Stock”) as determined by the board of directors, under the Equity Plan (or any similar or successor plan) (the stock portion of any such Bonus being a “Restricted Stock Grant”). The number of shares comprising any Restricted Stock Grant shall be determined by dividing the applicable portion of the Bonus being awarded in GateHouse Common Stock by the fair market value (as determined by our
156
Table of Contents
board of directors) of the GateHouse Common Stock on the date of grant. The cash portion of each Bonus shall be paid to Ms. Janik within a reasonable time after the end of the fiscal year, but in no event later than four months following completion of the fiscal year to which such Bonus relates (“Outside Payment Date”). The Restricted Stock Grant portion of each Bonus shall be made on such date as the board of directors determines in its discretion, though no later than the applicable Outside Payment Date. No Bonus in respect of any fiscal year will be due to Ms. Janik unless she is employed by us on the last day of the fiscal year in respect of which the Bonus is awarded. As described below, Ms. Janik’s employment agreement has the same type of severance provisions as those that are in Ms. Sack’s employment agreement.
The above description of Ms. Janik’s employment agreement is qualified in its entirety by the text of such agreement, which is attached as Exhibit 10.24 to our Annual Report on Form 10-K filed on March 8, 2012.
Michael E. Reed
In 2013, Mr. Reed was employed as our Chief Executive Officer pursuant to an employment agreement effective as of January 30, 2006, as amended on March 6, 2012. Under this agreement, he has the duties and responsibilities customarily exercised by the person serving as chief executive officer of a company of our size and nature.
Pursuant to his employment agreement, which has an initial three-year term that automatically renews subject to the same terms and conditions for additional one-year terms unless either we or Mr. Reed gives notice of non-renewal within ninety days prior to the end of the term, Mr. Reed receives an annual base salary of $500,000. Mr. Reed also is eligible for an annual, performance-based bonus. The agreement provides that Mr. Reed is eligible to receive an annual target bonus of $200,000 upon the achievement of certain performance goals agreed to by Mr. Reed and the GateHouse board of directors. The bonus is payable in either our common stock or cash in the discretion of our board of directors, provided that no more than 50% of the bonus shall be payable in our common stock without Mr. Reed’s approval.
Melinda A. Janik
On March 6, 2012, our board of directors approved and we entered into an employment agreement with Ms. Janik. This employment agreement is generally consistent with the prior offer letter between Ms. Janik and us. Under her employment agreement, Ms. Janik is entitled to receive a base salary of $275,000. Ms. Janik is also eligible to receive an annual bonus based on the achievement of certain performance requirements and satisfaction of a continuous employment requirement, as determined by the board of directors. Such annual bonus is payable in such combination of cash and shares of our common stock under the Equity Plan, as determined by the board of directors. Ms. Janik will be entitled to all of the usual benefits offered to employees at the executive level, including vacation, sick time, participation in our medical, dental and insurance programs, as well as the ability to participate in our 401(k) retirement savings plan. We will also reimburse Ms. Janik for any expenses reasonably and necessarily incurred by her in furtherance of her duties under the employment agreement.
Ms. Janik’s employment may be terminated (a) by us for “cause” (as such term is defined above); (b) by us at any time without “cause”; or (c) by Ms. Janik at any time. If Ms. Janik’s employment with us is terminated by us for “cause,” she shall not be entitled to any further compensation or benefits other than accrued but unpaid base salary and accrued and unused vacation pay through the date of such termination (collectively, the “Accrued Benefits”).
If Ms. Janik’s employment is terminated by us other than for “cause,” and not within 18 months of a “change in control” (as such term is defined above), then she shall be entitled to, upon providing us with a signed release of claims and subject to Ms. Janik’s continued compliance with restrictive covenants and confidentiality provisions of the employment agreement: (a) the Accrued Benefits, (b) an amount equal to 12 months base salary payable in the same manner as provided under the employment agreement, (c) any declared annual bonus not yet paid and (d) continuation of her coverage under our medical plan for 12 months from the date of such
157
Table of Contents
termination. If Ms. Janik’s employment is terminated by us without “cause” or Ms. Janik terminates her employment for “good reason” (as such term is defined above), in each case, within 18 months of the earlier to occur of the commencement of any discussion with any individual or entity that ultimately results in a change in control or the occurrence of a change in control transaction, Ms. Janik could become eligible to receive the same enhanced severance benefits described above in connection with the amendment to Ms. Sack’s employment agreement.
Unless Ms. Janik breaches one of the restrictive covenants contained in the employment agreement, the payments described in the termination provisions in the employment agreement shall be paid over a period of 12 months commencing on the date of Ms. Janik’s termination of employment with us; provided that if such termination is by Ms. Janik for “good reason” or occurs within 18 months of a “change in control,” such payments shall be paid over a 21-month period.
Kirk Davis
In 2013, Mr. Davis was employed as our President and Chief Operating Officer pursuant to an employment agreement effective as of January 9, 2009, as amended on March 6, 2012. Under this agreement, he has the duties and responsibilities customarily exercised by the person serving as president and chief operating officer of a company of our size and nature.
Pursuant to his employment agreement, which has no guaranteed term of employment or renewal provision, Mr. Davis’ annual base salary shall be reviewed on an annual basis and adjusted in our sole discretion. Mr. Davis also is eligible for an annual bonus, based on the achievement, as determined by the GateHouse board of directors in its sole discretion, of certain performance standards agreed to by Mr. Davis and our board of directors. Such bonus may be paid in such combination of cash and shares of our common stock as determined by our board of directors, in its sole discretion under the Equity Plan (or any similar or successor plan).
Mr. Davis was appointed as our Chief Executive Officer on January 14, 2014 and continues to be employed in that role pursuant to his employment agreement described above.
Polly G. Sack
Ms. Sack is employed as our Senior Vice President, Secretary and General Counsel pursuant to an employment agreement effective as of May 17, 2006, as amended on March 6, 2012. Under this agreement, she has the duties and responsibilities customarily exercised by the person serving as chief legal officer of a company of our size and nature.
Pursuant to her employment agreement, which has no guaranteed term of employment or renewal provision, Ms. Sack’s annual base salary shall be reviewed on an annual basis and adjusted in our sole discretion. Ms. Sack also is eligible for an annual, performance-based bonus, without a target level, based upon the achievement of certain performance goals agreed to by Ms. Sack and our board of directors. Such bonus may be a Restricted Stock Bonus as determined by the GateHouse board of directors and without restriction as to the relative proportions of common stock or cash comprising such bonus. Ms. Sack’s employment agreement also provided for the reimbursement of her reasonable relocation expenses.
Mark Maring
Mr. Maring is currently employed as our Treasurer and Vice President of Investor Relations and Strategic Development. From August 19, 2008 to February 2, 2009, Mr. Maring also served as our Interim Chief Financial Officer. Pursuant to an offer letter effective as of February 6, 2008, Mr. Maring was initially employed as our Vice President of Investor Relations and Strategic Development, with the duties and responsibilities customarily exercised by the person serving as Vice President of Investor Relations and Strategic Development of a company of our size and nature.
158
Table of Contents
Pursuant to his offer letter, which has no guaranteed term of employment or renewal provision, Mr. Maring’s initial annual base salary is at the rate of $200,000 per year. Mr. Maring also is eligible for an annual bonus based on achievement of annually agreed upon targets, of up to 70% of base pay. This bonus will be paid with a combination of cash and restricted stock and is subject to approval by the GateHouse board of directors.
General
The employment agreements with the Named Executive Officers are referred to collectively as the “Employment Agreements.” Our Named Executive Officers have restrictive covenants in the Employment Agreements and/or their management stockholder agreements for our benefit relating to non-competition during the term of employment and for the one year period following termination of their employment for any reason. Each of the Employment Agreements also contains restrictive covenants relating to non-solicitation of our employees, directors, agents, clients, customers, vendors, suppliers or consultants during the term of employment and for the one year period following termination of their employment for any reason.
No Grants of Plan-Based Awards, No Equity Compensation Granted During 2013, No Outstanding Equity Awards at Fiscal Year-End and No Options Exercised or Stock Vested During 2013
We did not grant any plan-based awards or equity compensation to our Named Executive Officers during the fiscal year ending December 29, 2013. No equity awards were outstanding at the end of fiscal 2013. Our Named Executive Officers did not exercise any stock options nor were they vested in any stock awards during 2013.
Pension Benefits
The following table sets forth Mr. Davis’ retirement benefits under our retirement plans. No other Named Executive Officers participate in any pension plan.
| Name |
Plan name |
Number of years credited service (#) |
Present value of accumulated benefit ($) |
Payments during last fiscal year ($) |
||||||||||
| Kirk Davis |
Prescott Pension Plan | 4.8 | $ | 56,077 | $ | 0 | ||||||||
We maintain one defined benefit plan, the George W. Prescott Publishing Company Pension Plan (the “Prescott Pension Plan”). The Prescott Pension Plan benefits the employees of the George W. Prescott Publishing Company by providing funded, tax-qualified benefits up to the limits on compensation and benefits under the Internal Revenue Code. Benefits under the Prescott Pension Plan are funded by an irrevocable tax-exempt trust. An executive’s benefits under the Prescott Pension Plan are payable from the assets held by a tax-exempt trust, and are based on earnings up to a compensation limit under the Internal Revenue Code (which was $230,000 in 2008).
Effective December 31, 2008, the Prescott Pension Plan was amended to freeze benefit accruals and participation. The only Named Executive Officer who has benefits in the Prescott Pension Plan is Mr. Davis. The terms and conditions below relate solely to participants in the Prescott Pension Plan.
The “Normal Retirement Benefit” is expressed as an annual single life annuity payable from normal retirement age for the remainder of his life. The benefit under the Prescott Pension Plan is equal to an amount equal to the sum of (i) and (ii):
(i) an amount equal to the product of:
(a) 0.5% of Mr. Davis’ Average Compensation (as defined below) not in excess of the covered compensation base plus 1% of his Average Compensation in excess of the covered compensation base; and (b) Mr. Davis’ years of Accrued Service (not in excess of 40).
159
Table of Contents
(ii) an amount equal to the product of:
(a) 0.67% of Mr. Davis’ Average Compensation; and
(b) Mr. Davis’ years of Accrued Service in excess of 40.
“Average Compensation” means the average of Mr. Davis’ highest compensation paid during any five consecutive plan years of the ten plan years prior to December 31, 2008. “Compensation” means Mr. Davis’ total compensation in a plan year, excluding any bonuses, any overtime payments and employer contributions under the Prescott Pension Plan or under any other employee benefit plan of an affiliated company. Pay in excess of the Internal Revenue Code Section 401(a)(17) limit, is not considered. “Accrued Service” is the total number of years prior to January 1, 2009 (June 1, 2009 for IBT Union employees), during which the executive has completed at least 1,000 Hours of Service.
If Mr. Davis retires after reaching the age of 60 and has completed five years of vesting service, he is entitled to the benefit amount. However, the benefit amount will be reduced 0.56% for each month his retirement precedes his reaching the age of 65.
In the event Mr. Davis dies prior to the commencement of benefit payments, his spouse will be eligible for a death benefit protection. This provides that if Mr. Davis and spouse were married for at least one year prior to his date of death, then the spouse of Mr. Davis shall receive a survivor annuity which is equal to 50% of the pension Mr. Davis would have received had he retired on his date of death or age 60, if later, with a joint and 50% survivor annuity option.
If Mr. Davis dies after payment of his benefit under the Prescott Pension Plan has commenced, the death benefit payable, if any, shall be determined in accordance with the form in which the benefit was being paid. The pension benefit under the Prescott Pension Plan is reduced if paid before normal retirement age. The pension benefit is defined as a single life annuity. Optional annuity forms which are approximately equal in value are also available.
2013 Non-Qualified Deferred Compensation
None of our Named Executive Officers were participants in or made contributions to or withdrawals from any of our nonqualified deferred compensation plans during the fiscal year ending December 29, 2013.
Potential Payments Upon Resignation, Termination or Change in Control
The table beginning on page 163 of this in this report on Form 10-K estimates the amount of compensation payable to each of our Named Executive Officers in the event of termination of such executives’ employment upon voluntary termination, termination for cause, death, disability, retirement, involuntary not for cause termination and termination following a change of control. The amounts shown are estimates assuming that such termination was effective as of December 29, 2013. Each of our Named Executive Officers is entitled to receive amounts earned during his or her term of employment regardless of the manner in which the Named Executive Officer’s employment is terminated. These amounts include accrued but unpaid base salary and accrued and unused vacation pay through the date of such termination. These amounts are not shown in the table. In addition, each of our Named Executive Officers may receive compensation under the terms of our Management Stockholder Agreements or the Equity Plan, as well as under the terms of their respective employment agreements.
The Management Stockholder Agreements with each of Mr. Reed and Ms. Sack contains a call option exercisable at our discretion pursuant to which we may purchase the shares of non-forfeited common stock which are subject to the Management Stockholder Agreement upon termination of his or her employment for any reason (the “Call Option”). The amount we will pay is determined as follows: (a) in the case of a termination for cause, the lower of the purchase price of one thousand dollars ($1,000) per share or the fair market value (as determined by our board of directors) or (b) in the case of a termination for any reason other than cause, the fair market value (as determined by our board of directors). Following the Restructuring, the Call Option has no value.
160
Table of Contents
Payments Made Upon Termination for Cause or Resignation without Good Reason
If the Named Executive Officer’s employment is terminated by the Company for cause or he or she voluntarily resigns without “good reason” (as such term is defined above), he or she would not be entitled to any further compensation or benefits other than Accrued Benefits. The Named Executive Officer would also forfeit all unvested shares subject to his or her initial stock grant and any restricted stock bonuses and, in the case of termination due to an act of dishonesty committed in connection with our business, he or she would forfeit all shares subject to his or her initial stock grant and any restricted stock bonuses. Under the Management Stockholder Agreements, we may exercise our Call Option.
Payments Made Upon Termination without Cause or Termination for Good Reason Unrelated to a Change in Control
If the Named Executive Officer’s employment is terminated by the Company other than for Cause or is terminated by the Named Executive Officer for “good reason” (as such term is defined above) unrelated to a change in control, in each case, not within 18 months of the earlier to occur of the commencement of any discussion with any individual or entity that ultimately results in a change in control or the occurrence of a change in control transaction (this period is referred to as the “Protection Period”), then he or she shall be entitled to:
(a) the Accrued Benefits;
(b) an amount equal to 12 months current base salary;
(c) the annual bonus, including any declared bonus not yet paid;
(d) continuation of health benefits at the same levels until the earlier of: (i) the time it takes the Named Executive Officer to become eligible for benefits from a new employer; or (ii) 12 months from the date of termination;
(e) the shares subject to the initial stock grant and any additional restricted stock bonuses that would have vested on the next anniversary date following the date of such termination, but in no event less than one-third (1/3) each of the shares to the initial stock grant and any additional restricted stock bonuses; and
(f) with respect to each of Mr. Reed and Ms. Sack only, under the Management Stockholder Agreement, we may exercise our Call Option.
Payments Made Upon Termination without Cause or Termination for Good Reason following a Change in Control
If the Named Executive Officer’s employment is terminated by the Company other than for Cause or is terminated by the Named Executive Officer for Good Reason following a change in control, in each case within the Protection Period, then he or she shall be entitled to:
(a) the Accrued Benefits;
(b) an amount equal to:
i. with respect to Mr. Reed, 27 months Base Salary plus Average Monthly Bonus (as defined in the Employment Agreements) current base salary;
ii. with respect to Mr. Davis, 24 months Base Salary plus Average Monthly Bonus; and
iii. with respect to each of Ms. Janik and Ms. Sack, 21 months Base Salary plus Average Monthly Bonus.
(c) a pro-rated bonus for the year of termination;
161
Table of Contents
(d) vesting of the portion of the shares of any Restricted Stock Grant and the Initial Restricted Stock Grant, respectively, that are not vested as of the date of termination, if the date of termination is within 12 months of the change in control;
(e) up to 6 months of outplacement services;
(f) continuation of health benefits at the same levels until the earlier of: (i) the time it takes the Named Executive Officer to become eligible for benefits from a new employer; or (ii) 12 months from the date of termination;
(g) the shares subject to the initial stock grant and any additional restricted stock bonuses that would have vested on the next anniversary date following the date of such termination, but in no event less than one-third (1/3) each of the shares to the initial stock grant and any additional restricted stock bonuses, if the date of termination is not within 12 months of the change in control; and
(h) with respect to each of Mr. Reed and Ms. Sack only, under the Management Stockholder Agreement, we may exercise our Call Option.
Payments Made Upon Resignation, Death or Disability
If the Named Executive Officer’s employment is terminated by reason of voluntary resignation (other than a voluntary termination for good reason), death or Disability (as defined in the Employment Agreements), he or she would not be entitled to receive any further compensation or benefits other than the Accrued Benefits. If any Named Executive Officer fails to perform his or her duties as a result of Disability or incapacity, he or she shall continue to receive his or her Base Salary and all other benefits and all other compensation unless and until his or her employment is terminated. In addition, under the Management Stockholder Agreements, we may exercise our Call Option.
162
Table of Contents
Potential Payments upon Termination or Change of Control
| OFFICERS | ||||||||||||||||||||
| EVENT |
Michael E. Reed |
Melinda A. Janik |
Mark Maring |
Kirk Davis | Polly G. Sack |
|||||||||||||||
| VOLUNTARY TERMINATION, TERMINATION FOR CAUSE OR RESIGNATION WITHOUT “GOOD REASON” |
| |||||||||||||||||||
| Call Option (1) |
$ | 0 | $ | 0 | $ | 0 | $ | 0 | $ | 0 | ||||||||||
|
|
|
|
|
|
|
|
|
|
|
|||||||||||
| Total |
$ | 0 | $ | 0 | $ | 0 | $ | 0 | $ | 0 | ||||||||||
| DEATH |
||||||||||||||||||||
| Call Option (1) |
$ | 0 | $ | 0 | $ | 0 | $ | 0 | $ | 0 | ||||||||||
| Life insurance proceeds |
$ | 500,000 | $ | 275,000 | $ | 200,000 | $ | 461,261 | $ | 260,000 | ||||||||||
|
|
|
|
|
|
|
|
|
|
|
|||||||||||
| Total |
$ | 500,000 | $ | 275,000 | $ | 200,000 | $ | 461,261 | $ | 260,000 | ||||||||||
| DISABILITY |
||||||||||||||||||||
| Call Option(1) |
$ | 0 | $ | 0 | $ | 0 | $ | 0 | $ | 0 | ||||||||||
|
|
|
|
|
|
|
|
|
|
|
|||||||||||
| Total |
$ | 0 | $ | 0 | $ | 0 | $ | 0 | $ | 0 | ||||||||||
| RETIREMENT |
||||||||||||||||||||
| Call Option (1) |
$ | 0 | $ | 0 | $ | 0 | $ | 0 | $ | 0 | ||||||||||
|
|
|
|
|
|
|
|
|
|
|
|||||||||||
| Total |
$ | 0 | $ | 0 | $ | 0 | $ | 0 | $ | 0 | ||||||||||
| TERMINATION WITHOUT CAUSE, TERMINATION FOR “GOOD REASON” UNRELATED TO A “CHANGE IN CONTROL” |
| |||||||||||||||||||
| Annual Bonus (2) |
$ | 800,000 | $ | 125,000 | $ | 80,000 | $ | 350,000 | $ | 140,000 | ||||||||||
| Call Option (1) |
$ | 0 | $ | 0 | $ | 0 | $ | 0 | $ | 0 | ||||||||||
| Cash severance payment |
$ | 500,000 | $ | 275,000 | $ | 200,000 | $ | 461,261 | $ | 260,000 | ||||||||||
| Continued health care benefits |
$ | 9,119 | $ | 3,878 | $ | 9,119 | $ | 9,433 | $ | 8,520 | ||||||||||
|
|
|
|
|
|
|
|
|
|
|
|||||||||||
| Total |
$ | 1,309,119 | $ | 403,878 | $ | 289,119 | $ | 820,694 | $ | 408,520 | ||||||||||
| TERMINATION WITHOUT CAUSE, TERMINATION FOR “GOOD REASON” FOLLOWING A “CHANGE IN CONTROL” |
| |||||||||||||||||||
| Annual Bonus (3) |
$ | 800,000 | $ | 125,000 | $ | 80,000 | $ | 350,000 | $ | 140,000 | ||||||||||
| Call Option (1) |
$ | 0 | $ | 0 | $ | 0 | $ | 0 | $ | 0 | ||||||||||
| Cash severance payment (4) |
$ | 2,887,479 | $ | 720,629 | $ | 200,000 | $ | 1,572,514 | $ | 691,250 | ||||||||||
| Continued health care benefits |
$ | 9,119 | $ | 3,878 | $ | 9,119 | $ | 9,433 | $ | 8,520 | ||||||||||
|
|
|
|
|
|
|
|
|
|
|
|||||||||||
| Total |
$ | 3,696,598 | $ | 849,507 | $ | 289,119 | $ | 1,931,947 | $ | 839,770 | ||||||||||
| (1) | The Call Option has no value following the Restructuring. |
| (2) | This is the maximum amount based on the previous year’s bonus and is payable only if previously declared. |
| (3) | With respect to Mr. Reed, Ms. Janik, Mr. Davis and Ms. Sack, this is the maximum amount based on the previous year’s bonus and is subject to pro-ration for portion of the year elapsed. With respect to Mr. Maring, this is the maximum amount based on the previous year’s bonus and is payable only if previously declared. |
| (4) | With respect to Mr. Reed, Ms. Janik, Mr. Davis and Ms. Sack, the “cash severance payment” consists of a monthly payment for a specified period (27 months for our Chief Executive Officer, 24 months for our Chief Operating Officer, 21 months for our Chief Financial Officer and 21 months for our General Counsel) equal to the executive’s monthly base salary and average monthly bonus (the average of the last three annual cash bonuses divided by 12). With respect to Mr. Maring, the “cash severance payment” equals twelve (12) months’ current base salary. |
163
Table of Contents
| Item 12. | Security Ownership of Certain Beneficial Owners and Management and Related Stockholder Matters |
SECURITY OWNERSHIP OF CERTAIN BENEFICIAL OWNERS AND MANAGEMENT
The following table provides information with respect to the beneficial ownership of our Common Stock as of March 4, 2014 by (i) each person who is a beneficial owner of more than 5% of our outstanding Common Stock, (ii) each of our directors and our named executive officers, and (iii) all directors, director nominees and executive officers as a group.
On the Effective Date of the Plan, we were deemed to have issued and distributed 1,362,479 New Media Warrants. The New Media Warrants collectively represent the right to acquire New Media Common Stock, which in the aggregate was equal to 5% of New Media Common Stock as of the Effective Date (calculated prior to dilution from shares of New Media Common Stock issued pursuant to the Local Media Contribution) at a strike price of $46.35 calculated based on a total equity value of New Media prior to the Local Media Contribution of $1.2 billion. Former equity interests were cancelled under the Plan.
The following table sets forth information regarding ownership of our Common Stock as of March 4, 2014 (except as noted otherwise) by: (a) each of our directors and named executive officers, (b) each person or group known to us holding more than 5% of our Common Stock, and (c) all of our directors and executive officers as a group. Except as otherwise indicated, each owner has sole voting and investment powers with respect to the securities listed. The information provided in the table is based on our records, information filed with SEC and information provided to us, except where otherwise noted.
| Name and Address of Beneficial Owner / Named Executive Officers and Directors (1) |
Number of Shares Beneficially Owned |
Percentage of Class (2) | ||||||
| Wesley R. Edens (3)(6) |
792,411 | 2.64 | % | |||||
| Michael E. Reed (4) |
9,550 | * | % | |||||
| Kevin M. Sheehan (5) |
1,259 | * | % | |||||
| Theodore P. Janulis |
— | * | % | |||||
| Laurence Tarica |
— | * | % | |||||
| Kirk Davis (7) |
1,700 | * | % | |||||
| Gregory Freiberg |
— | * | % | |||||
| All directors, nominees and executive officers as a group (7 persons) |
804,920 | 2.68 | % | |||||
| Omega Advisors, Inc. and its affiliates (8) |
3,062,887 | 10.21 | % | |||||
| * | Denotes less than 1%. |
| (1) | The address of all of the officers and directors listed above are in the care of FIG LLC, 1345 Avenue of the Americas, 46th Floor, New York, New York 10105. |
| (2) | Percentages shown assume the exercise by such persons of all options and warrants to acquire shares of our Common Stock that are exercisable within 60 days of March 4, 2014 and no exercise by any other person. |
| (3) | Includes 200,246 shares of New Media Common Stock held by Mr. Edens, 74,872 shares of New Media Common Stock held by FOE I, which is an affiliate of our Manager and 517,293 shares of New Media Common Stock issuable upon exercise of the New Media Warrants held by FIF III Liberty Holdings LLC. Mr. Edens disclaims beneficial ownership of the shares of New Media common stock held by FOE I and the shares of New Media Common Stock issuable upon the exercise of the New Media Warrants held by FIF III Liberty Holdings LLC, except, in each case, to the extent of his pecuniary interest therein. Does not include 7,219 shares of New Media Common Stock held by a charitable trust of which Mr. Edens’s spouse is sole trustee, and Mr. Edens disclaims beneficial ownership of the shares of New Media Common Stock held by this charitable trust; does not include 7,219 shares of New Media Common Stock held by a charitable trust of which Mr. Edens is trustee, and Mr. Edens disclaims beneficial ownership of these shares of New Media Common Stock. |
164
Table of Contents
| (4) | Includes 9,550 shares of New Media Common Stock issuable upon exercise of the New Media Warrants. |
| (5) | Includes 1,259 shares of New Media Common Stock issuable upon exercise of the New Media Warrants. |
| (6) | Mr. Edens, as a beneficial owner of FOE I, may be considered to have, together with the other beneficial owners of FOE I, shared voting and investment power with respect to the shares of New Media Common Stock held by FOE I. |
| (7) | Includes 1,700 shares of New Media Common Stock issuable upon exercise of the New Media Warrants. |
| (8) | Based on information set forth in a Form 3 filed by Leon G. Cooperman on January 30, 2014. |
| Item 13. | Certain Relationships and Related Transactions, and Director Independence |
CERTAIN RELATIONSHIPS AND TRANSACTIONS WITH RELATED PERSONS,
AFFILIATES AND AFFILIATED ENTITIES
Our Board adopted written policies and procedures upon Listing regarding the approval of any “related person transaction,” which is any transaction or series of transactions in which we or any of our subsidiaries is or are to be a participant, the amount involved exceeds $120,000, and a “related person” (as defined under SEC rules) has a direct or indirect material interest. Under the policy, a related person would need to promptly disclose to the legal department of our Manager any proposed related person transaction and all material facts about the proposed transaction. The legal department would then assess and promptly communicate that information to our independent directors. Based on their consideration of all of the relevant facts and circumstances, our independent directors will decide whether or not to approve such transaction and will generally approve only those transactions that are in, or are not inconsistent with, the best interests of New Media, as determined by at least a majority of the independent directors acting with ordinary care and in good faith. If we become aware of an existing related person transaction that has not been pre-approved under this policy, the transaction will be referred to our independent directors, who will evaluate all options available, including ratification, revision or termination of such transaction. Our policy requires any director who may be interested in a related person transaction to recuse himself or herself from any consideration of such related person transaction.
Transactions between the Company and the Manager or any affiliate of the Manager must be approved in advance by the majority of the independent directors and be determined by such independent directors to be in the best interests of the Company. If any affiliate transaction involving the acquisition of an asset by the Company from the Manager or an affiliate of the Manager is not approved in advance by a majority of the independent directors, then the Manager may be required to repurchase the asset at the purchase price (plus closing costs) to the Company.
Management Agreement
On November 26, 2013, we entered into the Management Agreement with our Manager, as amended and restated, which provides for the day-to-day management of our operations. Our Management Agreement requires our Manager to manage our business affairs subject to the supervision of our Board of Directors. Our Manager is responsible for, among other things, (i) the purchase and sale of our investments, (ii) the financing of our investments, and (iii) investment advisory services. Our Manager is responsible for our day-to-day operations and will perform (or cause to be performed) such services and activities relating to our assets and operations as may be appropriate.
The Management Agreement has an initial three-year term and will be automatically renewed for one-year terms thereafter unless terminated pursuant to its terms.
Our Manager is (a) entitled to receive an annual management fee equal to 1.5% per annum of our Total Equity (as defined in the Management Agreement) and (b) eligible to receive on a quarterly basis annual
165
Table of Contents
incentive compensation in an amount equal to the product of 25% of the dollar amount by which (a) the adjusted net income (as defined in the Management Agreement) of the Company exceeds (b)(i) the weighted daily average Total Equity (plus cash capital raising costs), multiplied by (ii) a simple interest rate of 10% per annum. In addition, New Media is obligated to reimburse certain expenses incurred by the Manager in connection with the performance of its duties under the Management Agreement.
This description is a summary and is subject to, and qualified in its entirety by, the provisions of the Amended and Restated Management Agreement filed as an exhibit hereto.
GateHouse Management and Advisory Agreement
On November 26, 2013, New Media entered into the GateHouse Management and Advisory Agreement (the “GateHouse Management Agreement”) with GateHouse, pursuant to which New Media will manage the assets and the day-to-day operations of GateHouse. New Media will be responsible for, among other things (i) the purchase and sale of GateHouse’s investments (ii) the financing of GateHouse’s investments and (iii) investment advisory services. Such services may be performed by the Manager.
The GateHouse Management Agreement has an initial three-year term and will be automatically renewed for one-year terms thereafter unless terminated by New Media or Gate House. The GateHouse Management Agreement will automatically terminate if the Management Agreement between New Media and the Manager is terminated.
New Media is (a) entitled to receive a management fee equal to 1.50% per annum of GateHouse’s Total Equity (as defined in the GateHouse Management Agreement) and (b) eligible to receive incentive compensation that is based on GateHouse’s performance. In addition, GateHouse is obligated to reimburse certain expenses incurred by New Media in connection with the performance of its duties under the agreement. This description is a summary and is subject to, and qualified in its entirety by, the provisions of the GateHouse Management Agreement filed as an exhibit hereto.
Local Media Management and Advisory Agreement
GateHouse manages the assets of Local Media pursuant to a management and advisory agreement. The agreement has a two-year term, with automatic renewal for successive two-year periods unless terminated. While the agreement is in effect, GateHouse will receive an annual management fee of $1.1 million, subject to adjustments (up to a maximum annual management fee of $1.2 million), and an annual incentive compensation fee based on exceeding EBITDA targets of Local Media.
Registration Rights Agreement with Omega
New Media entered into a registration rights agreement with Omega Advisors, Inc. and its affiliates (collectively, “Omega”). Under the terms of the registration rights agreement, subject to customary exceptions and limitations, New Media will be required to use commercially reasonable efforts to file a registration statement (the “Registration Statement”) providing for the registration and sale by Omega of its New Media Common Stock acquired pursuant to the Plan (the “Registrable Securities”) as soon as reasonably practicable, but not prior to the earlier of (i) 120 days following the Effective Date and (ii) 14 days after the required financials are completed in the ordinary course of business. During the first 12 months following the Listing, subject to customary exceptions and limitations, Omega may request one demand right with respect to some or all of the Registrable Securities under the Registration Statement (the “Demand Registration”).
Once New Media is eligible to use Form S-3, New Media will be required to use commercially reasonable efforts to file a resale shelf registration statement providing for the registration and sale on a continuous or delayed basis by Omega of its Registrable Securities (the “Shelf Registration”), subject to customary exceptions and limitations. Omega is entitled to initiate up to three offerings or sales with respect to some or all of the Registrable Securities pursuant to the Shelf Registration.
166
Table of Contents
Omega may only exercise its right to request the Demand Registration and any Shelf Registrations if Registrable Securities to be sold pursuant to such Registration Statement or Shelf Registration are at least 3% of the then-outstanding New Media Common Stock. This description is a summary and is subject to, and qualified in its entirety by, the provisions of the Registration Rights Agreement filed as Exhibit 4.5 to our registration statement on Form S-1.
Director Independence
For a discussion regarding our director independence see Item 10 in this Annual Report.
| Item 14. | Principal Accounting Fees and Services |
Fees Paid to Ernst & Young
The following table sets forth the fees for services provided by Ernst & Young (“EY”) during the fiscal years ended December 29, 2013 and December 30, 2012, respectively.
| 2013(1) | 2012(2) | |||||||
| Audit Fees |
$ | 2,933 | $ | 871 | ||||
| Audit-Related Fees |
95 | — | ||||||
| Tax Fees |
— | — | ||||||
| All Other Fees |
— | — | ||||||
| Total |
$ | 3,028 | $ | 871 | ||||
| (1) | These amounts reflect fees paid by Predecessor and Successor. |
| (2) | These amounts reflect fees paid by Predecessor. |
The following is a description of the nature of the services comprising the fees disclosed in the table above for each of the four categories of services.
(a) Audit Fees. These are fees for professional services rendered by EY for: (1) our audit and the audit of our Predecessor, GateHouse’s annual consolidated financial statements; and (2) the review of financial statements included in GateHouse’s Quarterly Reports on Form 10-Q.
(b) Audit-Related Fees. Audit-related fees include assurance and related services rendered by EY that are reasonably related to the performance of the audit or the review of our financial statements that are not included as audit fees. These services consist of consultation on financial accounting and reporting and acquisition accounting.
(c) Tax Fees. For the fiscal years ending December 29, 2013 and December 30, 2012, no fees were incurred for these services. Tax fees would include professional services rendered by EY with respect to tax compliance (i.e. tax returns), tax advice and tax planning.
(d) All Other Fees. For the fiscal years ending December 29, 2013 and December 30, 2012, no other fees were incurred.
Audit Committee Pre-approval Policy
The Audit Committee is responsible for pre-approving all audit services and permitted non-audit services (including the fees and retention terms) to be performed for us by the independent registered public accounting firm prior to its engagement for such services. For each engagement, management provides the Audit Committee with information about the services and fees sufficiently detailed to allow the Audit Committee to make an informed judgment about the nature and scope of the services and the potential for the services to impair the independence of the auditor. After the end of the audit year, management provides the Audit Committee with a summary of the actual fees incurred for the completed audit year.
167
Table of Contents
| Item 15. | Exhibits and Financial Statement Schedules |
(a) Documents filed as part of this report:
| (1) | Financial Statements |
The financial statements required by this Item 15 are set forth in Part II, Item 8 of this report.
| (2) | Financial Statement Schedules |
Schedule II—Valuation and Qualifying Accounts.
New Media Investment Group Inc.
Valuation and Qualifying Accounts
(In Thousands)
| Description |
Balance at Beginning of Period |
Charges to Earnings |
Charges to Other Accounts |
Deductions | Balance at End of Period |
|||||||||||||||
| Allowance for doubtful accounts |
||||||||||||||||||||
| Two months ended December 29, 2013 |
$ | — | $ | 349 | $ | — | $ | — | $ | 349 | ||||||||||
| Ten months ended November 6, 2013 |
$ | 2,456 | $ | 1,635 | $ | — | $ | (186 | )(1) | $ | 3,905 | |||||||||
| Year ended December 30, 2012 |
$ | 2,976 | $ | 2,304 | $ | — | $ | (2,824 | )(1) | $ | 2,456 | |||||||||
| Year ended January 1, 2012 |
$ | 3,260 | $ | 3,093 | $ | — | $ | (3,377 | )(1) | $ | 2,976 | |||||||||
| Deferred tax valuation allowance |
||||||||||||||||||||
| Two months ended December 29, 2013 |
$ | 166,911 | $ | (2,142 | ) | $ | — | $ | — | $ | 164,769 | |||||||||
| Ten months ended November 6, 2013 |
$ | 444,590 | $ | (59,839 | ) | $ | (20,412 | )(2) | $ | (197,428 | )(3) | $ | 166,911 | |||||||
| Year ended December 30, 2012 |
$ | 432,954 | $ | 11,795 | $ | (159 | )(2) | $ | — | $ | 444,590 | |||||||||
| Year ended January 1, 2012 |
$ | 430,247 | $ | 6,551 | $ | (3,844 | )(2) | $ | — | $ | 432,954 | |||||||||
| (1) | Amounts are primarily related to the write off of fully reserved accounts receivable. |
| (2) | Amount is primarily related to the tax effects of the change in derivative value and is recorded in accumulated other comprehensive income (loss). |
| (3) | Amount primarily relates to the reduction of tax attributes related to the cancellation of indebtedness and other fresh start adjustments. |
All other schedules are omitted because the conditions requiring their filing do not exist, or because the required information is provided in the consolidated financial statements, including the notes thereto.
168
Table of Contents
(b) Exhibits. The following Exhibits are filed as a part of this report:
| Exhibit |
Description | |
| 2.1 | Share Purchase Agreement, dated as of January 28, 2007, by and among SureWest Communications, as Seller, SureWest Directories and GateHouse Media, Inc., as Purchaser (incorporated herein by reference to Exhibit 2.1 to GateHouse Media, Inc.’s Current Report on Form 8-K, filed March 1, 2007). | |
| 2.2 | Amended and Restated Asset Purchase Agreement, dated April 12, 2007, by and among Gannett Satellite Information Network, Inc., Gannett River States Publishing Corporation, Pacific and Southern Company, Inc., Federated Publications, Inc., Media West—GSI, Inc., Media West—GRS, Inc., as Sellers, and GateHouse Media Illinois Holdings, Inc., as Buyer, and GateHouse Media, Inc., as Buyer guarantor (incorporated herein by reference to Exhibit 2.1 to GateHouse Media, Inc’s Current Report on Form 8-K, filed May 8, 2007). | |
| 2.3 | Asset Purchase Agreement, dated April 12, 2007, by and among Gannett Satellite Information Network, Inc., Media West—GSI, Inc., as Sellers, GateHouse Media Illinois Holdings, Inc., as Buyer, and GateHouse Media, Inc., as Buyer guarantor (incorporated herein by reference to Exhibit 2.2 to GateHouse Media, Inc’s Current Report on Form 8-K, filed May 8, 2007). | |
| 2.4 | Stock Purchase Agreement dated as of June 28, 2013 by and among Dow Jones Ventures VII, Inc., Dow Jones Local Media Group, Inc., Newcastle Investment Corp. and Dow Jones & Company, Inc. (incorporated herein by reference to Exhibit 2.7 to New Media Investment Group Inc.’s Registration Statement on Form 10/A (File No. 001-36097), filed November 8, 2013). | |
| 2.5 | Debtors’ Joint Prepackaged Chapter 11 Plan (incorporated herein by reference to Exhibit 2.8 to New Media Investment Group Inc.’s Registration Statement on Form 10/A (File No. 001-36097), filed November 8, 2013). | |
| 2.6 | Debtors’ Findings of Fact and Conclusions of Law and Order Approving Debtors’ Disclosure Statement For, and Confirming, Debtors’ Joint Prepackaged Chapter 11 Plan (incorporated herein by reference to Exhibit 2.9 to New Media Investment Group Inc.’s Registration Statement on Form 10/A (File No. 001-36097), filed November 8, 2013). | |
| 3.1 | Amended and Restated Certificate of Incorporation of New Media Investment Group Inc. (incorporated herein by reference to Exhibit 3.1 to New Media Investment Group Inc.’s Registration Statement on Form S-1/A (Registration No. 333-192736), filed January 15, 2014). | |
| 3.2 | Amended and Restated Bylaws of New Media Investment Group Inc. (incorporated herein by reference to Exhibit 3.2 to New Media Investment Group Inc.’s Registration Statement on Form S-1/A (Registration No. 333-192736), filed January 15, 2014). | |
| 4.1 | Form of Registration Rights Agreement between New Media Investment Group Inc. and Omega Advisors, Inc. (incorporated herein by reference to Exhibit 4.5 to New Media Investment Group Inc.’s Registration Statement on Form 10/A (File No. 001-36097), filed November 8, 2013). | |
| 4.2 | Global Warrant Certificate of New Media Investment Group Inc. (included in Exhibit 10.20). | |
| 4.3 | Global Warrant Certificate of New Media Investment Group Inc. (amended) (included in Exhibit 10.28). | |
| *10.1 | GateHouse Media, Inc. Omnibus Stock Incentive Plan (incorporated herein by reference to Exhibit 10.1 to GateHouse Media, Inc.’s Registration Statement on Form S-1/A (Registration No. 333-135944), filed October 11, 2006). | |
| *10.2 | Form of Restricted Share Award Agreement under the GateHouse Media, Inc. Omnibus Stock Incentive Plan (three-year vesting) (incorporated herein by reference to Exhibit 10.2 to GateHouse Media, Inc.’s Annual Report on Form 10-K, filed March 17, 2008). | |
169
Table of Contents
| Exhibit |
Description | |
| *10.3 | Form of Restricted Share Award Agreement under the GateHouse Media, Inc. Omnibus Stock Incentive Plan (April 15, 2008 vesting) (incorporated herein by reference to Exhibit 10.3 to GateHouse Media, Inc.’s Annual Report on Form 10-K, filed March 17, 2008). | |
| *10.4 | Liberty Group Publishing, Inc. Publisher’s Deferred Compensation Plan (incorporated herein by reference to Exhibit 10.2 to GateHouse Media, Inc’s Registration Statement on Form S-1 (Registration No. 333-135944), filed July 21, 2006). | |
| *10.5 | Liberty Group Publishing, Inc. Executive Benefit Plan (incorporated herein by reference to Exhibit 10.3 to GateHouse Media, Inc’s Registration Statement on Form S-1 (Registration No. 333-135944), filed July 21, 2006). | |
| *10.6 | Liberty Group Publishing, Inc. Executive Deferral Plan (incorporated herein by reference to Exhibit 10.4 to GateHouse Media, Inc’s Registration Statement on Form S-1 (Registration No. 333-135944), filed July 21, 2006). | |
| *10.7 | Employment Agreement, dated as of January 3, 2006, by and among Liberty Group Publishing, Inc., Liberty Group Operating, Inc. and Michael E. Reed (incorporated herein by reference to Exhibit 10.8 to GateHouse Media, Inc’s Registration Statement on Form S-1 (Registration No. 333-135944), filed July 21, 2006). | |
| *10.8 | Employment Agreement, dated as of May 1, 2006, by and among GateHouse Media, Inc., GateHouse Media Operating, Inc. and Polly G. Sack (incorporated herein by reference to Exhibit 10.12 to GateHouse Media, Inc’s Registration Statement on Form S-1 (Registration No. 333-135944), filed July 21, 2006). | |
| *10.9 | Management Stockholder Agreement, dated as of January 29, 2006, by and between Liberty Group Publishing, Inc., FIF III Liberty Holdings LLC and Michael E. Reed (incorporated herein by reference to Exhibit 10.13 to GateHouse Media, Inc’s Registration Statement on Form S-1 (Registration No. 333-135944), filed July 21, 2006). | |
| *10.10 | Management Stockholder Agreement, dated as of May 17, 2006, by and between GateHouse Media, Inc., FIF III Liberty Holdings LLC and Polly G. Sack (incorporated herein by reference to Exhibit 10.19 to GateHouse Media, Inc’s Registration Statement on Form S-1 (Registration No. 333-135944), filed July 21, 2006). | |
| 10.11 | Form of Indemnification Agreement to be entered into by New Media Investment Group Inc. with each of its executive officers and directors (incorporated herein by reference to Exhibit 10.11 to New Media Investment Group Inc.’s Registration Statement on Form 10/A (File No. 001-36097), filed November 8, 2013). | |
| 10.12 | License Agreement, dated as of February 28, 2007, by and between SureWest Communications and GateHouse Media, Inc. (incorporated herein by reference to Exhibit 10.1 to GateHouse Media, Inc.’s Current Report on Form 8-K (Items 1.01, 2.01, and 9.01), filed March 1, 2007). | |
| 10.13 | Amended and Restated Credit Agreement, dated as of February 27, 2007, among GateHouse Media Holdco, Inc., as Holdco, GateHouse Media Operating, Inc., as the Company, GateHouse Media Massachusetts I, Inc., GateHouse Media Massachusetts II, Inc., and ENHE Acquisition, LLC, as Subsidiary Borrowers, the Domestic Subsidiaries of Holdco from time to time Parties thereto, as Guarantors, the Lenders Parties thereto, Goldman Sachs Credit Partners L.P., as Syndication Agent, Morgan Stanley Senior Funding, Inc., and BMO Capital Markets Financing, Inc., as co-documentation Agents and Cortland Products Corp., as successor to Wells Fargo Bank, as Administrative Agent, Wachovia Capital Markets, LLC, as Goldman Sachs Credit Partners, L.P., General Electric Capital Corporation and Morgan Stanley Senior Funding, Inc., as Joint Lead Arrangers and Joint Book Runners (incorporated herein by reference to Exhibit 10.1 to GateHouse Media, Inc.’s Current Report on Form 8-K (Items 1.01, 2.03, and 9.01), filed March 1, 2007). | |
170
Table of Contents
| Exhibit |
Description | |
| 10.14 | Amended and Restated Security Agreement, dated as of February 28, 2007, among GateHouse Media Holdco, Inc., as Holdco, GateHouse Media Operating, Inc., as the Company, GateHouse Media Massachusetts I, Inc., GateHouse Media Massachusetts II, Inc., and ENHE Acquisition, LLC, as Subsidiary Borrowers, the Domestic Subsidiaries of Holdco from time to time Parties thereto, as Guarantors, and Wells Fargo Bank, as Administrative Agent, Wachovia Capital Markets, LLC, as Goldman Sachs Credit Partners, L.P., General Electric Capital Corporation and Morgan Stanley Senior Funding, Inc., as Joint Lead Arrangers and Joint Book Runners (incorporated herein by reference to Exhibit 10.2 to GateHouse Media, Inc.’s Current Report on Form 8-K (Items 1.01, 2.03, and 9.01), filed March 1, 2007). | |
| 10.15 | Amended and Restated Pledge Agreement, dated as of February 28, 2007, among GateHouse Media Holdco, Inc., as Holdco, GateHouse Media Operating, Inc., as the Company, GateHouse Media Massachusetts I, Inc., GateHouse Media Massachusetts II, Inc., and ENHE Acquisition, LLC, as Subsidiary Borrowers, the Domestic Subsidiaries of Holdco from time to time Parties thereto, as Guarantors, and Wells Fargo Bank, as Administrative Agent, for the several banks and other financial institutions as may from time to time becomes parties to such Credit Agreement (incorporated herein by reference to Exhibit 10.3 to GateHouse Media, Inc.’s Current Report on Form 8-K (Items 1.01, 2.03, and 9.01), filed March 1, 2007). | |
| 10.16 | First Amendment to Amended and Restated Credit Agreement, dated as of May 7, 2007, by and among GateHouse Media Holdco, Inc., as Holdco, GateHouse Media Operating, Inc., as the Company, GateHouse Media Massachusetts I, Inc., GateHouse Media Massachusetts II, Inc. and ENHE Acquisition, LLC, as Subsidiary Borrowers, the Domestic Subsidiaries of Holdco from time to time Parties thereto, as Guarantors, the Lenders Parties thereto, and Wells Fargo Bank, as Administrative Agent (incorporated herein by reference to Exhibit 99.1 to GateHouse Media, Inc.’s Current Report on Form 8-K, filed May 11, 2007). | |
| 10.17 | Second Amendment to Amended and Restated Credit Agreement, dated as of February 3, 2009, by and among GateHouse Media Holdco, Inc., as Holdco, GateHouse Media Operating, Inc., as the Company, GateHouse Media Massachusetts I, Inc., GateHouse Media Massachusetts II, Inc. and ENHE Acquisition, LLC, as Subsidiary Borrowers, the Domestic Subsidiaries of Holdco from time to time Parties thereto, as Guarantors, the Lenders Parties thereto, and Wells Fargo Bank, as Administrative Agent (incorporated herein by reference to Exhibit 99.1 to GateHouse Media, Inc.’s Current Report on Form 8-K, filed February 5, 2009). | |
| *10.18 | Offer letter dated December 23, 2008, between GateHouse Media, Inc., and Melinda A. Janik (incorporated herein by reference to Exhibit 10.23 to GateHouse Media, Inc.’s Annual Report on Form 10-K, filed March 13, 2009). | |
| *10.19 | Employment Agreement dated as of January 9, 2009, by and among GateHouse Media, Inc., GateHouse Media Operating Inc., and Kirk Davis (incorporated herein by reference to Exhibit 10.1 to GateHouse Media, Inc.’s Current Report on Form 8-K, filed January 9, 2009). | |
| *10.20 | Offer letter dated February 4, 2008, between GateHouse Media, Inc., and Mark Maring (incorporated herein by reference to Exhibit 10.1 to GateHouse Media, Inc.’s Quarterly Report on Form 10-Q for the period ended September 30, 2008, filed November 7, 2008). | |
| *10.21 | Form of amendment to Employment Agreement for Michael E. Reed (incorporated herein by reference to Exhibit 10.22 to GateHouse Media, Inc.’s Annual Report on Form 10-K, filed March 8, 2012). | |
| *10.22 | Form of amendment to Employment Agreement for Kirk Davis (incorporated herein by reference to Exhibit 10.23 to GateHouse Media, Inc.’s Annual Report on Form 10-K, filed March 8, 2012). | |
| *10.23 | Form of Employment Agreement by and among GateHouse Media, Inc., GateHouse Operating, Inc. and Melinda A. Janik (incorporated herein by reference to Exhibit 10.24 to GateHouse Media, Inc.’s Annual Report on Form 10-K, filed March 8, 2012). | |
171
Table of Contents
| Exhibit |
Description | |
| *10.24 | Form of amendment to Employment Agreement for Polly G. Sack (incorporated herein by reference to Exhibit 10.25 to GateHouse Media, Inc.’s Annual Report on Form 10-K, filed March 8, 2012). | |
| 10.25 | Agency Succession and Amendment Agreement, dated as of March 30, 2011 by and among GateHouse Media Holdco, Inc., GateHouse Media Operating, Inc., GateHouse Media Massachusetts I, Inc., GateHouse Media Massachusetts II, Inc., ENHE Acquisition, LLC, each of those domestic subsidiaries of Holdco identified as a “Guarantor” on the signature pages of the Credit Agreement, Wells Fargo Bank, N.A., successor-by-merger to Wachovia Bank, National Association, as the resigning Administrative Agent, and the Successor Agent (incorporated herein by reference to Exhibit 99.1 to GateHouse Media, Inc.’s Current Report on Form 8-K, filed April 7, 2011). | |
| 10.26 | Credit Amendment, dated as of September 3, 2013, by and among GateHouse Media Holdco, Inc. (“Holdco”), GateHouse Media Operating, Inc., GateHouse Media Massachusetts I, Inc., GateHouse Media Massachusetts II, Inc. and ENHE Acquisition, LLC, those subsidiaries of Holdco party hereto as Guarantors and the Required Lenders party hereto (incorporated herein by reference to Exhibit 4.3 to GateHouse Media, Inc’s Current Report on Form 8-K, filed September 11, 2013). | |
| 10.27 | Warrant Agreement dated as of November 26, 2013 between New Media Investment Group Inc. and American Stock Transfer & Trust Company, LLC (incorporated herein by reference to Exhibit 10.27 to New Media Investment Group Inc.’s Registration Statement on Form S-1 (Registration No. 333-192736), filed December 10, 2013). | |
| 10.28 | Form of Management Agreement between New Media Investment Group Inc. and FIG LLC (incorporated herein by reference to Exhibit 10.28 to New Media Investment Group Inc.’s Registration Statement on Form 10 (File No. 001-36097), filed September 27, 2013). | |
| 10.29 | Contribution Agreement dated November 26, 2013 between Newcastle Investment Corp. and New Media Investment Group Inc. (incorporated herein by reference to Exhibit 10.29 to New Media Investment Group Inc.’s Registration Statement on Form S-1 (Registration No. 333-192736), filed December 10, 2013). | |
| 10.30 | Form of Cooperation Agreement between Newcastle Investment Corp. and New Media Investment Group Inc. (incorporated herein by reference to Exhibit 10.30 to New Media Investment Group Inc.’s Registration Statement on Form 10/A (File No. 001-36097), filed November 8, 2013). | |
| 10.31 | Form of Assignment Agreement between Newcastle Investment Corp. and New Media Investment Group Inc. (incorporated herein by reference to Exhibit 10.31 to New Media Investment Group Inc.’s Registration Statement on Form 10/A (File No. 001-36097), filed November 8, 2013). | |
| 10.32 | Revolving Credit, Term Loan and Security Agreement, dated as of November 26, 2013 by and among GateHouse Media, Inc., GateHouse Media Intermediate Holdco, Inc., certain wholly-owned subsidiaries of GateHouse Media Intermediate Holdco, Inc., PNC Bank, National Association, as the administrative agent, Crystal Financial LLC, as term loan B agent, and each of the lenders party thereto (incorporated herein by reference to Exhibit 10.33 to New Media Investment Group Inc.’s Registration Statement on Form S-1 (Registration No. 333-192736), filed December 10, 2013). | |
| 10.33 | Term Loan and Security Agreement dated November 26, 2013 by and among GateHouse Media, Inc., GateHouse Media Intermediate Holdco Inc., certain wholly-owned subsidiaries of GateHouse Media Intermediate Holdco, Inc., Mutual Quest Fund and each of the lenders party thereto (incorporated herein by reference to Exhibit 10.34 to New Media Investment Group Inc.’s Registration Statement on Form S-1 (Registration No. 333-192736), filed December 10, 2013). | |
| *10.34 | New Media Investment Group Inc. Nonqualified Stock Option and Incentive Award Plan (incorporated herein by reference to Exhibit 10.1 to New Media Investment Group Inc.’s Current Report on Form 8-K, filed February 7, 2014). | |
172
Table of Contents
| Exhibit |
Description | |
| 10.35 | Amended and Restated Warrant Agreement dated January 15, 2014 between New Media Investment Group Inc. and American Stock & Transfer Company, LLC (incorporated herein by reference to Exhibit 10.37 to New Media Investment Group Inc.’s Registration Statement on Form S-1/A (Registration No. 333-192736), filed January 28, 2014). | |
| *10.36 | Form of New Media Investment Group Inc. Non-Officer Director Restricted Stock Grant Agreement (incorporated herein by reference to Exhibit 10.2 to New Media Investment Group Inc.’s Current Report on Form 8-K, filed February 7, 2014). | |
| 10.37 | Amended and Restated Management Agreement, dated as of February 14, 2014, between New Media Investment Group Inc. and FIG LLC (included herewith). | |
| *10.38 | Form of Nonqualified Stock Option Agreement between New Media Investment Group Inc. and Fortress Operating Entity I LP (included herewith) | |
| *10.39 | Form of Tandem Award Agreement between New Media Investment Group Inc. and FIG LLC (included herewith) | |
| 21 | Subsidiaries of New Media Investment Group Inc. (included herewith). | |
| 31.1 | Rule 13a-14(a)/15d-14(d) Certification of Principal Executive Officer under the Securities Exchange Act of 1934 (included herewith). | |
| 31.2 | Rule 13a-14(a)/15d-14(d) Certification of Principal Financial Officer under the Securities Exchange Act of 1934 (included herewith). | |
| 32.1 | Section 1350 Certification (included herewith). | |
| 32.2 | Section 1350 Certification (included herewith). | |
| * | Asterisks identify management contracts and compensatory plans or arrangements. |
173
Table of Contents
SIGNATURES
Pursuant to the requirements of Section 13 or 15(d) of the Securities Exchange Act of 1934, the Registrant has duly caused this report to be signed on its behalf by the undersigned, thereunto duly authorized.
| NEW MEDIA INVESTMENT GROUP INC. | ||
| By: | /s/ MICHAEL E. REED | |
| Michael E. Reed Chief Executive Officer | ||
March 19, 2014
Pursuant to the requirements of the Securities Exchange Act of 1934, this report has been signed below by the following persons on behalf of the Registrant and in the capacities and on the dates indicated.
| Signature |
Title |
Date | ||
| /s/ WESLEY R. EDENS Wesley R. Edens |
Chairman of the Board | March 19, 2014 | ||
| /s/ MICHAEL E. REED Michael E. Reed |
Chief Executive Officer and Director (Principal Executive Officer) |
March 19, 2014 | ||
| /s/ GREGORY W. FREIBERG Gregory W. Freiberg |
Chief Financial Officer and Chief Accounting Officer (Principal Financial and Accounting Officer) |
March 19, 2014 | ||
| /s/ KEVIN M. SHEEHAN Kevin M. Sheehan |
Director | March 19, 2014 | ||
| /s/ THEODORE P. JANULIS Theodore P. Janulis |
Director | March 19, 2014 | ||
| /s/ LAURENCE TARICA Laurence Tarica |
Director | March 19, 2014 | ||
174