Attached files
| file | filename |
|---|---|
| EX-99.1 - EXHIBIT 99.1 - CLARIVATE Plc | tm2116608d1_ex99-1.htm |
| EX-10.2 - EXHIBIT 10.2 - CLARIVATE Plc | tm2116608d1_ex10-2.htm |
| EX-10.1 - EXHIBIT 10.1 - CLARIVATE Plc | tm2116608d1_ex10-1.htm |
| EX-2.1 - EXHIBIT 2.1 - CLARIVATE Plc | tm2116608d1_ex2-1.htm |
| 8-K - 8-K - CLARIVATE Plc | tm2116608d1_8k.htm |
Exhibit 99.2

Clarivate to Acquire May 17, 2021 Creating a Global Leader in Academic and Research Content and Software Solutions
Forward - Looking Statements These materials contain “forward - looking statements” as defined in the Private Securities Litigation Reform Act of 1995 . Forward - looking statements are neither historical facts nor assurances of future performance . Instead, they are based only on management’s current beliefs, expectations, and assumptions regarding the future of our business, future plans and strategies, projections, outlook, anticipated cost savings, anticipated events and trends, the economy, and other future conditions . Because forward - looking statements relate to the future, they are difficult to predict, and many are outside of our control . Important factors that could cause our actual results and financial condition to differ materially from those indicated in the forward - looking statements include those factors discussed under the caption “Risk Factors” in Amendment No . 1 to our 2020 annual report on Form 10 - K and our other filings with the U . S . Securities and Exchange Commission (“SEC”) . However, those factors should not be considered to be a complete statement of all potential risks and uncertainties . Forward - looking statements are based only on information currently available to our management and speak only as of the date of this press release . We do not assume any obligation to publicly provide revisions or updates to any forward - looking statements, whether as a result of new information, future developments or otherwise, should circumstances change, except as otherwise required by securities and other applicable laws . Please consult our public filings with the SEC or on our website at www . clarivate . com . Non - GAAP Financial Measures The non - GAAP financial measures discussed herein are not recognized terms under, and should not be considered as a substitute for, financial measures calculated in accordance with U . S . generally accepted accounting principles (“GAAP”) . Our definitions of and method of calculating non - GAAP financial measures may vary from the definitions and methods used by other companies, which may limit their usefulness as a comparative measure . Our presentation of non - GAAP financial measures should not be construed as an inference that our future results will be unaffected by any of the adjusted items, or that our projections and estimates will be realized in their entirety or at all . In addition, because of these limitations, non - GAAP financial measures should not be considered as measures of liquidity or discretionary cash available to us to fund our cash needs, including investing in the growth of our business and meeting our obligations . See the Appendix for definitions of the non - GAAP measures used herein and a reconciliation to the most directly comparable GAAP measures . Combined Financial Presentation In this presentation, we present certain estimated combined financial information for the combined business . Such financial information is presented for illustrative purposes only based on historical FY 2020 financial statements of Clarivate and ProQuest, as well as additional adjustments to reflect the full year impact of Clarivate's acquisitions and divestitures, including DRG, CPA Global and Techstreet, but does not reflect all of the adjustments that would be required to be presented in order for such combined financial information to comply with Article 11 of Regulation S - X . Our combined financial information may differ materially from our actual combined results, and such differences may be material . You should not place undue reliance on our estimated combined financial information as an indication of how we would have performed as a combined business in FY 2020 , or what our results of operations will be for any future period . 2

I. Transaction Overview
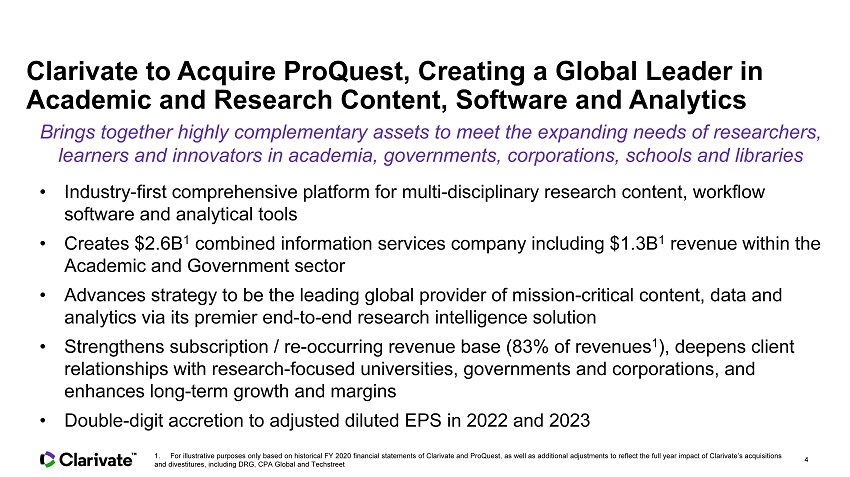
Clarivate to Acquire ProQuest, Creating a Global Leader in Academic and Research Content, Software and Analytics Brings together highly complementary assets to meet the expanding needs of researchers, learners and innovators in academia, governments, corporations, schools and libraries • Industry - first comprehensive platform for multi - disciplinary research content, workflow software and analytical tools • Creates $2.6B 1 combined information services company including $1.3B 1 revenue within the Academic and Government sector • Advances strategy to be the leading global provider of mission - critical content, data and analytics via its premier end - to - end research intelligence solution • Strengthens subscription / re - occur r ing revenue base (83% of revenues 1 ), deepens client relationships with research - focused universities , governments and corporations, and enhances long - term growth and margins • Double - digit accretion to adjusted diluted EPS in 2022 and 2023 1 . For illustrative purposes only based on historical FY 2020 financial statements of Clarivate and ProQuest, as well as additio na l adjustments to reflect the full year impact of Clarivate’s acquisitions and divestitures, including DRG, CPA Global and Techstreet 4
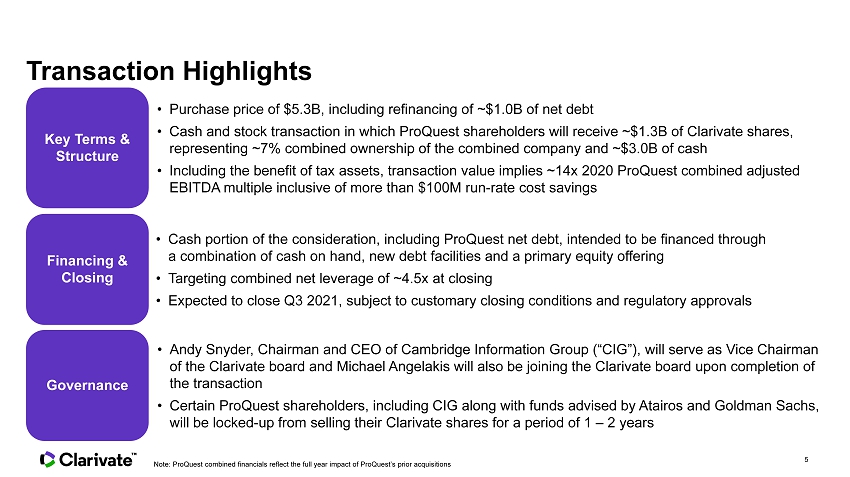
Transaction Highlights Key Terms & Structure • Purchase price of $5.3B, including refinancing of ~$1.0B of net debt • Cash and stock transaction in which ProQuest shareholders will receive ~$1.3B of Clarivate shares, representing ~7% combined ownership of the combined company and ~$ 3 .0B of cash • Including the benefit of tax assets, transaction value implies ~14x 2020 ProQuest combined adjusted EBITDA multiple inclusive of more than $100M run - rate cost savings Financing & Closing • Cash portion of the consideration, including ProQuest net debt, intended to be financed through a combination of cash on hand, new debt facilities and a primary equity offering • Targeting combined net leverage of ~4.5x at closing • Expected to close Q3 2021, subject to customary closing conditions and regulatory approvals Governance • And y Snyder, Chairman and CEO of Cambridge Information Group (“CIG”), will serve as Vice Chairman of the Clarivate board and Michael Angel a kis will also be joining the Clarivate board upon completion of the transaction • Certain ProQuest shareholders, including CIG along with funds advised by Atairos and Goldman Sachs, will be locked - up from selling their Clarivate shares for a period of 1 – 2 years Note: ProQuest combined financials reflect the full year impact of ProQuest’s prior acquisitions 5
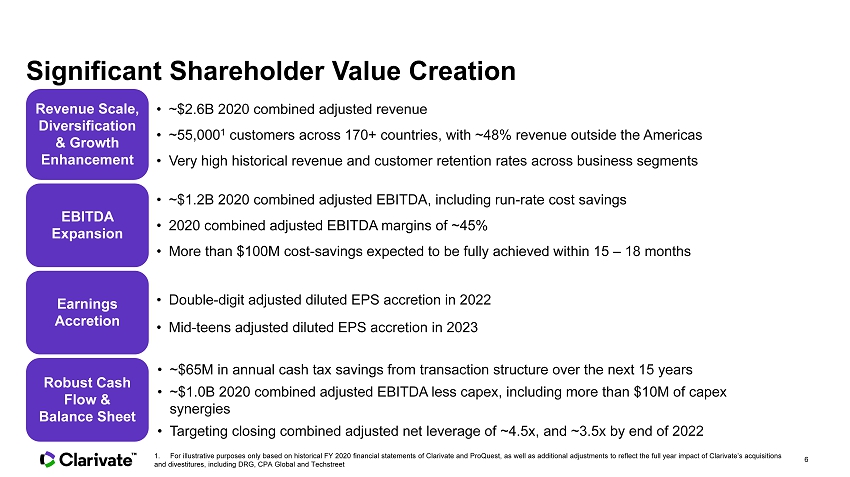
Significant Shareholder Value Creation Revenue Scale, Diversification & Growth Enhancement EBITDA Expansion Earnings Accretion Robust Cash Flow & Balance Sheet • ~$1. 2 B 2020 combined adjusted EBITDA, including run - rate cost savings • 2020 combined adjusted EBITDA margins of ~45% • More than $100M cost - savings expected to be fully achieved within 15 – 18 months • Double - digit ad justed diluted EPS accretion in 2022 • Mid - teens adjusted diluted EPS accretion in 2023 • ~$65M in annual cash tax savings from transaction structure over the next 15 years • ~$1.0B 2020 combined adjusted EBITDA less capex, including more than $10M of capex synergies • Targeting closing combined adjusted net leverage of ~4.5x, and ~3.5x by end of 2022 • ~$2.6B 2020 combined adjusted revenue • ~55,000 1 customers across 170+ countries, with ~48% revenue outside the Americas • Very high historical revenue and customer retention rates across business segments 1 . For illustrative purposes only based on historical FY 2020 financial statements of Clarivate and ProQuest, as well as additio nal adjustments to reflect the full year impact of Clarivate’s acquisitions and divestitures, including DRG, CPA Global and Techstreet 6
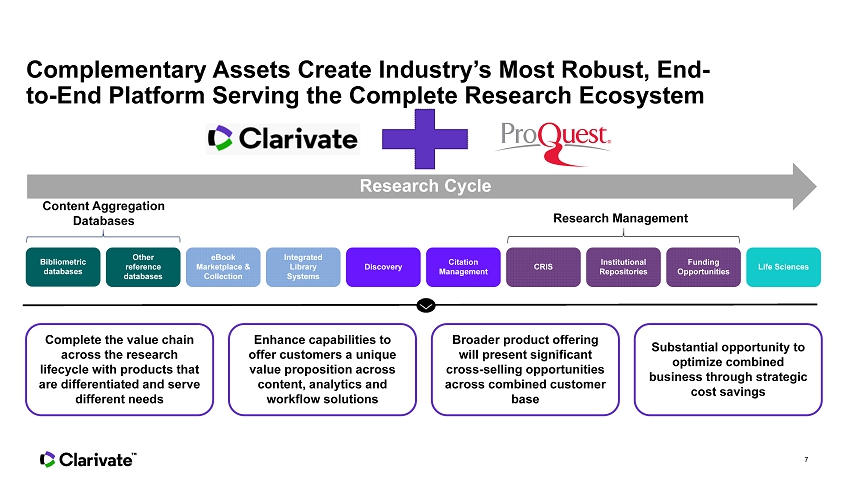
Complementary Assets Create Industry’s Most Robust, End - to - End Platform Serving the Complete Research Ecosystem Bibliometric databases Other reference databases eBook Marketplace & Collection Integrated Library Systems Discovery Citation Management CRIS Institutional Repositories Funding Opportunities Content Aggregation Databases Research Management Life Sciences Research Cycle Complete the value chain across the research lifecycle with products that are differentiated and serve different needs Enhance capabilities to offer customers a unique value proposition across content, analytics and workflow solutions Broader product offering will present significant cross - selling opportunities across combined customer base Substantial opportunity to optimize combined business through strategic cost savings 7

II. ProQuest Overview
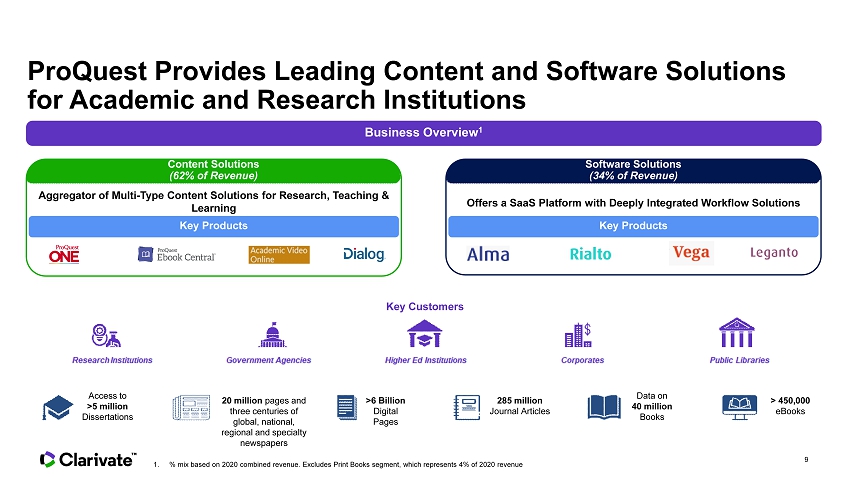
ProQuest Provides Leading Content and Software Solutions for Academic and Research Institutions 1. % mix based on 2020 combined revenue. Excludes Print Books segment, which represents 4% of 2020 revenue Access to >5 million Dissertations 20 million pages and three centuries of global, national, regional and specialty newspapers >6 Billion Digital Pages 285 million Journal Articles Data on 40 million Books > 450,000 eBooks Business Overview 1 Offers a SaaS Platform with Deeply Integrated Workflow Solutions Aggregator of Multi - Type Content Solutions for Research, Teaching & Learning Key Customers Key Products Key Products Content Solutions (62% of Revenue) Software Solutions (34% of Revenue) 9
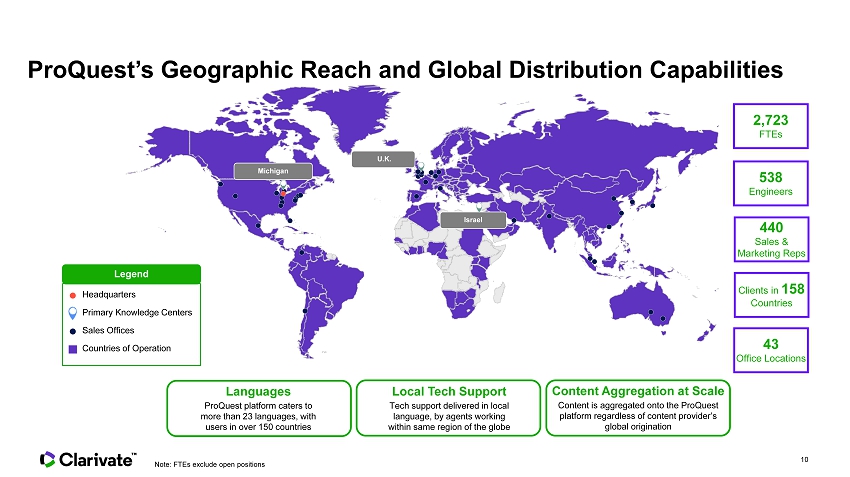
ProQuest’s Geographic Reach and Global Distribution Capabilities Legend Headquarters Sales Offices Countries of Operation Primary Knowledge Centers Michigan U.K. Israel 43 Office Locations 2,723 FTEs 538 Engineers 440 Sales & Marketing Reps Clients in 158 Countries Languages ProQuest platform caters to more than 23 languages, with users in over 150 countries Local Tech Support Tech support delivered in local language, by agents working within same region of the globe Content Aggregation at Scale Content is aggregated onto the ProQuest platform regardless of content provider’s global origination Note: FTEs exclude open positions 10
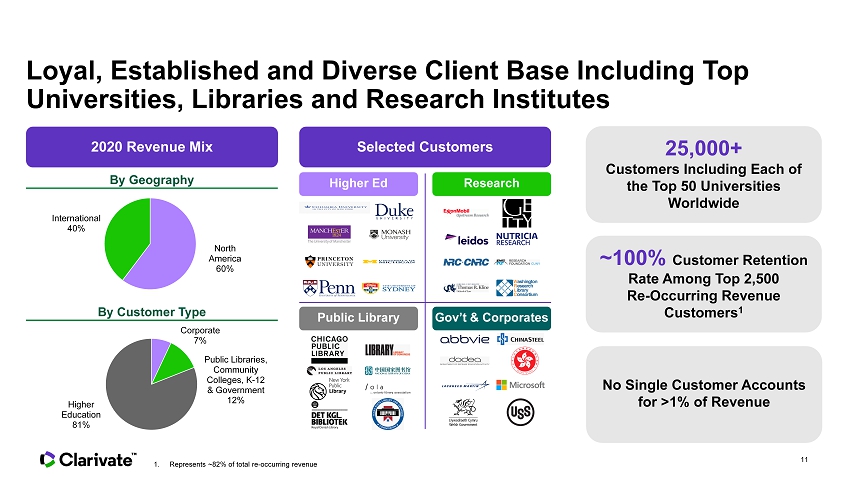
Loyal, Established and Diverse Client Base Including Top Universities, Libraries and Research Institutes 1. Represents ~82% of total re - oc curring revenue Selected Customers 25,000+ Customers Including Each of the Top 50 Universities Worldwide ~100% Customer Retention Rate Among Top 2,500 Re - Occurring Revenue Customers 1 No Single Customer Accounts for >1% of Revenue Higher Ed Research Public Library Gov’t & Corporates By Geography By Customer Type 11 2020 Revenue Mix North America 60% International 40% Corporate 7% Public Libraries, Community Colleges, K - 12 & Government 12% Higher Education 81%
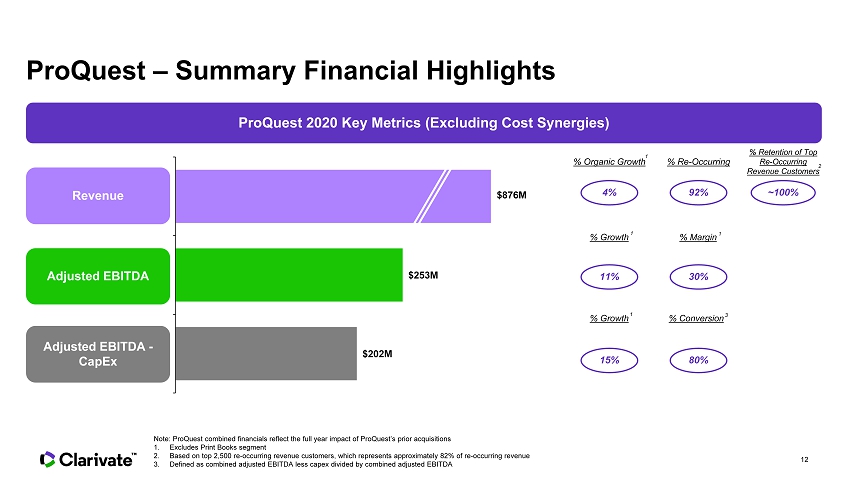
ProQuest – Summary Financial Highlights Note: ProQuest combined financials reflect the full year impact of ProQuest’s prior acquisitions 1. Excludes Print Books segment 2. Based on top 2,500 re - oc curring revenue customers, which represents approximately 82% of re - oc curring revenue 3. Defined as combined adjusted EBITDA less capex divided by combined adjusted EBITDA 4% % Organic Growth 1 ProQuest 2020 Key Metrics (Excluding Cost Synergies) % Re - Occurring % Retention of Top Re - Oc curring Revenue Customers 2 % Growth 1 % Margin 1 % Growth 1 % Conversion 92% ~100% 30% 11% 80% 15% 3 12 $202M $253M Pro Forma Adjusted EBITDA - Capex Pro Forma Adjusted EBITDA Pro Forma Revenue $876M Revenue Adjusted EBITDA Adjusted EBITDA - CapEx

III. Combined Business Highlights
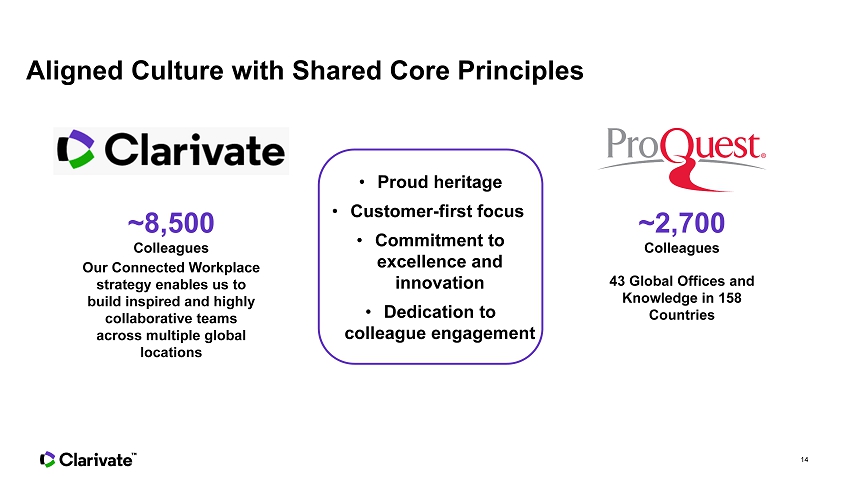
Aligned Culture with Shared Core Principles • Proud heritage • Customer - first focus • Commitment to excellence and innovation • Dedication to colleague engagement ~2,700 Colleagues ~8,500 Colleagues Our Connected Workplace strategy enables us to build inspired and highly collaborative teams across multiple global locations 43 Global Offices and Knowledge in 158 Countries 14
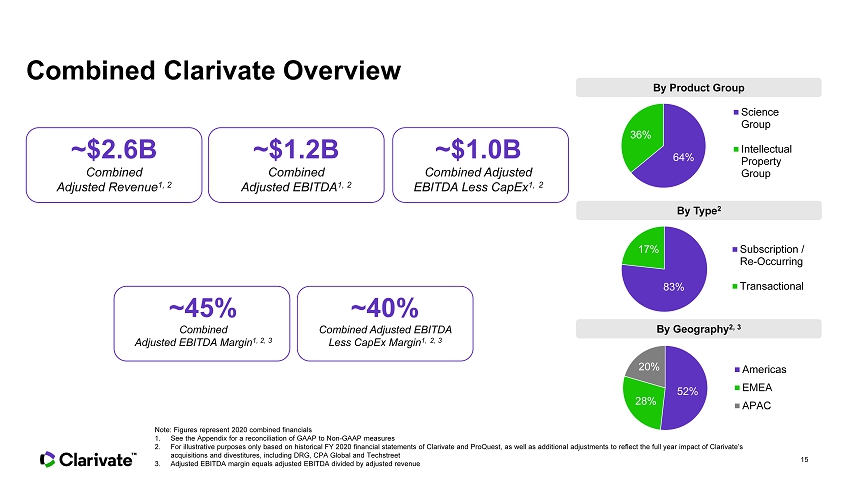
Combined Clarivate Overview Note: Figures represent 2020 combined financials 1. See the Appendix for a reconciliation of GAAP to Non - GAAP measures 2. For illustrative purposes only based on historical FY 2020 financial statements of Clarivate and ProQuest, as well as additio nal adjustments to reflect the full year impact of Clarivate’s acquisitions and divestitures, including DRG, CPA Global and Techstreet 3. Adjusted EBITDA margin equals adjusted EBITDA divided by adjusted revenue ~$2.6B Combined Adjusted Revenue 1, 2 ~$1. 2 B Combined Adjusted EBITDA 1, 2 ~$1.0B Combined Adjusted EBITDA Less CapEx 1, 2 ~45% Combined Adjusted EBITDA Margin 1, 2, 3 ~40% Combined Adjusted EBITDA Less CapEx Margin 1, 2, 3 15 64% 36% Science Group Intellectual Property Group By Product Group By Type 2 By Geography 2, 3 83% 17% Subscription / Re-Occurring Transactional 52% 28% 20% Americas EMEA APAC
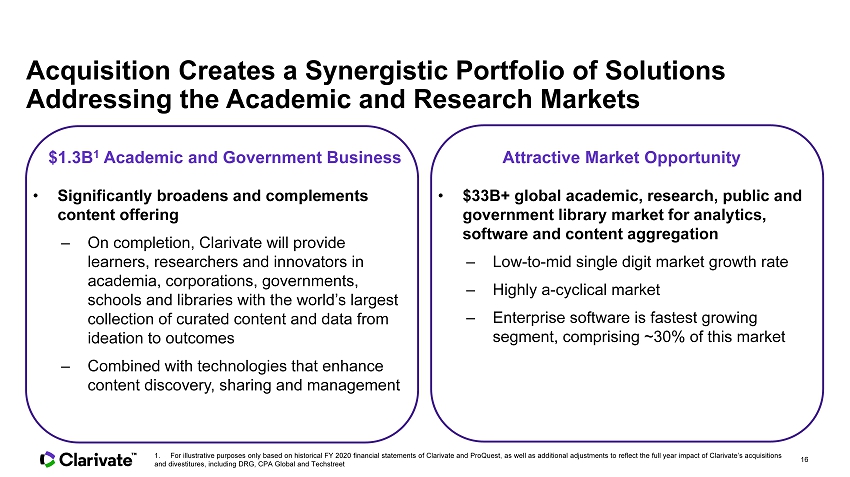
Acquisition Creates a Synergistic Portfolio of Solutions Addressing the Academic and Research Markets • Significantly broadens and complements content offering – On completion, Clarivate will provide learners, researchers and innovators in academia, corporations, governments, schools and libraries with the world’s largest collection of curated content and data from ideation to outcomes – Combined with technologies that enhance content discovery, sharing and management $1.3B 1 Academic and Government Business Attractive Market Opportunity • $ 33 B+ global academic , research , public and government library market for analytics, software and content aggregation – Low - to - mid single digit market growth rate – Highly a - cyclical market – Enterprise software is fastest growing segment, comprising ~30% of this market 16 1 . For illustrative purposes only based on historical FY 2020 financial statements of Clarivate and ProQuest, as well as additio na l adjustments to reflect the full year impact of Clarivate’s acquisitions and divestitures, including DRG, CPA Global and Techstreet
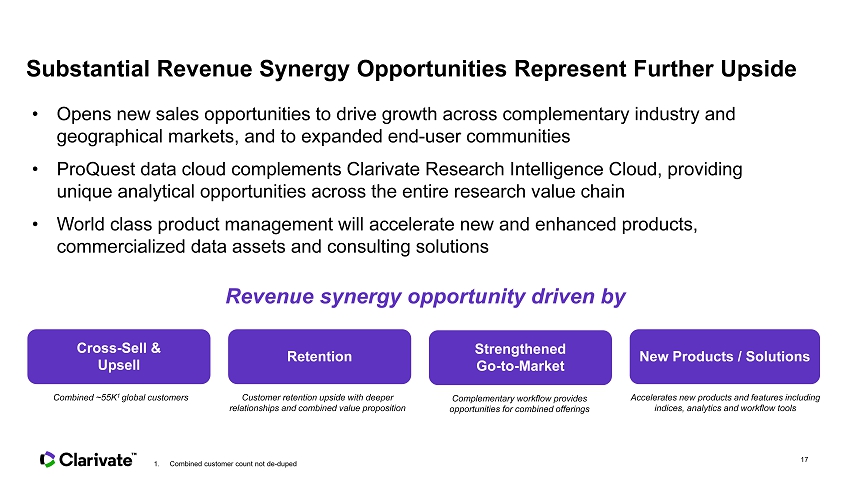
Substantial Revenue Synergy Opportunities Represent Further Upside • Opens new sales opportunities to drive growth across complementary industry and geographical markets, and to expanded end - user communities • ProQuest data cloud complements Clarivate Research Intelligence Cloud, providing unique analytical opportunities across the entire research value chain • World class product management will accelerate new and enhanced products, commercialized data assets and consulting solutions Revenue synergy opportunity driven by Cross - Sell & Upsell New Products / Solutions Combined ~55K 1 global customers Retention Customer retention upside with deeper relationships and combined value proposition Accelerates new products and features including indices, analytics and workflow tools 1. Combined customer count not de - duped Strengthened Go - to - Market Complementary workflow provides opportunities for combined offerings 17

Significant Cost Synergies Identified to Accelerate Earnings Growth Direct Costs More than $100M of Run - Rate Cost and $10M of CapEx Synergies Identified Expected to be fully Realized within 15 - 18 months Content Sources Technology Infrastructure Corporate & Real Estate 18 >$100M $ - $20M $40M $60M $80M $100M $120M 2021E 2022E 2023E
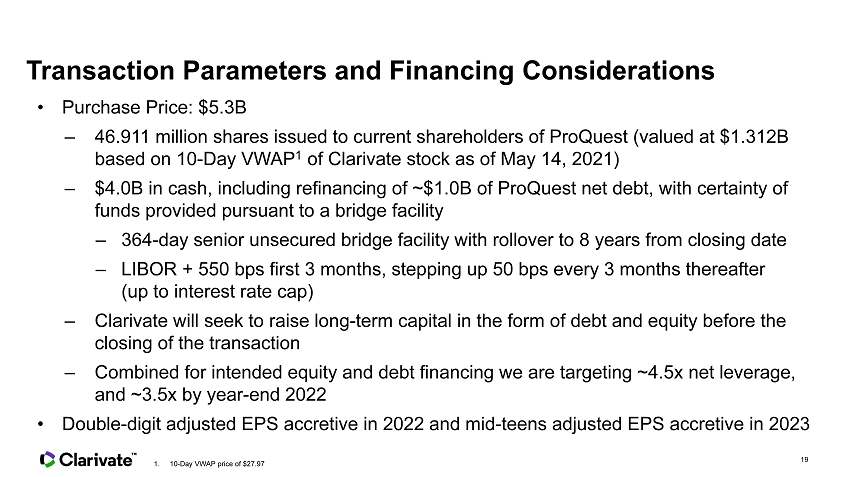
Transaction Parameters and Financing Considerations • Purchase Price: $5.3B – 46.9 11 million shares issued to current shareholders of ProQuest (valued at $1.312B based on 10 - Day VWAP 1 of Clarivate stock as of May 1 4 , 2021) – $4.0B in cash, including refinancing of ~$1.0B of ProQuest net debt, with certainty of funds provided pursuant to a bridge facility – 364 - day senior unsecured bridge facility with rollover to 8 years from closing date – LIBOR + 550 bps first 3 months, stepping up 50 bps every 3 months thereafter (up to interest rate cap) – Clarivate will seek to raise long - term capital in the form of debt and equity before the closing of the transaction – Combined for intended equity and debt financing we are targeting ~4.5x net leverage, and ~3.5x by year - end 2022 • Double - digit adjusted EPS accretive in 2022 and mid - teens adjusted EPS accretive in 2023 19 1. 10 - Day VWAP price of $27.97

IV. Conclusion
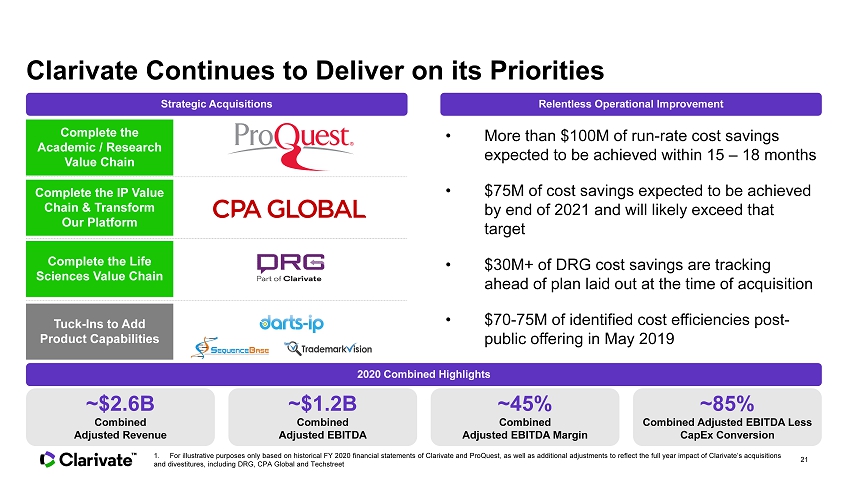
Clarivate Continues to Deliver on its Priorities Strategic Acquisitions Relentless Operational Improvement Complete the IP Value Chain & Transform Our Platform Complete the Life Sciences Value Chain • More than $100M of run - rate cost savings expected to be achieved within 15 – 18 months • $75M of cost savings expected to be achieved by end of 2021 and will likely exceed that target • $30M+ of DRG cost savings are tracking ahead of plan laid out at the time of acquisition • $70 - 75M of identified cost efficiencies post - public offering in May 2019 ~$2.6B Combined Adjusted Revenue ~$1.2B Combined Adjusted EBITDA ~4 5 % Combined Adjusted EBITDA Margin ~8 5 % Combined Adjusted EBITDA Less CapEx Conversion 2020 Combined Highlights Complete the Academic / Research Value Chain Tuck - Ins to Add Product Capabilities 21 1 . For illustrative purposes only based on historical FY 2020 financial statements of Clarivate and ProQuest, as well as additio na l adjustments to reflect the full year impact of Clarivate’s acquisitions and divestitures, including DRG, CPA Global and Techstreet

© 2020 Clarivate. All rights reserved. Republication or redistribution of Clarivate content, including by framing or similar mea ns, is prohibited without the prior written consent of Clarivate. Clarivate and its logo, as well as all other trademarks used herein are trademar ks of their respective owners and used under license. APPENDIX
Non - GAAP Financial Measures Non - GAAP Financial Measures The non - GAAP financial measures discussed herein are not recognized terms under, and should not be considered as a substitute for, financial measures calculated in accordance with U . S . generally accepted accounting principles (“GAAP”) . Our definitions of and method of calculating non - GAAP financial measures may vary from the definitions and methods used by other companies, which may limit their usefulness as a comparative measure . Our presentation of non - GAAP financial measures should not be construed as an inference that our future results will be unaffected by any of the adjusted items, or that our projections and estimates will be realized in their entirety or at all . In addition, because of these limitations, non - GAAP financial measures should not be considered as measures of liquidity or discretionary cash available to us to fund our cash needs, including investing in the growth of our business and meeting our obligations . See the Appendix for definitions of the non - GAAP measures used herein and a reconciliation to the most directly comparable GAAP measures . Combined Financial Presentation In this presentation, we present certain estimated combined financial information for the combined business . Such financial information is presented for illustrative purposes only based on historical FY 2020 financial statements of Clarivate and ProQuest, as well as additional adjustments to reflect the full year impact of Clarivate's acquisitions and divestitures, including DRG, CPA Global and Techstreet, but does not reflect all of the adjustments that would be required to be presented in order for such combined financial information to comply with Article 11 of Regulation S - X . Our combined financial information may differ materially from our actual combined results, and such differences may be material . You should not place undue reliance on our estimated combined financial information as an indication of how we would have performed as a combined business in FY 2020 , or what our results of operations will be for any future period . Combined Adjusted Revenue Adjusted Revenues excludes the impact of the deferred revenues purchase accounting adjustment (primarily recorded in connection with recent acquisitions) . Combined adjusted revenue represents the historical FY 2020 adjusted revenue of Clarivate and ProQuest, as well as additional adjustments to reflect the full year impact of Clarivate's acquisitions and divestitures, including DRG, CPA Global and Techstreet . Combined Adjusted EBITDA Adjusted EBITDA is calculated using net (loss) income before provision for income taxes, depreciation and amortization and interest income and expense adjusted to exclude acquisition or disposal - related transaction costs (such costs include net income from continuing operations before provision for income taxes, depreciation and amortization and interest income), share - based compensation, unrealized foreign currency gains/(losses), mark to market on financial instruments, acquisition - related adjustments to deferred revenues, non - operating income or expense, the impact of certain non - cash and other items that are included in net income for the period that the Company does not consider indicative of its ongoing operating performance, and certain unusual items impacting results in a particular period . Combined adjusted EBITDA represents the historical FY 2020 adjusted revenue of Clarivate and ProQuest, as well as additional adjustments to reflect the full year impact of Clarivate's acquisitions and divestitures, including DRG, CPA Global and Techstreet . Additionally, synergies and integration costs are included in the calculation . Combined Adjusted EBITDA Margin Combined adjusted EBITDA margin represents the historical FY 2020 adjusted revenue of Clarivate and ProQuest, as well as additional adjustments to reflect the full year impact of Clarivate's acquisitions and divestitures, including DRG, CPA Global and Techstreet . Combined Adjusted EBITDA Less Cap E x Conversion Combined adjusted EBITDA less capex conversion represents the historical FY 2020 adjusted EBITDA less capex conversion of Clarivate and ProQuest, as well as additional adjustments to reflect the full year impact of Clarivate's acquisitions and divestitures, including DRG, CPA Global and Techstreet . 23
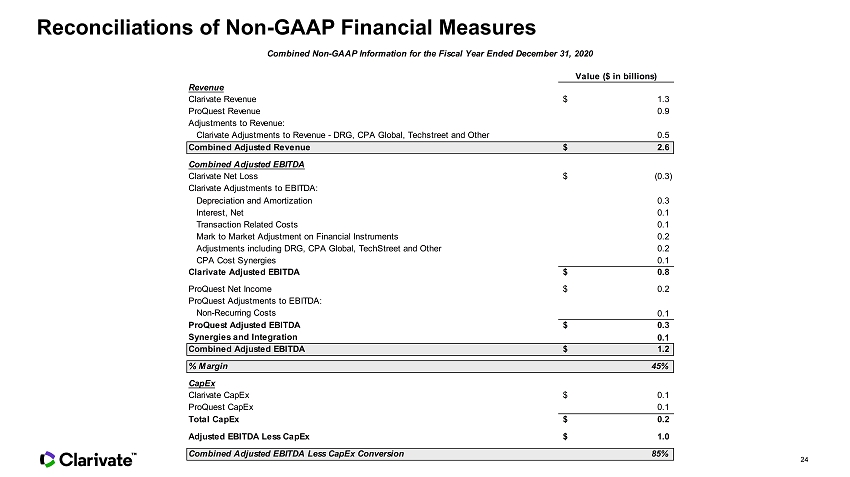
Reconciliations of Non - GAAP Financial Measures 24 Value ($ in billions) Revenue Clarivate Revenue 1.3$ ProQuest Revenue 0.9 Adjustments to Revenue: Clarivate Adjustments to Revenue - DRG, CPA Global, Techstreet and Other 0.5 Combined Adjusted Revenue 2.6$ Combined Adjusted EBITDA Clarivate Net Loss (0.3)$ Clarivate Adjustments to EBITDA: Depreciation and Amortization 0.3 Interest, Net 0.1 Transaction Related Costs 0.1 Mark to Market Adjustment on Financial Instruments 0.2 Adjustments including DRG, CPA Global, TechStreet and Other 0.2 CPA Cost Synergies 0.1 Clarivate Adjusted EBITDA 0.8$ ProQuest Net Income 0.2$ ProQuest Adjustments to EBITDA: Non-Recurring Costs 0.1 ProQuest Adjusted EBITDA 0.3$ Synergies and Integration 0.1 Combined Adjusted EBITDA 1.2$ % Margin 45% CapEx Clarivate CapEx 0.1$ ProQuest CapEx 0.1 Total CapEx 0.2$ Adjusted EBITDA Less CapEx 1.0$ Combined Adjusted EBITDA Less CapEx Conversion 85% Combined Non-GAAP Information for the Fiscal Year Ended December 31, 2020

© 2020 Clarivate. All rights reserved. Republication or redistribution of Clarivate content, including by framing or similar mea ns, is prohibited without the prior written consent of Clarivate. Clarivate and its logo, as well as all other trademarks used herein are trademar ks of their respective owners and used under license. Thank you