Attached files
| file | filename |
|---|---|
| EX-32 - EXHIBIT 32 - CLARIVATE Plc | tm206490d1_ex32.htm |
| EX-31 - EXHIBIT 31 - CLARIVATE Plc | tm206490d1_ex31.htm |
| EX-23.1 - EXHIBIT 23.1 - CLARIVATE Plc | tm206490d1_ex23-1.htm |
| EX-10.17 - EXHIBIT 10.17 - CLARIVATE Plc | tm206490d1_ex10-17.htm |
| EX-10.16 - EXHIBIT 10.16 - CLARIVATE Plc | tm206490d1_ex10-16.htm |
| EX-10.15 - EXHIBIT 10.15 - CLARIVATE Plc | tm206490d1_ex10-15.htm |
| EX-4.5 - EXHIBIT 4.5 - CLARIVATE Plc | tm206490d1_ex4-5.htm |
UNITED STATES
SECURITIES AND EXCHANGE COMMISSION
Washington, D.C. 20549
Form 10-K
(Mark One)
| x | ANNUAL REPORT PURSUANT TO SECTION 13 OR 15(d) OF THE SECURITIES EXCHANGE ACT OF 1934 |
For the fiscal year ended December 31, 2019
| ¨ | TRANSITION REPORT PURSUANT TO SECTION 13 OR 15(d) OF THE SECURITIES EXCHANGE ACT OF 1934 |
For the transition period from _________ to _______
Commission File No. 001-38911
CLARIVATE ANALYTICS PLC
(Exact name of registrant as specified in its charter)
| Jersey, Channel Islands | Not applicable | |
| (State or other jurisdiction of incorporation or organization) |
(I.R.S. Employer Identification No.) |
| Friars House, 160 Blackfriars Roads London SE1 8EZ United Kingdom (Address of principal executive offices) |
Not applicable (Zip Code) |
Registrant's telephone number, including area code: +44 207 4334000
Securities registered pursuant to Section 12(b) of the Exchange Act:
| Title of each class | Trading Symbol(s) |
Name of exchange on which registered |
| Ordinary shares | CCC | New York Stock Exchange |
| Warrants to purchase ordinary shares | CCC.WS | NYSE American |
Securities registered pursuant to Section 12(g) of the Exchange Act: None
Indicate by check mark if the registrant is a well-known seasoned issuer, as defined in Rule 405 of the Securities Act. Yes ¨ No x
Indicate by check mark if the registrant is not required to file reports pursuant to Section 13 or Section 15(d) of the Exchange Act. Yes ¨ No x
Indicate by check mark whether the registrant (1) has filed all reports required to be filed by Section 13 or 15(d) of the Securities Exchange Act of 1934 during the preceding 12 months (or for such shorter period that the registrant was required to file such reports), and (2) has been subject to such filing requirements for the past 90 days. Yes x No ¨
Indicate by check mark whether the registrant has submitted electronically every Interactive Data File required to be submitted pursuant to Rule 405 of Regulation S-T (§ 232.405 of this chapter) during the preceding 12 months (or for such shorter period that the registrant was required to submit such files). Yes x No ¨
Indicate by check mark whether the registrant is a large accelerated filer, an accelerated filer, a non-accelerated filer, a smaller reporting company or an emerging growth company. See the definitions of “large accelerated filer,” “accelerated filer,” “smaller reporting company” and “emerging growth company” in Rule 12b-2 of the Exchange Act.
| Large accelerated filer | ¨ | Accelerated filer | ¨ |
| Non-accelerated filer | x | Smaller reporting company | ¨ |
| Emerging growth company | x |
If an emerging growth company, indicate by check mark if the registrant has elected not to use the extended transition period for complying with any new or revised financial accounting standards provided pursuant to Section 13(a) of the Exchange Act. ☒
Indicate by check mark whether the registrant is a shell company (as defined in Rule 12b-2 of the Securities Exchange Act of 1934). Yes ¨ No x
The aggregate market value of the approximately 68.0 million ordinary shares held by non-affiliates of the Company (assuming for these purposes, but without conceding, that all executive officers and directors of the Company are affiliates of the Company) as of June 30, 2019, the last day of business of our most recently completed second fiscal quarter, was $1.05 billion, based on the closing sale price of the ordinary shares of $15.38 on June 28, 2019 as reported by the New York Stock Exchange.
The number of ordinary shares of the Company outstanding as of February 26, 2020 was 361,663,054.
DOCUMENTS INCORPORATED BY REFERENCE
None
TABLE OF CONTENTS
2
Note on Defined Terms and Presentation
We employ a number of defined terms in this annual report for clarity and ease of reference, which we have capitalized so that you may recognize them as such. Generally, we explain a defined term the first time it is used. As used throughout this annual report, unless otherwise indicated or the context otherwise requires, the terms “Clarivate,” the “Company,” “our,” “us” and “we” refer to Clarivate Analytics Plc and its consolidated subsidiaries; “Baring” refers to the affiliated funds of Baring Private Equity Asia Pte Ltd that from time to time hold our ordinary shares; and “Onex” refers to the affiliates of Onex Partners Advisor LP that from time to time hold our ordinary shares.
Unless otherwise indicated, dollar amounts throughout this annual report are presented in thousands of dollars, except for per share amounts.
Website and Social Media Disclosure
We use our website (www.clarivate.com) and corporate Twitter account (@Clarivate) as routine channels of distribution of company information, including news releases, analyst presentations, and supplemental financial information, as a means of disclosing material non-public information and for complying with our disclosure obligations under Regulation FD promulgated by the Securities and Exchange Commission (the “SEC”) under the Securities Act of 1933, as amended (the “Securities Act”) and the Securities Exchange Act of 1934, as amended (the “Exchange Act”). Accordingly, investors should monitor our website and our corporate Twitter account in addition to following press releases, SEC filings, and public conference calls and webcasts. Additionally, we provide notifications of news or announcements as part of our investor relations website. Investors and others can receive notifications of new information posted on our investor relations website in real time by signing up for email alerts.
None of the information provided on our website, in our press releases, public conference calls, and webcasts, or through social media channels is incorporated into, or deemed to be a part of, this annual report or in any other report or document we file with the SEC, and any references to our website or our social media channels are intended to be inactive textual references only.
Foreign Private Issuer Status and Financial Presentation
We currently qualify as a foreign private issuer (“FPI”) under the rules of the SEC. We currently anticipate that we will retain FPI status until at least December 31, 2020. However, even though we qualify as an FPI, we report our financial results in accordance with U.S. generally accepted accounting principles (“GAAP”) and, beginning with this annual report, we have elected to file our periodic and current reports on Forms 10-K, 10-Q and 8-K.
Industry and Market Data
The market data and other statistical information used throughout this annual report are based on industry publications and surveys, public filings and various government sources. Industry publications and surveys generally state that the information contained therein has been obtained from sources believed to be reliable, but there can be no assurance as to the accuracy or completeness of the included information. Statements as to our ranking, market position and market estimates (including estimates of the sizes and future growth rates of our markets) are based on independent industry publications, government publications, third-party forecasts and management’s good faith estimates and assumptions about our markets and our internal research. We have not independently verified such third-party information nor have we ascertained the underlying economic assumptions relied upon in those sources, and we are unable to assure you of the accuracy or completeness of such information contained in this annual report. While we are not aware of any misstatements regarding our market, industry or similar data presented herein, such data involve risks and uncertainties and are subject to change based on various factors. See “Item 1A. Risk Factors” and “Cautionary Statement Regarding Forward-Looking Statements” in this annual report.
3
Overview
We are a leading global information services and analytics company serving the scientific research, intellectual property and life sciences end-markets. We provide structured information and analytics to facilitate the discovery, protection and commercialization of scientific research, innovations and brands. Our product portfolio includes well-established, market-leading brands such as Web of Science, Derwent Innovation, Life Sciences, CompuMark and MarkMonitor. We believe that our flagship products hold a #1 or #2 global position by revenues across the respective markets they serve, including abstracting and indexing databases, life science regulatory and competitive intelligence and intellectual property protection (including patent, trademarks and brand protection). We serve a large, diverse and global customer base. As of December 31, 2019, we served over 40,000 entities in more than 170 countries, including the top 30 pharmaceutical companies by revenues and 50 global patent offices. We believe that the strong value proposition of our content, user interfaces, visualization and analytical tools, combined with the integration of our products and services into customers’ daily workflows, leads to our substantial customer loyalty as evidenced by their high propensity to renew their subscriptions with us.
Our structure is comprised of two product groups: Science and Intellectual Property (“IP”). The Science Group consists of the Web of Science and Life Science Product Lines. The IP Group consists of the Derwent, CompuMark and MarkMonitor Product Lines. This structure enables a sharp focus on cross-selling opportunities within the markets we serve and provides substantial scale.
Corporations, government agencies, universities, law firms and other professional services organizations around the world depend on our high-value, curated content, analytics and services. Unstructured data has grown exponentially over the last decade. This trend has resulted in a critical need for unstructured data to be meaningfully filtered, analyzed and curated into relevant information that facilitates key operational and strategic decisions made by businesses, academic institutions and governments worldwide. Our highly curated, proprietary information created through our sourcing, aggregation, verification, translation and categorization of data has resulted in our solutions being embedded in our customers’ workflow and decision-making processes.
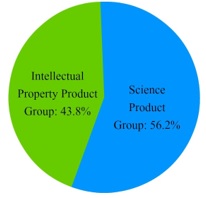
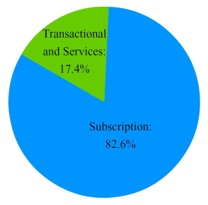
For the year ended December 31, 2019, we generated approximately $974,345 of revenues. We generated recurring revenues through our subscription-based model, which accounted for 82.6% of our revenues for the year ended December 31, 2019. In each of the past three years, we have also achieved annual revenue renewal rates in excess of 90%. (For information on annual revenue renewal rates, see “Item 7. Management’s Discussion and Analysis of Financial Condition and Results of Operations — Key Performance Indicators — Annual Revenue Renewal Rates.”) No single customer accounted for more than 1% of revenues and our ten largest customers represented only 5% of revenues for the year ended December 31, 2019.
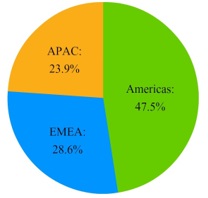
The following charts illustrate our revenues for the year ended December 31, 2019 by group, type and geography:
| Revenue by Product Group | Revenue by Type | Revenue by Geography |
 |
 |
 |
4
Our Products
Our product portfolio is summarized below.
| Science Group | Intellectual Property Group | ||||||
| Web of Science | Life Sciences | Derwent | CompuMark | MarkMonitor | |||
| Product Description | Used to navigate scientific and academic research discoveries, conduct analysis and evaluate research impact | Used by life sciences firms for drug research, market intelligence and regulatory compliance | Used to search and analyze patents | Used to monitor trademarks on an ongoing basis | Used to register and manage portions of web domains | ||
| Curated Information Set | Database of 1B+ citations, 166mm+ index records | 73,000+ drug program records, 340,000 clinical trial records | Database of 80mm+ patent filings across 50 patent offices | 180+ patent and trademark offices | Database of 1.3mm corporate domain names | ||
| Customers | 7,000+ leading academic institutions and governments and research intensive corporations use Web of Science and its Journal Impact Factor | Trusted by the top 30 pharma companies and hundreds of research groups | Used by 50 patent offices, large R&D organizations of Fortune 1000 companies and various universities | 15 industrial databases, 70 Pharma in-use databases | MarkMonitor manages 44% of the top 50 most trafficked corporate website domain portfolios | ||
| Notable Products | Web of Science InCites ScholarOne | Cortellis RI Integrity Newport | Derwent Innovation TechStreet | Watch Screen Search | Domain Management Brand Protection | ||
Our Strategy
The Clarivate management team, led by Executive Chairman and Chief Executive Officer Jerre Stead, is implementing a transformation strategy designed to improve operations, increase cash flow and accelerate revenues growth. Our transition to standalone operations since our 2016 separation from Thomson Reuters Corporation and its affiliates (“Thomson Reuters”) has required extensive management time and focus and involved significant expenditures, including sizeable payments to Thomson Reuters under the transition services agreement formerly in effect. We believe that our transition to a standalone company positions us to implement our transformation strategy and to improve our productivity compared to other leaders in the information services sector on a revenues per employee basis and in terms of our Adjusted EBITDA margins.
Under Mr. Stead’s leadership, we are embarking on a race to deliver excellence to the markets we serve and continue our evolution as a world-class organization. As we move forward, the focus will be on three basic principles; focus, simplify and execute. This means:
| 1. | Focusing on our core capabilities and the greatest opportunities for growth. |
| 2. | Simplifying our organization and processes. The focus on two product groups will be the driver for streamlining our operations. |
| 3. | Relentlessly driving execution of our strategy and growth plans. |
These changes will help us operate with greater focus and urgency. They will ensure that we put our clients first, drive accountability throughout the organization, accelerate decision-making, and promote consistency. These tenets will enable us to deliver long-term, sustainable growth.
5
With a proven operational playbook, we have quickly pursued initiatives to set ourselves on a growth trajectory. Our results for the year ended December 31, 2019 are among the first proof points that our transformation is underway.
| Proven Playbook with Multiple Levers | Fourth Progress Report | ||||
| Accelerate Revenue Growth | 2019 Earnings(1) | ||||
| ~ | Product and pricing enhancement strategies | 1. | Revenue growth 0.6% (2) | ||
| ~ | Increased pipeline of new products | 2. | Adjusted revenue growth (at constant currency) 3.1% (2) | ||
| ~ | Build strength in Asia Pacific | 3. | Subscription revenue growth 1.4% | ||
| ~ | Optimizing pricing and cross-sell | 4. | Adjusted subscription revenue growth (at constant currency) 4.3%(2) | ||
| 5. | Transactional revenue growth (4.7)% | ||||
| 6. | Adjusted Transactional revenue growth (at constant currency) (2.3%) | ||||
| Enhance Margins | 7. | ACV growth (at constant currency) 3.5% (3) | |||
| ~ | Benefit from top-line initiatives | 8. | 90.1% retention rate (4) | ||
| ~ | Simplifying G&A structure | 9. | Net loss $210,977 (Net loss margin and margin improvement not meaningful; reduction in Net loss of 12.9%) (2) | ||
| ~ | Consolidating footprint | 10. | Adjusted EBITDA margin 30.2% (2) | ||
| ~ | Increase automation and cloud infrastructure | 11. | Adjusted EBITDA margin improvement 150 bps (2) | ||
| 12. | Adjusted EBITDA growth 7.7% (2) | ||||
| 13. | Exited TSA six months ahead of schedule | ||||
1. For a reconciliation of our non-GAAP measures to the corresponding most closely related measures calculated in accordance with GAAP, see “Item 7. Management’s Discussion and Analysis of Financial Condition and Results of Operations – Certain Non-GAAP Measures.”
2. Results calculated for the year ended December 31, 2019 as compared to the year ended December 31, 2018.
3. “ACV” or “annualized contract value” refers to the annualized value for a 12-month period following a given date of all subscription-based client license agreements, assuming that all license agreements that come up for renewal during that period are renewed. The figure above represents the year-over-year growth in the annual value of our subscriptions as of December 31, 2019 as compared to December 31, 2018. For information on ACV, see “Item 7. Management’s Discussion and Analysis of Financial Condition and Results of Operations – Key Performance Indicators – Annualized Contract Value.”
4. Retention rate measurement period is for the year ended December 31, 2019.
Operational Improvement Initiatives
We are in the process of implementing several cost-saving and margin improvement initiatives designed to generate substantial incremental cash flow. We have engaged a strategic consulting firm to assist us in optimizing our structure and cost base. The focus of these initiatives is to identify significant cost reductions to be implemented over the next several quarters, enabling us to deliver margins consistent with those of our peer group. Some examples include:
| • | decreasing costs by simplifying organizational structures and rationalizing general and administrative functions to enhance a customer-centric focus; |
| • | using artificial intelligence and the latest technologies to reduce costs and increase efficiencies for content sourcing and curation; |
| • | moving work performed by contractors in-house to best-cost geographic locations, particularly India, where we have significant scale that can be leveraged; |
| • | achieving headcount productivity benchmarks and operational efficiency metrics based on alignment with quantified sector leader benchmarks; |
| • | expanding existing operations in best-cost geographic locations, aligning with business objectives; |
| • | minimizing our real estate footprint by reducing facility locations substantially over the next three years; and |
| • | divesting non-core assets. |
6
Revenues Growth Initiatives
We believe a significant opportunity exists for us to accelerate revenues growth by increasing the value of our products and services, developing new products, cross-selling certain products and optimizing sales force productivity. Actions to achieve such revenues growth are expected to include:
| • | developing new value-added products and services; |
| • | delivering an enhanced client experience through ongoing renovations to our products’ user interface and user experience; |
| • | offering additional analytics that enhance existing products and services; |
| • | moving up the value chain by providing our clients with predictive and prescriptive analytics, allowing for stronger growth and higher retention rates; |
| • | expanding our footprint with new and existing customers, with significant opportunity for growth in the Asia Pacific and emerging markets; |
| • | broadening our consulting capabilities, in particular in the Science Group, where there is considerable opportunity for us to deliver high value consulting services to drive significant revenues growth; |
| • | optimizing product pricing and packaging based on customer needs; |
| • | increasing sales force focus on large accounts; |
| • | expanding our inside sales capability to improve account coverage; and |
| • | restructuring our incentive plans to drive new business, as well as cross-selling among similar products and overlapping buying centers. |
The above actions are part of an overarching effort to improve retention rates and new business growth rates to best-in-class levels across our portfolio.
Pursue Acquisition Opportunities
Given the fragmented nature of the broader information services industry, we track and, where appropriate, will continue to pursue opportunities across our product groups. From 2017 through 2019, we completed five small add-on acquisitions to augment our existing portfolio of assets and provide additional datasets and services for our customers. Our completed acquisitions include Publons and Kopernio in Science and TrademarkVision, SequenceBase and Darts-ip in IP. Certain of these acquisitions are fully integrated into our platform. while others continue to be integrated, and we believe they have already provided additional value to our customers.
In February 2020, we consummated the acquisition of Decision Resources Group, our largest acquisition to date. See “— Recent Developments.”
We are evaluating additional acquisition opportunities to supplement our existing platform and enable us to enter new markets. Our focus is on disciplined and accretive investments that leverage our core strengths and enhance our current product, market, geographic and customer strategies. We believe that the combination of Mr. Stead’s successful acquisition track record and our scale and status as a global information services leader uniquely positions us to create value through additional acquisitions.
Positive Sector Dynamics Support Our Trajectory
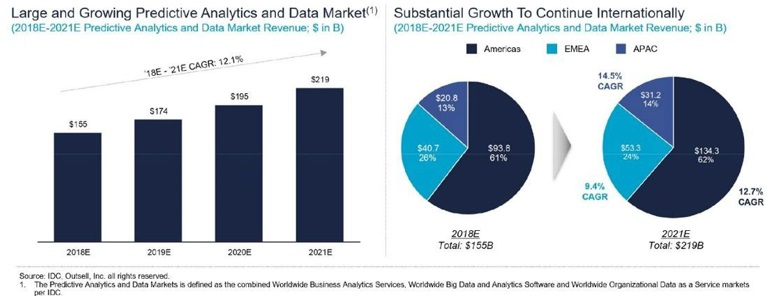
We operate in the global information services and analytics sector, which is experiencing robust growth due to many factors. Data and analytics have become critical inputs into broader corporate decision-making in today’s marketplace, and companies and institutions are seeking services like ours to enhance the predictive nature of their analysis. In addition to greater demand for our services, rapid innovation within our customers’ businesses has created new use cases for our services. Third-party industry reports estimate the global data and analytics market will grow from $155 billion in 2018 to $219 billion by 2021, a 12.1% compound annual growth rate over the period. This represents the target addressable market across verticals that have a need for data and analytical services.
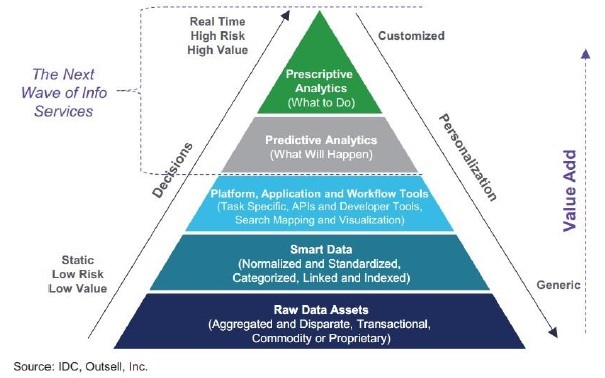
Customers of data and analytics products continue to approach complex business decisions in new ways. We believe that these customers are placing greater emphasis and value on the ability to embed predictive and prescriptive analytics into their decision-making processes. These customers are using smart data to anticipate what will happen in the future, as opposed to using historical data to study what has happened in the past. As such, we are investing in these critical, forward-facing products and solutions. We believe offering these types of products will increase the value clients place on our products, allow for stronger growth and open new addressable markets, as illustrated below.
7
Significant Move Up the Value Chain with Smart Data Offerings
Our Competitive Strengths
Leading Market Positions in Attractive and Growing Global Markets
We offer a collection of high-quality, market-leading information and analytic products and solutions serving the intellectual property, scientific research and life sciences end-markets. Through our products and services, we address the large and growing demand from corporations, government agencies, universities, law firms and other professional services organizations worldwide for comprehensive, industry-specific content and analytical tools to facilitate the discovery, development, protection, commercialization and measurement of scientific research, innovations and brands. We believe that our flagship products hold a #1 or #2 by revenue across the respective markets they serve, including abstracting and indexing databases, life science regulatory and competitive intelligence and intellectual property protection (including patent, trademarks and brand protection). We also believe that the outlook for growth in each of our Product Lines is compelling because of customer demand for curated high-quality data, underpinned by favorable end-market trends, such as rising global R&D spending, growing demand for information services in emerging markets, the acceleration of e-commerce and the increasing number of patent and trademark applications.
A Trusted Partner Delivering Highly Curated Content Embedded Within Customer Workflows
We believe the substantial increase in unstructured data over the last decade has increased the importance of our proprietary, curated databases to our customers. This trend has resulted in a critical need for unstructured data to be meaningfully filtered, analyzed and curated into relevant information that facilitates key operational and strategic decisions made by businesses, academic institutions and governments worldwide. Our suite of branded information and analytic solutions provides access to content that has been collected, curated and standardized over decades, making our products and services highly valued and increasingly important for our customers. Our content curation and editorial teams include over 930 employees, who clean, analyze and classify unstructured data to ensure high-quality content and an enhanced user experience. We believe our solutions and commitment to excellence provide us with a significant advantage in both retaining existing and attracting new customers.
8
Attractive Business Model with Strong Free Cash Flow Profile
Approximately 82.6% of revenues for the year ended December 31, 2019 were generated through annual or multi-year subscription agreements. In addition, we have been able to achieve annual revenues renewal rates in excess of 90% over the past two years. We believe our business has strong and attractive free cash flow characteristics due to our highly visible and recurring subscription revenues stream, attractive Adjusted EBITDA margins, low capital expenditure requirements and favorable net working capital characteristics. Anticipated revenues growth, margin improvement, the recently-completed separation from Thomson Reuters and effective working capital management are expected to result in strong free cash flow generation. We believe this will create capacity to invest further into the business so that we can grow and maximize shareholder returns.
Diversified Product Lines with Longstanding Customer Relationships
We believe that the diversified nature of our Product Lines enhances the stability of our entire platform as we are not dependent on any one end-market, product, service or customer. We serve a large, diverse and global customer base, and as of December 31, 2019, we served over 40,000 entities in more than 170 countries, including the top 30 pharmaceutical companies by revenues and 50 global patent offices. No single customer accounted for more than 1% of revenues and our ten largest customers represented only 5% of revenues for the year ended December 31, 2019. We believe the strong value proposition offered by our content, combined with the integration of our products and services into our customers’ daily workflows and decision-making processes, leads to substantial customer loyalty. Our relationships with our top 50 customers by revenues span an average tenor of over 15 years. Our diverse global footprint is highlighted by the distribution of our revenues for the year ended December 31, 2019 by geography: Americas (47.5%), Europe/Middle East/Africa (28.6%), and Asia Pacific (23.9%).
Resilience Through Economic Cycles
We believe our business is resilient across economic cycles because our products and services are an integral part of our customers’ decision-making processes. We believe multi-year agreements also help to maintain this resiliency. During the most recent economic downturn, three of our key products — Web of Science, Life Sciences and Derwent Innovation — realized year-over-year revenues increases from 2008 to 2009. In addition, our diverse global footprint reduces our exposure to national and regional economic downturns.
Our performance is largely due to the sectors we serve and the deep integration of our products with our customers’ workflows, which provides for a resilient business model even during an economic downturn.
Proven and Experienced Leadership
Mr. Stead is a proven business operator with demonstrated success in shareholder value creation. At Clarivate, Mr. Stead brings his decades of expertise in the information services sector to guide a talented and experienced management team sourced from world-class, global companies, most of whom have decades of experience in their respective areas of expertise.
9
Background and History
Clarivate Analytics Plc was registered on January 7, 2019 and is organized under the laws of Jersey, Channel Islands. Our registered office is located at 4th Floor, St Paul’s Gate, 22-24 New Street, St. Helier, Jersey JE1 4TR. Our principal business offices are located at Friars House, 160 Blackfriars Road, London SE1 8EZ, United Kingdom, where our main telephone number is +44 207 4334000. We maintain a website at www.clarivate.com. In addition, the SEC maintains a website that contains reports, proxy and information statements, and other information regarding issuers (including Clarivate) that file electronically with the SEC at www.sec.gov.
Our predecessors date back to the acquisition of two industry-leading information services businesses: Derwent World Patents Index (“DWPI”) and Institute for Scientific Information (“ISI”). DWPI was founded in 1951 by Monte Hyams who first began abstracting and publishing British patents on a weekly basis. This platform was then launched as the first online patent search tool in 1974. ISI was founded in 1957 by Dr. Eugene Garfield as a series of databases which laid the foundation for modern day bibliometrics and the influential Journal Impact Factor indicator. Thomson Reuters acquired DWPI in 1984 and ISI in 1992; it made further investments in complementary businesses centered on life science research, domain management and brand protection.
Since Thomson Reuters acquired DWPI and ISI, the business now known as Clarivate has emerged as the leading global information services and analytics company serving the scientific research, intellectual property and life sciences end-markets. Through product development, investment and acquisitions, we have developed a full suite of solutions providing high-value structured information that facilitates the discovery, protection and commercialization of scientific research, innovations and brands.
During the majority of its time under prior ownership, the Company operated as a set of non-core, separate divisions until Thomson Reuters decided in 2015 to divest them. This decision led to two key transformative events.
The first transformative event occurred in October 2016, when Onex and Baring acquired subsidiaries and assets comprising the intellectual property and science business of Thomson Reuters for $3,566,599 and formed Clarivate.
Onex, Baring and the new executive team they put in place focused on transitioning us to be a standalone company and completed a substantial number of operational improvements, including:
| • | building a new senior executive management team; |
| • | investing in our core products to upgrade their content, functionality, analytical tools and user interfaces; |
| • | completing the acquisitions of Publons, Kopernio, TrademarkVision, and SequenceBase to complement our product offerings; |
| • | implementing initial cost savings initiatives; and |
| • | fully transitioning the business from reliance on Thomson Reuters. |
The second transformative event occurred in January 2019, when Churchill Capital Corp, a special purpose acquisition company led by Mr. Stead, announced that it would combine with Clarivate in a transaction completed in May 2019. Following the merger, the ordinary shares and warrants of Clarivate began trading on the New York Stock Exchange (“NYSE”) and the NYSE American under the symbols “CCC” and “CCC.WS,” respectively.
10
Recent Developments
Acquisition of Decision Resources Group
On January 17, 2020, we entered into an agreement to acquire Decision Resources Group (“DRG”), a premier provider of high-value data, analytics and insights products and services to the healthcare industry, from Piramal Enterprises Limited, which is a part of global business conglomerate Piramal Group. The acquisition closed on February 28, 2020.
The aggregate consideration paid in connection with the closing of the DRG acquisition was approximately $950,000, comprised of $900,000 in cash paid on the closing date and approximately $50,000 in Clarivate ordinary shares to be issued to Piramal Enterprises Limited following the one-year anniversary of closing.
In February 2020, we completed an underwritten public offering of 27,600,000 of our ordinary shares, generating net proceeds of $540,736, which we used to fund a portion of the cash consideration for the DRG acquisition. In addition, we incurred an incremental $360,000 of term loans under our term loan facility and used the net proceeds from such borrowings, together with cash on hand, to fund the remainder of the cash consideration for the DRG acquisition and to pay related fees and expenses.
Redemption of Public Warrants
On February 20, 2020, we announced the redemption of all of our outstanding public warrants to purchase our ordinary shares that were issued as part of the units sold in the Churchill Capital Corp initial public offering and remain outstanding at 5:00 p.m. New York City time on March 23, 2020, for a redemption price of $0.01 per public warrant. In addition, our board of directors elected that, upon delivery of the notice of the redemption on February 20, 2020, all public warrants are to be exercised only on a “cashless basis.” Accordingly, by virtue of the cashless exercise of public warrants, exercising public warrant holders will receive 0.4626 of an ordinary share for each public warrant. Assuming all outstanding public warrants called for redemption on March 23, 2020 are exercised prior to redemption, an additional 4,749,616 ordinary shares would be issued.
In addition, during the period from January 1, 2020 through February 21, 2020, 24,132,666 of our outstanding public warrants were exercised for one ordinary share per whole warrant at a price of $11.50 per share.
The private warrants issued in a private placement concurrently with the Churchill Capital Corp initial public offering and still held by their initial holders are not subject to this redemption.
MarkMonitor Brand Protection, Antipiracy and Antifraud Disposition
In November 2019, we announced an agreement to sell the MarkMonitor™ brand protection, antipiracy and antifraud businesses, and completed such divestiture on January 1, 2020. We retained the MarkMonitor Domain Management business.
Our Product Lines
SCIENCE GROUP (56.2% of revenues for the year ended December 31, 2019)
Our Science Group consists of our Web of Science and Life Science Product Lines. Both provide curated, high-value, structured information that is delivered and embedded into the workflows of our customers, which include research intensive corporations, life science organizations and universities world-wide.
Web of Science Product Line
Our Web of Science Product Line (“WOSPL”) provides products and services to organizations that plan, fund, implement and utilize research. We deliver search and discovery services to researchers with proprietary scientific data; we help researchers cite their research with workflow tools; we provide data and analytics to allow for global measures of research excellence and university rankings; we support governments and policy makers worldwide in assessment programs; and we inform a wide range of sector specific consultation and reporting activities to national and institutional research agencies across the G20 countries. We believe that the high quality and unique nature of WOSPL’s products and the informed approach of our professional service expertise have resulted in our information, services and workflow tools becoming embedded within the fabric of the research community. Key products include Web of Science, InCites, Journal Citation Reports, EndNote, ScholarOne, Converis, Publons and Kopernio.
Web of Science (“WOS”), our flagship product, holds a unique and pivotal role in the infrastructure of R&D and is frequently utilized as a reference standard in the academic, institutional and corporate sectors. It provides publication records and essential metadata from trusted published assets and is linked and indexed together via over one billion tracked citations from over 166 million index records going back to 1900 within the core Web of Science, and back to 1864 in Zoological Record. A key metric we provide is the “Journal Impact Factor” (“JIF”), which we believe is the most influential and best-known research metric of the last 50 years. Its primary value is as a journal-level metric to assess what journals are the most impactful, but universities and research funders use JIF to inform their evaluation of research excellence when assessing faculty and selecting funding grantees. Researchers also rely on the JIF to identify top-tier journals where they should publish their content.
11
Example Use Cases
| • | A physics professor planning a research program and making a grant proposal accesses WOS to evaluate the current state of research in her discipline, identify emerging trends within highly regarded and relevant scientific journals and select a research topic, while the grant-making institutions will use WOS’s analytic tools to measure the professor’s credentials. |
| • | A university provost interested in evaluating her university’s chemistry department accesses WOS and our analytical tool InCites to measure the strength of the university’s research output and benchmark it against comparable institutions, find the best researchers to bolster the university’s ranking and improve the caliber of research and find highly cited researchers, departments and laboratories. |
Life Sciences Product Line
Our Life Sciences Product Line (“LSPL”) provides products and services primarily to pharmaceutical and biotechnology companies. Our products are market leaders in regulatory intelligence and competitive intelligence, and our clinical trial offering is rapidly gaining share. We believe we provide a unique end-to-end proposition, which links to early research workflows, and believe there is an opportunity to stretch further into the approval and post-approval phases of drug development. Key products include Cortellis, Newport and Integrity.
Cortellis, our flagship LSPL product, is used by strategy, business development, drug development, medical affairs and clinical professionals at pharmaceutical and biotechnology companies to support research, market intelligence and competitive monitoring in connection with the development and commercialization of new drugs. Our customers use the database to access and evaluate scientific data, drug pipeline data, clinical trial information, drug monographs, pharmaceutical M&A data and regulatory information, all of which has been aggregated, curated and classified by our team of scientific experts who evaluate and select data for inclusion in the database from a wide array of sources. In addition, our team of experts creates high-value content from this data, such as analytics, abstracts, conference summaries and regulatory reports. As of December 31, 2019, our data included more than 73,000 drug program records and more than 340,000 clinical trial records.
Example Use Case
| • | An analyst at a pharmaceutical firm who is evaluating several potential R&D programs will access the Cortellis database to assess competitive products in the drug development pipeline, review clinical trial data and summarize regulatory information. |
INTELLECTUAL PROPERTY GROUP (43.8% of revenues for the year ended December 31, 2019)
Our Intellectual Property Group consists of our Derwent, CompuMark and MarkMonitor Product Lines. These Product Lines help manage customer’s end-to-end portfolio of intellectual property from patents to trademarks to corporate website domains.
12
Derwent Product Line
Our Derwent Product Line (“DPL”) enables customers to evaluate the novelty of potential new products, confirm freedom to operate with respect to their product design, help them secure patent protection, assess the competitive technology landscape and ensure that their products comply with required industry standards. We provide a range of analytics capabilities and data visualization tools to improve the efficiency and accuracy of IP-driven decisions. Key products include Derwent Innovation, Techstreet and IP Professional Services.
Derwent Innovation, our flagship DPL product, is used by R&D professionals and lawyers to monitor patent filings, search existing patents and analyze data to support R&D decision-making. It is a critical resource to help our customers secure patent protection and address litigation of patent infringement. The product is powered by Derwent World Patents Index, our proprietary database of over 80 million patent publications from 50 patent offices, which represented 98% of all patents published globally in 2018 and has been developed and curated for over 50 years. The database combines data science with our team of domain experts who correct, enrich and abstract over six million global patents per year in over 30 languages, as of December 31, 2019. We provide customers with easy-to-understand summaries of patent filings that are prepared by our domain experts, who index and translate the highly technical and intentionally obscure patent filings into understandable abstracts that provide insights into a patent’s novelty, use and advantage over prior patents.
Example Use Case
| • | An employee developing a new product or idea (e.g., a chemical engineer or a product designer) will access the Derwent Innovation database of patents to evaluate the novelty and determine the patentability of the new product or idea. |
CompuMark Product Line
Our CompuMark Product Line (“CPL”) provides trademark research and protection services for businesses and law firms globally and relies on our leading trademark database. CompuMark’s offerings span the entire life cycle of a trademark, from determining availability of a proposed trademark to monitoring for infringement post registration. CPL provides global trademark research and protection to corporations and law firms globally. Over the last 30 years, the organization has curated content from more than 180 patent and trademark offices. Coupled with industry specific sources, including over 15 industrial design databases and 70 Pharma In-Use Databases as of December 31, 2019, CompuMark delivers the most comprehensive data set for trademark professionals available.
Key products include trademark screening, trademark searching and trademark watching. We do this by (i) providing customers with sophisticated self-service tools to narrow large lists of potential trademarks, which we refer to as “screening”; (ii) preparing detailed, custom reports post screening that uncover potential risks related to a proposed trademark, which we refer to as “clearance searching”; and (iii) monitoring trademark applications and other data sources on a recurring subscription revenues basis to alert clients to potential instances of infringement post registration, which we refer to as “watching.”
Example Use Case
| • | An attorney for a large law firm helps clear a trademark for use by its corporate customer as part of a new product launch. The attorney first conducts a “knock-out” search as part of a preliminary screening process using our trademark research tool and then later orders an analyst curated “Full Search” report by CompuMark to ensure the availability of the proposed trademark in the markets in which the customer will be operating. In this way, the attorney can clear both the word and image mark for use by his/her client. The lawyer will then subscribe to CompuMark’s trademark watching services to continually ensure that none of their customers’ valuable trademarks are being infringed upon. |
13
MarkMonitor Product Line
Our MarkMonitor Product Line (“MPL”) helps global enterprises establish, manage, optimize and protect their online presence. MPL provides a suite of technology services for brand managers, IT managers, marketing teams, and legal counsel in corporations to register and manage portfolios of domain names critical for their business. This allows customers to achieve the right balance of being easily found online without overpaying for domains that generate little to no Internet user traffic. MPL also provides data and domain industry insights which help enterprises maximize the power of their portfolios, and mitigate cyber squatters’ attempts to register domains aimed to defraud consumers.
Example Use Case
| • | An in-house counsel uses MarkMonitor to ensure that important domain names are registered and protected from security threats such as domain hijacking, spam, and other forms of DNS abuse. |
Customers
We serve a large, diverse and global customer base and, as of December 31, 2019, we served over 40,000 entities in more than 170 countries as well as the top 30 pharmaceutical companies by revenue and 50 global patent offices. Our customers either use our databases on an exclusive basis or on a dual-sourced basis.
No single customer accounted for more than 1% of revenues and our ten largest customers represented only 5%, 6%, and 7% of revenues for the years ended December 31, 2019, 2018, and 2017 respectively.
Competitive Environment
We believe the principal competitive factors in our business include the quality of content embedded in our databases and those of our competitors, customers’ perception of our products relative to the value that they deliver, user interface of the products and the quality and breadth of our overall offerings. We believe we compete favorably with respect to each of these factors.
We believe no single competitor currently offers the same scope of services and market coverage we provide, nor do we provide the same scope of services and market coverage as our competitors. The breadth of markets we serve exposes us to a broad range of competitors as described below.
Our primary competitors differ by product line and include the following companies and product offerings:
| • | Abstracting and Indexing Database Market: Elsevier (Scopus, SciVal), Digital Science (Dimensions) and ProQuest (RefWorks); | |
| • | Patent Protection Market: CPA Global (Innography and IP services), IHS Markit (Engineering Workbench, ecommerce store), LexisNexis (TotalPatent), Minesoft (PatBase), Questel (Orbit) and SAI Global (i2i, ecommerce store); | |
| • | Life Sciences Regulatory and Competitive Intelligence Market: Evaluate (Evaluate Pharma), Global Data (Global Data Pharmaceuticals), Informa (Pharma Intelligence, BioMedTracker, Pharmaprojects, Trialtrove, Sitetrove), IQVIA (Tarius) and Qiagen (Qiagen Services); |
14
| • | Trademark Protection Market: Corsearch (Contour, Corsearch Screening, search and watch services), TrademarkNow (NameCheck, LogoCheck, NameWatch) and Markify (ComprehensiveSearch, ProSearch and trademark and domain watch); and | |
| • | Domain Management and Brand Protection Market: Corporation Service Company (CSC) (domain name management, online brand protection, anti-counterfeiting services), Incopro (online brand protection, content protection intelligence, site blocking intelligence and advertising Monitoring), Yellow (anti-piracy, anti-counterfeiting and IP protection), Phish Labs (phishing incident response and brand protection), Friend MTS (anti-piracy and content management) and AppDetex (domain management and online brand protection) and Red Point Solutions (anti-piracy and brand protection). |
Sources of Data
The data supporting our products and services is sourced principally through two different types of arrangements. First, we source data generally at little or no cost from public sources, including federal, state and local governments. Second, we purchase data from third-party data aggregators under contracts that reflect prevailing market pricing for the data elements purchased.
Technology
Our information technology systems are fundamental to our success. They are used for the storage, processing, access and delivery of the data which forms the foundation of our business and the development and delivery of our solutions provided to our customers.
Much of the technology we use and provide to our customers is developed, maintained and supported by approximately 800 employees and approximately 570 contractors, as of December 31, 2019. We generally own or have secured ongoing rights to use for the purposes of our business all the customer-facing applications which are material to our operations.
We are continually transforming our content, products, services and company to better meet our customers’ needs. We also are focused on securing our customer data and global systems as we implement and enhance our security programs. We are migrating the infrastructure for several of our customer applications and content databases to a third-party service provider, which provides a distributed computing infrastructure platform for business operations, or what is commonly referred to as a “cloud” computing service.
Intellectual Property
As of December 31, 2019, we owned approximately 644 registered trademarks, 276 trademark applications, 2,846 domain names, 68 granted patents and 58 patent applications. We also own certain proprietary software. In addition, we are licensed to use certain third-party software, and obtain significant content and data through third-party licensing arrangements with content providers. We consider our trademarks, service marks, databases, software and other IP to be proprietary, and we rely on a combination of statutory (e.g., copyright, trademark, trade secret and patent), contractual and technical safeguards to protect our IP rights. We believe that the IP we own and license is sufficient to permit us to carry on our business as presently conducted.
Our agreements with our customers and business partners place certain restrictions on the use of our IP. As a general practice, employees, contractors and other parties with access to our proprietary information sign agreements that prohibit the unauthorized use or disclosure of our IP and confidential information.
15
New Product Development
We believe that innovation is essential to our success and is one of our primary bases of competition. We believe we are uniquely positioned to help shape how professionals find, evaluate, interact with, consume and act upon information. We are focused on developing capabilities to improve our products’ user interfaces, analytical tools, searching algorithms and content curation processes. Our current focus includes building out a technology platform focused on search technologies, big data and analytics, machine learning, social computing and natural language technologies. This will enable more rapid product development as we shift our investment focus toward new products rather than maintenance of legacy technology.
We also add to our business line offerings through acquisitions. Since our separation from Thomson Reuters in 2016, we have completed five small add-on acquisitions to augment our existing portfolio of assets and provide additional datasets and services for our customers. Given the fragmented nature of the broader information services industry, we track and, where appropriate, have pursued opportunities across our Product Lines. These include Publons and Kopernio in WOSPL, SequenceBase in DPL and TrademarkVision and Darts-ip in CompuMark Product Line. Certain of these acquisitions are fully integrated into our platform. while others continue to be integrated, and we believe they have already provided additional value to our customers.
When we find it advantageous, we augment our proprietary data sources and systems by forming alliances with other leading information providers and technology companies and integrating their product offerings into our offerings. This approach gives our customers the opportunity to obtain the information they need from a single source and more easily integrate the information into their workflows.
Enforcement of Civil Liabilities
U.S. laws do not necessarily extend either to us or our officers or directors. We are incorporated under the laws of Jersey, Channel Islands. Some of our directors and officers reside outside of the United States. Substantially all of our assets and the assets of our directors and officers are located outside the United States. As a result, it may not be possible for investors to effect service of process on either us or our officers and directors within the United States, or to enforce against these persons or us, either inside or outside the United States, a judgment obtained in a U.S. court predicated upon the civil liability provisions of the federal securities or other laws of the United States or any U.S. state.
We have appointed Vistra USA, LLC, as our agent to receive service of process with respect to any action brought against us in the United States under the federal securities laws of the United States or of the laws of any state of the United States.
A judgment of a U.S. court is not directly enforceable in Jersey, but constitutes a cause of action which may be enforced by Jersey courts provided that:
| • | the applicable U.S. courts had jurisdiction over the case, as recognized under Jersey law; |
| • | the judgment is given on the merits and is final, conclusive and non-appealable; |
| • | the judgment relates to the payment of a sum of money, not being taxes, fines or similar governmental penalties; |
| • | the defendant is not immune under the principles of public international law; |
| • | the same matters at issue in the case were not previously the subject of a judgment or disposition in a separate court; |
| • | the judgment was not obtained by fraud; and |
| • | the recognition and enforcement of the judgment is not contrary to public policy in Jersey. |
16
Jersey courts award compensation for the loss or damage actually sustained by the plaintiff. Although punitive damages are generally unknown to the Jersey legal system, there is no prohibition on them either by statute or customary law. Whether a particular judgment may be deemed contrary to Jersey public policy depends on the facts of each case, though judgments found to be exorbitant, unconscionable, or excessive will generally be deemed as contrary to public policy. Moreover, certain defendants may qualify for protection under Protection of Trading Interests Act 1980, an act of the UK extended to Jersey by the Protection of Trading Interests Act 1980 (Jersey) Order, 1983. This Act provides that a qualifying defendant is not liable for multiple damages, in excess of that required for actual compensation. A “qualifying defendant” for these purposes is a citizen of the UK and its Colonies (as defined in the Act), a corporation or other limited liability entity organized under the laws of the UK, Jersey or other territory for whose international relations the UK is responsible or a person conducting business in Jersey.
Jersey courts cannot enter into the merits of the foreign judgment and cannot act as a court of appeal or review over the foreign courts. It is doubtful that an original action based on U.S. federal or state securities laws could be brought before Jersey courts. In addition, a plaintiff who is not resident in Jersey may be required to provide a security bond in advance to cover the potential of the expected costs of any case initiated in Jersey. In addition, Clarivate has been further advised by our legal counsel in Jersey that it is uncertain as to whether the courts of Jersey would entertain original actions or enforce judgments from U.S. courts against us or our officers and directors which originated from actions alleging civil liability under U.S. federal or state securities laws.
Marketing, Sales and Customer Support
We primarily sell our products and services directly to our customers, although some of our products and services are sold through partners. Focusing some of our sales and marketing efforts on digital sales and marketing has allowed us to broaden our range of customers and reduce sales and marketing costs. We have a dedicated global sales force, which, as of December 31, 2019, consisted of approximately 1,155 people.
We annually develop sales, distribution and marketing strategies on a product-by-product and service-by-service basis. We leverage customer data, business and market intelligence and competitive profiling to retain customers and cross-sell products and services, while also working to promote unified brand recognition across all our products and services.
Our sales teams participate in both service and sales activities. They provide direct support, interacting frequently with assigned customers to assure a positive experience using our products and services. Sales people primarily seek out new sales opportunities, including existing customer retention and upsell, and work with the various sales teams to coordinate sales activity and provide the best solutions for our customers. A portion of our sales people’s compensation is tied to revenues retention. We believe our sales people’s product knowledge and local presence differentiates us from our competition.
In addition, we employ product specialists who are subject-matter experts and work with sales people on specific opportunities for their assigned products. Both sales people and product specialists have responsibility for identifying new sales opportunities. A team approach and a common customer relationship management system allow for effective coordination between the two groups.
Employees
As of December 31, 2019, approximately 4,090 full-time and approximately 113 part-time employees support our business operations. The employee count excludes employees related to the MarkMonitor Brand Protection, Antipiracy and Antifraud Disposition. See “Item 7. Management's Discussion and Analysis of Financial Condition and Results of Operations — Factors Affecting the Comparability of Our Results of Operations” for information related to the disposition. None of our employees in the United States are represented by unions; however, customary representation by unions and works councils applies for certain of our non-U.S. employees. We consider our relationship with our employees to be good and have not experienced interruptions to operations due to labor disagreements.
17
Seasonality
Our cash flows from operations are generated primarily from payments from our subscription customers and the standard term of a subscription is typically 12 months. When a customer enters into a new subscription agreement, or submits a notice to renew their subscription, we typically invoice for the full amount of the subscription period, record the balance to deferred revenues and ratably recognize the deferral throughout the subscription period. As a result, we experience cash flow seasonality throughout the year, with a heavier weighting of operating cash inflows occurring during the first half, and particularly first quarter, of the year, when most subscription invoices are sent, as compared to the second half of the year.
Regulatory Environment
Certain of our Product Lines provide authorized customers with products and services such as access to public records. Our Product Lines that provide such products and services are subject to applicable privacy and consumer information laws and regulations, including U.S. federal and state and European Union (the “EU”) and member state regulation. Our compliance obligations vary from regulator to regulator, and may include, among other things, strict data security programs, submissions of regulatory reports, providing consumers with certain notices and correcting inaccuracies in applicable reports. Many of these laws and regulations are complex and their application to us, our customers or the specific services and relationships we have with our customers are not always clear. Our failure to accurately anticipate the application of these laws and regulations, or any failure to comply, could create liability for us, result in adverse publicity and otherwise negatively affect our business. See “Item 1A. Risk Factors” for more information about the impact of government regulation on our company.
We operate in highly competitive markets and may be adversely affected by this competition.
The markets for our products and services are highly competitive and are subject to rapid technological changes and evolving customer demands and needs. We compete on the basis of various factors, including the quality of content embedded in our databases and those of our competitors, customers’ perception of our products relative to the value that they deliver, user interface of the products and the quality of our overall offerings.
Many of our principal competitors are established companies that have substantial financial resources, recognized brands, technological expertise and market experience, and these competitors sometimes have more established positions in certain Product Lines and geographies than we do. We also compete with smaller and sometimes newer companies, some of which are specialized with a narrower focus than our company, and face competition from other Internet services companies and search providers.
Our competitors may be able to adopt new or emerging technologies or address customer requirements more quickly than we can. New and emerging technologies can also have the impact of allowing start-up companies to enter the market more quickly than they would have been able to in the past. We may also face increased competition from companies that could pose a threat to our business by providing more in-depth offerings, adapting their products and services to meet the demands of their customers or combining with one of their competitors to enhance their products and services. A number of our principal competitors may continue to make acquisitions as a means to improve the competitiveness of their offerings. In order to better serve the needs of our existing customers and to attract new customers, we must continue to:
| • | enhance and improve our existing products and services (such as by adding new content and functionalities); |
| • | develop new products and services; |
18
| • | invest in technology; and |
| • | strategically acquire additional businesses and partner with other businesses in key sectors that will allow us to offer a broader array of products and services. |
Our ability to compete successfully is also impacted by the growing availability of information from government information systems and other free sources, as well as competitors who aggressively market their products as a lower cost alternative. See “— Increased accessibility to free or relatively inexpensive information sources may reduce demand for our products and services.” Because some of our competitors are able to offer products and services that may be more cost effective than ours, including through the provision of price incentives for new customers, and because some of our competitors’ products and services may be seen as having greater functionality or performance than ours, the relative value of some of our products or services could be diminished. In addition, some of our competitors combine competing products with complementary products as packaged solutions, which could pre-empt use of our products or solutions. Competition from such free or lower cost sources may require us to reduce the price of some of our products and services (which may result in lower revenues) or make additional capital investments (which might result in lower profit margins). If we are unable or unwilling to reduce prices or make additional investments in the future, we may lose customers and our financial results may be adversely affected. In addition, implementation of annual price increases by us from time to time may also, in some cases, cause customers to use lower-cost competitors.
Certain of our distribution partners have licensing rights to portions of our content for use within their platforms. Over time they may become more directly competitive with us (subject to the terms of their agreements with us) if they were to advance their technology more efficiently and effectively than we do. Additionally, some of our customers may decide to develop independently certain products and services that they obtain from us, including through the formation of consortia. Educating our customers on the intricacies and uses of our products and services could, in certain cases, improve their ability to offer competing products and services as they look to expand their business models. If more of our customers become self-sufficient, demand for our products and services may be reduced. If we fail to compete effectively, our financial condition and results of operations would be adversely affected.
We may not be able to achieve the expected benefits of the DRG acquisition, including anticipated revenue and cost synergies, and costs associated with achieving synergies or integrating DRG may exceed our expectations.
We may not be able to achieve the expected benefits of the DRG acquisition, including anticipated revenue and cost synergies. There can be no assurance that the DRG acquisition will be beneficial to us. We may not succeed in cross-selling our other products and services to DRG’s customer base, or in cross-selling DRG’s products and services to our existing customer base. Moreover, we may not be able to integrate the assets acquired in the DRG acquisition or achieve our expected cost synergies without increases in costs or other difficulties. The integration process may be complex, costly and time-consuming. We expect to incur expenses in connection with the integration of DRG acquisition. While it is anticipated that certain expenses will be incurred to achieve operational synergies, such expenses are difficult to estimate accurately, and may exceed current estimates. Accordingly, the benefits from the DRG acquisition may be offset by costs incurred or delays in integrating the businesses. Any unexpected costs or delays incurred in connection with the integration of the DRG acquisition could have an adverse effect on our business, results of operations, financial condition and prospects, as well as the market price of our ordinary shares.
The overall integration of the businesses may result in material unanticipated problems, expenses, liabilities, competitive responses, loss of customer relationships, and diversion of management’s attention. In addition, even if the operations of our business and DRG’s business are integrated successfully, we may not realize the full benefits of the DRG acquisition, including the synergies, cost savings or sales or growth opportunities that we expect. These benefits may not be achieved within the anticipated time frame, or at all. Furthermore, additional unanticipated costs may be incurred in the integration of the businesses.
19
Our ability to make specified claims against the seller in the DRG acquisition generally expires over time and we may be left with no recourse for liabilities and other problems associated with the DRG acquisition that we do not discover prior to the expiration date related to such matters under our agreement to acquire DRG.
The market price of our ordinary shares may decline as a result of the DRG acquisition if, among other things, the integration of the entities to be acquired in the DRG acquisition is unsuccessful, if we fail to realize the anticipated cost or revenue synergies, or if the related liabilities, expenses or transaction costs are greater than expected. The market price of our ordinary shares may decline if we do not achieve the perceived benefits of the DRG acquisition as rapidly or to the extent anticipated by us or by securities market participants or if the effect of the DRG acquisition on our business, results of operations or financial condition or prospects is not consistent with our expectations or those of securities market participants. Furthermore, the DRG acquisition may subject us to new types of risks to which we were not previously exposed.
If our products and services do not maintain and/or achieve broad market acceptance, or if we are unable to keep pace with or adapt to rapidly changing technology, evolving industry standards and changing regulatory requirements, our revenues could be adversely affected.
Our business is characterized by rapidly changing technology, evolving industry standards and changing regulatory requirements. Our growth and success depend upon our ability to keep pace with such changes and developments and to meet changing customer needs and preferences. In order to enable our sales personnel to sell new products and services effectively, we must invest resources and incur additional costs in training programs on new products and services and key differentiators and business values.
The process of developing our products and services is complex and may become increasingly complex and expensive in the future due to the introduction of new platforms, operating systems and technologies. Our ability to keep pace with technology and business and regulatory changes is subject to a number of risks, including that we may find it difficult or costly to:
| • | update our products and services and develop new products and services quickly enough to meet our customers’ needs; |
| • | make some features of our products work effectively and securely over the Internet or with new or changed operating systems; |
| • | update our products and services to keep pace with business, evolving industry standards, regulatory requirements and other developments in the markets in which our customers operate; and |
| • | integrate or further develop acquired products or technologies successfully or at all. |
The items reflected in the adjustments included in Standalone Adjusted EBITDA may not be achieved.
We have made adjustments to net income (loss) to calculate Standalone Adjusted EBITDA. These adjustments reflect certain items related to our transition to a standalone operation since our 2016 separation from Thomson Reuters. For example, in calculating Standalone Adjusted EBITDA, we have added back, among other things, the annualization effect of cost savings implementation during the year and excess standalone costs, certain restructuring and integration costs, acquisition-related costs and other unusual and/or non-recurring items. We cannot provide assurance that our estimates and assumptions in calculating Standalone Adjusted EBITDA will prove to be accurate. For example, we believe that the standalone costs that we have incurred to date and expect to incur through 2020 are not reflective of the standalone costs that we expect that we will incur starting in 2021 and onwards (“steady state standalone costs”). As a result, we have made an adjustment when calculating Standalone Adjusted EBITDA to reflect the excess of current standalone costs to steady state standalone costs. If the actual annualized effect of cost savings we have implemented is less than our estimates, our cost savings initiatives adversely affect our operations or cost more or take longer to implement than we project, our steady state standalone costs are higher than our estimates, and/or if our assumptions prove to be inaccurate, our Standalone Adjusted EBITDA will be lower than we anticipate.
20
We may be unable to achieve some or all of the operational cost improvements and other benefits that we expect to realize.
We may not be able to realize all of the cost savings we expect to achieve. We believe that we will be able to achieve additional annual cost savings as a result of other initiatives, particularly by pursuing a number of operational cost improvements identified during diligence, increased overall focus on cost control as a stand-alone company and certain ongoing restructuring initiatives we plan to undertake. We cannot assure you that we will be able to successfully realize the expected benefits of these initiatives. A variety of risks could cause us not to realize some or all of the expected benefits. These risks include, among others, higher than expected standalone overhead expenses, delays in the anticipated timing of activities related to such initiatives, increased difficulty and cost in establishing ourselves as an independent company, lack of sustainability in cost savings over time, unexpected costs associated with operating our business, inability to eliminate duplicative back office overhead or redundant selling and general and administrative functions and inability to avoid labor disruptions in connection with any integration of the foregoing, particularly in connection with any headcount reductions. Our ability to successfully manage organizational changes is important for our future business success. In particular, our reputation and results of operations could be harmed if employee morale, engagement or productivity decline as a result of organizational or other changes.
Moreover, our implementation of these initiatives may disrupt our operations and performance, and our estimated cost savings from these initiatives are based on several assumptions that may prove to be inaccurate and, as a result, we cannot assure you that we will realize these cost savings. If, for any reason, the benefits we realize are less than our estimates, or our improvement initiatives adversely affect our operations or cost more or take longer to implement than we project, or if our assumptions prove inaccurate, our results of operations may be materially adversely affected.
We are dependent on third parties, including public sources, for data, information and other services, and our relationships with such third parties may not be successful or may change, which could adversely affect our results of operations.
Substantially all of our products and services are developed using data, information or services obtained from third-party providers and public sources, or are made available to our customers or are integrated for our customers’ use through information and technology solutions provided by third-party service providers.
We have commercial relationships with third-party providers whose capabilities complement our own and, in some cases, these providers are also our competitors. The priorities and objectives of these providers, particularly those that are our competitors, may differ from ours, which may make us vulnerable to unpredictable price increases and unfavorable licensing terms. Agreements with such third-party providers periodically come up for renewal or renegotiation, and there is a risk that such negotiations may result in different rights and restrictions which could impact our customers’ use of the content. Moreover, providers that are not currently our competitors may become competitors or be acquired by or merge with a competitor in the future, any of which could reduce our access to the information and technology solutions provided by those companies. If we were to expand our product and service offerings, whether through organic growth or acquisitions, we may launch products and services that compete with providers that are not currently our competitors, which could negatively impact our existing relationships. If we do not maintain, or obtain the expected benefits from, our relationships with third-party providers or if a substantial number of our third-party providers or any key service providers were to withdraw their services, we may be less competitive, our ability to offer products and services to our customers may be negatively affected, and our results of operations could be adversely impacted.
We also depend on public sources in the development of our products and services. These public sources are usually free to access or are available at minimal cost, and do not compete directly with our products and services. If such public sources were to begin competing with us directly, or were to increase the cost to access their data, prohibit us from collecting and synthesizing the data they provide or cease existing altogether, our results of operations could be adversely impacted.
21
Increased accessibility to free or relatively inexpensive information sources may reduce demand for our products and services.
In recent years, more public sources of free or relatively inexpensive information have become available, particularly through the Internet, and this trend is expected to continue. For example:
| • | some governmental and regulatory agencies have increased the amount of information they make publicly available at no cost; |
| • | several companies and organizations have made certain information publicly available at little or no cost; and |
| • | “open source” software that is available for free may also provide some functionality similar to that in some of our products. |
Public sources of free or relatively inexpensive information may reduce demand for our products and services. Demand could also be reduced as a result of cost-cutting, reduced spending or reduced activity by customers. Our results of operations would be adversely affected if our customers choose to use these public sources as a substitute for our products or services.
We generate a significant percentage of our revenues from recurring subscription-based arrangements, and if we are unable to maintain a high annual revenue renewal rate, our results of operations could be adversely affected.
For the year ended December 31, 2019, approximately 82.6% of our revenues were subscription-based. In order to maintain existing revenues and to generate higher revenues, we are dependent on a significant number of our customers renewing their arrangements with us. Although many of these arrangements have automatic renewal provisions, with appropriate notice these arrangements are cancellable and our customers have no obligation to renew their subscriptions after the expiration of their initial subscription period. As a result, our past annual revenue renewal rates may not be indicative of our future annual revenue renewal rates, and our annual revenue renewal rates may decline or fluctuate in the future as a result of a number of factors, including customer satisfaction with our products and services, our prices and the prices offered by competitors, reductions in customer spending levels and general economic conditions. Our revenues could also decline if a significant number of our customers renewed their arrangements with us, but reduced the amount of their spending.
In addition, because most of the revenues we report in each quarter are the result of subscription agreements entered into or renewed in previous quarters, a decline in subscriptions in any one quarter may not affect our results in that quarter, but could reduce revenues in future quarters. We may not be able to adjust our cost structure in response to sustained or significant downturns in revenues. Moreover, renewal dates for our subscription agreements are typically concentrated in the first quarter. Adverse events impacting us or our customers occurring in the first quarter may result in us failing to secure subscription agreement renewals, which would have a disproportionately adverse effect on our financial condition and results of operations in future periods.
Failure to protect the reputation of our brands may adversely impact our credibility as a trusted source of content and may have a negative impact on our business. In addition, in certain jurisdictions we engage sales agents in connection with the sale of certain of our products and services. It is difficult to monitor whether such agents’ representation of our products and services is accurate. Poor representation of our products and services by agents, or entities acting without our permission, could have an adverse effect on our reputation and our business.
Any significant disruption in or unauthorized access to our computer systems or those of third parties that we utilize in our operations, including those relating to cybersecurity or arising from cyber-attacks, could result in a loss or degradation of our products or services, unauthorized disclosure of data or our customers losing confidence in our security measures, which could adversely impact our business.
Our reputation and ability to attract, retain and serve our customers is dependent upon the reliable performance and security of our computer systems and those of third parties that we utilize in our operations. These systems may be subject to damage or interruption from natural disasters, terrorist attacks, power loss, telecommunications failures and cybersecurity risks.
Our computer systems and those of third parties we use in our operations are vulnerable to cybersecurity risks, including cyber-attacks, both from state-sponsored entities and individual activity, such as computer viruses, denial of service attacks, physical or electronic break-ins and similar disruptions. We have implemented certain systems and processes to thwart hackers and protect our data and systems; however, these systems and processes may not be effective and may have the unintentional effect of reducing the functionality of our operations. Any significant disruption to our operations or access to our systems could result in a loss of customers and adversely affect our business and results of operations.
22
Our ability to effectively use the Internet may also be impaired due to system or infrastructure failures, service outages at third-party Internet providers or increased government regulation, and such impairment may result in shortage of capacity and increased costs associated with such usage. These events may affect our ability to store, process and transmit data and services to our customers.
We collect, store and use public records, IP and sensitive data. In addition, our internal systems contain confidential information, our proprietary business information and personally identifiable information of our employees and customers. A number of our customers and suppliers also entrust us with storing and securing their own confidential data and information. Similar to other global multinational companies that provide services online, we experience cyber-threats, cyber-attacks and other attempts to breach the security of our systems, which can include unauthorized attempts to access, disable, improperly modify or degrade our information, systems and networks, the introduction of computer viruses and other malicious codes and fraudulent “phishing” e-mails that seek to misappropriate data and information or install malware onto users’ computers. Cyber-threats in particular vary in technique and sources, are persistent, frequently change and increasingly are more sophisticated, targeted and difficult to detect and prevent. In particular, our MarkMonitor brand of products, which are used to detect and protect against domain name infringements, have been, and will continue to be, the target of cyber-attacks due to the nature of the offering they provide.
Under the transition services agreement with Thomson Reuters, we relied on dedicated Thomson Reuters personnel who were responsible for maintaining appropriate levels of cyber-security for products and services hosted in Thomson Reuters data centers. In order to comply with Thomson Reuters’ system access requirements and procedures, only Thomson Reuters’ information security personnel could provide support for products and services hosted in Thomson Reuters data centers. We have gradually transitioned away from this arrangement and hired our own information security personnel. These information security personnel are still relatively new to us and may not be able to provide the same level of support that Thomson Reuters personnel previously provided. We also utilize third-party technology, products and services to help identify, protect and remediate our information technology systems and infrastructure against security breaches and cyber-incidents. However, our measures may not be adequate or effective to prevent, identify or mitigate attacks or breaches caused by employee error, malfeasance or other disruptions. In addition, we rely on a system of internal processes and software controls, along with policies, procedures and training to protect the confidentiality of customer data. If we fail to maintain the adequacy of our internal controls, if an employee, consultant or third-party provider purposely circumvents or violates our internal controls, policies or procedures or if we fail to adequately address the requirements of our customers’ internal controls, policies or procedures, as a result of contractual requirements or otherwise, then unauthorized access to, or disclosure or misappropriation of, customer data could occur.
Any fraudulent, malicious or accidental breach of data security could result in unintentional disclosure of, or unauthorized access to, customer, vendor, employee or other confidential or sensitive data or information, which could potentially result in additional costs to our company to enhance security or to respond to occurrences, lost sales, violations of privacy or other laws, notifications to individuals, penalties or litigation. While we maintain what we believe is sufficient insurance coverage that may (subject to certain policy terms and conditions including self-insured deductibles) cover certain aspects of security and cyber-risks and business interruption, our insurance coverage may not cover all costs or losses. Additionally, any fraudulent, malicious or accidental breach of data security could result in our disclosing valuable trade secrets, know-how or other confidential information. Media or other reports of perceived security vulnerabilities to our systems or those of our third-party suppliers, even if no breach has been attempted or occurred, could also adversely impact our brand and reputation and cause customers to lose confidence in our security measures and reliability, which would harm our ability to retain customers and gain new ones, and materially impact our business and results of operations.
23
We rely upon a third party cloud computing service to support our operations, and any disruption of or interference with our use of such service or material change to our arrangement with this provider could adversely affect our business.
We currently host the vast majority of our computing on a distributed computing infrastructure platform for business operations, or what is commonly referred to as a “cloud” computing service, and have completed the migration of our product and services platform from Thomson Reuters to a third party cloud computing service.
We do not have control over the operations of the facilities of the third party cloud computing service that we use. These facilities are vulnerable to damage or interruption from natural disasters, cyber security attacks, including ransomware attacks, terrorist attacks, power losses, telecommunications failures, or other unanticipated problems which could result in lengthy interruptions to our operations. In the event of damage or interruption, our insurance policies may not adequately compensate us for any losses that we may incur. These facilities could also be subject to break-ins, computer viruses, sabotage, intentional acts of vandalism, and other misconduct. Our uninterrupted use of this third party cloud computing service is critical to our success. This, coupled with the fact that we cannot easily switch our cloud computing operations to another cloud provider, means that any disruption of or interference with our use of our current third party cloud computing service could disrupt our operations and our business would be adversely impacted.
Our third party cloud computing service provider provides us with their standard computing and storage capacity, service level agreements, and related support in exchange for timely payment by us under the terms of our agreement, which continues until terminated by either party. Such provider may terminate the agreement without cause by providing 90 days’ prior written notice, and may terminate the agreement with 30 days’ prior written notice for cause, including any material default or breach of the agreement by us that we do not cure within the 30-day period. If any of our arrangements with our third party cloud computing service provider are terminated, we could experience interruptions in our products and services, as well as delays and additional expenses in arranging new facilities and services.
Our third party cloud computing service provider does not have an obligation to renew its agreements with us on commercially reasonable terms, or at all. If we are unable to renew our agreements on commercially reasonable terms, our agreements are prematurely terminated, or we add additional infrastructure providers, we may experience costs or downtime in connection with the transfer to, or the addition of, new data center providers. If these providers increase the cost of their services, we may have to increase fees to our customers, and our operating results may be adversely impacted.
We may be unable to derive fully the anticipated benefits from organic growth, existing or future acquisitions, joint ventures, investments or dispositions.
We seek to achieve our growth objectives by (i) optimizing our offerings to meet the needs of our customers through organic development, including by delivering integrated workflow platforms, cross-selling our products across our existing customer base, acquiring new customers and implementing operational efficiency initiatives, (ii) through acquisitions, joint ventures, investments and dispositions and (iii) through implementing our transformational strategy in connection with our merger with Churchill Capital Corp in 2019. If we are unable to successfully execute on our strategies to achieve our growth objectives or drive operational efficiencies, or if we experience higher than expected operating costs that cannot be adjusted accordingly, our growth rates and profitability could be adversely affected.
Acquisitions have not historically been a significant part of our growth strategy; however, going forward, we expect to evaluate and, where appropriate, opportunistically undertake acquisitions. To the extent that we seek to grow our business through acquisitions, we may not be able to successfully identify attractive acquisition opportunities or make acquisitions on terms that are satisfactory to our company from a commercial perspective. In addition, competition for acquisitions in the markets in which we operate during recent years has increased, and may increase costs of acquisitions or cause us to refrain from making certain acquisitions. We may also be subject to increasing regulatory scrutiny from competition and antitrust authorities in connection with acquisitions. Achieving the expected returns and synergies from existing and future acquisitions will depend in part upon our ability to integrate the products and services, technology, administrative functions and personnel of these businesses into our Product Lines in an efficient and effective manner. We cannot assure you that we will be able to do so, or that our acquired businesses will perform at anticipated levels or that we will be able to obtain these synergies. Management resources may also be diverted from operating our existing businesses to certain acquisition integration challenges. If we are unable to successfully integrate acquired businesses, our anticipated revenues and profits may be lower. Our profit margins may also be lower, or diluted, following the acquisition of companies whose profit margins are less than those of our existing businesses.
24
In addition, we may incur earn-out and contingent consideration payments in connection with future acquisitions, which could result in a higher than expected impact on our future earnings. We may also finance future transactions through debt financing, including significant draws on our revolving credit facility or use of any incremental capacity under our term loan facility, the issuance of our ordinary shares, the use of existing cash, or any combination of the foregoing. Acquisitions financed with debt could require us to dedicate a substantial portion of our cash flows to principal and interest payments and could subject us to restrictive covenants. Future acquisitions financed with our own cash could further deplete the cash and working capital available to fund our operations adequately. Difficulty borrowing funds, selling securities or generating sufficient cash from operations to finance our activities may have a material adverse effect on our results of operations.
We may also decide from time to time to dispose of assets or Product Lines that are no longer aligned with strategic objectives and we deem to be non-core. Once a decision to divest has been made, there can be no assurance that a transaction will occur, or if a transaction does occur, there can be no assurance as to the potential value created by the transaction. The process of exploring strategic alternatives or selling a business could negatively impact customer decision-making and cause uncertainty and negatively impact our ability to attract, retain and motivate key employees. In addition, we expend costs and management resources to complete divestitures. Any failures or delays in completing divestitures could have an adverse effect on our financial results and on our ability to execute our strategy.
The international scope of our operations may expose us to increased risk, and our international operations and corporate and financing structure may expose us to potentially adverse tax consequences.
We have international operations and, accordingly, our business is subject to risks resulting from differing legal and regulatory requirements, political, social and economic conditions and unforeseeable developments in a variety of jurisdictions. Our international operations are subject to the following risks, among others:
| • | political instability; | |
| • | international hostilities, military actions, terrorist or cyber-terrorist activities, natural disasters, pandemics, and infrastructure disruptions; | |
| • | differing economic cycles and adverse economic conditions; | |
| • | unexpected changes in regulatory environments and government interference in the economy; | |
| • | changes to economic sanctions laws and regulations, including regulatory exemptions that currently authorize certain of our limited dealings involving sanctioned countries; | |
| • | varying tax regimes, including with respect to the imposition of withholding taxes on remittances and other payments by our partnerships or subsidiaries; | |
| • | differing labor regulations, particularly in India where we have a significant number of employees; | |
| • | foreign exchange controls and restrictions on repatriation of funds; | |
| • | fluctuations in currency exchange rates; | |
| • | inability to collect payments or seek recourse under or comply with ambiguous or vague commercial or other laws; | |
| • | insufficient protection against product piracy and differing protections for IP rights; | |
| • | varying attitudes towards censorship and the treatment of information service providers by foreign governments, in particular in emerging markets; | |
| • | difficulties in attracting and retaining qualified management and employees, or rationalizing our workforce; | |
| • | differing business practices, which may require us to enter into agreements that include non-standard terms; and | |
| • | difficulties in penetrating new markets due to entrenched competitors, lack of recognition of our brands or lack of local acceptance of our products and services. |
25
Our overall success as a global business depends, in part, on our ability to anticipate and effectively manage these risks, and there can be no assurance that we will be able to do so without incurring unexpected costs. If we are not able to manage the risks related to our international operations, our business, financial condition and results of operations may be materially affected.
We have expanded our presence in a number of major regions, including China, and any future actions or escalations by either the United States or China that affect trade relations may cause global economic turmoil and potentially have a negative impact on our business. In particular, we may have access to fewer business opportunities and our operations in that region may be negatively impacted.
As a result of the international scope of our operations and our corporate and financing structure, we are subject to taxation in, and to the tax laws and regulations of, multiple jurisdictions. We are also subject to intercompany pricing laws, including those relating to the flow of funds between our companies pursuant to, for example, purchase agreements, licensing agreements or other arrangements. Adverse developments in these laws or regulations, or any change in position regarding the application, administration or interpretation of these laws or regulations in any applicable jurisdiction, could have a material adverse effect on our business, financial condition and results of operations. Furthermore, changes in or the interpretations of the tax laws or tax treaties of the countries in which we operate may severely and adversely affect our ability to efficiently realize income or capital gains or mitigate withholding taxes and may subject us to tax and return filing obligations in such countries. Such changes may increase our tax burden and/or may cause us to incur additional costs and expenses in compliance with such changes. In addition, the tax authorities in any applicable jurisdiction may disagree with the positions we have taken or intend to take regarding the tax treatment or characterization of any of our transactions, including the tax treatment or characterization of our indebtedness. If any applicable tax authorities were to successfully challenge the tax treatment or characterization of any of our transactions, it could result in the disallowance of deductions, the imposition of withholding taxes, the reallocation of income or other consequences that could have a material adverse effect on our business, financial condition and results of operations.
In addition, the U.S. Congress, the UK Government, the Organization for Economic Co-operation and Development (the “OECD”), and other government agencies in jurisdictions where we and our affiliates do business have had an extended focus on issues related to the taxation of multinational corporations. Also, within the EU, the European Council Directive 2016/1164 (Anti-Tax Avoidance Directive (“ATAD”)) and Directive 2017/952 (“ATAD II”) required EU member states to transpose certain measures affecting multinational corporations into national legislation by December 31, 2019. Further, the introduction of a digital services tax, which at the date hereof has not yet been formally implemented in these jurisdictions, may increase our tax burden which and could adversely affect our business, financial condition and results of operations.
Our international operations require us to comply with various trade restrictions, such as sanctions and export controls.
We are subject to various trade restrictions, including trade and economic sanctions and export controls (collectively, “Trade Controls”), imposed by governments around the world with jurisdiction over our operations. Such Trade Controls prohibit or restrict transactions involving certain persons and certain designated countries or territories, including Cuba, Iran, Syria, North Korea and the Crimea Region of Ukraine. Our failure to successfully comply with applicable Trade Controls may expose us to legal, business or reputational harm, possibly including criminal fines, imprisonment, civil penalties, disgorgement of profits, injunctions, debarment from government contracts and other measures. Investigations of alleged violations can be expensive and disruptive.
As part of our business, we engage in limited sales and transactions involving certain countries that are targets of Trade Controls. We believe that such sales and transactions are authorized by applicable regulatory exemptions. Under the informational materials exemption to the U.S. economic sanction programs, we are permitted to make certain sales to Iran, Cuba and Syria.
We endeavor to conduct our activities in compliance with applicable Trade Controls and maintain policies and procedures reasonably designed to promote compliance. However, we cannot guarantee that our policies and procedures will be effective in preventing violations, which could adversely affect our business, reputation, financial condition and results of operations. Further, we cannot predict the nature, scope or effect of future regulatory requirements, including changes that may affect existing regulatory exceptions, and we cannot predict the manner in which existing laws and regulations might be administered or interpreted.
26
Our failure to comply with the anti-corruption laws of the United States and various international jurisdictions could negatively impact our reputation and results of operations.
Doing business on a worldwide basis requires us to comply with anti-corruption laws and regulations imposed by governments around the world with jurisdiction over our operations, which may include the U.S. Foreign Corrupt Practices Act (“FCPA”) and the UK Bribery Act 2010 (“UK Bribery Act”), as well as the laws of the countries where we do business. These laws and regulations may restrict our operations, trade practices, investment decisions and partnering activities. The FCPA, the UK Bribery Act and other applicable laws prohibit us and our officers, directors, employees and business partners acting on our behalf, including agents, from corruptly offering, promising, authorizing or providing anything of value to “foreign officials” for the purposes of influencing official decisions or obtaining or retaining business or otherwise obtaining favorable treatment. The UK Bribery Act also prohibits non-governmental “commercial” bribery and accepting bribes. As part of our business, we deal with governments and state-owned business enterprises, the employees and representatives of which may be considered “foreign officials” for purposes of the FCPA and the UK Bribery Act. We also are subject to the jurisdiction of various governments and regulatory agencies around the world, which may bring our personnel and representatives into contact with “foreign officials” responsible for issuing or renewing permits, licenses or approvals or for enforcing other governmental regulations.
In addition, some of the international locations in which we operate lack a developed legal system and have elevated levels of corruption. Our international operations expose us to the risk of violating, or being accused of violating, anti-corruption laws and regulations. Our failure to successfully comply with these laws and regulations may expose us to reputational harm, as well as significant sanctions, including criminal fines, imprisonment, civil penalties, disgorgement of profits, injunctions and debarment from government contracts, as well as other remedial measures. Investigations of alleged violations can be expensive and disruptive. We maintain policies and procedures designed to comply with applicable anti-corruption laws and regulations. However, there can be no guarantee that our policies and procedures will effectively prevent violations by our employees or business partners acting on our behalf, including agents, for which we may be held responsible, and any such violation could adversely affect our reputation, business, financial condition and results of operations.
Brexit may have a negative effect on global economic conditions, financial markets and our business.
We have material business operations in Europe, and our headquarters is in the United Kingdom which is currently undergoing the process of “Brexit”, or withdrawal from the European Union. Although we generated only approximately 4.4% of our revenues in the United Kingdom for the year ended December 31, 2019, Brexit-related developments and the potential consequences of them, have had and may continue to have a material adverse effect upon global economic conditions and the stability of global financial markets, and could significantly reduce global market liquidity and restrict the ability of key market participants to operate in certain financial markets. Asset valuations, currency exchange rates and credit ratings have been and may continue to be subject to increased market volatility. Lack of clarity about future United Kingdom laws and regulations as the United Kingdom determines which European Union laws to replace or replicate, including financial laws and regulations, tax and free trade agreements, tax and customs laws, intellectual property rights, environmental, health and safety laws and regulations, immigration laws, employment laws and transport laws could increase costs, depress economic activity, restrict our access to capital, impair our ability to attract and retain qualified personnel and have other adverse consequences. If the United Kingdom and the European Union are unable to negotiate acceptable withdrawal terms, barrier-free access between the United Kingdom and other European Union member states or among the European economic area overall could be diminished or eliminated. Any of these factors could have a material adverse effect on our business, financial condition and results of operations and reduce the price of our ordinary shares.
If governments or their agencies reduce their demand for our products or services or discontinue or curtail their funding, our business may suffer. Moreover, if we fail to comply with government contracting regulations, we could suffer a loss of revenues or incur price adjustments or other penalties.
The principal customers for certain of the products and services offered by our Web of Science Product Line are universities and government agencies, which fund purchases of these products and services from limited budgets that are sensitive to changes in private and governmental sources of funding. Recession, economic uncertainty or austerity have contributed, and may in the future contribute, to reductions in spending by such sources. Accordingly, any further decreases in budgets of universities or government agencies, which have remained under pressure, or changes in the spending patterns of private or governmental sources that fund academic institutions, are likely to adversely affect our results of operations.
27
In addition, we are subject to government procurement and contracting regulations, including the Federal Acquisition Regulation (the “FAR”). The FAR governs U.S. government contract pricing, including the establishment of fixed prices and labor categories/fixed hourly rates for the performance of certain of our U.S. government contracts. Under the FAR, certain contract pricing may be subject to change. Additionally, under the FAR, the U.S. government is entitled, after final payment on certain negotiated contracts, to examine our cost records with respect to such contracts and to seek a downward adjustment to the price of the contract if it determines that we failed to furnish complete, accurate and current cost or pricing data in connection with the negotiation of the price of the contract.
In connection with our U.S. government contracts, we are also subject to government inquiries, audits and review of our performance under contracts, our related cost structure and compliance with applicable laws, regulations and standards. The U.S. government contracting entity may also review the adequacy of and our compliance with our internal policies, procedures and internal controls. The U.S. government contracting party may modify, curtail or terminate its contracts and subcontracts with us, without prior notice and either at its convenience or for default based on performance. In addition, funding pursuant to our U.S. government contracts may be reduced or withheld as part of the U.S. Congressional appropriations process due to fiscal constraints, changing U.S. priorities or due to other reasons. Further, as a U.S. government contractor, we are subject to U.S. government inquiries, investigations, legal actions and liabilities that would not apply to a non-U.S. government contractor. In certain circumstances, if we do not comply with the terms of a contract or with regulations or statutes, our U.S. government contracts could be terminated, we could be subject to downward contract price adjustments or refund obligations, we could be assessed civil or criminal penalties (including under the False Claims Act) or we could be debarred or suspended from obtaining future contracts with the U.S. government for a specified period of time. Any such termination, adjustment, sanction, debarment or suspension could have an adverse effect on our business. We also could suffer reputational harm if allegations of impropriety were made against us, even if such allegations are later determined to be false.
Our collection, storage and use of personal data are subject to applicable data protection and privacy laws, and any failure to comply with such laws may harm our reputation and business or expose us to fines and other enforcement action.
In the ordinary course of business, we collect, store, use and transmit certain types of information that are subject to different laws and regulations. In particular, data security and data protection laws and regulations that we are subject to often vary significantly by jurisdiction.
For example, the new EU-wide General Data Protection Regulation (“GDPR”) became applicable on May 25, 2018, replacing the data protection laws of each EU member state. The GDPR implemented more stringent operational requirements for processors and controllers of personal data, including, for example, expanded disclosures about what and how personal information is to be used, limitations on retention of information, increased requirements to erase an individual’s information upon request, mandatory data breach notification requirements and higher standards for data controllers to demonstrate that they have obtained valid consent from individuals to process their personal data (or reliance on another appropriate legal basis) for certain data processing activities. It also significantly increased penalties for noncompliance, including where we act as a data processor. Although we have executed intracompany “Standard Contractual Clauses” in compliance with the GDPR, which allow for the transfer of personal data from the EU to other jurisdictions (including the United States), data security and data protection laws and regulations are continuously evolving. There are currently a number of legal challenges to the validity of EU mechanisms for adequate data transfers (such as the Privacy Shield Framework and the Standard Contractual Clauses), and our work could be impacted by changes in law as a result of a future review of these transfer mechanisms by European regulators under the GDPR, as well as current challenges to these mechanisms in the European courts. Brexit may also mean that we are required to take additional steps to ensure that data flows from EU members states to the United Kingdom are not disrupted and remain permissible after the exit date.
28
In recent years, U.S. and European lawmakers and regulators have expressed concern over electronic marketing and the use of third-party cookies, web beacons and similar technology for online behavioral advertising. In the EU, marketing is defined broadly to include any promotional material and the rules specifically on e-marketing are currently set out in the ePrivacy Directive which will be replaced by a new ePrivacy Regulation. While no official time frame has been given for the ePrivacy Regulation, there will be a transition period after the ePrivacy Regulation is agreed for compliance, and commentators consider it unlikely to come into force before 2021. We are likely to be required to expend further capital and other resources to ensure compliance with these changing laws and regulations.
The ePrivacy Regulation will be directly implemented into the laws of each of the EU Member States, without the need for further enactment. When implemented, the ePrivacy Regulation is expected to alter rules on third-party cookies, web beacons and similar technology for online behavioral advertising and to impose stricter requirements on companies using these tools. Regulation of cookies and web beacons may lead to broader restrictions on our online activities, including efforts to understand followers’ Internet usage and promote ourselves to them. The current draft of the ePrivacy Regulation significantly increases fining powers to the same levels as the GDPR. Given the delay in finalizing the ePrivacy Regulation, certain EU regulators have issued guidance (including UK and French data protection regulators) on the requirement to seek strict opt-in, unbundled consent to use all nonessential cookies. We will need to make changes to our cookies notice to meet these requirements but we do not anticipate that the new regulation will significantly adversely affect us.
In addition, California has enacted the California Consumer Privacy Act, or CCPA, which became effective on January 1, 2020. The CCPA requires new disclosures to California consumers, imposes new rules for collecting or using information, requires companies to comply with data subject access and deletion requests, and affords California consumers new abilities to opt out of certain disclosures of personal information. It remains unclear what, if any, regulations will be implemented pursuant to the law or how it will be interpreted. However, as passed, the effects of the CCPA potentially are significant and may require us to modify our data collection or processing practices and policies and to incur substantial costs and expenses in an effort to comply.
Although we have implemented policies and procedures that are designed to ensure compliance with applicable laws, rules and regulations, if our privacy or data security measures fail to comply with applicable current or future laws and regulations, we may be subject to fines, litigation, regulatory investigations, enforcement notices requiring us to change the way we use personal data or our marketing practices or other liabilities such as compensation claims by individuals affected by a personal data breach, as well as negative publicity and a potential loss of business. Fines are significant in some countries (e.g., the GDPR introduced fines of up to €20,000,000 or up to 4% of the total worldwide annual turnover of the preceding financial year (whichever is higher)) as well as litigation, compensation claims by affected individuals (including class action type litigation where individuals suffer harm), regulatory investigations and enforcement notices requiring us to change the way we use personal data.
Actions by governments that restrict access to our platform in their countries could substantially harm our business and financial results.
Governments of one or more countries in which we operate from time to time seek to censor the Internet, restrict access to selected foreign websites from their country, or otherwise impose restrictions if they consider such information or the provision thereof is in violation of their laws or regulations.
Governmental authorities in other countries may seek to restrict user access to our products if they consider us to be in violation of their laws or for other reasons. In the event that the information and analytics provided on our platform is subject to censorship, or any governmental authorities restrict access to our products, or our competitors are able to successfully penetrate new geographic markets or capture a greater share of existing geographic markets that we cannot access or where we face restrictions, our ability to maintain or expand our geographical markets may be adversely affected, and our business operations and financial results could be adversely affected.
29
We may face IP infringement claims that could be costly to defend and result in our loss of significant rights.
From time to time, we may receive notices from third parties claiming infringement by our products and services of third-party patent and other IP rights. As the number of products and services in our markets increases and the functionality of these products and services further overlaps with third-party products and services, we may become increasingly subject to claims by a third party that our products and services infringe on such party’s IP rights. In addition, there is a growing occurrence of patent suits being brought by non-practicing organizations that use patents to generate revenues without manufacturing, promoting or marketing products or investing in R&D in bringing products to markets. These organizations continue to be active and target whole industries as defendants. We may not prevail in any such suit given the complex technical issues and inherent uncertainties in IP litigation. If an infringement suit against us is successful, we may be required to compensate the third party bringing the suit either by paying a lump sum or ongoing license fees to be able to continue selling a particular product or service. This type of compensation could be significant. We might also be prevented or enjoined by a court from continuing to provide the affected product or service and may be forced to significantly increase our development efforts and resources to redesign such product or service. We may also be required to defend or indemnify any customers, partners or agents who have been sued for allegedly infringing a third party’s patent in connection with using one of our products or services. Responding to IP claims, regardless of the validity, can be time-consuming for our personnel and management, result in costly litigation, cause product shipment delays, cause unavailability of our products or services delivered electronically and harm our reputation, any of which could adversely affect our results of operations.
We operate in a litigious environment which may adversely affect our financial results.
We may become involved in legal actions and claims arising in the ordinary course of business, including litigation regarding employment matters, breach of contract and other commercial matters. Due to the inherent uncertainty in the litigation process, the resolution of any particular legal proceeding could result in changes to our products and business practices and could have a material adverse effect on our financial position and results of operations.
We may need to recognize impairment charges related to goodwill, identified intangible assets and fixed assets.
We have substantial balances of goodwill and identified intangible assets. We are required to test goodwill and any other intangible assets with an indefinite life for possible impairment on an annual basis, or more frequently when circumstances indicate that impairment may have occurred. We are also required to evaluate amortizable intangible assets and fixed assets for impairment if there are indicators of a possible impairment.
Based on the results of the annual impairment test as of October 1, 2019, the fair values of our reporting units exceeded the individual reporting unit’s carrying value, and goodwill was not impaired. We did not identify any impairment triggers as of December 31, 2019, except for the sale of the Brand Protection, AntiPiracy, and AntiFraud solutions of the MarkMonitor Product Line. For information on the MarkMonitor Product Line sale, see “Item 8. – Financial Statements and Supplementary Data – Notes to the Consolidated Financial Statements – Note 5.”
There is significant judgment required in the analysis of a potential impairment of goodwill, identified intangible assets and fixed assets. If, as a result of a general economic slowdown, deterioration in one or more of the markets in which we operate or impairment in our financial performance and/or future outlook, the estimated fair value of our long-lived assets decreases, we may determine that one or more of our long-lived assets is impaired. An impairment charge would be recorded if the estimated fair value of the assets is lower than the carrying value and any such impairment charge could have a material adverse effect on our results of operations and financial position.
30
If we fail to maintain an effective system of disclosure controls and internal control over financial reporting, our ability to produce timely and accurate financial statements or comply with applicable regulations could be impaired.
The Sarbanes-Oxley Act requires, among other things, that we maintain effective disclosure controls and procedures and internal control over financial reporting. In particular, Section 404 of the Sarbanes-Oxley Act (“Section 404”) will require us to perform system and process evaluation and testing of our internal control over financial reporting to allow management to report on, and our independent registered public accounting firm to attest to, the effectiveness of our internal control over financial reporting. We will be required to provide an annual management report on the effectiveness of our internal control over financial reporting commencing with the annual report that we file for the fiscal year ended December 31, 2020. Pursuant to Section 404, once we are no longer an “emerging growth company,” we will also be required to include with such annual report an attestation report on internal control over financial reporting issued by our independent registered public accounting firm. At such time, our independent registered public accounting firm may issue a report that is adverse in the event, in their opinion, the Company has not maintained, in all material respects, effective internal control over financial reporting based on criteria established in Internal Control - Integrated Framework (2013) issued by the Committee of Sponsoring Organizations of the Treadway Commission (COSO). Any failure to maintain effective disclosure controls and internal control over financial reporting could have a material and adverse effect on our business, results of operations and financial condition and could cause a decline in the trading price of our ordinary shares.
We are continuing to develop and refine our disclosure controls and other procedures that are designed to ensure that information required to be disclosed by us in the reports that we will file with the SEC is recorded, processed, summarized and reported within the time periods specified in SEC rules and forms and that information required to be disclosed in reports under the Exchange Act is accumulated and communicated to our principal executive and financial officers. We are also continuing to improve our internal control over financial reporting. In order to develop, maintain and improve the effectiveness of our disclosure controls and procedures and internal control over financial reporting, we have expended, and anticipate that we will continue to expend, significant resources, including accounting-related and audit-related costs and significant management oversight.
Our current controls and any new controls that we develop may become inadequate because of changes in conditions in our business. Further, weaknesses in our disclosure controls and internal control over financial reporting may be discovered in the future. Any failure to develop or maintain effective controls or any difficulties encountered in their implementation or improvement could harm our results of operations or cause us to fail to meet our reporting obligations and may result in a restatement of our consolidated financial statements for prior periods. Any failure to implement and maintain effective internal control over financial reporting could also adversely affect the results of periodic management evaluations and annual independent registered public accounting firm attestation reports regarding the effectiveness of our internal control over financial reporting that we will eventually be required to include in our periodic reports that will be filed with the SEC. Ineffective disclosure controls and procedures and internal control over financial reporting could also cause investors to lose confidence in our reported financial and other information, which would likely have a negative effect on the trading price of Clarivate shares. In addition, if we are unable to continue to meet these requirements, we may not be able to remain listed on the NYSE.
We have and will continue to have high levels of indebtedness and our relatively large fixed costs magnify the impact of revenues fluctuations on our operating results.
We had approximately $1,665,000 of indebtedness as of December 31, 2019, primarily consisting of $900,000 outstanding under our term loan facility, $700,000 outstanding under our secured notes due 2026, and $65,000 outstanding under our $250,000 revolving credit facility. These notes and credit facilities were originally entered into in October 2019. We used net proceeds from the sale of our secured notes due 2026, together with initial proceeds from our credit facilities to, among other things, redeem our prior 7.875% senior notes due 2024, refinance all amounts under our prior credit facilities, fund the termination of the tax receivable agreement and pay fees and expenses related to the foregoing. In February 2020, we repaid all amounts drawn under our revolving credit facility. In addition, we incurred an incremental $360,000 of term loans under our term loan facility in connection with the DRG acquisition.
31
Because borrowings under our term loan facility bear interest at variable rates, any increase in interest rates on debt that we have not fixed using interest rate hedges will increase our interest expense, reduce our cash flow or increase the cost of future borrowings or refinancings. Our indebtedness could have important consequences to our investors, including, but not limited to:
| • | increasing vulnerability to, and reducing its flexibility to respond to, general adverse economic and industry conditions; | |
| • | requiring the dedication of a substantial portion of cash flow from operations to the payment of principal of, and interest on, its indebtedness, thereby reducing the availability of such cash flow to fund working capital, capital expenditures, acquisitions, joint ventures or other general corporate purposes; | |
| • | limiting flexibility in planning for, or reacting to, changes in its business and the competitive environment; and | |
| • | limiting our ability to borrow additional funds and increasing the cost of any such borrowing. |
Other than variable rate debt, we believe our business has relatively large fixed costs and low variable costs, which magnifies the impact of revenues fluctuations on our operating results. As a result, a decline in our revenues may lead to a relatively larger impact on operating results. A substantial portion of our operating expenses will be related to personnel costs, regulation and corporate overhead, none of which can be adjusted quickly and some of which cannot be adjusted at all. Our operating expense levels will be based on our expectations for future revenues. If actual revenues are below management’s expectations, or if our expenses increase before revenues do, both revenues less transaction-based expenses and operating results would be materially and adversely affected. Because of these factors, it is possible that our operating results or other operating metrics may fail to meet the expectations of stock market analysts and investors. If this happens, the market price of our ordinary shares may be adversely affected.
A downgrade to our credit ratings would increase our cost of borrowing and adversely affect our ability to access the capital markets.
Our cost of borrowing under our credit facilities and our ability and the terms under which we may access the credit markets are affected by credit ratings assigned to us by the major credit rating agencies. These ratings are premised on our performance under assorted financial metrics and other measures of financial strength, business and financial risk, industry conditions, timeliness of financial reporting, and other factors determined by the credit rating agencies. Our current ratings have served to lower our borrowing costs and facilitate access to a variety of lenders. However, there can be no assurance that our credit ratings or outlook will not be lowered in the future in response to adverse changes in these metrics and factors caused by our operating results or by actions that we take, that reduce our profitability, or that require us to incur additional indebtedness for items such as substantial acquisitions, significant increases in costs and capital spending in security and IT systems, significant costs related to settlements of litigation or regulatory requirements, or by returning excess cash to shareholders through dividends. A downgrade of our credit ratings would increase our cost of borrowing, negatively affect our ability to access the capital markets on advantageous terms, or at all, negatively affect the trading price of our securities, and have a significant negative impact on our business, financial condition, and results of operations.
We are a holding company that depends on cash flow from our subsidiaries to meet our obligations, and any restrictions on our subsidiaries’ ability to pay dividends or make other payments to us may have a material adverse effect on our results of operations and financial condition.
As a holding company, we require dividends and other payments from our subsidiaries to meet cash requirements. Minimum capital requirements mandated by regulatory authorities having jurisdiction over some of our regulated subsidiaries indirectly restrict the amount of dividends paid upstream. In addition, repatriations of cash from our subsidiaries may be subject to withholding, income and other taxes in various applicable jurisdictions. If our subsidiaries are unable to pay dividends and make other payments to us when needed, we may be unable to satisfy our obligations, which would have a material adverse effect on our business, financial condition and operating results.
32
Our articles of association contain anti-takeover provisions that could adversely affect the rights of our shareholders.
Our articles of association contain provisions to limit the ability of others to acquire control of our Company or cause us to engage in change of control transactions, including, among other things:
| • | provisions that authorize our board of directors, without action by our shareholders, to issue additional ordinary shares and preferred shares with preferential rights determined by our board of directors; | |
| • | provisions that permit only a majority of our board of directors or one or more of our shareholders who together hold at least 10% of the voting rights of our shareholders to call shareholder meetings; | |
| • | provisions that impose advance notice requirements, minimum shareholding periods and ownership thresholds, and other requirements and limitations on the ability of shareholders to propose matters for consideration at shareholder meetings; provided, however, such advance notice procedure will not apply to Onex, Baring or Jerre Stead or his successor (as the “Designated Shareholder” under the Director Nomination Agreement entered into in connection with our merger with Churchill Capital Corp) for so long as such person is entitled to nominate one or more members of our board of directors pursuant to our Shareholders Agreement or the Director Nomination Agreement; and | |
| • | a staggered board whereby our directors are divided into three classes, with each class subject to retirement and re-election once every three years on a rotating basis. |
These provisions could have the effect of depriving our shareholders of an opportunity to sell their shares at a premium over prevailing market prices by discouraging third parties from seeking to obtain control of our company in a tender offer or similar transaction. With our staggered board of directors, at least two annual general meetings of shareholders will generally be required in order to effect a change in a majority of our directors. Our staggered board of directors can discourage proxy contests for the election of our directors and purchases of substantial blocks of our shares by making it more difficult for a potential acquirer to gain control of our board of directors in a relatively short period of time.
If a U.S. person is treated as owning at least 10% of our ordinary shares, such holder may be subject to adverse U.S. federal income tax consequences.
If a U.S. person is treated as owning (directly, indirectly or constructively) at least 10% of the value or voting power of our ordinary shares, such person may be treated as a “United States shareholder” with respect to us or to any of our subsidiaries that constitute a “controlled foreign corporation” (in each case, as such terms are defined under the Internal Revenue Code of 1986, as amended (the “Code”)). Certain United States shareholders of a controlled foreign corporation may be required to annually report and include in its U.S. taxable income, as ordinary income, its pro rata share of “Subpart F income,” “global intangible low-taxed income” and certain investments in U.S. property by controlled foreign corporations, whether or not we make any distributions to such United States shareholder. A failure by a United States shareholder to comply with its reporting obligations may subject the United States shareholder to significant monetary penalties and other adverse tax consequences, and may extend the statute of limitations with respect to the United States shareholder’s U.S. federal income tax return for the year for which such reporting was due. We cannot provide any assurances that we will assist investors in determining whether we or any of our non-U.S. subsidiaries are controlled foreign corporations or whether any investor is a United States shareholder with respect to any such controlled foreign corporations. We also cannot guarantee that we will furnish to United States shareholders information that may be necessary for them to comply with the aforementioned obligations. United States investors should consult their own advisors regarding the potential application of these rules to their investments in us. The risk of being subject to increased taxation may deter our current shareholders from increasing their investment in us and others from investing in us, which could impact the demand for, and value of, our ordinary shares.
33
If we are characterized as a passive foreign investment company for U.S. federal income tax purposes, our U.S. shareholders may suffer adverse tax consequences.
If 75% or more of our gross income in a taxable year, including our pro rata share of the gross income of any company, U.S. or foreign, in which we are considered to own, directly or indirectly, 25% or more of the shares by value, is passive income, then we will be a passive foreign investment company (“PFIC”) for U.S. federal income tax purposes. Alternatively, we will be considered to be a PFIC if at least 50% of our assets in a taxable year, averaged over the year and ordinarily determined based on fair market value and including our pro rata share of the assets of any company in which we are considered to own, directly or indirectly, 25% or more of the shares by value, are held for the production of, or produce, passive income. Once treated as a PFIC, for any taxable year in which a U.S. Holder owns equity in such foreign corporation, a foreign corporation will generally continue to be treated as PFIC for all subsequent taxable years with respect to such U.S. Holder. If we were to be a PFIC, and a U.S. Holder does not make an election to treat us as a qualified electing fund (“QEF”) or a “mark-to-market” election, “excess distributions” to a U.S. Holder, and any gain recognized by a U.S. Holder on a disposition of our ordinary shares, would be taxed in an unfavorable way. Among other consequences, our dividends would be taxed at the regular rates applicable to ordinary income, rather than the 20% maximum rate applicable to certain dividends received by an individual from a qualified foreign corporation, and, to the extent that they constituted excess distributions, certain “interest” charges may apply. In addition, gains on the sale of our shares would be treated in the same way as excess distributions. The tests for determining PFIC status are applied annually and it is difficult to make accurate predictions of future income and assets, which are relevant to the determination of PFIC status. Based on the current composition of our income and assets, we do not believe that we were a PFIC in 2019, and do not currently expect to become a PFIC in the future. However, because the PFIC asset and income tests are applied on an annual basis, there can be no assurance that we will not be a PFIC in the current taxable year or any future taxable year. If we do become a PFIC in the future, U.S. Holders who hold ordinary shares during a period when we are a PFIC will be subject to the foregoing rules, even if we cease to be a PFIC, subject to exceptions for U.S. Holders who made a timely QEF mark-to-market election, or certain other elections. We do not currently intend to prepare or provide the information that would enable you to make a QEF election. Accordingly, our shareholders are urged to consult their tax advisors regarding the application of PFIC rules.
Future resales of our ordinary shares and/or warrants may cause the market price of our securities to drop significantly, even if our business is doing well.
Onex, Baring and other parties have been granted rights pursuant to a registration rights agreement to require us to register, in certain circumstances, the resale under the Securities Act of ordinary shares of us or warrants held by them, subject to certain conditions. The sale or possibility of sale of these ordinary shares and/or warrants could have the effect of increasing the volatility in our share price or putting significant downward pressure on the price of our ordinary shares and/or warrants.
We may issue additional ordinary shares or other equity securities without your approval, which would dilute your ownership interests and may depress the market price of Clarivate’s ordinary shares.
As of December 31, 2019 we have warrants outstanding to purchase an aggregate of 52,699,886 ordinary shares, that includes 34,399,886 public warrants and approximately 18,300,000 private warrants. During the period January 1, 2020 through February 21, 2020, 24,132,666 of the Company’s outstanding warrants were exercised for one ordinary share per whole warrant at a price of $11.50 per share and on February 20, 2020, we issued a notice to redeem all remaining outstanding public warrants that would result in 4,749,616 shares being issued (assuming all such public warrants called for redemption on March 23, 2020 are exercised prior to redemption). In addition, certain of our current and former employees and service providers hold options to purchase ordinary shares pursuant to the Clarivate Analytics Plc 2019 Incentive Award Plan. Pursuant to this plan, Clarivate may issue an aggregate of up to 60,000,000 ordinary shares, which amount may be subject to increase from time to time. Clarivate may also issue additional ordinary shares or other equity securities of equal or senior rank in the future in connection with, among other things, future acquisitions or repayment of outstanding indebtedness, without shareholder approval, in a number of circumstances.
Our issuance of additional ordinary shares or other equity securities of equal or senior rank would have the following effects:
| • | our existing shareholders’ proportionate ownership interest in us will decrease; | |
| • | the amount of cash available per share, including for payment of dividends in the future, may decrease; | |
| • | the relative voting strength of each previously outstanding ordinary share may be diminished; and | |
| • | the market price of our ordinary shares may decline. |
34
You may face difficulties in protecting your interests as a shareholder, as Jersey law provides substantially less protection when compared to the laws of the United States.
We are incorporated under Jersey law. The rights of holders of ordinary shares are governed by Jersey law, including the provisions of the Companies (Jersey) Law 1991, as amended (the “Jersey Companies Law”), and by our articles of association. These rights differ in certain respects from the rights of shareholders in typical U.S. corporations.
It may be difficult to enforce a U.S. judgment against us or our directors and officers outside the United States, or to assert U.S. securities law claims outside of the United States.
A number of our directors and executive officers are not residents of the United States, and the majority of our assets and the assets of these persons are located outside the United States. As a result, it may be difficult or impossible for investors to effect service of process upon us within the United States or other jurisdictions, including judgments predicated upon the civil liability provisions of the federal securities laws of the United States. Additionally, it may be difficult to assert U.S. securities law claims in actions originally instituted outside of the United States. Foreign courts may refuse to hear a U.S. securities law claim because foreign courts may not be the most appropriate forum in which to bring such a claim. Even if a foreign court agrees to hear a claim, it may determine that the law of the jurisdiction in which the foreign court resides, and not U.S. law, is applicable to the claim. Further, if U.S. law is found to be applicable, the content of applicable U.S. law must be proved as a fact, which can be a time-consuming and costly process, and certain matters of procedure would still be governed by the law of the jurisdiction in which the foreign court resides.
Uncertainty relating to the likely phasing out of LIBOR by 2021 may result in our paying increased interest under our credit facilities.
In July 2017, the U.K. Financial Conduct Authority, which regulates LIBOR, announced that it will no longer persuade or compel banks to submit rates for the calculation of LIBOR after 2021. As a result, the continuation of LIBOR on its current basis is not guaranteed after 2021, and currently it appears highly likely that LIBOR will be discontinued or substantially modified by 2021.
Borrowings under our credit facilities bear interest at rates determined using LIBOR as the reference rate. At this time, it is not possible to predict the effect that any discontinuance, modification or other reform of LIBOR or any other reference rate, or the establishment of alternative reference rates, may have on LIBOR, other benchmarks, or LIBOR-based debt instruments such as our credit facilities. However, the use of alternative reference rates or other reforms could cause the interest rates payable under our credit facilities to be substantially higher than we would otherwise have expected.
35
CAUTIONARY STATEMENT REGARDING FORWARD-LOOKING STATEMENTS
This annual report includes statements that express our opinions, expectations, beliefs, plans, objectives, assumptions or projections regarding future events or future results and therefore are, or may be deemed to be, “forward-looking statements.” These forward-looking statements can generally be identified by the use of forward-looking terminology, including the terms “believes,” “estimates,” “anticipates,” “expects,” “seeks,” “projects,” “intends,” “plans,” “may,” “will” or “should” or, in each case, their negative or other variations or comparable terminology. These forward-looking statements include all matters that are not historical facts. They appear in a number of places throughout this annual report and include statements regarding our intentions, beliefs or current expectations concerning, among other things, anticipated cost savings, results of operations, financial condition, liquidity, prospects, growth, strategies and the markets in which we operate. Such forward-looking statements are based on available current market material and management’s expectations, beliefs and forecasts concerning future events impacting us. Factors that may impact such forward-looking statements include:
| • | our ability to make, consummate and integrate acquisitions, including the DRG acquisition, and realize any expected benefits or effects of any acquisitions or the timing, final purchase price, costs associated with achieving synergies or integration or consummation of any acquisitions, including the DRG acquisition; |
| • | our ability to compete in the highly competitive markets in which we operate, and potential adverse effects of this competition; |
| • | our ability to maintain revenues if our products and services do not achieve and maintain broad market acceptance, or if we are unable to keep pace with or adapt to rapidly changing technology, evolving industry standards and changing regulatory requirements; |
| • | our ability to achieve all expected benefits from the items reflected in the adjustments included in Standalone Adjusted EBITDA, a non-GAAP measure; |
| • | our ability to achieve operational cost improvements and other anticipated benefits of our merger with Churchill Capital Corp in 2019; |
| • | our dependence on third parties, including public sources, for data, information and other services; |
| • | increased accessibility to free or relatively inexpensive information sources; |
| • | our ability to maintain high annual revenue renewal rates as recurring subscription-based arrangements generate a significant percentage of our revenues; |
| • | any significant disruption in or unauthorized access to our computer systems or those of third parties that we utilize in our operations, including those relating to cybersecurity or arising from cyber-attacks; |
| • | our reliance on our own and third-party telecommunications, data centers and network systems, as well as the Internet; |
| • | potential adverse tax consequences resulting from the international scope of our operations, corporate structure and financing structure; |
36
| • | increased risks resulting from our international operations; |
| • | our ability to comply with various trade restrictions, such as sanctions and export controls, resulting from our international operations; |
| • | our ability to comply with the anti-corruption laws of the United States and various international jurisdictions; |
| • | the United Kingdom’s withdrawal from the EU; |
| • | fraudulent or unpermitted data access, cyber-security attacks, or other privacy breaches; |
| • | government and agency demand for our products and services and our ability to comply with government contracting regulations; |
| • | changes in legislation and regulation, which may impact how we provide products and services and how we collect and use information, particularly relating to the use of personal data; |
| • | actions by governments that restrict access to our platform in their countries; |
| • | potential intellectual property infringement claims; |
| • | our ability to operate in a litigious environment; |
| • | our potential need to recognize impairment charges related to goodwill, identified intangible assets and fixed assets; |
| • | our ability to make timely and accurate financial disclosure and maintain effective systems of internal controls; |
| • | our substantial indebtedness, which could adversely affect our financial condition, limit our ability to raise additional capital to fund our operations and prevent us from fulfilling our obligations under our indebtedness; and |
| • | other factors beyond our control. |
The forward-looking statements contained in this annual report are based on our current expectations and beliefs concerning future developments and their potential effects on us. There can be no assurance that future developments affecting us will be those that we have anticipated. These forward-looking statements involve a number of risks and uncertainties (some of which are beyond our control) or other assumptions that may cause actual results or performance to be materially different from those expressed or implied by these forward-looking statements. These risks and uncertainties include, but are not limited to, those factors described under the heading “Item 1A. Risk Factors.” Should one or more of these risks or uncertainties materialize, or should any of the assumptions prove incorrect, actual results may vary in material respects from those projected in these forward-looking statements. We will not undertake any obligation to update or revise any forward-looking statements, whether as a result of new information, future events or otherwise, except as may be required under applicable securities laws.
37
Item 1B. Unresolved Staff Comments
None.
The Company’s primary office spaces as of January 1, 2020 are represented in the table below:
| Location | Space Leased | Lease Expiration | ||
| Philadelphia, Pennsylvania, USA | 123,853 square feet | October 2029 | ||
| Bangalore, India | 56,891 square feet | July 2024 | ||
| Hyderabad, India | 54,064 square feet | July 2023 | ||
| London, UK | 49,794 square feet | December 2028 | ||
| Chennai, India | 47,522 square feet | February 2020 | ||
| Boston, Massachusetts, USA | 35,023 square feet | October 2024 | ||
| Barcelona, Spain | 33,387 square feet | October 2023 | ||
| Bangalore, India | 30,122 square feet | March 2027 | ||
| Tokyo, Japan | 29,787 square feet | May 2022 | ||
| Antwerp, Belgium | 27,459 square feet | December 2024 | ||
| San Francisco, California, USA | 18,905 square feet | October 2025 | ||
| Beijing, China | 17,039 square feet | August 2020 |
We believe that our properties, taken as a whole, are in good operating condition, are suitable and adequate for our current business operations, and that additional or alternative space will be available on commercially reasonable terms for future use and expansion.
From time to time, we are a party to various lawsuits, claims and other legal proceedings that arise in the ordinary course of our business. While the outcomes of these matters are uncertain, management does not expect that the ultimate costs to resolve these matters will have a material adverse effect on our consolidated financial position, results of operations or cash flows.
38
Item 4. Mine Safety Disclosures
Not applicable.
Item 5. Market for Registrant’s Common Equity, Related Stockholder Matters and Issuer Purchases of Equity Securities
Market Price of Ordinary Shares and Warrants
Our ordinary shares are traded on the NYSE under the symbol CCC and our warrants are traded on the NYSE American under the symbol CCC.WS. The following table sets forth the high and low sales prices for the ordinary shares and warrants since they commenced separate trading on October 29, 2018.
| Ordinary Shares | Warrants | |||||||||||||||
| High | Low | High | Low | |||||||||||||
| 2019: | ||||||||||||||||
| Fourth Quarter | $ | 18.05 | $ | 15.72 | $ | 6.68 | $ | 5.25 | ||||||||
| Third Quarter | $ | 17.68 | $ | 15.03 | $ | 6.34 | $ | 4.47 | ||||||||
| Second Quarter | $ | 15.38 | $ | 12.92 | $ | 4.75 | $ | 3.25 | ||||||||
| First Quarter | $ | 13.59 | $ | 9.58 | $ | 3.37 | $ | 0.73 | ||||||||
| 2018: | ||||||||||||||||
| Fourth Quarter | $ | 9.61 | $ | 9.54 | $ | 1.20 | $ | 0.87 | ||||||||
Holders
As of December 31, 2019 there were 38 holders of record of ordinary shares and 9 holders of record of warrants. A substantially greater number of holders of our ordinary shares are “street name” or beneficial holders, whose shares of record are held by banks, brokers, and other financial institutions.
Dividends
We did not pay any dividends to stockholders during the year ended December 31, 2019. We presently intend to retain our earnings for use in business operations and, accordingly, we do not anticipate that our board will declare dividends in the foreseeable future. In addition, the terms of our credit facilities and the indenture governing our secured notes due 2026 include restrictions that may impact our ability to pay dividends.
39
Securities Authorized for Issuance Under Equity Compensation Plans
The following table sets forth information as of December 31, 2019, with respect to compensation plans under which equity securities are authorized for issuance.
| Equity Compensation Plan Information | ||||||||||||
| Number of securities to be issued upon exercise of outstanding options, warrants and rights ( a ) | Weighted-average exercise price of outstanding options, warrants, and rights ( b ) | Number of securities remaining available for issuance under equity compensation plans (excluding securities reflected in column (a)) ( c ) | ||||||||||
| Equity Compensation Plans Approved by Security Holders | ||||||||||||
| 2019 Incentive Award Plan | 21,173,407 | (2) | $ | 12.18 | (3) | 37,302,599 | (4) | |||||
| Equity Compensation Plans Not Approved by Security Holders(1) | ||||||||||||
| Warrants | 52,699,886 | $ | 11.50 | N/A | ||||||||
| Merger Shares | 7,000,000 | N/A | N/A | |||||||||
| Total | 73,873,293 | N/A | N/A | |||||||||
(1) See “Item 11. Executive Compensation — Compensation Committee Interlocks and Insider Participation”. See “Item 8. Financial Statements and Supplementary Data — Notes to the Consolidated Financial Statements — Note 16” for information regarding the Warrants and the Merger Shares.
(2) Includes (a) 20,880,225 stock options and (b) 293,182 restricted share units that were issued with no exercise price or other consideration.
(3) The weighted-average exercise price is reported for the outstanding stock options reported in the first column. There are no exercise prices for the restricted share units.
(4) The total number of securities remaining available for issuance under equity compensation plans may be issued under the 2019 Incentive Award Plan.
Issuer Purchases of Equity Securities
None.
40
Performance Graph
The following graph compares our total cumulative stockholder return with the Standard & Poor’s Composite Stock Index (“S&P 500”) and a market capitalization-weighted peer index consisting of FactSet Research Systems Inc., Gartner, Inc., IHS Markit Ltd., Moody’s Corporation, MSCI Inc., S&P Global Inc. and Verisk Analytics, Inc.
The graph assumes a $100 cash investment on May 14, 2019 and the reinvestment of all dividends, where applicable. This graph is not indicative of future financial performance. The following graph is not filed but is furnished pursuant to Regulation S-K Item 201(e), Instruction 7.
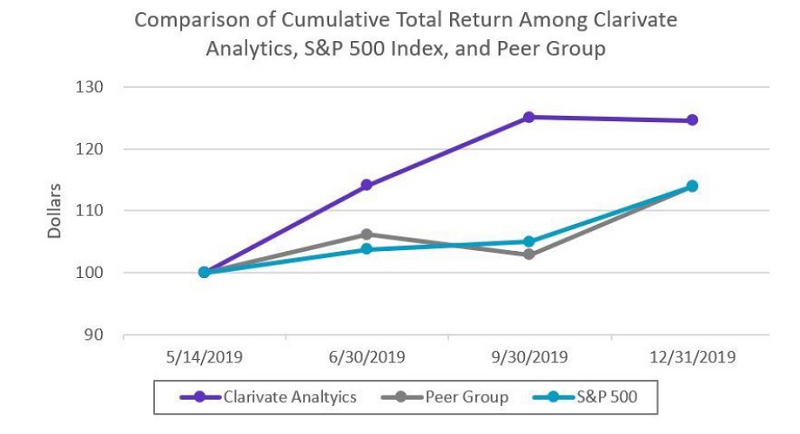
Recent Sales of Unregistered Equity; Use of Proceeds from Registered Offerings
In March 2017, the Company adopted the management incentive plan under which certain employees of the Company may be eligible to purchase shares of the Company. In exchange for each share purchase subscription, the purchaser is entitled to a fully vested right to an ordinary share. Additionally, along with a subscription, employees receive a corresponding number of options to acquire additional ordinary shares subject to five year vesting. The Company did not receive any subscriptions during the year ended December 31, 2019. The Company received net subscriptions for 198,602 during the year ended December 31, 2018. As of December 31, 2019, there were 358,313 shares issued and outstanding under the management incentive plan. The Company believes that these grants, and the vesting of ordinary shares pursuant to such grants, did and do not require registration under the Securities Act because these securities were offered in transactions exempt from registration under the Securities Act. None of the foregoing transactions involved any underwriters, underwriting discounts or commissions or any public offering.
Item 6. Selected Financial Data
The Company’s Consolidated Balance Sheet data as of December 31, 2019 and 2018 and Consolidated Statements of Operations, of Comprehensive Loss, and of Cash Flow data for the years ended December 31, 2019, 2018 and 2017 are derived from the Company’s audited financial statements, included in Item 8 of this annual report.
This information is only a summary and should be read in conjunction with the Company’s Consolidated Financial Statements and “Item 7. Management’s Discussion and Analysis of Financial Condition and Results of Operations." The historical results included below and elsewhere in this annual report are not indicative of the future performance of the Company. All amounts are in US dollars. Certain amounts that appear in this section may not sum due to rounding.
41
| Year Ended December 31, | ||||||||||||
| 2019(1)(2) | 2018(3)(4) | 2017(5) | ||||||||||
| (in thousands, except share and per share data) | ||||||||||||
| Statement of Operations Data: | ||||||||||||
| Revenues, net | $ | 974,345 | $ | 968,468 | $ | 917,634 | ||||||
| Cost of revenues, excluding depreciation and amortization | (346,503 | ) | (396,499 | ) | (394,215 | ) | ||||||
| Selling, general and administrative, excluding depreciation and amortization | (368,675 | ) | (369,377 | ) | (343,143 | ) | ||||||
| Share-based compensation | (51,383 | ) | (13,715 | ) | (17,663 | ) | ||||||
| Depreciation | (9,181 | ) | (9,422 | ) | (6,997 | ) | ||||||
| Amortization | (191,361 | ) | (227,803 | ) | (221,466 | ) | ||||||
| Impairment on assets held for sale | (18,431 | ) | — | — | ||||||||
| Transaction expenses | (46,214 | ) | (2,457 | ) | (2,245 | ) | ||||||
| Transition, integration and other related expenses | (14,239 | ) | (61,282 | ) | (78,695 | ) | ||||||
| Restructuring | (15,670 | ) | — | — | ||||||||
| Legal settlement | 39,399 | — | — | |||||||||
| Other operating income (expense), net | 4,826 | 6,379 | (237 | ) | ||||||||
| Total operating expenses | (1,017,432 | ) | (1,074,176 | ) | (1,064,661 | ) | ||||||
| Loss from operations | (43,087 | ) | (105,708 | ) | (147,027 | ) | ||||||
| Interest expense, net | (157,689 | ) | (130,805 | ) | (138,196 | ) | ||||||
| Loss before income tax | (200,776 | ) | (236,513 | ) | (285,223 | ) | ||||||
| Benefit (provision) for income taxes | (10,201 | ) | (5,649 | ) | 21,293 | |||||||
| Net loss | $ | (210,977 | ) | $ | (242,162 | ) | $ | (263,930 | ) | |||
| Loss from operations per ordinary share | $ | (0.77 | ) | $ | (1.11 | ) | $ | (1.22 | ) | |||
| Year Ended December 31, | ||||||||||||
| 2019 | 2018 | 2017 | ||||||||||
| (in thousands) | ||||||||||||
| Statement of Cash Flows data: | ||||||||||||
| Net cash provided by (used in): | ||||||||||||
| Operating activities | $ | 117,580 | $ | (26,100 | ) | $ | 6,667 | |||||
| Investing activities | (140,885 | ) | 11,934 | (40,205 | ) | |||||||
| Financing activities | $ | 75,215 | $ | (32,605 | ) | $ | 22,818 | |||||
| Other Financial Data: | ||||||||||||
| Capital expenditures | $ | (69,836 | ) | $ | (45,410 | ) | $ | (37,804 | ) | |||
42
| Year Ended December 31, | ||||||||||||
| 2019(6)(7)(8) | 2018 | 2017 | ||||||||||
| (in thousands) | ||||||||||||
| Balance Sheet data: | ||||||||||||
| Cash and cash equivalents | $ | 76,130 | $ | 25,575 | $ | 53,186 | ||||||
| Accounts receivable, net | 333,858 | 331,295 | 317,808 | |||||||||
| Computer hardware and other property, net | 18,042 | 20,641 | 23,010 | |||||||||
| Total assets | $ | 3,791,371 | $ | 3,709,674 | $ | 4,005,111 | ||||||
| Total long term liabilities | 1,779,961 | 2,015,353 | 2,057,932 | |||||||||
| Total long term debt | 1,628,611 | 1,930,177 | 1,967,735 | |||||||||
| Total shareholders’ equity | $ | 1,360,412 | $ | 1,050,607 | $ | 1,286,106 | ||||||
| (1) | In September 2019, the Company completed the acquisition of SequenceBase. SequenceBase has been included in our consolidated results of operations starting on the acquisition date. In November 2019, the Company completed the acquisition of Darts-ip. Darts-ip has been included in our consolidated results of operations starting on the acquisition date. |
| (2) | Includes $18,431 of asset impairment charges related to assets held for sale, $15,670 of restructuring charges, and $39,399 gain related to a legal settlement. |
| (3) | In October 2018, the Company completed the acquisition of TrademarkVision. TrademarkVision has been included in our consolidated results of operations starting on the acquisition date. |
| (4) | Includes $36,072 gain on the sale of a business and $33,819 loss related to the write down of a tax indemnity asset. |
| (5) | In June 2017, the Company completed the acquisition of Publons. Publons has been included in our consolidated results of operations starting on the acquisition date. |
| (6) | Reflects the impact of the adoption of ASC 842 Leases. See “Item 8. Financial Statements and Supplementary Data — Notes to the Consolidated Financial Statements — Note 3” for further discussion. |
| (7) | Includes the impact of October 2019 Refinancing Transaction. |
| (8) | Includes $200,000 related to the net impact of the tax receivable agreement and buyout agreement and $678,054 related to the merger recapitalization. |
43
Item 7. Management’s Discussion and Analysis of Financial Condition and Results of Operations
The following discussion should be read in conjunction with “Item 6. Selected Financial Data” and our Consolidated Financial Statements, including the notes thereto, included elsewhere in this annual report. Certain statements in this section are forward-looking statements that involve risks and uncertainties, such as statements regarding our plans, objectives, expectations and intentions. Our future results and financial condition may differ materially from those we currently anticipate as a result of the factors we describe under “Item 1A. Risk Factors.” Certain income statement amounts discussed herein are presented on an actual and on a constant currency basis. We calculate constant currency by converting the non-U.S. dollar income statement balances for the most current year to U.S. dollars by applying the average exchange rates of the preceding year. Certain amounts that appear in this section may not sum due to rounding.
Overview
We offer a collection of high quality, market leading information and analytic products and solutions through our Science and Intellectual Property (“IP”) Product Groups. Our Science Product Group consists of our Web of Science and Life Science Product Lines, and our IP Product Group consists of our Derwent, CompuMark and MarkMonitor Product Lines. Our highly curated Web of Science products are offered primarily to universities, helping them navigate scientific literature, facilitate research and evaluate and measure the quality of researchers, institutions and scientific journals across various academic disciplines. Our Life Sciences Product Line offerings serve the content and analytical needs of pharmaceutical and biotechnology companies across the drug development lifecycle, including content on discovery and pre-clinical research, competitive intelligence, regulatory information and clinical trials. Our Derwent Product Line offerings help patent and legal professionals in R&D intensive businesses evaluate the novelty and patentability of new ideas and products to help protect and research patents. Our CompuMark products and services allow businesses and legal professionals to access our comprehensive trademark database. Finally, our MarkMonitor offerings include enterprise web domain portfolio management products and services.
Factors Affecting the Comparability of Our Results of Operations
The following factors have affected the comparability of our results of operations between the periods presented in this annual report and may affect the comparability of our results of operations in future periods.
Our Transition to Operations as a Standalone Business
We began to transition to a standalone company in October 2016, when Onex and Baring acquired subsidiaries and assets comprising the intellectual property and science business of Thomson Reuters for approximately $3,600,000 and formed Clarivate.
Transition Services Agreement
At the time of our separation from Thomson Reuters in 2016, we entered into a transition services agreement with Thomson Reuters, pursuant to which Thomson Reuters provided us with certain transitional support services, including facilities management, human resources, accounting and finance, sourcing, certain data center services, and sales and marketing and other back office services. We have replaced all transition services agreement services by building up comparable internal functions during the course of 2017, 2018 and 2019, though we continued to rely to a limited extent on certain Thomson Reuters data center services until we complete our product migration to either Amazon Web Services, or our own systems in 2019. Pursuant to the transition services agreement, we paid Thomson Reuters a fee based on Thomson Reuters’ historical allocation for such services to our business when it was owned by Thomson Reuters. These transition services agreement fees amounted to $10,481, $55,764 and $89,942 in the years ended December 31, 2019, 2018 and 2017, respectively. Our standalone operating costs have differed substantially from the historical costs of services under the transition services agreement and may differ substantially in the future, which may impact the comparability of our results of operations between the periods presented in this annual report and with those for future periods.
44
Purchase Accounting Impact of Our Separation from Thomson Reuters in 2016
In addition, purchase accounting adjustments related to our separation from Thomson Reuters in 2016 included a revaluation of deferred revenues to account for the difference in value between the customer advances retained by us upon the consummation of our separation from Thomson Reuters in 2016 and our outstanding performance obligations related to those advances. The difference in value is written down as an adjustment to revenues as the related performance obligations, which cannot be recognized as revenues under GAAP, are fulfilled. This resulted in negative adjustments to revenues of $438, $3,152, and $49,673 in the years ended December 31, 2019, 2018 and 2017, respectively. As of December 31, 2019, the relevant performance obligations have been substantially fulfilled and the valuation difference has been written down. As a result, our consolidated revenues and margins are not comparable between the periods presented in this annual report and may not be comparable with those for future periods. To facilitate comparability between periods we present Adjusted Revenues in this annual report to eliminate, among other things, the impact of the deferred revenues adjustment. See “— Certain Non-GAAP Measures — Adjusted Revenues, Adjusted Subscription Revenues and Adjusted Transactional Revenues.”
Merger with Churchill Capital Corp.
In January 2019, we entered into an agreement to merge with Churchill Capital Corp, which closed in May 2019. At closing, our available cash increased by approximately $682,087, of which $650,000 was applied to pay down our existing debt and the remainder was used to pay costs related to the merger and for general corporate purposes.
Following the consummation of the merger, our ordinary shares and warrants began trading on the NYSE and NYSE American, respectively. Our filings with the SEC and listing on the NYSE have required us to develop the functions and resources necessary to operate as a public company, including employee-related costs and equity compensation, which have resulted in increased operating expenses, which we estimate to be approximately $6,458 per year.
Acquisition of Decision Resources Group
On January 17, 2020, we entered into an agreement to acquire DRG, a premier provider of high-value data, analytics and insights products and services to the healthcare industry, from Piramal Enterprises Limited, which is a part of global business conglomerate Piramal Group. The acquisition closed on February 28, 2020.
The aggregate consideration paid in connection with the closing of the DRG acquisition was approximately $950,000, comprised of $900,000 in cash paid on the closing date and approximately $50,000 in Clarivate ordinary shares to be issued to Piramal Enterprises Limited following the one-year anniversary of closing.
In February 2020, we completed an underwritten public offering of 27,600,000 of our ordinary shares, generating net proceeds of $540,736, which we used to fund a portion of the cash consideration for the DRG acquisition. In addition, we incurred an incremental $360,000 of term loans under our term loan facility and used the net proceeds from such borrowings, together with cash on hand, to fund the remainder of the cash consideration for the DRG acquisition and to pay related fees and expenses.
MarkMonitor Brand Protection, Antipiracy and Antifraud Disposition
In November 2019, we entered into an agreement with an unrelated third-party for the sale of certain assets and liabilities of our MarkMonitor Product Line within the IP Group. The divestment closed in January 2020 for a consideration of approximately $3,751. As a result of this divestiture, we recorded an impairment loss of $18,431 for the year ended December 31, 2019. As of December 31, 2019, we determined that these assets and liabilities met the criteria to be classified as held for sale. All assets and liabilities of the divested business are reclassified to Assets held for sale and Liabilities held for sale respectively on our December 31, 2019 Consolidated Balance Sheet. The divestiture did not represent a strategic shift, and is not expected to have a significant effect on our financial results or operations in future periods. We retained the MarkMonitor Domain Management business.
45
Refinancing Transactions
In October 2019, we closed a private offering of $700,000 in principal amount of secured notes due 2026 and entered into new credit facilities in an initial principal amount of $1,150,000. We used the net proceeds from the offering of notes, together with drawings under the credit facilities, to refinance all amounts outstanding under our prior credit facilities, to redeem our then-outstanding notes and pay fees and expenses related to the foregoing, and to fully fund our $200,000 payment obligation under the agreement terminating our obligations under the tax receivable agreement entered into in connection with our merger with Churchill Capital Corp.
Termination of Tax Receivable Agreement
In connection with our merger with Churchill Capital Corp, we entered into a tax receivable agreement with Onex and Baring and certain other pre-merger shareholders of the Company. The tax receivable agreement generally would have required us to pay the counterparties 85% of the amount of cash savings, if any, realized (or, in some cases, deemed to be realized) as a result of the utilization of certain tax assets. In August 2019, we entered into an agreement pursuant to which all of our future payment obligations under the tax receivable agreement would terminate in exchange for a payment of $200,000, which we made in November 2019. We believe that termination of the tax receivable agreement will significantly improve our free cash flow profile by eliminating near-term cash outflows of up to $30,000 annually that we were expecting to pay starting in early 2021.
IPM Product Line Divestiture
In October 2018, we sold certain subsidiaries and assets related to our intellectual property management (IPM) Product Line for a total purchase price of $100,130 gross of restricted cash and cash included in normalized working capital and related adjustments, of which $31,378 was used to repay a portion of the term loan. As a result, we recorded a net gain on sale of $36,072 for the year ended December 31, 2018. Our consolidated financial statements included elsewhere in this annual report include the results of operations related to our divested IPM Product Line through the date of divestiture, including revenues of $0, $20,450 and $31,854 for the years ended December 31, 2019, 2018, and 2017, respectively. The divestiture did not represent a strategic shift, and is not expected to have a significant effect on our financial results or operations in future periods, although as a result our consolidated revenues and profits for the periods presented in this annual report may not be comparable between periods or with those for future periods. To facilitate comparability between periods we present Adjusted Revenues in this annual report to eliminate, among other things, IPM Product Line revenues for 2019, 2018, and 2017. See “— Certain Non-GAAP Measures — Adjusted Revenues, Adjusted Subscription Revenues and Adjusted Transactional Revenues.”
Darts-ip Acquisition
On November 27, 2019, our IP Product Group completed the acquisition of Darts-ip, a leading provider of case law data for intellectual property professionals. We acquired 100% of the voting equity interest of the acquired business. All assets and liabilities are included in our consolidated financial statements.
Effect of Currency Fluctuations
As a result of our geographic reach and operations across regions, we are exposed to currency transaction and currency translation impacts. Currency transaction exposure results when we generate revenues in one currency and incur expenses in another. While we seek to limit our currency transaction exposure by matching revenues and expenses, we are not always able to do so. For example, our revenues were denominated approximately 81% in U.S. dollars, 9% in euros, 3% in British pounds and 7% in other currencies for the year ended December 31, 2019, 79% in U.S. dollars, 7% in euros, 7% in British pounds and 7% in other currencies for the year ended December 31, 2018 and 79% in U.S. dollars, 7% in euros, 7% in British pounds and 7% in other currencies for the year ended December 31, 2017, while our direct expenses before depreciation and amortization, tax and interest in 2019, 2018 and 2017, were denominated approximately 70%, 70%, and 73% in U.S. dollars, 9%, 9%, and 8% in euros, 13%, 11%, and 11% in British pounds and 8%, 10%, and 8% in various other currencies, respectively.
46
The financial statements of our subsidiaries outside the U.S. and the UK are typically measured using the local currency as the functional currency. Assets and liabilities of these subsidiaries are translated at the balance sheet date exchange rates, while income and expense items are translated at the average monthly exchange rates. Resulting translation adjustments are recorded in Accumulated other comprehensive income (loss) on the Consolidated Balance Sheets.
Subsidiary monetary assets and liabilities that are denominated in currencies other than the functional currency are remeasured using the month-end exchange rate in effect during each month, with any related gain or loss recorded in Other operating expense, net within the Consolidated Statements of Operations.
We do not currently hedge our foreign currency transaction or translation exposure. As a result, significant currency fluctuations could impact the comparability of our results between periods, while such fluctuations coupled with material mismatches in revenues and expenses could also adversely impact our cash flows. See “Item 7A. Quantitative and Qualitative Disclosures About Market Risk.”
Key Performance Indicators
We regularly monitor the following key performance indicators to evaluate our business and trends, measure our performance, prepare financial projections and make strategic decisions.
Adjusted Revenues, Adjusted Subscription Revenues and Adjusted Transactional Revenues
We present Adjusted Revenues, which excludes the impact of the deferred revenue purchase accounting adjustment (recorded in connection with the separation from Thomson Reuters) and revenues from divestitures. We also present Adjusted Subscription Revenues and Adjusted Transactional Revenues, which exclude the revenues from divestitures. We present these measures because we believe it is useful to readers to better understand the underlying trends in our operations. See “— Certain Non-GAAP Measures — Adjusted Revenues, Adjusted Subscription Revenues and Adjusted Transactional Revenues” below for important information on the limitations of Adjusted Revenues and their reconciliation to the respective revenues measures under U.S. GAAP.
Adjusted EBITDA and Adjusted EBITDA margin
Adjusted EBITDA is presented because it is a basis upon which our management assesses our performance, and we believe it is useful for investors to understand the underlying trends of our operations. See “— Certain Non-GAAP Measures — Adjusted EBITDA and Adjusted EBITDA margin” for important information on the limitations of Adjusted EBITDA and its reconciliation to our Net loss under GAAP. Adjusted EBITDA represents net (loss) income before provision for income taxes, depreciation and amortization, interest income and expense adjusted to exclude acquisition or disposal-related transaction costs (such costs include net income from continuing operations before provision for income taxes, depreciation and amortization and interest income and expense from divestitures), losses on extinguishment of debt, stock-based compensation, unrealized foreign currency gains/(losses), costs associated with the transition services agreement with Thomson Reuters, which we entered into in connection with our separation from Thomson Reuters in 2016, separation and integration costs, transformational and restructuring expenses, acquisition-related adjustments to deferred revenues, costs related to our merger with Churchill Capital Corp in 2019, non-cash income/(loss) on equity and cost method investments, non-operating income or expense, the impact of certain non-cash, legal settlements and other items that are included in net income for the period that the Company does not consider indicative of its ongoing operating performance and certain unusual items impacting results in a particular period. Adjusted EBITDA margin is calculated by dividing Adjusted EBITDA by Adjusted Revenues.
47
Annualized Contract Value
Annualized Contract Value (“ACV”), at a given point in time, represents the annualized value for the next 12 months of subscription-based client license agreements, assuming that all expiring license agreements during that period are renewed at their current price level. License agreements may cover more than one product and the standard subscription period for each license agreement typically runs for no less than 12 months. The renewal period for our subscriptions starts 90 days before the end of the current subscription period, during which customers must provide notice of whether they intend to renew or cancel the license agreement.
An initial subscription period for new customers may be for a term of less than 12 months, in certain circumstances. Most of our customers, however, opt to enter into a full 12-month initial subscription period, resulting in renewal periods spread throughout the calendar year. Customers that license more than one subscription-based product may, at any point during the renewal period, provide notice of their intent to renew only certain subscriptions within the license agreement and cancel other subscriptions, which we typically refer to as a downgrade. In other instances, customers may upgrade their license agreements by adding additional subscription-based products to the original agreement. Our calculation of ACV includes the impact of downgrades, upgrades, price increases, and cancellations that have occurred as of the reporting period. For avoidance of doubt, ACV does not include fees associated with transactional revenues.
We monitor ACV because it represents a leading indicator of the potential subscription revenues that may be generated from our existing customer base over the upcoming 12-month period. Measurement of subscription revenues as a key operating metric is particularly relevant because a majority of our revenues are generated through subscription-based products, which accounted for 82.6%, 81.7%, 81.2% of our total revenues for the years ended December 31, 2019, 2018 and 2017, respectively. We calculate and monitor ACV for each of our Groups (excluding the IPM Product Line, which we sold in October 2018), and use the metric as part of our evaluation of our business and trends.
The amount of actual subscription revenues that we earn over any 12-month period are likely to differ from ACV at the beginning of that period, sometimes significantly. This may occur for numerous reasons, including subsequent changes in annual revenue renewal rates, impact of price increases (or decreases), cancellations, upgrades and downgrades, and acquisitions and divestitures.
We calculate the ACV on a constant currency basis to exclude the effect of foreign currency fluctuations.
The following table presents ACV as of the dates indicated:
| December 31, | Change | Change | ||||||||||||||||||
| (dollars in thousands) | 2019 | 2018 | 2017 | 2019 vs. 2018 | 2018 vs. 2017 | |||||||||||||||
| Annualized Contract Value | $ | 793,727 | $ | 767,021 | $ | 737,500 | 3.5 | % | 4.0 | % | ||||||||||
Annual Revenue Renewal Rates
Our revenues are primarily subscription based, which leads to high revenue predictability. Our ability to retain existing subscription customers is a key performance indicator that helps explain the evolution of our historical results and is a leading indicator of our revenues and cash flows for the subsequent reporting period.
“Annual revenue renewal rate” is the metric we use to determine renewal levels by existing customers across all of our Groups, and is a leading indicator of renewal trends, which impact the evolution of our ACV and results of operations. We calculate the annual revenue renewal rate for a given period by dividing (a) the annualized dollar value of existing subscription product license agreements that are renewed during that period, including the value of any product downgrades, by (b) the annualized dollar value of existing subscription product license agreements that come up for renewal in that period. “Open renewals,” which we define as existing subscription product license agreements that come up for renewal, but are neither renewed nor canceled by customers during the applicable reposting period, are excluded from both the numerator and denominator of the calculation. We calculate the annual revenue renewal rate to reflect the value of product downgrades but not the value of product upgrades upon renewal, because upgrades reflect the purchase of additional services.
The impact of upgrades, new subscriptions and product price increases is reflected in ACV, but not in annual revenue renewal rates. Our annual revenue renewal rates were 90.1%, 91.7% and 91.0% (which for the avoidance of doubt, does not reflect the impact of upgrades, new subscriptions or product price increases) for the years ended December 31, 2019, 2018, and 2017, respectively.
48
Key Components of Our Results of Operations
Revenues, net
We categorize our revenues into two categories: subscription and transactional.
Subscription-based revenues are recurring revenues that are earned under annual, multi-year, or evergreen contracts, pursuant to which we license the right to use our products to our customers. Revenues from the sale of subscription data and analytics solutions are typically invoiced annually in advance and recognized ratably over the year as revenues are earned. Subscription revenues are driven by annual revenue renewal rates, new subscription business, price increases on existing subscription business and subscription upgrades and downgrades from recurring customers. Substantially all of our historical deferred revenues purchase accounting adjustments are related to subscription revenues.
Transactional revenues are earned under contracts for specific deliverables that are typically quoted on a product, data set or project basis and often derived from repeat customers, including customers that also generate subscription-based revenues. Transactional products and services are invoiced according to the terms of the contract, typically in arrears. Transactional content sales are usually delivered to the customer instantly or in a short period of time, at which time revenues are recognized. Transactional revenues also include, to a lesser extent, professional services, which are typically performed under contracts that vary in length from several months to years for multi-year projects and are typically invoiced based on the achievement of milestones. The most significant components of our transactional revenues include our “clearance searching” and “backfiles” products.
Cost of Revenues, Excluding Depreciation and Amortization
Cost of revenues consists of costs related to the production, servicing and maintenance of our products and are comprised primarily of related personnel costs, such as salaries, benefits and bonuses for employees, fees for contracted labor, and data center services and licensing costs. Cost of revenues also includes the costs to acquire or produce content, royalties payable and non-capitalized R&D expenses. Cost of revenues does not include production costs related to internally generated software, which are capitalized.
Selling, General and Administrative, Excluding Depreciation and Amortization
Selling, general and administrative costs consist primarily of salaries, benefits, commission and bonuses for the executive, finance and accounting, human resources, administrative, sales and marketing personnel, third-party professional services fees, such as legal and accounting expenses, facilities rent and utilities and technology costs associated with our corporate infrastructure.
Depreciation
Depreciation expense relates to our fixed assets, including mainly computer hardware and leasehold improvements, furniture and fixtures. These assets are depreciated over their expected useful lives, and in the case of leasehold improvements over the shorter of their useful life or the duration of the related lease.
Amortization
Amortization expense relates to our finite-lived intangible assets, including mainly databases and content, customer relationships, internally generated computer software and trade names. These assets are amortized over periods of between two and 20 years. Definite-lived intangible assets are tested for impairment when indicators are present, and, if impaired, are written down to fair value based on discounted cash flows. No impairment of intangible assets has been identified during any financial period included in our accompanying consolidated financial statements.
49
Impairment on Assets Held for Sale
Impairment on assets held for sale represents an impairment charge recorded for certain assets classified as assets held for sale.
Share-based Compensation
Share-based compensation expense includes costs associated with stock options granted to and certain modifications for certain members of management and expense related to the issuance of shares in connection with our merger with Churchill Capital Corp in 2019.
Transaction Expenses
Transaction expenses are incurred to complete business combination transactions, including acquisitions and dispositions, and typically include advisory, legal and other professional and consulting costs.
Transition, Integration and Other Related Expenses
Transition, integration and other related expenses, including transformation expenses, mainly reflect the costs of transitioning certain activities performed under the transition services agreement by Thomson Reuters and certain consulting costs related to standing up our back-office systems to enable our operation on a stand-alone basis. These costs include labor costs of full time employees currently working on migration projects, including primarily employees whose labor costs are capitalized in other circumstances (such as employees working on application development). In 2019, these costs also relate to the Company's transition expenses incurred following the merger with Churchill Capital Corp.
Restructuring
Restructuring expense includes costs associated with involuntary termination benefits provided to employees under the terms of a one-time benefit arrangement, certain contract termination costs, and other costs associated with an exit or disposal activity.
Legal Settlement
Legal settlement represents a net gain recorded for cash received in relation to closure of a confidential legal matter.
Other Operating Income (Expense), Net
Other operating income (expense), net consists of gains or losses related to legal settlements and the disposal of our assets, asset impairments or write-downs and the consolidated impact of re-measurement of the assets and liabilities of our company and our subsidiaries that are denominated in currencies other than each relevant entity’s functional currency.
Interest Expense, net
Interest expense, net consists of expense related to interest on our borrowings under our term loan facility and our secured notes due 2026, the amortization and write off of debt issuance costs and original discount, and interest related to certain derivative instruments.
Benefit (Provision) for Income Taxes
A benefit or provision for income tax is calculated for each of the jurisdictions in which we operate. The benefit or provision for income taxes is determined using the asset and liability approach of accounting for income taxes. Under this approach, deferred taxes represent the future tax consequences expected to occur when the reported amounts of assets and liabilities are recovered or paid. The benefit or provision for income taxes represents income taxes paid or payable for the current year plus the change in deferred taxes during the year. Deferred taxes result from differences between the book and tax bases of assets and liabilities and are adjusted for changes in tax rates and tax laws when changes are enacted. Valuation allowances are recorded to reduce deferred tax assets when it is more likely than not that a tax benefit will not be realized. Interest accrued related to unrecognized tax benefits and income tax related penalties are included in the provision for income taxes.
50
Results of Operations
The following table presents the results of operations for the years ended December 31, 2019, 2018, and 2017:
| Year Ended December 31, | Change 2019 vs. 2018 | Change 2018 vs. 2017 | ||||||||||||||||||
| (in thousands, except percentages) | 2019 | 2018 | 2017 | % | % | |||||||||||||||
| Revenues, net | $ | 974,345 | $ | 968,468 | $ | 917,634 | 0.6 | % | 5.5 | % | ||||||||||
| Cost of revenues, excluding depreciation and amortization | (346,503 | ) | (396,499 | ) | (394,215 | ) | (12.6 | )% | 0.6 | % | ||||||||||
| Selling, general and administrative, excluding depreciation and amortization | (368,675 | ) | (369,377 | ) | (343,143 | ) | (0.2 | )% | 7.6 | % | ||||||||||
| Share-based compensation | (51,383 | ) | (13,715 | ) | (17,663 | ) | N/M | (22.4 | )% | |||||||||||
| Depreciation | (9,181 | ) | (9,422 | ) | (6,997 | ) | (2.6 | )% | 34.7 | % | ||||||||||
| Amortization | (191,361 | ) | (227,803 | ) | (221,466 | ) | (16.0 | )% | 2.9 | % | ||||||||||
| Impairment on assets held for sale | (18,431 | ) | — | — | 100.0 | % | 0.0 | % | ||||||||||||
| Transaction expenses | (46,214 | ) | (2,457 | ) | (2,245 | ) | N/M | 9.4 | % | |||||||||||
| Transition, integration and other related expenses | (14,239 | ) | (61,282 | ) | (78,695 | ) | (76.8 | )% | (22.1 | )% | ||||||||||
| Restructuring | (15,670 | ) | — | — | 0.0 | % | 0.0 | % | ||||||||||||
| Legal settlement | 39,399 | — | — | 100.0 | % | 0.0 | % | |||||||||||||
| Other operating income (expense), net | 4,826 | 6,379 | (237 | ) | (24.3 | )% | N/M | |||||||||||||
| Total operating expenses | (1,017,432 | ) | (1,074,176 | ) | (1,064,661 | ) | (5.3 | )% | 0.9 | % | ||||||||||
| Loss from operations | (43,087 | ) | (105,708 | ) | (147,027 | ) | (59.2 | )% | (28.1 | )% | ||||||||||
| Interest expense, net | (157,689 | ) | (130,805 | ) | (138,196 | ) | 20.6 | % | (5.3 | )% | ||||||||||
| Loss before income tax | (200,776 | ) | (236,513 | ) | (285,223 | ) | (15.1 | )% | (17.1 | )% | ||||||||||
| Benefit (provision) for income taxes | (10,201 | ) | (5,649 | ) | 21,293 | (80.6 | )% | N/M | ||||||||||||
| Net loss | (210,977 | ) | (242,162 | ) | (263,930 | ) | (12.9 | )% | (8.2 | )% | ||||||||||
51
Revenues, net
Revenues, net of $974,345 in 2019 increased by $5,877, or 0.6%, from $968,468 in 2018. Adjusted Revenues, which exclude the impact of the deferred revenues adjustment and revenues from the IPM Product Line prior to its date of divestiture, increased $23,613, or 2.5% to $974,783 in 2019 from $951,170 in 2018.
Revenues, net increased by $50,834, or 5.5%, from $917,634 in 2017 to $968,468 in 2018. Adjusted Revenues, which exclude the impact of the deferred revenues adjustment and revenues from the IPM Product Line prior its date of divestiture, increased $15,717, or 1.7%, to $951,170 in 2018 from $935,453 in 2017.
For an explanation of our calculation of Adjusted Revenues and the limitations as to its usefulness, see “— Certain Non-GAAP Measures — Adjusted Revenues, Adjusted Subscription Revenues and Adjusted Transactional Revenues.”
The comparability of our Revenues, net between periods was impacted by several factors described under “— Factors Affecting the Comparability of Our Results of Operations.” above. In addition to the deferred revenues adjustment and the divestiture of the IPM Product Line, our results were also impacted by foreign currency effects and revenue from ongoing business, as discussed below.
The table below presents the items that impacted the change in our revenues, net between periods.
| Variance 2019 vs. 2018 | ||||||||
| (in thousands, except percentages) | $ | % | ||||||
| Revenue change driver | ||||||||
| Decrease in deferred revenues adjustment | $ | 2,714 | 0.3 | % | ||||
| Decrease in consolidated IPM Product Line revenue | (20,450 | ) | (2.1 | )% | ||||
| Foreign currency translation | (5,929 | ) | (0.6 | )% | ||||
| Revenue increase from ongoing business | 29,542 | 3.1 | % | |||||
| Revenues, net (total change) | $ | 5,877 | 0.6 | % | ||||
| Variance 2018 vs. 2017 | ||||||||
| (in thousands, except percentages) | $ | % | ||||||
| Revenue change driver | ||||||||
| Decrease in deferred revenues adjustment | $ | 46,521 | 5.1 | % | ||||
| Decrease in consolidated IPM Product Line revenue | (11,404 | ) | (1.2 | )% | ||||
| Foreign currency translation | 6,070 | 0.7 | % | |||||
| Revenue increase from ongoing business | 9,647 | 1.1 | % | |||||
| Revenues, net (total change) | $ | 50,834 | 5.5 | % | ||||
Revenues, net from our ongoing business improved for both our Product Groups, led by Science, reflecting a trend consistent with the increase in our ACV between periods, mainly due to product price increases and new business. The evolution of our recurring business is discussed further below by Product Group.
52
The following tables present the amounts of our subscription and transactional revenues, for the periods indicated.
| Variance Increase/(Decrease) | Percentage of Factors Increase/(Decrease) | |||||||||||||||||||||||||||
| Year Ended December 31, | Total Variance (Dollars) | Total Variance (Percentage) | Divested IPM Product Line | FX Impact | Ongoing Business | |||||||||||||||||||||||
| (in thousands, except percentages) | 2019 | 2018 | ||||||||||||||||||||||||||
| Subscription revenues | $ | 805,518 | $ | 794,097 | $ | 11,421 | 1.4 | % | (2.2 | )% | (0.6 | )% | 4.2 | % | ||||||||||||||
| Transactional revenues | 169,265 | 177,523 | (8,258 | ) | (4.7 | )% | (1.6 | )% | (0.8 | )% | (2.3 | )% | ||||||||||||||||
| Deferred revenues adjustment (1) | (438 | ) | (3,152 | ) | (2,714 | ) | (86.1 | )% | 0.0 | % | 0.0 | % | 0.0 | % | ||||||||||||||
| Revenues, net | $ | 974,345 | $ | 968,468 | $ | 5,877 | 0.6 | % | (2.1 | )% | (0.6 | )% | 3.1 | % | ||||||||||||||
| (1) | Reflects the deferred revenues adjustment made as a result of purchase accounting related to our separation from Thomson Reuters in 2016 |
Subscription revenues of $805,518 in 2019 increased by $11,421, or 1.4% from $794,097 in 2018. On a constant currency basis, subscription revenues increased by $15,959, or 2.0%. Subscription revenues from ongoing business increased primarily due to price increases and new business within the Science Product Group, consistent with the growth in the annualized contract value and revenue increases related to upgrade of the Techstreet product offerings. This revenue growth was offset by a decrease due to the IPM Product Line divestiture.
Transactional revenues of $169,265 in 2019 decreased by $8,258, or 4.7% from $177,523 in 2018. On a constant currency basis, transactional revenues decreased by $6,867, or 3.9%. The decline in transactional revenues is due to the loss of income related to the IPM Product Line divestiture, demand for patent services in the period and reflected timing and product offerings within the IP Product Group. The revenues decline was offset partially by increased revenues related to the upgrades of the Techstreet product offerings.
| Variance Increase/(Decrease) | Percentage of Factors Increase/(Decrease) | |||||||||||||||||||||||||||
| Year Ended December 31, | Total Variance (Dollars) | Total Variance (Percentage) | Divested IPM Product Line | FX Impact | Ongoing Business | |||||||||||||||||||||||
| (in thousands, except percentages) | 2018 | 2017 | ||||||||||||||||||||||||||
| Subscription revenues | $ | 794,097 | $ | 785,717 | $ | 8,380 | 1.1 | % | 1.7 | % | 0.6 | % | (1.2 | )% | ||||||||||||||
| Transactional revenues | 177,523 | 181,590 | (4,067 | ) | (2.2 | )% | (1.2 | )% | 1.0 | % | (2.0 | )% | ||||||||||||||||
| Deferred revenues adjustment (1) | (3,152 | ) | (49,673 | ) | (46,521 | ) | (93.7 | )% | 0.0 | % | 0.0 | % | 0.0 | % | ||||||||||||||
| Revenues, net | $ | 968,468 | $ | 917,634 | $ | 50,834 | 5.5 | % | 1.2 | % | 0.7 | % | (1.4 | )% | ||||||||||||||
| (1) | Reflects the deferred revenues adjustment made as a result of purchase accounting related to our separation from Thomson Reuters in 2016 |
Subscription revenues of $794,097 in 2018 increased by $8,380, or 1.1% from $785,717 in 2017. On a constant currency basis, subscription revenues increased by $4,113, or 0.5%. The increase in subscription revenues between periods mainly reflected the effect of product price increases partially offset by a reduction in the income related to the IPM divestiture in October 2018.
Transactional revenues of $177,523 in 2018 decreased by $4,067, or 2.2% from $181,590 in 2017. On a constant currency basis, transactional revenues decreased by $5,870, or 3.2%. The decrease in Adjusted Transactional Revenues reflects our product and sales strategy to enhance our subscription product offerings and a reduction in the income related to the IPM divestiture in October 2018.
53
The following tables present the amounts of our adjusted subscription and adjusted transactional revenues, for the periods indicated.
| Variance Increase/(Decrease) | Percentage of Factors Increase/(Decrease) | |||||||||||||||||||||||
| Year Ended December 31, | Total Variance (Dollars) | Total Variance (Percentage) | FX Impact | Ongoing Business | ||||||||||||||||||||
| (in thousands, except percentages) | 2019 | 2018 | ||||||||||||||||||||||
| Adjusted subscription revenues | $ | 805,518 | $ | 776,415 | $ | 29,103 | 3.7 | % | (0.6 | )% | 4.3 | % | ||||||||||||
| Adjusted transactional revenues | 169,265 | 174,755 | (5,490 | ) | (3.1 | )% | (0.8 | )% | (2.3 | )% | ||||||||||||||
| Deferred revenues adjustment(1) | (438 | ) | (3,152 | ) | (2,714 | ) | (86.1 | )% | — | % | — | % | ||||||||||||
| IPM Product Line(2) | — | 20,450 | (20,450 | ) | (100.0 | )% | — | % | — | % | ||||||||||||||
| Revenues, net | $ | 974,345 | $ | 968,468 | $ | 5,877 | 0.6 | % | (0.6 | )% | 3.1 | |||||||||||||
| (1) | Reflects the deferred revenues adjustment made as a result of purchase accounting related to our separation from Thomson Reuters in 2016 |
| (2) | Reflects the revenue generated by the IPM Product Line for the year ended December 31, 2018. We sold the IPM Product Line in October 2018. |
Adjusted subscription revenues of $805,518 in 2019 increased by $29,103, or 3.7% from $776,415 in 2018. On a constant currency basis, adjusted subscription revenues increased by $33,641, or 4.3%. Adjusted subscription revenues from ongoing business increased primarily due to price increases and new business within the Science Product Group, consistent with the growth in the Clarivate's ACV, combined with revenues from the TrademarkVision and Darts-ip acquisitions, and increases related to upgrade of the Techstreet product offerings.
Adjusted transactional revenues of $169,265 in 2019 decreased by $5,490, or 3.1% from $174,755 in 2018. On a constant currency basis, adjusted transactional revenues decreased by $4,099, or 2.3%. The decline in adjusted transactional revenues reflected timing and product offerings within the IP Product Group and demand for patent services in the period. The revenues decline was offset partially by increased revenues related upgrades in the Techstreet product offerings.
| Variance Increase/(Decrease) | Percentage of Factors Increase/(Decrease) | |||||||||||||||||||||||
| Year Ended December 31, | Total Variance (Dollars) | Total Variance (Percentage) | FX Impact | Ongoing Business | ||||||||||||||||||||
| (in thousands, except percentages) | 2018 | 2017 | ||||||||||||||||||||||
| Adjusted subscription revenues | $ | 776,415 | $ | 754,463 | $ | 21,952 | 2.9 | % | 0.6 | % | 2.3 | % | ||||||||||||
| Adjusted transactional revenues | 174,755 | 180,990 | (6,235 | ) | (3.4 | )% | 1.0 | % | (4.4 | )% | ||||||||||||||
| Deferred revenues adjustment(1) | (3,152 | ) | (49,673 | ) | (46,521 | ) | (93.7 | )% | — | % | — | % | ||||||||||||
| IPM Product Line(2) | 20,450 | 31,854 | (11,404 | ) | (35.8 | )% | — | % | — | % | ||||||||||||||
| Revenues, net | $ | 968,468 | $ | 917,634 | $ | 50,834 | 5.5 | % | 0.7 | % | 1.1 | % | ||||||||||||
| (1) | Reflects the deferred revenues adjustment made as a result of purchase accounting related to our separation from Thomson Reuters in 2016 |
| (2) | Reflects the revenue generated by the IPM Product Line for the year ended December 31, 2018. We sold the IPM Product Line in October 2018. |
54
Adjusted subscription revenues of $776,415 in 2018 increased by $21,952, or 2.9% from $754,463 in 2017. On a constant currency basis, adjusted subscription revenues increased by $17,685, or 2.3%. The increase in Adjusted Subscription Revenues is primarily due to price increases and new business within the Science Product Group and IP Product Group.
Adjusted transactional revenues of $174,755 in 2018 decreased by $6,235, or 3.4% from $180,990 in 2017. On a constant currency basis, adjusted transactional revenues decreased by $8,038, or 4.4%. The decrease in Adjusted Transactional Revenues reflects our product and sales strategy to enhance our subscription product offerings.
The tables present our revenues split by geographic region, separating the impacts of the deferred revenues adjustment and the IPM Product Line:
| Variance Increase/(Decrease) | Percentage of Factors Increase/(Decrease) | |||||||||||||||||||||||
| Revenues by Geography | Year Ended December 31, | Total Variance (Dollars) | Total Variance (Percentage) | FX Impact | Ongoing Business | |||||||||||||||||||
| (in thousands, except percentages) | 2019 | 2018 | ||||||||||||||||||||||
| Americas | $ | 463,041 | $ | 456,281 | $ | 6,760 | 1.5 | % | (0.1 | )% | 1.6 | % | ||||||||||||
| Middle East/Africa/Europe | 278,738 | 272,910 | 5,828 | 2.1 | % | (2.0 | )% | 4.1 | % | |||||||||||||||
| Asia Pacific | 233,004 | 221,979 | 11,025 | 5.0 | % | 0.1 | % | 4.9 | % | |||||||||||||||
| Deferred revenues adjustment (1) | (438 | ) | (3,152 | ) | (2,714 | ) | (86.1 | )% | — | % | — | % | ||||||||||||
| IPM Product Line (2) | — | 20,450 | (20,450 | ) | (100.0 | )% | — | % | — | % | ||||||||||||||
| Revenues, net | $ | 974,345 | $ | 968,468 | $ | 5,877 | 0.6 | % | (0.6 | )% | 3.1 | % | ||||||||||||
| (1) | Reflects the deferred revenues adjustment made as a result of purchase accounting related to our separation from Thomson Reuters in 2016 |
| (2) | Reflects the revenue generated by the IPM Product Line for the year ended December 31, 2018. We sold the IPM Product Line in October 2018. |
On a constant currency basis, Americas revenues increased by $7,205, or 1.6%, primarily due to improved subscription revenues partially offset by a decline in transactional revenues, consistent with the explanations above. On a constant currency basis, Europe/Middle East/Africa revenues increased by $11,396, or 4.1%, primarily due to improved subscription revenues and an increase in transactional revenues as the result of increased demand and product offerings. On a constant currency basis, Asia Pacific revenues increased $10,941, or 4.9%, primarily due to improved subscription revenues partially offset by a decline in transactional revenues.
55
| Variance Increase/(Decrease) | Percentage of Factors Increase/(Decrease) | |||||||||||||||||||||||
| Revenues by Geography | Year Ended December 31, | Total Variance (Dollars) | Total Variance (Percentage) | FX Impact | Ongoing Business | |||||||||||||||||||
| (in thousands, except percentages) | 2018 | 2017 | ||||||||||||||||||||||
| Americas | $ | 456,281 | $ | 444,875 | $ | 11,406 | 2.6 | % | 0.2 | % | 2.4 | % | ||||||||||||
| Europe/Middle East/Africa | 272,910 | 273,706 | (796 | ) | (0.3 | )% | 1.5 | % | (1.8 | )% | ||||||||||||||
| Asia Pacific | 221,979 | 216,872 | 5,107 | 2.4 | % | 0.6 | % | 1.8 | % | |||||||||||||||
| Deferred revenues adjustment(1) | (3,152 | ) | (49,673 | ) | (46,521 | ) | (93.7 | )% | — | % | — | % | ||||||||||||
| IPM Product Line(2) | 20,450 | 31,854 | (11,404 | ) | (35.8 | )% | — | % | — | % | ||||||||||||||
| Revenues, net | $ | 968,468 | $ | 917,634 | $ | 50,834 | 5.5 | % | 0.7 | % | 1.1 | % | ||||||||||||
| (1) | Reflects the deferred revenues adjustment made as a result of purchase accounting related to our separation from Thomson Reuters in 2016 |
| (2) | Reflects the revenue generated by the IPM Product Line for the year ended December 31, 2018. We sold the IPM Product Line in October 2018. |
On a constant currency basis, Americas revenues increased by $10,647, or 2.4%, primarily due to improved subscription revenues partially offset by a decline in transactional revenues. On a constant currency basis, Europe/Middle East/Africa revenues decreased by $4,959, or 1.8%, primarily due to improved subscription revenues. On a constant currency basis, Asia Pacific revenues increased $3,959, or 1.8%, primarily due to improved subscription revenues.
The following tables, and the discussions that follow, present our revenues by Group for the periods indicated.
| Variance Increase/(Decrease) | Percentage of Factors Increase/(Decrease) | |||||||||||||||||||||||
| Revenues by Product Group | Year Ended December 31, | Total Variance (Dollars) | Total Variance (Percentage) | FX Impact | Ongoing Business | |||||||||||||||||||
| (in thousands, except percentages) | 2019 | 2018 | ||||||||||||||||||||||
| Science Product Group | $ | 547,542 | $ | 527,877 | $ | 19,665 | 3.7 | % | (0.4 | )% | 4.1 | % | ||||||||||||
| IP Product Group | 427,241 | 423,293 | 3,948 | 0.9 | % | (0.9 | )% | 1.8 | % | |||||||||||||||
| Deferred revenues adjustment(1) | (438 | ) | (3,152 | ) | (2,714 | ) | (86.1 | )% | — | % | — | % | ||||||||||||
| IPM Product Line(2) | — | 20,450 | (20,450 | ) | (100.0 | )% | — | % | — | % | ||||||||||||||
| Revenues, net | $ | 974,345 | $ | 968,468 | $ | 5,877 | 0.6 | % | (0.6 | )% | 3.1 | % | ||||||||||||
| (1) | Reflects the deferred revenues adjustment made as a result of purchase accounting related to our separation from Thomson Reuters in 2016 |
| (2) | Reflects the revenue generated by the IPM Product Line for the year ended December 31, 2018. We sold the IPM Product Line in October 2018. |
Science Group: Revenues of $547,542 in 2019 increased by $19,665, or 3.7%, from $527,877 in 2018. On a constant currency basis, revenues increased by $21,671, or 4.1%, driven by organic subscription revenue growth, primarily due to price increases and new business across the product offerings, consistent with the growth in the ACV. Additionally transactional revenues increased minimally due to increased demand and timing of the product offerings.
Intellectual Property Group: Revenues of $427,241 in 2019, increased by $3,948, or 0.9%, from $423,293 in 2018. On a constant currency basis, revenues increased by $7,868, or 1.8%, driven by revenues related to the Techstreet product upgrades. This increase was offset by a decrease from the transactional revenues due to a demand for patent services in the period, and timing and product offerings.
56
| Variance Increase/(Decrease) | Percentage of Factors Increase/(Decrease) | |||||||||||||||||||||||
| Revenues by Product Group | Year Ended December 31, | Total Variance (Dollars) | Total Variance (Percentage) | FX Impact | Ongoing Business | |||||||||||||||||||
| (in thousands, except percentages) | 2018 | 2017 | ||||||||||||||||||||||
| Science Product Group | $ | 527,877 | $ | 518,990 | $ | 8,887 | 1.7 | % | 0.4 | % | 1.3 | % | ||||||||||||
| IP Product Group | 423,293 | 416,463 | 6,830 | 1.6 | % | 0.9 | % | 0.7 | % | |||||||||||||||
| Deferred revenues adjustment(1) | $ | (3,152 | ) | $ | (49,673 | ) | (46,521 | ) | (93.7 | )% | — | % | — | % | ||||||||||
| IPM Product Line(2) | 20,450 | 31,854 | (11,404 | ) | (35.8 | )% | — | % | — | % | ||||||||||||||
| Revenues, net | $ | 968,468 | $ | 917,634 | $ | 50,834 | 5.5 | % | 0.7 | % | 1.1 | % | ||||||||||||
| (1) | Reflects the deferred revenues adjustment made as a result of purchase accounting related to our separation from Thomson Reuters in 2016 |
| (2) | Reflects the revenue generated by the IPM Product Line for the year ended December 31, 2018. We sold the IPM Product Line in October 2018. |
Science Group: Revenues of $527,877 in 2018 increased by $8,887, or 1.7%, from $518,990 in 2017. On a constant currency basis, revenues increased by $6,571, or 1.3%. Exclusive of these currency translation effects, subscription revenues increased mainly due to net price increases on our subscription revenues products and new subscription business across our Product Lines. The increase in subscription revenues was partially offset by a decrease in transactional revenues across several products, reflecting our product and sales strategy to enhance our subscription product offerings.
Intellectual Property Group: Revenues of $423,293 in 2018, increased by $6,830, or 1.6%, from $416,463 in 2017. On a constant currency basis, revenues increased by $3,076, or 0.7%. Exclusive of these currency translation effects, subscription revenues increased mainly due to net price increases on our subscription revenues products and new subscription business across our Product Lines. The increase in subscription revenues was partially offset by a decrease in transactional revenues across several products, reflecting our product and sales strategy as discussed above.
Cost of Revenues, Excluding Depreciation and Amortization
Cost of revenues of $346,503 in 2019, decreased by $49,996, or 12.6%, from $396,499 in 2018. On a constant currency basis, cost of revenues decreased by $45,330, or 11.4%, due to a $32,493 decrease in transition services agreement data center costs and a $11,489 decrease in costs associated with the divestiture of the IPM Product Line.
Cost of revenues increased by $2,284, or 0.6%, from $394,215 in 2017 to $396,499 in 2018. Excluding the $3,764 of cost attributable to foreign currency translation effects, Cost of revenues declined slightly between periods. The change also reflected a $23,300 decrease in transition services agreement fees allocated to Cost of revenues and a $9,000 decrease in consulting fees for outside services as well as an increase of $36,000 in technology related costs attributable to the in-house establishment of functions for maintaining our product content to replace services previously provided by Thomson Reuters, mainly cloud computing and data service centers.
Selling, General and Administrative, Excluding Depreciation and Amortization
Selling, general and administrative expense of $368,675 in 2019, remained consistent by $702, or 0.2%, from $369,377 in 2018. On a constant currency basis, cost of revenues increased by $3,280, or 0.9%. The change reflected a $22,128 increase in people related costs which is due to the increase in headcount for the stand-alone transition. This increase was offset by a decrease of $6,154 in contract labor, $9,095 in transition services agreement fees and $2,709 of costs related to the divestiture of the IPM product line.
57
Selling, general and administrative expense, excluding depreciation and amortization, increased by $26,234, or 7.6%, from $343,143 in 2017 to $369,377 in 2018. Excluding the $2,039 of cost attributable to foreign currency translation effects, the increase was driven by a $16,000 increase in people related cost such as salaries and recruitment costs which were driven by an increase in headcount and merit raises, a $6,000 increase in professional fees such as audit and tax fees due to an increase in required reporting, and a $4,102 increase in telecommunication costs. These increases in cost were offset by a net $1,000 decline in cost primarily associated with facility, technology, and advertising cost incurred as a standalone company compared to the cost that would have been paid to Thomson Reuters.
Share-based Compensation
Share-based compensation expense of $51,383 in 2019, increased by $37,668, from $13,715 in 2018 primarily driven by accelerated vesting and expense related to our merger with Churchill Capital Corp in 2019, offset by forfeited options and a lower number of grants in the year.
Share-based compensation expense decreased by $3,948, or 22.4%, from $17,663 in 2017 to $13,715 in 2018, reflecting a net decrease in equity compensation vesting attributable to a decline in grants in 2018 from 2017 and 2017 from 2016.
Depreciation
Depreciation expense of $9,181 in 2019, decreased by $241, or 2.6%, from $9,422 in 2018, driven by the run-off of previously purchased capital expenditures. This decrease was partially offset by new purchases of fixed assets.
Depreciation expense increased by $2,425, or 34.7%, from $6,997 in 2017 to $9,422 in 2018. The increase relates primarily to increased purchases of fixed assets, particularly computer hardware.
Amortization
Amortization expense of $191,361 in 2019, decreased by $36,442, or 16.0%, from $227,803 in 2018, primarily related to intangible assets acquired in connection with our separation from Thomson Reuters in 2016 that are now fully amortized, coupled with the divestiture of the IPM Product Line and related assets.
Amortization expense increased by $6,337, or 2.9%, from $221,466 in 2017 to $227,803 in 2018. The increase primarily relates to an increase in intangible assets related to the Publons acquisition, and computer software associated with the capitalization of internal and external labor during 2018. This was partially offset by a reduction in intangible amortization due to the divestiture of the IPM Product Line and related assets.
Impairment on Assets Held for Sale
The year ended December 31, 2019 includes an impairment on assets held for sale of $18,431. On November 3, 2019, the Company entered into an agreement with OpSec Security for the sale of certain assets and liabilities of its MarkMonitor Product Line within its IP Group. At December 31, 2019, an impairment charge of $18,431 was recognized in the Statement of Operations during the fourth quarter to reduce the Assets Held for Sale to their fair value. See “Item 8. Financial Statements and Supplementary Data — Notes to the Consolidated Financial Statements — Note 5” for further information.
Transaction Expenses
Transaction expenses of $46,214 in 2019, increased by $43,757, from $2,457 in 2018. The increase in transaction expenses primarily relate to costs incurred in association with our merger with Churchill Capital Corp in 2019 coupled with costs related to the debt refinancing, secondary offerings, contingent payment earn out adjustments and divestitures and acquisitions.
58
Transaction expenses increased by $212, or 9.4%, from $2,245 in 2017 to $2,457 in 2018. Transaction expenses primarily related to acquisitions and dispositions that occurred during the applicable period.
Transition, Integration and Other Related Expenses
Transition, integration, and other expenses of $14,239 in 2019, decreased by $47,043, or 76.8%, from $61,282 in 2018. The decrease reflects the slowing pace of costs incurred in connection with establishing our standalone company infrastructure following our separation from Thomson Reuters in 2016.
Transition, integration, and other expenses decreased by $17,413, or 22.1%, from $78,695 in 2017 to $61,282 in 2018. The decrease reflects the gradual slowing in the pace of costs incurred to establish our standalone company infrastructure as we completed the establishment of necessary functions, systems and processes. We expect the pace of costs incurred to continue to slow.
Restructuring
Restructuring of $15,670 in 2019, increased by $15,670, from $0 in 2018. The increase is related to an initiative, following our merger with Churchill Capital Corp in 2019, to streamline our operations by simplifying our organization and focusing on two product groups.
Legal Settlement
The year ended December 31, 2019 includes a gain for a confidential legal settlement of $39,399.
Other Operating Income (Expense), Net
Other operating income (expense), net of $4,826 in 2019, decreased by $1,553, or 24.3% from $6,379 in 2018, attributable to the consolidated impact of the remeasurement of the assets and liabilities of our company that are denominated in currencies other than each relevant entity’s functional currency.
Other operating income (expense), net was $6,379 in 2018, compared to other operating expense of $237 in 2017. Of the $6,616 change between periods, $3,575 was attributable to the consolidated impact of the remeasurement of the assets and liabilities of our company that are denominated in currencies other than each relevant entity’s functional currency and a $36,072 net gain from the sale of the IPM Product Line and related assets, which was partially offset by a $33,819 loss on the write down of a tax indemnity asset due to a dispute with the indemnitor.
Interest Expense, net
Interest expense, net of $157,689 in 2019, increased by $26,884, or 20.6%, from $130,805 in 2018. The increase was attributable to the write down of deferred financing charges and original issuance discount on our prior term loan facility in proportion to the principal paydown; in addition to debt extinguishment and refinancing related costs on the October 2019 refinancing of our prior credit facilities and notes. This was offset by lower interest payments due to lower interest and LIBOR rates as a result of the refinance and the voluntary prepayment of our prior term loan in connection with the closing of our merger with Churchill Capital Corp in 2019.
Interest expense, net decreased by $7,391, or 5.3%, from $138,196 in 2017 to $130,805 in 2018. The decrease was primarily due to debt issuance cost write-offs resulting from debt amendments in 2017, and associated lower interest rate margin in the fourth quarter. These decreases were partially offset by increases in LIBOR, which was the base rate on our term loan facility, through the course of 2018.
59
Provision for Income Taxes
Provision for income tax of $10,201 in 2019, increased by $4,552, or 80.6%, from $5,649 in 2018 . The increase in tax expense is due to the base erosion and anti-abuse (BEAT) tax and tax on mergers, offset by deferred tax movements. Our effective tax rate is (5.1)% in 2019 and was (2.4)% in 2018. Differences in effective tax rates for the reported periods are attributable to changes in valuation allowance, BEAT tax, non-deductible capitalization costs and changes in income/losses for the different rates in various jurisdictions. The current year effective tax rate may not be indicative of our effective tax rates for future periods.
Provision for income tax of $5,649 in 2018 increased by $26,942 from a benefit of $21,293 in 2017. The provision in 2018, despite a loss before tax reflects unrecognized tax losses and valuation allowance. In 2017 we recorded a $16,500 one-time tax benefit, attributable to changes in Belgian and U.S. tax rates. Our effective tax rate was (2.4)% in 2018 and was 7.5% in 2017. Differences in effective tax rates for the reported periods are attributable mainly to changes in valuation allowance and temporary differences and the one-time impacts discussed below, and may not be indicative of our effective tax rates for future periods. In addition, changes in applicable tax rates were enacted in 2017, including in Belgium and the United States, and the Company recorded a tax benefit related to these changes. We did not provide for income or withholding taxes on the undistributed income of our foreign subsidiaries as of December 31, 2018, because we intend to permanently reinvest these earnings.
Certain Non-GAAP Measures
We include non-GAAP measures in this annual report, including Adjusted Revenues, Adjusted Subscription Revenues, Adjusted Transactional Revenues, Adjusted EBITDA, Adjusted EBITDA margin and Free Cash Flow because they are a basis upon which our management assesses our performance and we believe they reflect the underlying trends and indicators of our business by allowing management to focus on the most meaningful indicators of our continuous operational performance.
Although we believe these measures are useful for investors for the same reasons, we recommend users of the financial statements to note these measures are not a substitute for GAAP financial measures or disclosures. We provide reconciliations of these non-GAAP measures to the corresponding most closely related GAAP measure.
Adjusted Revenues, Adjusted Subscription Revenues and Adjusted Transactional Revenues
We present Adjusted Revenues, which excludes the impact of the deferred revenue purchase accounting adjustment (recorded in connection with the separation from Thomson Reuters) and revenues from divestitures. We also present Adjusted Subscription Revenues and Adjusted Transactional Revenues, which exclude the revenues from divestitures. We present these measures because we believe they are useful to readers to better understand the underlying trends in our operations.
Our presentation of Adjusted Revenues, Adjusted Subscription Revenues and Adjusted Transactional Revenues is for informational purposes only and is not necessarily indicative of our future results. You should compensate for these limitations by relying primarily on our GAAP results and only using non-GAAP measures for supplementary analysis.
60
The following table presents our calculation of Adjusted Revenues for the years ended December 31, 2019, 2018, and 2017 and a reconciliation of this measure to our Revenues, net for the same periods:
| Year Ended December 31, | Change 2019 vs. 2018 | Change 2018 vs. 2017 | ||||||||||||||||||
| (in thousands, except percentages) | 2019 | 2018 | 2017 | % | % | |||||||||||||||
| Revenues, net | $ | 974,345 | $ | 968,468 | $ | 917,634 | 0.6 | % | 5.5 | % | ||||||||||
| Deferred revenues purchase accounting adjustment | 438 | 3,152 | 49,673 | (86.1 | )% | (93.7 | )% | |||||||||||||
| Revenue attributable to IPM Product Line | — | (20,450 | ) | (31,854 | ) | (100.0 | )% | (35.8 | )% | |||||||||||
| Adjusted Revenues | $ | 974,783 | $ | 951,170 | $ | 935,453 | 2.5 | % | 1.7 | % | ||||||||||
The following table presents our calculation of Adjusted Subscription Revenues and Adjusted Transactional Revenues for the years ended December 31, 2019, 2018 and 2017 and a reconciliation of these measures to Subscription revenues and Transactional revenues, respectively, for the same periods:
| Year Ended December 31, | Change 2019 vs. 2018 | Change 2018 vs. 2017 | ||||||||||||||||||
| (in thousands, except percentages) | 2019 | 2018 | 2017 | % | % | |||||||||||||||
| Subscription revenues | $ | 805,518 | $ | 794,097 | $ | 785,717 | 1.4 | % | 1.1 | % | ||||||||||
| Revenue attributable to IPM Product Line | — | (17,682 | ) | (31,254 | ) | (100.0 | )% | (43.4 | )% | |||||||||||
| Adjusted subscription revenues | $ | 805,518 | $ | 776,415 | $ | 754,463 | 3.7 | % | 2.9 | % | ||||||||||
| Year Ended December 31, | Change
2019 vs. 2018 |
Change 2018 vs. 2017 |
||||||||||||||||||
| (in thousands, except percentages) | 2019 | 2018 | 2017 | % | % | |||||||||||||||
| Transactional revenues | $ | 169,265 | $ | 177,523 | $ | 181,590 | (4.7 | )% | (2.2 | )% | ||||||||||
| Revenue attributable to IPM Product Line | — | (2,768 | ) | (600 | ) | (100.0 | )% | 361.3 | % | |||||||||||
| Adjusted transactional revenues | $ | 169,265 | $ | 174,755 | $ | 180,990 | (3.1 | )% | (3.4 | )% | ||||||||||
61
Adjusted EBITDA and Adjusted EBITDA margin
Adjusted EBITDA is presented because it is a basis upon which our management assesses our performance, and we believe it is useful for investors to understand the underlying trends of our operations. See “— Certain Non-GAAP Measures — Adjusted EBITDA and Adjusted EBITDA margin” for important information on the limitations of Adjusted EBITDA and its reconciliation to our Net loss under GAAP. Adjusted EBITDA represents net (loss) income before provision for income taxes, depreciation and amortization, interest income and expense adjusted to exclude acquisition or disposal-related transaction costs (such costs include net income from continuing operations before provision for income taxes, depreciation and amortization and interest income and expense from divestitures), losses on extinguishment of debt, stock-based compensation, unrealized foreign currency gains/(losses), costs associated with the transition services agreement with Thomson Reuters, which we entered into in connection with our separation from Thomson Reuters in 2016, separation and integration costs, transformational and restructuring expenses, acquisition-related adjustments to deferred revenues, costs related to our merger with Churchill Capital Corp in 2019, non-cash income/(loss) on equity and cost method investments, non-operating income or expense, the impact of certain non-cash, legal settlements and other items that are included in net income for the period that the Company does not consider indicative of its ongoing operating performance and certain unusual items impacting results in a particular period. Adjusted EBITDA margin is calculated by dividing Adjusted EBITDA by Adjusted Revenues.
Our presentation of Adjusted EBITDA and Adjusted EBITDA margin should not be construed as an inference that our future results will be unaffected by any of the adjusted items, or that our projections and estimates will be realized in their entirety or at all. In addition, because of these limitations, Adjusted EBITDA should not be considered as a measure of liquidity or discretionary cash available to us to fund our cash needs, including investing in the growth of our business and meeting our obligations. You should compensate for these limitations by relying primarily on our U.S. GAAP results and only use Adjusted EBITDA and Adjusted EBITDA margin for supplementary analysis.
The following table presents our calculation of Adjusted EBITDA for the years ended December 31, 2019, 2018 and 2017, and reconciles these measures to our Net loss for the same periods:
| Year Ended December 31, | ||||||||||||
| (in thousands) | 2019 | 2018 | 2017 | |||||||||
| Net loss | $ | (210,977 | ) | $ | (242,162 | ) | $ | (263,930 | ) | |||
| (Benefit) provision for income taxes | 10,201 | 5,649 | (21,293 | ) | ||||||||
| Depreciation and amortization | 200,542 | 237,225 | 228,463 | |||||||||
| Interest, net | 157,689 | 130,805 | 138,196 | |||||||||
| Transition services agreement costs(1) | 10,481 | 55,764 | 89,942 | |||||||||
| Transition, transformation and integration expense(2) | 24,372 | 69,185 | 86,809 | |||||||||
| Deferred revenues adjustment(3) | 438 | 3,152 | 49,673 | |||||||||
| Transaction related costs(4) | 46,214 | 2,457 | 2,245 | |||||||||
| Share-based compensation expense | 51,383 | 13,715 | 17,663 | |||||||||
| Gain on sale of IPM Product Line | — | (36,072 | ) | — | ||||||||
| Tax indemnity asset(5) | — | 33,819 | — | |||||||||
| IPM adjusted operating margin(6) | — | (5,897 | ) | (6,811 | ) | |||||||
| Restructuring(7) | 15,670 | — | — | |||||||||
| Legal Settlement | (39,399 | ) | — | — | ||||||||
| Impairment on assets held for sale | 18,431 | — | — | |||||||||
| Other(8) | 9,021 | 5,221 | (1,250 | ) | ||||||||
| Adjusted EBITDA | $ | 294,066 | $ | 272,861 | $ | 319,707 | ||||||
| Adjusted EBITDA margin | 30.2 | % | 28.7 | % | 34.2 | % | ||||||
62
| (1) | Includes accruals for payments to Thomson Reuters under the transition services agreement. These costs have decreased substantially in 2019, as we are in the final stages of implementing our standalone company infrastructure. |
| (2) | Includes costs incurred in connection with and after our separation from Thomson Reuters in 2016 relating to the implementation of our standalone company infrastructure and related cost-savings initiatives. These costs include mainly transition consulting, technology infrastructure, personnel and severance expenses relating to our standalone company infrastructure, which are recorded in Transition, integration, and other line-item of our income statement, as well as expenses related to the restructuring and transformation of our business following our separation from Thomson Reuters in 2016 mainly related to the integration of separate business units into one functional organization and enhancements in our technology. |
| (3) | Reflects deferred revenues fair value accounting adjustment arising from purchase price allocation in connection with our separation from Thomson Reuters in 2016 See “—Factors Affecting the Comparability of Our Results of Operations — Our Transition to Operations as a Standalone Business — Purchase Accounting Impact of Our Separation from Thomson Reuters in 2016.” |
| (4) | Includes consulting and accounting costs associated with acquisitions and the sale of the IPM Product Line and sale of MarkMonitor business. |
| (5) | Reflects the write down of a tax indemnity asset. |
| (6) | Reflects the IPM Product Line’s operating margin, excluding amortization and depreciation, prior to its divestiture in October 2018. |
| (7) | Reflects costs incurred in connection with the initiative, following our merger with Churchill Capital Corp in 2019, to streamline our operations by simplifying our organization and focusing on two product groups. |
| (8) | Includes primarily the net impact of foreign exchange gains and losses related to the re-measurement of balances and other items that do not reflect our ongoing operating performance. |
Free Cash Flow
We use free cash flow in our operational and financial decision-making and believe free cash flow is useful to investors because similar measures are frequently used by securities analysts, investors, ratings agencies and other interested parties to evaluate our competitors and to measure the ability of companies to service their debt.
Our presentation of free cash flow should not be construed as a measure of liquidity or discretionary cash available to us to fund our cash needs, including investing in the growth of our business and meeting our obligations. You should compensate for these limitations by relying primarily on our U.S. GAAP results.
We define free cash flow as net cash provided by operating activities less capital expenditures. For further discussion on free cash flow, including a reconciliation to cash flows provided by operating activities, refer to “— Liquidity and Capital Resources — Cash Flows” below.
Liquidity and Capital Resources
Liquidity describes the ability of a company to generate sufficient cash flows to meet the cash requirements of its business operations, including working capital needs, capital expenditures, debt service, acquisitions, other commitments and contractual obligations. Our principal sources of liquidity include cash from operating activities, cash and cash equivalents on our Consolidated Balance Sheet and amounts available under our revolving credit facility. We consider liquidity in terms of the sufficiency of these resources to fund our operating, investing and financing activities for a period of 12 months after the financial statement issuance date.
Our cash flows from operations are generated primarily from payments from our subscription customers. As described above, the standard term of a subscription is typically 12 months. When a customer enters into a new subscription agreement, or submits a notice to renew their subscription, we typically invoice for the full amount of the subscription period, record the balance to deferred revenues, and ratably recognize the deferral throughout the subscription period. As a result, we experience cash flow seasonality throughout the year, with a heavier weighting of operating cash inflows occurring during the first half, and particularly first quarter, of the year, when most subscription invoices are sent, as compared to the second half of the year.
63
We require and will continue to need significant cash resources to, among other things, meet our debt service requirements under our credit facilities, our secured notes due 2026 and any future indebtedness, fund our working capital requirements, make capital expenditures (including related to product development), and expand our business through acquisitions. Based on our forecasts, we believe that cash flow from operations, available cash on hand and available borrowing capacity under our revolving credit facility will be adequate to service debt, meet liquidity needs and fund necessary capital expenditures for at least the next 12 months. Our future capital requirements will depend on many factors, including the number of future acquisitions, data center infrastructure investments, and the timing and extent of spending to support product development efforts. We could be required, or could elect, to seek additional funding through public or private equity or debt financings; however, additional funds may not be available on terms acceptable to us.
Cash and cash equivalents were $76,130, $25,575, and $53,186 as of December 31, 2019, December 31, 2018 and December 31, 2017, respectively. As of December 31, 2019, we had approximately $1,665,000 of debt, consisting primarily of $900,000 in borrowings under our term loan facility, $700,000 in outstanding principal of secured notes due 2026 and $65,000 of borrowings under our revolving credit facility (which borrowings under our revolving credit facility we subsequently paid down in full in February 2020). On February 28, 2020, we incurred an incremental $360,000 of term loans under our term loan facility and used the net proceeds from such borrowings, together with cash on hand, to fund a portion of the cash consideration for the DRG acquisition and to pay related fees and expenses. See “—Debt Profile” below.
64
Cash Flows
The following table discloses our consolidated cash flows provided by (used in) operating, investing and financing activities for the periods presented:
| Year Ended December 31, | ||||||||||||
| (in thousands) | 2019 | 2018 | 2017 | |||||||||
| Net cash provided by (used in) operating activities | $ | 117,580 | $ | (26,100 | ) | $ | 6,667 | |||||
| Net cash provided by (used in) investing activities | (140,885 | ) | 11,934 | (40,205 | ) | |||||||
| Net cash provided by (used in) financing activities | 75,215 | (32,605 | ) | 22,818 | ||||||||
| Effect of exchange rates | (971 | ) | (5,193 | ) | 3,248 | |||||||
| Increase (Decrease) in cash and cash equivalents | 50,939 | (51,964 | ) | (7,472 | ) | |||||||
| Cash and cash equivalents beginning of the year | 25,584 | 77,548 | 85,020 | |||||||||
| Less: Cash included in assets held for sale, end of period | (384 | ) | — | — | ||||||||
| Cash and cash equivalents end of the year | $ | 76,139 | $ | 25,584 | $ | 77,548 | ||||||
Cash Flows Provided by (Used in) Operating Activities
Net cash provided by operating activities consists of net loss adjusted for non-cash items, such as: depreciation and amortization of property and equipment and intangible assets, deferred income taxes, share-based compensation, deferred finance charges and for changes in net working capital assets and liabilities.
Net cash provided by operating activities was $117,580 for the year ended December 31, 2019 compared to net cash used in operating activities of $26,100 for the year ended December 31, 2018. The $117,580 of net cash provided by operating activities for the year ended December 31, 2019 includes net loss of $210,977 offset with $324,842 of non-cash adjustments and changes in operating assets and liabilities of $3,715. The improvement in operating cash flows was driven by: (1) continual increase in deferred revenue illustrating an increase in sales year over year; (2) lower operating loss, which included the impact of a $39,399 gain on legal settlement and (3) a decrease of $47,043 in Transition, integration and other related expenses as a result of establishing a standalone company infrastructure.
Net cash used in operating activities was $26,100 for the year ended December 31, 2018 compared to net cash provided by operating activities of $6,667 for the year ended December 31, 2017. The $32,767 negative change in 2018 was primarily due to a $27,200 change in operating working capital. Accounts receivable increased due to price increases across our Product Lines along with a slight increase in the aging of the accounts, compared to the prior year change, reflecting strong collections efforts. Deferred revenues increased in both 2018 and 2017 reflecting continued increases in sales year over year. Accounts payable continues to decrease, reflecting the shortening of our accounts payable outstanding period to a normalized level, compared to the prior year backlog in payments. Excluding the reduction in Accrued expenses for the IPM Product Line Divesture, the activity in both years was consistent. While the current year change was minimal, the 2017 change in Other assets is a result of sales commission capitalization in connection with the adoption of ASC 606.
Net cash provided by operating activities for the year ended December 31, 2017 decreased by $200,429 to $6,667 from $207,096 for the year ended December 31, 2016. The decrease was primarily due to a decrease in deferred revenue, accounts payable and accruals offset partially by an increase in accounts receivables.
Cash Flows Provided by (Used in) Investing Activities
Net cash used in investing activities was $140,885 for the year ended December 31, 2019. Cash flows used in investing reflects the following activity: (1) $69,836 in capital expenditures; (2) $68,424 for the acquisition of Darts-ip, a provider of global IP case law data and analytics headquartered in Brussels, Belgium; (3) $2,625 for the acquisition of key business assets of SequenceBase.
65
Net cash provided by investing activities was $11,934 for the year ended December 31, 2018. Cash flows used in investing reflects the following activity: (1) $80,883 in net proceeds from the IPM Product Line divestiture (net of restricted cash and cash included in normalized working capital, as well as a working capital adjustment of $6,135), partially offset by (2) $45,410 in capital expenditures and (3) $23,539 in acquisitions, mainly TradeMarkVision and Kopernio.
Net cash used in investing activities was $40,205 for the year ended December 31, 2017. Cash flows used in investing reflects the following activity: (1) $37,804 in capital expenditures; (2) $7,401 in acquisitions related to Publons, a researcher-facing peer-review data and recognition platform; (3) offset by $5,000 in proceeds from the sale of an equity method investment.
Our capital expenditures in 2019, 2018 and 2017 consisted primarily of capitalized labor, consulting and other costs associated with product development.
Cash Flows Provided by (Used in) Financing Activities
Net cash provided by financing activities was $75,215 for the year ended December 31, 2019. Key drivers of the cash flows provided by financing include: (1) $1,600,000 of proceeds related to the refinance of debt as described in Note 14 — “Long Term Debt”; (2) $682,087 of proceeds from our merger with Churchill Capital Corp in 2019, net of cash acquired; (3) $200,000 related to the tax receivable agreement (See “Item 8. Financial Statements and Supplementary Data — Notes to the Consolidated Financial Statements — Note 20” for additional detail; (4) $70,000 in proceeds from our revolving credit facility; (5) $1,582 for the exercise of warrants and employee share options. This activity was offset by cash flows used in financing due to: (1) $1,342,651 due to the extinguishment of old debt; (2) Payment of $641,509 on our prior term loan facility upon consummation of the transaction with Churchill (includes $11,509 of recurring term loan principal repayments); (3) $50,000 repayment of borrowings under our prior revolving credit facility, and (4) $41,923 of debt issuance costs pursuant to the new debt.
Net cash used in financing activities was $32,605 for the year ended December 31, 2018. Key drivers of the cash flows used in financing include: (1) $46,709 in net repayments of debt under our term loan facility, mainly driven by an excess cash repayment of $31,378 following the IPM Product Line divestiture and standard recurring principle repayments of $15,000; (2) $30,000 repayment of borrowings under our revolving credit facility and (3) $2,470 contingent purchase price paid as a result of Publons achieving the first tier of milestones and performance metrics. This activity was offset by cash flows provided by financing due to: (1) $45,000 draw on our revolving credit facility in the second half of 2018, and (2) 1,574 for the exercise of warrants and employee share options.
Net cash provided by financing activities was $22,818 for the year ended December 31, 2017. Key drivers of the cash flows provided by financing include: (1) $30,000 in proceeds from our revolving credit facility; (2) $9,058 in proceeds from the issuance of equity related to management; offset by (3) $15,423 in principal payments on our term loan facility.
In February 2020, we completed an underwritten public offering of 27,600,000 of our ordinary shares, generating net proceeds of $540,736, which we used to fund a portion of the cash consideration for the DRG acquisition. In addition, we incurred an incremental $360,000 of term loans under our term loan facility and used the net proceeds from such borrowings, together with cash on hand, to fund the remainder of the cash consideration for the DRG acquisition and to pay related fees and expenses.
During the period January 1, 2020 through February 21, 2020, 24,132,666 of the Company’s outstanding warrants were exercised for one ordinary share per whole warrant at a price of $11.50 per share.
66
Free Cash Flow (non-GAAP measure)
The following table reconciles free cash flow measure, which is a non-GAAP measure, to net cash provided by operating activities:
| Year Ended December 31, | ||||||||||||
| (in thousands) | 2019 | 2018 | 2017 | |||||||||
| Net cash provided by (used in) operating activities | $ | 117,580 | $ | (26,100 | ) | $ | 6,667 | |||||
| Capital expenditures | (69,836 | ) | (45,410 | ) | (37,804 | ) | ||||||
| Free cash flow | $ | 47,744 | $ | (71,510 | ) | $ | (31,137 | ) | ||||
Free cash flow was $47,744 for the year ended December 31, 2019, compared to a use of $71,510 for the year ended December 31, 2018 and a use of $31,137 for the year ended December 31, 2017. The increase in free cash flow was primarily due to higher net cash provided by operating activities.
Required Reported Data - Standalone Adjusted EBITDA
We are required to report Standalone Adjusted EBITDA, which is substantially similar to Consolidated EBITDA and EBITDA as such terms are defined under our credit facilities, dated as of October 31, 2019 and the indenture governing our secured notes due 2026 issued by Camelot Finance S.A. and guaranteed by certain of our subsidiaries, respectively. In addition, the credit facilities and the indenture contain certain restrictive covenants that govern debt incurrence and the making of restricted payments, among other matters. These restrictive covenants utilize Standalone Adjusted EBITDA as a primary component of the compliance metric governing our ability to undertake certain actions otherwise proscribed by such covenants. Standalone Adjusted EBITDA reflects further adjustments to Adjusted EBITDA for cost savings already implemented and excess standalone costs.
Because Standalone Adjusted EBITDA is required pursuant to the terms of the reporting covenants under the credit facilities and the indenture and because this metric is relevant to lenders and noteholders, management considers Standalone Adjusted EBITDA to be relevant to the operation of its business. It is also utilized by management and the compensation committee of the Board as an input for determining incentive payments to employees.
Excess standalone costs are the difference between our actual standalone company infrastructure costs, and our estimated steady state standalone infrastructure costs. We make an adjustment for the difference because we have had to incur costs under the transition services agreement with Thomson Reuters after we had implemented the infrastructure to replace the services provided pursuant to the transition services agreement, thereby incurring dual running costs. Furthermore, there has been a ramp up period for establishing and optimizing the necessary standalone infrastructure. Since our separation from Thomson Reuters, we have had to transition quickly to replace services provided under the transition services agreement, with optimization of the relevant standalone functions typically following thereafter. Cost savings reflect the annualized “run rate” expected cost savings, net of actual cost savings realized, related to restructuring and other cost savings initiatives undertaken during the relevant period.
Standalone Adjusted EBITDA is calculated under the credit facilities and the indenture by using our consolidated net income for the trailing 12-month period (defined in the credit facilities and the indenture as our U.S. GAAP net income adjusted for certain items specified in the credit facilities and the indenture) adjusted for items including: taxes, interest expense, depreciation and amortization, non-cash charges, expenses related to capital markets transactions, acquisitions and dispositions, restructuring and business optimization charges and expenses, consulting and advisory fees, run-rate cost savings to be realized as a result of actions taken or to be taken in connection with an acquisition, disposition, restructuring or cost savings or similar initiatives, “run rate” expected cost savings, operating expense reductions, restructuring charges and expenses and synergies related to the transition projected by us, costs related to any management or equity stock plan, other adjustments that were presented in the offering memorandum used in connection with the issuance of the secured notes due 2026 and earnout obligations incurred in connection with an acquisition or investment.
67
The following table reconciles Standalone Adjusted EBITDA to our Net loss for the periods presented:
| Year Ended December 31, | ||||||||||||
| 2019 | 2018 | 2017 | ||||||||||
| (in thousands) | ||||||||||||
| Net loss | $ | (210,977 | ) | $ | (242,162 | ) | $ | (263,930 | ) | |||
| (Benefit) provision for income taxes | 10,201 | 5,649 | (21,293 | ) | ||||||||
| Depreciation and amortization | 200,542 | 237,225 | 228,463 | |||||||||
| Interest, net | 157,689 | 130,805 | 138,196 | |||||||||
| Transition services agreement costs(1) | 10,481 | 55,764 | 89,942 | |||||||||
| Transition, transformation and integration expense(2) | 24,372 | 69,185 | 86,809 | |||||||||
| Deferred revenues adjustment(3) | 438 | 3,152 | 49,673 | |||||||||
| Transaction related costs(4) | 46,214 | 2,457 | 2,245 | |||||||||
| Gain on sale of IPM Product Line | — | (36,072 | ) | — | ||||||||
| Share-based compensation expense | 51,383 | 13,715 | 17,663 | |||||||||
| Tax indemnity asset(5) | — | 33,819 | — | |||||||||
| IPM adjusted operating margin(6) | — | (5,897 | ) | (6,811 | ) | |||||||
| Restructuring(7) | 15,670 | — | — | |||||||||
| Legal settlement | (39,399 | ) | — | — | ||||||||
| Impairment on assets held for sale | 18,431 | — | — | |||||||||
| Other(8) | 9,021 | 5,221 | (1,250 | ) | ||||||||
| Adjusted EBITDA | 294,066 | 272,861 | 319,707 | |||||||||
| Realized foreign exchange gain | (3,500 | ) | — | — | ||||||||
| Cost savings(9) | 15,500 | 12,700 | 9,700 | |||||||||
| Excess standalone costs(10) | 30,000 | 25,407 | (24,600 | ) | ||||||||
| Standalone Adjusted EBITDA | $ | 336,066 | $ | 310,968 | $ | 304,807 | ||||||
| (1) | Includes accruals for payments to Thomson Reuters under the transition services agreement. These costs have decreased substantially in 2019, as we are in the final stages of implementing our standalone company infrastructure. |
| (2) | Includes costs incurred in connection with and after our separation from Thomson Reuters in 2016 relating to the implementation of our standalone company infrastructure and related cost-savings initiatives. These costs include mainly transition consulting, technology infrastructure, personnel and severance expenses relating to our standalone company infrastructure, which are recorded in Transition, integration, and other line-item of our income statement, as well as expenses related to the restructuring and transformation of our business following our separation from Thomson Reuters in 2016 mainly related to the integration of separate business units into one functional organization and enhancements in our technology. |
| (3) | Reflects deferred revenues fair value accounting adjustment arising from purchase price allocation in connection with our separation from Thomson Reuters in 2016 See “—Factors Affecting the Comparability of Our Results of Operations — Our Transition to Operations as a Standalone Business — Purchase Accounting Impact of Our Separation from Thomson Reuters in 2016.” |
| (4) | Includes consulting and accounting costs associated with acquisitions and the sale of the IPM Product Line and sale of MarkMonitor business. |
| (5) | Reflects the write down of a tax indemnity asset. |
| (6) | Reflects the IPM Product Line’s operating margin, excluding amortization and depreciation, prior to its divestiture in October 2018. |
| (7) | Reflects costs incurred in connection with the initiative, following our merger with Churchill Capital Corp in 2019, to streamline our operations by simplifying our organization and focusing on two product groups. |
68
| (8) | Includes primarily the net impact of foreign exchange gains and losses related to the re-measurement of balances and other items that do not reflect our ongoing operating performance. |
| (9) | Reflects the estimated annualized run-rate cost savings, net of actual cost savings realized, related to restructuring and other cost savings initiatives undertaken during the period (exclusive of any cost reductions in our estimated standalone operating costs). |
| (10) | Reflects the difference between our actual standalone company infrastructure costs, and our estimated steady state standalone operating costs, which were as follows: |
| Year Ended December 31, | ||||||||||||
| (in thousands) | 2019 | 2018 | 2017 | |||||||||
| Actual standalone company infrastructure costs | $ | 162,000 | $ | 153,607 | $ | 97,100 | ||||||
| Steady state standalone cost estimate | (132,000 | ) | (128,200 | ) | (121,700 | ) | ||||||
| Excess standalone costs | $ | 30,000 | $ | 25,407 | $ | (24,600 | ||||||
The foregoing adjustments (9) and (10) are estimates and are not intended to represent pro forma adjustments presented within the guidance of Article 11 of Regulation S-X. Although we believe these estimates are reasonable, actual results may differ from these estimates, and any difference may be material. See “Cautionary Statement Regarding Forward-Looking Statements.”
Debt Profile
Secured Notes Due 2026
On October 31, 2019, we closed a private offering of $700,000 in aggregate principal amount of secured notes due 2026 bearing interest at 4.50% per annum. The secured notes due 2026 were issued by Camelot Finance S.A., an indirect wholly-owned subsidiary of Clarivate, are secured on a first-lien pari passu basis with borrowings under the credit facilities, and are guaranteed on a joint and several basis by certain of Clarivate’s subsidiaries. We used the net proceeds from the offering of secured notes due 2026, together with proceeds from the credit facilities discussed below to, among other things, redeem in full our secured notes due 2026, refinance all amounts terminating under the tax receivable agreement and under the prior credit facilities, fund in full the $200,000 payment pursuant to the agreement, and pay fees and expenses related to the foregoing.
The indenture governing the secured notes due 2026 contains covenants which, among other things, limit the incurrence of additional indebtedness (including acquired indebtedness), issuance of certain preferred stock, the payment of dividends, making restricted payments and investments, the purchase or acquisition or retirement for value of any equity interests, the provision of loans or advances to restricted subsidiaries, the sale or lease or transfer of any properties to any restricted subsidiaries, the transfer or sale of assets, and the creation of certain liens. As of the date of this annual report, we believe we were in compliance with the indenture covenants.
Credit Facilities
On October 31, 2019, we entered into a $900,000 term loan facility, which was fully drawn at closing, and a $250,000 revolving credit facility, which was undrawn at closing. The revolving credit facility matures on October 31, 2024 and the term loan facility matures on October 31, 2026. On February 28, 2020, we incurred an incremental $360,000 of term loans under our term loan facility and used the net proceeds from such borrowings to fund a portion of the cash consideration for the DRG acquisition.
Borrowings under the credit facilities bear interest at a floating rate which can be, at our option, either (i) a Eurocurrency rate plus an applicable margin or (ii) an alternate base rate (equal to the highest of (i) the rate which Bank of America, N.A. announces as its prime lending rate, (ii) the Federal Funds Effective Rate plus one-half of 1.00% and (iii) the Eurocurrency rate for an interest period of one month for loans denominated in dollars plus 1.00%) plus an applicable margin, in either case, subject to a Eurocurrency rate floor of 0.00%. Commencing March 31, 2020, the term loan facility will amortize in equal quarterly installments in an amount equal to 1.00% per annum of the original par principal amount thereof, with the remaining balance due at final maturity.
69
The credit facilities are secured by substantially all of our assets and the assets of all of our U.S. restricted subsidiaries and certain of our non-U.S. subsidiaries, including those that are or may be borrowers or guarantors under the credit facilities, subject to customary exceptions. The credit facilities contain customary events of default and restrictive covenants that limit us from, among other things, incurring certain additional indebtedness, issuing preferred stock, making certain restricted payments and investments, certain transfers or sales of assets, entering into certain affiliate transactions or incurring certain liens. These limitations are subject to customary baskets, including certain limitations on debt incurrence and issuance of preferred stock, subject to compliance with a consolidated coverage ratio of Consolidated EBITDA (as defined in the credit facilities), a measure substantially similar to our Standalone Adjusted EBITDA disclosed above under “— Required Reported Data — Standalone Adjusted EBITDA”, to interest and other fixed charges on certain debt (as defined in the credit facilities) greater than 2.00 to 1.00 or a total net leverage ratio (as defined in the credit facilities) not to exceed 6.50 to 1.00. In addition, the credit facilities require us to comply with a springing financial covenant pursuant to which, as of the first quarter of 2020, we must not exceed a first lien net leverage ratio (as defined under the credit facilities) of 7.25 to 1.00, to be tested on the last day of any quarter only when more than 35% of the revolving credit facility (excluding (i) non-cash collateralized, issued and undrawn letters of credit in an amount up to $20,000 and (ii) any cash collateralized letters of credit) is utilized at such date. As of December 31, 2019, our consolidated coverage ratio was 3.32 to 1.00 and our consolidated leverage ratio was 4.73 to 1.00. As of the date of this form 10-K, we are in compliance with the covenants in the credit facilities.
The credit facilities provide that, upon the occurrence of certain events of default, our obligations thereunder may be accelerated and the lending commitments terminated. Such events of default include payment defaults to the lenders, material inaccuracies of representations and warranties, covenant defaults, cross-defaults to other material indebtedness (including the secured notes due 2026), voluntary and involuntary bankruptcy proceedings, material money judgments, loss of perfection over a material portion of collateral, material ERISA/pension plan events, certain change of control events and other customary events of default, in each case subject to threshold, notice and grace period provisions.
Commitments and Contingencies
Our contingent liabilities consist primarily of letters of credit and performance bonds and other similar obligations in the ordinary course of business.
Additionally, the Company has agreed to pay the former shareholders of acquired companies certain amounts in conjunction with the Publons, TradeMarkVision and Kopernio acquisitions. Regarding the Publons acquisition, the Company agreed to pay the former shareholders up to an additional $9,500 through 2020, of which $2,371 and $2,470 was paid in 2019 and 2018 respectively. Regarding the TradeMarkVision acquisition, the Company agreed to pay former shareholders earn-out payments through 2020. Regarding the Kopernio acquisition, the Company agreed to pay contingent consideration of up to $3,500 through 2021. Amounts payable are contingent upon Publons’, TrademarkVision’s and Kopernio’s achievement of certain milestones and performance metrics. As of December 31, 2019, the Company had an outstanding liability for Publons of $3,100 related to the estimated fair value of this contingent consideration, of which $3,100, was included in Accrued expenses and Other current liabilities. As of December 31, 2019, the Company had an outstanding liability for TradeMarkVision of $8,000 related to the estimated fair value of this contingent consideration, which compensation earn-out was included in Other non-current liabilities in the Consolidated Balance Sheets. As of December 31, 2019, the Company has recognized over the concurrent service period an outstanding liability for Kopernio of $992 related to the estimated fair value of this contingent compensation earn-out. The liability is included in Accrued expenses and other current liabilities in the Consolidated Balance Sheets.
In 2018, we wrote down our $33,819 tax indemnity asset, based on a dispute with the indemnitor which was later resolved by a confidential legal settlement.
Off Balance Sheet Arrangements
We do not currently have any off-balance sheet arrangements and do not have any holdings in variable interest entities.
70
Contractual Obligations
We have various contractual obligations and commercial commitments that are recorded as liabilities in our financial statements. Other items, such as purchase obligations and other executory contracts, are not recognized as liabilities in our consolidated financial statements, but are required to be disclosed.
In the table below, we set forth our significant enforceable and legally binding obligations and future commitments as of December 31, 2019.
| Payments Due by Period | ||||||||||||||||||||
| (in thousands) | Total | Less than 1 Year | 1 to 3 Years | 3 to 5 Years | More Than 5 Years | |||||||||||||||
| Long-term debt, including interest (1) | $ | 2,266,405 | $ | 101,441 | $ | 170,046 | $ | 299,961 | $ | 1,694,957 | ||||||||||
| Operating Leases (2) | 103,162 | 21,178 | 33,232 | 23,292 | 25,460 | |||||||||||||||
| Purchase Obligations (3) | 48,076 | 37,332 | 10,744 | — | — | |||||||||||||||
| Total | $ | 2,417,643 | $ | 159,951 | $ | 214,022 | $ | 323,253 | $ | 1,720,417 | ||||||||||
(1) This amount also includes interest, which, for the floating rate portion of our debt has been calculated based on the applicable base rates (i.e., LIBOR) in effect as of December 31, 2019.
(2) Our operating lease obligations include future minimum lease payments under all our non-cancellable operating leases with an initial term in excess of one year. We adopted the new accounting standard for leases, ASC 842, on January 1, 2019, under which operating leases are to be recorded as balance sheet liabilities, with a corresponding right of use asset. See “Item 8. Financial Statements and Supplementary Data — Notes to the Consolidated Financial Statements — Note 3”
(3) Includes purchase obligations, primarily for cloud computing services and software licenses, pursuant to agreements to purchase goods and services that are enforceable, legally binding, and specify significant terms, including fixed or minimum quantities to be purchased, fixed minimum or variable pricing provisions, and the approximate timing of the transactions. Purchase orders made in the ordinary course of business are excluded from the above table. Any amounts for which we are liable are reflected in our Consolidated Balance Sheets as Accounts payable or Accrued expenses.
On August 21, 2019, Camelot entered into an agreement, terminating all future payment obligations of Camelot under the tax receivable agreement in exchange for a payment of $200,000, which Camelot paid on November 7, 2019 with a portion of the net proceeds from the Refinancing Transactions.
In addition, in connection with our merger with Churchill Capital Corp in 2019, Onex Partners Advisors LP, an affiliate of Onex, received a fee of $5,400 and BPEA, an affiliate of Baring, received a fee of $2,100 in the second quarter of 2019. See “Item 13. Certain Relationships and Related Person Transactions — Company Related Person Transactions — Consulting Services Agreements.”
Critical Accounting Policies, Estimates and Assumptions
The preparation of the consolidated financial statements in accordance with GAAP requires management to make judgments, estimates and assumptions that affect the amounts reported in the consolidated financial statements. On an ongoing basis, we evaluate estimates, which are based on historical experience and on various other assumptions that we believe to be reasonable under the circumstances. We consider the following accounting policies to be critical to understanding our financial statements because the application of these policies requires significant judgment on the part of management, which could have a material impact on our financial statements if actual performance should differ from historical experience or if our assumptions were to change. The following accounting policies include estimates that require management’s subjective or complex judgments about the effects of matters that are inherently uncertain. For information on our significant accounting policies, including the policies discussed below, see “Item 8. Financial Statements and Supplementary Data — Notes to the Consolidated Financial Statements — Note 3”
71
Revenue Recognition
We derive revenues from contracts with customers by selling information on a subscription and single transaction basis as well as performing professional services. Our subscription contract agreements contain standard terms and conditions, and most contracts include a one-year subscription, although we may provide a multi-year subscription in certain instances. In some cases, contracts provide for variable consideration that is contingent upon the occurrence of uncertain future events, such as retroactive discounts provided to the customers, indexed or volume based discounts, and revenues between contract expiration and renewal. We estimate the amount of the variable consideration at the expected value or at the most likely amount depending on the type of consideration. Estimated amounts are included in the transaction price to the extent it is probable that a significant reversal of cumulative revenues recognized will not occur when the uncertainty associated with the variable consideration is resolved. The estimate of variable consideration and determination of whether to include estimated amounts in the transaction price are based largely on an assessment of its anticipated performance and all information (historical, current and forecasted) that is reasonably available to us.
Most of our revenues are derived from subscription contract arrangements, which may contain multiple performance obligations. For these arrangements, the transaction price is allocated to the identified performance obligations based on their relative standalone selling prices. We utilize standard price lists, together with consideration of market conditions, customer demographics, and geographic location, to determine the standalone selling price for most of our products and services, however certain products may not have a standalone selling price that is directly observable, which requires judgment.
See “Item 8. Financial Statements and Supplementary Data — Notes to the Consolidated Financial Statements — Note 3” for further discussion.
Accounts Receivable
Accounts receivable are recorded at the amount invoiced to customers and do not bear interest. We maintain an allowance for doubtful accounts for losses resulting from the inability of specific customers to meet their financial obligations, representing our best estimate of probable credit losses in existing trade accounts receivable. A specific reserve for doubtful receivables is recorded against the amount due from these customers. For all other customers, we recognize reserves for doubtful receivables by evaluating factors such as the length of time receivables are past due, historical collection experience, and the economic and competitive environment. If any of these estimates change or actual results differ from expected results, then an adjustment is recorded in the period in which the amounts become reasonably estimable.
Business Combinations
In a business combination, substantially all identifiable assets, liabilities and contingent liabilities acquired are accounted for using the acquisition method at the acquisition date and are recorded at their respective fair values. One of the most significant estimates relates to the determination of the fair value of these assets and liabilities. The determination of the fair values is based on estimates and judgments made by management. Our estimates of fair value are based upon assumptions we believe to be reasonable, but which are inherently uncertain and unpredictable. Measurement period adjustments are reflected at the time identified, up through the conclusion of the measurement period, which is the time at which all information for determination of the values of assets acquired and liabilities assumed is received, and is not to exceed one year from the acquisition date.
Goodwill is measured at the acquisition date as the fair value of the consideration transferred (including, if applicable, the fair value of any previously held equity interest and any non-controlling interests) less the net recognized amount (which is generally the fair value) of the identifiable assets acquired and liabilities assumed.
When a business combination involves contingent consideration, we record a liability for the estimated cost of such contingencies when expenditures are probable and reasonably estimable. A significant amount of judgment is required to estimate and quantify the potential liability in these matters. We engage outside experts as deemed necessary or appropriate to assist in the calculation of the liability; however, management is responsible for evaluating the estimate. We reassess the estimated fair value of the contingent consideration each financial reporting period over the term of the arrangement. Any resulting changes identified subsequent to the measurement period are recognized in earnings and could have a material effect on our results of operations.
72
Other Identifiable Intangible Assets, net
Other identifiable intangible assets are recorded at fair value upon acquisition and are subsequently carried at cost less accumulated amortization or accumulated impairment for indefinite-lived intangible assets. Where applicable, other identifiable intangible assets are amortized over their estimated useful lives as follows:
| Customer relationships | 2 – 14 years | |||
| Databases and content | 13 – 20 years | |||
| Other | N/A | |||
| Finite-lived trade names | 18 years | |||
| Indefinite-lived trade names | Indefinite |
The carrying values of other identifiable intangible assets are reviewed for impairment whenever circumstances indicate that their carrying amounts may not be recoverable. The carrying values of indefinite-lived intangible assets are reviewed for impairment annually, or more frequently when circumstances indicate that impairment may have occurred. The test for impairment compares the carrying amounts to the fair value based on current revenues projections of the related operations, under the relief from royalty method. Any excess of the carrying value over the amount of fair value is recognized as an impairment. Any such impairment would be recognized in full in the reporting period in which it has been identified and could have a material adverse effect on our financial condition or results of operations.
Goodwill
We test goodwill annually for impairment in the fourth quarter, or more frequently when circumstances indicate that impairment may have occurred. Goodwill represents the purchase price in excess of the fair value of the net assets acquired in a business combination. If the carrying value of a reporting unit exceeds the implied fair value of that reporting unit, an impairment charge to goodwill is recognized for the excess. Our reporting units are one level below the operating segment, as determined in accordance with ASC 350, Intangibles — Goodwill and Other. For the years ended December 31, 2019 and 2018, we identified five reporting units.
We completed our most recent annual goodwill impairment testing during the fourth quarter of 2019. As a part of our assessment of each reporting unit’s estimated fair value and likelihood of impairment, we include both a quantitative and qualitative evaluation. In the testing, we assess various qualitative factors to determine whether the fair value of a reporting unit may be less than its carrying amount. If a determination is made that, based on the qualitative factors, an impairment does not exist, then we are not required to perform further testing. If the aforementioned qualitative assessment results in concluding that it is more likely than not that the fair value of a reporting unit may be less than its carrying amount, the fair value of the reporting unit will be determined and compared to its carrying value including goodwill. We estimate the fair value of our reporting units using the income approach. Under the income approach, we calculate the fair value of a reporting unit based on the present value of estimated cash flows. Cash flow projections are based on our estimates of revenues growth rates and operating margins. The discount rate is based on the weighted average cost of capital adjusted for the relevant risk associated with the characteristics of the business and projected cash flows.
Based on the results of the annual impairment test as of October 1, 2019, the fair values of our reporting units exceeded the individual reporting unit’s carrying value, and goodwill was not impaired.
Share-Based Compensation
Share-based compensation expense includes cost associated with stock options and restricted stock units (“RSUs”) granted to certain members of key management.
73
The stock option fair value is estimated at the date of grant using the Black-Scholes option pricing model, which requires management to make certain assumptions of future expectations based on historical and current data. The assumptions include the expected term of the stock option, expected volatility, dividend yield, and risk-free interest rate. The expected term represents the amount of time that options granted are expected to be outstanding, based on forecasted exercise behavior. The risk-free rate is based on the rate at grant date of zero-coupon U.S. Treasury Notes with a term comparable to the expected term of the option. Expected volatility is estimated based on the historical volatility of comparable public entities’ stock price from the same industry. Our dividend yield is based on forecasted expected payments, which are expected to be zero for the immediate future. We recognize compensation expense over the vesting period of the award on a graded-scale basis, and we recognize forfeitures as they occur.
The stock-based compensation cost of time-based RSU grants is calculate by multiplying the grant date fair market value by the number of shares granted. We recognize compensation expense over the vesting period of the award on a graded-scale basis, and we recognize forfeitures as they occur.
Derivative Financial Instruments
We may use interest rate derivatives to manage risks generally associated with interest rate fluctuations. These derivative instruments are used as risk management tools and not for speculative or trading purposes.
We use interest rate derivatives with counterparties to reduce our exposure to variability in cash flows relating to interest payments on a portion of our outstanding term loan facility and revolver borrowings. We apply hedge accounting and have designated these instruments as cash flow hedges of the risk associated with floating interest rates on designated future quarterly interest payments. Management assumes the hedge is highly effective and therefore changes in the value of the hedging instrument are recorded in Accumulated other comprehensive income (loss) in the Consolidated Balance Sheets. Any ineffectiveness is recorded in earnings. Amounts in Accumulated other comprehensive income (loss) are reclassified into earnings in the same period during which the hedged transactions affect earnings, or upon termination of the hedging relationship.
Fair Value of Financial Instruments
We disclose and recognize the fair value of our assets and liabilities using a hierarchy that prioritizes the inputs to valuation techniques used to measure fair value. Fair value is defined as the exchange price that would be received for an asset or paid to transfer a liability (an exit price) in the principal or most advantageous market for the asset or liability in an orderly transaction between market participants. The hierarchy gives the highest priority to unadjusted quoted prices in active markets for identical assets or liabilities (Level 1 measurements) and the lowest priority to unobservable inputs (Level 3 measurements). A financial instrument’s level within the fair value hierarchy is based on the lowest level of any input that is significant to the fair value measurement.
The following valuation techniques are used to measure fair value for assets and liabilities:
Level 1 — Quoted market prices in active markets for identical assets or liabilities;
Level 2 — Significant other observable inputs (e.g., quoted prices for similar items in active markets, quoted prices for identical or similar items in markets that are not active, inputs other than quoted prices that are observable such as interest rate and yield curves, and market-corroborated inputs); and
Level 3 — Unobservable inputs for the asset or liability, which are valued based on management’s estimates of assumptions that market participants would use in pricing the asset or liability.
Movements in the fair value of financial instruments could have a material effect on the financial condition or results of operations.
74
Taxation
Certain items of income and expense are not recognized in our financial statements and income tax returns in the same year, which creates timing differences. These timing differences result in (1) deferred income tax liabilities that create an increase in future income taxes, and (2) deferred income tax assets that create a reduction in future income taxes. Recognition of deferred tax assets is based on management’s belief that it is more likely than not that the income tax benefit associated with certain temporary differences, income tax credits, capital loss carryforwards, and income tax operating loss, would be realized. We record a valuation allowance to reduce the deferred tax assets to equal an amount that is more likely than not to be realized. The amount of the valuation allowance is based on the assessment of future taxable income by tax jurisdiction and tax planning strategies. If the estimate of future taxable income or tax strategies changes at any time, we would record an adjustment to the valuation allowance. Such an adjustment could have a material effect on our financial condition or results of operations.
Changes in tax laws and tax rates could also affect recorded deferred tax assets and liabilities in the future. The calculation of our tax liabilities involves dealing with uncertainties in the application of complex tax laws and regulations in a multitude of jurisdictions across our global operations. ASC Topic 740, Income Taxes, states that a benefit from an uncertain tax position may be recognized when it is more likely than not that the position will be sustained upon examination, including resolutions of any related appeals or litigation processes, on the basis of the technical merits. We first record unrecognized tax benefits as liabilities in accordance with ASC 740 and then adjust these liabilities when changes are identified, as a result of the evaluation of new information not previously available at the time of establishing the liability. Because of the complexity of some of these uncertainties, the ultimate resolution may result in a payment that is materially different from the current estimate of the unrecognized tax benefit liabilities. These differences will be reflected as increases or decreases to income tax expense in the period in which new information is available and could have a material effect on the financial condition or results of operations.
Interest accrued related to unrecognized tax benefits and income tax related penalties are included in the provision for income taxes.
Deferred tax is provided on taxable temporary differences arising on investments in non-U.S. subsidiaries and equity method investees, except where we intend, and are able, to reinvest such amounts on a permanent basis.
Tax Receivable Agreement
In connection with our merger with Churchill Capital Corp, we entered into a tax receivable agreement with Onex, Baring and certain other pre-merger shareholders of the Company. The tax receivable agreement generally would have required us to pay the counterparties 85% of the amount of cash savings, if any, realized (or, in some cases, deemed to be realized) as a result of the utilization of certain tax assets. In August 2019, we entered into an agreement pursuant to which all of our future payment obligations under the tax receivable agreement would terminate in exchange for a payment of $200,000, which we made in November 2019. The settlement of the original tax receivable agreement liability was accounted for as an adjustment to Equity.
Prior to termination of the tax receivable agreement, there may have been significant changes to the estimate of our liability due to various reasons including changes in corporate tax law, changes in estimates of the amount or timing of future taxable income, and other items. Changes in those estimates would have been recognized as adjustments to the related liability, with offsetting impacts recorded in the statement of operations as Other operating income (expense), net.
Pension and Other Post-Retirement Benefits
We provide retirement benefits to certain employees, including defined benefit pension plans. The determination of benefit obligations and expense is based on actuarial models. In order to measure benefit costs and obligations using these models, critical assumptions are made with regard to the discount rate, expected return on assets, and the assumed rate of compensation increases. Other assumptions involve demographic factors such as turnover, retirement, and mortality rates. Changes in material assumptions could materially affect the amounts, particularly the long-term rate of return on plan assets and the rate used to discount the projected benefit obligation. Management reviews these assumptions periodically and updates them when its experience deems it appropriate to do so.
75
The discount rate is determined annually by management. For most international markets, the discount rate is based on the results of a modeling process in which the plans’ expected cash flows (based on the plans’ duration as of December 31, 2019 market conditions) is matched with the spot rate from a current yield curve of an index of high quality (Standard & Poor’s AA and above) corporate bonds to develop the present value of the expected cash flow, and then determine the discount rate. In India specifically, the discount rate is set based on the yields of the Indian Government bonds, appropriate to the duration of the plan liabilities. As a sensitivity measure, a 100-basis point increase in the discount rate for all of our plans, absent any other changes in assumptions, would result in a $2,300 decrease in the projected benefit obligation as of December 31, 2019. A 100-basis point decrease in the discount rate would result in a $1,800 increase in the projected benefit obligation as of December 31, 2019.
We sponsor only one specific plan, the Belgium plan, that has a plan asset. The plan asset has a rate of return guaranteed by the insurance company.
In selecting an expected return on our plan assets, we consider obtaining a rate that is consistent with the level of risk taken, and to target performance rates that meet the standard required by local regulations for our defined benefit plan. The actual return on plan assets will vary from year to year versus this assumption. We believe it is appropriate to use long-term expected forecasts in selecting the expected return on assets. As such, there can be no assurance that our actual return on plan assets will approximate the long-term expected forecasts. Our current strategy is to invest primarily in 100% insurance contracts, that do not have target asset allocation ranges, and a guarantee that the plan asset will always provide a minimum rate of return.
Recently Issued and Adopted Accounting Pronouncements
For recently issued and adopted accounting pronouncements, see “Item 8. Financial Statements and Supplementary Data — Notes to the Consolidated Financial Statements — Note 3.”
Item 7A. Quantitative and Qualitative Disclosures About Market Risk
Market risk is the risk that changes in market prices, such as foreign currency exchange rates and interest rates, will affect our cash flows or the fair value of our holdings of financial instruments. The objective of market risk management is to manage and control market risk exposures within acceptable parameters.
Foreign Currency Exchange Rate Risk
We are exposed to foreign currency exchange risk related to our transactions and our subsidiaries’ balances that are denominated in currencies other than the U.S. dollar, our functional currency. See “Item 7. Management’s Discussion and Analysis of Financial Condition and Results of Operations — Factors Affecting the Comparability of Our Results of Operations-Effect of Currency Fluctuations” for more information about our foreign currency exchange rate exposure. In accordance with our treasury policy, we seek to naturally hedge our foreign exchange transaction exposure by matching the transaction currencies for our cash inflows and outflows. For example, where commercially feasible, we seek to borrow in the same currencies in which cash flows from operations are generated. In the past, we have used derivatives to hedge foreign currency exchange risk arising from receipts and payments denominated in foreign currencies on a limited basis, primarily in our IPM Product Line, which we divested in October 2018. We do not currently hedge our foreign exchange transaction or translation exposure, but may consider doing so in the future.
76
Revenues denominated in currencies other than U.S. dollars amounted to $185,894, or approximately 19.1%, of our total revenues for the year ended December 31, 2019. A significant majority of this amount was denominated in euro, British pounds and Japanese yen. A 5% increase or decrease in the value of the euro, British pound and Japanese yen relative to the U.S. dollar would have caused our revenues for the year ended December 31, 2019 to increase or decrease by $9,295.
Interest Rate Risk
Our interest rate risk arises primarily from our borrowings at floating interest rates. Borrowings under our credit facilities are subject to floating base interest rates, plus a margin. As of December 31, 2019, we had $965,000 of floating rate debt outstanding under our credit facilities, consisting of borrowings under the revolving and term loan facilities for which the base rate was one-month LIBOR (subject, with respect to the term loan facility only, to a floor of 0.00%), which stood at 1.76% at December 31, 2019. Of this amount, we hedged $340,610 of our principal amount of our floating rate debt under hedges using interest rate derivatives. As a result, $624,390 of our outstanding borrowings effectively bore interest at floating rates. A 100 basis point increase or decrease in the applicable base interest rate under our credit facilities would have an annual impact of $9,059 on our cash interest expense for the year ended December 31, 2019. For additional information on our outstanding debt and related hedging, see "Item 8. Financial Statements and Supplementary Data — Notes to the Consolidated Financial Statements — Note 11 and 14."
In April 2017, the Company entered into interest rate derivative arrangements with counterparties to reduce its exposure to variability in cash flows relating to interest payments on $300,000 of its term loan, effective April 30, 2021. Additionally, in May 2019, the Company entered into additional interest rate derivative arrangements with counterparties to reduce its exposure to variability in cash flows relating to interest payments on $50,000 of its term loan, effective March 2021 and maturing in September 2023. The Company will apply hedge accounting by designating the interest rate swaps as a hedge in applicable future quarterly interest payments.
It is not clear what impact, if any, the United Kingdom’s withdrawal from the European Union will have on the interest rate on our indebtedness and related derivative instruments. The United Kingdom withdrew from the European Union on January 31, 2020. Under the terms of the withdrawal agreement between the United Kingdom and the European Union, a transition period is in effect until December 31, 2020. During the transition period, the United Kingdom will be treated in all material respects as though it is a member of the European Union, with most EU laws applying to and in the United Kingdom. In addition, the United Kingdom will remain in the European Union single market and customs union and free movement of people will continue until the end of the transition period.
However, the terms of a future relationship between the United Kingdom and the European Union are not clear at this time. Therefore, there is a risk that if there is no agreement at the end of the transition period, or the agreement is detrimental to the United Kingdom, LIBOR could become an unauthorized “third country” benchmark for the purposes of the European Union Benchmarks Regulation, and neither European Union banks, nor their counter parties will be able to reference it.
In addition, in July 2017 the UK Financial Conduct Authority announced its intention to phase out LIBOR rates by the end of 2021. It is not possible to predict the effect of any changes in the methods by which LIBOR is determined, or any other reforms to LIBOR that may be enacted in the United Kingdom or elsewhere. Such developments may cause LIBOR to perform differently than in the past, including sudden or prolonged increases or decreases in LIBOR, or cease to exist, resulting in the application of a successor base rate under our credit facilities, which in turn could have unpredictable effects on our interest payment obligations under our credit facilities.
Credit Risk
We are not currently exposed to market instruments, except for the effective interest rate hedges discussed above. We are, however, exposed to credit risk on our accounts receivable, and we maintain an allowance for potential credit losses. As of December 31, 2019, no single customer accounted for more than 1% of our consolidated revenues. Further, given our subscription-based revenues model, where a significant portion of customer obligations are payable to us upfront, and our credit control procedures, we believe that our exposure to customer credit risk is currently limited.
77
Item 8. Financial Statements and Supplementary Data
INDEX TO CONSOLIDATED FINANCIAL STATEMENTS
Page
78
Report of Independent Registered Public Accounting Firm
To the Board of Directors and Shareholders of
Clarivate Analytics Plc
Opinion on the Financial Statements
We have audited the accompanying consolidated balance sheets of Clarivate Analytics Plc and its subsidiaries (the “Company”) as of December 31, 2019 and 2018, and the related consolidated statements of operations, of comprehensive income (loss), of changes in equity and of cash flows for each of the three years in the period ended December 31, 2019, including the related notes (collectively referred to as the “consolidated financial statements”). In our opinion, the consolidated financial statements present fairly, in all material respects, the financial position of the Company as of December 31, 2019 and 2018, and the results of its operations and its cash flows for each of the three years in the period ended December 31, 2019 in conformity with accounting principles generally accepted in the United States of America.
Change in Accounting Principle
As discussed in Note 3 to the consolidated financial statements, the Company changed the manner in which it accounts for leases in 2019.
Basis for Opinion
These consolidated financial statements are the responsibility of the Company’s management. Our responsibility is to express an opinion on the Company’s consolidated financial statements based on our audits. We are a public accounting firm registered with the Public Company Accounting Oversight Board (United States) (PCAOB) and are required to be independent with respect to the Company in accordance with the U.S. federal securities laws and the applicable rules and regulations of the Securities and Exchange Commission and the PCAOB.
We conducted our audits of these consolidated financial statements in accordance with the standards of the PCAOB. Those standards require that we plan and perform the audit to obtain reasonable assurance about whether the consolidated financial statements are free of material misstatement, whether due to error or fraud.
Our audits included performing procedures to assess the risks of material misstatement of the consolidated financial statements, whether due to error or fraud, and performing procedures that respond to those risks. Such procedures included examining, on a test basis, evidence regarding the amounts and disclosures in the consolidated financial statements. Our audits also included evaluating the accounting principles used and significant estimates made by management, as well as evaluating the overall presentation of the consolidated financial statements. We believe that our audits provide a reasonable basis for our opinion.
/s/ PricewaterhouseCoopers LLP
Philadelphia, Pennsylvania
March 2, 2020
We have served as the Company's auditor since 2016.
79
CLARIVATE ANALYTICS PLC
(In thousands, except share data)
| As of December 31, | ||||||||
| 2019 | 2018 | |||||||
| Assets | ||||||||
| Current assets: | ||||||||
| Cash and cash equivalents | $ | 76,130 | $ | 25,575 | ||||
| Restricted cash | 9 | 9 | ||||||
| Accounts receivable, net of allowance for doubtful accounts of $16,511 and $14,076 at December 31, 2019 and December 31, 2018, respectively | 333,858 | 331,295 | ||||||
| Prepaid expenses | 40,710 | 31,021 | ||||||
| Other current assets | 11,750 | 20,712 | ||||||
| Assets held for sale | 30,619 | — | ||||||
| Total current assets | 493,076 | 408,612 | ||||||
| Computer hardware and other property, net | 18,042 | 20,641 | ||||||
| Other intangible assets, net | 1,828,640 | 1,958,520 | ||||||
| Goodwill | 1,328,045 | 1,282,919 | ||||||
| Other non-current assets | 18,632 | 26,556 | ||||||
| Deferred income taxes | 19,488 | 12,426 | ||||||
| Operating lease right-of-use assets | 85,448 | — | ||||||
| Total Assets | $ | 3,791,371 | $ | 3,709,674 | ||||
| Liabilities and Shareholders’ Equity | ||||||||
| Current liabilities: | ||||||||
| Accounts payable | $ | 26,458 | $ | 38,418 | ||||
| Accrued expenses and other current liabilities | 159,217 | 153,849 | ||||||
| Current portion of deferred revenues | 407,325 | 391,102 | ||||||
| Current portion of operating lease liability | 22,130 | — | ||||||
| Current portion of long-term debt | 9,000 | 60,345 | ||||||
| Liabilities held for sale | 26,868 | — | ||||||
| Total current liabilities | 650,998 | 643,714 | ||||||
| Long-term debt | 1,628,611 | 1,930,177 | ||||||
| Non-current portion of deferred revenues | 19,723 | 17,112 | ||||||
| Other non-current liabilities | 18,891 | 24,838 | ||||||
| Deferred income taxes | 48,547 | 43,226 | ||||||
| Operating lease liabilities | 64,189 | — | ||||||
| Total liabilities | 2,430,959 | 2,659,067 | ||||||
| Commitments and contingencies | ||||||||
| Shareholders’ equity: | ||||||||
| Ordinary Shares, no par value; unlimited shares authorized at December 31, 2019 and December 31, 2018; 306,874,115 and 217,526,425 shares issued and outstanding at December 31, 2019 and December 31, 2018, respectively; | 2,208,529 | 1,677,510 | ||||||
| Accumulated other comprehensive income (loss) | (4,879 | ) | 5,358 | |||||
| Accumulated deficit | (843,238 | ) | (632,261 | ) | ||||
| Total shareholders’ equity | 1,360,412 | 1,050,607 | ||||||
| Total Liabilities and Shareholders’ Equity | $ | 3,791,371 | $ | 3,709,674 | ||||
The accompanying notes are an integral part of these financial statements.
80
CLARIVATE ANALYTICS PLC
Consolidated Statement of Operations
(In thousands, except share and per share data)
| Year ended December 31, | ||||||||||||
| 2019 | 2018 | 2017 | ||||||||||
| Revenues, net | $ | 974,345 | $ | 968,468 | $ | 917,634 | ||||||
| Operating costs and expenses: | ||||||||||||
| Cost of revenues, excluding depreciation and amortization | (346,503 | ) | (396,499 | ) | (394,215 | ) | ||||||
| Selling, general and administrative costs, excluding depreciation and amortization | (368,675 | ) | (369,377 | ) | (343,143 | ) | ||||||
| Share-based compensation expense | (51,383 | ) | (13,715 | ) | (17,663 | ) | ||||||
| Depreciation | (9,181 | ) | (9,422 | ) | (6,997 | ) | ||||||
| Amortization | (191,361 | ) | (227,803 | ) | (221,466 | ) | ||||||
| Impairment on assets held for sale | (18,431 | ) | — | — | ||||||||
| Transaction expenses | (46,214 | ) | (2,457 | ) | (2,245 | ) | ||||||
| Transition, integration and other related expenses | (14,239 | ) | (61,282 | ) | (78,695 | ) | ||||||
| Restructuring | (15,670 | ) | — | — | ||||||||
| Legal settlement | 39,399 | — | — | |||||||||
| Other operating income (expense), net | 4,826 | 6,379 | (237 | ) | ||||||||
| Total operating expenses | (1,017,432 | ) | (1,074,176 | ) | (1,064,661 | ) | ||||||
| Loss from operations | (43,087 | ) | (105,708 | ) | (147,027 | ) | ||||||
| Interest expense, net | (157,689 | ) | (130,805 | ) | (138,196 | ) | ||||||
| Loss before income tax | (200,776 | ) | (236,513 | ) | (285,223 | ) | ||||||
| Benefit (provision) for income taxes | (10,201 | ) | (5,649 | ) | 21,293 | |||||||
| Net loss | $ | (210,977 | ) | $ | (242,162 | ) | $ | (263,930 | ) | |||
| Per share: | ||||||||||||
| Basic and diluted | $ | (0.77 | ) | $ | (1.11 | ) | $ | (1.22 | ) | |||
| Weighted average shares used to compute earnings per share: | ||||||||||||
| Basic and diluted | 273,883,342 | 217,472,870 | 216,848,866 | |||||||||
The accompanying notes are an integral part of these financial statements.
81
CLARIVATE ANALYTICS PLC
Consolidated Statements of Comprehensive Income (Loss)
(In thousands)
| Year ended December 31, | ||||||||||||
| 2019 | 2018 | 2017 | ||||||||||
| Net loss | $ | (210,977 | ) | $ | (242,162 | ) | (263,930 | ) | ||||
| Other comprehensive income (loss), net of tax: | ||||||||||||
| Interest rate swaps, net of $0 tax in all periods | (6,422 | ) | 2,537 | 1,107 | ||||||||
| Defined benefit pension plans, net of tax (benefit) provision of $683, ($91), and $430, respectively | (1,041 | ) | (17 | ) | 881 | |||||||
| Foreign currency translation adjustment | (2,774 | ) | (11,146 | ) | 15,466 | |||||||
| Total other comprehensive income (loss) | (10,237 | ) | (8,626 | ) | 17,454 | |||||||
| Comprehensive loss | $ | (221,214 | ) | $ | (250,788 | ) | (246,476 | ) | ||||
The accompanying notes are an integral part of these financial statements.
82
CLARIVATE ANALYTICS PLC
Consolidated Statements of Changes in Equity
(In thousands, except share data)
| Share Capital | Accumulated Other Comprehensive | Accumulated | Total Shareholders’ | |||||||||||||||||
| Shares | Amount | Income (Loss) | Deficit | Equity | ||||||||||||||||
| Balance at December 31, 2016 as originally reported | 1,635,000 | $ | 1,635,000 | $ | (3,470 | ) | $ | (126,169 | ) | $ | 1,505,361 | |||||||||
| Conversion of units of share capital | 214,408,455 | — | — | — | — | |||||||||||||||
| Balance at December 31, 2016, as recasted | 216,043,455 | 1,635,000 | (3,470 | ) | (126,169 | ) | 1,505,361 | |||||||||||||
| Issuance of common stock, net | 1,284,368 | 9,558 | — | — | 9,558 | |||||||||||||||
| Share-based compensation | — | 17,663 | — | — | 17,663 | |||||||||||||||
| Net loss | — | — | — | (263,930 | ) | (263,930 | ) | |||||||||||||
| Comprehensive income | — | 17,454 | — | 17,454 | ||||||||||||||||
| Balance at December 31, 2017 | 217,327,823 | $ | 1,662,221 | $ | 13,984 | $ | (390,099 | ) | $ | 1,286,106 | ||||||||||
| Balance at December 31, 2017, as originally reported | 1,644,720 | $ | 1,662,221 | $ | 13,984 | $ | (390,099 | ) | $ | 1,286,106 | ||||||||||
| Conversion of units of share capital | 215,683,103 | — | — | — | — | |||||||||||||||
| Balance at December 31, 2017, as recasted | 217,327,823 | 1,662,221 | 13,984 | (390,099 | ) | 1,286,106 | ||||||||||||||
| Issuance of common stock, net | 198,602 | 1,574 | — | — | 1,574 | |||||||||||||||
| Share-based compensation | — | 13,715 | — | — | 13,715 | |||||||||||||||
| Net loss | — | — | — | (242,162 | ) | (242,162 | ) | |||||||||||||
| Comprehensive (loss) | — | — | (8,626 | ) | — | (8,626 | ) | |||||||||||||
| Balance at December 31, 2018 | 217,526,425 | $ | 1,677,510 | $ | 5,358 | $ | (632,261 | ) | $ | 1,050,607 | ||||||||||
| Balance at December 31, 2018, as originally reported | 1,646,223 | $ | 1,677,510 | $ | 5,358 | $ | (632,261 | ) | $ | 1,050,607 | ||||||||||
| Conversion of units of share capital | 215,880,202 | — | — | — | — | |||||||||||||||
| Balance at December 31, 2018, as recasted | 217,526,425 | 1,677,510 | 5,358 | (632,261 | ) | 1,050,607 | ||||||||||||||
| Tax Receivable Agreement | — | (264,000 | ) | — | — | (264,000 | ) | |||||||||||||
| Settlement of Tax Receivable Agreement | — | 64,000 | — | — | 64,000 | |||||||||||||||
| Issuance of common stock, net | 1,597,691 | 1,582 | — | — | 1,582 | |||||||||||||||
| Merger recapitalization | 87,749,999 | 678,054 | — | — | 678,054 | |||||||||||||||
| Share-based compensation | — | 51,383 | — | — | 51,383 | |||||||||||||||
| Net loss | — | — | — | (210,977 | ) | (210,977 | ) | |||||||||||||
| Comprehensive (loss) | — | — | (10,237 | ) | — | (10,237 | ) | |||||||||||||
| Balance at December 31, 2019 | 306,874,115 | $ | 2,208,529 | $ | (4,879 | ) | $ | (843,238 | ) | $ | 1,360,412 | |||||||||
The accompanying notes are an integral part of these financial statements.
83
CLARIVATE ANALYTICS PLC
Consolidated Statements of Cash Flows
(In thousands)
| Year ended December 31, | ||||||||||||
| 2019 | 2018 | 2017 | ||||||||||
| Cash Flows From Operating Activities | ||||||||||||
| Net loss | $ | (210,977 | ) | $ | (242,162 | ) | $ | (263,930 | ) | |||
| Adjustments to reconcile net loss to net cash provided by operating activities: | ||||||||||||
| Depreciation and amortization | 200,542 | 237,225 | 228,463 | |||||||||
| Bad debt expense | 1,331 | 6,507 | 6,505 | |||||||||
| Deferred income tax benefit | 357 | (14,103 | ) | (36,272 | ) | |||||||
| Share-based compensation | 51,383 | 13,715 | 17,663 | |||||||||
| Loss on extinguishment of debt | 50,676 | — | — | |||||||||
| Gain on sale of line of business | — | (39,104 | ) | — | ||||||||
| Impairment on assets held for sale | 18,431 | — | — | |||||||||
| Deferred finance charges | 2,496 | 9,182 | 23,510 | |||||||||
| Tax indemnity write-off | — | 33,819 | — | |||||||||
| Other operating activities | (374 | ) | (3,979 | ) | 2,548 | |||||||
| Changes in operating assets and liabilities: | ||||||||||||
| Accounts receivable | (593 | ) | (50,906 | ) | 43,109 | |||||||
| Prepaid expenses | (10,224 | ) | (2,936 | ) | (4,052 | ) | ||||||
| Other assets | (975 | ) | 578 | 10,799 | ||||||||
| Accounts payable | (13,838 | ) | (18,091 | ) | (39,660 | ) | ||||||
| Accrued expenses and other current liabilities | 1,095 | 9,842 | (6,038 | ) | ||||||||
| Deferred revenues | 33,480 | 33,539 | 18,751 | |||||||||
| Operating lease right of use assets | 11,365 | — | — | |||||||||
| Operating lease liabilities | (11,251 | ) | — | — | ||||||||
| Other liabilities | (5,344 | ) | 774 | 5,271 | ||||||||
| Net cash (used in) provided by operating activities | 117,580 | (26,100 | ) | 6,667 | ||||||||
| Cash Flows From Investing Activities | ||||||||||||
| Capital expenditures | (69,836 | ) | (45,410 | ) | (37,804 | ) | ||||||
| Acquisitions, net of cash acquired | (68,424 | ) | (23,539 | ) | (7,401 | ) | ||||||
| Acquisition of intangibles | (2,625 | ) | — | — | ||||||||
| Proceeds from sale of product line, net of restricted cash | — | 80,883 | 5,000 | |||||||||
| Net cash (used in) provided by investing activities | (140,885 | ) | 11,934 | (40,205 | ) | |||||||
| Cash Flows From Financing Activities | ||||||||||||
| Proceeds from revolving credit facility | 70,000 | 45,000 | 30,000 | |||||||||
| Principal payments on term loan | (641,509 | ) | (46,709 | ) | (15,423 | ) | ||||||
| Repayments of revolving credit facility | (50,000 | ) | (30,000 | ) | — | |||||||
| Payment of debt issuance costs | (41,923 | ) | — | (817 | ) | |||||||
| Contingent purchase price payment | (2,371 | ) | (2,470 | ) | — | |||||||
| Proceeds from reverse recapitalization | 682,087 | — | — | |||||||||
| Proceeds from issuance of debt | 1,600,000 | — | — | |||||||||
| Extinguishment of debt | (1,342,651 | ) | — | — | ||||||||
| Tax receivable agreement payout | (200,000 | ) | — | — | ||||||||
| Proceeds from the exercise of warrants and employee share options | 1,582 | 1,574 | 9,058 | |||||||||
| Net cash (used in) provided by financing activities | 75,215 | (32,605 | ) | 22,818 | ||||||||
| Effects of exchange rates | (971 | ) | (5,193 | ) | 3,248 | |||||||
| Net increase (decrease) in cash and cash equivalents, and restricted cash | 50,939 | (51,964 | ) | (7,472 | ) | |||||||
| Beginning of period: | ||||||||||||
| Cash and cash equivalents | 25,575 | 53,186 | 77,136 | |||||||||
| Restricted cash | 9 | 24,362 | 7,884 | |||||||||
| Total cash and cash equivalents, and restricted cash, beginning of period | 25,584 | 77,548 | 85,020 | |||||||||
| Less: Cash included in assets held for sale, end of period | (384 | ) | — | — | ||||||||
| Cash and cash equivalents, and restricted cash, end of period | 76,139 | 25,584 | 77,548 | |||||||||
| End of period: | ||||||||||||
| Cash and cash equivalents | 76,130 | 25,575 | 53,186 | |||||||||
| Restricted cash | 9 | 9 | 24,362 | |||||||||
| Total cash and cash equivalents, and restricted cash, end of period | $ | 76,139 | $ | 25,584 | $ | 77,548 | ||||||
| Supplemental Cash Flow Information | ||||||||||||
| Cash paid for interest | $ | 101,164 | $ | 121,916 | $ | 115,236 | ||||||
| Cash paid for income tax | $ | 29,204 | $ | 13,210 | $ | 14,722 | ||||||
| Capital expenditures included in accounts payable | $ | 8,762 | $ | 5,166 | $ | 2,473 | ||||||
| Assets received as reverse recapitalization capital | $ | 1,877 | $ | — | $ | — | ||||||
| Liabilities assumed as reduction of reverse recapitalization capital | $ | 5,910 | $ | — | $ | — | ||||||
The accompanying notes are an integral part of these financial statements.
84
CLARIVATE ANALYTICS PLC
Notes to the Consolidated Financial Statements
(In thousands, except share and per share data, option prices, ratios or as noted)
Note 1: Background and Nature of Operations
Clarivate Analytics Plc (“Clarivate,” “us,” “we,” “our,” or the “Company”), a public limited company organized under the laws of Jersey, Channel Islands, was incorporated as a Jersey limited company on January 7, 2019. Pursuant to the definitive agreement entered into to effect a merger between Camelot Holdings (Jersey) Limited (“Jersey”) and Churchill Capital Corp, a Delaware corporation, (“Churchill”) (the “2019 Transaction”), the Company was formed for the purposes of completing the 2019 Transaction and related transitions and carrying on the business of Jersey, and its subsidiaries.
The Company is a provider of proprietary and comprehensive content, analytics, professional services and workflow solutions that enables users across government and academic institutions, life science companies and research and development (“R&D”) intensive corporations to discover, protect and commercialize their innovations. Our Science Product Group consists of our Web of Science and Life Science Product Lines. Both Product Lines provide curated, high-value, structured information that is delivered and embedded into the workflows of our customers, which include research intensive corporations, life science organizations and universities world-wide. Our Intellectual Property (“IP”) Product Group consists of our Derwent, CompuMark and MarkMonitor Product Lines. These Product Lines help manage customer’s end-to-end portfolio of intellectual property from patents to trademarks to corporate website domains.
In January 2019, we entered into an Agreement and Plan of Merger (as amended by Amendment No. 1 to the Agreement and Plan of Merger, dated February 26, 2019, and Amendment No. 2 to the Agreement and Plan of Merger, dated March 29, 2019, collectively, the “Merger Agreement”) by and among Churchill, Jersey, CCC Merger Sub, Inc., a Delaware corporation and wholly owned subsidiary of Clarivate (“Delaware Merger Sub”), Camelot Merger Sub (Jersey) Limited, a private limited company organized under the laws of Jersey, Channel Islands and wholly owned subsidiary of Clarivate (“Jersey Merger Sub”), and the Company, which, among other things, provided for (i) Jersey Merger Sub to be merged with and into Jersey with the Jersey being the surviving company in the merger (the “Jersey Merger”) and (ii) Delaware Merger Sub to be merged with and into Churchill with Churchill being the surviving corporation in the merger (the “Delaware Merger”), and together with the Jersey Merger, the “Mergers”.
On May 13, 2019, the 2019 Transaction was consummated, and Clarivate became the sole managing member of Jersey, operating and controlling all of the business and affairs of Jersey, through Jersey and its subsidiaries. Following the consummation of the 2019 Transaction on May 13, 2019, the Company’s ordinary shares and warrants began trading on the New York Stock Exchange. See Note 4 – "Business Combinations" for more information.
The 2019 Transaction was accounted for as a reverse recapitalization in accordance with accounting principles generally accepted in the United States of America ("U.S. GAAP"). Under this method of accounting Churchill was treated as the "acquired" company for financial reporting purposes. This determination was primarily based on post 2019 Transaction relative voting rights, composition of the governing board, size of the two entities pre-merger, and intent of the 2019 Transaction. Accordingly, for accounting purposes, the 2019 Transaction was treated as the equivalent of the Company issuing stock for the net assets of Churchill. The net assets of Churchill, were stated at historical cost, with no goodwill or other intangible assets resulting from the 2019 Transaction. Reported amounts from operations included herein prior to the 2019 Transaction are those of Jersey.
On September 10, 2019 and December 9, 2019 the Company issued a public offering of 39,675,000 and 49,680,000 ordinary shares, respectively, (the “Secondary Offerings”) by affiliated funds of Onex Corporation and Baring Private Equity Asia Limited (“BPEA”), together with certain other shareholders, at $16.00 and $17.25, respectively, per share. The Company did not receive any of the proceeds from the sale of its ordinary shares by the selling shareholders.
Jersey was formed on August 4, 2016 as a private limited liability company organized under the laws of the Island of Jersey. Its registered office is located at 4th Floor, St Paul’s Gate, 22-24 New Street, St Helier, Jersey JE1 4TR.
85
CLARIVATE ANALYTICS PLC
Notes to the Consolidated Financial Statements
(In thousands, except share and per share data, option prices, ratios or as noted)
On July 10, 2016, Camelot UK Bidco Limited, a private limited liability company incorporated under the laws of England and Wales, and a direct wholly owned subsidiary of Camelot UK Holdco Limited, a direct wholly owned subsidiary (“UK Holdco”), collectively referred to as (“Bidco”), entered into a separation agreement to acquire (i) certain assets and liabilities related to the Intellectual Property & Science business (“IP&S”) business from our Thomson Reuters Corporation ("Former Parent") and (ii) all of the equity interests and substantially all of the assets and liabilities of certain entities engaged in the IP&S business together with their subsidiaries (“2016 Transaction”). The 2016 Transaction total consideration was $3,566,599, net of cash acquired. Jersey is owned by affiliates of Onex Corporation and private investment funds managed by BPEA and certain co-investors.
Note 2: Basis of Presentation
The accompanying Consolidated Financial Statements for the years ended December 31, 2019, 2018 and 2017, respectively, were prepared in conformity with U.S. GAAP. The Consolidated Financial Statements of the Company include the accounts of all of its subsidiaries. Subsidiaries are entities over which the Company has control, where control is defined as the power to govern financial and operating policies. Generally, the Company has a shareholding of more than 50% of the voting rights in its subsidiaries. The effect of potential voting rights that are currently exercisable are considered when assessing whether control exists. Subsidiaries are fully consolidated from the date control is transferred to the Company, and are de-consolidated from the date control ceases. The U.S. dollar is the Company’s reporting currency. As such, the financial statements are reported on a U.S. dollar basis.
Note 3: Summary of Significant Accounting Policies
Business Combinations
The Company determines whether substantially all the fair value of the gross assets acquired is concentrated in a single identifiable asset or group of similar identifiable assets. If this threshold is met, the set is not a business. If it is not met, the Company then evaluates whether the set meets the requirement that a business include, at a minimum, an input and as substantive process that together significantly contribute to the ability to create outputs.
Business combinations are accounted for using the acquisition method at the acquisition date, which is when control is obtained. The consideration transferred is generally measured at fair value, as are the identifiable assets acquired and liabilities assumed. During the one-year period following the acquisition date, if an adjustment is identified based on new information about facts and circumstances that existed as of the acquisition date, the Company will record measurement-period adjustments related to the acquisitions in the period in which the adjustment is identified.
Goodwill is measured at the acquisition date as the fair value of the consideration transferred (including, if applicable, the fair value of any previously held equity interest and any non-controlling interests) less the net recognized amount (which is generally the fair value) of the identifiable assets acquired and liabilities assumed.
Transaction costs, other than those associated with the issuance of debt or equity securities incurred in connection with a business combination, are expensed as incurred and included in Transaction expenses in the Consolidated Statements of Operations.
Principles of Consolidation
The accompanying Consolidated Financial Statements include the accounts and operations of the Company, and its subsidiaries. Intercompany accounts and transactions have been eliminated in consolidation.
86
CLARIVATE ANALYTICS PLC
Notes to the Consolidated Financial Statements
(In thousands, except share and per share data, option prices, ratios or as noted)
Use of Estimates
The preparation of financial statements in conformity with U.S. GAAP requires management to make estimates and assumptions that affect the reported amounts in the Consolidated Financial Statements and accompanying notes. Actual results could differ from those estimates. The most important of these relate to share-based compensation expenses, revenue recognition, the allowance for doubtful accounts, internally developed computer software, valuation of goodwill and other identifiable intangible assets, determination of the projected benefit obligations of the defined benefit plans, income taxes, fair value of stock options, derivatives and financial instruments, contingent earn-out, and the tax related valuation allowances. On an ongoing basis, management evaluates these estimates, assumptions and judgments, in reference to historical experience and other factors, including expectations of future events that are believed to be reasonable under the circumstances.
Cash and Cash Equivalents
Cash and cash equivalents is comprised of cash on hand and short-term deposits with an original maturity at the date of purchase of three months or less.
Restricted Cash
As of December 31, 2019 and 2018, the Company held $9 of restricted cash primarily related to funds from the Company’s Publons transaction.
Accounts Receivable
Accounts receivable are presented net of the allowance for doubtful accounts and any discounts. Accounts receivable are recorded at the invoiced amount and do not bear interest. Collections of accounts receivable are included in cash provided by operating activities in the Consolidated Statements of Cash Flows. The Company maintains an allowance for doubtful accounts for estimated losses and assesses its adequacy each reporting period by evaluating factors such as the length of time receivables are past due, historical collection experience, and the economic and competitive environment. The expense related to doubtful accounts is included within Selling, general and administrative costs, excluding depreciation and amortization in the Consolidated Statements of Operations. Account balances are written off against the allowance when the potential for recovery is considered remote. The Company does not have any off-balance-sheet credit exposure related to its customers.
Concentration of Credit Risk
Accounts receivable are the primary financial instrument that potentially subjects the Company to significant concentrations of credit risk. Accounts receivable represents arrangements in which services were transferred to a customer before the customer pays consideration or before payment is due. Contracts with payment in arrears are recognized as receivables after the Company considers whether a significant financing component exists. The Company does not require collateral or other securities to support customer receivables. Management performs ongoing credit evaluations of its customers’ financial condition and limits the amount of credit extended when deemed appropriate. Credit losses have been immaterial and reasonable within management’s expectations. No single customer accounted for more than 1% of revenues and our ten largest customers represented only 5% of revenues for the year ended December 31, 2019.
The Company maintains its cash and cash equivalent balances with high-quality financial institutions and consequently, the Company believes that such funds are subject to minimal credit risk.
Prepaid Expenses
Prepaid expenses represent amounts that the Company has paid in advance of receiving benefits or services. Prepaid expenses include amounts for system and service contracts, sales commissions, deposits, prepaid royalties and insurance and are recognized as an expense over the general contractual period that the Company expects to benefit from the underlying asset or service.
87
CLARIVATE ANALYTICS PLC
Notes to the Consolidated Financial Statements
(In thousands, except share and per share data, option prices, ratios or as noted)
Computer Hardware and Other Property, net
Generally, computer hardware and other property are recorded at cost and are depreciated over the respective estimated useful lives. Upon the 2016 Transaction, computer hardware and other property were revalued and recorded at net book value, which approximated fair value at the 2016 Transaction.
Depreciation is computed using the straight-line method. Repair and maintenance costs are expensed as incurred. The cost and related accumulated depreciation of sold or retired assets are removed from the accounts and any gain or loss is included within Loss from operations in the Consolidated Statements of Operations.
The estimated useful lives are as follows:
| Computer hardware | 3 years |
| Furniture, fixtures and equipment | 5-7 years |
| Leasehold improvements | Lesser of lease term or estimated useful life |
Computer Software
Development costs related to internally generated software are capitalized once a project has progressed beyond a conceptual, preliminary stage to that of the application development stage. Costs of significant improvements on existing software for internal use, both internally developed and purchased, are also capitalized. Costs related to the preliminary project stage, data conversion and post-implementation/operation stage of an internal use software development project are expensed as incurred.
Capitalized costs are amortized over five years, which is the estimated useful life of the related software. Purchased software is amortized over three years, which is the estimated useful life of the related software. The capitalized amounts, net of accumulated amortization, are included in Other intangible assets, net in the Consolidated Balance Sheets. The cost and related accumulated amortization of sold or retired assets are removed from the accounts and any gain or loss is included within Loss from operations in the Consolidated Statements of Operations.
Computer software is evaluated for impairment whenever circumstances indicate the carrying amount may not be recoverable. The test for impairment compares the carrying amounts with the sum of undiscounted cash flows related to the asset. If the carrying value is greater than the undiscounted cash flows of the asset, the asset is written down to its estimated fair value.
Identifiable Intangible Assets, net
Upon acquisition, identifiable intangible assets are recorded at fair value and are carried at cost less accumulated amortization or accumulated impairment for indefinite-lived intangible assets. Useful lives are reviewed at the end of each reporting period and adjusted if appropriate. Fully amortized assets are retained at cost and accumulated amortization accounts until such assets are derecognized.
Customer Relationships — Customer relationships primarily consist of customer contracts and customer relationships arising from such contracts.
Databases and Content — Databases and content primarily consists of repositories of the Company’s specific financial and customer information and intellectual content.
Trade Names — Trade names consist of purchased brand names that the Company continues to use.
88
CLARIVATE ANALYTICS PLC
Notes to the Consolidated Financial Statements
(In thousands, except share and per share data, option prices, ratios or as noted)
Where applicable, intangible assets are amortized on a straight-line basis over their estimated useful lives as follows:
| Customer relationships | 2 – 14 years |
| Databases and content | 13 – 20 years |
| Finite-lived trade names | 18 years |
| Indefinite-lived trade names | Indefinite |
Impairment of Long-Lived Assets
Residual values and useful lives are reviewed at the end of each reporting period and adjusted if appropriate. The Company evaluates its long-lived assets, including computer hardware and other property, computer software, and finite-lived intangible assets for impairment whenever circumstances indicate that their carrying amounts may not be recoverable. Recoverability of these assets is measured by comparison of the carrying amount of each asset to the future undiscounted cash flows the asset is expected to generate over its remaining life. An asset is assessed for impairment at the lowest level that the asset generates cash inflows that are largely independent of cash inflows from other assets. If the asset is considered to be impaired, the amount of any impairment is measured as the difference between the carrying value and the fair value of the impaired asset.
Management identified an impairment loss in connection with the divestiture of certain assets and liabilities of its MarkMonitor Product Line within its IP Group in the year ended December 31, 2019. Management determined that additional impairment did not exist for any of the periods presented.
Goodwill and Indefinite-Lived Intangible Assets
The Company evaluates its goodwill for impairment at the reporting unit level, defined as an operating segment or one level below an operating segment, annually as of October 1 or more frequently if impairment indicators arise in accordance with Accounting Standards Codification ("ASC") Topic 350. The Company identified five reporting units due to a change in the Company’s reporting structure for the years ended December 31, 2019 and 2018 and one reporting unit for the year ended December 31, 2017.
The Company evaluates the recoverability of goodwill at the reporting unit level. The Company assesses various qualitative factors to determine whether the fair value of a reporting unit may be less than its carrying amount. If a determination is made that, based on the qualitative factors, an impairment does not exist, the Company is not required to perform further testing. If the aforementioned qualitative assessment results in the Company concluding that it is more likely than not that the fair value of a reporting unit may be less than its carrying amount, the fair value of the reporting unit will be determined and compared to its carrying value including goodwill.
In determining the fair value of a reporting unit, the Company estimates the fair value of a reporting unit using the fair value derived from the income approach. The market approach estimates fair value based on market multiples of revenue and earnings derived from comparable publicly traded companies with similar operating and investment characteristics as the reporting unit; whereas, the income approach uses a discounted cash flow (“DCF”) model. The DCF model determines the fair value of our reporting units based on projected future discounted cash flows, which in turn were based on our views of uncertain variables such as growth rates, anticipated future economic conditions, and the appropriate discount rates relative to risk and estimates of residual values.
If the fair value of the reporting unit exceeds the carrying value of the net assets assigned to that unit, goodwill is not impaired, and the Company is not required to perform further testing. If the fair value of the reporting unit is less than the carrying value, the Company will recognize the difference as an impairment charge. Management concluded that no goodwill impairment existed for any of the periods presented.
89
CLARIVATE ANALYTICS PLC
Notes to the Consolidated Financial Statements
(In thousands, except share and per share data, option prices, ratios or as noted)
The Company also has indefinite-lived intangible assets related to trade names. Indefinite-lived intangible assets are subject to impairment testing annually or whenever events or changes in circumstances indicate that their carrying value may not be recoverable. For purposes of impairment testing, the fair value of trade names is determined using an income approach, specifically the relief from royalties method. Management concluded that no indefinite-lived intangible impairment existed for any of the periods presented.
Other Current and Non-Current Assets and Liabilities
The Company defines current assets and liabilities as those from which it will benefit from or which it has an obligation for within one year that do not otherwise classify as assets or liabilities separately reported on the Consolidated Balance Sheets. Other non-current assets and liabilities are expected to benefit the Company or cause its obligation beyond one year. The Company classifies the current portion of long-term assets and liabilities as current assets or liabilities.
Leases
We determine if an arrangement is a lease at inception. Operating leases are included in Operating lease right-of-use (“ROU”) assets, Current portion of operating lease liability, and Operating lease liabilities on our Consolidated Balance Sheets.
Operating lease ROU assets and operating lease liabilities are recognized based on the present value of the future minimum lease payments over the lease term at commencement date. As most of our leases do not provide an implicit rate, we use our incremental borrowing rate based on the information available at commencement date in determining the present value of future payments. The operating lease ROU asset also includes any lease payments made and excludes lease incentives and initial direct costs incurred. Our lease terms may include options to extend or terminate the lease when it is reasonably certain that we will exercise that option. Lease expense for minimum lease payments is recognized on a straight-line basis over the lease term.
We have lease agreements with lease and non-lease components, which are accounted as a single lease component. Additionally, for certain equipment leases, we apply a portfolio approach to effectively account for the operating lease ROU assets and liabilities.
Accounts Payable and Accruals
Accounts payable and accruals are obligations to pay for goods or services that have been acquired in the ordinary course of business. Accounts payable and accruals are recognized initially at their settlement value, and are classified as current liabilities if payment is due within one year or less.
Debt
Debt is recognized initially at par value, net of any applicable discounts or financing costs. Debt is subsequently stated at amortized cost with any difference between the proceeds (net of transactions costs) and the redemption value recognized in the Consolidated Statements of Operations over the term of the debt using the effective interest method. Interest on indebtedness is expensed as incurred.
Debt is classified as a current liability when due within 12 months after the end of the reporting period.
90
CLARIVATE ANALYTICS PLC
Notes to the Consolidated Financial Statements
(In thousands, except share and per share data, option prices, ratios or as noted)
Tax Receivable Agreement (“TRA”)
Concurrent with the completion of the 2019 Transaction, in May 2019 we became a party to a TRA with our pre-business combination equity holders. Under the TRA, we are generally required to pay to certain pre-business combination equity holders approximately 85% of the amount of calculated tax savings, if any, we are deemed to realize (using the actual applicable U.S. federal income tax rate and an assumed combined state and local income tax rate) as a result of (1) any existing tax attributes associated with Covered Tax Assets acquired in the pre-business combination organizational transactions, the benefit of which is allocable to us as a result of such transactions, (2) net operating loss (NOL) carryforwards available as a result of such transactions and (3) tax benefits related to imputed interest. Further, there may be significant changes, to the estimate of the TRA liability due to various reasons including changes in corporate tax law, changes in estimates of the amount or timing of future taxable income, and other items. Changes in those estimates are recognized as adjustments to the related TRA liability, with offsetting impacts recorded in the Consolidated Statements of Operations as Other operating income (expense), net. On August 21, 2019 the Company entered into a TRA Buyout Agreement to settle the outstanding liability. The settlement of the original TRA liability pursuant to the TRA Buyout Agreement was accounted for as an adjustment to Shareholders' equity.
Derivative Financial Instruments
Foreign Exchange Derivative Contracts
Prior to the sale of IPM, the Company used derivative financial instruments to manage foreign currency exchange rate risk in IPM. The Company’s derivative financial instruments consist of foreign currency forward contracts (“forward contracts”). Derivative financial instruments were neither held nor issued by the Company for trading purposes.
Interest Rate Swaps
The Company has interest rate swaps with counterparties to reduce its exposure to variability in cash flows relating to interest payments on a portion of its outstanding first lien senior secured term loan facility in an aggregate principal amount of $900,000 (“Term Loan Facility”). The Company applies hedge accounting and has designated these instruments as cash flow hedges of the risk associated with floating interest rates on designated future quarterly interest payments. Management assumes the hedge is highly effective and therefore changes in the value of the hedging instrument are recorded in Accumulated other comprehensive income (loss) in the Consolidated Balance Sheets. Any ineffectiveness is recorded in earnings. Amounts in Accumulated other comprehensive income (loss) are reclassified into earnings in the same period during which the hedged transactions affect earnings, or upon termination of the hedging relationship.
Fair Value of Financial Instruments
In determining fair value, the use of various valuation methodologies, including market, income and cost approaches is permissible. The Company considers the principal or most advantageous market in which it would transact and considers assumptions that market participants would use when pricing the asset or liability. The accounting guidance for fair value measurements establishes a fair value hierarchy that requires an entity to maximize the use of observable inputs and minimize the use of unobservable inputs when measuring fair value. There are three levels of inputs that may be used to measure fair value based on the reliability of inputs. A financial instrument’s categorization within the fair value hierarchy is based upon the lowest level of input that is significant to the fair value measurement. The Company’s interest rate swap derivative instruments are classified as Level 2. Earn-out liabilities and defined benefit plan assets are classified as Level 3.
Contingent Considerations
The Company records liabilities for the estimated cost of such contingencies when expenditures are probable and reasonably estimable. A significant amount of judgment is required to estimate and quantify the potential liability in these matters. We engage outside experts as deemed necessary or appropriate to assist in the calculation of the liability, however management is responsible for evaluating the estimate. As information becomes available regarding changes in circumstances for ongoing contingent considerations, our potential liability is reassessed and adjusted as necessary. See Note 22 — “Commitments and Contingencies” for further information on contingencies.
91
CLARIVATE ANALYTICS PLC
Notes to the Consolidated Financial Statements
(In thousands, except share and per share data, option prices, ratios or as noted)
Pension and Other Post-Retirement Benefits
The Company may be required to sponsor pension benefit plans, for certain international markets, which are unfunded and are not material for the Company. The net periodic pension expense is actuarially determined on an annual basis by independent actuaries using the projected unit credit method. The determination of benefit expense requires assumptions such as the discount rate, which is used to measure service cost, benefit plan obligations and the interest expense on the plan obligations. Other significant assumptions include expected mortality, the expected rate of increase with respect to future compensation and pension. Because the determination of the cost and obligations associated with employee future benefits requires the use of various assumptions, there is measurement uncertainty inherent in the actuarial valuation process. Actual results will differ from results which are estimated based on assumptions.
The liability recognized in the Consolidated Balance Sheets is the present value of the defined benefit obligation at the end of the reporting period. The present value of the defined benefit obligation is determined by discounting the estimated future cash outflows using interest rates of high-quality corporate bonds that are denominated in the currency in which the benefits will be paid and that have terms to maturity approximating the terms of the related pension liability. The defined benefit obligation is included in Other non-current liabilities in the Consolidated Balance Sheets. All actuarial gains and losses that arise in calculating the present value of the defined benefit obligation are recognized immediately in Accumulated deficit and included in the Consolidated Statements of Comprehensive Income (Loss). See Note 13 — “Pension and Other Post Retirement Benefits” for balances and further details including an estimate of the impact on the Consolidated Financial Statements from changes in the most critical assumptions.
Employer contributions to defined contribution plans are expensed as incurred, which is as the related employee service is rendered.
Taxation
The Company recognizes income taxes under the asset and liability method. Our income tax expense, deferred tax assets and liabilities, and reserves for unrecognized tax benefits reflect our best assessment of estimated current and future taxes to be paid. Significant judgments and estimates are required in determining the consolidated Income tax expense for financial statement purposes. Deferred income taxes arise from temporary differences between the tax basis of assets and liabilities and their reported amounts in the financial statements, which will result in taxable or deductible amounts in the future. In assessing the realizability of deferred tax assets, we consider future taxable income by tax jurisdiction and tax planning strategies. The Company records a valuation allowance to reduce our deferred tax assets to equal an amount that is more likely than not to be realized.
Changes in tax laws and tax rates could also affect recorded deferred tax assets and liabilities in the future. The calculation of our tax liabilities involves dealing with uncertainties in the application of complex tax laws and regulations in a multitude of jurisdictions across our global operations. ASC Topic 740, Income Taxes, states that a benefit from an uncertain tax position may be recognized when it is more likely than not that the position will be sustained upon examination, including resolutions of any related appeals or litigation processes, on the basis of the technical merits. The Company first records unrecognized tax benefits as liabilities in accordance with ASC 740 and then adjusts these liabilities when our judgment changes as a result of the evaluation of new information not previously available at the time of establishing the liability. Because of the complexity of some of these uncertainties, the ultimate resolution may result in a payment that is materially different from our current estimate of the unrecognized tax benefit liabilities. These differences will be reflected as increases or decreases to income tax expense in the period in which new information is available.
92
CLARIVATE ANALYTICS PLC
Notes to the Consolidated Financial Statements
(In thousands, except share and per share data, option prices, ratios or as noted)
Interest accrued related to unrecognized tax benefits and income tax-related penalties are included in the Benefit (provision) for income taxes.
Deferred tax is provided on taxable temporary differences arising on investments in foreign subsidiaries, except where we intend, and are able, to reinvest such amounts on a permanent basis.
Revenue Recognition
The Company derives revenue by selling information on a subscription and single transaction basis as well as from performing professional services. The Company recognizes revenue when control of these services are transferred to the customer for an amount, referred to as the transaction price, that reflects the consideration to which the Company is expected to be entitled in exchange for those goods or services. The Company determines revenue recognition utilizing the following five steps: (1) identification of the contract with a customer, (2) identification of the performance obligations in the contract (promised goods or services that are distinct), (3) determination of the transaction price, (4) allocation of the transaction price to the performance obligations, and (5) recognition of revenue when, or as, the Company transfers control of the product or service for each performance obligation. Revenue is recognized net of discounts and rebates, as well as value added and other sales taxes. Cash received or receivable in advance of the delivery of the services or publications is included in deferred revenues. The Company disaggregates revenue based on revenue recognition pattern. Subscription based revenues recognize revenue over time whereas our transactional revenues recognize revenue at a point in time. The Company believes subscription and transaction is reflective of how the Company manages the business. The revenue recognition policies for the Company’s revenue streams are discussed below.
Subscription Revenues
Subscription-based revenues are recurring revenues that are earned under annual, evergreen or multi-year contracts pursuant to which we license the right to use our products to our customers. Revenues from the sale of subscription data and analytics solutions are typically invoiced annually in advance and recognized ratably over the year as revenues are earned. Subscription revenues are typically generated either on (i) an enterprise basis, meaning that the organization has a license for the particular product or service offering and then anyone within the organization can use it at no additional cost, (ii) a seat basis, meaning each individual that uses the particular product or service offering has to have his or her own license, or (iii) a unit basis, meaning that incremental revenues are generated on an existing subscription each time the product is used (e.g., a trademark or brand is searched or assessed).
Transactional Revenues
Transactional revenues are revenues that are earned under contracts for specific deliverables that are typically quoted on a product, data set or project basis and often derived from repeat customers, including customers that also generate subscription-based revenues. Revenues from the sale of transactional products and services are invoiced according to the terms of the contract, typically in arrears. Transactional content sales are usually delivered to the customer instantly or in a short period of time, at which time revenues are recognized. In the case of professional services, these contracts vary in length from several months to years for multi-year projects and customers and typically invoiced based on the achievement of milestones. Transactional revenues are typically generated on a unit basis, although for certain product and service offerings transactional revenues are generated on a seat basis. Transactional revenues may involve sales to the same customer on multiple occasions but with different products or services comprising the order.
Performance Obligations
Content Subscription: Content subscription performance obligations are most prevalent in the Web of Science, Derwent, and Life Sciences Product Lines. Content subscriptions are subscriptions that can only be accessed through the Company’s on-line platform for a specified period of time through downloads or access codes. In addition to the primary content subscription, these types of performance obligations can often include other performance obligations, such as training subscriptions, access to historical content, maintenance and other optional content. While revenue for these performance obligations are primarily recognized over the length of the contract (subscription revenue) there are instances where revenue could be recognized upon delivery (transactional revenue). Historical content and some optional content can be purchased via a perpetual license, which would be recognized upon delivery. Fees are typically paid annually at the beginning of each term.
93
CLARIVATE ANALYTICS PLC
Notes to the Consolidated Financial Statements
(In thousands, except share and per share data, option prices, ratios or as noted)
Domain Registration Services: This performance obligation relates to the MarkMonitor Product Line. This is a service to register domain names with the applicable registries, with the Company being responsible for monitoring the domain name expiration and paying the registry before expiration. In addition, the Company has an ongoing responsibility to ensure the domain name is maintained at the registry. Customers typically sign a one to two year contract, identifying specific domain names to be registered and tracked. Revenue is recognized over the term of the contract and fees are typically invoiced annually at the beginning of each contract term.
Search Services: This performance obligation relates to the CompuMark Product Line. It is a comprehensive search report across multiple databases for a proposed trademark. The report is compiled by Clarivate’s analysts and sent to customers. Revenue is recognized upon delivery of the report. Fees are typically paid upon delivery.
Trademark Watch: This performance obligation relates to the CompuMark Product Line. Trademark watch service is an annual subscription that allows customers to protect their trademarks from infringement by providing timely notification of newly filed or published trademarks. Revenue is recognized over the term of the contract, with fees paid annually at the beginning of each contract term.
Patent Management: This performance obligation related to the IPM Product Line. The Company paid patent registration fees for customers in multiple countries to ensure their patents do not expire. Transaction fee revenue was recognized at the time payment is made on the client’s behalf to the applicable patent office. Fees were paid annually at the beginning of each term.
Variable Consideration
In some cases, contracts provide for variable consideration that is contingent upon the occurrence of uncertain future events, such as retroactive discounts provided to the customers, indexed or volume-based discounts, and revenue between contract expiration and renewal. Variable consideration is estimated at the expected value or at the most likely amount depending on the type of consideration. Estimated amounts are included in the transaction price to the extent it is probable that a significant reversal of cumulative revenue recognized will not occur when the uncertainty associated with the variable consideration is resolved. The estimate of variable consideration and determination of whether to include estimated amounts in the transaction price are based largely on an assessment of its anticipated performance and all information (historical, current, and forecasted) that is reasonably available to the Company.
Significant Judgments
Significant judgments and estimates are necessary for the allocation of the proceeds received from an arrangement to the multiple performance obligations and the appropriate timing of revenue recognition. Our contracts with customers often include promises to transfer multiple products and services to a customer. Determining whether products and services are considered distinct performance obligations that should be accounted for separately versus together may require significant judgment. Determining a standalone selling price that may not be directly observable amongst all the products and performance obligations requires judgment. Specifically, many Web of Science Product Line contracts include multiple product offerings, which may have both subscription and transactional revenues. Judgment is also required to determine whether the software license is considered distinct and accounted for separately, or not distinct and accounted for together with the subscription service and recognized over time for other products. The Company allocates value to primary content subscriptions or licenses and accompanying performance obligations, such as training subscriptions, access to historical content, maintenance and other optional content. When multiple performance obligations exist in a single contract, the transaction price is allocated to each performance obligation based on the standalone selling price of each performance obligation. The Company utilizes its standard price lists to determine the standalone selling price based on the product and country.
94
CLARIVATE ANALYTICS PLC
Notes to the Consolidated Financial Statements
(In thousands, except share and per share data, option prices, ratios or as noted)
The Company allocates the transaction price to each performance obligation based on the best estimate of the standalone selling price of each distinct good or service in the contract. The transaction price in the contract is allocated at contract inception to the distinct good or service underlying each performance obligation in proportion to the standalone selling price. The standalone selling prices are based on the Company’s normal pricing practices when sold separately with consideration of market conditions and other factors, including customer demographics and geographic location. Discounts applied to the contract will be allocated based on the same proportion of standalone selling prices.
Cost to Obtain a Contract
Commission costs represent costs to obtain a contract and are considered contract assets. The Company pays commissions to the sales managers and support teams for earning new customers and renewing contracts with existing customers. These commission costs are capitalized within Prepaid expenses and Other non-current assets on the Consolidated Balance Sheets. The costs are amortized to Selling, general and administrative expenses within the Consolidated Statements of Operations. The amortization period is between one and five years based on the estimated length of the customer relationship.
Deferred Revenues
The timing of revenue recognition may differ from the timing of invoicing to customers. We record deferred revenues when revenue is recognized subsequent to invoicing. For multi-year agreements, we generally invoice customers annually at the beginning of each annual coverage period and recognize revenue over the term of the coverage period.
Cost of Revenues, Excluding Depreciation and Amortization
Cost of revenues consists of costs related to the production and servicing of the Company’s offerings. These costs primarily relate to information technology, production and maintenance of content and personnel costs relating to professional services and customer service.
Selling, General and Administrative, Excluding Depreciation and Amortization
Selling, general and administrative includes compensation for support and administrative functions in addition to rent, office expenses, professional fees and other miscellaneous expenses. In addition, it includes selling and marketing costs associated with acquiring new customers or selling new products or product renewals to existing customers. Such costs primarily relate to wages and commissions for sales and marketing personnel.
Depreciation
Depreciation expense relates to the Company’s fixed assets including furniture & fixtures, hardware, and leasehold improvements. These assets are depreciated over their expected useful lives, and in the case of leasehold improvements over the shorter of their useful life or the life of the related lease.
Amortization
Amortization expense relates to the Company’s finite-lived intangible assets including databases and content, customer relationships, computer software, and trade names. These assets are being amortized over periods of two to 20 years.
95
CLARIVATE ANALYTICS PLC
Notes to the Consolidated Financial Statements
(In thousands, except share and per share data, option prices, ratios or as noted)
Impairment on Assets Held for Sale
Impairment on assets held for sale represents an impairment charge recorded for certain assets classified as assets held for sale.
Share-based Compensation
Share-based compensation expense includes cost associated with stock options, restricted share units (“RSUs”), and 2019 Transaction related shares granted to certain members of key management. All share-based awards are recognized in the Consolidated Statements of Operations based on their grant date fair values. We amortize the value of share-based awards to expense over the vesting period on a graded-scale basis. The incremental fair value of modifications to stock awards is estimated at the date of modification. We recognize any additional estimated expense in the period of modification for vested awards and over the remaining vesting period for un-vested awards. The Company elects to recognize forfeitures as they occur.
The fair value of stock options is estimated at the date of grant using the Black-Scholes option pricing model, which requires management to make certain assumptions of future expectations based on historical and current data. The assumptions include the expected term of the stock option, expected volatility, dividend yield, and risk-free interest rate. The expected term represents the amount of time that options granted are expected to be outstanding, based on forecasted exercise behavior. The risk-free rate is based on the rate at grant date of zero-coupon U.S. treasury notes with a term comparable to the expected term of the option. Expected volatility is estimated based on the historical volatility of comparable public entities' stock price from the same industry. The Company’s dividend yield is based on forecasted expected payments, which are expected to be zero for current plan. The Company recognizes compensation expense over the vesting period of the award on a graded-scale basis.
The share-based compensation cost of time-based RSU grants is calculate by multiplying the grant date fair market value by the number of shares granted. We recognize compensation expense over the vesting period of the award.
Transaction Expenses
Transaction expenses are incurred by the Company to assess and complete business transactions, including acquisitions and disposals, and typically include advisory, legal and other professional and consulting costs. Transaction expenses also include any earn-out related adjustments.
Transition, Integration and Other
Transition, integration and other expenses provide for the costs of transitioning certain activities performed by the Former Parent to the Company to enable operation on a stand-alone basis. Transition full time employee expense represents labor costs of full time employees who are currently working on migration projects and being expensed. Their traditional role is application development, which was capitalized.
Restructuring
Restructuring expense includes costs associated with involuntary termination benefits provided to employees under the terms of a one-time benefit arrangement, certain contract termination costs, and other costs associated with an exit or disposal activity.
Other Operating Income (Expense), Net
Other operating income (expense) consists of gains or losses related to the disposal of our assets, asset impairments or write-downs and the consolidated impact of re-measurement of the assets and liabilities of our company and our subsidiaries that are denominated in currencies other than each relevant entity’s functional currency. Other operating income (expense), net includes a tax indemnification write down related to the 2016 Transaction for the year ended December 31, 2018. See Note 22 — “Commitments and Contingencies — Tax Indemnity” for further details. The gain on sale of the divested IPM Product Line and related assets is also included in the year ended December 31, 2018. See Note 5 — “Assets Held for Sale and Divested Operations” for further details.
96
CLARIVATE ANALYTICS PLC
Notes to the Consolidated Financial Statements
(In thousands, except share and per share data, option prices, ratios or as noted)
Interest Expense, Net
Interest expense consists of interest expense related to our borrowings under the Term Loan Facility and the Notes as well as the amortization of debt issuance costs and interest related to certain derivative instruments.
Foreign Currency Translation
The operations of each of the Company’s entities are measured using the currency of the primary economic environment in which the subsidiary operates (“functional currency”). Nonfunctional currency monetary balances are re-measured into the functional currency of the operation with any related gain or loss recorded in Selling, general and administrative costs, excluding depreciation and amortization in the accompanying Consolidated Statements of Operations. Assets and liabilities of operations outside the U.S., for which the functional currency is the local currency, are translated into U.S. dollars using period-end exchange rates. Revenues and expenses are translated at the average exchange rate in effect during each fiscal month during the year. The effects of foreign currency translation adjustments are included as a component of Accumulated other comprehensive income (loss) in the accompanying Consolidated Balance Sheets.
Comprehensive Income (Loss)
Comprehensive income (loss) is defined as the change in equity of a business enterprise during a period from Net loss, transactions and other events or circumstances from non-owner sources.
Advertising and Promotion Costs
Advertising and promotion costs are expensed as of the first date that the advertisements take place. Advertising expense was approximately $9,574, $12,150 and $14,416 for the years ended December 31, 2019, 2018, and 2017, respectively.
Legal Costs
Legal costs are expensed as incurred.
Debt Issuance Costs
Fees incurred to issue debt are generally deferred and amortized as a component of interest expense over the estimated term of the related debt using the effective interest rate method.
Earnings Per Share
The calculation of earnings per share is based on the weighted average number of common shares or common stock equivalents outstanding during the applicable period. The dilutive effect of common stock equivalents is excluded from basic earnings per share and is included in the calculation of diluted earnings per share. Potentially dilutive securities include outstanding stock options. Employee equity share options and similar equity instruments granted by the Company are treated as potential common shares outstanding in computing diluted earnings per share. Diluted shares outstanding are calculated based on the average share price for each fiscal period using the treasury stock method. Under the treasury stock method, the amount the employee must pay for exercising stock options, the amount of compensation cost for future service that the Company has not yet recognized, and the amount of benefits that would be recorded in Ordinary shares when the award becomes deductible for tax purposes are assumed to be used to repurchase shares.
97
CLARIVATE ANALYTICS PLC
Notes to the Consolidated Financial Statements
(In thousands, except share and per share data, option prices, ratios or as noted)
Newly Adopted Accounting Standards
In February 2016, the FASB issued new guidance, Accounting Standard Update (“ASU”) 2016-02, related to leases in which lessees are required to recognize assets and liabilities on the balance sheet for leases having a term of more than 12 months. Recognition of these lease assets and lease liabilities represents a change from previous U.S. GAAP, which did not require lease assets and lease liabilities to be recognized for operating leases. Qualitative disclosures along with specific quantitative disclosures are required to provide enough information to supplement the amounts recorded in the financial statements so that users can understand more about the nature of an entity’s leasing activities. The Company adopted the standard, using a modified retrospective approach, on January 1, 2019.
The provisions of ASU 2016-02 are effective for the Company’s fiscal year beginning January 1, 2019, including interim periods within that fiscal year. The Company elected the package of practical expedients included in this guidance, which allows it to not reassess whether any expired or existing contracts contain leases, the lease classification for any expired or existing leases, and the initial direct costs for existing leases. The Company does not recognize short-term leases on its Consolidated Balance Sheet, and recognizes those lease payments in Selling, general and administrative costs, excluding depreciation and amortization on the Consolidated Statements of Operations on a straight-line basis over the lease term.
In January 2017, the FASB issued new guidance, ASU 2017-04, which simplifies testing goodwill for impairment by eliminating Step 2 from the goodwill impairment test as described in previously issued guidance. The guidance is effective for annual or any interim goodwill impairment tests in fiscal years beginning after December 15, 2019. The Company elected to adopt this standard on January 1, 2019. This standard did not have a material impact on the Company’s Consolidated Financial Statements.
In July 2018, the FASB issued ASU 2018-11, Leases — Targeted Improvements, as an update to the previously issued guidance. This update added a transition option which allows for the recognition of a cumulative effect adjustment to the opening balance of retained earnings in the period of adoption without recasting the financial statements in periods prior to adoption. The Company elected this transition option.
In March 2019, the FASB issued ASU 2019-01, Leases, as an update to the previously issued guidance. This update added a transition option which clarified the interim disclosure requirements as defined in ASC 250-10-50-3. The Company elected to provide the ASU 2016-02 transition disclosures as of the beginning of the period of adoption rather than the beginning of the earliest period presented. The guidance is effective for all entities during the same period that ASU 2016-02 is adopted.
The standard had a material impact on our Consolidated Balance Sheet and Consolidated Statement of Cash Flows, but did not have an impact on our Consolidated Statement of Operations. The most significant impact was the recognition of ROU assets and lease liabilities for operating leases.
In June 2018, the FASB issued guidance, ASU 2018-07, Compensation — Stock Compensation, which simplifies the accounting for nonemployee share-based payment transactions. The guidance is effective for all entities for fiscal years beginning after December 15, 2018, and interim periods within those fiscal years. This standard did not have a material impact on the Company’s Consolidated Financial Statements.
In July 2018, the FASB issued guidance, ASU 2018-09, Codification Improvements, which clarifies guidance that may have been incorrectly or inconsistently applied by certain entities. The guidance is effective for all entities for fiscal years beginning after December 15, 2018. This standard did not have a material impact on the Company’s Consolidated Financial Statements.
In August 2018, the FASB issued guidance, ASU 2018-13, Fair Value Measurement, which modifies the disclosure requirements on fair value measurements. The guidance is effective for all entities for fiscal years, and interim periods within those fiscal years, beginning after December 15, 2019 with early adoption permitted upon issuance of this update. The Company adopted this standard on January 1, 2019. This standard did not have a material impact on the Company’s Consolidated Financial Statements.
98
CLARIVATE ANALYTICS
PLC
Notes to the Consolidated Financial Statements
(In thousands, except share and per share data, option prices, ratios or as noted)
Recently Issued Accounting Standards
In June 2016, the FASB issued new guidance, ASU 2016-13, related to measurement of credit losses on financial instruments which requires the measurement and recognition of expected credit losses for financial assets held at amortized cost. This new guidance replaces the existing incurred loss impairment model with an expected loss methodology, which will result in more timely recognition of credit losses. The guidance is effective for annual reporting periods beginning after December 15, 2019, and interim periods within fiscal years beginning after December 15, 2019. The adoption of this standard is not expected to have a material impact on the Company’s Consolidated Financial Statements.
In August 2018, the FASB issued guidance, ASU 2018-14, which modifies the disclosure requirements for employers that sponsor defined benefit pension or other postretirement plans. The guidance is effective for all entities for fiscal years beginning after December 15, 2020. Early adoption is permitted. The Company is currently in the process of evaluating the impact of the adoption of this standard on its Consolidated Financial Statements.
In August 2018, the FASB issued guidance, ASU 2018-15, which aligns the requirements for capitalizing implementation costs incurred in a hosting arrangement that is a service contract with the requirements for capitalizing implementation costs incurred to develop or obtain internal-use software (and hosting arrangements that include an internal use software license). The accounting for the service element of a hosting arrangement that is a service contract is not affected by the amendments in this Update. The guidance is effective for all entities for fiscal years beginning after December 15, 2019, and interim periods within those fiscal years. The Company adopted the standard on January 1, 2020. The Company does not expect the standard to have a material impact on the Company’s Consolidated Financial Statements.
In April 2019, the FASB issued ASU 2019-04, Codification Improvements to Topic 326, which provides targeted improvements or clarification and correction to the ASU 2016-01 Financial Instruments Overall, ASU 2016-13 Financial Instruments Credit Losses, and ASU 2017-12 Derivatives and Hedging, accounting standards updates that were previously issued. The guidance is effective upon adoption of the related standards. The Company is currently in the process of evaluating the impact of the adoption of this standard on its Consolidated Financial Statements.
In April 2019, the FASB issued ASU 2019-05, Financial Instruments — Credit Losses, which provides targeted transition relief to the accounting standards update previously issued as part of ASU 2016-13 Financial Instruments Credit Losses. The guidance is effective for all entities during the same period that ASU 2016-13 is adopted. The Company is currently in the process of evaluating the impact of the adoption of this standard on its Consolidated Financial Statements.
In November 2019, the FASB issued ASU 2019-10, Credit Losses (Topic 326), Derivatives and Hedging (Topic 815), and Leases (Topic 842), which provides improvements or clarification and correction to the ASU 2016-02 Leases, ASU 2016-13 Financial Instruments Credit Losses, and ASU 2017-12 Derivatives and Hedging, accounting standards updates that were previously issued. The guidance is effective upon adoption of the related standards. The Company is currently in the process of evaluating the impact of the adoption of this standard on its Consolidated Financial Statements.
In November 2019, the FASB issued ASU 2019-11, Codification Improvements to Topic 326, Financial Instruments — Credit Losses, which provides clarification to certain aspects of the accounting standards update previously issued as part of ASU 2016-13 Financial Instruments Credit Losses. The guidance is effective for all entities during the same period that ASU 2016-13 is adopted. The Company is currently in the process of evaluating the impact of the adoption of this standard on its Consolidated Financial Statements.
In December 2019, the FASB issued ASU 2019-12, which enhances and simplifies various aspects of the income tax accounting guidance, including requirements such as tax basis step-up in goodwill obtained in a transaction that is not a business combination, ownership changes in investments, and interim-period accounting for enacted changes in tax law. The guidance is effective for all entities for fiscal years beginning after December 15, 2020. Early adoption is permitted. The Company is currently in the process of evaluating the impact of the adoption of this standard on its Consolidated Financial Statements.
99
CLARIVATE ANALYTICS
PLC
Notes to the Consolidated Financial Statements
(In thousands, except share and per share data, option prices, ratios or as noted)
There were no other new accounting standards that we expect to have a material impact to our financial position or results of operations upon adoption.
Note 4: Business Combinations
On May 13, 2019, the Company completed the 2019 Transaction. Jersey began operations in 2016 as a provider of proprietary and comprehensive content, analytics, professional services and workflow solutions that enables users across government and academic institutions, life science companies and R&D intensive corporations to discover, protect and commercialize their innovations. Churchill was a special purpose acquisition company whose business was to effect a merger, capital stock exchange, asset acquisition, stock purchase reorganization or similar business combination. The shares and earnings per share available to holders of the Company’s ordinary shares, prior to the 2019 Transaction, have been recasted as shares reflecting the exchange ratio established in the 2019 Transaction (1.0 Jersey share to 132.13667 Clarivate shares).
Pursuant to the Merger Agreement, the aggregate stock consideration issued by the Company in the 2019 Transaction was $3,052,500, consisting of 305,250,000 newly issued ordinary shares of the Company valued at $10.00 per share, subject to certain adjustments described below. Of the $3,052,500, the shareholders of Jersey prior to the closing of the 2019 Transaction (the “Company Owners”) received $2,175,000 in the form of 217,500,000 newly issued ordinary shares of the Company. In addition, of the $3,052,500, Churchill public shareholders received $690,000 in the form of 68,999,999 newly issued ordinary shares of the Company. In addition, Churchill Sponsor LLC (the “sponsor”) received $187,500 in the form of 17,250,000 ordinary shares of the Company issued to the sponsor, and 1,500,000 additional ordinary shares of the Company were issued to certain investors. See Note 16 – “Shareholders’ Equity” for further information.
Upon consummation of the 2019 Transaction, each outstanding share of common stock of Churchill was converted into one ordinary share of the Company. At the closing of the 2019 Transaction, the Company Owners held approximately 74% of the issued and outstanding ordinary shares of the Company and stockholders of Churchill held approximately 26% of the issued and outstanding shares of the Company excluding the impact of (i) 52,800,000 warrants, (ii) approximately 24,806,793 compensatory options issued to the Company's management (based on number of options to purchase Jersey ordinary shares outstanding immediately prior to the 2019 Transaction, after giving effect to the exchange ratio described above) and (iii) 10,600,000 ordinary shares of Clarivate owned of record by the sponsor and available for distribution to certain individuals following the applicable lock-up and vesting restrictions.
Certain restrictions were removed following the Secondary Offering on August 14, 2019. See Note 17 – “Employment and Compensation Arrangements” for further information. After giving effect to the satisfaction of the vesting restrictions, the Company Owners held approximately 60% of the issued and outstanding shares of the Company at the close of the 2019 Transaction. See Note 16 – “Shareholders’ Equity” for further information on equity instruments.
In September 2019, the Company purchased the key business assets of SequenceBase, an international patent sequence information provider. The SequenceBase acquisition was accounted for as an asset acquisition. As a result of the SequenceBase acquisition, SequenceBase’s identifiable assets were adjusted to their fair market values as of the closing date, which included customer relations intangibles of $1,000 and computer software intangibles of $2,500. The Consolidated Financial Statements include the results of the acquisition subsequent to the closing date.
100
CLARIVATE ANALYTICS
PLC
Notes to the Consolidated Financial Statements
(In thousands, except share and per share data, option prices, ratios or as noted)
On November 27, 2019, the Company closed on the acquisition of Darts-ip, (“Darts”), a provider of global IP case law data and analytics headquartered in Brussels, Belgium. The Company acquired 100% of the voting equity interest of Darts for cash considerations. The Darts acquisition was accounted for using the acquisition method of accounting. As a result of the Darts acquisition and the application of purchase accounting, Darts’ identifiable assets and liabilities were adjusted to their fair market values as of the closing date, which included database intangible assets of $22,012, computer software intangible assets of $9,025, customer relationships intangible assets of $2,641 and finite-lived trade names intangible assets of $1,541. The Consolidated Financial Statements include the results of the acquisition subsequent to the closing date. The excess of the purchase price over the net tangible and intangible assets is recorded to goodwill and primarily reflects the assembled workforce and expected synergies. The weighted-average amortization period for total acquired finite-lived intangible assets is 11.5 years and the weighted-average amortization period by major class of intangible asset is 14.0 years for database and content, 6.0 years for computer software, 18.0 years for trade names, and 5.0 years for customer relationships.
On October 25, 2018, Clarivate closed on the acquisition of TrademarkVision USA, LLC (“TrademarkVision”), an artificial intelligence technology start-up organization headquartered in Brisbane, Australia. The total purchase price for the acquisition consisted of $20,042 in closing date net cash consideration, subject to subsequent working capital adjustments, plus potential earn-out cash payments dependent upon achievement of certain milestones and financial performance metrics. The fair market value of the liability associated with the earn-out was $4,115 on the date of acquisition. Additionally, the excess value of the total purchase price over the fair value of our identifiable assets and liabilities upon the closing of the acquisition of $19,205 was allocated to goodwill. The Consolidated Financial Statements include the results of the acquisition subsequent to the closing date. TrademarkVision and its revolutionary image recognition software search tool for trademarks joined the trademark clearance and protection partner CompuMark. The fair value of the earn-out liability was $8,000 and $4,115 at December 31, 2019 and 2018.
On March 15, 2018, the Company acquired all of the outstanding stock of Kopernio (“Kopernio”), an artificial-intelligence technology startup, for $3,497. The Kopernio acquisition was accounted for using the acquisition method of accounting. As a result of the Kopernio acquisition and the application of purchase accounting, Kopernio’s identifiable assets and liabilities were adjusted to their fair market values as of the closing date, which included a finite life intangible of $1,258 relating to computer software. Additionally, the excess value of the total purchase price over the fair value of our identifiable assets and liabilities upon the closing of the acquisition of $2,322 was allocated to goodwill. The Consolidated Financial Statements include the results of the acquisition subsequent to the closing date. In conjunction with the acquisition of Kopernio, the Company agreed to pay former shareholders up to an additional $3,500 through 2021. Amounts payable are contingent upon Kopernio’s achievement of certain milestones and performance metrics and will be recognized over the concurrent service period.
On June 1, 2017, the Company acquired all assets, liabilities and equity interests of Publons Limited and its wholly-owned subsidiary (“Publons”). Total net cash consideration for the acquisition was $7,401, plus potential future cash payments of up to $9,500 contingent upon Publons achieving certain milestones or financial and non-financial performance targets through 2020, including platform users and reviews. The fair market value of the liability associated with the earn-out was $5,900 on the date of acquisition. Publons is a researcher-facing peer-review data and recognition platform. The acquisition of Publons, its platform and data, is believed to increase the value of multiple existing Company products, while supporting researchers in the process. The Consolidated Financial Statements include the results of the acquisitions subsequent to the closing date. The fair value of the Publons earn-out liability was $3,100, $2,960, and $5,900 at December 31, 2019, 2018, and 2017, respectively.
101
CLARIVATE ANALYTICS
PLC
Notes to the Consolidated Financial Statements
(In thousands, except share and per share data, option prices, ratios or as noted)
The fair value of identifiable assets acquired and liabilities assumed for all acquisitions at closing during 2019, 2018, and 2017 respectively, net of cash acquired, and contingent consideration liabilities incurred in relation to the acquisitions are summarized below:
| 2019(1) | 2018 | 2017 | ||||||||||
| Current assets | $ | 2,137 | $ | 706 | $ | 51 | ||||||
| Computer hardware and other property | 86 | — | — | |||||||||
| Finite-lived intangible assets | 38,719 | 7,928 | 3,600 | |||||||||
| Indefinite-lived intangible assets | — | — | 70 | |||||||||
| Goodwill | 44,779 | 21,527 | 9,767 | |||||||||
| Other non-current assets | 2 | 38 | 14 | |||||||||
| Total assets | 85,723 | 30,199 | 13,502 | |||||||||
| Current liabilities | 4,366 | 491 | 182 | |||||||||
| Non-current liabilities | 8,920 | 2,054 | 19 | |||||||||
| Total liabilities | 13,286 | 2,545 | 201 | |||||||||
| Net assets acquired | $ | 72,437 | $ | 27,654 | $ | 13,301 |
(1) Net assets acquired includes $3,500 related to the SequenceBase acquisition.
None of the goodwill associated with any of the business combinations above will be deductible for income tax purposes. Pro forma information is not presented for these acquisitions as the aggregate operations of the acquired acquisitions were not significant to the overall operations of the Company.
102
CLARIVATE ANALYTICS
PLC
Notes to the Consolidated Financial Statements
(In thousands, except share and per share data, option prices, ratios or as noted)
Note 5: Assets Held for Sale and Divested Operations
On November 3, 2019, the Company entered into an agreement with OpSec Security for the sale of certain assets and liabilities of its MarkMonitor Product Line within its IP Group. At December 31, 2019 the assets and liabilities related to the divestment met the criteria for classification as Assets Held for Sale on the Company’s balance sheet. The divestiture closed on January 1, 2020 for a total purchase price of $3,751 and an impairment charge of $18,431 was recognized in the Statement of Operations during the fourth quarter 2019 to reduce the Assets held for sale to their fair value. Of the total impairment charge, $17,967 related to the write down of intangible assets and $468 to the write down of goodwill. Accordingly, we do not expect to record a gain or loss on the divestiture in the first quarter of 2020. After impairment, Current Assets of $2,274 and Long Term Assets of $28,345 were reclassified to Current Assets Held for Sale, while Current Liabilities of $21,170 and Long Term Liabilities of $5,698 were reclassified to Current Liabilities Held For Sale.
The carrying amount of major classes of assets and liabilities that are included in Assets held for sale and Liabilities held for sale at December 31, 2019 related to the divested Brand Protection, Antipiracy and AntiFraud solutions consist of the following:
| As of December 31, | ||||
| 2019 | ||||
| Assets: | ||||
| Current assets: | ||||
| Cash and cash equivalents | $ | 384 | ||
| Prepaid expenses | 1,692 | |||
| Other current assets | 198 | |||
| Total current assets | 2,274 | |||
| Computer hardware and other property, net | 2,961 | |||
| Other intangible assets, net | 18,957 | |||
| Other non-current assets | 1,993 | |||
| Operating lease right-of-use assets | 4,434 | |||
| Total Assets held for sale | $ | 30,619 | ||
| Liabilities: | ||||
| Current liabilities: | ||||
| Accounts payable | $ | 25 | ||
| Accrued expenses and other current liabilities | 1,764 | |||
| Current portion of deferred revenues | 18,067 | |||
| Current portion of operating lease liabilities | 1,314 | |||
| Total current liabilities | 21,170 | |||
| Non-current portion of deferred revenues | 834 | |||
| Other non-current liabilities | 163 | |||
| Operating lease liabilities | 4,701 | |||
| Total Liabilities held for sale | $ | 26,868 | ||
On October 1, 2018, all assets, liabilities and equity interest of the IP Management (IPM) Product Line and related assets were sold to CPA Global for a total purchase price of $100,130. As a result of the sale, the Company recorded a net gain on sale of $36,072, inclusive of incurred transaction costs of $3,032 in connection with the divestiture. The gain on sale is included in Other operating income (expense), net within the Consolidated Statement of Operations. As a result of the sale, the Company wrote off Goodwill in the amount of $49,349. The Company used $31,378 of the proceeds to pay down the Term Loan Facility on October 31, 2018.
103
CLARIVATE ANALYTICS
PLC
Notes to the Consolidated Financial Statements
(In thousands, except share and per share data, option prices, ratios or as noted)
Both the divestitures of the MarkMonitor Brand Protection, Anti-Piracy and AntiFraud solutions, and IPM Product Lines do not represent a strategic shift and is not expected to have a major effect on the Company’s operations or financial results, as defined by ASC 205-20, Discontinued Operations; as a result, these divestitures do not meet the criteria to be classified as discontinued operations.
104
CLARIVATE ANALYTICS
PLC
Notes to the Consolidated Financial Statements
(In thousands, except share and per share data, option prices, ratios or as noted)
Note 6: Accounts Receivable
Our accounts receivable balance consists of the following as of December 31, 2019 and 2018:
| Year ended December 31, | ||||||||
| 2019 | 2018 | |||||||
| Accounts receivable | 350,369 | 345,371 | ||||||
| Less: Accounts receivable allowance | (16,511 | ) | (14,076 | ) | ||||
| Accounts receivable, net | $ | 333,858 | $ | 331,295 | ||||
We record an accounts receivable allowance when it is probable that the accounts receivable balance will not be collected. The amounts comprising the allowance are based upon management’s estimates and historical collection trends. The activity in our accounts receivable allowance consists of the following for the years ended December 31, 2019, 2018, and 2017, respectively:
| Year ended December 31, | ||||||||||||
| 2019 | 2018 | 2017 | ||||||||||
| Balance at beginning of year | $ | 14,076 | $ | 8,495 | $ | 2,643 | ||||||
| Additional provisions | 4,662 | 6,469 | 6,233 | |||||||||
| Write-offs and other deductions | (2,321 | ) | (870 | ) | (434 | ) | ||||||
| Exchange differences | 94 | (18 | ) | 53 | ||||||||
| Balance at the end of year | $ | 16,511 | $ | 14,076 | $ | 8,495 | ||||||
Note 7: Leases
As the lessee, we currently lease real estate space, automobiles, and certain equipment under non-cancelable operating lease agreements. Some of the leases include options to extend the leases for up to an additional 10 years. We do not include any of our renewal options in our lease terms for calculating our lease liability as the renewal options allow us to maintain operational flexibility, and we are not reasonably certain we will exercise these renewal options at this time.
We determine if an arrangement is a lease at inception. Operating leases are included in Operating lease right-of-use assets, Current portion of operating lease liabilities, and Operating lease liabilities on our Condensed Consolidated Balance Sheets. The Company assesses its ROU asset and other lease-related assets for impairment consistent with other long-lived assets. As of December 31, 2019, we did not record impairment related to these assets.
Operating lease ROU assets and operating lease liabilities are recognized based on the present value of the future minimum lease payments over the lease term at commencement date. As most of our leases do not provide an implicit rate, we use our incremental borrowing rate based on the information available at commencement date in determining the present value of future payments. As such, the Company used judgment to determine an appropriate incremental borrowing rate. The operating lease ROU asset also includes any lease payments made and excludes lease incentives and initial direct costs incurred. Our variable lease payments consist of non-lease services related to the lease and lease payments that are based on annual changes to an index. Variable lease payments are excluded from the ROU assets and lease liabilities and are recognized in the period in which the obligation for those payments is incurred. Lease expense for minimum lease payments is recognized on a straight-line basis over the lease term.
We have lease agreements with lease and non-lease components, which are accounted as a single lease component. Additionally, for certain equipment leases, we apply a portfolio approach to effectively account for the operating lease ROU assets and liabilities.
105
CLARIVATE ANALYTICS
PLC
Notes to the Consolidated Financial Statements
(In thousands, except share and per share data, option prices, ratios or as noted)
As of December 31, 2019, we have additional operating leases, primarily for real estate, that have not yet commenced of $4,158. These operating leases will commence in fiscal year 2020 with lease terms of one year to five years.
| December 31, | ||||
| 2019 | ||||
| Lease cost | ||||
| Operating lease cost | $ | 27,812 | ||
| Short-term lease cost | 296 | |||
| Variable lease cost | 1,213 | |||
| Total lease cost | $ | 29,321 | ||
| December 31, | ||||
| 2019 | ||||
| Other information | ||||
| Cash Paid for amounts included in measurement of lease liabilities | ||||
| Operating cash flows from operating leases | $ | 24,303 | ||
| Right-of-use assets obtained in exchange for lease obligations | ||||
| Operating leases | $ | 6,386 | ||
| Weighted-average remaining lease term - operating leases | 6 | |||
| Weighted-average discount rate - operating leases | 5.8 | % | ||
The future aggregate minimum lease payments as of December 31, 2019 under all non-cancelable operating leases for the years noted are as follows:
| Year ending December 31, | ||||
| 2020 | $ | 21,178 | ||
| 2021 | 17,854 | |||
| 2022 | 15,378 | |||
| 2023 | 12,816 | |||
| 2024 | 10,476 | |||
| 2025 & Thereafter | 25,460 | |||
| Total operating lease commitments | 103,162 | |||
| Less imputed interest | (16,843 | ) | ||
| Total | $ | 86,319 | ||
In connection with certain leases, the Company guarantees the restoration of the leased property to a specified condition after completion of the lease period. As of December 31, 2019 and December 31, 2018, the liability of $3,455 and $4,100, respectively, associated with these restorations is recorded within Other non-current liabilities.
There were no material future minimum sublease payments to be received under non-cancelable subleases at December 31, 2019. There was no material sublease income for the years ended December 31, 2019, 2018 and 2017, respectively.
106
CLARIVATE ANALYTICS
PLC
Notes to the Consolidated Financial Statements
(In thousands, except share and per share data, option prices, ratios or as noted)
Disclosures related to periods prior to adoption of Topic 842
As discussed above, the Company adopted Topic 842 effective January 1, 2019 using a modified retrospective approach. For comparability purposes, and as required, the following disclosure is provided for periods prior to adoption. The Company’s total future minimum annual rental payments in effect at December 31, 2018 for noncancelable operating leases, which were accounted for under the previous leasing standard, Accounting Standards Codification 840, were as follows:
| Year ended December 31, | ||||
| 2019 | $ | 22,140 | ||
| 2020 | 19,531 | |||
| 2021 | 17,240 | |||
| 2022 | 15,333 | |||
| 2023 | 14,944 | |||
| Thereafter | 40,367 | |||
| Total operating lease commitments | $ | 129,555 | ||
Total rental expense under operating leases amounted to $25,527 and $17,255 for the years ended December 31, 2018 and 2017, respectively.
Note 8: Computer Hardware and Other Property, Net
Computer hardware and other property consisted of the following:
| December 31, | ||||||||
| 2019 | 2018 | |||||||
| Computer hardware | $ | 24,620 | $ | 18,130 | ||||
| Leasehold improvements | 12,496 | 13,298 | ||||||
| Furniture, fixtures and equipment | 4,412 | 6,816 | ||||||
| Total computer hardware and other property | 41,528 | 38,244 | ||||||
| Accumulated depreciation | (23,486 | ) | (17,603 | ) | ||||
| Total computer hardware and other property, net | $ | 18,042 | $ | 20,641 | ||||
Depreciation amounted to $9,181, $9,422, and $6,997 for the years ended December 31, 2019, 2018, and 2017, respectively.
107
CLARIVATE ANALYTICS
PLC
Notes to the Consolidated Financial Statements
(In thousands, except share and per share data, option prices, ratios or as noted)
Note 9: Identifiable Intangible Assets, net
The Company’s identifiable intangible assets consist of the following:
| December 31, 2019 | December 31, 2018 | |||||||||||||||||||||||
| Gross | Accumulated Amortization | Net | Gross | Accumulated Amortization | Net | |||||||||||||||||||
| Finite-lived intangible assets | ||||||||||||||||||||||||
| Customer relationships | $ | 280,493 | $ | (180,571 | ) | $ | 99,922 | $ | 291,503 | $ | (164,611 | ) | $ | 126,892 | ||||||||||
| Databases and content | 1,755,323 | (342,385 | ) | 1,412,938 | 1,725,878 | (233,733 | ) | 1,492,145 | ||||||||||||||||
| Computer software | 285,701 | (135,919 | ) | 149,782 | 268,704 | (97,570 | ) | 171,134 | ||||||||||||||||
| Trade names | 1,570 | — | 1,570 | — | — | — | ||||||||||||||||||
| Finite-lived intangible assets | 2,323,087 | (658,875 | ) | 1,664,212 | 2,286,085 | (495,914 | ) | 1,790,171 | ||||||||||||||||
| Indefinite-lived intangible assets | ||||||||||||||||||||||||
| Trade names | 164,428 | — | 164,428 | 168,349 | — | 168,349 | ||||||||||||||||||
| Total intangible assets | $ | 2,487,515 | $ | (658,875 | ) | $ | 1,828,640 | $ | 2,454,434 | $ | (495,914 | ) | $ | 1,958,520 | ||||||||||
The Company performed the indefinite-lived impairment test as of October 1, 2019 and 2018. Additionally, the Company reviewed goodwill for indicators of impairment at December 31, 2019 and 2018. As part of this analysis, the Company determined that its trade name, with a carrying value of $164,428, and $168,349 as of December 31, 2019 and 2018, respectively, was not impaired and will continue to be reported as indefinite-lived intangible assets.
In September and November 2019, the Company purchased the key business assets of SequenceBase and Darts-ip. As a result of the purchase, customer relations balance increased $3,641, computer software increased $11,525, databases and content increased $22,012 and finite-lived trade names increased $1,541. See Note 4 – “Business Combinations” for further details.
On January 1, 2020, all assets, liabilities, and equity interest of the Brand Protection, AntiPiracy, and AntiFraud solutions of the MarkMonitor Product Line were sold to OpSec Security for a purchase price of $3,751, which was determined to be the approximation of the fair value. At December 31, 2019, the assets and liabilities related to the divestment met the criteria for classification as Assets held for sale on the Company’s balance sheet, which included $36,924 of intangible assets. In addition, the Company compared the book value of the assets and liabilities to the purchase price and recorded a total impairment charge during the year ended December 31, 2019 of $18,431, which included the write down of the $17,967 intangible assets classified as Assets held for sale. See Note 5 – “Assets Held for Sale and Divested Operations” for further details.
The weighted-average amortization period for each class of finite-lived intangible assets and for total finite-lived intangible assets, which range between two and 20 years, is as follows:
| Remaining Weighted - Average Amortization Period (in years) | ||||
| Customer relationships | 12.70 | |||
| Databases and content | 13.80 | |||
| Computer software | 3.89 | |||
| Trade names | 18.00 | |||
| Total | 13.08 | |||
Amortization amounted to $191,361, $227,803, and 221,466 for the years ended December 31, 2019, 2018, and 2017, respectively.
108
CLARIVATE ANALYTICS
PLC
Notes to the Consolidated Financial Statements
(In thousands, except share and per share data, option prices, ratios or as noted)
Estimated amortization for each of the five succeeding years as of December 31, 2019 is as follows:
| 2020 | $ | 170,343 | ||
| 2021 | 160,666 | |||
| 2022 | 122,886 | |||
| 2023 | 116,665 | |||
| 2024 | 116,395 | |||
| Thereafter | 935,302 | |||
| Subtotal finite-lived intangible assets | 1,622,257 | |||
| Internally developed software projects in process | 41,955 | |||
| Total finite-lived intangible assets | 1,664,212 | |||
| Intangibles with indefinite lives | 164,428 | |||
| Total intangible assets | $ | 1,828,640 |
109
CLARIVATE ANALYTICS PLC
Notes to the Consolidated Financial Statements
(In thousands, except share and per share data, option prices, ratios or as noted)
Note 10: Goodwill
The change in the carrying amount of goodwill is shown below:
| Balance as of December 31, 2017 | $ | 1,311,253 | ||
| Acquisition | 21,527 | |||
| Disposal | (49,349 | ) | ||
| Impact of foreign currency fluctuations and other | (512 | ) | ||
| Balance as of December 31, 2018 | $ | 1,282,919 | ||
| Acquisition | 44,779 | |||
| Transferred to Assets held for sale | (468 | ) | ||
| Impact of foreign currency fluctuations and other | 815 | |||
| Balance as of December 31, 2019 | $ | 1,328,045 |
The Company performed the goodwill impairment test as of October 1, 2019 and 2018. Additionally, the Company reviewed goodwill for indicators of impairment at December 31, 2019 and 2018. As of December 31, 2019, 2018 and 2017, the accumulated goodwill impairment was $0.
Goodwill represents the purchase price in excess of the fair value of the net assets acquired in a business combination. If the carrying value of a reporting unit exceeds the implied fair value of that reporting unit, an impairment charge to goodwill is recognized for the excess. The Company’s reporting units are one level below the operating segment, as determined in accordance with ASC 350. For the years ended December 31, 2019 and 2018, the Company had five reporting units.
The Company estimates the fair value of its reporting units using the income approach. Under the income approach, the fair value of a reporting unit is calculated based on the present value of estimated cash flows. No indicators of impairment existed as a result of the Company’s assessments, except for the sale of the Brand Protection, AntiPiracy, and AntiFraud solutions of the MarkMonitor Product Line.
On January 1, 2020, all assets, liabilities, and equity interest of the Brand Protection, AntiPiracy, and AntiFraud solutions of the MarkMonitor Product Line were sold to OpSec Security for a purchase price of $3,751, which was determined to be the approximation of the fair value. At December 31, 2019, the assets and liabilities related to the divestment met the criteria for classification as Assets held for sale on the Company’s balance sheet, which included $468 of goodwill. In addition, the Company compared the book value of the assets and liabilities to the purchase price and recorded a total impairment charge during the year ended December 31, 2019 of $18,431, which included the write down of the $468 goodwill classified as Assets held for sale. See Note 5 – “Assets Held for Sale” for further details.
On November 27, 2019, the Company acquired Darts-ip, which included $44,779 of goodwill. See Note 4 – “Business Combinations” for further details.
On October 1, 2018, the Company divested the IPM Product Line, which included $49,349 of goodwill. See Note 5 – “Assets Held for Sale and Divested Operations” for further details.
On October 25, 2018, Clarivate closed on the acquisition of TrademarkVision USA, LLC (“TrademarkVision”), which included $19,205 of goodwill. See Note 4 – “Business Combinations” for further details.
On March 15, 2018, the Company acquired all of the outstanding stock of Kopernio (“Kopernio”), which included $2,322 of goodwill. See Note 4 – “Business Combinations” for further details.
110
CLARIVATE ANALYTICS PLC
Notes to the Consolidated Financial Statements
(In thousands, except share and per share data, option prices, ratios or as noted)
Note 11: Derivative Instruments
The IPM Product Line and related assets, which were divested on October 1, 2018, had forward contracts with notional values of $0 at December 31, 2019 and December 31, 2018. Gains or (losses) on the forward contracts amounted to $0, $240 and $(1,479) for the years ended December 31, 2019, 2018 and 2017 respectively. These amounts were recorded in Revenues, net in the Consolidated Statements of Operations. The cash flows from forward contracts are reported as operating activities in the Consolidated Statements of Cash Flows. The fair value of the forward contracts recorded in Accrued expenses and other current liabilities was $0 as at December 31, 2019 and December 31, 2018.
In April 2017, the Company entered into interest rate derivative arrangements with counterparties to reduce its exposure to variability in cash flows relating to interest payments on $300,000 of its term loan, effective April 30, 2021. Additionally, in May 2019, the Company entered into additional interest rate derivative arrangements with counterparties to reduce its exposure to variability in cash flows relating to interest payments on $50,000 of its Term Loan, effective March 2021 and maturing in September 2023. The Company applies hedge accounting by designating the interest rate swaps as a hedge in applicable future quarterly interest payments.
Changes in the fair value of interest rate swaps are recorded in Accumulated other comprehensive income (loss) (“AOCI”) and the amounts reclassified out of AOCI are recorded to Interest expense, net. The fair value of the interest rate swaps is recorded in Other non-current assets or liabilities according to the duration of related cash flows. The total fair value of the interest rate swaps was a liability of $2,778 at December 31, 2019 and an asset of $3,644 at December 31, 2018.
See Note 12 – “Fair Value Measurements” for additional information on derivative instruments.
The following table summarizes the changes in AOCI (net of tax) related to cash flow hedges for the year ended December 31, 2017:
| Balance at December 31, 2016: | $ | — | ||
| Other comprehensive income (loss) | 3,011 | |||
| Amounts reclassified from AOCI to net income | (1,904 | ) | ||
| Balance at December 31, 2017: | $ | 1,107 |
The following table summarizes the changes in AOCI (net of tax) related to cash flow hedges for the year ended December 31, 2018:
| AOCI Balance at December 31, 2017 | $ | 1,107 | ||
| Derivative gains (losses) recognized in Other comprehensive income (loss) | 2,313 | |||
| Amount reclassified out of Other comprehensive income (loss) to net loss | 224 | |||
| AOCI Balance at December 31, 2018 | $ | 3,644 |
The following table summarizes the changes in AOCI (net of tax) related to cash flow hedges for the year ended December 31, 2019:
| AOCI Balance at December 31, 2018 | $ | 3,644 | ||
| Derivative gains (losses) recognized in Other comprehensive income (loss) | (7,107 | ) | ||
| Amount reclassified out of Other comprehensive income (loss) to net loss | 685 | |||
| AOCI Balance at December 31, 2019 | $ | (2,778 | ) |
111
CLARIVATE ANALYTICS PLC
Notes to the Consolidated Financial Statements
(In thousands, except share and per share data, option prices, ratios or as noted)
Note 12: Fair Value Measurements
The Company records certain assets and liabilities at fair value. Fair value is defined as the price that would be received to sell an asset or paid to transfer a liability in the principal or most advantageous market for the asset or liability in an orderly transaction between market participants at the measurement date. A three-level fair value hierarchy that prioritizes the inputs used to measure fair value is described below. This hierarchy requires entities to maximize the use of observable inputs and minimize the use of unobservable inputs. The three levels of inputs used to measure fair value are as follows:
| • | Level 1 - Quoted prices in active markets for identical assets or liabilities. |
| • | Level 2 - Observable inputs other than quoted prices include in Level 1, such as quoted prices for similar assets and liabilities in active markets; quoted prices for identical or similar assets and liabilities in markets that are not active; or other inputs that are observable or can be corroborated by observable market data. |
| • | Level 3 - Unobservable inputs that are support by little or no market activity. This includes certain pricing models, discounted cash flow methodologies and similar techniques that use significant unobservable inputs. |
Below is a summary of the valuation techniques used in determining fair value:
Derivatives - Derivatives consist of foreign exchange contracts and interest rate swaps. The fair value of foreign exchange contracts is based on observable market inputs of spot and forward rates or using other observable inputs. The fair value of the interest rate swaps is the estimated amount that the Company would receive or pay to terminate such agreements, taking into account market interest rates and the remaining time to maturities or using market inputs with mid-market pricing as a practical expedient for bid-ask spread. See Note 11 – “Derivative Instruments” for additional information.
Contingent consideration - The Company values contingent consideration related to business combinations using a weighted probability calculation of potential payment scenarios discounted at rates reflective of the risks associated with the expected future cash flows. Key assumptions used to estimate the fair value of contingent consideration include revenue, net new business and operating forecasts and the probability of achieving the specific targets.
The carrying value of cash and cash equivalents, restricted cash, accounts receivable, accounts payable, and other accruals readily convertible into cash approximate fair value because of the short-term nature of the instruments. The carrying value of the Company’s variable interest rate debt, excluding unamortized debt issuance costs and original issue discount, approximates fair value due to the short-term nature of the interest rate benchmark rates. The fair value of the fixed rate debt is estimated based on market observable data for debt with similar prepayment features. The fair value of the Company’s debt was $1,692,750 and $1,950,318 at December 31, 2019 and 2018, respectively. The fair value is considered Level 2 under the fair value hierarchy.
Assets and Liabilities Recorded at Fair Value on a Recurring Basis
The Company has determined that its foreign exchange forward contracts, included in Other current assets, along with the interest rate swaps, included in Accrued expenses and other current liabilities and Other non-current liabilities according to the duration of related cash flows, reside within Level 2 of the fair value hierarchy.
The earn-out liability is recorded in Accrued expenses and other current liabilities and Other non-current liabilities and is classified as Level 3 in the fair value hierarchy. Additionally, the earn-out relates to the TrademarkVision and the Publons acquisitions that occurred in 2018 and 2017, respectively. The amount payable is contingent upon the achievement of certain company specific milestones and performance metrics over a 1-year and 3-year period, respectively, including number of cumulative users, cumulative reviews and annual revenue. In accordance with ASC 805, we estimated the fair value of the earn-outs using a Monte Carlo simulation for the year ended December 31, 2018.
As of December 31, 2019, the amount of the earn-outs approximate fair value due to their short term nature of their remaining payments. This fair value measurement is based on significant inputs not observable in the market and thus represents a Level 3 measurement as defined in ASC 820. As of December 31, 2019, the Company increased the earn-out liabilities related to Publons and TrademarkVision based on current period performance. Changes in the earn-out are recorded to Transaction expenses in the Consolidated Statements of Operations.
There were no transfers of assets or liabilities between levels during the years ended December 31, 2019 and 2018.
112
CLARIVATE ANALYTICS PLC
Notes to the Consolidated Financial Statements
(In thousands, except share and per share data, option prices, ratios or as noted)
The following inputs and assumptions were used to value the earn-out liability as of December 31, 2018:
| TrademarkVision | |
| Risk-free rate | 2.77% |
| Discount rate | 8.09% |
| Expected life (in years) | 1.54 |
| Publons | |
| Risk-free rate | 2.34 - 2.63% |
| Discount rate | 9.23 - 9.72% |
| Expected life (in years) | 1.04 - 3.04 |
The following table presents the changes in the earn-out, the only Level 3 item, for the years ended December 31, 2019 and 2018:
| Balance at December 31, 2016 | $ | — | ||
| Earn-out liability | 5,900 | |||
| Balance at December 31, 2017 | $ | 5,900 | ||
| Business combinations | 4,115 | |||
| Payment of earn-out liability | (2,470 | ) | ||
| Revaluations included in earnings | (470 | ) | ||
| Balance at December 31, 2018 | $ | 7,075 | ||
| Payment of Earn-out liability (1) | (2,371 | ) | ||
| Revaluations included in earnings | 6,396 | |||
| Balance as of December 31, 2019 | $ | 11,100 |
| (1) See Note 22 — “Commitments and Contingencies” for further details |
113
CLARIVATE ANALYTICS PLC
Notes to the Consolidated Financial Statements
(In thousands, except share and per share data, option prices, ratios or as noted)
The following table provides a summary of the Company’s assets and liabilities that were recognized at fair value on a recurring basis as at December 31, 2019 and 2018:
| December 31, 2019 | ||||||||||||||||
| Level 1 | Level 2 | Level 3 | Total Fair Value | |||||||||||||
| Assets | ||||||||||||||||
| Interest rate swap asset | $ | — | $ | — | $ | — | $ | — | ||||||||
| — | — | — | — | |||||||||||||
| Liabilities | ||||||||||||||||
| Interest rate swap liability | — | 2,778 | — | 2,778 | ||||||||||||
| Earn-out | — | — | 11,100 | 11,100 | ||||||||||||
| Total | $ | — | $ | 2,778 | $ | 11,100 | $ | 13,878 | ||||||||
| December 31, 2018 | ||||||||||||||||
| Level 1 | Level 2 | Level 3 | Total Fair Value | |||||||||||||
| Assets | ||||||||||||||||
| Interest rate swap asset | — | 3,644 | — | 3,644 | ||||||||||||
| — | 3,644 | — | 3,644 | |||||||||||||
| Liabilities | ||||||||||||||||
| Earn-out | — | — | 7,075 | 7,075 | ||||||||||||
| Total | $ | — | $ | — | $ | 7,075 | $ | 7,075 | ||||||||
Non-Financial Assets Valued on a Non-Recurring Basis
The Company’s long-lived assets, including goodwill, indefinite-lived intangible and finite-lived intangible assets subject to amortization, are measured at fair value on a non-recurring basis. These assets are measured at cost but are written-down to fair value, if necessary, as a result of impairment.
Finite-lived Intangible Assets - If a triggering event occurs, the Company determines the estimated fair value of finite-lived intangible assets by determining the present value of the expected cash flows.
Indefinite-lived Intangible Asset - If a qualitative analysis indicates that it is more likely than not that the estimated fair value is less than the carrying value of an indefinite-lived intangible asset, the Company determines the estimated fair value of the indefinite-lived intangible asset (trade name) by determining the present value of the estimated royalty payments on an after-tax basis that it would be required to pay the owner for the right to use such trade name. If the carrying amount exceeds the estimated fair value, an impairment loss is recognized in an amount equal to the excess.
Goodwill - Goodwill represents the difference between the purchase price and the fair value of the identifiable tangible and intangible net assets resulting from business combinations. The Company evaluates its goodwill for impairment at the reporting unit level, defined as an operating segment or one level below an operating segment, annually as of October 1 or more frequently if impairment indicators arise in accordance with ASC Topic 350. The Company performs qualitative analysis of macroeconomic conditions, industry and market considerations, internal cost factors, financial performance, fair value history and other company specific events. If this qualitative analysis indicates that it is more likely than not that the estimated fair value is less than the book value for the respective reporting unit, the Company applies a two-step impairment test in which the Company determines whether the estimated fair value of the reporting unit is in excess of its carrying value. If the carrying value of the net assets assigned to the reporting unit exceeds the estimated fair value of the reporting unit, the Company performs the second step of the impairment test to determine the implied estimated fair value of the reporting unit’s goodwill. The Company determines the implied estimated fair value of goodwill by determining the present value of the estimated future cash flows for each reporting unit and comparing the reporting unit’s risk profile and growth prospects to selected, reasonably similar publicly traded companies.
114
CLARIVATE ANALYTICS PLC
Notes to the Consolidated Financial Statements
(In thousands, except share and per share data, option prices, ratios or as noted)
Effective January 1, 2020, all assets, liabilities, and equity interest of the Brand Protection, AntiPiracy, and AntiFraud solutions of the MarkMonitor Product Line were sold to OpSec Security for a purchase price of $3,751, which approximates fair value of the assets as of December 31, 2019. To measure the amount of impairment related to the divestiture, the Company compared the fair values of assets and liabilities at the evaluation date to the carrying amounts as of December 31, 2019. The loss on impairment was $18,431 as of December 31, 2019. The sale of the Brand Protection, AntiPiracy, and AntiFraud solutions of the MarkMonitor Product Line assets and liabilities are categorized as Level 2 within the fair value hierarchy. The key assumption included the negotiated sales price of the assets and the assumptions of the liabilities. See Note 5 — “Assets Held for Sale and Divested Operations” for additional information.
Note 13: Pension and Other Post-Retirement Benefits
Retirement Benefits
Defined contribution plans
Employees participate in various defined contribution savings plans that provide for Company-matching contributions. Costs for future employee benefits are accrued over the periods in which employees earn the benefits. Total expense related to defined contribution plans was $12,143, $13,170 and $12,488 for the year ended December 31, 2019, 2018 and 2017, respectively, which approximates the cash outlays related to the plans.
Defined benefit plans
A limited number of employees participate in noncontributory defined benefit pension plans that are maintained in certain international markets. The plans are managed and funded to provide pension benefits to covered employees in accordance with local regulations and practices. The Company’s obligations related to the defined benefit pension plans is in Accrued expenses and other current liabilities and Other non-current liabilities.
115
CLARIVATE ANALYTICS PLC
Notes to the Consolidated Financial Statements
(In thousands, except share and per share data, option prices, ratios or as noted)
The following table presents the changes in projected benefit obligations, the plan assets, and the funded status of the defined benefit pension plans:
| December 31, | ||||||||
| 2019 | 2018 | |||||||
| Obligation and funded status: | ||||||||
| Change in benefit obligation | ||||||||
| Projected benefit obligation at beginning of year | $ | 14,486 | $ | 14,258 | ||||
| Service costs | 870 | 888 | ||||||
| Interest cost | 311 | 283 | ||||||
| Plan participant contributions | 114 | 109 | ||||||
| Actuarial losses | 1,492 | 29 | ||||||
| Divestiture | — | (138 | ) | |||||
| Benefit payments | (312 | ) | (274 | ) | ||||
| Expenses paid from assets | (36 | ) | (35 | ) | ||||
| Settlements | (89 | ) | — | |||||
| Curtailment | — | — | ||||||
| Effect of foreign currency translation | (273 | ) | (634 | ) | ||||
| Projected benefit obligation at end of year | $ | 16,563 | $ | 14,486 | ||||
| Change in plan assets | ||||||||
| Fair value of plan assets at beginning of year | $ | 5,184 | $ | 5,062 | ||||
| Actual return on plan assets | 198 | 95 | ||||||
| Settlements | (89 | ) | — | |||||
| Plan participant contributions | 113 | 109 | ||||||
| Employer contributions | 533 | 460 | ||||||
| Benefit payments | (312 | ) | (274 | ) | ||||
| Expenses paid from assets | (36 | ) | (35 | ) | ||||
| Effect of foreign currency translation | (104 | ) | (233 | ) | ||||
| Fair value of plan assets at end of year | 5,487 | 5,184 | ||||||
| Unfunded status | $ | (11,076 | ) | $ | (9,302 | ) | ||
The following table summarizes the amounts recognized in the Consolidated Balance Sheets related to the defined benefit pension plans:
| December 31, | ||||||||
| 2019 | 2018 | |||||||
| Current liabilities | $ | (635 | ) | $ | (443 | ) | ||
| Non-current liabilities | $ | (10,441 | ) | $ | (8,859 | ) | ||
| AOCI | $ | 470 | $ | (1,054 | ) | |||
116
CLARIVATE ANALYTICS PLC
Notes to the Consolidated Financial Statements
(In thousands, except share and per share data, option prices, ratios or as noted)
The following table provides information for those pension plans with an accumulated benefit obligation in excess of plan assets and projected benefit obligations in excess of plan assets:
| December 31, | ||||||||
| 2019 | 2018 | |||||||
| Plans with accumulated benefit obligation in excess of plan assets: | ||||||||
| Accumulated benefit obligation | $ | 15,465 | $ | 13,605 | ||||
| Fair value of plan assets | $ | 5,487 | $ | 5,184 | ||||
| Plans with projected benefit obligation in excess of plan assets: | ||||||||
| Projected benefit obligation | $ | 16,563 | $ | 14,486 | ||||
| Fair value of plan assets | $ | 5,487 | $ | 5,184 | ||||
The components of net periodic benefit cost changes in plan assets and benefit obligations recognized as follows:
| December 31, | ||||||||||||
| 2019 | 2018 | 2017 | ||||||||||
| Service cost | $ | 870 | $ | 888 | $ | 442 | ||||||
| Interest cost | 311 | 283 | 168 | |||||||||
| Expected return on plan assets | (157 | ) | (150 | ) | — | |||||||
| Amortization of actuarial gains | (76 | ) | (78 | ) | (4 | ) | ||||||
| Settlement | 7 | — | — | |||||||||
| Net periodic benefit cost | $ | 955 | $ | 943 | $ | 606 | ||||||
The following table presents the weighted-average assumptions used to determine the net periodic benefit cost as of:
| December 31, | ||||||||
| 2019 | 2018 | |||||||
| Discount rate | 2.26 | % | 2.31 | % | ||||
| Expected return on plan assets | 3.00 | % | 3.00 | % | ||||
| Rate of compensation increase | 3.68 | % | 3.76 | % | ||||
| Social Security increase rate | 2.50 | % | 2.50 | % | ||||
| Pension increase rate | 1.80 | % | 1.80 | % | ||||
117
CLARIVATE ANALYTICS PLC
Notes to the Consolidated Financial Statements
(In thousands, except share and per share data, option prices, ratios or as noted)
The following table presents the weighted-average assumptions used to determine the benefit obligations as of:
| December 31, | ||||||||
| 2019 | 2018 | |||||||
| Discount rate | 1.60 | % | 2.26 | % | ||||
| Rate of compensation increase | 3.77 | % | 3.68 | % | ||||
| Social Security increase rate | 2.50 | % | 2.50 | % | ||||
| Pension increase rate | 1.80 | % | 1.80 | % | ||||
The Company determines the assumptions used to measure plan liabilities as of the December 31 measurement date.
The discount rate represents the interest rate used to determine the present value of the future cash flows currently expected to be required to settle the Company’s defined benefit pension plan obligations. The discount rates are derived using weighted average yield curves on corporate bonds. The cash flows from the Company’s expected benefit obligation payments are then matched to the yield curve to derive the discount rates. At December 31, 2019, the discount rates ranged from 0.45% to 6.45% for the Company’s pension plan and postretirement benefit plan. At December 31, 2018, the discount rates ranged from 0.40% to 7.10% for the Company’s pension plan and postretirement benefit plan.
Plan Assets
The general investment objective for our plan assets is to obtain a rate of investment return consistent with the level of risk being taken and to earn performance rates of return as required by local regulations for our defined benefit plans. For such plans, the strategy is to invest primarily 100% in insurance contracts. Plan assets held in insurance contracts do not have target asset allocation ranges. The expected long-term return on plan assets is estimated based off of historical and expected returns. As of December 31, 2019, the expected weighted-average long-term rate of return on plan assets was 3%.
The fair value of our plan assets and the respective level in the far value hierarchy by asset category is as follows:
| December 31, 2019 | December 31, 2018 | |||||||||||||||||||||||||||||||
| Level 1 | Level 2 | Level 3 | Total Assets | Level 1 | Level 2 | Level 3 | Total Assets | |||||||||||||||||||||||||
| Fair value measurement of pension plan assets: | ||||||||||||||||||||||||||||||||
| Insurance contract | $ | — | — | 5,487 | $ | 5,487 | $ | — | — | 5,184 | $ | 5,184 | ||||||||||||||||||||
The fair value of the insurance contracts is an estimate of the amount that would be received in an orderly sale to a market participant at the measurement date. The amount the plan would receive from the contract holder if the contracts were terminated is the primary input and is unobservable. The insurance contracts are therefore classified as Level 3 investments.
The following table provides the estimated pension benefit payments that are payable from the plans to participants as of December 31, 2019 for the following years:
| 2020 | $ | 677 | ||
| 2021 | 550 | |||
| 2022 | 707 | |||
| 2023 | 851 | |||
| 2024 | 829 | |||
| 2025 to 2029 | 4,943 | |||
| Total | $ | 8,557 |
Based on the current status of our defined benefit obligations, we expect to make payments in the amount of $401 to fund these plans in 2020. However, this estimate may change based on future regulatory changes.
118
CLARIVATE ANALYTICS PLC
Notes to the Consolidated Financial Statements
(In thousands, except share and per share data, option prices, ratios or as noted)
Note 14: Debt
The following is a summary of the Company’s debt:
| December 31, 2019 | December 31, 2018 | |||||||||||||||||
| Type | Maturity | Effective Interest Rate | Carrying Value | Effective Interest Rate | Carrying Value | |||||||||||||
| Senior Secured Notes (2026) | 2026 | 4.500 | % | $ | 700,000 | — | % | $ | — | |||||||||
| Senior Unsecured Notes (2024) | 2024 | — | % | — | 7.875 | % | 500,000 | |||||||||||
| Term Loan Facility (2026) | 2026 | 5.049 | % | 900,000 | — | % | — | |||||||||||
| Term Loan Facility (2023) | 2023 | — | % | — | 5.729 | % | 1,483,993 | |||||||||||
| The Revolving Credit Facility | 2024 | 5.049 | % | 65,000 | — | % | — | |||||||||||
| The Revolving Credit Facility | 2021 | — | % | — | 5.754 | % | 5,000 | |||||||||||
| The Revolving Credit Facility | 2021 | — | % | — | 5.729 | % | 40,000 | |||||||||||
| Total debt outstanding | 1,665,000 | 2,028,993 | ||||||||||||||||
| Debt issuance costs | (25,205 | ) | (34,838 | ) | ||||||||||||||
| Term Loan Facility, discount | (2,184 | ) | (3,633 | ) | ||||||||||||||
| Short-term debt, including current portion of long-term debt | (9,000 | ) | (60,345 | ) | ||||||||||||||
| Long-term debt, net of current portion and debt issuance costs | $ | 1,628,611 | $ | 1,930,177 | ||||||||||||||
The loans were priced at market terms and collectively have a weighted average interest rate and term of 4.818% and 6.259% for the year ended December 31, 2019 and 2018, respectively.
Financing Transactions
Senior Secured Notes due 2026
On October 31, 2019, we closed a private placement offering of $700,000 in aggregate principal amount of Senior Secured Notes (“Notes”) due 2026 bearing interest at 4.50% per annum, payable semi-annually to holders of record in May and November. The first interest payment will be made May 2020. The Notes due 2026 were issued by Camelot Finance S.A., an indirect wholly-owned subsidiary of Clarivate, and are secured on a first-lien pari passu basis with borrowings under the Credit Facilities. These Notes are guaranteed on a joint and several basis by certain Clarivate subsidiaries. The Notes will be general senior secured obligations of the Issuer and will be secured on a first-priority basis by the collateral now owned or hereafter acquired by the Issuer and each of the Guarantors that secures the Issuer’s and such Guarantor’s obligations under the New Senior Credit Facility (subject to permitted liens and other exceptions).
We used the net proceeds from the offering of the Notes due 2026, together with proceeds from the $900,000 Term Loan Facility and a $250,000 Revolving Credit Facility with a $40,000 letter of credit sublimit, collectively the “Credit Facilities” discussed below to, among other things, redeem the 7.875% senior notes due 2024 issued by Camelot Finance S.A. (“Prior Notes”) in full, refinance all amounts outstanding under the $175,000 revolving credit facility which was governed by the credit agreement dated as of October 3, 2016 (“Prior Revolving Credit Facility”) and the $1,550,000 term loan facility (“Prior Term Loan Facility”), collectively the “Prior Credit Facilities”, fund in full the TRA Termination Payment pursuant to the TRA Buyout Agreement and pay fees and expenses related to the foregoing. We redeemed the Prior Notes at a fixed price of 103.938%, plus accrued and unpaid interest to the date of the purchase. The total loss on the extinguishment of debt, including the transactions noted below, was $3,179.
119
CLARIVATE ANALYTICS PLC
Notes to the Consolidated Financial Statements
(In thousands, except share and per share data, option prices, ratios or as noted)
The Notes are subject to redemption as a result of certain changes in tax laws or treaties of (or their interpretation by) a relevant taxing jurisdiction at 100% of the principal amount, plus accrued and unpaid interest to the date of redemption, and upon certain changes in control at 101% of the principal amount, plus accrued and unpaid interest to the date of purchase. Additionally, at the Company’s election the Notes may be redeemed (i) prior to November 1 , 2022 at a redemption price equal to 100% of the aggregate principal amount of Notes being redeemed plus a “make-whole” premium, plus accrued and unpaid interest to the date of redemption or (ii) prior to November 1, 2022, the Company may use funds in an aggregate amount not exceeding the net cash proceeds of one or more specified equity offerings to redeem up to 40% of the aggregate principal amount of the Notes at a redemption price equal to 104.500% of the aggregate principal amount of the Notes being redeemed, plus accrued and unpaid interest and additional amounts to the date of redemption provided that at least 50% of the original aggregate principal amount of the Notes issued on the Closing Date remains outstanding after the redemption (or all Notes are redeemed substantially concurrently) and the redemption occurs within 120 days of the date of the closing of such equity offering or (iii) on November 1, 2022 of each of the years referenced below based on the call premiums listed below, plus accrued and unpaid interest to the date of redemption.
| Period | Redemption Price (as a percentage of principal) | |||
| 2022 | 102.250 | % | ||
| 2023 | 101.125 | % | ||
| 2024 and thereafter | 100.000 | % | ||
The Indenture governing the senior secured notes due 2026 contains covenants which, among other things, limit the incurrence of additional indebtedness (including acquired indebtedness), issuance of certain preferred stock, the payment of dividends, making restricted payments and investments, the purchase or acquisition or retirement for value of any equity interests, the provision of loans or advances to restricted subsidiaries, the sale or lease or transfer of any properties to any restricted subsidiaries, the transfer or sale of assets, and the creation of certain liens. As of December 31, 2019, we were in compliance with the indenture covenants.
Credit Facilities
On October 31, 2019, we entered into the Credit Facilities. The Credit Facilities consist of a $900,000 Term Loan Facility, which was fully drawn at closing, and a $250,000 Revolving Credit Facility with a $40,000 letter of credit sublimit, which was undrawn at closing. The Revolving Credit Facility carries an interest rate at LIBOR plus 3.25% per annum or Prime plus a margin of 2.25% per annum, as applicable depending on the borrowing, and matures on October 31, 2024. The Revolving Credit Facility interest rate margins will decrease upon the achievement of certain first lien net leverage ratios (as the term is used in the Credit Agreement). The Term Loan Facility matures on October 31, 2026. Principal repayments under the Term Loan Facility are due quarterly in an amount equal to 0.25% of the aggregate outstanding principal amount borrowed under the Term Loan Facility on October 31, 2019 and on the maturity date, in an amount equal to the aggregate outstanding principal amount on such date, together in each case, with accrued and unpaid interest. The Prior Credit facility and Prior Notes were replaced by the Credit Facility and Notes. $41,980 of old unamortized discount and fees were written off as part of the restructuring, and of the new costs incurred under the Credit Facility and the Notes, $17 was expensed and $25,818 was deferred.
Borrowings under the Credit Facility bear interest at a floating rate which can be, at our option, either (i) a Eurocurrency rate plus an applicable margin or (ii) an alternate base rate (equal to the highest of (i) the rate which Bank of America, N.A. announces as its prime lending rate, (ii) the Federal Funds Effective Rate plus one-half of 1.00% and (iii) the Eurocurrency rate for an interest period of one month for loans denominated in dollars plus 1.00% plus an applicable margin, in either case, subject to a Eurocurrency rate floor of 0.00%. Commencing with the last day of the first full quarter ending after the closing date of the Credit Facilities, the Term Loan Facility will amortize in equal quarterly installments in an amount equal to 1.00% per annum of the original par principal amount thereof, with the remaining balance due at final maturity.
120
CLARIVATE ANALYTICS PLC
Notes to the Consolidated Financial Statements
(In thousands, except share and per share data, option prices, ratios or as noted)
The Credit Facilities are secured by substantially all of our assets and the assets of all of our U.S. restricted subsidiaries and certain of our non-U.S. subsidiaries, including those that are or may be borrowers or guarantors under the Credit Facilities, subject to customary exceptions. The Credit Agreement governing the Credit Facilities contains customary events of default and restrictive covenants that limit us from, among other things, incurring certain additional indebtedness, issuing preferred stock, making certain restricted payments and investments, certain transfers or sales of assets, entering into certain affiliate transactions or incurring certain liens.
The Credit Facilities provide that, upon the occurrence of certain events of default, our obligations thereunder may be accelerated and the lending commitments terminated. Such events of default include payment defaults to the lenders, material inaccuracies of representations and warranties, covenant defaults, cross-defaults to other material indebtedness (including the senior secured notes due 2026), voluntary and involuntary bankruptcy proceedings, material money judgments, loss of perfection over a material portion of collateral, material ERISA/pension plan events, certain change of control events and other customary events of default, in each case subject to threshold, notice and grace period provisions.
The Revolving Credit Facility provides for revolving loans, same-day borrowings and letters of credit pursuant to commitments in an aggregate principal amount of $250,000 with a letter of credit sublimit of $40,000. Proceeds of loans made under the Revolving Credit Facility may be borrowed, repaid and reborrowed prior to the maturity of the Revolving Credit Facility. Our ability to draw under the Revolving Credit Facility or issue letters of credit thereunder will be conditioned upon, among other things, delivery of required notices, accuracy of the representations and warranties contained in the Credit Agreement and the absence of any default or event of default under the Credit Agreement.
With respect to the Credit Facilities, the Company may be subject to certain negative covenants, including either a fixed charge coverage ratio, total first lien net leverage ratio, or total net leverage ratio if certain conditions are met. These conditions were not met and the Company was not required to perform these covenants as of December 31, 2019 .
The obligations of the borrowers under the Credit Agreement are guaranteed by UK Holdco and certain of its restricted subsidiaries and are collateralized by substantially all of UK Holdco’s and certain of its restricted subsidiaries’ assets (with customary exceptions described in the Credit Agreement). UK Holdco and its restricted subsidiaries are subject to certain covenants including restrictions on UK Holdco’s ability to pay dividends, incur indebtedness, grant a lien over its assets, merge or consolidate, make investments, or make payments to affiliates.
As of December 31, 2019, letters of credit totaling $3,918 were collateralized by the Revolving Credit Facility. Notwithstanding the Revolving Credit Facility, as of December 31, 2019 the Company had an unsecured corporate guarantee outstanding for $9,646 and cash collateralized letters of credit totaling $37, all of which were not collateralized by the Revolving Credit Facility. The Company borrowed $65,000 and $45,000 against the Revolving Credit Facility as of December 31, 2019 and 2018, respectively, to support current operations. The Company’s cash from operations is expected to meet repayment needs for the next twelve months.
121
CLARIVATE ANALYTICS PLC
Notes to the Consolidated Financial Statements
(In thousands, except share and per share data, option prices, ratios or as noted)
Amounts due under all of the outstanding borrowings as of December 31, 2019 for the next five years are as follows:
| 2020 | $ | 9,000 | ||
| 2021 | 9,000 | |||
| 2022 | 9,000 | |||
| 2023 | 9,000 | |||
| 2024 | 74,000 | |||
| Thereafter | 1,555,000 | |||
| Total maturities | 1,665,000 | |||
| Less: capitalized debt issuance costs and original issue discount | (27,389 | ) | ||
| Total debt outstanding as of December 31, 2019 | $ | 1,637,611 |
122
CLARIVATE ANALYTICS PLC
Notes to the Consolidated Financial Statements
(In thousands, except share and per share data, option prices, ratios or as noted)
Note 15: Revenue
Disaggregated Revenues
The tables below show the Company’s disaggregated revenue for the periods presented:
| Year ended December 31, | ||||||||||||
| 2019 | 2018 | 2017 | ||||||||||
| Subscription revenues | $ | 805,518 | $ | 794,097 | $ | 785,717 | ||||||
| Transactional revenues | 169,265 | 177,523 | 181,590 | |||||||||
| Total revenues, gross | 974,783 | 971,620 | 967,307 | |||||||||
| Deferred revenues adjustment(1) | (438 | ) | (3,152 | ) | (49,673 | ) | ||||||
| Total Revenues, net | $ | 974,345 | $ | 968,468 | $ | 917,634 | ||||||
(1) This accounting adjustment relates to the 2016 Transaction, which included a revaluation of deferred revenues to account for the difference in value between the customer advances retained by the Company upon the consummation of the 2016 Transaction and our outstanding performance obligations related to those advances.
Cost to Obtain a Contract
The Company has prepaid sales commissions included in both Prepaid expenses and Other non-current assets on the balance sheets. The amount of prepaid sales commissions included in Prepaid expenses was $12,387 and $10,407 as of December 31, 2019 and 2018, respectively. The amount of prepaid sales commissions included in Other non-current assets was $11,620 and $9,493 as of December 31, 2019 and 2018, respectively. The Company has not recorded any impairments against these prepaid sales commissions.
Contract Balances
| Accounts receivable, net | Current portion of deferred revenues | Non-current portion of deferred revenues | ||||||||||
| Opening (1/1/2019) | $ | 331,295 | $ | 391,102 | $ | 17,112 | ||||||
| Closing (12/31/2019) | 333,858 | 407,325 | 19,723 | |||||||||
| (Increase)/decrease | $ | (2,563 | ) | $ | (16,223 | ) | $ | (2,611 | ) | |||
| Opening (1/1/2018) | $ | 317,808 | $ | 361,260 | $ | 15,796 | ||||||
| Closing (12/31/2018) | 331,295 | 391,102 | 17,112 | |||||||||
| (Increase)/decrease | $ | (13,487 | ) | $ | (29,842 | ) | $ | (1,316 | ) | |||
| Opening (1/1/2017) | $ | 361,586 | $ | 333,944 | $ | 18,602 | ||||||
| Closing (12/31/2017) | 317,808 | 361,260 | 15,796 | |||||||||
| (Increase)/decrease | $ | 43,778 | $ | (27,316 | ) | $ | 2,806 | |||||
The amounts of revenue recognized in the period that were included in the opening deferred revenues balances were $391,102, $361,260, and $333,944, for years ended 2019, 2018, and 2017, respectively. This revenue consists primarily of subscription revenue.
123
CLARIVATE ANALYTICS PLC
Notes to the Consolidated Financial Statements
(In thousands, except share and per share data, option prices, ratios or as noted)
Transaction Price Allocated to the Remaining Performance Obligation
As of December 31, 2019, approximately $63,100 of revenue is expected to be recognized in the future from remaining performance obligations, excluding contracts with durations of one year or less. The Company expects to recognize revenue on approximately 65.8% of these performance obligations over the next 12 months. Of the remaining 34.2%, 22.1% is expected to be recognized within the following year, with the final 12.1% expected to be recognized within years three to 10.
Note 16: Shareholders’ Equity
Shareholders’ Equity
Pre-2019 Transaction
In March 2017, the Company formed the Management Incentive Plan under which certain employees of the Company may be eligible to purchase shares of the Company. In exchange for each share purchase subscription, the purchaser is entitled to a fully vested right to an ordinary share. Additionally, along with a subscription, employees receive a corresponding number of options to acquire additional ordinary shares subject to five year vesting. See Note 17 – “Employment and Compensation Arrangements” for additional detail related to the options. The Company received net subscriptions for 198,602 shares during the year ended December 31, 2018. There were no share subscriptions received prior to or following the close of the 2019 Transaction as of December 31, 2019.
Post-2019 Transaction
Immediately prior to the closing of the 2019 Transaction, there were 87,749,999 shares of Churchill common stock issued and outstanding, consisting of (i) 68,999,999 public shares (Class A) and (ii) 18,750,000 founder shares (Class B). On May 13, 2019, in connection with the 2019 Transaction, all of the Class B common stock converted into Class A common stock of the post-combination company on a one-for-one basis, and effect the reclassification and conversion of all of the Class A common stock and Class B common stock into a single class of common stock of Clarivate Analytics PLC. One stockholder elected to have one share redeemed in connection with the 2019 Transaction.
In June 2019, the Company formed the 2019 Incentive Award Plan under which employees of the Company may be eligible to purchase shares of the Company. See Note 17 – “Employment and Compensation Arrangements” for additional detail related to the 2019 Incentive Award Plan. In exchange for each share subscription purchased, the purchaser is entitled to a fully vested right to an ordinary share. At December 31, 2019 there were unlimited shares of common stock authorized, and 306,874,115 shares issued and outstanding, with a par value of $0.00. The Company did not hold any shares as treasury shares as of December 31, 2019 or December 31, 2018. The Company’s common stockholders are entitled to one vote per share.
124
CLARIVATE ANALYTICS PLC
Notes to the Consolidated Financial Statements
(In thousands, except share and per share data, option prices, ratios or as noted)
Warrants
Upon consummation of the 2019 Transaction, the Company has warrants outstanding to purchase an aggregate of 52,800,000 ordinary shares. Each outstanding whole warrant of Churchill represents the right to purchase one ordinary share of the Company in lieu of one share of Churchill common stock upon closing of the 2019 Transaction at a price of $11.50 per share, subject to adjustment as discussed below, at any time commencing upon the later of (i) 30 days after the completion of the 2019 Transaction and (ii) September 11, 2019. The holder does not have the right to exercise the Warrants to the extent that they would beneficially own in excess of 4.9% or 9.8% (as specified by the holder) of the shares of common stock outstanding immediately after giving effect to such exercise. As of December 31, 2019, 100,114 warrants had been exercised.
Merger Shares
Upon consummation of the 2019 Transaction, there were 7,000,000 ordinary shares of Clarivate that are issuable to persons designated by Messrs. Stead and Klein, including themselves, if the last sale price of Clarivate’s ordinary shares is at least $20.00 for 40 days over a 60 consecutive trading day period on or before the sixth anniversary of the closing of the 2019 Transaction. On January 31, 2020, our Board agreed to waive this performance vesting condition, and all such merger shares are expected to be issued to persons designated by Messrs. Stead and Klein on or prior to December 31, 2020.
125
CLARIVATE ANALYTICS PLC
Notes to the Consolidated Financial Statements
(In thousands, except share and per share data, option prices, ratios or as noted)
Note 17: Employment and Compensation Arrangements
Employee Incentive Plans
Prior to the 2019 Transaction, the Company operated under its 2016 Equity Incentive Plan, which provided for certain employees of the Company to be eligible to participate in equity ownership in the Company. On May 8, 2019, in anticipation of the 2019 Transaction, the Board adopted the 2019 Incentive Award Plan, which was an amendment, restatement and continuation of the 2016 Equity Incentive Plan. Upon closing of the 2019 Transaction, awards under the 2016 Equity Incentive Plan were converted using the exchange ratio established during the 2019 Transaction and assumed into the 2019 Incentive Award Plan (See Note 4 – “Business Combinations”). The 2019 Incentive Award Plan permits the granting of awards in the form of incentive stock options, non-qualified stock options, share appreciation rights, restricted shares, restricted share units and other stock-based or cash based awards. Equity awards may be issued in the form of restricted shares or restricted share units with dividend rights or dividend equivalent rights subject to vesting terms and conditions specified in individual award agreements. The Company’s Management Incentive Plan provides for employees of the Company to be eligible to purchase shares of the Company. See Note 16 – “Shareholders’ Equity” for additional information.
A maximum aggregate amount of 60,000,000 ordinary shares are reserved for issuance under the 2019 Incentive Award Plan. Equity awards under the 2019 Incentive Award Plan may be issued in the form of options to purchase shares of the Company which are exercisable upon the occurrence of conditions specified within individual award agreements. As of December 31, 2019 and 2018, 37,302,599 and 35,475,302, respectively, awards have not been granted.
Total share-based compensation expense included in the Consolidated Statements of Operations amounted to $51,383, $13,715, and $17,663 for the years ended December 31, 2019, 2018, and 2017, respectively. The total associated tax benefits recognized amounted to $751, $2,740, and $3,192 for the years ended December 31, 2019, 2018, and 2017, respectively.
The Company’s Management Incentive Plan provides for certain employees of the Company to be eligible to purchase shares of the Company. See Note 16 – “Shareholders’ Equity” for additional information. Along with each subscription, employees may receive a corresponding number of options to acquire additional ordinary shares subject to five year vesting.
As of December 31, 2019 and 2018, there was $6,873 and $19,637, respectively, of total unrecognized compensation cost, related to outstanding stock options, which is expected to be recognized through 2024 with a remaining weighted-average service period of 2.6 years.
126
CLARIVATE ANALYTICS PLC
Notes to the Consolidated Financial Statements
(In thousands, except share and per share data, option prices, ratios or as noted)
Stock Options
The Company’s stock option activity is summarized below:
| Number of Options | Weighted Average Exercise Price per Share | Weighted Average Remaining Contractual Life | Aggregate Intrinsic Value | |||||||||||||
| Outstanding as of December 31, 2018 | 185,601 | $ | 1,587.00 | 8.5 | $ | 13,293 | ||||||||||
| 2019 Transaction Related Modified options | 24,339,097 | — | — | — | ||||||||||||
| Balance at December 31, 2018, as modified | 24,524,698 | 12.44 | 8.5 | 13,293 | ||||||||||||
| Granted | 2,321,348 | 17.55 | 7.7 | 5,431 | ||||||||||||
| Expired | (463,919 | ) | 11.47 | — | — | |||||||||||
| Forfeited | (2,840,539 | ) | 12.97 | — | — | |||||||||||
| Modified | (244,829 | ) | 13.36 | |||||||||||||
| Exercised | (2,416,534 | ) | 6.63 | — | — | |||||||||||
| Outstanding as of December 31, 2019 | 20,880,225 | $ | 12.18 | 7.3 | $ | 105,119 | ||||||||||
| Vested and exercisable at December 31, 2019 | 16,110,638 | $ | 11.12 | 7.0 | $ | 94,181 | ||||||||||
As noted above, options issued and outstanding under the 2016 Equity Incentive Plan prior to the 2019 Transaction were converted to options under the 2019 Incentive Award Plan through the Exchange Ratio established in the 2019 Transaction (See Note 4 – “Business Combinations”). The 24,339,097 of options modified in the above table represent this share conversion. The Company did not recognize any additional expense for the modification of shares related to the 2019 Transaction. The terms to certain stock option awards were amended, and the Company recognized $11,640 of Share-based compensation expense related to the incremental increase in fair value of the amended awards in the year ending December 31, 2019.
The aggregate intrinsic value in the table above represents the difference between the Company’s most recent valuation and the exercise price of each in-the-money option on the last day of the period presented. As of December 31, 2019, 2,416,534 stock options were exercised. No stock options were exercised in the years ended December 31, 2018. The total intrinsic value of stock options exercised during the year ended December 31, 2019 was approximately $25,123.
The Company accounts for awards issued under the 2019 Incentive Award Plan as additional contributions to equity. Share-based compensation includes expense associated with stock option grants which is estimated based on the grant date fair value of the award issued. Share-based compensation expense related to stock options is recognized over the vesting period of the award which is generally five years, on a graded-scale basis. The weighted-average fair value of options granted per share was $2.94 and $1.87 as of December 31, 2019 and 2018, respectively.
The Company uses the Black-Scholes option pricing model to estimate the fair value of options granted. The Black-Scholes model takes into account the fair value of an ordinary share and the contractual and expected term of the stock option, expected volatility, dividend yield, and risk-free interest rate. Prior to becoming a public company, the fair value of the Company’s ordinary shares were determined utilizing an external third-party pricing specialist.
The contractual term of the option ranges from the one year to 10 years. Expected volatility is the average volatility over the expected terms of comparable public entities from the same industry. The risk-free interest rate is based on a treasury rate with a remaining term similar to the contractual term of the option. The Company is recently formed and at this time does not expect to distribute any dividends. The Company recognizes forfeitures as they occur.
127
CLARIVATE ANALYTICS PLC
Notes to the Consolidated Financial Statements
(In thousands, except share and per share data, option prices, ratios or as noted)
The assumptions used to value the Company’s options granted during the period presented and their expected lives were as follows:
| December 31, | ||||||||||||
| 2019 | 2018 | 2017 | ||||||||||
| Weighted-average expected dividend yield | — | % | — | % | — | % | ||||||
| Expected volatility | 19.52 - 20.26 | % | 21.00 - 23.05 | % | 24.84%-27.90 | % | ||||||
| Weighted-average expected volatility | 19.87 | % | 21.86 | % | 27.50 | % | ||||||
| Weighted-average risk-free interest rate | 2.43 | % | 3.02 | % | 2.53 | % | ||||||
| Expected life (in years) | 7.3 | 8.5 | 9.0 | |||||||||
Restricted Stock Units (“RSUs”)
RSUs typically vest from one to three years and are generally subject to either cliff vesting or graded vesting. RSUs do not have nonforfeitable rights to dividends or dividend equivalents. The fair value of RSUs is typically based on the fair value of our common shares on the date of grant. We amortize the value of these awards to expense over the vesting period on a graded-scale basis. The Company recognizes forfeitures as they occur.
| Number of Shares | Weighted Average Grant Date Fair Value per Share | |||||||
| Outstanding as of December 31, 2018 | — | $ | — | |||||
| Granted | 327,398 | 16.66 | ||||||
| Vested | (34,216 | ) | 15.90 | |||||
| Outstanding as of December 31, 2019 | 293,182 | $ | 16.75 | |||||
The total fair value of RSUs that vested during the year ended December 31, 2019 was $544.
2019 Transaction Related Awards
The Sponsor Agreement provided that certain ordinary shares of Clarivate available for distribution to persons designated in the Sponsor Agreement in connection with the 2019 Transaction, and certain Clarivate warrants available for distribution to such persons, in each case, were subject to certain time and performance-based vesting provisions described below. In addition, the sponsor agreement provided that the merger shares were granted and are issuable to persons designated by Messrs. Stead and Klein, including themselves, in accordance with the terms in the sponsor agreement. See Note 16 – “Shareholders’ Equity” for details on the respective awards.
The vesting conditions added to certain ordinary shares include the following:
5,309,713 ordinary shares of Clarivate held by persons designated in the Sponsor Agreement, will vest in three equal annual installments on the first, second and third anniversaries of the closing of the 2019 Transaction, respectively, and are not contingent on continuing or future service of the respective holders to the Company.
2,654,856 ordinary shares of Clarivate held by such persons will vest at such time as the last sale price of Clarivate’s ordinary shares is at least $15.25 on or before the date that is 42 months after the closing of the 2019 Transaction; provided that none of such Clarivate ordinary shares will vest prior to the first anniversary of the closing of the 2019 Transaction, not more than 1/3 of such Clarivate warrants will vest prior to the second anniversary of the closing of the 2019 Transaction, and not more than 2/3 of such Clarivate warrants will vest prior to the third anniversary of the closing of the 2019 Transaction. Further, such vesting is not contingent on continuing or future service of the respective holders to the Company.
2,654,856 ordinary shares of Clarivate held by such persons will vest at such time as the last sale price of Clarivate’s ordinary shares is at least $17.50 on or before the fifth anniversary of the closing of the 2019 Transaction; provided that none of such Clarivate ordinary shares will vest prior to the first anniversary of the closing of the 2019 Transaction, not more than 1/3 of such Clarivate warrants will vest prior to the second anniversary of the closing of the 2019 Transaction, and not more than 2/3 of such Clarivate warrants will vest prior to the third anniversary of the closing of the 2019 Transaction. Further, such vesting is not contingent on continuing or future service of the respective holders to the Company.
128
CLARIVATE ANALYTICS PLC
Notes to the Consolidated Financial Statements
(In thousands, except share and per share data, option prices, ratios or as noted)
The vesting conditions added to certain warrants include the following:
17,265,826 of certain warrants held by persons designated in the Sponsor Agreement, will vest at such time as the last sale price of Clarivate’s ordinary shares is at least $17.50 on or before the fifth anniversary of the closing of the 2019 Transaction; provided that none of such Clarivate warrants will vest prior to the first anniversary of the closing of the 2019 Transaction, not more than 1/3 of such Clarivate warrants will vest prior to the second anniversary of the closing of the 2019 Transaction, and not more than 2/3 of such Clarivate warrants will vest prior to the third anniversary of the closing of the 2019 Transaction. Further, such vesting is not contingent on continuing or future service of the respective holders to the Company.
In considering the terms of the transaction related awards, the Company notes that the time based vesting restrictions were not conditioned on any continuing or future service of the holders to the Company, and reflect “lock-up” periods of the issuable shares. Further, the above mentioned performance-based restrictions were considered market conditions pursuant to ASC 718, and are contemplated in the value of the awards. As such vesting restrictions were contemplated in conjunction with the granting of the merger shares (See Note 16 – “Shareholders’ Equity”), the Company considered such terms of the total basket of transaction awards in determination of the fair value of the awards. As no continued or future service was required by the holders of such awards, the Company recognized compensation expense in the second quarter based on the fair value of such awards upon closing of the 2019 Transaction. The Company recognized $25,013 expense, net in Share-based compensation expense as of the date of the 2019 Transaction in accordance with the issuance of the merger shares offset by the addition of vesting terms to certain ordinary shares and warrants, as described above. The expense included the increases in value of $48,102 for the granting of merger shares, the increase in value of $1,193 for ordinary shares with only time vesting conditions, and the increase in value of shares purchased by the Founders immediately prior to the transaction of $4,411, all offset by the reduction in value of $9,396 for ordinary shares with performance vesting condition of $15.25, the reduction in value of $13,101 for ordinary shares with performance vesting condition of $17.50 and the reduction in value of $6,297 related to warrants. Pursuant to the Sponsor Agreement, certain founders of Churchill Capital Corp purchased an aggregate of 1,500,000 shares of Class B common stock of Churchill immediately prior to the closing of the 2019 Transaction for an aggregate purchase price of $15,000.
We used a third-party specialist to fair value the awards at the 2019 Transaction close date of May 13, 2019 using the Monte Carlo simulation approach. The assumptions included in the model include, but are not limited to, risk-free interest rate, 2.20%; expected volatility of the Company’s and the peer group’s stock prices, 20.00%; and dividend yield, 0.00%. A discount for lack or marketability (“DLOM”) was applied to shares that are subject to remaining post vesting lock up restrictions. The DLOM was between 3% - 7% dependent on the length of the post vesting restriction period.
On August 14, 2019, Clarivate (on its behalf and on behalf of its subsidiaries) agreed to waive the performance and time vesting conditions, described above, subject to the consummation of the secondary offering. These shares and warrants nevertheless remain subject to a lock-up for a period ranging from two to three years following the closing of the Mergers. We used a third-party specialist to fair value the awards at the modification date using the Monte Carlo simulation approach. The assumptions included in the model include, but are not limited to, risk-free interest rate, 1.42%; expected volatility of the Company’s and the peer group’s stock prices, 20.00%; and dividend yield, 0.00%. A discount for lack or marketability (“DLOM”) was applied to shares that are subject to remaining post vesting lock up restrictions. The DLOM was between 3% - 7% dependent on the length of the post vesting restriction period. Waiving the performance and time vesting conditions resulted in an immaterial impact to the Consolidated Statements of Operations.
In accordance with the terms of the sponsor agreement and in connection with our merger with Churchill in 2019, the merger shares are issued to persons designated by Messrs. Stead and Klein, and such designated merger shares will be issued on or prior to December 31, 2020. The Company has evaluated and recorded additional stock compensation expense as required upon the assignment of merger shares as applicable.
129
CLARIVATE ANALYTICS PLC
Notes to the Consolidated Financial Statements
(In thousands, except share and per share data, option prices, ratios or as noted)
Note 18: Income Taxes
Income tax (benefit)/expense on income/(loss) analyzed by jurisdiction is as follows:
| Year ended December 31, | ||||||||||||
| 2019 | 2018 | 2017 | ||||||||||
| Current | ||||||||||||
| U.K. | $ | 677 | $ | 1,014 | $ | (142 | ) | |||||
| U.S. Federal | 6,917 | 6,395 | 5,202 | |||||||||
| U.S. State | 988 | 2,146 | 833 | |||||||||
| Other | 9,959 | 11,061 | 8,552 | |||||||||
| Total current | 18,541 | 20,616 | 14,445 | |||||||||
| Deferred | ||||||||||||
| U.K. | — | 85 | (427 | ) | ||||||||
| U.S. Federal | (824 | ) | (5,465 | ) | (10,648 | ) | ||||||
| U.S. State | (223 | ) | (227 | ) | (142 | ) | ||||||
| Other | (7,293 | ) | (9,360 | ) | (24,521 | ) | ||||||
| Total deferred | (8,340 | ) | (14,967 | ) | (35,738 | ) | ||||||
| Total provision (benefit) for income taxes | $ | 10,201 | $ | 5,649 | $ | (21,293 | ) | |||||
The components of pre-tax loss are as follows:
| Year ended December 31, | ||||||||||||
| 2019 | 2018 | 2017 | ||||||||||
| U.K. loss | $ | (199,032 | ) | $ | (222,043 | ) | $ | (211,944 | ) | |||
| U.S. income (loss) | 3,733 | (11,880 | ) | (58,054 | ) | |||||||
| Other loss | (5,477 | ) | (2,590 | ) | (15,225 | ) | ||||||
| Pre-tax loss | $ | (200,776 | ) | $ | (236,513 | ) | $ | (285,223 | ) | |||
130
CLARIVATE ANALYTICS PLC
Notes to the Consolidated Financial Statements
(In thousands, except share and per share data, option prices, ratios or as noted)
A reconciliation of the statutory U.K. income tax rate to the Company’s effective tax rate is as follows:
| Year ended December 31, | ||||||||||||
| 2019 | 2018 | 2017 | ||||||||||
| Loss before tax: | $ | (200,776 | ) | $ | (236,513 | ) | $ | (285,223 | ) | |||
| Income tax, at statutory rate | 10,201 | 5,649 | (54,905 | ) | ||||||||
| Statutory rate(1) | 19.0 | % | 19.0 | % | 19.3 | % | ||||||
| Effect of different tax rates | (4.4 | )% | (1.2 | )% | 3.3 | % | ||||||
| BEAT | (1.2) | % | — | % | — | % | ||||||
| Tax rate modifications(2) | — | % | — | % | 5.7 | % | ||||||
| Valuation Allowances | (17.8 | )% | (18.0 | )% | (20.8 | )% | ||||||
| Other permanent differences | (1.3 | )% | (0.7 | )% | 0.3 | % | ||||||
| Non-deductible transaction costs | (2.1 | )% | — | % | — | % | ||||||
| Withholding tax | (0.7 | )% | (0.2 | )% | (0.3 | )% | ||||||
| Tax indemnity | 3.7 | % | (2.7 | )% | — | % | ||||||
| Sale of Subsidiary | — | % | 2.2 | % | — | % | ||||||
| Other | (0.3 | )% | (0.8 | )% | — | % | ||||||
| Effective rate | (5.1 | )% | (2.4 | )% | 7.5 | % | ||||||
| (1) | The Company performs a reconciliation of the income tax provisions based on its domicile and statutory rate. Reconciliations are based on the U.K. statutory corporate tax rate. |
(2) Due to rate reductions in the U.S. and Belgium enacted in the 4th quarter of 2017.
The tax effects of the significant components of temporary differences giving rise to the Company’s deferred income tax assets and liabilities are as follows:
| December 31, | ||||||||
| 2019 | 2018 | |||||||
| Accounts receivable | $ | 1,346 | $ | 916 | ||||
| Accrued expenses | 4,461 | 3,735 | ||||||
| Deferred revenue | 2,679 | 3,570 | ||||||
| Other assets | 5,721 | 9,655 | ||||||
| Unrealized gain/loss | 94 | 74 | ||||||
| Debt issuance costs | 3,176 | 1,199 | ||||||
| Operating losses and tax attributes | 177,853 | 135,219 | ||||||
| Total deferred tax assets | 195,330 | 154,368 | ||||||
| Valuation allowances | (165,157 | ) | (133,856 | ) | ||||
| Net deferred tax assets | 30,173 | 20,512 | ||||||
| Other identifiable intangible assets, net | (32,834 | ) | (43,247 | ) | ||||
| Other liabilities | (21,012 | ) | (7,785 | ) | ||||
| Goodwill | (4,233 | ) | (42 | ) | ||||
| Fixed Assets, net | (1,153 | ) | (238 | ) | ||||
| Total deferred tax liabilities | (59,232 | ) | (51,312 | ) | ||||
| Net deferred tax liabilities | $ | (29,059 | ) | $ | (30,800 | ) | ||
In the Consolidated Balance Sheets, deferred tax assets and liabilities are shown net if they are in the same jurisdiction. The components of the net deferred tax liabilities as reported on the Consolidated Balance Sheets are as follows:
131
CLARIVATE ANALYTICS PLC
Notes to the Consolidated Financial Statements
(In thousands, except share and per share data, option prices, ratios or as noted)
| December 31, | ||||||||
| 2019 | 2018 | |||||||
| Deferred tax asset | $ | 19,488 | $ | 12,426 | ||||
| Deferred tax liability | (48,547 | ) | (43,226 | ) | ||||
| Net deferred tax liability | $ | (29,059 | ) | $ | (30,800 | ) | ||
The Tax Cuts and Jobs Act (the Act) was enacted in the US on December 22, 2017. Of most relevance to the Company, the Act reduced the US federal corporate income tax rate to 21% from 35%, established a Base Erosion Anti-Abuse Tax (“BEAT”) regime and changed the provisions limiting current interest deductions and use of NOL carryforwards. Certain new provisions are effective for the Company beginning December 1, 2018 and did not have a material impact to the 2018 financial statements.
SAB 118 measurement period
We applied the guidance in SAB 118 when accounting for the enactment-date effects of the Act in 2017 and throughout 2018. At December 31, 2017, we had not completed our accounting for all of the enactment-date income tax effects of the Act under ASC 740, Income Taxes, for the remeasurement of deferred tax assets and liabilities and recorded a provisional tax benefit amount of $2,237 under SAB 118. At December 31, 2018, we completed our accounting for all of the enactment-date income tax effects of the Act. As further discussed above, during 2018, we did not recognize any adjustments to the provisional amounts recorded at December 31, 2017.
Deferred tax assets and liabilities
As of December 31, 2017, we remeasured certain deferred tax assets and liabilities based on the rates at which they were expected to reverse in the future (which was generally 21% for the US and 25% for Belgium), by recording a tax benefit amount of $2,237 (provisional) related to the US and $14,290 related to Belgium. Upon further analysis and refinement of our calculations during the 12 months ended December 31, 2018, it was determined that no adjustment to these amounts was necessary.
The Company is required to assess the realization of its deferred tax assets and the need for a valuation allowance. The assessment requires judgment on the part of management with respect to benefits that could be realized from future taxable income. The valuation allowance is $165,157 and $133,856 at December 31, 2019 and 2018, respectively against certain deferred tax assets, as it more likely than not that such amounts will not be fully realized. During the years ended December 31, 2019 and 2018, the valuation allowance increased by $31,301 and $40,912, respectively, primarily due to operating losses in certain jurisdictions and an increase in deferred tax assets with a full valuation allowance. The increases were partially offset by the release of valuation allowances in jurisdictions with current year operating income.
At December 31, 2019, the Company had U.K. tax loss carryforwards of $470,736, Japan tax loss carryforwards of $64,748, U.S. federal tax loss carryforwards of $127,717, tax loss carryforwards in other foreign jurisdictions of $20,840, and U.S. state tax loss carryforwards of $75,340, respectively. The majority of the unrecognized tax loss carryforwards relate to UK, US, and Japan. The carryforward period for the Japan tax losses is nine years, and the expiration period begins 2025. The carryforward period for the UK tax losses is indefinite. The carryforward period for US federal tax losses is twenty years for losses generated in tax years ended prior to December 31, 2017. The expiration period for these losses begins in 2036. For US losses generated in tax years beginning after January 1, 2018, the carryforward period is indefinite. The carryforward period for US state losses varies, and the expiration period is between 2020 and 2039.
The Company has not provided income taxes and withholding taxes on the undistributed earnings of foreign subsidiaries as of December 31, 2019 because the Company has determined that the amount of such taxes would not be significant. The Company is not permanently reinvesting its foreign earnings offshore.
132
CLARIVATE ANALYTICS PLC
Notes to the Consolidated Financial Statements
(In thousands, except share and per share data, option prices, ratios or as noted)
Deferred Tax Valuation Allowance
The following table shows the change in the deferred tax valuation as follows:
| December 31, | ||||||||||||
| 2019 | 2018 | 2017 | ||||||||||
| Beginning Balance, January 1 | $ | 133,856 | $ | 92,944 | $ | 47,185 | ||||||
| Change Charged to Expense/(Income) | 30,854 | 41,629 | 44,790 | |||||||||
| Change Charged to CTA | 447 | 381 | 713 | |||||||||
| Change Charged to OCI | (1,098 | ) | 256 | |||||||||
| Ending Balance, December 31 | $ | 165,157 | $ | 133,856 | $ | 92,944 | ||||||
Uncertain Tax Positions
Unrecognized tax benefits represent the difference between the tax benefits that we are able to recognize for financial reporting purposes and the tax benefits that we have recognized or expect to recognize in filed tax returns. The total amount of net unrecognized tax benefits that, if recognized, would impact the Company’s effective tax rate were $1,145 and $1,450 as of December 31, 2019 and 2018, respectively.
The Company recognizes accrued interest and penalties associated with uncertain tax positions as part of the tax provision. As of December 31, 2019, the interest and penalties are $354 and as of December 31, 2018, the interest and penalties are $449. It is reasonably possible that the amount of unrecognized tax benefits will change during the next 12 months by a range of $291 to $453.
The Company files income tax returns in the United Kingdom, the United States, and various other jurisdictions. As of December 31, 2019, the Company’s open tax years subject to examination were 2015 through 2019, which includes the Company’s major jurisdictions in the United Kingdom and the United States.
The following table summarizes the Company’s unrecognized tax benefits, excluding interest and penalties:
| December 31, | ||||||||||||
| 2019 | 2018 | 2017 | ||||||||||
| Balance at the Beginning of the year | $ | 1,450 | $ | 91 | 211 | |||||||
| Increases for tax positions taken in prior years | — | 1,339 | — | |||||||||
| Increases for tax positions taken in the current year | 412 | 72 | — | |||||||||
| Decreases due to statute expirations | — | (52 | ) | (120 | ) | |||||||
| Decrease due to payment | (717 | ) | — | — | ||||||||
| Balance at the End of the year | $ | 1,145 | $ | 1,450 | 91 | |||||||
133
CLARIVATE ANALYTICS PLC
Notes to the Consolidated Financial Statements
(In thousands, except share and per share data, option prices, ratios or as noted)
Note 19: Earnings per Share
Potential common shares of 80,873,293, 24,524,698, and 22,554,740 of Private Placement Warrants, Public Warrants, Merger Shares, and options and Restricted Stock Units related to the Incentive Award Plan were excluded from diluted EPS for the years ended December 31, 2019, 2018, and 2017, respectively, as the Company had net losses and their inclusion would be anti-dilutive. See Note 16 — “Shareholders” Equity” and Note 17 — “Employment and Compensation Arrangements” for a description.
The 2019 Transaction was accounted for as a reverse recapitalization in accordance with U.S. GAAP. See Note 4 – “Business Combinations”. Accordingly, weighted-average shares outstanding for purposes of the EPS calculation have been retroactively recasted as shares reflecting the exchange ratio established in the 2019 Transaction (1.0 Jersey share to 132.13667 Clarivate shares).
The basic and diluted EPS computations for our common stock are calculated as follows (in thousands, except share and per share amounts):
| Year ended December 31, | ||||||||||||
| 2019 | 2018 | 2017 | ||||||||||
| Basic/Diluted EPS | ||||||||||||
| Loss available to common stockholders | $ | (210,977 | ) | $ | (242,162 | ) | $ | (263,930 | ) | |||
| Basic and diluted weighted-average number of common shares outstanding | 273,883,342 | 217,472,870 | 216,848,866 | |||||||||
| Basic and diluted EPS | $ | (0.77 | ) | $ | (1.11 | ) | $ | (1.22 | ) | |||
Note 20: Tax Receivable Agreement
At the completion of the 2019 Transaction, we recorded an initial liability of $264,600 payable to the pre-business combination equity holders under the TRA, representing approximately 85% of the calculated tax savings based on the portion of the Covered Tax Assets we anticipate being able to utilize in future years. Based on current projections of taxable income, and before deduction of any specially allocated depreciation and amortization, we anticipated having enough taxable income to utilize a significant portion of these specially allocated deductions related to the original Covered Tax Assets (as defined in the TRA). Total payments related to the TRA could be up to a maximum of $507,326 if all Covered Tax Assets are utilized. TRA payments were expected to commence in 2021 (with respect to taxable periods ending in 2019) and would have been subject to deferral, at the Company’s election, for payment amounts in excess of $30,000 for payments to be made in 2021 and 2022, but would not be subject to deferral thereafter.
The projection of future taxable income involves significant judgment. Actual taxable income may differ from our estimates, which could significantly impact the liability under the TRA. We have determined it is more-likely-than-not we will be unable to utilize all of our deferred tax assets (“DTAs”) subject to the TRA; therefore, we have not recorded a liability under the TRA related to the tax savings we may realize from the utilization of NOL carryforwards and the amortization related to basis adjustments created by the Transaction. If utilization of these DTAs becomes more-likely-than-not in the future, at such time, we will record liabilities under the TRA of up to an additional $134,377 as a result of basis adjustments under the Internal Revenue Code and up to an additional $108,350 related to the utilization of NOL and credit carryforwards, which will be recorded through charges to our statements of operations. However, if the tax attributes are not utilized in future years, it is possible no amounts would be paid under the TRA. In this scenario, the reduction of the liability under the TRA would result in a benefit to our statements of operations.
134
CLARIVATE ANALYTICS PLC
Notes to the Consolidated Financial Statements
(In thousands, except share and per share data, option prices, ratios or as noted)
On August 21, 2019, the Company entered into a Buyout Agreement among the Company and Onex Partners IV LP (“TRA Buyout Agreement”), pursuant to which all future payment obligations of the Company under the Tax Receivable Agreement would terminate in exchange for a payment of $200,000 (the “TRA Termination Payment”), which the Company paid on November 7, 2019 with a portion of the net proceeds from the Refinancing 2019 Transaction. As a result of the payment, a gain was recorded to shareholders equity of $64,600. As of December 31, 2019, our liability under the TRA was $0.
Note 21: Product and Geographic Sales Information
The Company’s chief operating decision maker (“CODM”) assesses Company-wide performance and allocates resources based on consolidated financial information. As such, the company has one operating and reportable segment. The CODM evaluates performance based on profitability.
No single customer accounted for more than 1% of revenues and our ten largest customers represented only 5%, 6%, and 7% of revenues for the years ended December 31, 2019, 2018, and 2017 respectively. Revenues recognized in the U.S. represented 43%, 37%, and 42% of revenues for the years ended December 31, 2019, 2018, and 2017, respectively and no other country accounted for more than 10% of revenues.
Revenue by geography
The following table summarizes revenue from external customers by geography, which is based on the location of the customer:
| Year ended December 31, | ||||||||||||
| Revenue: | 2019 | 2018 | 2017 | |||||||||
| Americas | $ | 463,041 | $ | 475,897 | $ | 476,729 | ||||||
| Europe/Middle East/Africa | 278,738 | 273,744 | 273,706 | |||||||||
| APAC | 233,004 | 221,979 | 216,872 | |||||||||
| Deferred revenues adjustment | (438 | ) | (3,152 | ) | (49,673 | ) | ||||||
| Total | $ | 974,345 | $ | 968,468 | $ | 917,634 | ||||||
Assets by geography
Assets are allocated based on operations and physical location. The following table summarizes non-current assets other than financial instruments, operating lease right-of-use assets and deferred tax assets by geography:
| Year ended December 31, | ||||||||
| Assets: | 2019 | 2018 | ||||||
| Americas | $ | 992,469 | $ | 1,037,852 | ||||
| Europe/Middle East/Africa | 2,099,777 | 2,145,950 | ||||||
| APAC | 101,113 | 101,191 | ||||||
| Total | $ | 3,193,359 | $ | 3,284,993 | ||||
135
CLARIVATE ANALYTICS PLC
Notes to the Consolidated Financial Statements
(In thousands, except share and per share data, option prices, ratios or as noted)
Revenue by product group
The following table summarizes revenue by product group (in thousands):
| Year ended December 31, | ||||||||||||
| 2019 | 2018 | 2017 | ||||||||||
| Web of Science Product Line | $ | 380,299 | $ | 361,957 | $ | 352,995 | ||||||
| Life Sciences Product Line | 167,243 | 165,920 | 165,995 | |||||||||
| Science Group | 547,542 | 527,877 | 518,990 | |||||||||
| Derwent Product Line | 181,949 | 179,321 | 176,201 | |||||||||
| MarkMonitor Product Line | 122,841 | 122,947 | 120,408 | |||||||||
| CompuMark Product Line | 122,451 | 121,025 | 119,854 | |||||||||
| Intellectual Property Group | 427,241 | 423,293 | 416,463 | |||||||||
| IP Management Product Line | — | 20,450 | 31,854 | |||||||||
| Deferred revenue adjustment | (438 | ) | (3,152 | ) | (49,673 | ) | ||||||
| Total | $ | 974,345 | $ | 968,468 | $ | 917,634 | ||||||
Note 22: Commitments and Contingencies
The Company does not have any recorded or unrecorded guarantees of the indebtedness of others.
Contingencies
Lawsuits and Legal Claims
The Company is engaged in various legal proceedings, claims, audits and investigations that have arisen in the ordinary course of business. These matters include, but are not limited to, antitrust/competition claims, intellectual property infringement claims, employment matters and commercial matters. The outcome of all of the matters against the Company is subject to future resolution, including the uncertainties of litigation. Based on information currently known to the Company and after consultation with outside legal counsel, management believes that the ultimate resolution of any such matters, individually or in the aggregate, will not have a material impact on the Company’s financial condition taken as a whole.
Contingent Liabilities
In conjunction with the acquisition of Publons, the Company agreed to pay former shareholders up to an additional $9,500 through 2020. Amounts payable are contingent upon Publons’ achievement of certain milestones and performance metrics. The Company paid $2,371 and $2,470 of the contingent purchase price in the year ended December 31, 2019 and 2018, respectively, as a result of Publons achieving the first tier of milestones and performance metrics. The Company had an outstanding liability for $3,100 and $2,960 related to the estimated fair value of this contingent consideration as of December 31, 2019 and 2018, respectively. The outstanding balance consisted of $3,100 and $1,600 included in Accrued expenses and other current liabilities, and $0 and $1,360 included in Other non-current liabilities in the Consolidated Balance Sheets as of December 31, 2019 and 2018 respectively.
In conjunction with the acquisition of Kopernio, the Company agreed to pay former shareholders up to an additional $3,500 through 2021. Amounts payable are contingent upon Kopernio’s achievement of certain milestones and performance metrics and will be recognized over the concurrent service period.
136
CLARIVATE ANALYTICS PLC
Notes to the Consolidated Financial Statements
(In thousands, except share and per share data, option prices, ratios or as noted)
In conjunction with the acquisition of TrademarkVision, the Company agreed to pay former shareholders a potential earn-out dependent upon achievement of certain milestones and financial performance metrics through 2020. Amounts payable are contingent upon TrademarkVision’s achievement of certain milestones and performance metrics. As of December 31, 2019 and 2018, the Company had an outstanding liability for $8,000 and $4,115, respectively, related to the estimated fair value of this contingent consideration. The outstanding balance was included in Accrued expenses and other current liabilities as of December 31, 2019, and in Other non-current liabilities as of December 31, 2018, in the Consolidated Balance Sheets.
Tax Indemnity
In connection with the 2016 Transaction, the Company recorded certain tax indemnification assets pursuant to the terms of the separation and indemnified liabilities identified therein. As a result of counterparty dispute related to certain of the indemnification claims, the Company wrote off $33,819 during the 4th quarter of 2018, which represented a portion of the amount originally recorded, plus accumulated foreign currency impacts. Management continues to interpret the contractual obligation due from Former Parent and its controlled entities (“Thomson Reuters”) as due in full. The asset write down was recorded within Other operating income (expense), net within the Consolidated Statement of Operations.
Legal Settlement
In September 2019, the Company settled a confidential claim that resulted in a gain. The net gain was recorded in Legal settlement within the Condensed Consolidated Statement of Operations during the year ended December 31, 2019.
Commitments
Unconditional purchase obligations
Purchase obligations are defined as agreements to purchase goods or services that are enforceable and legally binding and that specify all significant terms, including fixed or minimum quantities to be purchased, fixed, minimum or variable pricing provisions and the approximate timing of the transactions. The Company has various purchase obligations for materials, supplies, outsourcing and other services contracted in the ordinary course of business. These items are not recognized as liabilities in our Consolidated Financial Statements but are required to be disclosed. The contractual terms of these purchase obligations extend through 2022. The Company paid $32,231 towards these purchase obligations during the year ended December 31, 2019.
The future unconditional purchase obligations as of December 31, 2019 are as follows:
| Year ended December 31, | ||||
| 2020 | 37,332 | |||
| 2021 | 10,186 | |||
| 2022 | 558 | |||
| 2023 | — | |||
| Total | $ | 48,076 | ||
Note 23: Related Party and Former Parent Transactions
Onex Partners Advisor LP (“Onex”), an affiliate of the Company, is considered a related party. Concurrent with the 2016 Transaction, the Company entered into a Consulting Services Agreement with Onex, pursuant to which the Company is provided certain ongoing strategic and financing consulting services in exchange for a quarterly management fee. In connection with this agreement, the Company recognized $470, $920, and $1,230 in operating expenses related to this agreement for the year ended December 31, 2019, 2018, and 2017, respectively. The Company pays 0.1% interest per annum to Onex for the Credit Agreement. For the year ended December 31, 2019, 2018 and 2017, the Company recognized interest expense, for Onex related interest, of $327, $905 and $1,557, respectively. The Company had an outstanding liability of $3 and $450 to Onex as of December 31, 2019 and 2018, respectively. In addition, the Company paid Onex a management fee of $5,400 in connection with the 2019 Transaction in the second quarter of 2019. See Note 4 – “Business Combinations” for additional information.
137
CLARIVATE ANALYTICS PLC
Notes to the Consolidated Financial Statements
(In thousands, except share and per share data, option prices, ratios or as noted)
BPEA, an affiliate of the Company, is considered a related party. Concurrently with the 2016 Transaction, the Company entered into a Management Services Agreement with Baring, pursuant to which the Company is provided certain ongoing strategic and financing consulting services. In connection with this agreement, the Company recognized $246, $669, and $854 in operating expenses related to this agreement for the years ended December 31, 2019, 2018 and 2017, respectively. The Company had an outstanding liability of $0 and $334 to Baring as of December 31, 2019 and 2018, respectively. In addition, the Company paid BPEA a management fee of $2,100 in connection with the 2019 Transaction in the second quarter of 2019. See Note 4 – “Business Combinations” for additional information.
In connection with the 2016 Transaction, Bidco and a subsidiary of the Former Parent entered into the Transition Service Agreement, which became effective on October 3, 2016, pursuant to which such subsidiary of the Former Parent will, or will cause its affiliates and/or third-party service providers to, provide Bidco, its affiliates and/or third-party service providers with certain technology, facilities management, human resources, sourcing, financial, accounting, data management, marketing and other services to support the operation of the IP&S business as an independent company. Such services are provided by such subsidiary of the Former Parent or its affiliates and/or third-party service providers for various time periods and at various costs based upon the terms set forth in the Transition Service Agreement.
A controlled affiliate of Baring is a vendor of ours. Total payments to this vendor were $765, $531 and $388 for the years ended December 31, 2019, 2018 and 2017, respectively. The Company had an outstanding liability of $160, $120 and $199 as of December 31, 2019, 2018 and 2017, respectively.
Jerre Stead, Chief Executive Officer of the Company, is the Co-founder of a vendor of ours. Total payments to this vendor were $756 for the year ended December 31, 2019 and the Company had an outstanding liability of $10 as of December 31, 2019. This vendor was not a related party in 2018 and 2017.
A former member of our key management is the Co-founder of a vendor of ours.Total payments to this vendor were $278 and $865 for the year ended December 31, 2019 and 2018, respectively. The Company had an outstanding liability of $0 and $332 as of December 31, 2019 and 2018, respectively. This vendor was not a related party in 2017.
In connection with our acquisition of Publons, we paid a $716 consulting fee to a former board member and company executive for the year ended December 31, 2017.
Note 24: Restructuring
In accordance with the applicable guidance for ASC 420, Exit or Disposal Cost Obligations, we accounted for termination benefits and recognized liabilities when the loss was considered probable that employees were entitled to benefits and the amounts could be reasonably estimated. We have incurred costs in connection with involuntary termination benefits associated with our corporate-related initiatives and cost-saving opportunities. These amounts are recorded within Restructuring in the Consolidated Statements of Operations. The payments associated with these actions are expected to be completed within 12 months from the balance sheet date.
The following table summarizes the activity related to the restructuring reserves and expenses for the years ended December 31, 2019 and 2018:
138
CLARIVATE ANALYTICS PLC
Notes to the Consolidated Financial Statements
(In thousands, except share and per share data, option prices, ratios or as noted)
| Balance as of December 31, 2018 | $ | — | ||
| Expenses recorded | 15,670 | |||
| Payments made | (6,323 | ) | ||
| Foreign currency translation | 159 | |||
| Balance as of December 31, 2019 | $ | 9,506 |
Restructuring charges incurred during 2019 included actions to reduce operational costs. Components of the pre-tax charges include $13,959 in severance costs incurred during the year ended December 31, 2019.
139
CLARIVATE ANALYTICS PLC
Notes to the Consolidated Financial Statements
(In thousands, except share and per share data, option prices, ratios or as noted)
Note 25: Quarterly Financial Data (Unaudited)
The following table summarizes the Company’s unaudited quarterly results of operations:
| 2019 | ||||||||||||||||
| First Quarter | Second Quarter | Third Quarter | Fourth Quarter | |||||||||||||
| Revenues | $ | 234,025 | $ | 242,309 | $ | 242,998 | $ | 255,013 | ||||||||
| Income (loss) from operations | $ | (25,919 | ) | $ | (36,581 | ) | $ | 35,844 | $ | (16,431 | ) | |||||
| Net income (loss) | $ | (59,260 | ) | $ | (77,761 | ) | $ | 10,831 | $ | (84,787 | ) | |||||
| Earnings per share: | ||||||||||||||||
| Basic | $ | (0.27 | ) | $ | (0.29 | ) | $ | 0.04 | $ | (0.28 | ) | |||||
| Diluted | $ | (0.27 | ) | $ | (0.29 | ) | $ | 0.03 | $ | (0.28 | ) | |||||
| 2018 | ||||||||||||||||
| First Quarter | Second Quarter | Third Quarter | Fourth Quarter | |||||||||||||
| Revenues | $ | 237,027 | $ | 243,297 | $ | 242,897 | $ | 245,247 | ||||||||
| Loss from operations | $ | (45,892 | ) | $ | (34,430 | ) | $ | (18,931 | ) | $ | (6,455 | ) | ||||
| Net loss | $ | (77,037 | ) | $ | (66,944 | ) | $ | (54,727 | ) | $ | (43,454 | ) | ||||
| Earnings per share: | ||||||||||||||||
| Basic and diluted | $ | (0.35 | ) | $ | (0.31 | ) | $ | (0.25 | ) | $ | (0.20 | ) | ||||
In September 2019, the Company settled a confidential claim that resulted in a gain of $39,399. The net gain was recorded in Legal settlement within the Interim Condensed Consolidated Statement of Operations during the three months ended September 30, 2019 and the year ended December 31, 2019.
Note 26: Subsequent Events
On January 1, 2020, the Company completed the sale of certain assets and liabilities of the MarkMonitor business to OpSec Security for a total purchase price of $3,751. At December 31, 2019 the assets and liabilities related to the divestment met the criteria for classification as Assets Held for Sale on the Company’s balance sheet. An impairment charge of $18,431 was recognized in the Statement of Operations during the fourth quarter to reduce the Assets Held for Sale to their fair value. Accordingly, we do not expect to record a gain or loss on the divestiture in the first quarter of 2020. Of the total impairment charge, $17,967 related to the write down of intangible assets and $468 to the write down of goodwill. After impairment, Current Assets of $2,274 and Long Term Assets of $28,345 were reclassified to Current Assets Held for Sale, while Current Liabilities of $21,170 and Long Term Liabilities of $5,698 were reclassified to Current Liabilities Held For Sale.
On January 17, 2020, the Company announced that it had signed a definitive agreement to acquire Decision Resources Group (“DRG”), a premier provider of high-value data, analytics and insights products and services to the healthcare industry, from Piramal Enterprises Limited, part of global business conglomerate Piramal Group. The acquisition closed on February 28, 2020. The aggregate consideration paid in connection with the closing of the DRG acquisition was approximately $950,000, comprised of $900,000 in cash paid on the closing date and approximately $50,000 in Clarivate ordinary shares to be issued to Piramal Enterprises Limited following the one-year anniversary of closing.
140
CLARIVATE ANALYTICS PLC
Notes to the Consolidated Financial Statements
(In thousands, except share and per share data, option prices, ratios or as noted)
In February 2020, the Company consummated a public offering of 27,600,000 ordinary shares at $20.25 per share. After this offering, Onex and Baring continue to beneficially own approximately 38.3% of the Company’s ordinary shares, representing approximately 59.3% of the ordinary shares beneficially owned by Onex and Baring immediately after the closing of our merger with Churchill Capital Corp in 2019. We received $540,736 in net proceeds from the sale of ordinary shares, after deducting $18,164 underwriting discounts. We used the net proceeds to fund a portion of the cash consideration for the DRG Acquisition and to pay related fees and expenses.
On February 12, 2020, the Company made a repayment of $65,000 on the Revolving Credit Facility. The $250,000 Revolving Credit Facility remains undrawn subsequent to the pay down.
On February 28, 2020, we incurred an incremental $360,000 of term loans under our term loan facility and used the net proceeds from such borrowings, together with cash on hand, to fund a portion of the cash consideration for the DRG acquisition and to pay related fees and expenses.
During the period January 1, 2020 through February 21, 2020, 24,132,666 of the Company’s outstanding warrants were exercised for one ordinary share per whole warrant at a price of $11.50 per share. We used a portion of the total proceeds of $277,526 from the warrant exercises to fund a portion of the cash consideration for the DRG Acquisition and intend to use the balance for general business purposes.
On February 20, 2020, we announced the redemption of all of our outstanding public warrants to purchase our ordinary shares that were issued as part of the units sold in the Churchill Capital Corp initial public offering and remain outstanding at 5:00 p.m. New York City time on March 23, 2020, for a redemption price of $0.01 per public warrant. In addition, our board of directors elected that, upon delivery of the notice of the redemption on February 20, 2020, all public warrants are to be exercised only on a “cashless basis.” Accordingly, by virtue of the cashless exercise of public warrants, exercising public warrant holders will receive 0.4626 of an ordinary share for each public warrant. Assuming all outstanding public warrants called for redemption on March 23, 2020 are exercised prior to redemption, an additional 4,749,616 ordinary shares would be issued.
141
Item 9. Changes in and Disagreements with Accountants on Accounting and Financial Disclosure
None.
Item 9A. Controls and Procedures
Disclosure Controls and Procedures
We maintain “disclosure controls and procedures,” as defined in Rule 13a-15(e) and Rule 15d-15(e) under the Exchange Act, which are designed to provide reasonable assurance that information required to be disclosed in reports that we file or submit under the Exchange Act is recorded, processed, summarized and reported within the time periods specified in the SEC’s rules and forms and that such information is accumulated and communicated to our management, including our Chief Executive Officer and Chief Financial Officer, as appropriate to allow timely decisions regarding required disclosure.
Our management, with the participation of our Chief Executive Officer and Chief Financial Officer, evaluated the effectiveness of our disclosure controls and procedures as of December 31, 2019. Based on the evaluation of our disclosure controls and procedures as of December 31, 2019, our Chief Executive Officer and Chief Financial Officer concluded that, as of such date, our disclosure controls and procedures were effective.
Management’s Report on Internal Control Over Financial Reporting
This annual report does not include a report of management’s assessment regarding internal control over financial reporting due to a transition period established by rules of the SEC for newly public companies. This annual report does not include an attestation report of the Company’s registered public accounting firm as the Company qualifies as an emerging growth company as of December 31, 2019.
Remediation of Prior Material Weakness
As discussed in our annual report on Form 20-F for the fiscal year ended December 31, 2018, our management concluded that our internal control over financial reporting was not effective as of December 31, 2018 as a result of a material weakness related to the internal control over the effectiveness of our design and implementation of account reconciliation activities. Management identified the people, process and technology necessary to strengthen our internal control over financial reporting and to address the material weakness. We began implementing certain of these measures in the fourth quarter of 2018 and continued to develop remediation plans and implemented additional measures throughout 2019. We have remediated the material weakness through the following:
| • | Reviewed the accounting organization to ensure an appropriate organization and skills to sustain the remedial actions. This included performing training to enhance knowledge and skills of the finance team and hiring of additional skilled resources, as appropriate. |
| • | Performed a comprehensive review of the Company’s account reconciliation process including controls to ensure the processes and controls are adequately designed, clearly documented and appropriately communicated to enhance control ownership throughout the finance organization. |
| • | Evaluated and designed controls to address the completeness and accuracy of data used in account reconciliations, primarily associated with spreadsheets and other key reports. |
| • | Implemented a new system to automate manual processes, to document and monitor adherence to standardized processes and controls. |
| • |
Reviewed and updated accounting policies to ensure they address the Company’s current environment. |
142
Management has completed its design, documentation, and testing and evaluation of the updated internal controls and determined that, as of December 31, 2019, the controls were designed and operating effectively and have been operating effectively for a sufficient period to conclude, and management has concluded that the material weakness has been remediated.
Changes in Internal Control Over Financial Reporting
There were no changes in internal control over financial reporting during the three month period ending December 31, 2019 that have materially affected or are reasonably likely to materially affect, the Company’s internal control over financial reporting.
143
Iran Threat Reduction And Syria Human Rights Act Disclosure
Pursuant to Section 219 of the Iran Threat Reduction and Syria Human Rights Act of 2012, which amended the Securities Exchange Act of 1934, an issuer is required to disclose in its annual or quarterly reports, as applicable, whether, during the reporting period, it or any of its affiliates knowingly engaged in certain activities, transactions or dealings relating to Iran or with individuals or entities designated pursuant to certain Executive Orders. Disclosure is generally required even where the activities, transactions or dealings were conducted in compliance with applicable laws and regulations.
During the reporting period, the Company sold access to information and informational materials, which are generally exempt from U.S. economic sanctions, to 3 entities that are part of, or may be owned or controlled by, the Government of Iran. We were advised by counsel that these transactions were permissible under U.S. sanctions pursuant to certain statutory and regulatory exemptions for the exportation of information and informational materials. The Company terminated this activity in October 2019 and does not intend to resume it.
Revenue in the reporting period attributable to the transactions or dealings by the Company described above was approximately $700 and the company incurred no expenses related to these transactions. As such, the net profit of these transactions is approximately $700.
Item 10. Directors, Executive Officers and Corporate Governance
As of February 17, 2020, our board of directors and executive officers are as follows:
| Name | Age | Position | ||||
| Jerre Stead | 77 | Executive Chairman and Chief Executive Officer | ||||
| Sheryl von Blucher | 58 | Director | ||||
| Martin Broughton | 72 | Director | ||||
| Kosty Gilis | 46 | Director | ||||
| Balakrishnan S. Iyer | 63 | Director | ||||
| Michael Klein | 56 | Director | ||||
| Nicholas Macksey | 40 | Director | ||||
| Karen G. Mills | 66 | Director | ||||
| Charles E. Moran | 65 | Director | ||||
| Amir Motamedi | 39 | Director | ||||
| Anthony Munk | 59 | Director | ||||
| Charles J. Neral | 61 | Director | ||||
| Matthew Scattarella | 38 | Director | ||||
| Mukhtar Ahmed | 52 | President, Science Group | ||||
| Richard Hanks | 55 | Chief Financial Officer | ||||
| Stephen Hartman | 50 | General Counsel and Global Head of Corporate Development | ||||
| Jeff Roy | 51 | President, IP Group | ||||
Jerre Stead has been Chief Executive Officer of the Company since June 30, 2019 and Executive Chairman of our board since May 13, 2019. Mr. Stead served as Chairman and Chief Executive Officer of IHS Markit Ltd., a world leader in critical information, analytics and solutions, from its formation in 2016 through 2017 and as Executive Chairman of its predecessor company, IHS Inc., from 2000 through 2016 and as both Chairman and Chief Executive Officer from 2015 through 2016 and from 2006 through 2013. Mr. Stead previously served as Co-Chief Executive Officer of DTN LLC, which provides services in relation to the delivery of weather, agricultural, energy and commodity market information from 2017 to 2018 and also previously served as its Executive Chairman. Mr. Stead previously served as Chairman and CEO of Ingram Micro from 1996 to 2000 and as Chairman and CEO of Legent Corporation in 1995. Mr. Stead has also previously served as Chairman and CEO of Honeywell-Phillips Medical Electronics, Chairman and CEO of Square D Company and Chairman and CEO of AT&T Global Information Solutions. Mr. Stead has served on over 30 corporate boards during his career and in 2017 received the B. Kenneth West Lifetime Achievement Award from the National Association of Corporate Directors. Mr. Stead is a graduate of the University of Iowa, where he earned a bachelor’s degree in business administration, and of the Harvard University Advanced Management Program in Switzerland. Mr. Stead was selected to serve on the board of directors due to his significant experience leading and growing companies in information services.
144
Sheryl von Blucher has been a member of our board since May 13, 2019. Ms. von Blucher has over 30 years of experience in a variety of roles in the global integrated energy, information services, technology services and software, and public and non-profit sectors. She has led strategic and portfolio planning, operations, and corporate finance and development for both domestic and international organizations. Ms. von Blucher served as Co-Chief Executive Officer of DTN LLC from 2017 to 2018. Prior to this, she joined IHS in 2000 as Senior Vice President of Planning and Corporate Development, and then served as an Advisor to the Chairman & CEO of the company from 2007 through 2017. Ms. von Blucher has also worked in private-equity portfolio management as a partner and managing director for the JMJS Group, a private equity partnership. Ms. von Blucher currently serves on the Board of Directors of Washington Prime Group, Inc.; Capital Canyon Club and Golf Development LLC; and on the Board of Trustees for the not-for-profit Guideposts. Ms. von Blucher holds a bachelor’s degree from Rice University and a master’s degree from Harvard University. Ms. von Blucher was selected to serve on the board of directors due to her significant experience as a senior executive in information services.
Sir Martin Broughton has been a member of our board since May 13, 2019. Sir Martin is the Chairman of Supponer, a company specializing in augmented digital reality technologies for real-time broadcasting of sporting events and streaming of in-venue advertising, which he joined in 2019. Sir Martin served as Deputy Chairman of International Consolidated Airlines Group from 2011 to 2016 as well as Chairman of British Airways from 2004 to 2013. He joined Sports Investment Partners in 2010, and currently serves as Chairman of Sports Investment Partners. He served as Chairman of British American Tobacco Company from 1997 to 2004 after having served in various roles at the company since 1971. Sir Martin was Chairman of Liverpool Football Club in 2010 and also served as President of the Confederation of British Industry from 2008 to 2010. Sir Martin was selected to serve on the board due to his significant business, investment and leadership experience.
Kosty Gilis has been a member of our board since October 2016 and Clarivate’s board since its formation in January 2019. Mr. Gilis is a Managing Director of Onex. Since joining Onex in 2004, Mr. Gilis has worked on numerous private equity transactions including the acquisitions and realizations of Allison Transmission and Tomkins plc, as well as the acquisitions of Emerald Expositions, WireCo Worldgroup and SMG. He currently also serves on the Board of Emerald Expositions Events, Inc. and ASM Global, and previously served on the boards of Allison Transmission Holdings, Inc., Gates Global Inc. and WireCo Worldgroup Inc. Prior to joining Onex, Mr. Gilis was a Vice President at Willis Stein & Partners, a Chicago-based private equity firm and was a management consultant at Bain & Company in Toronto, Canada and Johannesburg, South Africa. Mr. Gilis is a graduate of The Wharton School of the University of Pennsylvania, where he earned a B.S. in Economics, and Harvard Business School, where he earned an MBA. Mr. Gilis was selected to serve on the board of directors due to his significant experience in a variety of financing transactions and business services investments.
145
Balakrishnan S. Iyer has been a member of our board since May 13, 2019. Mr. Iyer served as a Board member of IHS Markit Ltd. (previously IHS Inc.) from 2003 to 2019. Mr. Iyer also has served on the Board of Directors of Skyworks Solutions Inc. since 2002 and Power Integrations, Inc. since 2004. Previously, Mr. Iyer was Senior Vice President and Chief Financial Officer of Conexant Systems, Inc. from 1998 to 2003. He held various leadership positions at VLSI Technology Inc., including Senior Vice President and Chief Financial Officer from 1997 to 1998 and Vice President, Corporate Controller from 1993 to 1997. Mr. Iyer served on the Board of Directors of Conexant Systems from 2002 to 2011, Life Technologies (and its predecessor Invitrogen) from 2001 to 2014 and QLogic Corporation from 2003 to 2016. Mr. Iyer holds a B.Tech in Mechanical Engineering from the Indian Institute of Technology, Madras, an MS in Industrial Engineering from the University of California, Berkeley and an MBA in Finance from the Wharton School of the University of Pennsylvania. Mr. Iyer was selected to serve on the board of directors due to his significant financial and corporate governance experience in information services.
Michael Klein has been a member of our board since May 13, 2019. Mr. Klein currently serves as a Director for Credit Suisse Group AG and Credit Suisse AG. Mr. Klein is the founder and managing partner of M. Klein and Company, LLC, which he founded in 2012. M. Klein and Company, LLC is a global strategic advisory firm that provides its clients a variety of advice tailored to their objectives. Mr. Klein is a strategic advisor to global companies, boards of directors, senior executives, governments and institutional investors. Mr. Klein’s background in strategic advisory work was built during his 30-year career, including more than two decades at Citi and its predecessors, during which he initiated and executed strategic advisory transactions. He began his career as an investment banker in the M&A Advisory Group at Salomon Smith Barney and subsequently became Chairman and Co-Chief Executive Officer of Citi Markets and Banking, with responsibilities for global corporate and investment banking and Global Transaction Services across Citi. Mr. Klein is a graduate of The Wharton School of the University of Pennsylvania, where he earned his Bachelors of Science in Economics with concentrations in finance and accounting. Mr. Klein was selected to serve on the board of directors due to his significant investment banking and advisory experience, including for companies in information services.
Nicholas Macksey has been a member of our board since October 2016. Mr. Macksey is a Managing Director of BPEA. Since joining BPEA in 2006, Mr. Macksey has worked on numerous private equity transactions. These transactions include Courts Asia Limited, Nord Anglia Education Inc., Vistra Group Limited, SAI Global Limited, Giant Interactive Group Inc. Prior to joining Baring Mr. Macksey was a Senior Associate at Westpac Institutional Bank. Mr. Macksey graduated with a Bachelor of Commerce and a Bachelor of Economics from the University of Queensland and is also a CFA charter holder. Mr. Macksey was selected to serve on the board due to his significant investment and business services experience.
Karen G. Mills has been a member of our board since May 13, 2019. Ms. Mills is currently a Senior Fellow at Harvard Business School and Harvard Kennedy School, focusing on technology, U.S. competitiveness, and entrepreneurship. Ms. Mills was a member of President Barack Obama’s Cabinet, serving as the Administrator of the U.S. Small Business Administration from 2009 to 2013. She is President of MMP Group, which invests in financial services, consumer products and technology solutions businesses. Prior to this, Ms. Mills held leadership positions in the private sector, including as a partner in several private equity firms. Ms. Mills is Vice Chair of the immigration services company Envoy Global and a past director of Arrow Electronics and Scotts Miracle-Gro. She also serves as a director of the National Bureau of Economic Research (NBER) and as a member of the Harvard Corporation. Ms. Mills holds an AB in economics from Harvard University and an MBA from Harvard Business School. Ms. Mills was selected to serve on the board of directors due to her significant experience in government, academia and investment.
Charles E. Moran has been a member of our board since November 2016. Mr. Moran is the founder and former President and Chief Executive Officer of Skillsoft Corporation, a leading global provider of cloud-based learning and talent management solutions. Mr. Moran held those positions from 1998 to 2016 and remained on as the Chairman from 2015 to 2016. From 1995 to 1997, Mr. Moran served as the President and Chief Executive Officer of NETg, a subsidiary of National Education Corporation, and a provider of computer-based training for IT professionals. From 1993 to 1994, he served as the Chief Operating Officer and Chief Financial Officer of SoftDesk, a leading architecture, engineering and construction/computer-aided design software-application company, which was acquired by Autodesk. From 1992 to 1993, he served as the President of Sytron Corp, a data management software subsidiary of Rexon, Inc. From 1989 to 1992, he was Vice President of Sales and Marketing at Insite Peripherals, a manufacturer of floppy disk drives. Prior to joining Insite Peripherals, his experience included various business management positions with Archive Corporation, Florida Data, and Hamilton-Avnet Corporation. From 2009 to 2014, Mr. Moran served on the board of directors of Higher One, Inc., a leading payment technology provider for higher education. From 1997 to 2001, he served on the board of directors of Workgroup Technology, a client/server product data management solution. Mr. Moran has also served as a member of the board of directors of Manhattan Associates, Inc. since May 2017 and Commvault since July 2018. Mr. Moran holds a B.S. from Boston College and an MBA from Suffolk University. Mr. Moran was selected to serve on the board due to his significant business and leadership experience in information services.
146
Amir Motamedi has been a member of our board since October 2016. Mr. Motamedi is a Managing Director of Onex. Since joining Onex in 2007, Mr. Motamedi has worked on numerous business services transactions including BBAM, Advanced Integration Technology, Emerald Expositions, ASM Global, and Ryan LLC. He currently serves on the boards of Emerald Expositions, SMG, and Ryan LLC and previously served on the board of BBAM. Prior to joining Onex, Mr. Motamedi was an analyst at Goldman Sachs. Mr. Motamedi is a graduate of McGill University where he earned Bachelor of Arts and Bachelor of Commerce degrees. Mr. Motamedi was selected to serve on the board of directors due to his significant experience in a variety of business services transactions.
Anthony Munk has been a member of our board since October 2016. Mr. Munk is a Senior Managing Director at Onex. Since joining Onex in 1988, Mr. Munk has worked on numerous private equity transactions, including the acquisitions and realizations of Husky Injection Molding Systems Ltd., RSI Home Products, Tomkins plc, Vencap Equities Alberta Ltd., Imperial Parking Ltd., ProSource Inc., and Loews Cineplex; and the initial public offering of the Cineplex Galaxy Income Fund, which acquired the Canadian operations of Loews Cineplex, Cineplex Odeon, and the operations of Onex’ subsidiary, Galaxy Entertainment. More recently, Mr. Munk was involved in the acquisitions by Onex of Ryan LLC, Jeld-Wen Holdings Inc., Jack’s Family Restaurants and Moran Foods, LLC (“Save-A-Lot”). Mr. Munk also currently serves on the boards of directors of Ryan LLC, Save-A-Lot, Jeld-Wen and SGS. Mr. Munk previously served on the board of directors of Barrick Gold Corporation, RSI Home Products, Husky Injection Molding Systems Ltd., Cineplex Inc., SMG, and Jack’s Family Restaurants. Prior to joining Onex, Mr. Munk was a Vice President with First Boston Corporation in London, England and an Analyst with Guardian Capital in Toronto. Mr. Munk is a graduate of Queen’s University, where he earned a bachelor’s degree in Economics. Mr. Munk was selected to serve on the board of directors due to his significant experience in a variety of strategic and financing transactions and investments.
Charles J. Neral has been a member of our board since July 2017 and also serves on the Board of Directors of SAI Global. In 2016, he founded Neral Associates, LLC which provides advisory services to public and private clients. Prior to that, from July 2012 to January 2016, Mr. Neral served as the Senior Vice President and Chief Financial Officer of SunGard. He also served as the Senior Vice President and Chief Financial Officer of SafeNet from October 2009 to June 2012. From 1981 to 2009, Mr. Neral served in a variety of positions across IBM’s Sales, Server, Global Services and Software Business lines including executive roles in Asia Pacific, IBM Corporate Headquarters and ultimately serving as the Chief Financial Executive of IBM’s Software Segment (2004 to 2009). Mr. Neral holds a B.S. in Computer Science from Indiana University of Pennsylvania and an MBA in Finance from New York University. Mr. Neral was selected to serve on the board of directors due to his significant business and advisory experience.
Matthew Scattarella has been a member of our board since May 13, 2019. Mr. Scattarella is a Principal with BPEA. Since joining BPEA in 2009, Mr. Scattarella has worked on numerous cross-border private equity transactions, including St. George’s University, Solera Holdings and Prometric Inc. Prior to joining BPEA, Mr. Scattarella worked with Golden Gate Capital and Bain & Company. Mr. Scattarella holds a Bachelor of Science in Economics and an MBA, both from the Wharton School at the University of Pennsylvania. Mr. Scattarella was selected to serve on the board due to his business and investment experience.
147
Mukhtar Ahmed has been President, Science Group of the Company since January 2019. He joined the Company in January 2018 as President of Life Sciences. Prior to joining, Mr. Ahmed served as President of eHealth Solutions at BioClinica from April 2015 to December 2017 and as Global Vice President at Oracle from November 2011 to April 2015. Prior to that, Mr. Ahmed served in senior executive positions at various multinational corporations including Parexel and Kendle International, as well as board-level positions with the National Health Service in the United Kingdom. Mr. Ahmed holds a B.Sc. (Hons) in Applied Computer Systems from Brunel University and a diploma in computing from Buckinghamshire College.
Richard Hanks has been the Chief Financial Officer of the Company since March 2017. Mr. Hanks served as Chief Financial Officer of BDP International from April 2013 to March 2017 and as Chief Financial Officer and an Executive Vice President of infoGROUP, Inc. from 2010 to 2013. Prior to that, Mr. Hanks served as Chief Operating Officer of Enterprise Media Group (EMG) of Dow Jones & Company Inc. from 2007 to 2010. From 1999 to 2006, Mr. Hanks served as Chief Financial Officer of Factiva, LLC. Prior to that, he served as Finance Director for the Corporate and Media Information Division of Reuters, Finance Director for the Financial Times Business Limited, Director of Operations Research and Internal Audit for SmithKline Beecham PLC and Senior Manager of Corporate Finance and Restructuring at PricewaterhouseCoopers. Mr. Hanks is a Chartered Accountant and is a graduate of the University of Nottingham, where he earned a bachelor’s degree in Industrial Economics (B.A. with Honors).
Stephen Hartman has been General Counsel and Global Head of Corporate Development of the Company since July 2014. Prior to that, Mr. Hartman served as Deputy General Counsel, TR Professional, General Counsel for Thomson Scientific and as Chief Counsel (EMEA) for Thomson Financial. Before joining Thomson Reuters in 2000, Mr. Hartman served as European counsel for Primark. Mr. Hartman is a graduate of the University of Nottingham.
Jeff Roy has been President, IP Group of the Company since September 2019. He joined the Company in September 2017 as President of CompuMark. Prior to joining the Company, Mr. Roy served as Global Head of Operations and Client Support for ICE Data Services at the Intercontinental Exchange (“ICE”) from February 2016 to September 2017. Prior to that, Mr. Roy served as Managing Director, Data Operations and Client Support for Interactive Data Inc., which was acquired by ICE in December 2015, from January 2011 to February 2016. Prior to that, Mr. Roy was the founder and CEO of Implementation Factory, Inc. Mr. Roy holds a bachelor’s degree in Banking and Finance from Hofstra University.
Family Relationships
There are no family relationships between any of Clarivate’s executive officers and directors.
Audit Committee Information
Clarivate has established an audit committee comprised of independent directors. The audit committee consists of Messrs. Neral and Iyer and Ms. Mills. Each of the members of the audit committee is independent under the applicable listing standards. The audit committee has a written charter. The purpose of the audit committee is, among other things, to appoint, retain, set compensation of, and supervise Clarivate’s independent accountants, review the results and scope of the audit and other accounting related services and review Clarivate’s accounting practices and systems of internal accounting and disclosure controls.
148
Financial Experts on Audit Committee
The audit committee will at all times be composed exclusively of “independent directors,” as defined for audit committee members under the NYSE listing standards and the rules and regulations of the SEC, who are “financially literate.” “Financially literate” generally means being able to read and understand fundamental financial statements, including a company’s balance sheet, income statement and cash flow statement. In addition, Clarivate is required to certify to the NYSE that the committee has, and will continue to have, at least one member who has past employment experience in finance or accounting, requisite professional certification in accounting, or other comparable experience or background that results in the individual’s financial sophistication.
Mr. Neral serves as a financial expert on the audit committee.
Compensation Committee Interlocks and Insider Participation
Our chief executive officer and executive chairman, Mr. Stead, was a member of our Compensation Committee during 2019. Mr. Stead no longer serves on our Compensation Committee as of January 1, 2020. In addition, in 2019, Mr. Stead designated Ms. von Blucher, a member of our Compensation Committee, to receive 1,800,000 Merger Shares in recognition of her founding of Churchill and in exchange for Ms. von Blucher agreeing to subject her Clarivate shares to specified transfer restrictions, see “Item 13. Certain Relationships and Related Transactions, and Director Independence — Transactions Involving Related Persons.” Other than Mr. Stead and Ms. von Blucher, none of the members of the Compensation Committee were at any time during 2019, or at any other time, an officer or employee of Clarivate or had any relationship requiring disclosure under the SEC's rules regarding related person transactions. During 2019, none of our executive officers served on the board of directors or compensation committee of a company that has an executive officer that serves on our Board of Directors or the Compensation Committee.
Code of Ethics
Clarivate has adopted a Code of Ethics that applies to all of its employees, officers, and directors. This includes Clarivate’s principal executive officer, principal financial officer, and principal accounting officer or controller, or persons performing similar functions. The full text of Clarivate’s Code of Ethics is posted on its website at www.ir.clarivate.com/Governance-Documents. Clarivate intends to disclose on its website any future amendments of the Code of Ethics or waivers that exempt any principal executive officer, principal financial officer, principal accounting officer or controller, persons performing similar functions, or Clarivate’s directors from provisions in the Code of Ethics.
Statement of Significant Differences Between our Corporate Governance Practices and NYSE Corporate Governance Standards for U.S. Issuers
Pursuant to exceptions for foreign private issuers, we are not required to comply with certain of the corporate governance practices followed by U.S. companies under NYSE listing standards. However, Section 303A.11 of the NYSE Listed Company Manual requires that we state any significant differences between our corporate governance practices and the practices required by the NYSE. In this regard, if we believe that circumstances warrant, we may elect to comply with provisions of Companies (Jersey) Law 1991 in lieu of the NYSE shareholder approval requirements applicable to certain dilutive events, such as the establishment or material amendment of certain equity-based compensation plans. In addition, our compensation committee and nominating and corporate governance committee are not subject to annual performance evaluations.
Compensation of Directors
Non-employee directors who are not employees or affiliates of Baring Private Equity Asia Pte Ltd (“Baring”) or Onex Partners Advisor LP (“Onex”) receive compensation comprised of an annual retainer for Board service, annual retainers for applicable committee service, and meeting fees. These payments are quantified in the table below.
| Director compensation | Amount ($) | |||
| Annual Retainers: | ||||
| Board of Directors | 75,000 | |||
| Audit Committee Chair | 50,000 | |||
| Risk Committee Chair | 20,000 | |||
| Audit Committee | 15,000 | |||
| Nominating and Governance Committee | 10,000 | |||
| Compensation Committee | 15,000 | |||
| Risk Committee | 10,000 | |||
| Individual Meeting Fee | 18,750 | |||
Directors may elect to receive 50.0% of their annual Board retainer in shares of Clarivate stock. Directors do not receive grants of stock options or stock awards.
In addition to the fees described above, reimbursement is provided for travel, lodging and other reasonable expenses. Some of this expense reimbursement is taxable in the UK, and in those cases, the Company provides a tax gross-up so that directors would not have been responsible for paying taxes on their expense reimbursements.
The Nominating and Governance Committee periodically evaluates the compensation of our non-employee directors, with the assistance of Pay Governance, the Compensation Committee’s consultant. Pay Governance reviews director pay levels and provides analyses on where the Company is positioned relative to the Company’s compensation. The Nominating and Governance Committee may bring recommendations for adjustments to non-employee director compensation to the Board for review and approval.
The following table provides information concerning the compensation of each of our non-employee directors who received compensation during fiscal year 2019. Other than directors who elected to receive 50.0% of the annual Board retainer in shares of Clarivate stock, none of the non-employee directors received stock options, stock awards, or non-equity incentive compensation.
| Non-Employee Director Compensation | ||||||||||||
| Name(1) | Fees earned or paid in cash(1) ($) | All other compensation(2) ($) | Total compensation ($) | |||||||||
| Martin Broughton | 112,500 | -- | 112,500 | |||||||||
| Michael Klein | 112,500 | -- | 112,500 | |||||||||
| Balakrishnan S. Iyer(3) | 138,750 | 1,630 | 140,380 | |||||||||
| Charles E. Moran(4) | 176,250 | 34 | 176,284 | |||||||||
| Charles J. Neral(4) | 240,000 | 72 | 240,072 | |||||||||
| Sheryl von Blucher | 132,346 | 5,426 | 137,772 | |||||||||
| Karen G. Mills(3) | 131,250 | 1,209 | 132,459 | |||||||||
| Vin Caraher (4)(5) | 112,500 | 297 | 112,797 | |||||||||
| (1) | Kosty Gilis, Anthony Munk and Amir Motamedi do not receive compensation as they are affiliates of Onex. Matthew Scattarella and Nicholas Macksey do not receive compensation as they are affiliates of Baring. Mr. Stead, who serves as our CEO, has not received any compensation for director services other than what is disclosed in the Summary Compensation Table. |
| (2) | All other compensation was for reimbursement of UK taxes due on certain aspects of ordinary business travel considered as taxable compensation by the UK tax authorities. |
| (3) | Mr. Iyer and Ms. Mills elected to receive half of their Board retainer fees, excluding meeting fees and committee retainers and equal to $28,125 for each, in shares of Clarivate stock. The number of shares they received was calculated by dividing $28,125 by $13.34, the closing price of our stock on May 13, 2019, the day of the first scheduled Board meeting following the Merger. Mr. Iyer and Ms. Mills each received 2,108 shares of Clarivate stock in lieu of half of their cash retainer. |
| (4) | Messrs. Moran, Neral and Caraher were directors of Clarivate prior to the Merger and their reported fees include payments for their services prior to the Merger. |
| (5) | Mr. Caraher’s service as a director ended on May 13, 2019 in connection with the Merger. |
The Company’s Amended and Restated Memorandum of Association provides that, to the fullest extent permitted by law, the Company shall indemnify its directors and officers against any liability, action, proceeding, claim, demand, costs, damages or expenses, including legal expenses, which they may incur as a result of any act or failure to act in carrying out their functions in connection with the Company other than such liability (if any) that they may incur by reason of their own actual fraud or willful default. The Company maintains a directors’ and officers’ liability policy for the benefit of any director or officer in the event of any loss or liability the director or officer may experience in respect of any negligence, default, breach of duty or breach of trust, whether or not we may otherwise indemnify such officer or director.
149
Item 11. Executive Compensation
Compensation Committee Report
The Compensation Committee of the Board of Directors (the “Compensation Committee”) has reviewed and discussed with management of the Company the Compensation Discussion and Analysis. Based on this review and discussion, the Compensation Committee recommended to the Board of Directors that the Compensation Discussion and Analysis be included in the Company’s Annual Report on Form 10-K for the year ended December 31, 2019.
Compensation Committee of the Board of Directors
Kosty Gilis, Chairperson
Amir Motamedi
Nicholas Macksey
Sheryl von Blucher
Jerre Stead (served on Compensation Committee in fiscal year 2019 through January 1, 2020)
150
Compensation Discussion and Analysis
(Amounts are Actuals, Unless Otherwise Noted)
Introduction
This Compensation Discussion and Analysis (CD&A) describes how we determine compensation provided to the executive officers whose compensation is described herein and who are referred to as named executive officers (“NEOs”).
Our active NEOs are:
| · | Jerre Stead – Executive Chairman and Chief Executive Officer |
| · | Richard Hanks – Chief Financial Officer |
| · | Mukhtar Ahmed – President, Science Group |
| · | Jeff Roy – President, Intellectual Property (“IP”) Group |
| · | Stephen Hartman – General Counsel and Global Head of Corporate Development |
In addition, we will be reporting compensation for the following two former executive officers, who served during the last fiscal year: Jay Nadler, former Chief Executive Officer and Dr. Annette Thomas, former Chief Executive Officer, Scientific and Academic Research.
Executive Summary
Who We Are
We are a global leader in providing trusted insights and analytics that accelerate the pace of innovation. To achieve this, we deliver critical data, information, workflow solutions and deep domain expertise to innovators everywhere. We offer solutions that drive the entire lifecycle of innovation, including the following:
| • | Scientific and academic research |
| • | Patent intelligence and compliance standards |
| • | Pharmaceutical and biotech intelligence |
| • | Trademark, domain and brand protection |
Fiscal year 2019 reflected a transformational year for Clarivate Analytics. In May 2019, we transitioned from a private to a publicly held company through the merger of Churchill Capital Corp (“Churchill”) and Clarivate Analytics Plc (the “Merger”). From a business perspective, we have made significant accomplishments in a short period, as described under “2019 Business Highlights” and “2019 Financial Results” below.
Since the Merger, we have been highly focused on building a culture of high engagement and accountability. We are moving forward with a sense of urgency and intense external curiosity about what drives success for our customers. We understand that our own success and future is inextricably linked to the success and future of the world around us, and that identifying and addressing gaps in our environmental, social and governance performance will ultimately make us more globally competitive and allow us to drive profitable growth for the long-term.
We have a vibrant, engaged workforce guided by a common mission, values and strategic goals.


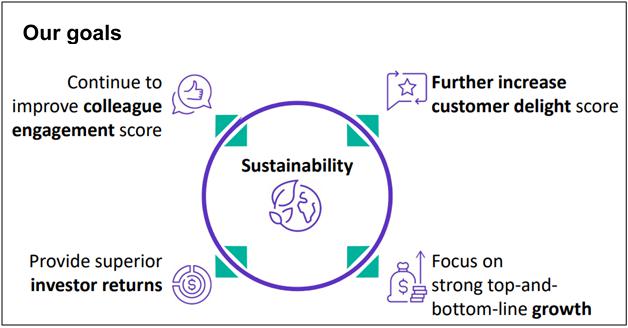
Executive Compensation Disclosures
We are voluntarily providing this CD&A and the related compensation disclosure. As mentioned above, Clarivate is currently classified as a FPI, and with this classification we are not required to provide a CD&A and detailed individual compensation information for our NEOs. However, we believe it is important to provide our shareholders with transparent disclosure of our past year’s executive compensation. We have chosen not to have a say on pay vote this year, as we have not yet had time to fully implement our planned compensation programs.
151
Shareholder Engagement
We are subjecting ourselves to the U.S. disclosure rules to be able to engage with shareholders more effectively. In 2020, we plan to reach out to our shareholders to discuss our executive compensation and corporate governance practices as they relate to executive compensation, and we will consider our shareholders’ input as we continue to refine our executive compensation program.
2019 Business Highlights
Clarivate is the leading provider of intellectual property and scientific information. In 2019, we have accomplished the following (see “Item 7. Management’s Discussion and Analysis of Financial Condition and Results of Operations – Factors Affecting the Comparability of Our Results of Operations – Our Transition to Operations as a Standalone Business”).
| · | Completed the separation of our business from Thomson Reuters infrastructure |
| · | Consolidated five Product Lines into two Product Groups: the Science Group and the IP Group (Mr. Ahmed and Mr. Roy were chosen to lead the Science Group and the IP Group, respectively) |
| · | Initiated organizational efficiency work, including headcount optimization, facilities consolidation, technology modernization, and vendor rationalization and renegotiation |
| · | Refinanced our debt capital structure to improve the weighted average cost of debt and lower interest expense by approximately $18.0 million per year |
| · | Completed two secondary offerings totaling 89,355,000 ordinary shares (including the underwriters’ option to purchase additional shares) held by our private equity sponsors and other shareholders |
| · | Completed the buyout of the tax receivable agreement for $200.0 million |
| · | Acquired two businesses (Sequencebase and Darts-ip) to augment our existing portfolio of IP assets and reached an agreement to divest our non-core brand protection assets |
| · | Implemented a customer delight program to focus our improvement efforts |
| · | Commenced the process to acquire Decision Resources Group, which expands our Life Sciences services and solutions portfolio to enable customers worldwide to accelerate life-changing innovations and improve patient outcomes and access; a definitive agreement was reached in January 2020 |
2019 Financial Results
The table below highlights our key financial metrics which we measured for purposes of compensating our NEOs in 2019.
Key Financial Results
| 2019 Results | 2018 Results | |||||||
| Revenue | $ | 974,345 | $ | 968,468 | ||||
| Adjusted Revenue | $ | 974,783 | $ | 951,170 | ||||
| Adjusted EBITDA | $ | 294,066 | $ | 272,861 | ||||
| Standalone Adjusted EBITDA | $ | 336,066 | $ | 310,968 | ||||
| Free Cash Flow | $ | 47,744 | $ | (71,510 | ) | |||
See “Item 7. Management’s Discussion and Analysis of Financial Condition and Results of Operations - Certain Non-GAAP Measures” and “Item 7. Management’s Discussion and Analysis of Financial Condition and Results of Operations - Liquidity and Capital Resources” for a reconciliation of our non-GAAP to GAAP financial measures.”
Return to Shareholders
We have delivered a strong return to our shareholders through the year. On December 31, 2019, Clarivate stock closed at $16.80 per share providing our shareholders with a 24.6% increase in value from the Merger (on May 14, 2019, the first trading day following the Merger, Clarivate stock closed at $13.48 per share) and providing investors who had invested in Churchill as of the end of 2018 and continued to hold their shares with a 75.9% increase in value from December 31, 2018, when our stock closed at $9.55 per share.
Approach to Performance-Based Compensation
To reward achievement in 2019, we maintained a target-based annual incentive plan (the “AIP”) that delivered annual cash payments to the NEOs and other senior employees based on achievement of pre-determined financial goals of the Company tied to adjusted revenue, standalone adjusted EBITDA and adjusted free cash flow (for employees with group-wide responsibility) and Product Line revenue and product contribution (for employees within Product Lines). The AIP also has an individual performance modifier. Our active NEOs had target payments ranging from 58.2% to 100.0% of their annual base salaries, depending upon their positions. As a result of the financial performance described in the table above, the AIP pool tied to corporate goals was funded at 100.0% of target.
Because our long-term incentive compensation program was not in effect in 2019, the percentage of fiscal year 2019 compensation that was at risk is not a full reflection of NEO compensation over a normal period. Beginning in 2020, we are expecting approximately 90% of our CEO’s compensation to be at risk and approximately 70% of the other NEOs’ compensation, on average as a group, to be at risk. For purposes of these estimates, compensation is comprised of base salary, AIP target and long-term incentive target, with AIP target and long-term incentive target both counting as at-risk pay.
Key Compensation Decisions
In 2019, we made decisions that impacted the compensation our NEOs received during 2019 as well as the structure of our future executive compensation program.
Initially, our executive compensation program for 2019 was designed and implemented as a private-equity owned company. As the year progressed and we became a public company, we focused on aligning and simplifying our organization, instilling a strong sense of urgency and accountability and further structuring Clarivate for incremental growth and profitability. In connection with this restructuring, there were several changes at the senior leadership level, including the appointment of Mr. Stead as our new CEO and subsequent personnel changes at the senior level in order to help achieve Mr. Stead’s goals for the Company. These leadership changes have required us to offer new compensation packages, adjust other compensation, and approve severance arrangements. Details of these compensation decisions are described further in this CD&A.
Since the Merger, we have been pivoting our executive compensation programs to align with the expectations of our public shareholders and expect that compensation for the 2020 fiscal year will create a performance-based culture and reward colleagues for collective performance and demonstration of our values. Although some of our plans will not take effect until 2020, we began planning a compensation program whose goals are to:
| • | Provide appropriate rewards for achievement of business objectives and which support the creation of long-term shareholder value, including the granting of performance-based equity tied to three-year performance goals and relative shareholder return; |
| • | Align with best practices from a corporate governance perspective, including having an appropriate peer group of comparator companies; and |
| • | Attract, retain and motivate the high-caliber executive talent needed to support our growth targets. |
152
Corporate Governance and Compensation Program Enhancements
We are committed to having policies in place to ensure effective oversight of our executive compensation program and strong corporate governance. Because we began the year as a private-equity-held firm, we are still implementing some governance policies relating to executive compensation. The table below highlights practices in effect in 2019 as well as practices we will be implementing in 2020.
| WHAT WE DO | WHAT WE DON’T DO | |
| þ We have an independent compensation consultant | ý We do not provide our CEO with an employment agreement | |
| þ We have adopted share ownership guidelines for our executive officers and the Board of Directors | ý We do not permit our employees to engage in hedging transactions | |
| þ Beginning in 2020, we will have a Compensation Committee that is fully comprised of independent directors | ý We do not permit our employees to pledge the Company’s securities to secure margin or other loans | |
| þ Beginning in 2020, the majority of NEO pay will be at risk and dependent upon performance | ý We do not reprice underwater stock options | |
| þ The mix of executive officer equity awards in 2020 will include a performance-based element | ý We do not provide excise tax gross-up payments | |
| þ In 2020, we intend to engage with our shareholders to discuss executive compensation and corporate governance matters | ý We do not have an evergreen provision that automatically adds shares to our equity incentive plan |
Our Approach to Pay
Compensation Philosophy
Our compensation in 2019 recognized Clarivate’s legacy as a private-equity-held firm, including: (i) increased emphasis on cash incentives, which were at risk based on pre-assigned company financial targets, (ii) pay levels targeted at or below market median without specific reference to an identified peer group for benchmarking, and (iii) historic stock options whose primary purpose was to create value for recipients alongside the private equity sponsors upon a Liquidity Event (as defined in the Clarivate Analytics PLC 2019 Incentive Award Plan (the “2019 Incentive Plan”)).
Soon after the merger with Churchill, we began reviewing our compensation programs in order to reflect our public company status and to create a performance-based culture and reward colleagues for collective performance and demonstration of our values. We adopted the following guiding principles for compensation and benefits:
| ü | Our total rewards strategy should support our mission, vision and values |
| ü | Our compensation philosophy must attract, retain and motivate top talent |
| ü | Our compensation programs should be globally consistent and locally competitive |
| ü | Our incentives need to be aligned to key business objectives appropriate to colleague roles |
| ü | Our compensation programs must support a pay-for-performance culture |
We assessed our long-term and short-term incentive plans against these principles and determined that our AIP is well designed for future purposes and not in need of significant change (other than our normal review in the ordinary course and setting of suitably demanding annual targets). However, we determined that stock options that had been tied to private equity returns did not give us the adaptability we need for providing ongoing competitive pay or to allow for a wider distribution of incentives to colleagues who are key to ensuring we hit our goals. Beginning in 2020, equity grants pursuant to our 2019 Incentive Plan will be comprised of a mix of restricted stock units: (a) performance-based units (“PRSUs”) tied to long-term financial and operational metrics with a relative total shareholder return modifier, and (b) time-based units (“RSUs”) that will vest over time.
Peer Group Benchmarking
With guidance from Pay Governance LLC, our independent compensation consultant, we established a peer group for benchmarking executive pay based on the following guiding principles:
| • | Companies engaged in intelligence development, data analytics, digital delivery or cybersecurity/intellectual property protections |
| • | Revenues between $300 million - $3.0 billion (approximately 0.3x – 3.0x Clarivate) |
| • | Market capitalization between $1.0 - $24.0 billion (approximately 0.25x – 5.0x Clarivate) |
| • | Business/talent competitors of Clarivate |
| • | A group of between 10 to 25 companies so that results are statistically reliable, and the peer group is sustainable over time |
| • | Sufficient pay data is available for companies identified as potential peers |
Based on this analysis, we selected the following companies as our primary peer group for compensation benchmarking in 2019:
| Clarivate Analytics Peer Group for Compensation | ||
| Cloudera, Inc. | FTI Consulting, Inc. | MSCI Inc. |
| ExIService Holdings, Inc. | Gartner, Inc. | Proofpoint, Inc. |
| Exponent, Inc. | ICF International, Inc. | PRA Health Sciences, Inc. |
| FactSet Research Systems Inc. | ICON Public Limited Company | RWS Holdings plc |
| Fair Isaac Corporation | Informa plc | Teradata Corporation |
| FireEye, Inc. | Morningstar, Inc. | |
153
Determination of Executive Compensation
Role of the Compensation Committee
Following the closing of the Merger, the Compensation Committee of the Board of Directors has administered the compensation program for our executive officers and executive leadership team.
With respect to CEO compensation, the Compensation Committee:
| · | Reviews and approves the corporate goals and objectives; |
| · | Evaluates the CEO’s performance in light of these goals and objectives; and |
| · | Sets the CEO’s compensation based upon the evaluation of the CEO’s performance. (Under its charter, the Compensation Committee may set the CEO’s compensation either alone or, if directed by the Board, in conjunction with a majority of the independent directors on the Board.) |
Additionally, the Compensation Committee reviews and sets or makes recommendations to the Board regarding the compensation of the executive officers other than the CEO.
The Compensation Committee reviews and approves or recommends to the Board regarding the adoption or amendment of the Company’s incentive compensation and equity-based plans and arrangements. The Compensation Committee administers these plans and has authority to make and modify awards under these plans.
The Compensation Committee considers a variety of factors when making compensation decisions, including:
| · | Experience, responsibilities, and both individual and overall Company performance |
| · | Internal equity among executives |
| · | Executive role in succession planning |
| · | Competitive external market data and trends |
| · | Alignment with shareholders, customers and colleagues |
Role of Compensation Consultant
During 2019, the Compensation Committee engaged Pay Governance LLC as its independent compensation consultant to advise on executive compensation matters. Pay Governance specializes in executive compensation and related governance matters and does not perform any unrelated services for Clarivate Analytics. The Compensation Committee has sole authority with regard to the decision to retain the compensation consultant and, while the compensation consultant interacts with management from time to time in order to best coordinate with and deliver services to the Compensation Committee, it reports directly to the Compensation Committee with respect to its compensation consulting advice.
Role of Management
At the Compensation Committee’s request, management provides us with information, analyses and recommendations regarding our executive compensation program. From May 2019, our CEO was a member of the Compensation Committee and participated in compensation decisions, other than those decisions that were directly related to the CEO’s own compensation. Starting in 2020, the CEO will no longer serve on the Compensation Committee, which is consistent with our decision to report as a domestic filer.
Compensation for Named Executive Officers
Elements of Compensation
For 2019, the executive compensation program consisted of the elements described in the table below.
| Pay Element | Alignment to Business Objectives | Overview | ||
| Annual | Fixed | Base Salary |
· Benchmarked base salaries attract and retain key talent · Adjustments are linked to individual performance and market data |
· Cash · Aligned to scope of responsibilities and market benchmarks |
| Variable | Annual Incentive Plan |
· Rewards performance to achieve short-term business objectives · Motivates executives to deliver on individual objectives alongside broader business objectives |
· Cash · Annual recognition of performance against pre-established targets, including § Standalone Adjusted EBITDA § Adjusted revenue § Adjusted free cash flow § Product Line profit and revenue § Individual performance modifier | |
| Long- Term | Long-Term Incentive Plan |
· Supports retention and mitigates excessive risk taking · Event-based grants (hire, promotion, etc.) |
· Stock Options · RSUs
| |
| Other | · Market aligned programs to facilitate strong productivity and support at times of personal need |
· Health, welfare and retirement programs · Limited perquisites | ||
CEO
At the time of the Merger, Mr. Stead was named Executive Chairman, and shortly thereafter Mr. Stead agreed to expand his role to become our CEO effective as of June 30, 2019. Mr. Stead has had a long and very successful career generating value for investors as a public company CEO. Over the last two decades, he led one of the fastest-growing and most successful companies in the information services sector, IHS Markit Ltd.
Post-Merger Compensation. Mr. Stead has been provided with an annual salary of $600,000 (pro-rated for the time he served as CEO) and an AIP target equal to 100.0% of his annual salary. Prior to the time that Mr. Stead’s AIP payout could be calculated, he requested and the Compensation Committee agreed that he be paid only 50.0% of his earned AIP payout. Mr. Stead has also requested that he not have an employment agreement. We have been advised by our compensation consultant, Pay Governance LLC, that Mr. Stead’s compensation (excluding the Merger Shares discussed below) is below market compared to our peer group. Given Mr. Stead’s successful track record and years of experience in the information services industry, we will review his compensation as compared to our peer group in 2020.
Pre-Merger Compensation. Under the Sponsor Agreement, Clarivate, Churchill and the other parties thereto agreed that Clarivate would issue 7,000,000 ordinary shares to persons designated by Messrs. Stead and Klein, including themselves, upon Clarivate’s achievement of a closing share price on the NYSE of at least $20.00 per share for 40 days over a 60 consecutive trading day period on or before the sixth anniversary of the closing of the Merger (the “Merger Shares”). Of the 7,000,000 Merger Shares, Mr. Stead was delegated the authority to designate recipients of up to 4,000,000. As of December 31, 2019, 1,000,000 Merger Shares were designated for Mr. Stead, and he retained the authorization to designate the recipients of a residual 400,000 unissued Merger Shares. On January 31, 2020, our Board agreed to waive the performance vesting condition described above, and such Merger Shares are expected to be issued to persons designated by Messrs. Stead and Klein on or prior to December 31, 2020. Additionally, the terms of the Sponsor Agreement provided that the Churchill board of directors could allocate up to 1,000,000 immediately vested non-qualified stock options that would be granted after the close of the Merger. At that time, the Churchill board of directors designated that the options would be granted to Mr. Stead given his agreement to serve as the executive chairman of Clarivate following the Merger. These options were then granted to Mr. Stead with an exercise price of $13.30, the fair market value as of the May 20, 2019 grant date. The stock options will only have value to Mr. Stead if our share price remains above the $13.30 exercise price. While we are required to report the Merger Shares and stock options designated for Mr. Stead as compensation to him under the rules of the SEC, the Merger Shares and stock options were actually received by Mr. Stead in his role as a founder of Churchill and were part of the terms of the Merger, which were negotiated on an arm’s length basis among the parties to the Sponsor Agreement, and not a decision of the Compensation Committee.
Base Salary. In connection with the Merger and restructuring described in “Key Compensation Decisions” above, we provided salary adjustments to Messrs. Ahmed, Roy and Hartman. Over the course of the year, Mr. Ahmed received two separate salary increases (the first being 13.8% and the second being 21.6%). The first increase, in July 2019, was after the Merger to align his pay with the competitive market, and the second increase, effective in September 2019, was in recognition of his appointment as head of one of our two primary Product Groups. In total Mr. Ahmed’s salary increased from $414,050 at the beginning of the year to $573,300 at year-end. Mr. Roy received an 17.6% increase in salary, from $382,500 to $450,000 after the Merger, which aligns his pay with the competitive market and recognizes his appointment as head of one of our two primary Product Groups. Both Messrs. Ahmed and Roy have significantly increased areas of responsibility and hold critically important roles. Mr. Hartman received a 25.0% increase in salary, from $305,760 to $382,200, in recognition of his expanded responsibilities as general counsel of a public company and to align his pay with the competitive market. Messrs. Hartman and Ahmed are based in the United Kingdom and their salaries have been converted to USD using a GBP:USD exchange rate of 1.274, which is a rate set at the beginning of 2019 using a six-month forward look which we use for the purposes of our budgetary planning.
154
Annual Incentive Plan
Our AIP is intended to reward achievement of operational and financial performance by aligning individual performance with our business strategy and objectives. Each NEO has a target AIP payout, which is defined as a percentage of the respective NEO’s eligible base pay. There is also a discretionary individual performance modifier, which may be used to increase or decrease an individual’s final payout up to twice the calculated payment, depending upon an assessment of that individual’s performance, determined by the Compensation Committee for NEOs, against individual objectives.
In mid-2019, the Compensation Committee adjusted the AIP target payout for the NEOs (other than for the CEO) as follows:
| • | Mr. Hanks: 62.5% to 85.0% of his base salary |
| • | Mr. Ahmed: 85.0% to 100.0% of his base salary |
| • | Mr. Roy: 60% to 85% of his base salary |
| • | Mr. Hartman: 50% to 65% of his base salary |
These adjustments were made to recognize the expanded roles following the Merger and restructuring. The increased targets have been pro-rated (from the date of adjustment) for purposes of determining the 2019 AIP payouts.
The AIP for our NEOs included goals which best represent our key business performance areas, including adjusted revenue, standalone adjusted EBITDA, and adjusted free cash flow. Additionally, Messrs. Roy and Ahmed had goals tied to Product Line performance.
The table below provides the threshold, target and maximum AIP opportunities and actual results achieved in 2019 at the corporate level. Payments are interpolated between these levels.
| 2019 AIP Calculations | |||||||
| Metric | Weighting | Payment Level | 2019 Corporate Goal (in thousands) |
2019 Corporate Goal as % of Target | 2019 Results (in thousands) | AIP Payout Level Achieved | |
| Adjusted Revenue(1) | 40% | Threshold | 0% | $962,000 | 97.9% | 977,775 | 35.8% |
| Target | 100% | $982,600 | 100.0% | ||||
| Maximum | 200% | $1,080,000 | 110.0% | ||||
| Standalone Adjusted EBITDA(1) | 40% | Threshold | 0% | $325,000 | 97.9% | 338,219 | 43.4%(2) |
| Target | 100% | $332,000 | 100.0% | ||||
| Maximum | 200% | $365,200 | 110.0% | ||||
| Adjusted Free Cash Flow(1) | 20% | Threshold | 0% | $42,800 | 75.0% | 57,600 | 20.8% |
| Target | 100% | $57,000 | 100.0% | ||||
| Maximum | 200% | $71,300 | 125.0% | ||||
| Calculated Annual Incentive Payout (as a Percentage of Target) | 100% | ||||||
(footnotes in thousands)
| (1) | Adjusted revenue and standalone adjusted EBITDA are presented at plan rates excluding results from two acquisitions that occurred late in 2019: Darts-ip, acquired in November 2019, and SequenceBase, acquired in September 2019. These exclusions and the presentation at plan rates resulted in the following differences between the amounts included above for 2019 AIP Calculations and the amounts reported in “Key Financial Results” in this section of the annual report: adjusted revenue plan results increased by $2,992; standalone adjusted EBITDA plan results increased by $2,153. See “Item 7. Management’s Discussion and Analysis of Financial Condition and Results of Operations - Certain Non-GAAP Measures” for a reconciliation of our non-GAAP to GAAP financial measures. Adjusted free cash flows for AIP purposes are presented at actual rates and are adjusted to exclude certain transactions that do not represent operations from our ongoing business. These adjustments resulted in an increase of $9,856 between the amount included above for 2019 AIP Calculation and the amount reported in “Key Financial Results” in this section of the annual report. |
| (2) | The calculated payout for standalone adjusted EBITDA is 47.5%; however, the payout was set at 43.4% to ensure that payment based on non-GAAP adjustments would not adversely impact overall adjusted EBITDA. |
The table below illustrates the AIP payout calculations for Messrs. Stead, Hanks and Hartman, whose AIP goals were 100% tied to the corporate AIP goals shown above, plus an individual modifier for Messrs. Hanks and Hartman. The Compensation Committee utilized the individual performance modifier to increase the final payments to Messrs. Hanks and Hartman to recognize their leadership and accomplishments that were required for the successful and timely closing of the Merger and start of operations as a public company.
| Individual NEO AIP Calculations – 100% Corporate | ||||||||||||||||||||||||||||
| Name | Eligible Base Pay ($) | Pro-Rata AIP Target (%) | Corporate Goal Achievement (%) | Voluntary Forfeiture ($) | Individual Modifier ($) | Final AIP Payout | Total AIP Payout as Percent of Target | |||||||||||||||||||||
| Jerre Stead(1) | 600,000 | 100.0 | % | 100.0 | % | (300,000 | ) | -- | 300,000 | 50.0 | % | |||||||||||||||||
| Richard Hanks | 500,000 | 68.9 | % | 100.0 | % | -- | 5,445 | 350,000 | 101.6 | % | ||||||||||||||||||
| Stephen Hartman | 350,576 | 58.2 | % | 100.0 | % | -- | 15,813 | 220,000 | 107.7 | % | ||||||||||||||||||
| (1) | See “CEO Compensation” for additional discussion regarding Mr. Stead’s eligible earnings and voluntary forfeiture of AIP incentive payout. |
Messrs. Ahmed and Roy had 50% of their AIP tied to the corporate AIP goals shown above and 50% tied to the performance of the Product Lines for which they had responsibility. Their respective Product Lines did not achieve the applicable threshold performance levels; thus, Messrs. Ahmed and Roy are not receiving a payout for the portion of their AIP that is weighted to their Product Lines. Because of their leadership, vision and key contributions to the Company’s strategic path forward, the Compensation Committee utilized the individual performance modifier to increase their payouts, as shown in the following table.
| Individual NEO AIP Calculations – 50% Corporate/50% Product Line | ||||||||||||||||||||||||||||
| Name | Eligible Base Pay ($) | Pro-Rata AIP Target ($) | Corporate Goal Achievement (%) | Percentage of AIP Payout Weighted to Corporate Goals (%) | Individual Modifier ($) | Final AIP Payout ($) | Total AIP Payout as Percent of Target (%) | |||||||||||||||||||||
| Mukhtar Ahmed | 477,017 | 91.0 | % | 100.0 | % | 50.0 | % | 132,896 | 350,000 | 80.6 | % | |||||||||||||||||
| Jeff Roy | 416,527 | 69.9 | % | 100.0 | % | 50.0 | % | 104,453 | 250,000 | 85.9 | % | |||||||||||||||||
Messrs. Hartman and Ahmed are based in the United Kingdom and, in the AIP tables above, their payments have been converted to USD using a GBP:USD exchange rate of 1.274. Since Mr. Nadler and Dr. Thomas were no longer employed with the Company as of the end of the fiscal year 2019, they did not receive an AIP payout tied to achievement of the performance goals.
155
Long-Term Incentive Plan
None of our NEOs received new equity grants in 2019 as compensation for their roles with Clarivate. As discussed previously under “Pre-Merger Compensation” above, as part of the Merger, Mr. Stead received an award of stock options for his role as a founder of Churchill.
In prior years, our NEOs, other than Mr. Stead, had received grants of non-qualified options under the Camelot Holdings (Jersey) Limited 2016 Equity Incentive Plan. In addition to compensatory grants, under this equity scheme, participants had an opportunity to invest in the then-private company and receive matching non-qualified stock options. After the Merger, these options were converted to non-qualified stock options under the 2019 Incentive Plan.
The terms of the stock options held by our NEOs, other than our CEO, provide for accelerated vesting in the event of a Liquidity Event which would require our “Principal Shareholders” (as defined in the 2019 Incentive Plan) to be holding less than 30% of the total shares of the Company that they held immediately after the Merger. The terms of the stock options held by our NEOs were approved when the Company was private-equity owned.
Benefits
We sponsor a qualified defined contribution plan (“401(k) Plan”) for U.S. employees, including U.S.-based NEOs. In addition, we sponsor a qualified defined contribution plan for UK employees, including UK-based NEOs. Other than the qualified plans described above, we do not provide any other pension plan, supplemental retirement plan, or deferred compensation plan to our NEOs.
We also provide NEOs with life and medical insurance, and other benefits generally available to all employees. We provide limited perquisites.
Employment and Separation Agreements
Our CEO does not have an employment agreement. In prior years, Clarivate entered into employment agreements with Messrs. Hanks, Ahmed, Roy and Hartman as well as with our former officers, Mr. Nadler and Dr. Thomas.
The employment agreements that we have in place with Messrs. Hanks, Ahmed, Roy, and Hartman are for the purpose of establishing their employment terms. These employment agreements provide a description of compensation elements and benefits to which each NEO is entitled, as further discussed under “Employment Contracts” below.
In 2019, we also entered into separation agreements with Mr. Nadler and Dr. Thomas that are described under “Employment Contracts” and “Potential Payments Upon Termination or Change in Control.”
Compensation Policies
Stock Ownership Guidelines
In January 2020, we adopted the following stock ownership guidelines for our non-employee directors, CEO, executive officers and leadership team.
| Position | Stock Ownership Guidelines |
| Chief Executive Officer | 6 times base salary |
| Other Executive Officers and Leadership Team | 3 times base salary |
| Non-employee Directors | 5 times annual retainer |
Insider Trading Policy
We have an insider trading policy that prohibits officers, directors, employees and consultants of the Company from trading while in possession of material, non-public information about the Company. We have Company-wide trading blackouts that are in effect prior to the release of earnings and we require all executive officers and other key employees to pre-clear any transactions with the Company’s General Counsel or Chief Financial Officer.
No Hedging Policy
Certain forms of hedging or monetization transactions allow an individual to lock in much of the value of his or her share holdings, often in exchange for all or part of the potential for upside appreciation in the shares. We have a policy that prohibits directors, executive officers, employees and consultants from engaging in such transactions.
No Pledging Policy
We have a policy that prohibits our directors, executive officers, employees and consultants from pledging the Company’s securities as collateral to secure loans or otherwise. This prohibition includes a prohibition on holding the Company’s securities in a margin account, which would allow the director or executive officer to borrow against their holdings to buy securities.
Equity Grant Practices
Beginning in 2020, we expect to make annual equity awards, comprised of PRSUs and RSUs, to management during the first quarter of the year. We also expect to make broad-based grants to our non-management employees in the fourth quarter of the year if we meet our Customer Delight goals. New hire and ad hoc grants may be made throughout the year.
Risk Management
The Board of Directors is responsible for the oversight of the Company’s ongoing assessment and management of material risks impacting our business. The Compensation Committee oversees compensation risk management by participating in the creation of, and approving, compensation elements, programs and performance metrics that encourage an appropriate level of risk-taking consistent with our business strategy. In 2019, we had a formulaic-based annual incentive plan with maximum caps and pre-established goals that focused on multiple areas across the Company. Beginning in 2020, we will have short-term and long-term incentive plans that include a mix of performance metrics that align with our overall corporate goals and strategy and do not encourage excessive risk taking in order to meet one particular goal. As noted above in “Compensation Policies,” we have stock ownership guidelines and prohibitions against hedging and pledging of our securities. We do not believe our current compensation practices and programs are reasonably likely to have a material adverse effect on the Company.
Impact of Accounting and Tax Treatment
The Compensation Committee considers the accounting and tax treatment to Clarivate and the NEOs in its decision-making process, including: the recognition of stock-based compensation; the Tax Cuts and Jobs Act which eliminated the exception that allowed for the deductibility of certain performance-based compensation under Section 162(m) of the Internal Revenue Code; and Section 409A of the Internal Revenue Code. We strive to ensure that there are no significant negative accounting implications due to the design of our compensation programs; however, we will base our decisions on what we believe is necessary and appropriate to further the growth of our Company, align with our shareholders interest, and pay for performance.
156
Employee Share Plans
Prior to our merger with Churchill Capital Corp, we granted awards to eligible participants under the Camelot Holdings (Jersey) Limited 2016 Equity Incentive Plan (the “Prior Plan”). Options to purchase ordinary shares of Camelot, which are referred to herein as Company shares, granted under the Prior Plan typically were divided into four tiers, with distinct escalating exercise prices for each tier. In addition, certain participants were previously given an opportunity to make a cash investment to purchase Company shares and those participants who made such a cash investment received additional options under the Prior Plan that had a single exercise price. All options granted under the Prior Plan are eligible to vest in five equal annual installments generally following the date of grant of such options. Vesting will accelerate at such time as Camelot Investors have collectively sold for cash 70% of the total Clarivate ordinary shares received by them in our merger with Churchill Capital Corp.
Effective as of the effective time of the Jersey Merger, each option to purchase Company shares, to the extent then outstanding and unexercised, were converted into an option to purchase ordinary shares of Clarivate (a “Rollover Option”), on the same terms, conditions and vesting schedules as previously applied, with adjustments to the number of shares and exercise price, in each case based on an exchange ratio that is intended to preserve the intrinsic value and overall economics of the outstanding options. The conversion and adjustment of the options to purchase Camelot’s shares as described above is referred to herein as the Option Conversion.
In addition, in connection with our merger with Churchill Capital Corp, Clarivate adopted the Clarivate Analytics Plc 2019 Incentive Award Plan, or the 2019 Plan, under which Clarivate may grant cash and equity-based incentive awards to eligible service providers in order to attract, retain and motivate the persons who make important contributions to Clarivate. The 2019 Plan is intended to be the successor plan to the Prior Plan and, upon the effectiveness of the 2019 Plan, the Rollover Options ceased to be subject to the terms of the Prior Plan and are instead governed by the terms and conditions of the 2019 Plan. The 2019 Plan became effective immediately prior to the consummation of our merger with Churchill Capital Corp. The following summarizes the material features of the 2019 Plan.
Eligibility and Administration
Employees, consultants and directors of Clarivate, and employees and consultants of subsidiaries of Clarivate, are eligible to receive awards under the 2019 Plan. The 2019 Plan is administered by the Clarivate board of directors, which may delegate its duties and responsibilities to one or more committees of the directors and/or officers of Clarivate (referred to collectively as the plan administrator below), subject to the limitations imposed under the 2019 Plan, Section 16 of the Exchange Act, stock exchange rules and other applicable laws. The plan administrator has the authority to take all actions and make all determinations under the 2019 Plan, to interpret the 2019 Plan and award agreements and to adopt, amend and repeal rules for the administration of the 2019 Plan as it deems advisable. The plan administrator also has the authority to grant awards, determine which eligible service providers receive awards and set the terms and conditions of all awards under the 2019 Plan, including any vesting and vesting acceleration provisions, subject to the conditions and limitations in the 2019 Plan.
Award Limits
An aggregate pool of 60,000,000 ordinary shares are initially available for issuance under the 2019 Plan. Shares issued upon exercise of the Rollover Options and shares issued in respect of all future awards will come out of this pool. No more than 60,000,000 ordinary shares may be issued under the 2019 Plan upon the exercise of options that are intended to qualify as incentive stock options under Section 422 of the Code. Shares issued under the 2019 Plan may be authorized but unissued shares, shares purchased on the open market or treasury shares.
157
If an award under the 2019 Plan (including the Rollover Options) expires, lapses or is terminated, exchanged for cash, surrendered, repurchased, redeemed, cancelled without having been fully exercised or forfeited, any unused shares subject to the award will, as applicable, become or again be available for new grants under the 2019 Plan. Awards granted under the 2019 Plan in substitution for any options or other shares or share-based awards granted by an entity before the entity’s merger or consolidation with Clarivate or Clarivate’s acquisition of the entity’s property or shares will not reduce the shares available for grant under the 2019 Plan, but will count against the maximum number of shares that may be issued upon the exercise of options that are intended to qualify as incentive stock options under Section 422 of the Code.
Awards
The 2019 Plan provides for the grant of options, including options that are intended to qualify as incentive stock options under Section 422 of the Code and nonqualified options, share appreciation rights, restricted shares, dividend equivalents, restricted share units and other share or cash based awards. Certain awards under the 2019 Plan may constitute or provide for payment of “nonqualified deferred compensation” under Section 409A of the Code. All awards under the 2019 Plan will be set forth in award agreements, which will detail the terms and conditions of awards, including any applicable vesting and payment terms and post-termination exercise limitations. A brief description of each award type follows.
| • | Options and Share Appreciation Rights. Options provide for the purchase of ordinary shares in the future at an exercise price set on the grant date. Options that are intended to qualify as incentive stock options under Section 422 of the Code, in contrast to nonqualified options, may provide tax deferral beyond exercise and favorable capital gains tax treatment to their holders if certain holding period and other requirements of the Code are satisfied. Share appreciation rights entitle their holder, upon exercise, to receive from us an amount equal to the appreciation of the shares subject to the award between the grant date and the exercise date. The plan administrator will determine the number of shares covered by each option and share appreciation right, the exercise price of each option and share appreciation right and the conditions and limitations applicable to the exercise of each option and share appreciation right. The exercise price of an option or share appreciation right will not be less than 100% of the fair market value of the underlying share on the grant date (or 110% in the case of options that are intended to qualify as incentive stock options under Section 422 of the Code granted to certain significant shareholders), except with respect to certain substitute awards granted in connection with a corporate transaction. The term of an option or share appreciation right may not be longer than ten years (or five years in the case of options that are intended to qualify as incentive stock options under Section 422 of the Code granted to certain significant shareholders). |
| • | Restricted Shares and Restricted Share Units. Restricted shares are awards of nontransferable ordinary shares that remain forfeitable unless and until specified conditions are met and which may be subject to a purchase price. Restricted share units are contractual promises to deliver ordinary shares in the future, which may also remain forfeitable unless and until specified conditions are met and may be accompanied by the right to receive the equivalent value of dividends paid on ordinary shares prior to the delivery of the underlying shares. The plan administrator may provide that the delivery of the shares underlying restricted share units will be deferred on a mandatory basis or at the election of the participant. The terms and conditions applicable to restricted shares and restricted share units will be determined by the plan administrator, subject to the conditions and limitations contained in the 2019 Plan. |
| • | Other Share or Cash Based Awards. Other share or cash based awards are awards of cash, fully vested ordinary shares and other awards valued wholly or partially by referring to, or otherwise based on, ordinary shares or other property. Other share or cash based awards may be granted to participants and may also be available as a payment form in the settlement of other awards, as standalone payments and as payment in lieu of compensation to which a participant is otherwise entitled. The plan administrator will determine the terms and conditions of other share or cash based awards, which may include any purchase price, performance goal, transfer restrictions and vesting conditions. |
158
Performance Criteria
The plan administrator may select performance criteria for an award to establish performance goals for a performance period. Performance criteria under the 2019 Plan may include, but are not limited to, the following: net earnings or losses (either before or after one or more of interest, taxes, depreciation, amortization, and non-cash equity-based compensation expense); gross or net sales or revenues or sales or revenues growth; net income (either before or after taxes) or adjusted net income; profits (including but not limited to gross profits, net profits, profit growth, net operation profit or economic profit), profit return ratios or operating margin; budget or operating earnings (either before or after taxes or before or after allocation of corporate overhead and bonus); cash flow (including operating cash flow and free cash flow or cash flow return on capital); return on assets; return on capital or invested capital; cost of capital; return on shareholders’ equity; total shareholder return; return on sales; costs, reductions in costs and cost control measures; expenses; working capital; earnings or loss per share; adjusted earnings or loss per share; price per share or dividends per share (or appreciation in or maintenance of such price or dividends); regulatory achievements or compliance; implementation, completion or attainment of objectives relating to research, development, regulatory, commercial, or strategic milestones or developments; market share; economic value or economic value added models; division, group or corporate financial goals; customer satisfaction/growth; customer service; employee satisfaction; recruitment and maintenance of personnel; human resources management; supervision of litigation and other legal matters; strategic partnerships and transactions; financial ratios (including those measuring liquidity, activity, profitability or leverage); debt levels or reductions; sales-related goals; financing and other capital raising transactions; cash on hand; acquisition activity; investment sourcing activity; and marketing initiatives, any of which may be measured in absolute terms or as compared to any incremental increase or decrease. Such performance goals also may be based solely by reference to the company’s performance or the performance of a subsidiary, division, business segment or product line of the company or a subsidiary, or based upon performance relative to performance of other companies or upon comparisons of any of the indicators of performance relative to performance of other companies. When determining performance goals, the plan administrator may provide for exclusion of the impact of an event or occurrence which the plan administrator determines should appropriately be excluded, including, without limitation, non-recurring charges or events, acquisitions or divestitures, changes in the corporate or capital structure, events unrelated to the business or outside of the control of management, foreign exchange considerations, and legal, regulatory, tax or accounting changes.
Certain Transactions
In connection with certain corporate transactions and events affecting the ordinary shares of Clarivate, including a change in control, or change in any applicable laws or accounting principles, the plan administrator has broad discretion to take action under the 2019 Plan to prevent the dilution or enlargement of intended benefits, facilitate the transaction or event or give effect to the change in applicable laws or accounting principles. This includes cancelling awards for cash or property, accelerating the vesting of awards, providing for the assumption or substitution of awards by a successor entity, adjusting the number and type of shares subject to outstanding awards and/or with respect to which awards may be granted under the 2019 Plan and replacing or terminating awards under the 2019 Plan. In addition, in the event of certain non-reciprocal transactions with the shareholders of Clarivate, the plan administrator will make equitable adjustments to awards outstanding under the 2019 Plan as it deems appropriate to reflect the transaction.
159
Plan Amendment and Termination
The Clarivate board of directors may amend or terminate the 2019 Plan at any time; however, no amendment, other than an amendment that increases the number of shares available under the 2019 Plan, may materially and adversely affect an award outstanding under the 2019 Plan without the consent of the affected participant and shareholder approval will be obtained for any amendment to the extent necessary to comply with applicable laws. The 2019 Plan will remain in effect until the tenth anniversary of its effective date, unless earlier terminated by the Clarivate board of directors. No awards may be granted under the 2019 Plan after its termination.
Claw-Back Provisions, Transferability and Participant Payments
All awards will be subject to any company claw-back policy as set forth in such claw-back policy or the applicable award agreement. Except as the plan administrator may determine or provide in an award agreement, awards under the 2019 Plan are generally non-transferrable, except by will or the laws of descent and distribution, or, subject to the plan administrator’s consent, pursuant to a domestic relations order, and are generally exercisable only by the participant. With regard to tax withholding obligations arising in connection with awards under the 2019 Plan and exercise price obligations arising in connection with the exercise of options under the 2019 Plan, the plan administrator may, in its discretion, accept cash, wire transfer or check, Shares that meet specified conditions, a promissory note, a “market sell order,” such other consideration as the plan administrator deems suitable or any combination of the foregoing.
Executive Compensation Tables
2019 Summary Compensation Table
The following summary compensation table sets forth information concerning compensation paid or accrued to: (i) each person who served as our CEO during the fiscal year 2019, (ii) our chief financial officer, (iii) our three other most highly compensated executive officers who serve in such capacity as of the end of 2019, and (iv) one former executive officer who would have been included as one of our three other most highly compensated executive officers had she been serving in that capacity at the end of 2019.
| Name and principal position(1) | Year | Salary ($) | Stock ($)(2) | Option awards ($)(3) | Non-equity ($)(4) | All
other ($)(5) | Total ($) | |||||||||||||||||||||
| Jerre
Stead Executive Chairman and Chief Executive Officer | 2019 | 380,769 | 12,960,000 | 2,940,000 | 300,000 | 8,346 | 16,589,115 | |||||||||||||||||||||
| Richard Hanks
Chief Financial Officer | 2019 | 500,000 | -- | -- | 350,000 | 8,442 | 858,442 | |||||||||||||||||||||
Mukhtar Ahmed(6) President, Science Group | 2019 | 476,688 | -- | -- | 350,000 | 62,800 | 889,488 | |||||||||||||||||||||
| Jeff Roy President, IP Group | 2019 | 416,527 | -- | -- | 250,000 | 8,442 | 674,969 | |||||||||||||||||||||
Stephen Hartman(6) General Counsel and Global Head of Corporate Development | 2019 | 350,350 | -- | -- | 220,000 | 46,168 | 616,518 | |||||||||||||||||||||
| Jay Nadler Chief Executive Officer (Former) | 2019 | 363,462 | -- | -- | -- | 1,986,382 | 2,349,844 | |||||||||||||||||||||
Annette Thomas(6) CEO, Scientific and Academic Research (Former) | 2019 | 547,820 | -- | 5,853,715 | -- | 2,593,711 | 8,995,246 | |||||||||||||||||||||
| (1) | Mr. Stead was named Executive Chairman in connection with the closing of the Merger on May 13, 2019 and shortly thereafter, he agreed to expand his role to become our CEO effective June 30, 2019. Mr. Nadler served as our CEO prior to Mr. Stead and continued to serve as an advisor to the Company through year-end. Effective September 18, 2019, we entered into a separation agreement with Dr. Thomas. | |
| (2) | Represents the value of 1,000,000 Merger Shares based on the fair market value on the date of designation and calculated in accordance with FASB ASC Topic 718, excluding the effect of any estimated forfeitures. Information about the assumptions used to calculate the grant date fair value of the stock can be found in “Item 7. Management’s Discussion and Analysis of Financial Condition and Results of Operations - Note 3: Summary of Significant Accounting Policies - Share Based Compensation” and “Item 7. Management’s Discussion and Analysis of Financial Condition and Results of Operations - Note 17: Employment and Compensation Arrangements.” The reported amount does not include the value of the 400,000 Merger Shares over which Mr. Stead has retained the authority to designate, which were not designated as of December 31, 2019. As further described under “Pre-Merger Compensation” above, the Merger Shares were provided for in the Sponsor Agreement, the terms of which were negotiated on an arm’s length basis among the parties thereto. | |
| (3) | For Mr. Stead, the value of the option awards reflects the grant date fair value of stock options calculated in accordance with FASB ASC Topic 718, excluding the effect of any estimated forfeitures. As further described under “Pre-Merger Compensation” above, the stock options listed for Mr. Stead were provided for in the Sponsor Agreement, the terms of which were negotiated on an arm’s length basis among the parties thereto. For Dr. Thomas, the value of options reflects $5,553,629 of fair value related to stock options that were accelerated upon her termination and $300,086 in incremental expense related to the extension of exercise period for options that were vested at the time of her termination. The values for Dr. Thomas were calculated as of the modification date in accordance with FASB ASC Topic 718. Information about the assumptions used to calculate the grant date fair value of the stock options can be found in “Item 7. Management’s Discussion and Analysis of Financial Condition and Results of Operations – Note 3: Summary of Significant Accounting Policies - Share Based Compensation” and “Note 17: Employment and Compensation Arrangements.” | |
| (4) | Represents annual incentive payments under our AIP that will be paid in March 2020 for 2019 performance. | |
| (5) | The table below provides a breakdown of All Other Compensation in 2019 for our NEOs: |
160
| Description | Jerre Stead | Richard Hanks | Mukhtar Ahmed | Jeff Roy | Stephen Hartman | Jay Nadler | Annette Thomas | |||||||||||||||||||||
| Matching Contributions to Retirement Plans ($)(a) | 8,250 | 8,250 | 41,866 | 8,250 | 38,539 | 8,250 | ||||||||||||||||||||||
| Pension Allowance ($) | 33,055 | |||||||||||||||||||||||||||
| Life Insurance ($) | 96 | 192 | 550 | 192 | 367 | 96 | 432 | |||||||||||||||||||||
| Car Allowance ($) | 20,384 | 7,262 | ||||||||||||||||||||||||||
| Benefits Continuation ($) | 22,844 | |||||||||||||||||||||||||||
| Advisor Payments ($)(b) | 1,150,000 | |||||||||||||||||||||||||||
| Legal Fees ($)(c) | 35,000 | 12,740 | ||||||||||||||||||||||||||
| Notice Payment ($)(d) | 254,284 | |||||||||||||||||||||||||||
| Severance ($)(e) | 750,000 | 2,293,200 | ||||||||||||||||||||||||||
| Vacation Payout at Termination | 20,192 | |||||||||||||||||||||||||||
| Totals ($) | 8,346 | 8,442 | 62,800 | 8,442 | 46,168 | 1,986,382 | 2,593,711 | |||||||||||||||||||||
| (a) | For Messrs. Stead, Hanks, Roy and Nadler, the matching contributions to retirement plans were under the Company’s 401(k) plan offered to employees located in the U.S. For Messrs. Ahmed and Hartman, the matching contributions to retirement plans were under the Company’s defined contribution plan offered to employees located in the UK. |
| (b) | Mr. Nadler received a payment of $350,000 for ongoing advisory services from the date of his termination through December 31, 2019. In addition, because he made himself available to provide advisory services as provided in his separation agreement, in March 2020, Mr. Nadler will receive a full-year non-pro-rated AIP payment at target level performance in the amount of $800,000. |
| (c) | Mr. Nadler and Dr. Thomas received reimbursement of certain legal fees related to their separations. |
| (d) | Dr. Thomas received a notice payment in lieu of the United Kingdom’s required three-month notice period for salary and benefits. |
| (e) | Mr. Nadler’s severance represents only payments made in 2019 as continuation of his severance benefits is contingent upon him remaining in compliance with restrictive covenants set forth in his original employment agreement, including a non-compete covenant. |
| (6) | Messrs. Ahmed and Hartman and Dr. Thomas received cash payments in British Pounds. For purposes of the compensation tables, we used a GBP:USD exchange rate of 1.274 to convert their cash payments received to US dollars. |
Grants of Plan Based Awards During Fiscal Year 2019
The following table provides information regarding grants of plan-based awards to our NEOs.
| Estimated future payouts under non-equity incentive plan awards(1) | ||||||||||||||||||||||||||||||||
| Name | Grant date | Approval date | Threshold ($) | Target ($) | Maximum ($) | All other stock awards: Number of shares of stock or units (#) | All other option awards: Number of securities underlying options (#)(2) | Exercise or base price of option awards ($/Sh) | Grant date fair value of stock and option awards ($) | |||||||||||||||||||||||
| Jerre Stead | -- | 600,000 | 1,200,000 | |||||||||||||||||||||||||||||
| 5/20/2019 | 5/20/2019 | 1,000,000 | (3) | 13.30 | 2,940,000 | |||||||||||||||||||||||||||
| 5/26/2019 | 5/26/2019 | 1,000,000 | (4) | 12,960,000 | ||||||||||||||||||||||||||||
| Richard Hanks | -- | 344,555 | 689,110 | |||||||||||||||||||||||||||||
| Mukhtar Ahmed | -- | 434,207 | 868,414 | |||||||||||||||||||||||||||||
| Jeff Roy | -- | 291,095 | 582,190 | |||||||||||||||||||||||||||||
| Stephen Hartman | -- | 204,187 | 408,374 | |||||||||||||||||||||||||||||
| Jay Nadler | -- | -- | -- | |||||||||||||||||||||||||||||
| Annette Thomas(5) | -- | -- | -- | |||||||||||||||||||||||||||||
| 9/18/2019 | 9/16/2019 | 286,525 | 6.76 | 3,061,277 | ||||||||||||||||||||||||||||
| 9/18/2019 | 9/16/2019 | 204,626 | 10.39 | 1,474,084 | ||||||||||||||||||||||||||||
| 9/18/2019 | 9/16/2019 | 204,626 | 14.18 | 805,846 | ||||||||||||||||||||||||||||
| 9/18/2019 | 9/19/2019 | 122,807 | 17.96 | 212,422 | ||||||||||||||||||||||||||||
| (1) | The threshold, target and maximum amounts shown under “Estimated Future Payouts Under Non-Equity Incentive Plan Awards” reflect the ranges of payments that could be made under the AIP. Actual payments under the AIP are shown in the Summary Compensation Table. Because Mr. Nadler and Dr. Thomas terminated employment before the end of fiscal year 2019, they were not eligible to receive an AIP payout based on year-end performance. |
| (2) | Stock options were granted pursuant to the 2019 Incentive Plan. |
| (3) | As further described under “Pre-Merger Compensation” above, the stock options listed for Mr. Stead were provided for in the Sponsor Agreement, the terms of which were negotiated on an arm’s length basis among the parties thereto. |
| (4) | Represents the value of 1,000,000 Merger Shares based on the fair market value on the date of designation and calculated in accordance with FASB ASC Topic 718, excluding the effect of any estimated forfeitures. Information about the assumptions used to calculate the grant date fair value of the stock can be found in “Item 7. Management’s Discussion and Analysis of Financial Condition and Results of Operations - Note 17: Employment and Compensation Arrangements.” As further described under “Pre-Merger Compensation” above, the Merger Shares were provided for in the Sponsor Agreement, the terms of which were negotiated on an arm’s length basis among the parties thereto. |
| (5) | The option awards listed for Dr. Thomas show the details of the accelerated vesting of her unvested stock options, pursuant to the terms of her separation agreement, as further described in “Former Officer Agreement.” The number of securities underlying her stock options is the number of stock options accelerated. The exercise price is the original exercise price of the accelerated stock options, and the amounts shown for grant date fair value includes $5,553,629 of fair value related to stock options that were accelerated upon her termination and excludes $300,086 of incremental expense related to the extension of the exercise period for her stock options that were vested upon her termination. |
161
Outstanding Equity Awards at Fiscal Year-End
The following table provides information concerning the outstanding equity awards held by the NEOs at the end of fiscal year 2019. Except for our CEO, our NEOs were holding only stock options at the end of the fiscal year; none were holding stock awards.
| Option awards | Stock awards | |||||||||||||||||||
| Name | Number of securities underlying unexercised options (#) exercisable | Number of securities underlying unexercised options (#) unexercisable | Option exercise price ($) | Option expiration date | Number of shares or units of stock that have not vested(#) | Market value of shares or units of stock that have not vested ($) | ||||||||||||||
| Jerre Stead | 1,000,000 | (1) | -- | 13.30 | 5/19/2029 | |||||||||||||||
| 1,000,000(8) | 16,800,000 | |||||||||||||||||||
| Richard Hanks | 147,992 | 221,990 | (2) | 6.61 | 3/2/2027 | |||||||||||||||
| 105,710 | 158,563 | (2) | 10.39 | 3/2/2027 | ||||||||||||||||
| 105,710 | 158,563 | (2) | 14.18 | 3/2/2027 | ||||||||||||||||
| 63,426 | 95,138 | (2) | 17.96 | 3/2/2027 | ||||||||||||||||
| 14,271 | 9,513 | (3) | 6.61 | 5/22/2027 | ||||||||||||||||
| Mukhtar Ahmed | 46,248 | 184,991 | (4) | 6.91 | 3/7/2028 | |||||||||||||||
| 33,034 | 132,136 | (4) | 10.85 | 3/7/2028 | ||||||||||||||||
| 33,034 | 132,136 | (4) | 14.78 | 3/7/2028 | ||||||||||||||||
| 19,820 | 79,282 | (4) | 18.72 | 3/7/2028 | ||||||||||||||||
| Jeff Roy | 73,996 | 110,995 | (5) | 6.76 | 9/4/2027 | |||||||||||||||
| 52,854 | 79,282 | (5) | 10.39 | 9/4/2027 | ||||||||||||||||
| 52,854 | 79,282 | (5) | 14.18 | 9/4/2027 | ||||||||||||||||
| 31,712 | 47,570 | (5) | 17.96 | 9/4/2027 | ||||||||||||||||
| 7,928 | 11,892 | (5) | 6.76 | 9/4/2027 | ||||||||||||||||
| Stephen Hartman | 50,661 | 33,774 | (6) | 6.61 | 3/2/2027 | |||||||||||||||
| 36,153 | 24,101 | (6) | 10.39 | 3/2/2027 | ||||||||||||||||
| 36,153 | 24,101 | (6) | 14.18 | 3/2/2027 | ||||||||||||||||
| 21,723 | 14,482 | (6) | 17.96 | 3/2/2027 | ||||||||||||||||
| 79,281 | 52,855 | (6) | 6.61 | 5/22/2027 | ||||||||||||||||
| 16,887 | 67,548 | (7) | 8.14 | 11/12/2028 | ||||||||||||||||
| 12,051 | 48,203 | (7) | 12.68 | 11/12/2028 | ||||||||||||||||
| 12,051 | 48,203 | (7) | 17.23 | 11/12/2028 | ||||||||||||||||
| 7,241 | 28,964 | (7) | 21.78 | 11/12/2028 | ||||||||||||||||
| Jay Nadler | 863,098 | -- | 6.61 | 3/2/2027 | ||||||||||||||||
| 1,970,422 | -- | 10.39 | 3/2/2027 | |||||||||||||||||
| 1,970,422 | -- | 14.18 | 3/2/2027 | |||||||||||||||||
| 1,182,226 | -- | 17.96 | 3/2/2027 | |||||||||||||||||
| Annette Thomas | 477,541 | -- | 6.76 | 12/31/2022 | ||||||||||||||||
| 341,044 | -- | 10.39 | 12/31/2022 | |||||||||||||||||
| 341,044 | -- | 14.18 | 12/31/2022 | |||||||||||||||||
| 204,679 | -- | 17.96 | 12/31/2022 | |||||||||||||||||
| (1) | Represents stock options allocated to Mr. Stead. As further described under “Pre-Merger Compensation” above, the stock options were provided for in the Sponsor Agreement, the terms of which were negotiated on an arm’s length basis among the parties thereto. |
| (2) | 40% of each of Mr. Hanks’ option awards expiring on March 2, 2027 was vested as of December 31, 2019 and 20% will vest on each of March 1, 2020; March 1, 2021; and March 1, 2022. |
| (3) | 60% of Mr. Hanks’ option award expiring on May 22, 2027 was vested as of December 31, 2019 and 20% will vest on each of October 3, 2020 and October 3, 2021. |
| (4) | 20% of each of Mr. Ahmed’s option awards was vested as of December 31, 2019 and 20% will vest on each of February 13, 2020; February 13, 2021; February 13, 2022; and February 13, 2023. |
| (5) | 40% of each of Mr. Roy’s option awards was vested as of December 31, 2019 and 20% will vest on each of July 1, 2020; July 1, 2021; and July 1, 2022. |
| (6) | 60% of each of Mr. Hartman’s option awards expiring on March 2, 2027 and May 22, 2027 were vested as of December 31, 2019 and 20% will vest on each of October 3, 2020 and October 3, 2021. |
| (7) | 20% of each of Mr. Hartman’s option awards expiring on November 12, 2028 were vested as of December 31, 2019 and 20% will vest on each of November 13, 2020; November 13, 2021; November 13, 2022; and November 13, 2023. | |
| (8) | Represents the value of Mr. Stead’s allocated and unissued 1,000,000 Merger Shares based on the $16.80 closing price of Clarivate stock on December 31, 2019. The Merger Shares are further described under “Pre-Merger Compensation” above. |
162
Option Exercises and Stock Vested in 2019 Table
The following table provides information concerning stock options that were exercised by the NEOs during fiscal year 2019. Only Mr. Nadler exercised options. None of our NEOs received shares upon vesting of stock awards during fiscal year 2019.
| Name | Number of Shares Acquired Upon Exercise (#) | Value Realized on Exercise ($) | ||||||
| Jay Nadler | 2,357,997 | (1) | 24,457,399 | |||||
| (1) | Mr. Nadler used a net share exercise method through which 918,401 shares were withheld for the option exercise price, and 1,439,596 shares were issued to Mr. Nadler. |
Pension Benefits and Nonqualified Deferred Compensation
We do not provide any pension plan, supplemental retirement plan, or deferred compensation plan benefits to our NEOs. We do provide company matches to employee contributions to qualified retirement plans and these are reported as All Other Compensation in the Summary Compensation Table.
Employment Contracts
Our CEO does not have an employment agreement.
NEO Agreements, other than CEO
In prior years, we entered in employment agreements with Messrs. Hanks, Ahmed, Roy, and Hartman.
On March 1, 2017, the Company entered into an employment agreement with Mr. Hanks. Mr. Hanks’ employment agreement provides for an annual base salary to be reviewed at the discretion of management and the Compensation Committee and each salary adjustment is dependent on performance. Mr. Hanks is eligible to (a) participate in the AIP and is entitled to participate in employee benefits plans, programs and arrangements as are customarily accorded to our executives, and (b) participate in our 2019 Incentive Plan. In the event of an involuntary termination without cause, Mr. Hanks is eligible to receive 18 months’ of annual base salary continuation and a payment equal to 1.5 times his AIP target, as well as 18 months’ of continued benefits coverage. Payment of severance is contingent upon Mr. Hanks entering into a separation agreement, including a release of claims, with the Company. There is no eligibility for severance benefits if Mr. Hanks voluntarily resigns or the Company terminates him for cause. Mr. Hanks’ employment agreement does not constitute a contract of employment, does not entitle him to employment for any specified period and employment will continue to be considered “at will.”
Under his stock option agreements, Mr. Hanks is subject to confidentiality and intellectual property provisions and 12-month post-termination restrictive covenants related to non-competition and non-solicitation of employees and customers. His stock option agreements provide for accelerated vesting in the event of a Liquidity Event.
On January 1, 2018, the Company entered into an employment agreement with Mr. Ahmed, which constitutes a UK contract of employment. Mr. Ahmed’s employment agreement provides for an annual base salary to be reviewed at the discretion of management and the Compensation Committee and each salary adjustment is dependent on performance. Mr. Ahmed is eligible to (a) participate in the AIP and is entitled to participate in employee benefits plans, programs and arrangements as are customarily accorded to our executives, and (b) participate in our 2019 Incentive Plan. In the event of an involuntary termination without cause as defined in the agreement, Mr. Ahmed is eligible to receive one year of annual salary. Payment of severance is contingent upon Mr. Ahmed entering into a separation agreement, including a release of claims, with the Company. There is no eligibility for severance benefits if Mr. Ahmed voluntarily resigns or the Company terminates him for cause. Under the terms of his employment agreement, Mr. Ahmed is subject to confidentiality and intellectual property provisions and 12-month post-termination restrictive covenants related to non-competition and non-solicitation of employees, customers and suppliers.
Mr. Ahmed’s stock option agreements provide for accelerated vesting in the event of a Liquidity Event.
163
On September 5, 2017, the Company entered into an employment agreement with Mr. Roy. Mr. Roy’s employment agreement provides for an annual base salary to be reviewed at the discretion of management and the Compensation Committee and each salary adjustment is dependent on performance. Mr. Roy is eligible to (a) participate in the AIP and is entitled to participate in employee benefits plans, programs and arrangements as are customarily accorded to our executives, and (b) participate in our 2019 Incentive Plan. In the event of an involuntary termination without cause, Mr. Roy is eligible to receive 52 weeks’ severance of annual base salary continuation and 52 weeks’ continued benefits coverage. Mr. Roy is also entitled to be paid a prorated bonus if he is terminated without cause on or after April 1 of the year of termination. Payment of severance is contingent upon Mr. Roy entering into a separation agreement, including a release of claims, with the Company. There is no eligibility for severance benefits if Mr. Roy voluntarily resigns or the Company terminates him for cause. Mr. Roy’s employment agreement does not constitute a contract of employment, does not entitle him to employment for any specified period and employment will continue to be considered “at will.”
Under his stock option agreements, Mr. Roy is subject to confidentiality and intellectual property provisions and 12-month post-termination restrictive covenants related to non-competition and non-solicitation of employees and customers. His stock option agreements provide for accelerated vesting in the event of a Liquidity Event as defined in the 2019 Incentive Plan.
On April 22, 2013, the Company entered into an employment agreement with Mr. Hartman which constitutes a UK contract of employment. Mr. Hartman’s employment agreement provides for an annual base salary to be reviewed at the discretion of management and the Compensation Committee and each salary adjustment is dependent on performance. Mr. Hartman is eligible to participate in the AIP and is entitled to participate in employee benefits plans, programs and arrangements as are customarily accorded to our executives. Mr. Hartman’s employment agreement does not entitle him to severance in any termination event. Under the terms of his employment agreement, Mr. Hartman is subject to confidentiality and intellectual property provisions and six-month post-termination restrictive covenants related to non-competition and non-solicitation of employees, customers and suppliers.
Mr. Hartman’s stock option agreements provide for accelerated vesting in the event of a Liquidity Event.
Former CEO Agreements
Prior to 2019, the Company had an employment agreement with Mr. Nadler that provided for the following benefits in the event his employment was involuntarily terminated without “cause” (as defined in his employment agreement), subject to Mr. Nadler executing and not revoking a release of claims in favor of the Company: cash severance equal to 18 months’ of annual base salary continuation and payment of his AIP incentive at 1.5 times target payout for the year of termination, payment equal to the value of welfare benefits under the Consolidated Omnibus Budget Reconciliation Act of 1985 (“COBRA”) for the earlier to occur of (a) 18 months (the severance period), (b) the date he is no longer eligible for welfare benefits under COBRA, or (c) the date when he is eligible to receive benefits from a subsequent employer, and acceleration of stock options due to vest in the 12 month period following the termination date, with exercisability through the earlier of 18 months following the termination date or the full original term of the stock options. Additionally, to the extent unpaid as of his termination date, Mr. Nadler was entitled to a cash payment equivalent to the annual incentive for the prior year on the basis of actual performance achieved.
In April 2019, prior to the close of the Merger, Mr. Nadler’s employment agreement was amended to provide increased benefits in the event his employment was involuntarily terminated without “cause,” subject to Mr. Nadler executing and not revoking a release of claims in favor of the Company, including cash severance equal to 24 months’ of annual base salary continuation and payment of his AIP incentive at two times his target payout for the year of termination, and payment equal to the value of welfare benefits under COBRA for the earlier to occur of (a) 24 months (the severance period), (b) the date he is no longer eligible for welfare benefits under COBRA, or (c) the date when he is eligible to receive benefits from a subsequent employer. Mr. Nadler’s employment agreement was further amended to provide that, in the event of his termination without cause within 12 months following a “change in control” (as defined in his employment agreement), the vesting of all outstanding, unvested stock options would be accelerated and the options would remain exercisable through the earlier of 24 months following the termination date or the full original term of the options.
164
Upon his separation from the Company in June 2019, we entered into a separation agreement that provided the following benefits, subject to Mr. Nadler entering into a release of claims in favor of the Company:
| · | A severance payment of $3,000,000, which represents two times the sum of annual base salary and target AIP incentive which is payable in equal monthly installments over the 24-month period following the termination date | |
| · | Payment in an amount equal to the Company’s portion of payments which would have been required to be paid to continue medical, dental and vision coverage for Mr. Nadler and his dependents under the Company’s group healthcare plans under COBRA if Mr. Nadler and his dependents elect COBRA coverage for a 24-month period (the “COBRA Payment”) | |
| · | Accelerated vesting of 5,006,501 stock options which remain exercisable for the remainder of their term | |
| · | A contribution of $35,000 towards legal fees related to his separation | |
| · | In exchange for Mr. Nadler’s ongoing advisory services to the Company through December 31, 2019, (x) a payment of $350,000 in equal monthly installments beginning on July 1, 2019 through December 31, 2019, (y) an amount equal to six times the monthly amount of the COBRA Payment in equal monthly installments beginning on July 1, 2019 through December 2019, and (z) a payment of $800,000 relating to his target AIP incentive to be paid in March 2020. |
In the separation agreement, Mr. Nadler agreed to abide by the restrictive covenants included in his amended employment agreement, including a 24-month post-termination non-competition covenant. Mr. Nadler’s continued severance is subject to his remaining in compliance with these covenants through the 24-month payment period.
Former Officer Agreement
Effective September 18, 2019, we entered into a separation agreement with Dr. Thomas. In recognition of the terms of Dr. Thomas’s employment agreement, her tenure and her agreement to release the Company from any and all claims, Dr. Thomas received certain payments described below. These payments were made in British Pounds Sterling and are reported here in U.S. currency, using a GBP:USD exchange rate of 1.274.
| · | A payment of $254,283 for payment in lieu of her 3 months’ notice period related to salary and benefits, including accrued annual leave | |
| · | A severance payment of $2,293,200 representing 12 months annual base salary and two times the sum of target AIP incentive | |
| · | Accelerated vesting of 818,584 stock options | |
| · | A contribution of $12,740 towards legal fees related to her separation |
In the separation agreement Dr. Thomas agreed to abide by the confidentiality and intellectual property covenants set forth in her original employment agreement, in addition to the restrictive covenants set forth in her separation agreement, including a 12-month post-termination non-competition covenant.
165
Potential Payments Upon Termination or Change in Control
The information in the table below provides the estimated value of compensation that would have been paid to each of the NEOs in the event the NEO was involuntarily terminated by the Company for reason other than cause on December 31, 2019. Messrs. Stead and Hartman are not entitled to any payments upon termination. Other than the accelerated vesting of stock options that would occur in a Liquidity Event, none of the current NEOs would receive additional payments or benefits should their terminations be related to or following a change in control.
| Potential Payments Upon Termination | ||||||||||||||||||||||||||||
| Name | Salary and AIP(1) ($) | Continued benefits(1) ($) | Equity awards ($) | Consulting services ($) | Legal fees ($) | Notice fees(2) ($) | Total ($) | |||||||||||||||||||||
| Jerre Stead | -- | -- | -- | -- | -- | -- | -- | |||||||||||||||||||||
| Richard Hanks | 1,387,500 | 31,309 | -- | -- | -- | -- | 1,418,809 | |||||||||||||||||||||
| Mukhtar Ahmed | 573,300 | -- | -- | -- | -- | -- | 573,300 | |||||||||||||||||||||
| Jeff Roy | 832,500 | 23,329 | -- | -- | -- | -- | 855,829 | |||||||||||||||||||||
| Stephen Hartman | -- | -- | -- | -- | -- | -- | -- | |||||||||||||||||||||
| Jay Nadler(3) | 3,000,000 | 45,690 | 24,267,554 | (4) | 1,150,000 | 35,000 | -- | 28,498,244 | ||||||||||||||||||||
| Annette Thomas(3) | 2,293,200 | -- | 5,009,752 | (4) | -- | 12,750 | 254,283 | 7,569,985 | ||||||||||||||||||||
| (1) | See “Employment Contracts” for a description of how salary, AIP and continued benefits are determined for each NEO. |
| (2) | Under UK employment law, a payment may be made in lieu of a termination notice period. We have not reported such a notice payment for our current NEOs based in the UK as they may be required to remain in service through the notice period. |
| (3) | Amounts reported for Mr. Nadler and Dr. Thomas reflect actual values pursuant to their respective termination agreements. |
| (4) | The vesting of Mr. Nadler’s and Dr. Thomas’ unvested stock options was accelerated in connection with their terminations. The values shown are equal to the difference between the value of Clarivate stock on Mr. Nadler’s and Dr. Thomas’ respective termination dates less the applicable exercise prices of the accelerated options, multiplied by the number of accelerated options. |
Other than Mr. Stead, whose stock options are currently vested, each NEO’s stock options provide for accelerated vesting in the event of a Liquidity Event. There are no other benefits to the NEOs in the event of a Liquidity Event or other form of change in control. The information in the table below provides the value of unvested stock options that would have been accelerated had there been a Liquidity Event on December 31, 2019.
| Potential Payment Upon A Liquidity Event | ||||
| Name | Value of accelerated stock options(1) ($) | |||
| Jerre Stead | -- | |||
| Richard Hanks | 3,790,839 | |||
| Mukhtar Ahmed | 2,882,685 | |||
| Jeff Roy | 1,949,702 | |||
| Stephen Hartman | 1,883,944 | |||
| (1) | The value of the stock options is calculated by multiplying (x) the difference between $16.80, the closing price of our stock on December 31, 2019 and the exercise price, by (y) the number of stock options accelerated. Stock options that have an exercise price greater than $16.80 are not included in the calculation above. |
166
CEO Pay Ratio
Below is (i) the 2019 annual total compensation of our CEO; (ii) the 2019 annual total compensation of our median employee; (iii) the ratio of the annual total compensation of our CEO to that of our median employee; and (iv) the methodology we used to calculate our CEO pay ratio.
| CEO Pay Ratio | ||||
| CEO Annual Total Compensation | 16,598,115 | |||
| Median Employee Annual Total Compensation | 51,217 | |||
| Estimated CEO to Median Employee Pay Ratio | 324:1 | |||
As noted in the footnotes to the “Summary Compensation Table” and in “Pre-Merger Compensation,” Mr. Stead received Merger Shares and stock options in connection with the Merger. While we are required to report the Merger Shares and stock options designated for Mr. Stead as compensation under the rules of the SEC, these equity grants were received by Mr. Stead in his role as a founder of Churchill and were part of the terms of the Merger, which were negotiated on an arm’s length basis among the parties to the Sponsor Agreement, and not a decision of the Compensation Committee. The Merger Shares and stock options were not part of his CEO compensation, as determined by the Compensation Committee. If the values of the Merger Shares and stock options are excluded from the CEO Pay Ratio, the ratio is as follows:
| Alternative CEO Pay Ratio | ||||
| CEO Annual Total Compensation (excluding Merger Shares and stock options related to the Merger) | 698,115 | |||
| Median Employee Annual Total Compensation | 51,217 | |||
| Estimated CEO to Median Employee Pay Ratio | 14:1 | |||
Methodology
Our CEO pay ratio is a reasonable estimate calculated in a manner consistent with SEC rules. Our methodology and process are explained below.
| · | Employee population: We selected December 1, 2019 as the date to determine the median employee. At that time, we had approximately 4,624 employees globally, comprised of 1,396 employees located in the U.S. and 3,228 employees located outside of the U.S. |
| · | We included all full-time, part-time, seasonal and temporary employees worldwide, excluding our CEO, except that we relied on the De Minimis Exemption to decrease the number of countries where we obtained data. The impact of this exemption is less than 5% of our workforce, as permitted by the De Minimis Exemption. We excluded the 217 employees in the jurisdictions identified below. |
| Country | Number of employees excluded | |||
| Austria | 1 | |||
| Azerbaijan | 1 | |||
| Brazil | 16 | |||
| Canada | 20 | |||
| Chile | 2 | |||
| Colombia | 1 | |||
| Czech Republic | 4 | |||
| Denmark | 8 | |||
| Egypt | 1 | |||
| Finland | 1 | |||
| Hong Kong | 2 | |||
| Ireland | 1 | |||
| Italy | 17 | |||
| Kazakhstan | 2 | |||
| Korea, Republic of | 32 | |||
| Mexico | 8 | |||
| New Zealand | 21 | |||
| Poland | 3 | |||
| Russian Federation | 12 | |||
| Singapore | 28 | |||
| South Africa | 4 | |||
| Taiwan | 12 | |||
| Thailand | 1 | |||
| Turkey | 2 | |||
| Ukraine | 1 | |||
| United Arab Emirates | 16 | |||
| · | Of the 4,407 employees included in the CEO Pay Ratio calculation, 1,396 were in the U.S. and 3,011 were located outside of the U.S. |
| · | Median employee: For purposes of this calculation, for each employee we used total base pay (including commissions, allowances, and additional month pay where applicable). We identified employees within $1,000 of the median and removed those employees who had anomalous compensation characteristics to determine the median employee. We then calculated the compensation of the median employee using the same methodology we used to calculate the CEO’s compensation reported in the Summary Compensation Table. |
| · | SEC rules for identifying the median employee and calculating the pay ratio based on that employee’s annual total compensation allow companies to adopt a variety of methodologies, to apply certain exclusions, and to make reasonable estimates and assumptions that reflect their employee populations and compensation practices. As a result, the pay ratio reported by other companies may not be comparable to the pay ratio reported above, as other companies have different employee populations and compensation practices and may utilize different methodologies, exclusions, estimates and assumptions in calculating their own pay ratios. In addition, the median employee’s annual total compensation is unique to that individual, and therefore, is not an indicator of the annual total compensation of any other individual or group of employees. |
167
Item 12. Security Ownership of Certain Beneficial Owners and Management and Related Stockholder Matters
The following table and accompanying footnotes present information relating to the beneficial ownership of our ordinary shares as of December 31, 2019 and shows the number of shares and percentage of outstanding common shares owned by:
| • | each person or entity who is known by us to own beneficially 5% or more of our common shares; |
| • | each of our directors and executive officers, individually; and |
| • | all directors and executive officers as a group. |
Unless otherwise indicated, the business address of each of the individuals is c/o Clarivate Analytics Plc, Friars House, 160 Blackfriars Road, London, SE1 8EZ, UK.
| Amount and Nature of Beneficial Ownership | ||||||||
| Beneficial Owner | Number | Percent | ||||||
| Five Percent Holders: | ||||||||
| Onex(1) | 92,240,031 | 30.1 | % | |||||
| Baring(2) | 35,871,123 | 11.7 | % | |||||
| T. Rowe Price Associates, Inc.(3) | 37,968,527 | 12.4 | % | |||||
| Directors and Executive Officers: | ||||||||
| Jerre Stead(4) | 12,505,963 | 4.1 | % | |||||
| Sheryl von Blucher(5) | 3,556,684 | 1.2 | % | |||||
| Martin Broughton(6) | 532,279 | * | ||||||
| Kosty Gilis(7) | — | — | ||||||
| Balakrishnan S. Iyer(8) | 532,279 | * | ||||||
| Michael Klein(9) | 19,878,342 | 6.5 | % | |||||
| Nicholas Macksey(10) | — | — | ||||||
| Karen G. Mills(11) | 532,279 | * | ||||||
| Charles E. Moran | — | — | ||||||
| Amir Motamedi(12) | — | — | ||||||
| Anthony Munk(13) | — | — | ||||||
| Charles J. Neral(14) | 26,427 | * | ||||||
| Matthew Scattarella(15) | — | — | ||||||
| Mukhtar Ahmed(16) | 132,136 | * | ||||||
| Richard Hanks(17) | 437,108 | * | ||||||
| Stephen Hartman(18) | 404,339 | * | ||||||
| Jeff Roy(19) | 219,344 | * | ||||||
| All directors and executive officers as a group (17 individuals) | 38,757,180 | 12.6 | % | |||||
*Less than one percent.
168
| (1) | Includes: (i) 33,597,790 ordinary shares held by Onex Partners IV LP, (ii) 2,258,718 ordinary shares held by Onex Partners IV PV LP, (iii) 236,521 ordinary shares held by Onex Partners IV Select LP, (iv) 977,150 ordinary shares held by Onex Partners IV GP LP, (v) 1,258,995 ordinary shares held by Onex US Principals LP, (vi) 31,898,163 ordinary shares held by Onex Partners Holdings LLC, (vii) 2,019,440 ordinary shares held by New PCO II Investment Ltd. and (viii) 19,993,254 ordinary shares held by Onex Camelot Co-Invest LP. Onex Corporation, a corporation whose subordinated voting shares are traded on the Toronto Stock Exchange, and/or Mr. Gerald W. Schwartz, may be deemed to beneficially own the ordinary shares held by (a) Onex Partners IV LP, through Onex Corporation’s ownership of all of the equity of Onex Partners Canadian GP Inc., which owns all of the equity of Onex Partners IV GP Limited, the general partner of Onex Partners IV GP LP, the general partner of Onex Partners IV LP, (b) Onex Partners IV PV LP, through Onex Corporation’s ownership of all of the equity of Onex Partners Canadian GP Inc., which owns all of the equity of Onex Partners IV GP Limited, the general partner of Onex Partners IV GP LP, the general partner of Onex Partners IV PV LP, (c) Onex Partners IV Select LP, through Onex Corporation’s ownership of all of the equity of Onex Partners Canadian GP Inc., which owns all of the equity of Onex Partners IV GP LLC, the general partner of Onex Partners IV Select LP, (d) Onex Partners IV GP LP, through Onex Corporation’s ownership of all of the equity of Onex Partners Canadian GP Inc., which owns all of the equity of Onex Partners IV GP Limited, the general partner of Onex Partners IV GP LP, (e) Onex US Principals LP, through Onex Corporation’s ownership of all of the equity of Onex American Holdings II LLC, which owns all of the equity of Onex American Holdings GP LLC, the general partner of Onex US Principals LP, (f) Onex Partners Holdings LLC, through Onex Corporation’s ownership of all of the equity of Onex American Holdings II LLC, which owns all of the equity of Onex American Holdings Subco III LLC, which in turn owns all of the equity of Onex Partners Holdings LLC, (g) New PCO II Investment Ltd., through Gerald W. Schwartz’s indirect control of 1597257 Ontario Inc., which owns all of the voting equity of New PCo II Investments Ltd., and (h) Onex Camelot Co-Invest LP, through Onex Corporation’s ownership of all of the equity of Onex Partners Canadian GP Inc., which owns all of the equity of Onex Partners IV GP Limited, the general partner of Onex Partners IV GP LP, the general partner of Onex Camelot Co-Invest LP. Mr. Gerald W. Schwartz, the Chairman, President and Chief Executive Officer of Onex Corporation, indirectly owns shares representing a majority of the voting rights of the shares of Onex Corporation, and as such may be deemed to beneficially own all of the ordinary shares beneficially owned by Onex Corporation. Mr. Schwartz disclaims such beneficial ownership. The address for Onex Corporation and Mr. Schwartz is 161 Bay Street, Toronto, ON M5J 2S1 Canada. |
| (2) | The Baring Asia Private Equity Fund VI, L.P.1 (“Fund VI1”) and The Baring Asia Private Equity Fund VI, L.P.2 (“FundVI2”) and certain affiliates indirectly hold approximately 35,871,123 ordinary shares. The general partner of Fund VI1 and Fund VI2 is Baring Private Equity Asia GP VI, L.P. (“Fund VI GP”). The general partner of Fund VI GP is Baring Private Equity Asia GP VI Limited (“Fund VI Limited”). As the sole shareholder of Fund VI Limited, Jean Eric Salata may be deemed to have voting and dispositive power with respect to the shares beneficially owned by Fund VI and Fund VI2 and their affiliates, but disclaims beneficial ownership of such shares. The address of Fund VI GP, Fund VI Limited, and Jean Eric Salata is c/o Maples Corporate Services Limited, 390 GT Ugland House, South Church Street, Georgetown, Grand Cayman, Cayman Islands. |
| (3) | The information in the table above is based solely on information contained in this shareholder’s Schedule 13D or Schedule 13G under the Exchange Act filed by such shareholder with the SEC. The address of T. Rowe Price Associates, Inc. is 100 East Pratt Street, Baltimore, Maryland 21202. |
| (4) | Includes (i) 3,540,963 shares held by Mr. Stead, (ii) 1,000,000 ordinary shares held by JMJS Group - II, LP, an affiliate of Mr. Stead, (iii) 1,000,000 ordinary shares held by Mr. Stead issuable upon the exercise of options exercisable, and (iv) 6,965,000 ordinary shares issuable upon the exercise of warrants held by Mr. Stead. |
| (5) | Includes 3,282,684 ordinary shares. The columns reflecting shares beneficially owned after the offering also include 274,000 ordinary shares issuable upon the exercise of warrants held by Ms. von Blucher. |
| (6) | Includes (i) 258,279 ordinary shares and (ii) 274,000 ordinary shares issuable upon the exercise of warrants. |
| (7) | Does not include ordinary shares held by funds managed by an affiliate of Onex Corporation. Mr. Gilis is a managing director of Onex Corporation. Mr. Gilis does not have voting or investment power with respect to the shares held by such funds. |
169
| (8) | Includes (i) 258,279 ordinary shares and (ii) 274,000 ordinary shares issuable upon the exercise of warrants held by the Iyer Family Trust dated 1/25/2001. Mr. Iyer, as trustee, has voting and investment power over these shares. |
| (9) | Includes (i) 500,000 ordinary shares held by Mr. Klein, (ii) 5,655,738 ordinary shares held by Garden State Capital Partners LLC, (iii) 3,695,778 ordinary shares held by M. Klein Associates, Inc., and (iv) 4,026,826 ordinary shares and 6,000,000 ordinary shares issuable upon the exercise of warrants held by M. Klein Associates, Inc. and Garden State, respectively. Mr. Klein holds an equity interest in and is the managing member of Garden State Capital Partners LLC and is the sole stockholder of M. Klein Associates, Inc. In such capacities, Mr. Klein is deemed to have voting and investment power over these shares. The address of Garden State Capital Partners LLC and M. Klein Associates, Inc. is 640 Fifth Avenue, 12th Floor, New York, NY 10019. |
| (10) | Does not include ordinary shares held by funds managed by an affiliate of Baring. Mr. Macksey is a managing director of Baring. Mr. Macksey does not have voting or investment power with respect to the shares held by such funds. |
| (11) | Includes (i) 129,140 ordinary shares held by Mills Family I, LLC, (ii) 137,000 ordinary shares issuable upon the exercise of warrants held by Mills Family I, LLC, (iii) 129,139 ordinary shares held by K&BM LP and (iv) 137,000 ordinary shares issuable upon the exercise of warrants held by K&BM LP. Ms. Mills is the managing member of Mills Family I, LLC and the general partner of K&BM LP, and in such capacities has voting and investment power over the shares held by such entities. |
| (12) | Does not include ordinary shares held by funds managed by an affiliate of Onex Corporation. Mr. Motamedi is a managing director of Onex Corporation. Mr. Motamedi does not have voting or investment power with respect to the shares held by such funds. |
| (13) | Does not include ordinary shares held by funds managed by an affiliate of Onex Corporation. Mr. Munk is a managing director of Onex Corporation. Mr. Munk does not have voting or investment power with respect to the shares held by such funds. |
| (14) | Includes 26,427 ordinary shares. |
| (15) | Does not include ordinary shares held by funds managed by an affiliate of Baring. Mr. Scattarella is a managing director of Baring. Mr. Scattarella does not have voting or investment power with respect to the shares held by such funds. |
| (16) | Includes 132,136 ordinary shares issuable upon the exercise of options. |
| (17) | Includes 437,108 ordinary shares issuable upon the exercise of options. |
| (18) | Includes (i) 132,137 ordinary shares and (ii) 272,202 ordinary shares issuable upon the exercise of options. |
| (19) | Includes 219,344 ordinary shares issuable upon the exercise of options. |
170
Item 13. Certain Relationships and Related Transactions, and Director Independence
Transactions Involving Related Persons
Sponsor Agreement
In connection with the January 2019 execution of the execution of the agreement pursuant to which we agreed to merge with Churchill Capital Corp, the founders of Churchill Capital Corp, which include our directors Jerre Stead (our Executive Chairman and Chief Executive Officer) and our directors Michael S. Klein, Sheryl von Blucher, Martin Broughton, Karen G. Mills, Balakrishnan S. Iyer and certain of their affiliates, entered into the Sponsor Agreement.
Under the Sponsor Agreement, Mr. Stead, Ms. Blucher , and M. Klein Associates, Inc. and Garden State, affiliates of Mr. Klein (one of our directors), agreed with Clarivate to accept certain performance and time vesting conditions on certain Clarivate shares to be received by them in exchange for Churchill Capital Corp common stock purchased by them at or before Churchill Capital Corp’s initial public offering in September 2018, as well as on all of the Clarivate warrants to be received by them in exchange for Churchill Capital Corp warrants, in connection with the closing of the merger. Both performance and time vesting conditions applied to half of Mr. Stead’s, Ms. von Blucher’s and M. Klein Associates, Inc.’s Clarivate shares that were subject to vesting conditions (5,309,712 in aggregate), and time (but not performance) vesting conditions apply to the other half of their Clarivate shares that were subject to vesting conditions (5,309,712 in aggregate). Both performance and time vesting conditions applied to all of their and Garden State’s Clarivate warrants (17,265,826 in aggregate).
Pursuant to the performance vesting conditions, and subject to the time vesting conditions described below, half of the Clarivate shares held by Mr. Stead, Ms. von Blucher, and M. Klein Associates, Inc. that were subject to performance vesting conditions would vest upon Clarivate’s shares trading at $15.25 per share or above for 40 days in any 60-day period commencing on the first public sale by Onex and Baring of their ordinary shares (or, if earlier, the first anniversary of the closing of the merger) and during the three-and-a-half year period after closing of the merger, and the other half of their performance-based vesting shares and all of their and Garden State’s respective warrants would vest upon Clarivate’s shares trading at $17.50 per share or above for such a 40-day period during the five-year period after the closing of the merger.
Pursuant to the time vesting conditions, the Clarivate shares held by Mr. Stead, Ms. von Blucher, and M. Klein Associates, Inc. that were not subject to performance vesting conditions would vest in three equal annual installments beginning on the first anniversary of the closing of the merger, while the Clarivate shares and warrants that were subject to performance vesting conditions would vest over the period of time between the first and third anniversaries of the closing of the merger.
In August 2019, Clarivate (on its behalf and on behalf of its subsidiaries) agreed to waive the performance and time vesting conditions for all Clarivate shares and warrants subject to such conditions held by Mr. Stead, Ms. von Blucher, M. Klein Associates, Inc. and Garden State. These shares and warrants held by Mr. Stead, Ms. von Blucher, M. Klein Associates, Inc. and Garden State nevertheless remain subject to a lock-up for a period ranging from two to three years following the closing of the merger.
In the year ended December 31, 2019, the Company recognized additional share-based compensation expense related to the modification of certain awards under the 2019 Incentive Award Plan.
Additionally, under the Sponsor Agreement, Clarivate agreed to issue 7,000,000 ordinary shares to persons designated by Messrs. Stead and Klein, including themselves, upon Clarivate’s achievement of a closing share price on the NYSE of at least $20.00 per share for 40 days over a 60 consecutive trading day period on or before the sixth anniversary of the closing of the merger. In January 2020, our board agreed to waive this performance vesting condition, and all such shares are expected to be issued to persons designated by Messrs. Stead and Klein prior to December 31, 2020. As further described in "Pre-Merger Compensation" above, these shares are referred to as "Merger Shares."
Registration Rights Agreement
Onex, Baring, the founders of Churchill Capital Corp and certain other pre-merger shareholders were granted registration rights in connection with the closing of our merger with Churchill Capital Corp.
171
Shareholders Agreement and Director Nomination Agreement
In connection with consummation of our merger with Churchill Capital Corp, Onex, Baring the founders of Churchill Capital Corp and certain other shareholders entered into a Shareholders Agreement and a Director Nomination Agreement. Pursuant to the Shareholders Agreement, Onex and Baring have the right to nominate a majority of the members of the board of directors until such time as Onex and Baring beneficially own less than 60% of the ordinary shares held by them immediately after the closing of the merger, and continue to have the right to nominate directors in a declining number based on their aggregate beneficial ownership percentage of the ordinary shares held by them immediately after the closing of the merger. Matters over which Onex and Baring will, directly or indirectly, exercise control include:
| • | the election of our board of directors and the appointment and removal of our officers; |
| • | mergers and other business combination transactions requiring shareholder approval, including proposed transactions that would result in our shareholders receiving a premium price for their shares; and |
| • | amendments to our articles of association. |
Pursuant to the Director Nomination Agreement entered into in connection with our merger with Churchill Capital Corp, Mr. Stead, the Designated Shareholder, has the right to designate up to four nominees for the election to our board of directors for so long as Onex and Baring own at least 20% of their initial ordinary shares.
The directors are required to ensure that any individual nominated pursuant to the articles of association, the Director Nomination Agreement and the Shareholders Agreement shall be nominated for election as a director at the next general meeting of Clarivate, and such individual shall be appointed if approved by ordinary resolution at such general meeting.
Tax Receivable Agreement
In connection with our merger with Churchill Capital Corp, we entered into a tax receivable agreement with Onex, Baring and certain other pre-merger shareholders of the Company. The tax receivable agreement generally would have required us to pay the counterparties 85% of the amount of cash savings, if any, realized (or, in some cases, deemed to be realized) as a result of the utilization of certain tax assets. In August 2019, we entered into an agreement pursuant to which all of our future payment obligations under the tax receivable agreement would terminate in exchange for a payment of $200,000, which we made in November 2019.
Consulting Services and Advisory Agreements
In connection with our merger with Churchill Capital Corp, an affiliate of Onex received a consulting fee of $5,400 and an affiliate of Baring received a consulting fee of $2,100, for the year ended December 31, 2019. Churchill also engaged Klein Group, an affiliate of Michael Klein, to act as its financial advisor in connection with our merger with Churchill Capital Corp for an aggregate advisory fee of $12,500.
Other
A controlled affiliate of Baring is a vendor of ours. Total payments to this vendor were $765 for the year ended December 31, 2019. The Company had an outstanding liability of $160 as of December 31, 2019.
A former member of our key management is the Co-founder of a vendor of ours.Total payments to this vendor were $278 for the year ended December 31, 2019. The Company had an outstanding liability of $0 December 31, 2019.
Independence of Directors
We adhere to the rules of the NYSE in determining whether a director is independent. The NYSE listing standards generally define an “independent director” as a person, other than an executive officer of a company or any other individual having a relationship which, in the opinion of the issuer’s board of directors, would interfere with the exercise of independent judgment in carrying out the responsibilities of a director. The board has determined that Sheryl von Blucher, Martin Broughton, Kosty Gilis, Balakrishnan S. Iyer, Nicholas Macksey, Charles E. Moran, Karen G. Mills, Amir Motamedi, Anthony Munk, Charles J. Neral and Matthew Scattarella are independent directors.
172
Meetings and Committees of the Board of Directors
Clarivate has established a separately standing audit committee, nominating and corporate governance committee, risk committee, and compensation committee.
Nominating and Corporate Governance Committee Information
Clarivate has established a nominating and corporate governance committee of the board of directors comprised of Messrs. Gilis, Macksey and Moran and Ms. von Blucher. The nominating and corporate governance committee has a written charter. The nominating and corporate governance committee is responsible for overseeing the selection of persons to be nominated to serve on Clarivate’s board of directors.
Guidelines for Selecting Director Nominees
The nominating and corporate governance committee will consider persons identified by its members, management, shareholders, investment bankers and others. The guidelines for selecting nominees, which are specified in the nominating and corporate governance committee charter, generally provide that persons to be nominated:
| • | should have demonstrated notable or significant achievements in business, education or public service; |
| • | should possess the requisite intelligence, education and experience to make a significant contribution to the board of directors and bring a range of skills, diverse perspectives and backgrounds to its deliberations; and |
| • | should have the highest ethical standards, a strong sense of professionalism and intense dedication to serving the interests of the shareholders. |
The nominating and corporate governance committee will consider a number of qualifications relating to management and leadership experience, background and integrity and professionalism in evaluating a person’s candidacy for membership on the board of directors. The nominating and corporate governance committee may require certain skills or attributes, such as financial or accounting experience, to meet specific board needs that arise from time to time and will also consider the overall experience and makeup of its members to obtain a broad and diverse mix of board members. The nominating and corporate governance committee will not distinguish among nominees recommended by shareholders and other persons.
Compensation Committee Information
The board of directors of Clarivate has established a compensation committee. The compensation committee consists of Messrs. Gilis, Motamedi, and Macksey and Ms. von Blucher. The compensation committee has a written charter. The purpose of the compensation committee is to review and approve compensation paid to Clarivate’s officers and directors and to administer Clarivate’s incentive compensation plans, including authority to make and modify awards under such plans.
Any award made pursuant to an individual subject to the requirements of Section 16 of the Exchange Act must consist of a committee of two or more members of the board who are “nonemployee directors” as defined in Rule 16b-3(d)(1) under the Exchange Act.
Each of the members of the audit, nominating and corporate governance and compensation committee is independent under the applicable listing standards.
173
Item 14. Principal Accounting Fees and Services
In connection with the audit of the Company’s financial statements for the fiscal year ended December 31, 2019, we entered into an engagement letter with PricewaterhouseCoopers LLP that sets forth the terms by which PricewaterhouseCoopers LLP performed audit services for us. Aggregate fees for professional services rendered for us by PricewaterhouseCoopers LLP for the fiscal year ended December 31, 2019 and 2018, respectively, were as follows:
| 2019 | 2018 | |||||||
| (in thousands) | ||||||||
| Audit Fees | $ | 4,965 | $ | 7,621 | ||||
| Audit-Related Fees | 250 | 325 | ||||||
| Tax Fees | 895 | 1,310 | ||||||
| All Other Fees | 8 | 8 | ||||||
| Total | $ | 6,118 | $ | 9,264 | ||||
Audit Fees. Audit fees consist of fees billed for professional services rendered for the audit of our Consolidated Financial Statements, the statutory audit of our subsidiaries, the review of our Interim Consolidated Financial Statements, and other services provided in connection with statutory and regulatory filings.
Audit-Related Fees. Audit-related fees consist of fees billed for assurance and related services that are reasonably related to the performance of the audit or review of the Company’s Consolidated Financial Statements and are not reported under “Audit Fees.” These services may include employee benefit plan audits, due diligence services related to acquisitions and divestitures, auditing work in proposed transactions, attestation services that are not required by regulation or statute and consultations regarding financial accounting or reporting standards. For 2019, audit-related fees included approximately $250 for consultations regarding reporting standards. For 2018, audit-related fees included approximately $325 for due diligence services rendered related to divestitures.
Tax Fees. Tax fees consist of tax compliance consultants, preparation of tax reports, and other tax services.
All Other Fees. All other fees for 2019 and 2018 consisted of license fees for utilization of technical databases.
174
Item 15. Exhibits and Financial Statement Schedules
EXHIBIT INDEX
| * | Filed herewith. |
| † | Schedules and exhibits omitted pursuant to Item 601(a)(5) of Regulation S-K. Copies of any omitted schedule or exhibit will be furnished to the SEC upon request. |
| + | Compensatory plan or arrangement. |
175
Not applicable.
Pursuant to the requirements of Section 13 or 15(d) of the Securities Exchange Act of 1934, the registrant has duly caused this annual report to be signed on its behalf by the undersigned, thereunto duly authorized in the City of London, United Kingdom, on March 2, 2020.
| CLARIVATE ANALYTICS PLC | ||
| By: | /s/ Jerre Stead | |
| Name: Jerre Stead | ||
| Title: Executive Chairman and Chief Executive Officer | ||
KNOW ALL PERSONS BY THESE PRESENTS, that each person whose signature appears below hereby constitutes and appoints Jerre Stead, Richard Hanks and Stephen Hartman, and each of them, individually, as the undersigned’s true and lawful attorneys-in-fact and agents, with full power of substitution and resubstitution, for the undersigned and in the undersigned’s name, place and stead in any and all capacities, in connection with this annual report, including to sign in the name and on behalf of the undersigned, this annual report and any and all amendments hereto, and to file the same, with all exhibits thereto, and other documents in connection therewith, with the Securities and Exchange Commission, granting unto such attorneys-in-fact and agents full power and authority to do and perform each and every act and thing requisite and necessary to be done in and about the premises, as fully to all intents and purposes as the undersigned might or could do in person, hereby ratifying and confirming all that said attorneys-in-fact and agents, or his substitute, may lawfully do or cause to be done by virtue hereof.
176
Pursuant to the requirements of the Securities Exchange Act of 1934, this annual report has been signed below by the following persons on March 2, 2020 on behalf of the registrant and in the capacities indicated.
| Name | Title |
| /s/ Jerre Stead | Executive Chairman and Chief Executive Officer |
| Jerre Stead | (principal executive officer) |
| /s/ Richard Hanks | Chief Financial Officer |
| Richard Hanks | (principal financial officer) |
| /s/ Christie Archbold | Chief Accounting Officer |
| Christie Archbold | (principal financial officer) |
| /s/ Sheryl von Blucher | Director |
| Sheryl von Blucher | |
| /s/ Martin Broughton | Director |
| Martin Broughton | |
| /s/ Kosty Gilis | Director |
| Kosty Gilis | |
| /s/ Balakrishnan S. Iyer | Director |
| Balakrishnan S. Iyer | |
| /s/ Michael Klein | Director |
| Michael Klein | |
| /s/ Nicholas Macksey | Director |
| Nicholas Macksey | |
| /s/ Karen G. Mills | Director |
| Karen G. Mills | |
| /s/ Charles E. Moran | Director |
| Charles E. Moran | |
| /s/ Amir Motamedi | Director |
| Amir Motamedi | |
| /s/ Anthony Munk | Director |
| Anthony Munk | |
| /s/ Charles J. Neral | Director |
| Charles J. Neral | |
| /s/ Matthew Scattarella | Director |
| Matthew Scattarella |
177