Attached files
| file | filename |
|---|---|
| 8-K - 8-K - Recro Pharma, Inc. | reph-20210511.htm |
Investor Presentation May 2021 Exhibit 99.1
Non-GAAP To supplement our financial results determined by U.S. generally accepted accounting principles (“GAAP”), we have certain non-GAAP information for our business, including EBITDA, as adjusted. We believe this non-GAAP financial measure is helpful in understanding our business as it is useful to investors in allowing for greater transparency of supplemental information used by management. Non-GAAP financial measures should be considered in addition to, but not as a substitute for, reported GAAP results. Please see the “Reconciliation of GAAP to Non-GAAP Financial Measures” at the end of this presentation for a reconciliation of non-GAAP adjusted EBITDA to its most directly comparable GAAP measure. This presentation includes forward-looking statements within the meaning of Section 27A of the Securities Act of 1933 and Section 21E of the Securities Exchange Act of 1934. These statements, among other things, relate to the company’s financial guidance; ability to manage costs and to achieve its financial goals; to operate under increased leverage and associated lending covenants; to pay its debt under its credit agreement and to maintain relationships with CDMO commercial partners and develop additional commercial partnerships. The words "anticipate", "believe", "could", "estimate", “upcoming”, "expect", "intend", "may", "plan", "predict", "project", "will" and similar terms and phrases may be used to identify forward-looking statements in this presentation. Our operations involve risks and uncertainties, many of which are outside our control, and any one of which, or a combination of which, could materially affect our results of operations and whether the forward-looking statements ultimately prove to be correct. Factors that could cause the company’s actual outcomes to differ materially from those expressed in or underlying these forward-looking statements include the ongoing economic and social consequences of the COVID-19 pandemic, including any adverse impact on the customer ordering patterns or inventory rebalancing or disruption in raw materials or supply chain; demand for the company’s services, which depends in part on customers’ research and development and the clinical plans and market success of their products; customers' changing inventory requirements and manufacturing plans; customers and prospective customers decisions to move forward with the company’s manufacturing services; the average profitability, or mix, of the products the company manufactures; the company’s ability to enhance existing or introduce new services in a timely manner; fluctuations in the costs, availability, and suitability of the components of the products the company manufactures, including active pharmaceutical ingredients, excipients, purchased components and raw materials, or the company’s customers facing increasing or new competition. These forward-looking statements should be considered together with the risks and uncertainties that may affect our business and future results presented herein along with those risks and uncertainties discussed in our filings with the Securities and Exchange Commission at www.sec.gov. These forward-looking statements are based on information currently available to us, and we assume no obligation to update any forward-looking statements except as required by applicable law. Forward Looking Statements
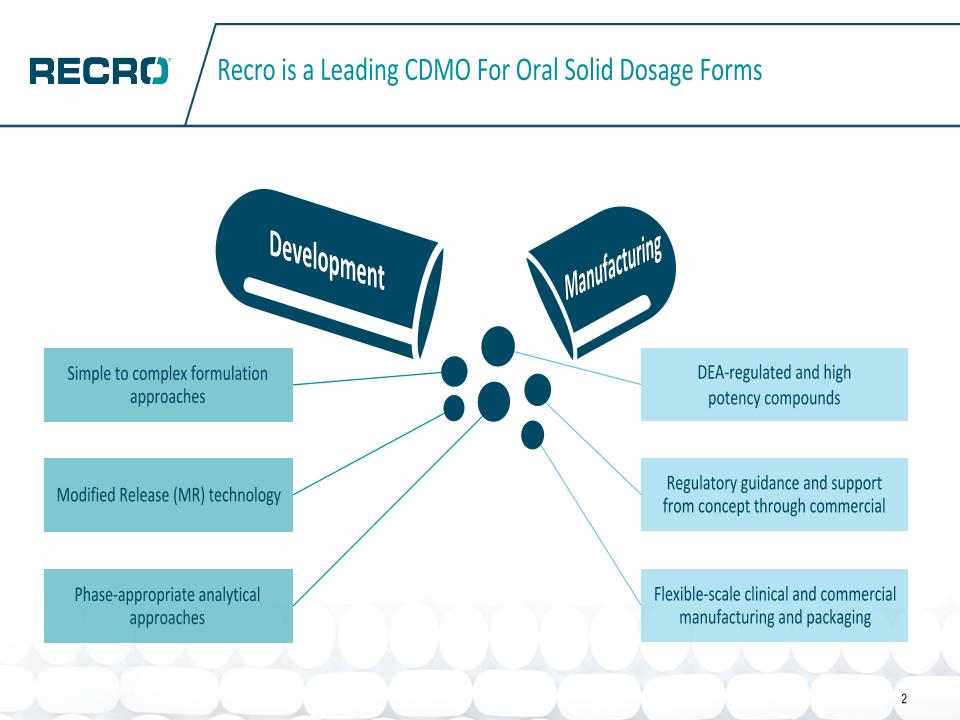
Recro is a Leading CDMO For Oral Solid Dosage Forms 2 DEA-regulated and high potency compounds Regulatory guidance and support from concept through commercial Flexible-scale clinical and commercial manufacturing and packaging Simple to complex formulation approaches Modified Release (MR) technology Phase-appropriate analytical approaches Development Manufacturing
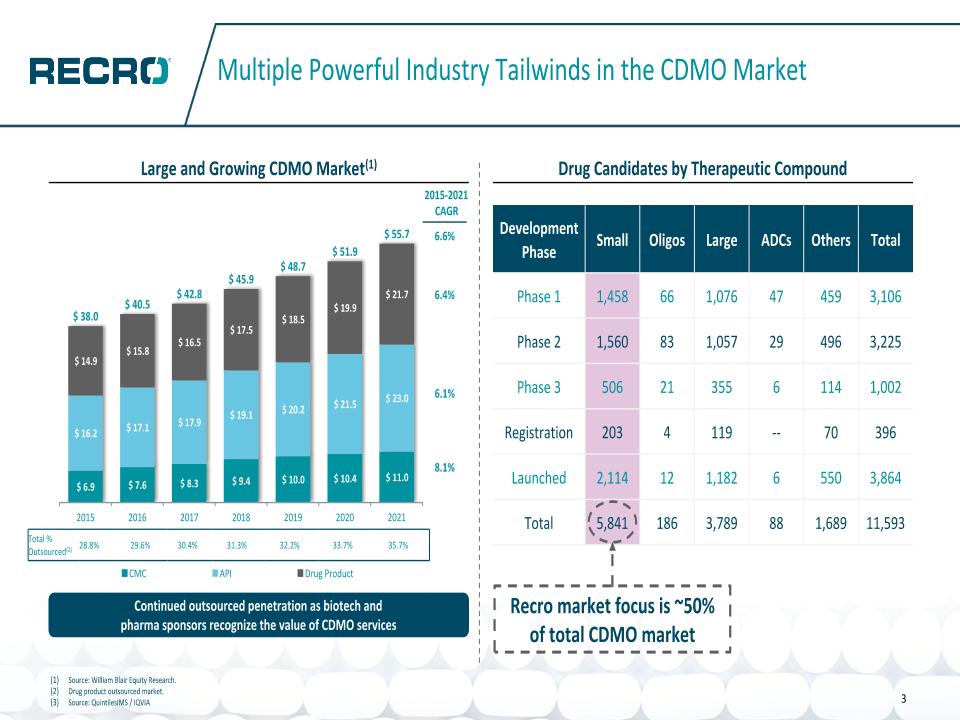
14 3 Multiple Powerful Industry Tailwinds in the CDMO Market Drug Candidates by Therapeutic Compound Total % Outsourced(2) 28.8% 29.6% 30.4% 31.3% 32.2% 33.7% 35.7% Continued outsourced penetration as biotech and pharma sponsors recognize the value of CDMO services 6.6% 6.4% 6.1% 8.1% 2015-2021 CAGR Large and Growing CDMO Market(1) Source: William Blair Equity Research. Drug product outsourced market. Source: QuintilesIMS / IQVIA Recro market focus is ~50% of total CDMO market Development Phase Small Oligos Large ADCs Others Total Phase 1 1,458 66 1,076 47 459 3,106 Phase 2 1,560 83 1,057 29 496 3,225 Phase 3 506 21 355 6 114 1,002 Registration 203 4 119 -- 70 396 Launched 2,114 12 1,182 6 550 3,864 Total 5,841 186 3,789 88 1,689 11,593
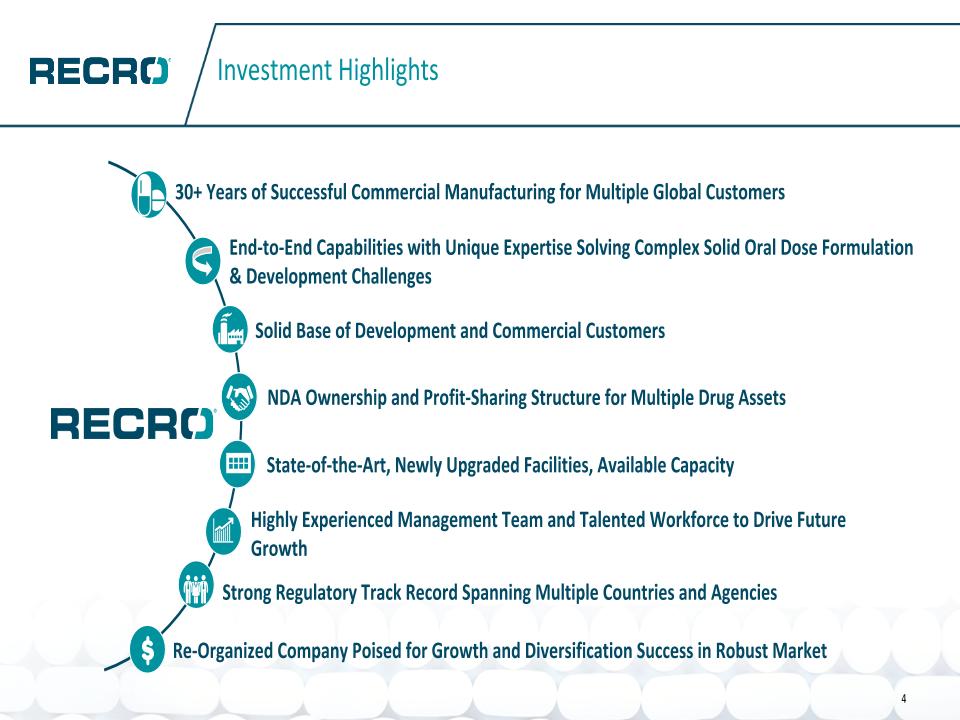
Investment Highlights Re-Organized Company Poised for Growth and Diversification Success in Robust Market State-of-the-Art, Newly Upgraded Facilities, Available Capacity 30+ Years of Successful Commercial Manufacturing for Multiple Global Customers Solid Base of Development and Commercial Customers Highly Experienced Management Team and Talented Workforce to Drive Future Growth Strong Regulatory Track Record Spanning Multiple Countries and Agencies NDA Ownership and Profit-Sharing Structure for Multiple Drug Assets End-to-End Capabilities with Unique Expertise Solving Complex Solid Oral Dose Formulation & Development Challenges 4
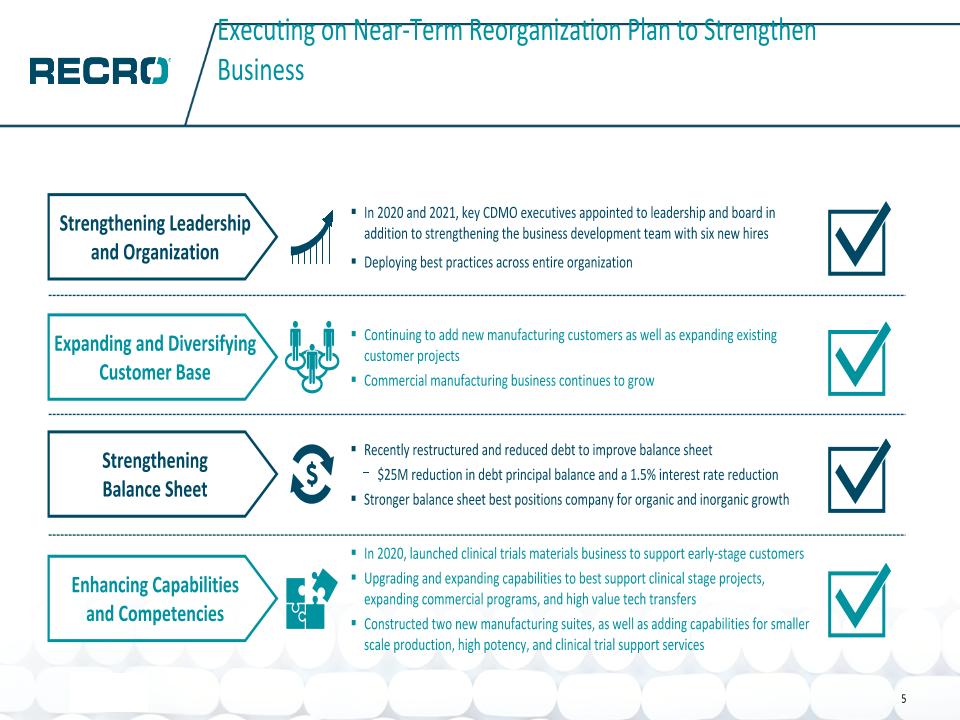
Executing on Near-Term Reorganization Plan to Strengthen Business In 2020 and 2021, key CDMO executives appointed to leadership and board in addition to strengthening the business development team with six new hires Deploying best practices across entire organization Strengthening Leadership and Organization Strengthening Balance Sheet Recently restructured and reduced debt to improve balance sheet $25M reduction in debt principal balance and a 1.5% interest rate reduction Stronger balance sheet best positions company for organic and inorganic growth Expanding and Diversifying Customer Base Continuing to add new manufacturing customers as well as expanding existing customer projects Commercial manufacturing business continues to grow In 2020, launched clinical trials materials business to support early-stage customers Upgrading and expanding capabilities to best support clinical stage projects, expanding commercial programs, and high value tech transfers Constructed two new manufacturing suites, as well as adding capabilities for smaller scale production, high potency, and clinical trial support services Enhancing Capabilities and Competencies 5
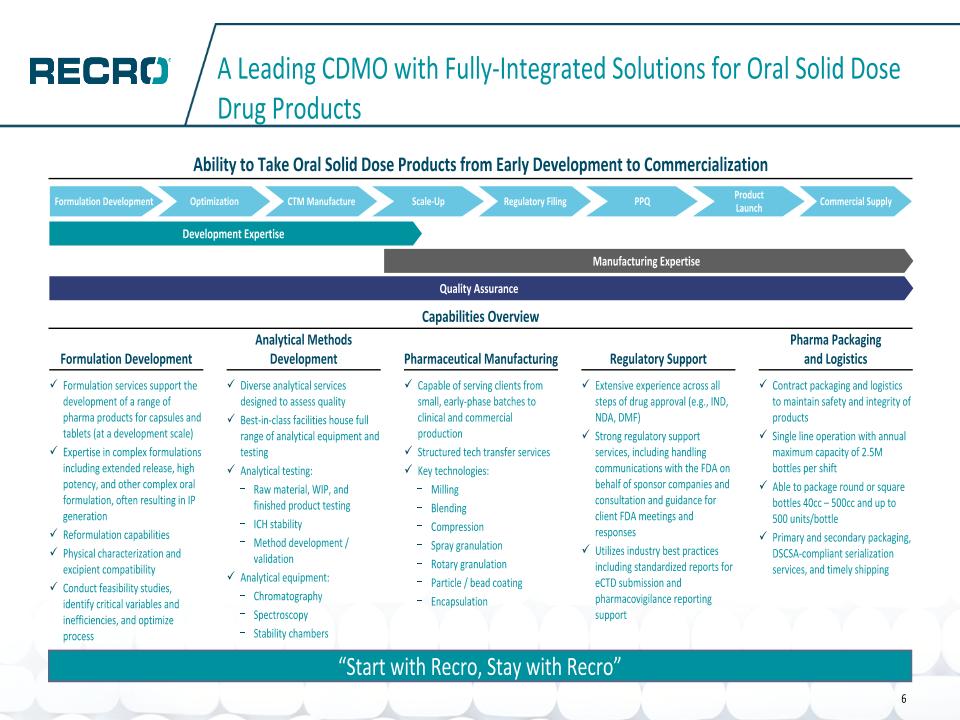
A Leading CDMO with Fully-Integrated Solutions for Oral Solid Dose Drug Products Capabilities Overview Formulation Development Analytical Methods Development Pharmaceutical Manufacturing Regulatory Support Formulation Development Optimization CTM Manufacture Scale-Up Regulatory Filing PPQ Product Launch Commercial Supply Development Expertise Quality Assurance Manufacturing Expertise Ability to Take Oral Solid Dose Products from Early Development to Commercialization Pharma Packaging and Logistics Contract packaging and logistics to maintain safety and integrity of products Single line operation with annual maximum capacity of 2.5M bottles per shift Able to package round or square bottles 40cc – 500cc and up to 500 units/bottle Primary and secondary packaging, DSCSA-compliant serialization services, and timely shipping Formulation services support the development of a range of pharma products for capsules and tablets (at a development scale) Expertise in complex formulations including extended release, high potency, and other complex oral formulation, often resulting in IP generation Reformulation capabilities Physical characterization and excipient compatibility Conduct feasibility studies, identify critical variables and inefficiencies, and optimize process Diverse analytical services designed to assess quality Best-in-class facilities house full range of analytical equipment and testing Analytical testing: Raw material, WIP, and finished product testing ICH stability Method development / validation Analytical equipment: Chromatography Spectroscopy Stability chambers Capable of serving clients from small, early-phase batches to clinical and commercial production Structured tech transfer services Key technologies: Milling Blending Compression Spray granulation Rotary granulation Particle / bead coating Encapsulation Extensive experience across all steps of drug approval (e.g., IND, NDA, DMF) Strong regulatory support services, including handling communications with the FDA on behalf of sponsor companies and consultation and guidance for client FDA meetings and responses Utilizes industry best practices including standardized reports for eCTD submission and pharmacovigilance reporting support “Start with Recro, Stay with Recro” 6
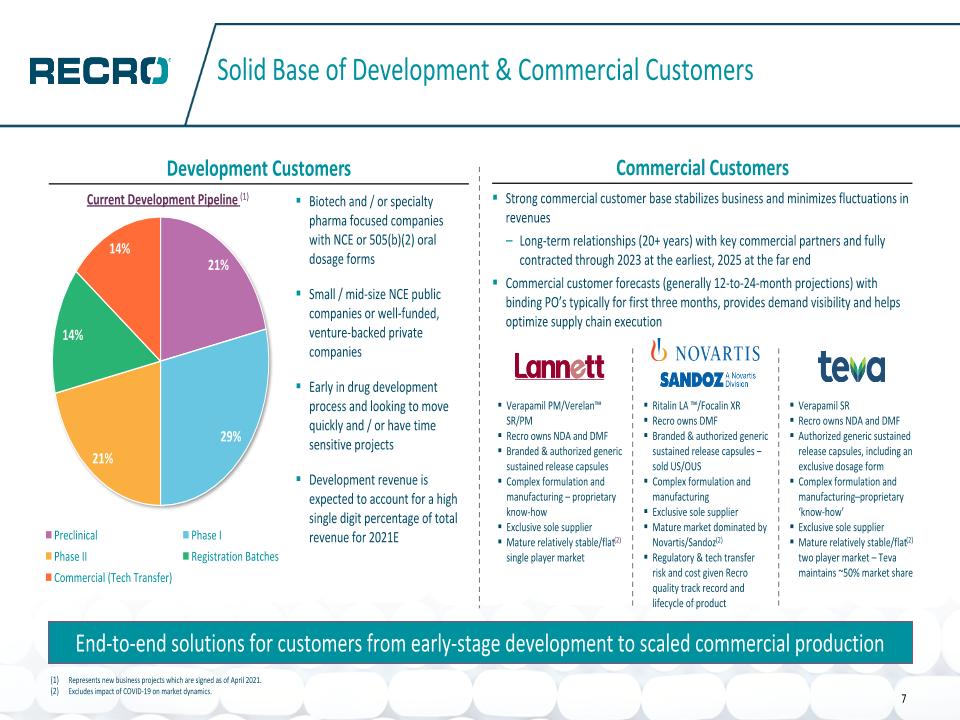
Solid Base of Development & Commercial Customers Development Customers Commercial Customers End-to-end solutions for customers from early-stage development to scaled commercial production Biotech and / or specialty pharma focused companies with NCE or 505(b)(2) oral dosage forms Small / mid-size NCE public companies or well-funded, venture-backed private companies Early in drug development process and looking to move quickly and / or have time sensitive projects Development revenue is expected to account for a high single digit percentage of total revenue for 2021E Strong commercial customer base stabilizes business and minimizes fluctuations in revenues Long-term relationships (20+ years) with key commercial partners and fully contracted through 2023 at the earliest, 2025 at the far end Commercial customer forecasts (generally 12-to-24-month projections) with binding PO’s typically for first three months, provides demand visibility and helps optimize supply chain execution Current Development Pipeline (1) 7 Verapamil PM/Verelan™ SR/PM Recro owns NDA and DMF Branded & authorized generic sustained release capsules Complex formulation and manufacturing – proprietary know-how Exclusive sole supplier Mature relatively stable/flat(2) single player market Verapamil SR Recro owns NDA and DMF Authorized generic sustained release capsules, including an exclusive dosage form Complex formulation and manufacturing–proprietary ‘know-how’ Exclusive sole supplier Mature relatively stable/flat(2) two player market – Teva maintains ~50% market share Ritalin LA ™/Focalin XR Recro owns DMF Branded & authorized generic sustained release capsules – sold US/OUS Complex formulation and manufacturing Exclusive sole supplier Mature market dominated by Novartis/Sandoz(2) Regulatory & tech transfer risk and cost given Recro quality track record and lifecycle of product Represents new business projects which are signed as of April 2021. Excludes impact of COVID-19 on market dynamics.
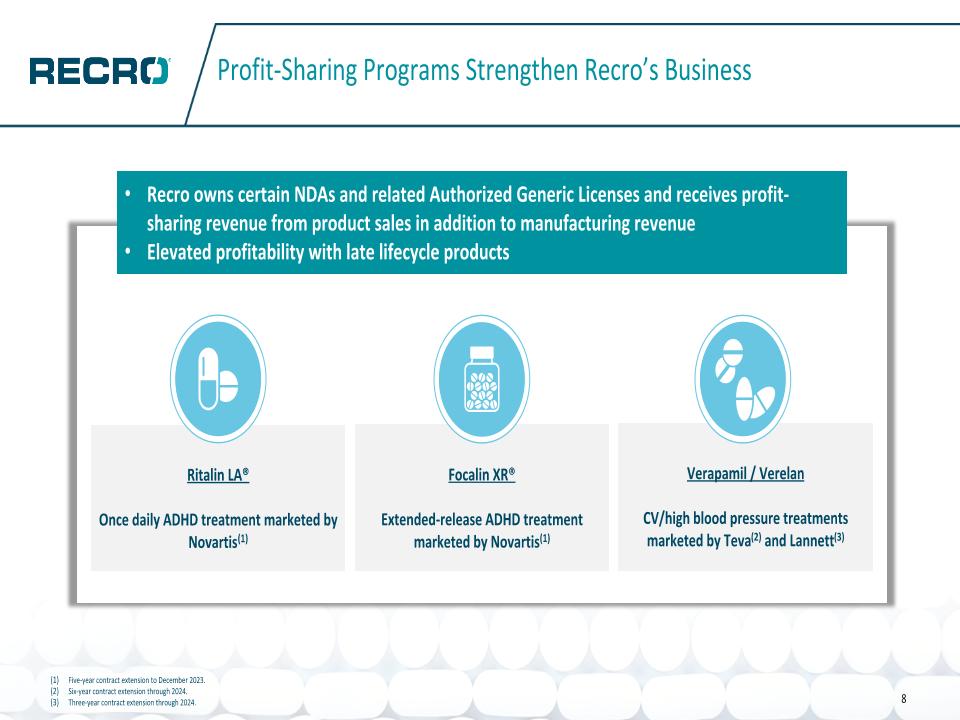
Profit-Sharing Programs Strengthen Recro’s Business Five-year contract extension to December 2023. Six-year contract extension through 2024. Three-year contract extension through 2024. Ritalin LA® Once daily ADHD treatment marketed by Novartis(1) Focalin XR® Extended-release ADHD treatment marketed by Novartis(1) Verapamil / Verelan CV/high blood pressure treatments marketed by Teva(2) and Lannett(3) Recro owns certain NDAs and related Authorized Generic Licenses and receives profit-sharing revenue from product sales in addition to manufacturing revenue Elevated profitability with late lifecycle products 8
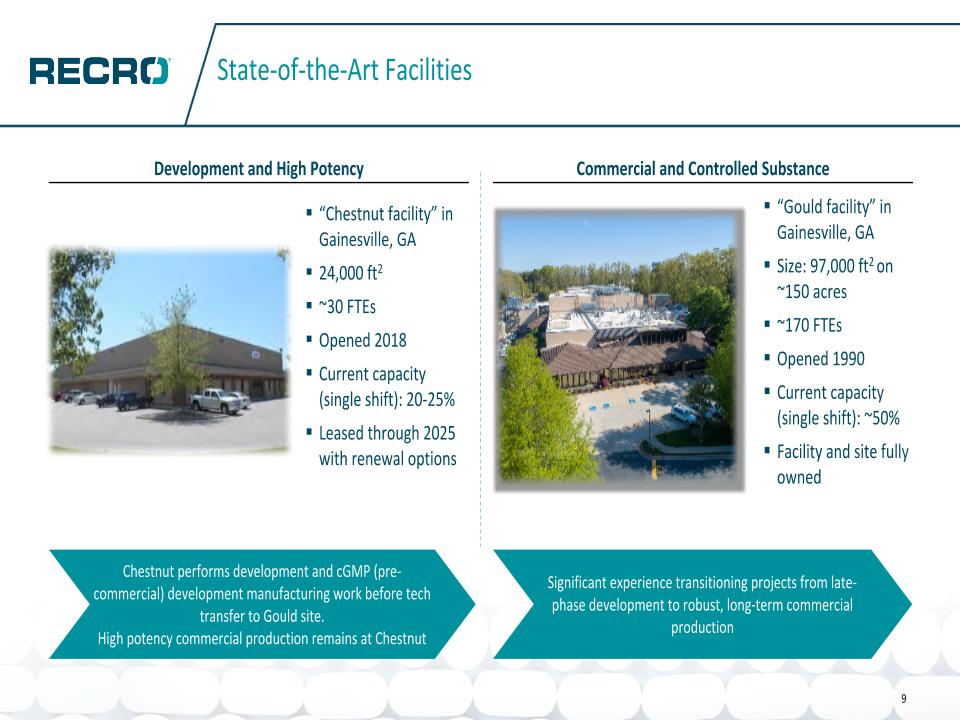
State-of-the-Art Facilities Commercial and Controlled Substance Development and High Potency “Chestnut facility” in Gainesville, GA 24,000 ft2 ~30 FTEs Opened 2018 Current capacity (single shift): 20-25% Leased through 2025 with renewal options “Gould facility” in Gainesville, GA Size: 97,000 ft2 on ~150 acres ~170 FTEs Opened 1990 Current capacity (single shift): ~50% Facility and site fully owned Significant experience transitioning projects from late-phase development to robust, long-term commercial production Chestnut performs development and cGMP (pre-commercial) development manufacturing work before tech transfer to Gould site. High potency commercial production remains at Chestnut 9
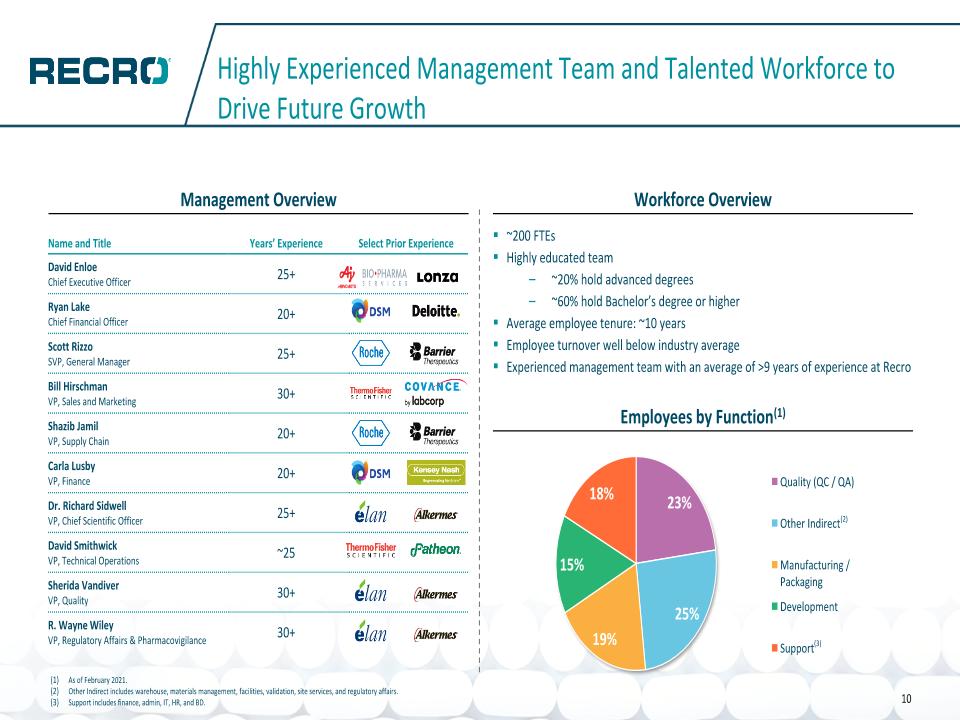
Highly Experienced Management Team and Talented Workforce to Drive Future Growth Workforce Overview Management Overview ~200 FTEs Highly educated team ~20% hold advanced degrees ~60% hold Bachelor’s degree or higher Average employee tenure: ~10 years Employee turnover well below industry average Experienced management team with an average of >9 years of experience at Recro Employees by Function(1) As of February 2021. Other Indirect includes warehouse, materials management, facilities, validation, site services, and regulatory affairs. Support includes finance, admin, IT, HR, and BD. (2) (3) Name and Title Years’ Experience Select Prior Experience David Enloe Chief Executive Officer 25+ Ryan Lake Chief Financial Officer 20+ Scott Rizzo SVP, General Manager 25+ Bill Hirschman VP, Sales and Marketing 30+ Shazib Jamil VP, Supply Chain 20+ Carla Lusby VP, Finance 20+ Dr. Richard Sidwell VP, Chief Scientific Officer 25+ David Smithwick VP, Technical Operations ~25 Sherida Vandiver VP, Quality 30+ R. Wayne Wiley VP, Regulatory Affairs & Pharmacovigilance 30+ 10
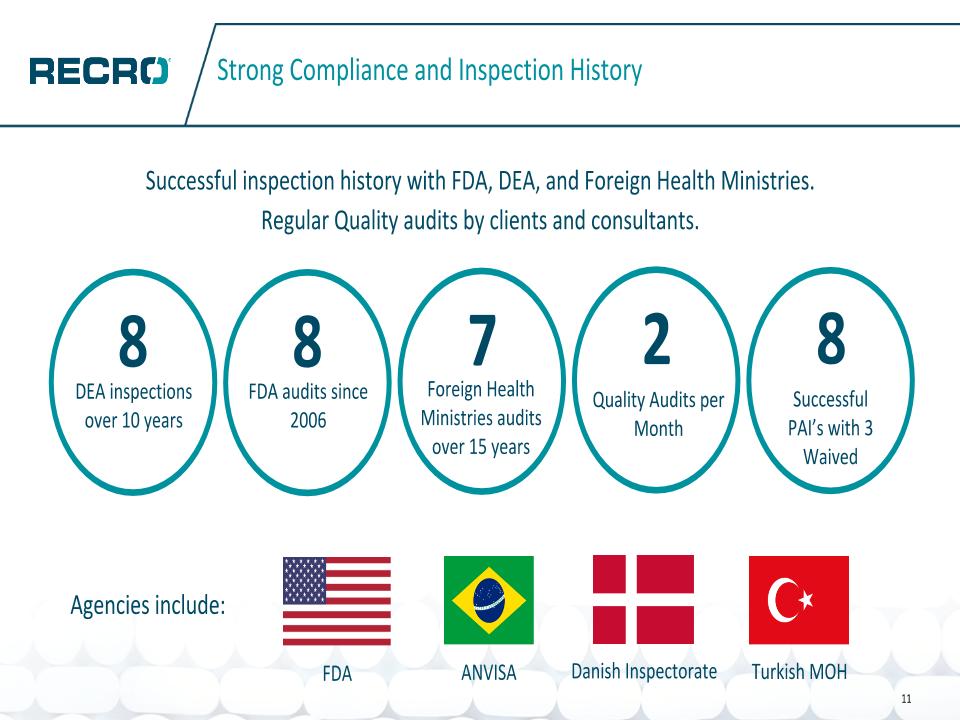
Successful inspection history with FDA, DEA, and Foreign Health Ministries. Regular Quality audits by clients and consultants. Strong Compliance and Inspection History 8 DEA inspections over 10 years 8 FDA audits since 2006 7 Foreign Health Ministries audits over 15 years 2 Quality Audits per Month 8 Successful PAI’s with 3 Waived FDA Agencies include: ANVISA Danish Inspectorate Turkish MOH 11
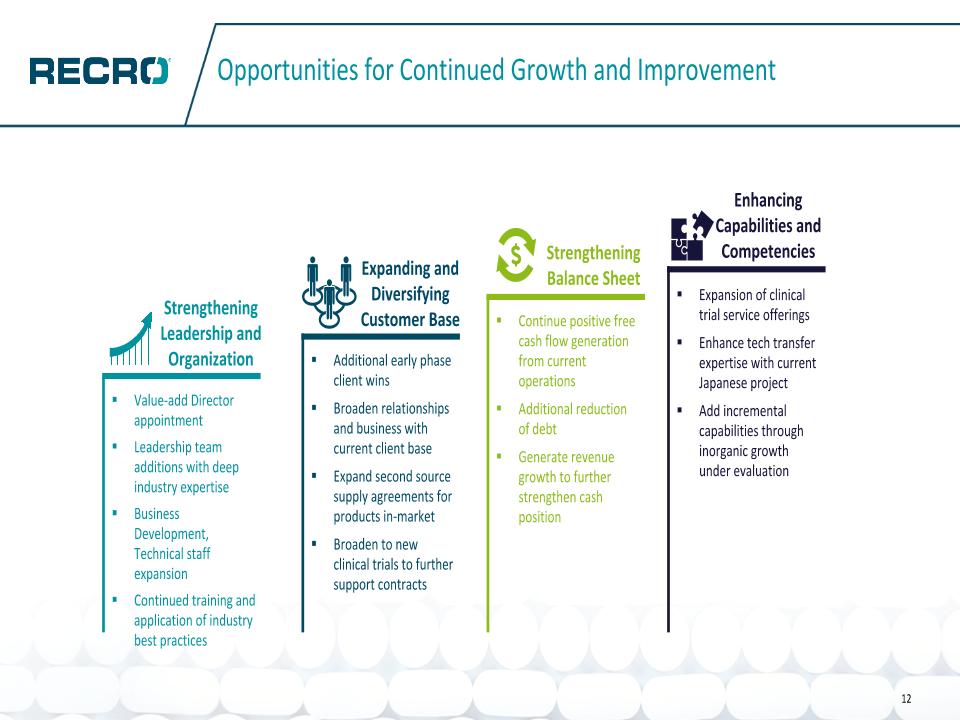
Opportunities for Continued Growth and Improvement 12 Value-add Director appointment Leadership team additions with deep industry expertise Business Development, Technical staff expansion Continued training and application of industry best practices Additional early phase client wins Broaden relationships and business with current client base Expand second source supply agreements for products in-market Broaden to new clinical trials to further support contracts Continue positive free cash flow generation from current operations Additional reduction of debt Generate revenue growth to further strengthen cash position Expansion of clinical trial service offerings Enhance tech transfer expertise with current Japanese project Add incremental capabilities through inorganic growth under evaluation Strengthening Leadership and Organization Expanding and Diversifying Customer Base Strengthening Balance Sheet Enhancing Capabilities and Competencies
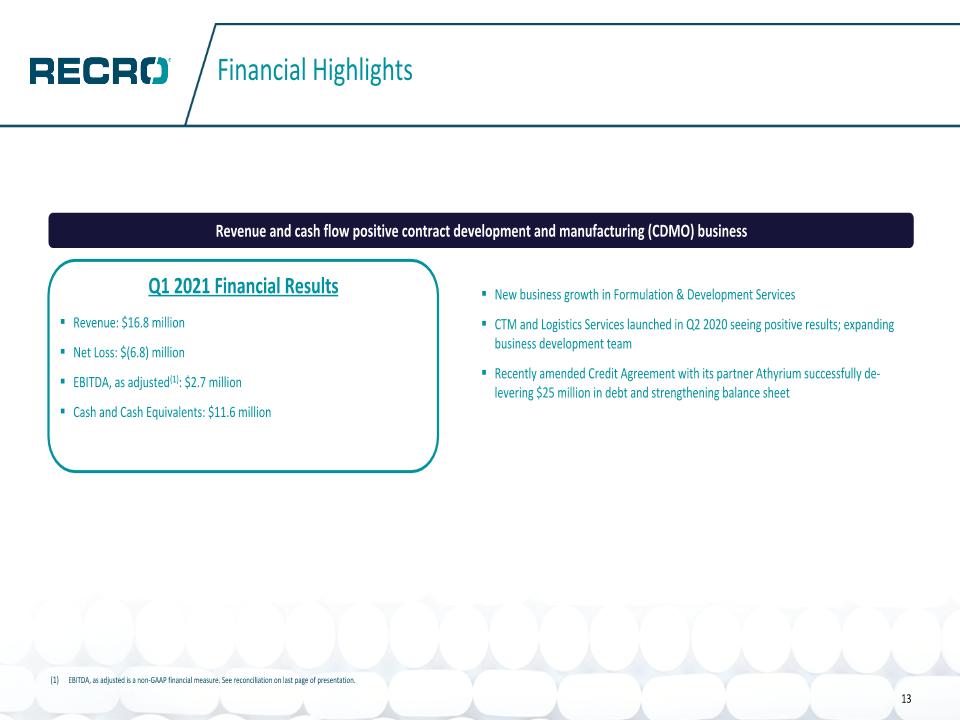
Financial Highlights 13 Q1 2021 Financial Results Revenue: $16.8 million Net Loss: $(6.8) million EBITDA, as adjusted(1): $2.7 million Cash and Cash Equivalents: $11.6 million Revenue and cash flow positive contract development and manufacturing (CDMO) business New business growth in Formulation & Development Services CTM and Logistics Services launched in Q2 2020 seeing positive results; expanding business development team Recently amended Credit Agreement with its partner Athyrium successfully de-levering $25 million in debt and strengthening balance sheet EBITDA, as adjusted is a non-GAAP financial measure. See reconciliation on last page of presentation.
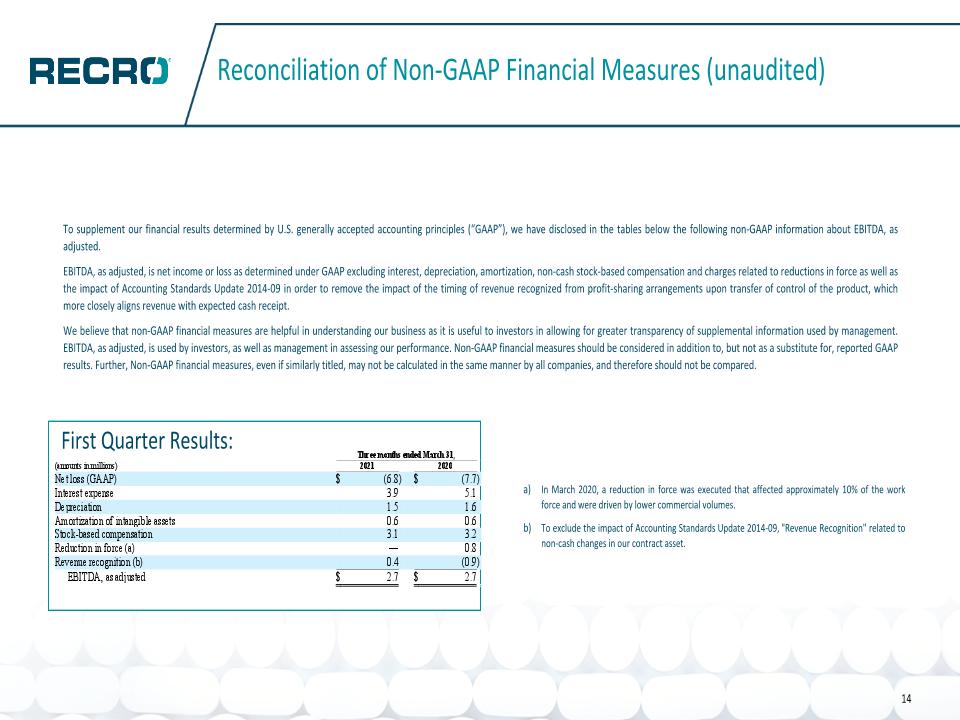
Reconciliation of Non-GAAP Financial Measures (unaudited) To supplement our financial results determined by U.S. generally accepted accounting principles (“GAAP”), we have disclosed in the tables below the following non-GAAP information about EBITDA, as adjusted. EBITDA, as adjusted, is net income or loss as determined under GAAP excluding interest, depreciation, amortization, non-cash stock-based compensation and charges related to reductions in force as well as the impact of Accounting Standards Update 2014-09 in order to remove the impact of the timing of revenue recognized from profit-sharing arrangements upon transfer of control of the product, which more closely aligns revenue with expected cash receipt. We believe that non-GAAP financial measures are helpful in understanding our business as it is useful to investors in allowing for greater transparency of supplemental information used by management. EBITDA, as adjusted, is used by investors, as well as management in assessing our performance. Non-GAAP financial measures should be considered in addition to, but not as a substitute for, reported GAAP results. Further, Non-GAAP financial measures, even if similarly titled, may not be calculated in the same manner by all companies, and therefore should not be compared. In March 2020, a reduction in force was executed that affected approximately 10% of the work force and were driven by lower commercial volumes. To exclude the impact of Accounting Standards Update 2014-09, "Revenue Recognition" related to non-cash changes in our contract asset. 14 First Quarter Results:
