Attached files
| file | filename |
|---|---|
| EX-99.1 - EX-99.1 - Great Elm Capital Corp. | gecc-ex991_22.htm |
| 8-K - 8-K - Great Elm Capital Corp. | gecc-8k_20210331.htm |
Exhibit 99.2
Statements in this communication that are not historical facts are “forward-looking” statements within the meaning of the federal securities laws. These statements are often, but not always, made through the use of words or phrases such as “expect,” “anticipate,” “should,” “will,” “estimate,” “designed,” “seek,” “continue,” “upside,” “potential,” “preliminary” and similar expressions. All such forward-looking statements involve estimates and assumptions that are subject to risks, uncertainties and other factors that could cause actual results to differ materially from the results expressed in the statements. Among the key factors that could cause actual results to differ materially from those projected in the forward-looking statements are: conditions in the credit markets, the price of GECC common stock, the performance of GECC’s portfolio and investment manager and risks associated with the economic impact of the COVID-19 pandemic on GECC and its portfolio companies. Information concerning these and other factors can be found in GECC’s Annual Report on Form 10-K and other reports filed with the SEC. GECC assumes no obligation to, and expressly disclaims any duty to, update any forward-looking statements contained in this communication or to conform prior statements to actual results or revised expectations except as required by law. Readers are cautioned not to place undue reliance on these forward-looking statements that speak only as of the date hereof. You should consider the investment objective, risks, charges and expenses of GECC carefully before investing. GECC’s filings with the SEC contain this and other information about GECC and are available by contacting GECC at the phone number and address at the end of this presentation. The SEC also maintains a website that contains the aforementioned documents. The address of the SEC’s website is http://www.sec.gov. These documents should be read and considered carefully before investing. The performance, distributions and financial data contained herein represent past performance, distributions and results and neither guarantees nor is indicative of future performance, distributions or results. Investment return and principal value of an investment will fluctuate so that an investor’s shares may be worth more or less than the original cost. GECC’s market price and net asset value will fluctuate with market conditions. Current performance may be lower or higher than the performance data quoted. All information and data, including portfolio holdings and performance characteristics, is as of March 31, 2021, unless otherwise noted, and is subject to change. This presentation does not constitute an offer of any securities for sale. Forward Looking Statement
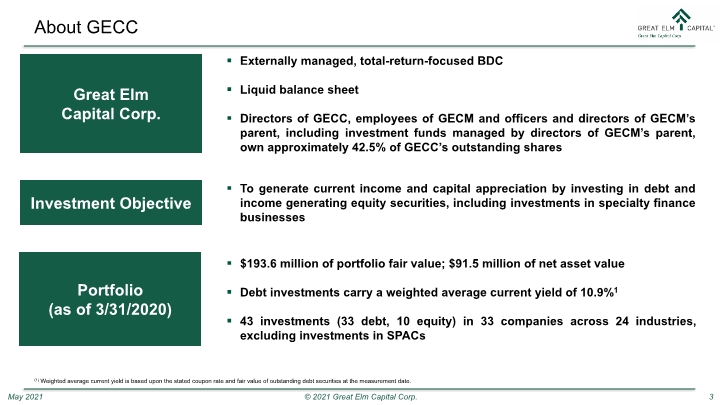
About GECC (1) Weighted average current yield is based upon the stated coupon rate and fair value of outstanding debt securities at the measurement date.
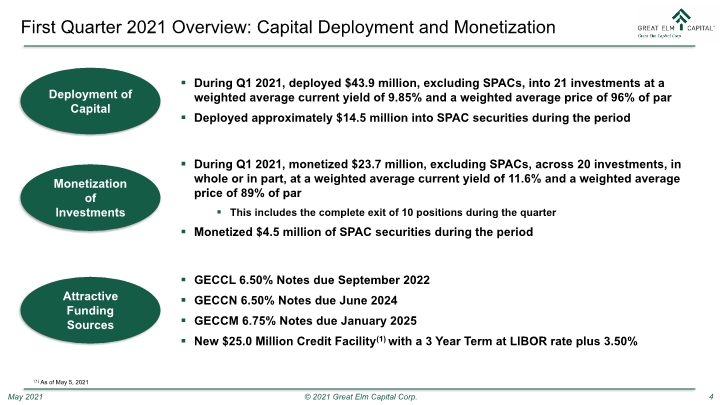
First Quarter 2021 Overview: Capital Deployment and Monetization GECCL 6.50% Notes due September 2022 GECCN 6.50% Notes due June 2024 GECCM 6.75% Notes due January 2025 New $25.0 Million Credit Facility(1) with a 3 Year Term at LIBOR rate plus 3.50% Attractive Funding Sources (1) As of May 5, 2021
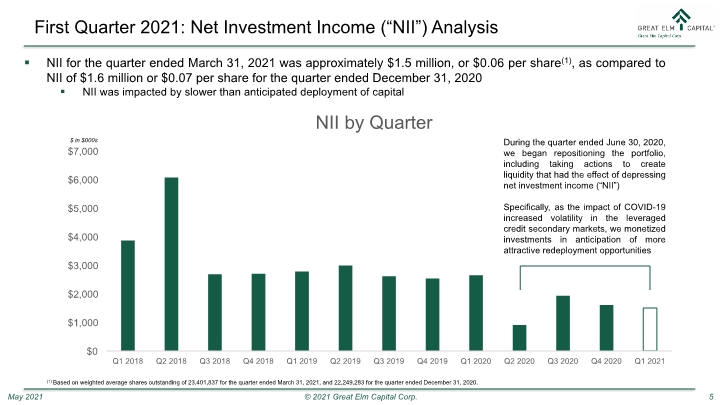
First Quarter 2021: Net Investment Income (“NII”) Analysis NII for the quarter ended March 31, 2021 was approximately $1.5 million, or $0.06 per share(1), as compared to NII of $1.6 million or $0.07 per share for the quarter ended December 31, 2020 NII was impacted by slower than anticipated deployment of capital During the quarter ended June 30, 2020, we began repositioning the portfolio, including taking actions to create liquidity that had the effect of depressing net investment income (“NII”) Specifically, as the impact of COVID-19 increased volatility in the leveraged credit secondary markets, we monetized investments in anticipation of more attractive redeployment opportunities $ in $000s (1) Based on weighted average shares outstanding of 23,401,837 for the quarter ended March 31, 2021, and 22,249,283 for the quarter ended December 31, 2020.
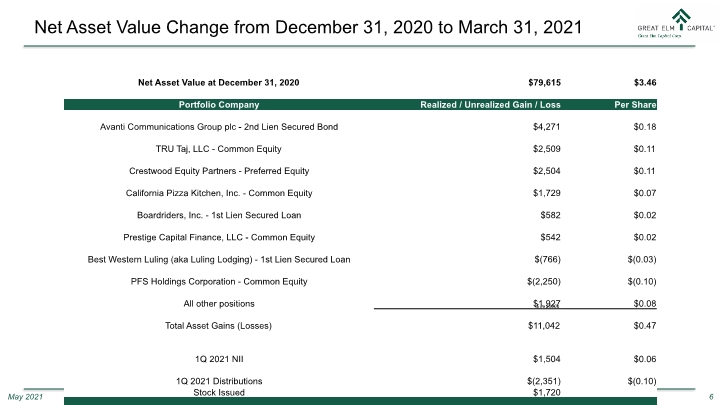
Net Asset Value Change from December 31, 2020 to March 31, 2021 $ in $000s
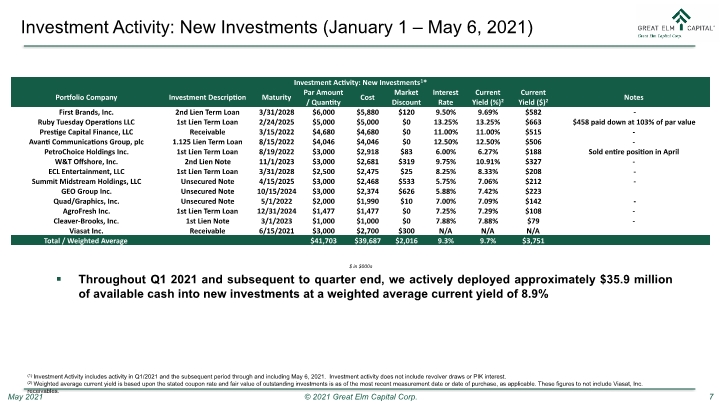
Investment Activity: New Investments (January 1 – May 6, 2021) Throughout Q1 2021 and subsequent to quarter end, we actively deployed approximately $35.9 million of available cash into new investments at a weighted average current yield of 8.9% $ in $000s (1) Investment Activity includes activity in Q1/2021 and the subsequent period through and including May 6, 2021. Investment activity does not include revolver draws or PIK interest. (2) Weighted average current yield is based upon the stated coupon rate and fair value of outstanding investments is as of the most recent measurement date or date of purchase, as applicable. These figures to not include Viasat, Inc. receivables.
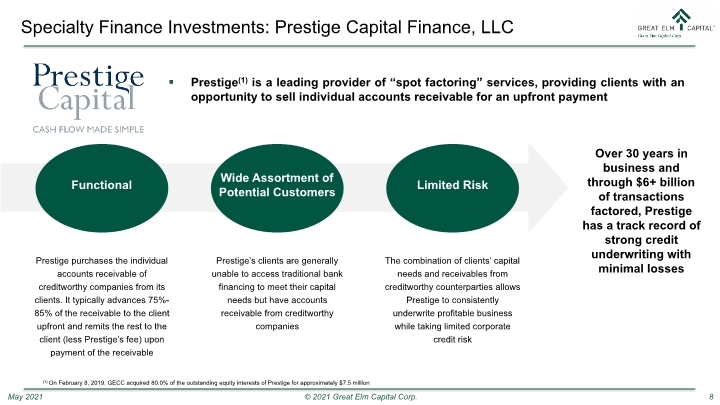
Prestige(1) is a leading provider of “spot factoring” services, providing clients with an opportunity to sell individual accounts receivable for an upfront payment Specialty Finance Investments: Prestige Capital Finance, LLC Over 30 years in business and through $6+ billion of transactions factored, Prestige has a track record of strong credit underwriting with minimal losses (1) On February 8, 2019, GECC acquired 80.0% of the outstanding equity interests of Prestige for approximately $7.5 million
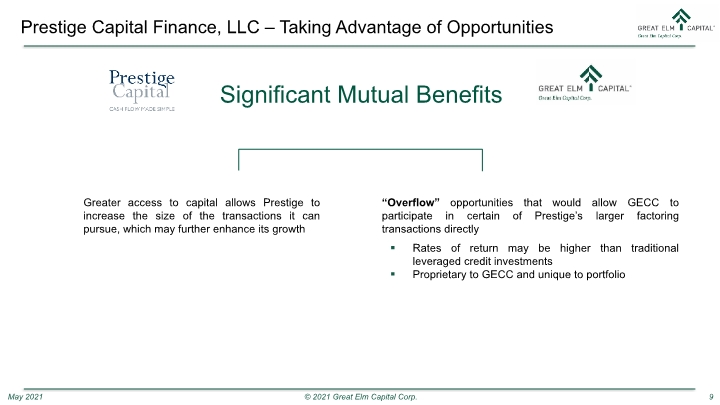
Prestige Capital Finance, LLC – Taking Advantage of Opportunities “Overflow” opportunities that would allow GECC to participate in certain of Prestige’s larger factoring transactions directly Significant Mutual Benefits Greater access to capital allows Prestige to increase the size of the transactions it can pursue, which may further enhance its growth Rates of return may be higher than traditional leveraged credit investments Proprietary to GECC and unique to portfolio
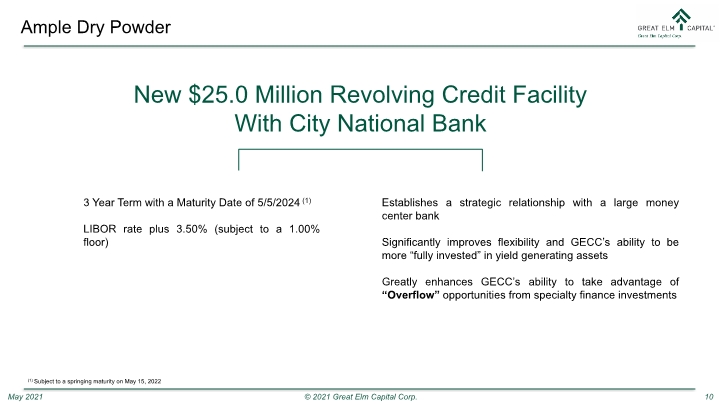
Ample Dry Powder Establishes a strategic relationship with a large money center bank Significantly improves flexibility and GECC’s ability to be more “fully invested” in yield generating assets Greatly enhances GECC’s ability to take advantage of “Overflow” opportunities from specialty finance investments New $25.0 Million Revolving Credit Facility With City National Bank 3 Year Term with a Maturity Date of 5/5/2024(1) LIBOR rate plus 3.50% (subject to a 1.00% floor) (1) Subject to a springing maturity on May 15, 2022
Portfolio Review (Quarter Ended 3/31/2021)
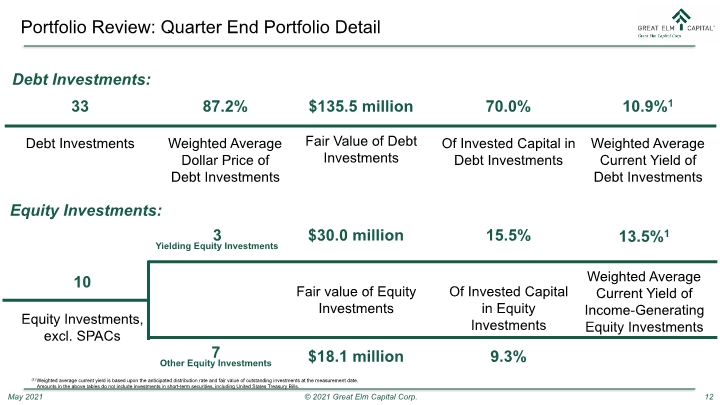
3 Yielding Equity Investments Portfolio Review: Quarter End Portfolio Detail 33 Debt Investments $135.5 million Fair Value of Debt Investments 87.2% Weighted Average Dollar Price of Debt Investments 10.9%1 Weighted Average Current Yield of Debt Investments 70.0% Of Invested Capital in Debt Investments 10 Equity Investments, excl. SPACs Debt Investments: Equity Investments: 15.5% Of Invested Capital in Equity Investments (1) Weighted average current yield is based upon the anticipated distribution rate and fair value of outstanding investments at the measurement date. Amounts in the above tables do not include investments in short-term securities, including United States Treasury Bills. Weighted Average Current Yield of Income-Generating Equity Investments 7 Other Equity Investments $30.0 million Fair value of Equity Investments $18.1 million 9.3% 13.5%1
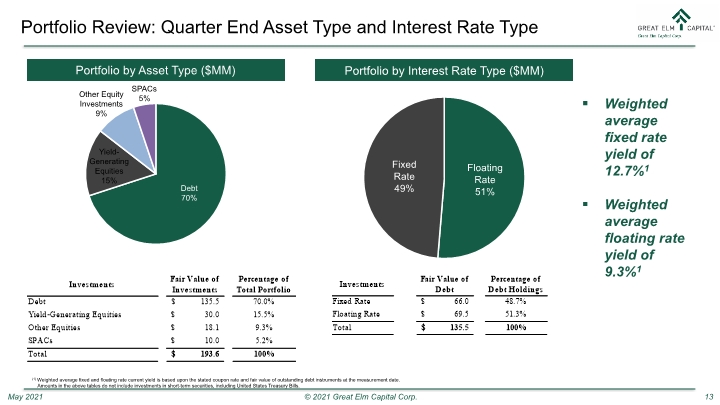
Portfolio by Asset Type ($MM) Portfolio by Interest Rate Type ($MM) Weighted average fixed rate yield of 12.7%1 Weighted average floating rate yield of 9.3%1 (1) Weighted average fixed and floating rate current yield is based upon the stated coupon rate and fair value of outstanding debt instruments at the measurement date. Amounts in the above tables do not include investments in short-term securities, including United States Treasury Bills. Portfolio Review: Quarter End Asset Type and Interest Rate Type
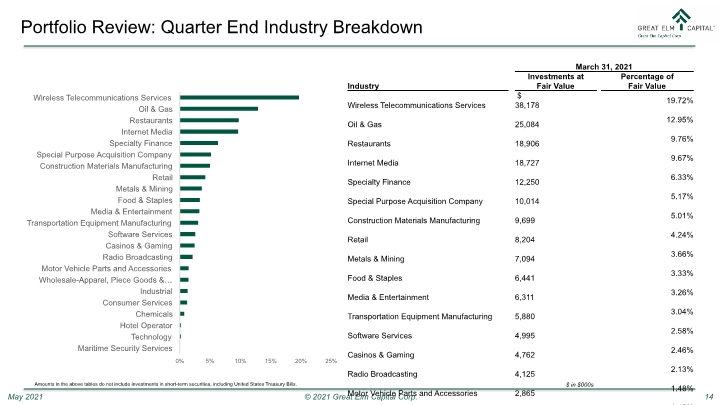
Portfolio Review: Quarter End Industry Breakdown Amounts in the above tables do not include investments in short-term securities, including United States Treasury Bills. $ in $000s
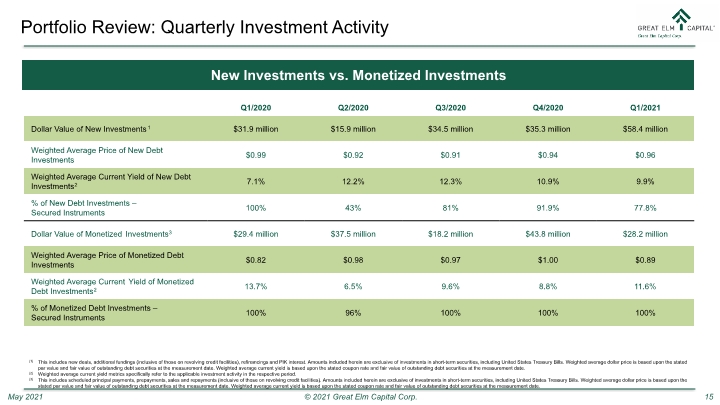
Portfolio Review: Quarterly Investment Activity (1) This includes new deals, additional fundings (inclusive of those on revolving credit facilities), refinancings and PIK interest. Amounts included herein are exclusive of investments in short-term securities, including United States Treasury Bills. Weighted average dollar price is based upon the stated par value and fair value of outstanding debt securities at the measurement date. Weighted average current yield is based upon the stated coupon rate and fair value of outstanding debt securities at the measurement date. (2) Weighted average current yield metrics specifically refer to the applicable investment activity in the respective period. (3) This includes scheduled principal payments, prepayments, sales and repayments (inclusive of those on revolving credit facilities). Amounts included herein are exclusive of investments in short-term securities, including United States Treasury Bills. Weighted average dollar price is based upon the stated par value and fair value of outstanding debt securities at the measurement date. Weighted average current yield is based upon the stated coupon rate and fair value of outstanding debt securities at the measurement date. New Investments vs. Monetized Investments
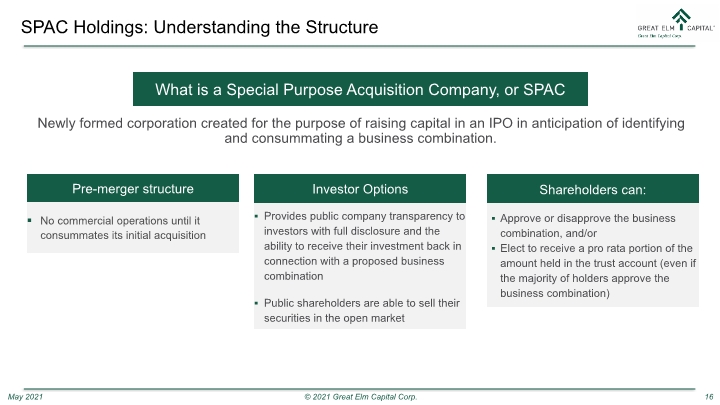
SPAC Holdings: Understanding the Structure What is a Special Purpose Acquisition Company, or SPAC Newly formed corporation created for the purpose of raising capital in an IPO in anticipation of identifying and consummating a business combination.
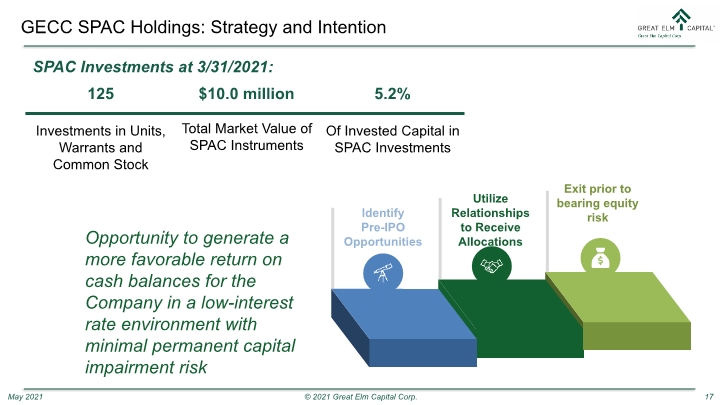
GECC SPAC Holdings: Strategy and Intention Identify Pre-IPO Opportunities Utilize Relationships to Receive Allocations Exit prior to bearing equity risk Opportunity to generate a more favorable return on cash balances for the Company in a low-interest rate environment with minimal permanent capital impairment risk
Financial Review (Quarter Ended 3/31/2021)
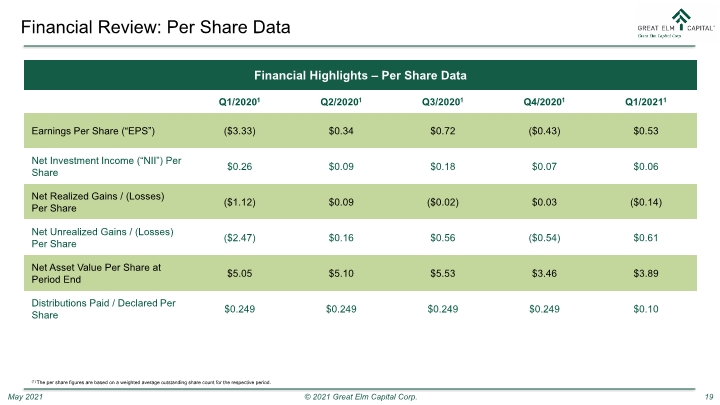
Financial Review: Per Share Data (1) The per share figures are based on a weighted average outstanding share count for the respective period. Financial Highlights – Per Share Data
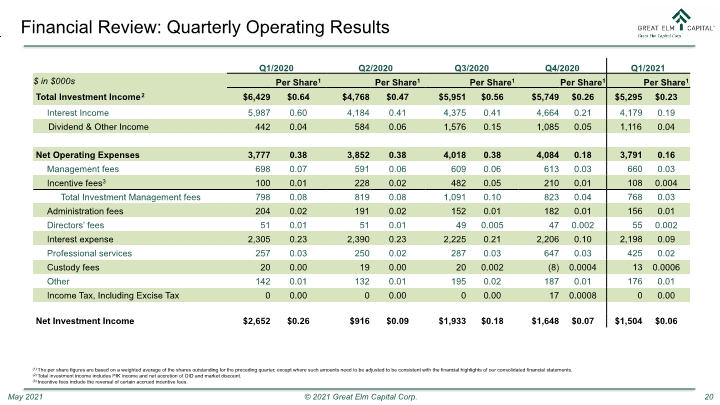
Financial Review: Quarterly Operating Results (1) The per share figures are based on a weighted average of the shares outstanding for the preceding quarter, except where such amounts need to be adjusted to be consistent with the financial highlights of our consolidated financial statements. (2) Total investment income includes PIK income and net accretion of OID and market discount. (3) Incentive fees include the reversal of certain accrued incentive fees.
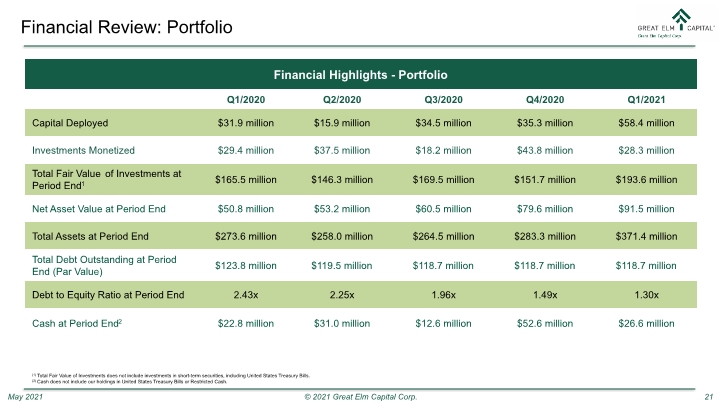
Financial Review: Portfolio (1) Total Fair Value of Investments does not include investments in short-term securities, including United States Treasury Bills. (2) Cash does not include our holdings in United States Treasury Bills or Restricted Cash. Financial Highlights - Portfolio
Summary
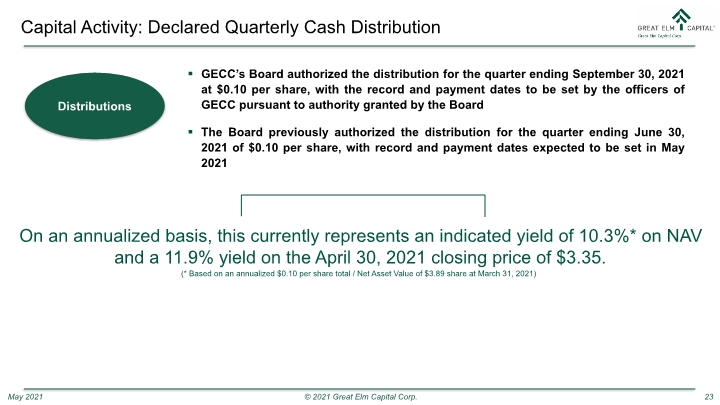
Capital Activity: Declared Quarterly Cash Distribution Distributions GECC’s Board authorized the distribution for the quarter ending September 30, 2021 at $0.10 per share, with the record and payment dates to be set by the officers of GECC pursuant to authority granted by the Board The Board previously authorized the distribution for the quarter ending June 30, 2021 of $0.10 per share, with record and payment dates expected to be set in May 2021 On an annualized basis, this currently represents an indicated yield of 10.3%* on NAV and a 11.9% yield on the April 30, 2021 closing price of $3.35. (* Based on an annualized $0.10 per share total / Net Asset Value of $3.89 share at March 31, 2021)
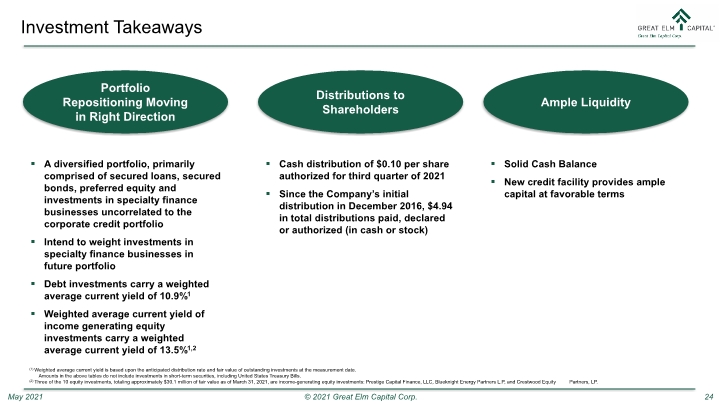
Investment Takeaways A diversified portfolio, primarily comprised of secured loans, secured bonds, preferred equity and investments in specialty finance businesses uncorrelated to the corporate credit portfolio Intend to weight investments in specialty finance businesses in future portfolio Debt investments carry a weighted average current yield of 10.9%1 Weighted average current yield of income generating equity investments carry a weighted average current yield of 13.5%1,2 Solid Cash Balance New credit facility provides ample capital at favorable terms Distributions to Shareholders Cash distribution of $0.10 per share authorized for third quarter of 2021 Since the Company’s initial distribution in December 2016, $4.94 in total distributions paid, declared or authorized (in cash or stock) (1) Weighted average current yield is based upon the anticipated distribution rate and fair value of outstanding investments at the measurement date. Amounts in the above tables do not include investments in short-term securities, including United States Treasury Bills. (2) Three of the 10 equity investments, totaling approximately $30.1 million of fair value as of March 31, 2021, are income-generating equity investments: Prestige Capital Finance, LLC, Blueknight Energy Partners L.P, and Crestwood Equity Partners, LP. Portfolio Repositioning Moving in Right Direction Ample Liquidity

Appendix Financial Statements Balance Sheet General Risks Contact Information
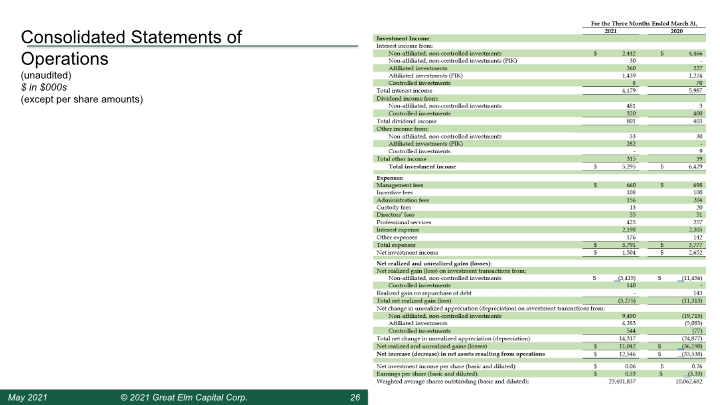
Consolidated Statements of Operations (unaudited) $ in $000s (except per share amounts)
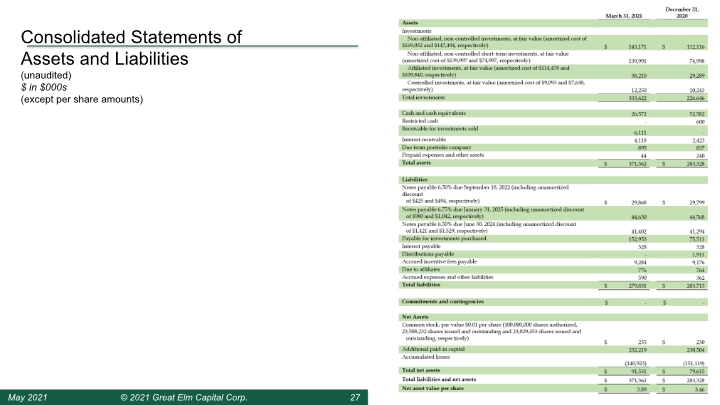
Consolidated Statements of Assets and Liabilities (unaudited) $ in $000s (except per share amounts)
Appendix: General Risks Debt instruments are subject to credit and interest rate risks. Credit risk refers to the likelihood that an obligor will default in the payment of principal or interest on an instrument. Financial strength and solvency of an obligor are the primary factors influencing credit risk. In addition, lack or inadequacy of collateral or credit enhancement for a debt instrument may affect its credit risk. Credit risk may change over the life of an instrument, and debt instruments that are rated by rating agencies are often reviewed and may be subject to downgrade. Our debt investments either are, or if rated would be, rated below investment grade by independent rating agencies. These “junk bonds” and “leveraged loans” are regarded as having predominantly speculative characteristics with respect to the issuer’s capacity to pay interest and repay principal. They may be illiquid and difficult to value and typically do not require repayment of principal before maturity, which potentially heightens the risk that we may lose all or part of our investment. Interest rate risk refers to the risks associated with market changes in interest rates. Interest rate changes may affect the value of a debt instrument indirectly (especially in the case of fixed rate obligations) or directly (especially in the case of an instrument whose rates are adjustable). In general, rising interest rates will negatively impact the price of a fixed rate debt instrument and falling interest rates will have a positive effect on price. Adjustable rate instruments also react to interest rate changes in a similar manner although generally to a lesser degree (depending, however, on the characteristics of the reset terms, including the index chosen, frequency of reset and reset caps or floors, among other factors). GECC utilizes leverage to seek to enhance the yield and net asset value of its common stock. These objectives will not necessarily be achieved in all interest rate environments. The use of leverage involves risk, including the potential for higher volatility and greater declines of GECC’s net asset value, fluctuations of dividends and other distributions paid by GECC and the market price of GECC’s common stock, among others. The amount of leverage that GECC may employ at any particular time will depend on, among other things, our Board’s and our adviser’s assessment of market and other factors at the time of any proposed borrowing. As part of our lending activities, we may purchase notes or make loans to companies that are experiencing significant financial or business difficulties, including companies involved in bankruptcy or other reorganization and liquidation proceedings. Although the terms of such financings may result in significant financial returns to us, they involve a substantial degree of risk. The level of analytical sophistication, both financial and legal, necessary for successful financing to companies experiencing significant business and financial difficulties is unusually high. We cannot assure you that we will correctly evaluate the value of the assets collateralizing our investments or the prospects for a successful reorganization or similar action. In any reorganization or liquidation proceeding relating to a portfolio company, we may lose all or part of the amounts advanced to the borrower or may be required to accept collateral with a value less than the amount of the investment advanced by us to the borrower.
Investor Relations 800 South Street, Suite 230 Waltham, MA 02453 Phone: +1 (617) 375-3006 investorrelations@greatelmcap.com Adam Prior The Equity Group Inc. +1 (212) 836-9606 aprior@equityny.com Contact Information
