Attached files
| file | filename |
|---|---|
| EX-99.1 - PRESS RELEASE - BROADWIND, INC. | exh_991.htm |
| 8-K - FORM 8-K - BROADWIND, INC. | f8k_050621.htm |
Exhibit 99.2

First Quarter 2021 Results Conference Call Investor Presentation
SAFE - HARBOR STATEMENT 2 | Investor Presentation This release contains “forward looking statements” — that is, statements related to future, not past, events — as defined in Section 21 E of the Securities Exchange Act of 1934 , as amended, that reflect our current expectations regarding our future growth, results of operations, financial condition, cash flows, performance, business prospects and opportunities, as well as assumptions made by, and information currently available to, our management . Forward looking statements include any statement that does not directly relate to a current or historical fact . We have tried to identify forward looking statements by using words such as “anticipate,” “believe,” “expect,” “intend,” “will,” “should,” “may,” “plan” and similar expressions, but these words are not the exclusive means of identifying forward looking statements . Our forward - looking statements may include or relate to our beliefs, expectations, plans and/or assumptions with respect to the following, many of which are, and will be, amplified by the COVID - 19 pandemic : (i) the impact of global health concerns, including the impact of the current COVID - 19 pandemic on the economies and financial markets and the demand for our products ; (ii) state, local and federal regulatory frameworks affecting the industries in which we compete, including the wind energy industry, and the related extension, continuation or renewal of federal tax incentives and grants and state renewable portfolio standards as well as new or continuing tariffs on steel or other products imported into the United States ; (iii) our customer relationships and our substantial dependency on a few significant customers and our efforts to diversify our customer base and sector focus and leverage relationships across business units ; (iv) the economic and operational stability of our significant customers and suppliers, including their respective supply chains, and the ability to source alternative suppliers as necessary, in light of the COVID - 19 pandemic ; (v) our ability to continue to grow our business organically and through acquisitions, and the impairment thereto by the impact of the COVID - 19 pandemic ; (vi) the production, sales, collections, customer deposits and revenues generated by new customer orders and our ability to realize the resulting cash flows ; (vii) information technology failures, network disruptions, cybersecurity attacks or breaches in data security, including with respect to any remote work arrangements implemented in response to the COVID - 19 pandemic ; (viii) the sufficiency of our liquidity and alternate sources of funding, if necessary ; (ix) our ability to realize revenue from customer orders and backlog ; (x) our ability to operate our business efficiently, comply with our debt obligations, manage capital expenditures and costs effectively, and generate cash flow ; (xi) the economy, including its stability in light of the COVID - 19 pandemic, and the potential impact it may have on our business, including our customers ; (xii) the state of the wind energy market and other energy and industrial markets generally and the impact of competition and economic volatility in those markets ; (xiii) the effects of market disruptions and regular market volatility, including fluctuations in the price of oil, gas and other commodities ; (xiv) competition from new or existing industry participants including, in particular, increased competition from foreign tower manufacturers ; (xv) the effects of the change of administrations in the U . S . federal government ; (xvi) our ability to successfully integrate and operate acquired companies and to identify, negotiate and execute future acquisitions ; (xvii) the potential loss of tax benefits if we experience an “ownership change” under Section 382 of the Internal Revenue Code of 1986 , as amended ; (xviii) our ability to utilize various relief options enabled by the CARES Act, including our ability to receive forgiveness of the PPP Loans ; (xix) the limited trading market for our securities and the volatility of market price for our securities ; and (xx) the impact of future sales of our common stock or securities convertible into our common stock on our stock price . These statements are based on information currently available to us and are subject to various risks, uncertainties and other factors that could cause our actual growth, results of operations, financial condition, cash flows, performance, business prospects and opportunities to differ materially from those expressed in, or implied by, these statements including, but not limited to, those set forth under the caption “Risk Factors” in Part I, Item 1 A of our Annual Report on Form 10 - K for the year ended December 31 , 2020 . We are under no duty to update any of these statements . You should not consider any list of such factors to be an exhaustive statement of all of the risks, uncertainties or other factors that could cause our current beliefs, expectations, plans and/or assumptions to change . Accordingly, forward - looking statements should not be relied upon as a predictor of actual results .

PERFORMANCE OVERVIEW

4 | Investor Presentation EXECUTIVE SUMMARY Market Update, Recent Results and Outlook Market Update As of May 2021 1Q21 Results Performance Overview 2Q21 Outlook Performance Overview Improved U.S. Offshore Wind Forecast 32 GW of new capacity expected by 2031; 2024 through 2030, new offshore capacity averages 4.5 GW/year Favorable Wind Policy Outlook Proposed Biden tax plan would advance clean energy production through a 10 - year extension of the PTC and ITC – potentially transformational for industry (1) C&I Demand Gradually Improving Increased gearing and industrial fabrication order activity within cyclical end - markets supports expectations for a gradual, post - pandemic recovery Upgraded U.S. Onshore Wind Outlook Dec - 20 extension of the Production Tax Credit (PTC) in the US strengthens near - term expectations of 35 GW of new capacity from 2021 to 2023 Total Revenue (33%) y/y to $32.7 million 1Q21 results impacted by a more than one - week , weather related outage at TX tower facility; shift in timing of customer order now scheduled for 2Q21; continued pandemic - related supply chain issues and presence of unfairly priced imports Heavy Fabrications Segment Update Total wind towers sections sold declined more than 45% on a y/y basis due to above - referenced issues; tower orders increased more than 100% y/y; tower capacity ~60% booked for full - year 2021 Gearing Segment Update Beginning to see early indications of improved demand activity; orders highest since 1Q20; backlog approaching pre - pandemic levels; financial performance improving Industrial Solutions Segment Update 1Q21 revenue improved on a y/y basis, supported by increased demand within the natural gas turbine market (1) U.S. Department of the Treasury. The Made In America Tax Plan. April 2021 Improved Outlook for 2Q21 Anticipate a reacceleration in customer activity, supported by both wind and non - wind customer shipments Anticipate Q/Q Revenue Growth 2Q21 total revenue expected to be in a range of $45 million to $50 million Anticipate Q/Q Adj. EBITDA Growth 2Q21 total Adjusted EBITDA expected to be $4.5 million to $5.0 million, including ~$3.0 million in ERC cash benefits Equity ATM Program Near Completion Received $ 6.4 million in cash proceeds, net of commissions, on $10.0 million authorization Employee Retention Credit (ERC ) Benefit Received $3.4 million in credits during 1Q21

PERFORMANCE BRIDGE Revenue declined nearly $16 million y/y in 1Q21; Anticipate strong q/q improvement into 2Q21 5 | Investor Presentation 1Q20 vs. 1Q21 Revenue Bridge ($ MM) 1Q20 vs. 1Q21 Adjusted EBITDA Bridge ($ MM) $32.7 $3.6

CONSOLIDATED FINANCIAL DATA Challenging first quarter due to non - recurring factors, but TTM revenue trend remains stable 6 | Investor Presentation Total Revenue ($MM) Gross Profit ($MM) Adjusted EBITDA ($MM) Earnings (Loss) Per Share ($) • TTM revenue remains stable, despite challenging 1Q21, where revenue declined 33% y/y • 1Q21 and TTM 1Q21 Adj. EBITDA benefited from a $3.4 million employee retention tax credit used to offset pandemic - related challenges • Anticipate sequential improvement in Adjusted EBITDA, given increased customer quoting and bidding activity Revenue declined (1.4%) y/y $48.6 $32.7 $185.2 $182.6 1Q20 1Q21 TTM 1Q20 TTM 1Q21 Revenue declined (33%) y/y $6.2 $0.3 $18.0 $12.1 1Q20 1Q21 TTM 1Q20 TTM 1Q21 $3.6 $1.2 $9.1 $5.6 1Q20 1Q21 TTM 1Q20 TTM 1Q21 $0.06 ($0.07) ($0.15) ($0.22) 1Q20 1Q21 TTM 1Q20 TTM 1Q21
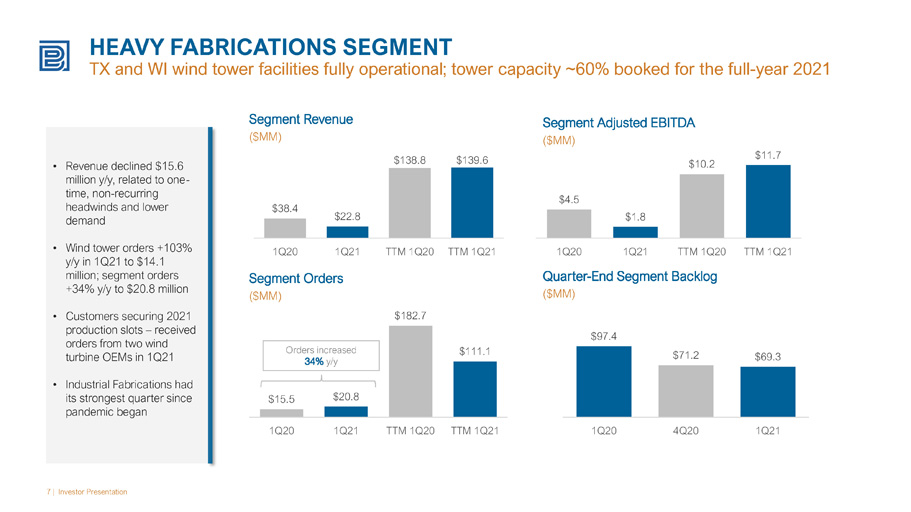
HEAVY FABRICATIONS SEGMENT TX and WI wind tower facilities fully operational; tower capacity ~60% booked for the full - year 2021 7 | Investor Presentation Segment Revenue ($MM) Segment Adjusted EBITDA ($MM) Segment Orders ($MM) Quarter - End Segment Backlog ($MM) • Revenue declined $15.6 million y/y, related to one - time, non - recurring headwinds and lower demand • Wind tower orders +103% y/y in 1Q21 to $14.1 million; segment orders +34% y/y to $20.8 million • Customers securing 2021 production slots – received orders from two wind turbine OEMs in 1Q21 • Industrial Fabrications had its strongest quarter since pandemic began $38.4 $22.8 $138.8 $139.6 1Q20 1Q21 TTM 1Q20 TTM 1Q21 $15.5 $20.8 $182.7 $111.1 1Q20 1Q21 TTM 1Q20 TTM 1Q21 $97.4 $71.2 $69.3 1Q20 4Q20 1Q21 Orders increased 34% y/y $4.5 $1.8 $10.2 $11.7 1Q20 1Q21 TTM 1Q20 TTM 1Q21

HEAVY FABRICATIONS SEGMENT TX weather, timing of customer order and supply chain impact pushed ~75 sections out of 1Q21 8 | Investor Presentation Total Wind Tower Sections Sold (Number of Sections) (1) Heavy Fabrications Adjusted EBITDA Margin (% of Sales) • Customer diversification driving growth in plant utilization • Approximately 75 tower sections pushed beyond 1Q21 due to non - recurring factors • EBITDA margin expansion evidenced in recent years driven by higher plant utilization and industrial fabrications investments (1) Our production facilities, located in Manitowoc, Wisconsin and Abilene, Texas, are situated near the primary U.S. domestic wind energy and equipment manufacturing hubs. The two facilities have a combined annual tower production capacity of up to approximately 550 towers (1650 tower sections), sufficient to support turbines generating more than 1,100 M W o f power. 0% 10% 20% 30% 40% 50% 60% 70% 80% - 200 400 600 800 1,000 1,200 1,400 2017 2018 2019 2020 TTM 1Q21 Wind Tower Sections Sold Tower Plant Capacity Utilization 7.5% 1.5% 5.2% 9.3% 8.4% 2017 2018 2019 2020 TTM 1Q21
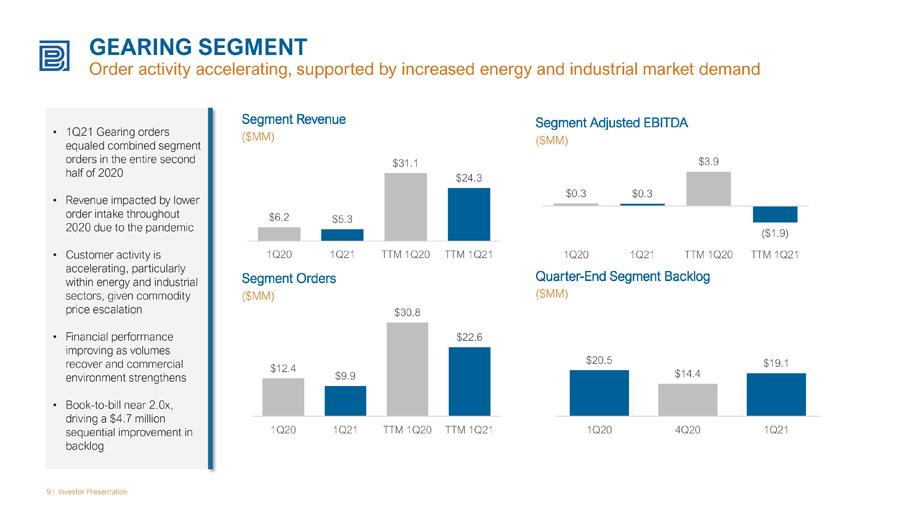
GEARING SEGMENT Order activity accelerating, supported by increased energy and industrial market demand 9 | Investor Presentation Segment Revenue ($MM) Segment Adjusted EBITDA ($MM) Segment Orders ($MM) Quarter - End Segment Backlog ($MM) • 1Q21 Gearing orders equaled combined segment orders in the entire second half of 2020 • Revenue impacted by lower order intake throughout 2020 due to the pandemic • Customer activity is accelerating, particularly within energy and industrial sectors, given commodity price escalation • Financial performance improving as volumes recover and commercial environment strengthens • Book - to - bill near 2.0x, driving a $ 4.7 million sequential improvement in backlog $6.2 $5.3 $31.1 $24.3 1Q20 1Q21 TTM 1Q20 TTM 1Q21 $12.4 $9.9 $30.8 $22.6 1Q20 1Q21 TTM 1Q20 TTM 1Q21 $20.5 $14.4 $19.1 1Q20 4Q20 1Q21 $0.3 $0.3 $3.9 ($1.9) 1Q20 1Q21 TTM 1Q20 TTM 1Q21
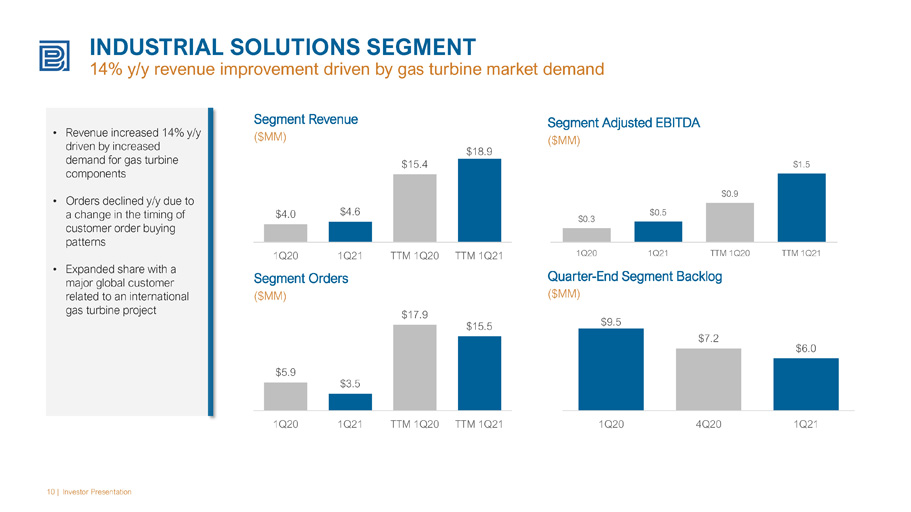
INDUSTRIAL SOLUTIONS SEGMENT 14% y/y revenue improvement driven by gas turbine market demand 10 | Investor Presentation Segment Revenue ($MM) Segment Adjusted EBITDA ($MM) Segment Orders ($MM) Quarter - End Segment Backlog ($MM) • Revenue increased 14% y/y driven by increased demand for gas turbine components • Orders declined y/y due to a change in the timing of customer order buying patterns • Expanded share with a major global customer related to an international gas turbine project $4.0 $4.6 $15.4 $18.9 1Q20 1Q21 TTM 1Q20 TTM 1Q21 $5.9 $3.5 $17.9 $15.5 1Q20 1Q21 TTM 1Q20 TTM 1Q21 $9.5 $7.2 $6.0 1Q20 4Q20 1Q21 $0.3 $0.5 $0.9 $1.5 1Q20 1Q21 TTM 1Q20 TTM 1Q21

BALANCE SHEET UPDATE More than $21 million of cash and availability to support growth as of 3/31/21 11 | Investor Presentation Quarter - End Total Cash and Availability on Credit Facility ($MM) Quarter - End Operating Working Capital as a % of Sales (1) (1) Operating working capital divided by T3M annualized sales $7.6 $8.1 $19.2 $19.0 $19.0 $21.9 $21.8 $24.1 $21.6 1Q19 2Q19 3Q19 4Q19 1Q20 2Q20 3Q20 4Q20 1Q21 11% 13% 3% 3% 5% 9% 6% 3% 9% 1Q19 2Q19 3Q19 4Q19 1Q20 2Q20 3Q20 4Q20 1Q21

U.S. WIND POWER INSTALLATION FORECAST Reduced cost of wind, clean energy policy agenda likely to improve outlook 12 | Investor Presentation (1) Source: Wood MacKenzie April 2021 Wind Sector Outlook; wind values include new build and repowering U.S. Onshore Wind Capacity Installations (Annual On - Shore GW Installed) (1) • PTC set to expire in 2021, and historically an extension of the PTC has led to significantly increased installations vs. market forecast • U.S. House of Representatives is currently evaluating a bill – The GREEN Act – that would preserve the PTC at the current phaseout level of 60% through the end of 2026 • Introduction of new offshore ITC in December 2020 • Offshore market is key to meeting state policies on the eastern seaboard and transition from fossil fuel generation U.S. Offshore Wind Capacity Installations (Annual Off - Shore GW Installed) (1) 11.0 17.6 15.3 11.6 7.6 7.6 8.1 2019 2020 2021e 2022e 2023e 2024e 2025e 0.4 2.9 4.3 5.6 4.8 4.6 4.7 2023e 2024e 2025e 2026e 2027e 2028e 2029e

CUSTOMER DIVERSIFICATION INITIATIVE Balanced revenue mix supports long - term growth and profitability 13 | Investor Presentation Wind vs. Non - Wind Revenue Concentration (% of Total Revenue) (1) (1) Wind energy figures shown above exclude repair/replacement demand • Wind and renewables remain our core industry focus • Revenue diversification positions us to better optimize our production capabilities during periods of lower wind tower demand • During the last four years, we have increased non - wind revenue by more than 300% to more than $60 million annually • Pandemic - related headwinds impacted more cyclical, non - wind end - markets in 2020, however, we anticipate a gradual recovery in 2021 Fastest Growing Non - Wind Sectors Since 2016 (Absolute Growth in Revenue) Industrial Mining Power Generation 92% 72% 50% 66% 69% 67% 8% 28% 50% 34% 31% 33% 2016 2017 2018 2019 2020 TTM 1Q21 Wind Revenue Non-Wind Revenue

APPENDIX
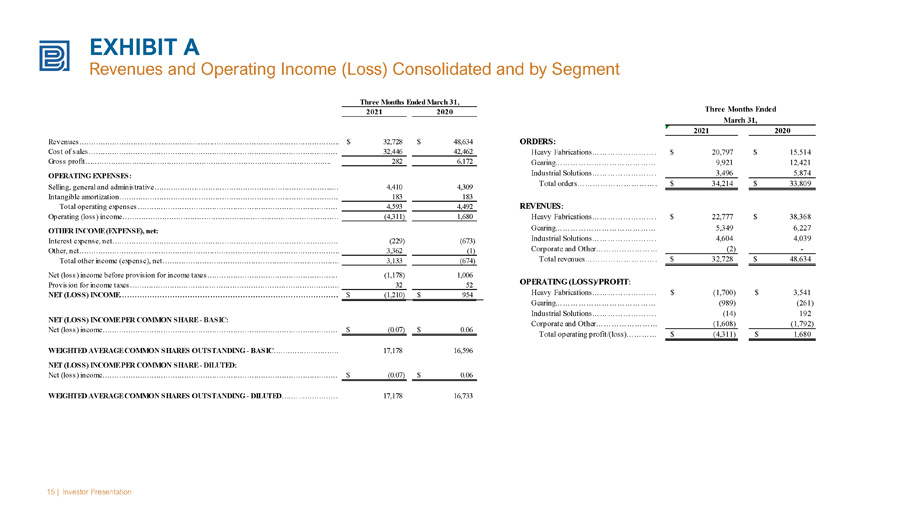
EXHIBIT A Revenues and Operating Income (Loss) Consolidated and by Segment 15 | Investor Presentation 2021 2020 Revenues…………………………………………………………………………………………………….. 32,728$ 48,634$ Cost of sales………………………………………………………………………………………………………. 32,446 42,462 Gross profit……………………………………………………………………………………………. 282 6,172 OPERATING EXPENSES: Selling, general and administrative…………………………………………………………………...………. 4,410 4,309 Intangible amortization……………………………………………………………………………………..… 183 183 Total operating expenses………………………………………………………………………………. 4,593 4,492 Operating (loss) income……………………………………………………………………………………………… (4,311) 1,680 OTHER INCOME (EXPENSE), net: Interest expense, net………………………………………………………………………………………. (229) (673) Other, net……………………………………………………………………………………………………… 3,362 (1) Total other income (expense), net…………………………………………………………………………………………….3,133 (674) Net (loss) income before provision for income taxes……………………………………………………….. (1,178) 1,006 Provision for income taxes………………………………………………………………………………. 32 52 NET (LOSS) INCOME…………………………………………………………………………………………………(1,210)$ 954$ NET (LOSS) INCOME PER COMMON SHARE - BASIC: Net (loss) income……………………………………………………………………………………………………………………………(0.07)$ 0.06$ WEIGHTED AVERAGE COMMON SHARES OUTSTANDING - BASIC………………………………………………..17,178 16,596 NET (LOSS) INCOME PER COMMON SHARE - DILUTED: Net (loss) income……………………………………………………………………………………………………………………………(0.07)$ 0.06$ WEIGHTED AVERAGE COMMON SHARES OUTSTANDING - DILUTED……………………………………………….17,178 16,733 Three Months Ended March 31, Three Months Ended 2021 2020 ORDERS: Heavy Fabrications………………………………………………………………20,797$ 15,514$ Gearing………………………………………………………………9,921 12,421 Industrial Solutions………………………………………………………………3,496 5,874 Total orders………………………………...………………34,214$ 33,809$ REVENUES: Heavy Fabrications………………………………………………………………22,777$ 38,368$ Gearing………………………………………………………………5,349 6,227 Industrial Solutions………………………………………………………………4,604 4,039 Corporate and Other……………………………………………………………(2) - Total revenues…………………………………..……………………32,728$ 48,634$ OPERATING (LOSS)/PROFIT: Heavy Fabrications………………………………………………………………(1,700)$ 3,541$ Gearing………………………………………………………………(989) (261) Industrial Solutions………………………………………………………………(14) 192 Corporate and Other……………………………………………………………(1,608) (1,792) Total operating profit/(loss)……………………………………(4,311)$ 1,680$ March 31,

EXHIBIT B GAAP to Non - GAAP Consolidated Adjusted EBITDA Reconciliation 16 | Investor Presentation Consolidated 2021 2020 Net (Loss) Income……………..…………...………………………………………(1,210)$ 953$ Interest Expense…………………….……………………………………. 230 673 Income Tax Provision…………………………….....…………………… 32 52 Depreciation and Amortization………………..……………………………………………………1,552 1,612 Share-based Compensation and Other Stock Payments………………………………………………………………613 315 Adjusted EBITDA (Non-GAAP)…………………………. 1,217 3,605 Three Months Ended March 31, Heavy Fabrications Segment 2021 2020 Net (Loss) Income……………………...…………………………….……. 921$ 2,698$ Interest Expense……………………………..……………………. 100 105 Income Tax (Benefit) Provision……..…………………...…………………… (402) 738 Depreciation……………………………………………………………… 944 964 Share-based Compensation and Other Stock Payments………………………………………………………………222 42 Adjusted EBITDA (Non-GAAP)…………………………….. 1,785$ 4,547$ Three Months Ended March 31, Gearing Segment 2021 2020 Net Loss……………………...……………………...……………. (283)$ (314)$ Interest Expense………………………...……………………………… 13 50 Income Tax Provision…………………...…………………… 3 4 Depreciation and Amortization………………………………………………………………458 512 Share-based Compensation and Other Stock Payments………………………………………………………………80 15 Adjusted EBITDA (Non-GAAP)……………………….. 271$ 267$ Three Months Ended March 31, Industrial Solutions Segment 2021 2020 Net (Loss)/Income……………………...……………………………. 178$ 159$ Interest Expense……………………………………………………. 14 1 Income Tax Provision…………………...…………………… 17 31 Depreciation and Amortization……………………………………. 106 104 Share-based Compensation and Other Stock Payments………… 147 19 Adjusted EBITDA (Non-GAAP)……………………………… 462$ 314$ Three Months Ended March 31, Corporate and Other 2021 2020 Net Income (Loss)………………………..……...……………………………. (2,026)$ (1,590)$ Interest Expense……………….…………………………………… 103 517 Income Tax Provision/(Benefit)……………………..…………… 414 (721) Depreciation and Amortization………………………………………………………………44 32 Share-based Compensation and Other Stock Payments………………………………………………………………164 239 Adjusted EBITDA (Non-GAAP)……………………..……………. (1,301)$ (1,523)$ Three Months Ended March 31,

EXHIBIT C Consolidated Statement of Cash Flows 17 | Investor Presentation 2021 2020 Net (loss) income…...……………………………………………………………………………………………(1,210)$ 954$ Adjustments to reconcile net cash used in operating activities: Depreciation and amortization expense…………………………………………………………………….1,553 1,612 Deferred income taxes………………………………………………………………………………………….(5) 22 Change in fair value of interest rate swap agreements………………………………………………………………….5 138 Stock-based compensation……………………………………………………………………………………..219 308 Allowance for doubtful accounts……………………………………………………………………………….(218) 29 Common stock issued under defined contribution 401(k) plan…………………………………….258 - Gain on disposal of assets……………………………………………………………………………………….(23) - Changes in operating assets and liabilities, net of acquisition: Accounts receivable………………………………………………………………………………………………..1,229 2,037 Employee retention credit receivable………………………………………………………………………………………………..(3,372) - Contract assets………………………………………………………………………………………………..(269) - Inventories ……………………………………………………………………………………………………………(13,552) (8,891) Prepaid expenses and other current assets……………………………………………………………..699 (476) Accounts payable ……………………………………………………………………………………………….7,591 3,545 Accrued liabilities………………………………………………………………………………………………419 (657) Customer deposits…………………………………………………………………………………………….(1,764) 305 Other non-current assets and liabilities…………………………………………………………………………………………….3 49 Net cash used in operating activities………………………………………………………………………………………………(8,437) (1,025) Purchases of property and equipment……………………………………………………………………………...…….(612) (670) Proceeds from disposals of property and equipment……………………………………………………………………23 - (589) (670) CASH FLOWS FROM FINANCING ACTIVITIES: Proceeds from line of credit………………………………………………………………………..5,673 51,552 Payments on line of credit………………………………………………………………………..(2,450) (49,070) Proceeds from long-term debt…………………………………………………………………………595 - Payments on long-term debt…………………………………………………………………………(150) (242) Principal payments on finance leases………………………………………………………………………………..(339) (218) Shares withheld for taxes in connection with issuance of restricted stock………………………………………………………………………………..(847) - Proceeds from sale of common stock, net………………………………………………………………………………..6,101 - 8,583 2,022 - NET (DECREASE) INCREASE IN CASH……………………………………….…………………….(443) 327 CASH beginning of the period……………………………………………………. 3,372 2,416 CASH end of the period………………………………………………………………………..2,929$ 2,743$ Three Months Ended March 31, CASH FLOWS FROM OPERATING ACTIVITIES: CASH FLOWS FROM INVESTING ACTIVITIES: Net cash used in investing activities……………………………………………………………………………………………… Net cash provided by financing activities………………………………………………………………………………………………………………………………

EXHIBIT D Consolidated Balance Sheet 18 | Investor Presentation March 31, December 31, 2021 2020 CURRENT ASSETS: Cash………………………………………………………………………………………………………………………2,929$ 3,372$ Accounts receivable, net………………………………………………………………………………………………………………………14,326 15,337 Employee retention credit receivable………………………………………………………………………………………………………………………3,372 - Contract assets………………………………………………………………………………………………………………………2,522 2,253 Inventories, net………………………………………………………………………………………………………..40,276 26,724 Prepaid expenses and other current assets……………………………………………………………………………2,204 2,909 Total current assets…………………………………………………………………………………………………….65,629 50,595 LONG-TERM ASSETS: Property and equipment, net………………………………………………………………………………….. 44,766 45,195 Operating lease right-of-use assets…………………………………………………………………………………………………………………..19,401 19,321 Intangible assets, net…………………………………………………………………………………………… 4,003 4,186 Other assets………………………………………………………………………………………………………. 422 385 TOTAL ASSETS……………………………………………………………………………………………………….. 134,221$ 119,682$ CURRENT LIABILITIES: Line of credit and other notes payable…………………………………………………………………………………………..5,076$ 1,406$ Current portion of finance lease obligations………………………………………………………………………..1,456 1,427 Current portion of operating lease obligations………………………………………………………………………..1,743 1,832 Accounts payable………………………………………………………………………………………………………….25,836 18,180 Accrued liabilities ………………………………………………………………………………………………………..6,731 6,307 Customer deposits…………………………………………………………………………………………………. 17,055 18,819 Total current liabilities………………………………………………………………………………………………..57,897 47,971 LONG-TERM LIABILITIES: Long-term debt, net of current maturities……………………………………………………………………………….9,380 9,381 Long-term finance lease obligations, net of current portion…………………………………………………. 1,891 1,996 Long-term operating lease obligations, net of current portion………………………………………………….19,748 19,569 Other…………………………………………………………………………………………………………………………123 104 Total long-term liabilities………………………………………………………………………………………….31,142 31,050 COMMITMENTS AND CONTINGENCIES STOCKHOLDERS' EQUITY: Preferred stock, $0.001 par value; 10,000,000 shares authorized; no shares issued or outstanding…………………………………………………………………………………………………………………….- - Common stock, $0.001 par value; 30,000,000 shares authorized; 18,474,170 and 17,211,498 shares issued as of March 31, 2021 and December 31, 2020, respectively………………………………………………………………………………………………………18 17 Treasury stock, at cost, 273,937 shares as of March 31, 2021 and December 31, 2020, respectively……………………………………………………………………………………………………… (1,842) (1,842) Additional paid-in capital………………………………………………………………………………………………….390,479 384,749 Accumulated deficit……………………………………………………………………………………………………………….(343,473) (342,263) Total stockholders' equity……………………………………………………………………………………… 45,182 40,661 TOTAL LIABILITIES AND STOCKHOLDERS' EQUITY………………………………………………………….. 134,221$ 119,682$ ASSETS LIABILITIES AND STOCKHOLDERS' EQUITY

Please contact our investor relations team at Investor@BWEN.com IR CONTACT