Attached files
| file | filename |
|---|---|
| EX-31.2 - EXHIBIT 31.2 - BROADWIND, INC. | a2197215zex-31_2.htm |
| EX-32.2 - EXHIBIT 32.2 - BROADWIND, INC. | a2197215zex-32_2.htm |
| EX-32.1 - EXHIBIT 32.1 - BROADWIND, INC. | a2197215zex-32_1.htm |
| EX-21.1 - EXHIBIT 21.1 - BROADWIND, INC. | a2197215zex-21_1.htm |
| EX-23.1 - EXHIBIT 23.1 - BROADWIND, INC. | a2197215zex-23_1.htm |
| EX-31.1 - EXHIBIT 31.1 - BROADWIND, INC. | a2197215zex-31_1.htm |
| EX-10.69 - EXHIBIT 10.69 - BROADWIND, INC. | a2197215zex-10_69.htm |
| EX-10.72 - EXHIBIT 10.72 - BROADWIND, INC. | a2197215zex-10_72.htm |
| EX-10.71 - EXHIBIT 10.71 - BROADWIND, INC. | a2197215zex-10_71.htm |
| EX-10.70 - EXHIBIT 10.70 - BROADWIND, INC. | a2197215zex-10_70.htm |
Use these links to rapidly review the document
BROADWIND ENERGY, INC. FORM 10-K TABLE OF CONTENTS
INDEX TO FINANCIAL STATEMENTS
SECURITIES AND EXCHANGE COMMISSION
Washington, D.C. 20549
FORM 10-K
| (Mark One) | ||
ý |
ANNUAL REPORT PURSUANT TO SECTION 13 OR 15(d) OF THE SECURITIES EXCHANGE ACT OF 1934 |
|
For the fiscal year ended December 31, 2009 |
||
or |
||
o |
TRANSITION REPORT PURSUANT TO SECTION 13 OR 15(d) OF THE SECURITIES EXCHANGE ACT OF 1934 |
|
For the transition period from to |
||
Commission File Number 0-31313

BROADWIND ENERGY, INC.
(Exact name of Registrant as specified in its charter)
| Delaware (State of or other jurisdiction of incorporation or organization) |
88-0409160 (I.R.S. Employer Identification No.) |
|
47 East Chicago Avenue, Suite 332 Naperville, Illinois |
60540 |
|
| (Address of principal executive offices) | (zip code) |
Registrant's telephone number, including area code: (630) 637-0315
Securities registered pursuant to Section 12(b) of the Act: None
Securities registered pursuant to Section 12(g) of the Act: Common Stock, $0.001 par value
Indicate by check mark whether the Registrant is a well-known seasoned issuer, as defined in Rule 405 of the Securities Act of 1933. Yes o No ý
Indicate by check mark if the Registrant is not required to file reports pursuant to Section 13 or 15(d) of the Securities Exchange Act of 1934. Yes o No ý
Indicate by check mark whether the Registrant (1) has filed all reports required to be filed by Section 13 or 15(d) of the Securities Exchange Act of 1934 during the preceding 12 months (or for such shorter period that the Registrant was required to file such reports), and (2) has been subject to such filing requirements for the past 90 days. Yes ý No o
Indicate by check mark whether the registrant has submitted electronically and posted on its corporate Web site, if any, every Interactive Data File required to be submitted and posted pursuant to Rule 405 of Regulation S-T during the preceding 12 months (or for such shorter period that the registrant was required to submit and post such files). Yes o No o
Indicate by check mark if disclosure of delinquent filers pursuant to Item 405 of Regulation S-K is not contained herein, and will not be contained, to the best of Registrant's knowledge, in definitive proxy or information statements incorporated by reference in Part III of this Form 10-K or any amendment to this Form 10-K. o
Indicate by check mark whether the Registrant is a large accelerated filer, an accelerated filer, a non-accelerated filer or a smaller reporting company. See the definitions of "large accelerated filer," "accelerated filer" and "smaller reporting company" in Rule 12b-2 of the Exchange Act. (Check one):
| Large accelerated filer o | Accelerated filer ý | Non-accelerated filer o (Do not check if a smaller reporting company) |
Smaller reporting company o |
Indicate by check mark whether the Registrant is a shell company, as defined in Rule 12b-2 of the Securities Exchange Act of 1934. Yes o No ý
The aggregate market value of the Registrant's voting common stock held by non-affiliates of the Registrant, based upon the $11.32 per share closing sale price of the Registrant's common stock on June 30, 2009 (the last business day of the Registrant's most recently completed second quarter) was approximately $386,816,829. For purposes of this calculation, the Registrant's directors and executive officers and holders of 10% or more of the Registrant's outstanding shares of voting common stock have been assumed to be affiliates, with such affiliates holding an aggregate of 62,430,684 shares of the Registrant's voting common stock on June 30, 2009, and shares held by such affiliates are not included in this calculation.
Number of shares of Registrant's common stock, par value $0.001, outstanding as of March 9, 2010, was 106,701,127.
DOCUMENTS INCORPORATED BY REFERENCE
Portions of the Registrant's Proxy Statement for the Registrant's 2010 Annual Meeting of Stockholders are incorporated by reference into Part III of this Annual Report.
BROADWIND ENERGY, INC.
FORM 10-K
TABLE OF CONTENTS
Cautionary Note Regarding Forward-Looking Statements
This Annual Report on Form 10-K contains "forward-looking statements"—that is, statements related to future, not past, events—as defined in Section 21E of the Securities Exchange Act of 1934, as amended (the "Exchange Act"), that reflect our current expectations regarding our future growth, results of operations, cash flows, performance and business prospects, and opportunities, as well as assumptions made by, and information currently available to, our management. Forward-looking statements include any statement that does not directly relate to a current or historical fact. We have tried to identify forward-looking statements by using words such as "anticipate," "believe," "expect," "intend," "will," "should," "may," "plan" and similar expressions, but these words are not the exclusive means of identifying forward-looking statements. These statements are based on information currently available to us and are subject to various risks, uncertainties, and other factors, including, but not limited to, those discussed in Item 1A "Risk Factors" in Part I of this Annual Report on Form 10-K that could cause our actual growth, results of operations, financial condition, cash flows, performance and business prospects and opportunities to differ materially from those expressed in, or implied by, these statements. Our forward-looking statements may include or relate to the following: (i) our plans to continue to grow our business through organic growth and integration of previous and future acquisitions; (ii) our beliefs with respect to the sufficiency of our liquidity and our plans to evaluate alternate sources of funding if necessary; (iii) our expectations relating to the extension, continuation or renewal of federal tax incentives and grants and state renewable portfolio standards; (iv) our expectations relating to construction of new facilities, expansion of existing facilities and sufficiency of our existing capacity to meet the demands of our customers and support expectations regarding our growth; (v) our plans with respect to the use of proceeds from financing activities; (vi) our beliefs and expectations relating to the economic downturn and the potential impact it may have on our business, including our customers; (vii) the anticipated benefits of our remediation efforts on the strength of our internal control processes and our plans with respect to future remediation efforts; and (viii) our beliefs regarding the state of the wind energy market generally. You should not consider any list of such factors to be an exhaustive statement of all of the risks, uncertainties, or potentially inaccurate assumptions that could cause our current expectations or beliefs to change. Except as expressly required by the federal securities laws, we undertake no obligation to update such factors or to publicly announce the results of any of the forward-looking statements contained herein to reflect future events, developments, or changed circumstances or for any other reason.
As used in this Annual Report on Form 10-K, the terms "we," "us," "our," "Broadwind," and the "Company" refer to Broadwind Energy, Inc., a Delaware incorporated company headquartered in Naperville, Illinois, and its wholly-owned subsidiaries.
Business Overview
Broadwind Energy provides technologically advanced high-value products and services to the U.S. wind energy industry. We believe we are the only independent company that offers our breadth of products and services to the market. Our product and service portfolio provides our customers, including wind turbine manufacturers, wind farm developers and wind farm operators, with access to a broad array of wind component and service offerings, which we believe is becoming increasingly important in today's wind market. We also provide technical service and precision repair and engineering and specialized logistics to the wind industry in the United States, a highly-fragmented market in which we hold a significant position. We have long standing relationships with our primary customers, who include several leading participants in the U.S. wind sector.
We believe we are well positioned to capture market opportunities associated with the anticipated growth in the wind farm development business in the United States. We believe this turn-around will be
1
driven by: (i) macroeconomic factors, including a broad economic recovery, an increase in overall energy prices and federal and state-level wind development incentives, (ii) broad upgrades to existing transmission infrastructure and increasing proliferation of smart grid technology, and (iii) the maturation of technologies and services within the wind industry, including increased turbine efficiencies, a coordinated global supply chain and improved equipment maintenance and reliability. Given our installed capital base, we believe we will be able to substantially grow revenues prior to investing in additional capital equipment.
As of December 31, 2009, we had four subsidiaries which consisted of Brad Foote Gear Works, Inc. ("Brad Foote"), Tower Tech Systems Inc. ("Tower Tech"), Energy Maintenance Service, LLC ("EMS") and Badger Transport, Inc. ("Badger"). In December 2009, we merged the operations of our R.B.A., Inc. ("RBA") subsidiary into Tower Tech.
In December 2009, we revised our reporting segment presentation into four reportable operating segments: Towers, Gearing, Technical and Engineering Services, and Logistics. Accordingly, all current and prior period financial results have been revised to reflect these changes. For additional financial information related to our segments, please refer to Item 7, "Management's Discussion and Analysis of Financial Condition and Results of Operations" and Note 19 "Segment Reporting" in Item 15 in the notes to our consolidated financial statements for a discussion of summary financial information by segment.
The following is a description of our product and service offerings:
Towers
We manufacture structural towers for wind turbines. We specialize in heavier "next generation" wind towers that are larger, more technically advanced towers, designed for 2 megawatt ("MW") and larger wind turbines. Since starting commercial production in 2005, we have produced over 500 towers. Our production facilities are strategically located in close proximity to the primary U.S. wind resource regions, sited in Wisconsin, Texas and South Dakota. When our Brandon, South Dakota facility becomes operational, our three tower production facilities will have a combined annual tower production capacity sufficient to support turbines generating more than 1,500 MW of power.
Our structural towers for wind turbines are predominantly sold to wind turbine manufacturers who utilize our products in the assembly of wind turbines. Due to the highly specialized nature of our products, they are generally sold through our direct sales force following an evaluation, qualification and testing period, which may occur over a number of months. We compete based on product performance, quality, price, location and available capacity. We have periodically entered into multi-year framework agreements under which we expect to provide products to certain key customers over multi-year periods. Our principal wind tower customers include Gamesa, Vestas and Nordex. We also manufacture specialty fabrications and heavy weldments for wind energy and other industrial customers.
Gearing
We manufacture high precision gearing systems for wind turbines. We also manufacture custom-engineered gearing systems for the mining, energy and other industrial sectors.
We produce to the highest industry quality standards, and we were the first U.S. gear manufacturer to achieve ISO 9001 certification. We use an integrated manufacturing process, which includes our machining process in Cicero, Illinois, our heat treatment process in Neville Island, Pennsylvania and our finishing process in our Cicero factory. These complex production processes allow us to manufacture custom products to meet the stringent tolerances and high quality standards of our wind
2
turbine customers. Our precision gearing manufacturing facilities have the production capacity to support turbines producing more than 4,000 MW of power annually.
Due to the highly specialized nature of our gearing, it is generally sold through our direct sales force following an evaluation, qualifying, prototyping and testing period, which may occur over a number of months. We compete based on product performance, quality, price and available capacity. We have periodically entered into multi-year framework agreements under which we expect to provide products to certain key customers over multi-year periods. Our principal customers include General Electric and Clipper Windpower, both of whom have been long-standing customers. We are currently in discussions with large global gear drive original equipment manufacturers with the aim of becoming a gearing system supplier to one or more of these companies.
We also manufacture gearing for industrial markets including mining and oilfield equipment. We target niche markets and applications that require the strict tolerances and high quality standards of our processes. These products serve to diversify our customer and product portfolio and balance our plant loadings.
Technical and Engineering Services
We offer technical and precision repair and engineering services to developers and operators of wind farms and manufacturers of wind turbines. Our technical services business provides construction support and operations and maintenance services to the wind industry. Our engineering services include precision repair and refurbishment of the complex systems and components of wind turbines. Sales contacts are typically initiated through a small direct sales force, or through operating unit managers located in our geographically dispersed service locations. Sales are generally made under individual purchase orders, although we have blanket purchase orders or framework agreements in place with select key customers. Our Technical and Engineering Services business competes with a number of independent service providers in a highly-fragmented but growing industry. Our principal Technical and Engineering Services segment customers include Bluarc, NexGen Energy Partners, NextEra Energy Resources, Siemens Energy and Suzlon Wind Energy. Our service locations are in Illinois, California, South Dakota, Texas and Colorado. Our vision is to become the most comprehensive service provider to the United States and Canadian wind industry by expanding the number of our service centers and product offerings.
Our specialty services include oil change-out, up-tower tooling for gearing systems, drive-train and blade repairs and component replacement. Our construction support capabilities include assembly of towers, nacelles, blades and other components. We also provide customer support, preventive maintenance and wind technician training. Our technicians utilize our regional service centers for storage and repair of parts as well as our training offerings.
Through our precision repair and engineering services, we repair and refurbish complex wind components, including control systems, gearboxes and blades. We also conduct warranty inspections, commission turbines and provide technical assistance. Additionally, we build replacement control panels for kilowatt ("kW") class wind turbines and repair both kW and MW blades. A large portion of the approximately 35,000 MW installed base of wind turbines in the United States is now coming out of warranty, creating a growing need for MW gearbox refurbishment. We plan to develop during 2010 the first independent gearbox refurbishing center and gearbox test stand to perform full-load testing for MW class wind turbine units.
Logistics
We offer specialized transportation, permitting and logistics management to the wind industry for oversize and overweight machinery and equipment. We deliver complete turbines to the installation site, including blades, nacelles and tower sections for final erection. We focus on the project
3
management of the delivery of complete wind turbine farms. We have a fleet of over 60 specialized heavy haul trailers supporting annual delivery of 500 MW of full turbine components. We primarily compete based on the availability of our trailer asset base, our service, price and reliability. Sales contracts are typically initiated through a small direct sales force, under discrete purchase orders issued by a turbine manufacturer or wind farm developer. Although we predominantly focus on wind energy customers, we also periodically haul other oversized equipment such as large pressure vessels or other industrial equipment, in order to maintain utilization of our heavy haul fleet. Our principal customers include Gamesa and Suzlon Wind Energy.
Competitive Strengths
We believe our business model offers a number of competitive strengths that have contributed to our commercial success and will enable us to capitalize on significant opportunities for growth. These competitive strengths include the following:
- •
- Strong relationships with leading wind industry
players. Our integrated business model has enabled us to hold leading positions in many of the markets we serve by successfully winning
key contracts and establishing strong relationships with major wind sector manufacturers. We provide products and services to the eight largest wind turbine manufacturers currently selling in the
United States: Acciona, Clipper Windpower, Gamesa, General Electric, Mitsubishi, Siemens Energy, Suzlon Wind Energy, and Vestas. We believe our relationships with leading players endorse our product
quality and service capabilities and position us well to sell effectively to new customers. We intend to continue to develop long-term, multi-year contracts and strategic
customer relationships across our businesses.
- •
- Leading service
platform. We are the largest horizontally integrated independent service provider to the U.S. wind industry. We believe that we are
differentiated by the breadth of our offerings, which enables us to work with wind farm developers through a project lifecycle: construction support including logistics and transport, commissioning of
the wind farm, ongoing maintenance and operational support services, precision repair and upgrades to existing installations. Our in-house gearing system manufacturing expertise positions
us to enter the market for gearbox repair and refurbishment which, for MW-scale turbines, has historically been performed by non-domestic sources. We believe that our broad
service offerings and technical capabilities will allow us to grow our services business significantly as the installed wind turbine base grows and wind turbines come off warranty.
- •
- Manufacturing and service capacity to support anticipated
growth. Over the past two years, we have made substantial upfront investments in property and equipment to position ourselves to take
advantage of the expected rapid growth in the North American wind industry. We believe this capacity will allow us to quickly respond to increased demand from our customers and enable us to gain share
as market growth returns. We have invested substantial capital in technology, engineering and manufacturing capabilities and capacity for both wind turbine towers and gearing systems. We have also
invested significantly to grow our capacity through the addition of personnel and new technical and precision repair and engineering service offerings and by expanding our footprint of regional
service centers. In connection with the expected growth of the wind power market, we believe these investments will allow us to realize significant operating leverage as we increase our revenues with
minimal capital expenditure.
- •
- Ability to cross-sell our product and service offerings. Our combined product and service suite provides us with opportunities to increase sales to existing customers and approach potential customers with a coordinated offering. Leveraging our broad existing customer base, we have realized additional revenues by selling products and services that our customers previously purchased from various other providers. As an example, we have provided logistics services to
4
- •
- Horizontally integrated supply chain offering with strategically located
operations. We believe that we have the leading North American platform designed to provide an integrated solution to the fragmented supply chain our customers face. Today, the
manufacture and production of wind turbines involves over 8,000 components and many of the key inputs are both geographically dispersed and lack integration. This results in high transportation costs
and quality control issues as many developers and manufacturers are forced to coordinate among multiple suppliers. While we do not provide all key components, our wind turbine component production
capabilities combined with the broad array of services we offer allows our customers to simplify coordination for these increasingly complex wind development projects. We believe the breadth of our
capabilities will prove attractive to new entrants and incumbents by improving speed to market, increasing product reliability and reducing costs. Additionally, our production facilities and service
offerings are strategically located near existing wind centers, which allows us to minimize our response time and reduce logistics costs for our customers.
- •
- Industry leading technology and manufacturing
expertise. We utilize industry-leading technology and design capabilities and have wind product manufacturing expertise. We specialize
in manufacturing "next generation" wind towers, and we were the first U.S. gear manufacturer to achieve ISO 9001 certification. Our gearing systems production facilities utilize
state-of-the-art Höfler production centers and are experienced in designing and manufacturing customized products to meet specific customer needs. We
have diverse technical repair expertise and the necessary spare inventory to minimize costs and response time and deliver the greatest long-term value for the lifecycle of our customers'
projects. We believe our ability to design and manufacture high quality customized products and provide superior service creates high barriers to entry and allows us to maintain an advantage over our
competition.
- •
- Experienced management team with decades of wind industry experience. Our senior management team has significant industry experience and proven expertise in wind and other energy sectors and holds leadership positions in industry organizations such as the American Wind Energy Association ("AWEA"), the Canadian Wind Energy Association and the American Gear Manufacturers Association. Key areas of expertise include high technical specification industrial manufacturing, operational execution in the wind industry, strategic business development, financial planning and acquisition integration. Members of our senior management team have held positions at leading global and national wind and industrial sector companies including Vestas, General Electric, Trinity Industries, DMI Industries, British Petroleum, Regal Beloit, FMC Technologies and Federal Signal.
customers to whom we had previously only supplied towers or operations and maintenance services. We have also recently been engaged by wind farm developers for comprehensive supply chain solutions including supply of towers, gearbox rebuilds, transport and logistics and construction and commissioning support services. We believe that the breadth of our comprehensive solution is unique and is compelling for the growing segment of smaller wind developers.
Business and Operating Strategy
We intend to capitalize on the anticipated growth of the wind sector in the United States and Canada by providing our technologically advanced, highly reliable, value-added products and components and customized services across the wind supply chain to enhance our leadership position.
Our strategic objectives include the following:
- •
- Utilize our established platform to increase market share and satisfy customer demand. During 2008, we took steps to enhance our manufacturing capabilities by increasing gearing production capacity and constructing a new state-of-the-art tower manufacturing plant in Abilene, Texas.
5
- •
- Continue to develop and grow our service
businesses. We have established a network of service centers strategically located near key wind farm sites with precision repair and
engineering capabilities and skilled personnel. We believe that there is a significant opportunity to continue to develop this network to provide more comprehensive support to additional businesses in
the wind industry. Wind turbine components are initially serviced by wind turbine manufacturers under applicable warranties, which have generally been shortening over time. We believe that, as the
size of the installed base grows and ages, manufacturer warranties expire and as the complexity and size of wind turbines increase, wind farm operators will increasingly seek third party service
providers to maintain their assets. We intend to support our customers' service strategies, to further develop our own service channels and to capture a share of the expanding service and aftermarket
support business through relationships with wind turbine manufacturers, wind farm operators and independent service providers.
- •
- Leverage our success in North America to pursue international business
opportunities. We have begun to expand our focus beyond the North American wind energy market to develop an international presence as a long-term strategic
objective. We believe that there has been a rapid migration of turbine manufacturers to the United States, which has allowed us to develop relationships with leading global turbine assembly companies
and increases our opportunity to leverage these relationships into global markets. We have recently restructured our management team to provide the framework for pursuing international business
opportunities, which we believe will expand our revenue opportunities and enable us to better serve our customers, enhance our supply chain and develop additional synergies across our operating units.
- •
- Continue to improve production technology and operational
efficiency. We believe that the proper coordination and integration of the supply chain are key factors that enable high operating
efficiencies, increased reliability and lower costs. Our manufacturing facilities include state-of-the-art equipment and lean processes to help enhance our
operational efficiency and flexibility. We will continue to pursue strategies to further optimize our production processes to generate increased output, leverage our scale and lower our costs while
maintaining product quality.
- •
- Broaden our product offerings. We believe that we offer one of the most complete sets of product offerings addressing the needs of customers across the North American wind supply chain. We are dedicated to the identification, development and commercialization of new products that take advantage of our scale in order to provide comprehensive solutions for our customers. Since a turbine may contain more than 8,000 components, we plan to take advantage of our extensive expertise and technological capabilities to develop the complex product offerings required to compete in the North American wind market.
In January 2010, we completed construction of an additional tower manufacturing plant in Brandon, South Dakota, which is not yet operational. We increased specialized heavy-haul capacity by over 20% and increased our service capacity through strategic hiring and the addition of a new facility capable of supporting MW-class blade repair. We believe our presence in key wind resource states provides us with an advantage on cost, efficiency and speed to market by limiting exchange rate risk and importation and customs duties (compared to international competitors) and substantially reducing transportation and working capital costs for our customers. As a result, we believe that we are well positioned with our existing infrastructure to take advantage of projected improvements in market conditions.
As the North American wind industry matures and the complexity of wind turbines increases, complex product offerings, advanced supply chain management and specialized services will be critical for wind turbine manufacturers and wind farm developers and owners, and we intend to pursue our
6
business strategies and maintain and enhance our established platform to more deeply penetrate our target markets and further diversify our customer base.
Wind Turbine Components
A wind turbine and its components represent approximately 65% of the costs of new wind farms. The manufacture and production of wind energy-related infrastructure involves over 8,000 components. The five most significant components, each of which generally accounts for more than 10% of the overall cost of a turbine, are the tower, blade system, nacelle, gearbox and pitch systems and bearings. Additional key components include the generator and the controller. The following illustration shows the key components of a wind turbine.
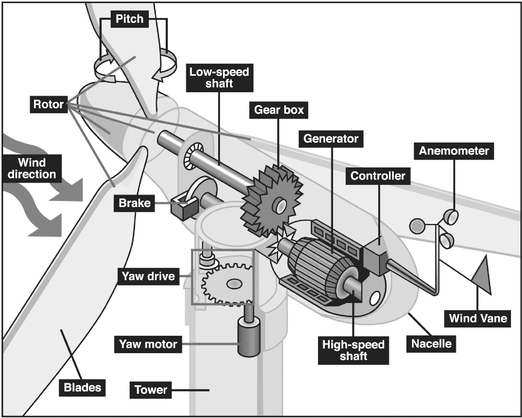
Towers
A wind tower accounts for approximately 18-27% of the total capital cost of a wind turbine. A tower's cost is proportional to its height and diameter. Taller towers give access to stronger winds and more even wind flow, both of which lead to a higher electrical output. Industry research indicates that for tower sizes between 80 and 100 meters, each additional meter delivers 0.9% more yield. Doubling the height of the tower generally requires doubling its diameter and increasing the amount of material needed by a factor of eight, which results in a trade-off between the additional yields delivered by increasing tower height versus the additional cost of the tower. We manufacture wind towers in our Manitowoc, Wisconsin and Abilene, Texas facilities and have a recently constructed, but not yet operational wind tower manufacturing facility in Brandon, South Dakota.
Nacelle
The nacelle houses most of the wind turbine's components including the generator, gearbox and control systems as well as thousands of smaller components and accounts for approximately 12-22% of
7
a wind turbine's cost. Due to the decrease in global foundry capacity since World War II, only a relatively few suppliers are capable of the precision production required for the large size and thinness of nacelle components. Some European wind turbine manufacturers have tried to identify cast product suppliers in India and China; however, it has been difficult finding the necessary standards and quality. We do not manufacture nacelles but we do service and repair nacelle components.
Blade System
The blade and hub system (rotor) is attached to the nacelle via the rotor shaft and rotates at an angular speed dependent on the power of the wind. Blades account for approximately 20-25% of the cost of a wind turbine and are typically made out of fiberglass and epoxy resin. Blades are currently the focus of significant research and development both at national research institutions and also at wind turbine manufacturers. With lengths upwards of 60 meters, blades can be difficult and expensive to manufacture and transport. The risk of damage in transit requires careful logistics planning and creates a demand for blade production sites near the end-market. We do not manufacture blade systems but we do service and repair blade systems.
Gearbox
The gearbox is made almost entirely of steel and is the heaviest component in the wind turbine's nacelle. The gearbox accounts for approximately 11-15% of a wind turbine's cost. The gearbox connects the low-speed shaft driven by the rotor blade to the high-speed shaft that drives the generator, increasing the rotational speeds from about 30 to 60 rotations per minute ("rpm") to about 1,200 to 1,500 rpm, which is the rotational speed required by most generators to produce electricity. Contained in the gearbox is a highly precise gearing system. We manufacture gearing systems in our Cicero, Illinois and Neville Island, Pennsylvania facilities.
Pitch Systems and Bearings
Pitch systems maximize a wind turbine's energy converting efficiency by optimizing the positioning of the machine housing and blades in relation to the wind direction. Pitch systems and bearings account for approximately 11-15% of a wind turbine's cost. We do not manufacture pitch systems or bearings.
COMPANY HISTORY
We are a Delaware corporation. We were incorporated in Nevada in 1996 as Blackfoot Enterprises Inc. ("Blackfoot"). In February 2006, Blackfoot completed a reverse shell transaction with Tower Tech, whereupon Blackfoot became a holding company for Tower Tech, and subsequently changed its name to Tower Tech Holdings Inc. In 2008, Tower Tech Holdings Inc. reincorporated in Delaware and changed its name from Tower Tech Holdings Inc. to Broadwind Energy, Inc. Through our October 2007 acquisitions of RBA and Brad Foote and acquisitions of EMS and Badger in January and June of 2008, respectively, we expanded upon our core platform as a wind tower component manufacturer and established our gearing systems, industrial products, technical services, precision repair and engineering and logistics businesses.
SALES AND MARKETING
Our sales and marketing strategy is to develop and maintain long-term relationships with our customers and to offer a comprehensive suite of products and services to them. We pursue this strategy by working closely with our customers in developing and designing customized product, manufacturing, and service solutions. We also intend for our offerings to fulfill needs that our customers may consider non-core and do not desire to provide for within their organizations. We attempt to base-load our manufacturing facilities by negotiating long-term agreements, under which we supply our customers
8
with gearing, towers or industrial products. Similarly, we seek to establish long-term relationships to provide logistics or technical and engineering services to our customers, which may be subject to framework agreements or undertaken on a project by project basis. Our customer base consists of wind turbine manufacturers who supply end-users and wind turbine developers with completed wind turbines, as well as wind farm developers and wind farm operators themselves. Within the wind industry, we have long-standing relationships with customers, engaging them at various levels from key account management, site management, research and development, product design and manufacturing up to senior management.
COMPETITION
We do not believe that any competitors exist that have developed a similar suite of products and services for the North American wind industry as those offered by our businesses. However, competition within each of our subsidiaries' niches exists and some of our customers maintain internal capabilities that compete with our offerings. Several domestic and international wind tower manufacturers compete in the United States, including Ameron International Corporation, DMI Industries, Dong Kuk, Hendricks, Trinity Industries, Inc. and Win&P. We are a major North American supplier of wind energy gear sets. Approximately five companies worldwide have the proven ability and capacity to compete with us to supply gear sets for the wind industry. Two of the major European suppliers are owned or affiliated with wind turbine manufacturers: Hansen Transmissions (affiliated with Suzlon energy) and Winergy/Flender (owned by Siemens). The competitor group participating to provide industrial gearing is slightly more fragmented. These companies compete based upon price, quality, location, available capacity, and several other factors. Anderson Trucking Service and Lonestar Trucking are our main logistics competitors, while additional competition within the market for technical and engineering services market is highly fragmented.
ENVIRONMENTAL REGULATION AND COMPLIANCE
Our operations are subject to numerous federal, state, and local environmental laws and regulations. While it is our objective to maintain compliance with these respective laws and regulations, it may not be possible to quantify with certainty the potential impact of actions regarding environmental matters, particularly remediation and other compliance efforts that we may undertake in the future. Many of our facilities have a history of industrial operations and contaminants have been detected at some of our facilities. We do not currently anticipate any material capital expenditures for environmental control facilities in the near term.
BACKLOG
The majority of our products are sold under long-term supply agreements and our services are typically sold under purchase orders and service contracts. Some of these supply agreements are structured as framework agreements, whereby we are required to reserve a specified percentage of our production capacity based upon mutually agreed production volumes. Under these framework agreements, we receive purchase orders on a monthly basis or based upon our customer's forecast of production volume levels. These long-term agreements have various terms, but generally range from several months to three years with some contracts carrying automatic renewal provisions. As of December 31, 2009, the dollar amount of our backlog believed to be firm under our supply agreements, purchase orders and service contracts was approximately $247.3 million, of which $119.3 million is expected to be delivered during 2010. Deliveries during 2010 may be subject to change as a result of any future modifications to our existing customer framework agreements or purchase orders.
9
SEASONALITY
The majority of our business is not affected by seasonality, although the provision of logistical and technical services can be negatively affected by weather-related constraints.
EMPLOYEES
We had 690 employees at December 31, 2009, of which 552 were in manufacturing, service, and field support related functions and 138 were in administrative functions. Approximately 21% of our employees are covered by two collective bargaining agreements with local unions in Cicero, Illinois and Neville Island, Pennsylvania. Collective bargaining agreements with our Neville Island and Cicero unions were ratified by local unions in the fourth quarter of 2009 and the first quarter of 2010, respectively, and are scheduled to remain in effect through October 2012 and February 2014, respectively. We consider our union and employee relations to be satisfactory.
RAW MATERIALS
The primary raw material used in the construction of wind towers and gearing products is steel in the form of steel plate, forgings, and castings. Additionally, some agreements may allow customers to independently provide steel for the construction of wind towers.
We operate a multiple sourcing strategy and source our raw materials through various suppliers located throughout the United States and abroad. We do not generally have long-term supply agreements with any of our raw materials suppliers and closely match terms with those of our customers to limit our exposure to price fluctuations. We believe that we will be able to obtain an adequate supply of steel and other raw materials to meet our manufacturing requirements.
QUALITY CONTROL
We have a long-standing focus on processes for ensuring the manufacture of high quality products. To achieve high standards of production and operational quality, we implement strict and extensive quality control and inspection throughout our production processes. We maintain internal quality controls over all core manufacturing processes and carry out quality assurance inspections at the completion of each major manufacturing step to ensure the quality of our products. The manufacturing process at our Gearing operation, for example, involves transforming forged steel into highly technical specification gears through rough machining, hobbing, reinforcing thermal treatment, fine machining and fine grinding. We inspect and test raw materials before they enter the assembly process, re-test the raw materials after rough machining, test the functioning of gear teeth and cores after thermal treatment and accuracy test final outputs for product specifications. We believe our investment in industry-leading heat treatment, high precision machining, specialized grinding technologies, and cutting edge welding has contributed to our high product reliability and consistent performance of our products under varying operating conditions once installed.
Our Gearing segment is ISO 9001:2000 certified and our other companies have certification programs in various stages of completion.
CUSTOMERS
We manufacture products for and provide logistics, technical and engineering services to a variety of customers in the wind energy, oil and gas, mining and other industries. The majority of our customer base consists of wind turbine manufacturers, who supply wind farm operators and wind farm developers with completed wind turbines. In the other industrial sectors, we sell our products through our trained sales force or through manufacturers' representatives to a wide variety of customers. The wind turbine market is very concentrated. According to AWEA's 2009 industry data, the top eight wind turbine
10
manufacturers constituted over 97% of the North American market. As a result, our concentration with a limited number of customers accounted for the majority of our revenues. Sales to each of Gamesa, Clipper Windpower, Nordex and General Electric represented an amount greater than 10% of our consolidated revenues for the year ended December 31, 2009 and the loss of one of these customers could have a material adverse effect on our business. Despite these significant customers, our customer concentration declined in 2009. In 2008, four customers accounted for greater than 75% of our total revenues compared to six customers in 2009. We intend to continue to diversify our customer base as we grow our business.
Our current portfolio of key customers includes: Clipper Windpower, Gamesa, General Electric, Nordex, Siemens Energy, Suzlon Wind Energy, Vestas and Bluarc.
WORKING CAPITAL
Our primary customers are wind turbine manufacturers and wind farm developers. The industry has historically entered into customized contracts with varying terms and conditions between suppliers and customers, depending on the specific objectives of each party. Our practices mirror this historical industry practice for negotiating agreements on a case-by-case basis. As a result, working capital needs, including levels of accounts receivable and inventory, can vary significantly from quarter to quarter based on the contractual terms associated with that quarter's sales, such as whether we are required to purchase and supply steel pursuant to such contractual terms.
CORPORATE INFORMATION
Our principal executive office is located at 47 East Chicago Avenue, Suite 332, Naperville, IL 60540. Our phone number is (630) 637-0315 and our website address is www.broadwindenergy.com.
OTHER INFORMATION
On our website at www.broadwindenergy.com, we make available under the "Investors" menu selection, free of charge, our Annual Reports on Form 10-K and Form 10-KSB, Quarterly Reports on Form 10-Q and Form 10-QSB, Current Reports on Form 8-K, and amendments to these reports filed or furnished pursuant to Section 13(a) or 15(d) of the Exchange Act as soon as reasonably practicable after such reports or amendments are electronically filed with, or furnished to, the Securities and Exchange Commission ("SEC"). Materials that we file or furnish to the SEC may also be read and copied at the SEC's Public Reference Room at 100 F Street, N.E., Washington, DC 20549. Information on the operation of the Public Reference Room may be obtained by calling the SEC at 1-800-SEC-0330. Also, the SEC maintains an Internet site at www.sec.gov that contains reports, proxy and information statements, and other information that we file electronically with SEC.
Risks Related to Our Business
Our businesses, and therefore our results of operations and financial condition, may continue to be adversely affected by dislocation in the global credit markets and economic uncertainty.
The disruption in the global credit markets, the re-pricing of credit risk and the deterioration of the financial and real estate markets generally, particularly in the United States and Europe, have all contributed to a reduction in consumer spending and a contraction in global economic growth including the wind energy sector. The recession has had negative effects on demand for alternative sources of energy and consequently for our product and service offerings. Although there is a growing confidence that the global economies have resumed growth, there remains risk that the recovery will be short-lived, such recovery may not include the industries or markets in which we conduct our business or the
11
downturn may resume. In addition, because there is a long lead-time between orders for wind products and delivery, there is generally a lag before the impact of changed economic conditions affects our results, and an improvement in economic conditions may not be reflected in our financial results of operations in a corresponding manner. Any deterioration in economic conditions could have a material adverse effect on our business in a number of ways, including lower sales and extended renewal cycles if there is a reduction in demand for wind energy and such deterioration could have a material adverse effect on our liquidity, results of operations and financial condition.
In particular, risks we might face could include: potential declines in revenues in our business segments due to reduced orders or other factors caused by economic challenges faced by our customers and prospective customers, and an inability to finance our operating needs on reasonable terms.
The U.S. wind industry is reliant on tax and other economic incentives and political and governmental policies. A significant change in these incentives and policies could negatively impact our results of operations and growth.
Our business segments are focused on supplying products and services to wind turbine manufacturers and owners and operators of wind energy generation facilities. The wind industry is dependent upon federal tax incentives and state renewable portfolio standards and may not be economically viable absent such incentives. The federal government provides economic incentives to the owners of wind energy facilities, including a federal production tax credit, an investment tax credit and a cash grant equal in value to the investment tax credit. The production tax credit was extended by the American Recovery and Reinvestment Act ("ARRA") in February 2009 and provides the owner of a qualifying wind energy facility placed in service before the end of 2012 with a ten-year tax credit against the owner's federal income tax obligations based on the amount of electricity generated by the qualifying wind energy facility and sold to unrelated third parties. Alternatively, wind project owners may (i) elect to receive an investment tax credit equal to 30% of the qualifying basis of facilities placed in service before the end of 2012 or (ii) for facilities placed in service in 2009 or 2010 (or, if construction begins before the end of 2010, placed in service before the end of 2012), apply to receive a cash grant from the Department of Treasury, equal in value to the investment tax credit.
These programs provide material incentives to develop wind energy generation facilities and thereby impact the demand for our manufactured products and services. The increased demand for our products and services resulting from the credits and incentives may continue until such credits or incentives lapse. The failure of Congress to extend or renew these incentives beyond their current expiration dates could significantly delay the development of wind energy generation facilities and the demand for wind turbines, towers, gearing and related components. In addition, we cannot assure you that any subsequent extension or renewal of the production tax credit, investment tax credit or cash grant program will be enacted prior to its expiration or, if allowed to expire, that any extension or renewal enacted thereafter would be enacted with retroactive effect. It is possible that these federal incentives will not be extended beyond their current expiration dates. Any delay or failure to extend or renew the federal production tax credit, investment tax credit or cash grant program in the future could have a material adverse impact on our business, results of operations, financial performance and future development efforts.
State renewable energy portfolio standards generally require or encourage state-regulated electric utilities to supply a certain proportion of electricity from renewable energy sources or devote a certain portion of their plant capacity to renewable energy generation. Typically, utilities comply with such standards by qualifying for renewable energy credits evidencing the share of electricity that was produced from renewable sources. Under many state standards, these renewable energy credits can be unbundled from their associated energy and traded in a market system allowing generators with insufficient credits to meet their applicable state mandate. These standards have spurred significant growth in the wind energy industry and a corresponding increase in the demand for our manufactured
12
products. Currently, the majority of states and the District of Colombia have renewable energy portfolio standards in place and certain states have voluntary utility commitments to supply a specific percentage of their electricity from renewable sources. The enactment of renewable energy portfolio standards in additional states or any changes to existing renewable energy portfolio standards, or the enactment of a federal renewable energy portfolio standard or imposition of other greenhouse gas regulations may impact the demand for our products. We cannot assure you that government support for renewable energy will continue. The elimination of, or reduction in, state or federal government policies that support renewable energy could have a material adverse impact on our business, results of operations, financial performance and future development efforts.
We could incur substantial costs to comply with environmental, health and safety laws and regulations and to address violations of or liabilities under these requirements.
Our operations are subject to a variety of environmental laws and regulations in the jurisdictions in which we operate and sell products governing, among other things, air emissions, wastewater discharges, the use, handling and disposal of hazardous materials, soil and groundwater contamination, employee health and safety, and product content, performance and packaging. We cannot guarantee that we will at all times be in compliance with such laws and regulations and if we fail to comply with these laws and regulations or our permitting and other requirements, we may be required to pay fines, limit production at our facilities or be subject to other sanctions. Also, certain environmental laws can impose the entire or a portion of the cost of investigating and cleaning up a contaminated site, regardless of fault, upon any one or more of a number of parties, including the current or previous owner or operator of the site. These environmental laws also impose liability on any person who arranges for the disposal or treatment of hazardous substances at a contaminated site. Third parties may also make claims against owners or operators of sites and users of disposal sites for personal injuries and property damage associated with releases of hazardous substances from those sites. Many of our facilities have a history of industrial operations and contaminants have been detected at some of our facilities.
Changes in existing environmental laws and regulations, or their application, could cause us to incur additional or unexpected costs to achieve or maintain compliance. Our facilities emit greenhouse gases which may be subject to pending or future environmental laws or regulations, which could cause us to incur additional or unexpected costs to achieve and maintain compliance. The assertion of claims relating to on- or off-site contamination, the discovery of previously unknown environmental liabilities, or the imposition of unanticipated investigation or cleanup obligations, could result in potentially significant expenditures to address contamination or resolve claims or liabilities. Such costs and expenditures could have a material adverse effect on our business, financial condition or results of operations.
Our financial and operating performance is subject to certain factors which are out of our control, including prevailing economic conditions and the state of the wind energy market in North America.
As a supplier of products and services to wind turbine manufacturers and owners and operators of wind energy generation facilities, our results of operations (like those of our customers) are subject to general economic conditions and specifically, to the state of the wind energy market. In addition to the state and federal government policies supporting renewable energy described above, the growth and development of the larger wind energy market in North America is subject to a number of factors, including, among other things:
- •
- available financing for the estimated pipeline of wind development projects;
13
- •
- the cost of electricity, which may be affected by a number of factors, including the cost and availability of fuel,
government regulation, power transmission, seasonality and fluctuations in demand;
- •
- the development of new power generating technology or advances of existing technology or discovery of power generating
natural resources;
- •
- the development of electrical transmission infrastructure;
- •
- state and federal laws and regulations;
- •
- administrative and legal challenges to proposed wind development projects; and
- •
- public perception and localized community responses to wind energy projects.
In addition, while some of the factors listed above may only affect individual wind project developments or portions of the market, in the aggregate they may have a significant effect on the successful development of the wind energy market, and thus affect our operating and financial results.
We are substantially dependent on a few significant customers.
The wind turbine market in the United States is very concentrated, with eight manufacturers controlling in excess of 97% of the market. Like us, these customers were adversely affected by the downturn in the economy and we have seen, and may continue to see, a decrease in order volume from such customers. During 2009, we were affected by the global economic downturn, particularly with respect to the economic impact that it had on our customers. Historically, the majority of our revenues are highly concentrated with a limited number of customers. In 2009, four customers—Gamesa, Nordex, General Electric and Clipper Windpower—each accounted for more than 10% of our consolidated revenues and our six largest customers accounted for 75% of our consolidated revenues. During 2009, several of our customers expressed their intent to scale back, delay or restructure existing customer agreements, which led to reduced revenues from these customers. As a result, our operating profits and gross margins were negatively affected by a decline in production levels during 2009, which created production volume inefficiencies in our operations and cost structures.
Additionally, if our relationships with significant customers should change materially, it could be difficult for us to immediately and profitably replace lost sales in a market with such concentration, which would materially adversely affect our results. We could be adversely impacted by decreased customer demand for our products and services due to (1) the impact of current or future economic conditions on our customers, (2) our customers' loss of market share to competitors of theirs that do not use our products, and (3) our loss of market share with our customers. We could lose market share with our customers to competitors or to our customers themselves, should they decide to become more vertically integrated and produce our products and services internally. Finally, most of our customers do not purchase all of our products and services, so if some of our customers gain market share, it could impact our mix of services and products among our segments.
In addition, even if our customers continue to do business with us, we can be adversely affected by a number of other potential developments with our customers. For example:
- •
- our customers may not comply with their contractual payment or volume obligations. The inability or failure of our
customers to meet their contractual obligations could have a material adverse effect on our business, financial position and results of operations;
- •
- our customers have, and in the future may seek to renegotiate the terms of current agreements or renewals. For example, some customers have sought payments from us for claims despite contractual limits that preclude our obligation to make payments for such claims;
14
- •
- although our subsidiary companies operate independently, a dispute between a significant customer and us or one of our
subsidiaries could have a negative effect on the business relationship we have with that customer across our entire organization. Among other things, such a dispute could lead to an overall decrease
in such customer's demand for our products and services or difficulty in collecting amounts due to one or more of our subsidiaries that are otherwise not related to such a dispute; and
- •
- a material change in payment terms for accounts receivable of a significant customer could have a material adverse effect on our short-term cash flows.
Our customers may be significantly affected by disruptions and volatility in the markets.
Current market disruptions and regular market volatility may have adverse impacts on our customers' ability to pay when due the amounts payable to us and could cause related increases in our working capital or borrowing needs. In addition, our customers have in the past and may attempt in the future to renegotiate the terms of contracts or reduce the size of orders with us as a result of disruptions and volatility in the markets. Our backlog is substantial, but we cannot predict with any degree of certainty the amount of our backlog that we will be successful in collecting from our customers.
Market disruptions and regular market volatility may also result in an increased likelihood of our customers bringing warranty or remediation claims in connection with our products or services that they would not ordinarily bring in a more stable economic environment. In the event of such a claim, we may incur costs if we decide to compensate the affected customer or to engage in litigation against the affected customer regarding the claim. We maintain product liability insurance, but there can be no guarantee that such insurance will be available or adequate to protect against such claims. A successful claim against us could result in a material adverse effect on our business.
We may have difficulty raising additional financing when needed or on acceptable terms and there can be no assurances that our operations will generate sufficient cash flows in an amount sufficient to enable us to pay our indebtedness.
We rely on access to both short- and long-term capital markets as a source of liquidity for capital requirements not satisfied by cash flows from operations. While we anticipate that our current cash resources, cash generated through our operations, and cash proceeds from our January 2010 common stock offering will be adequate to meet our liquidity needs for at least the next twelve months, we do not have any significant committed sources of liquidity. If we are not able to access capital at competitive rates, the ability to implement our business plans may be adversely affected. In the absence of access to capital resources, we could face substantial liquidity problems and might be required to dispose of material assets or operations at times when the prices for such assets are depressed. We may not be able to consummate those dispositions. Furthermore, these proceeds may not be adequate to meet our debt service obligations then due.
Additionally, our ability to make scheduled payments on our existing or future debt obligations and fund operations will depend on our future financial and operating performance. While we have repaid approximately $19.1 million in outstanding indebtedness to Bank of America and Investors Community Bank in January 2010, and we believe we will continue to have sufficient cash flows to operate our businesses, there can be no assurances that our operations will generate sufficient cash flows to enable us to pay our remaining indebtedness or to fund our other liquidity needs. If we cannot make scheduled payments on our debt, we will be in default and, as a result, among other things, our debt holders could declare all outstanding principal and interest to be due and payable and we could be forced into bankruptcy or liquidation or required to substantially restructure or alter our business operations or debt obligations. Moreover, if we are unable to obtain additional capital or if our current
15
sources of financing are reduced or unavailable, we will likely be required to delay, reduce the scope of, or eliminate our plans for expansion and growth and this could affect our overall operations.
Growth and diversification through acquisitions and internal expansion may not be successful, and could result in poor financial performance.
To execute our business strategy, we may seek to acquire new businesses. We may not be able to identify appropriate acquisition candidates or successfully negotiate, finance or integrate acquisitions. If we are unable to make acquisitions, we may be unable to realize the growth we anticipate. Future acquisitions could involve numerous risks including difficulties in integrating the operations, services, products and personnel of the acquired business, and the potential loss of key employees, customers and suppliers of the acquired business. If we are unable to successfully manage these acquisition risks, future earnings may be adversely affected.
We may also grow our existing business through increased production levels at existing facilities and through expansion to new manufacturing facilities and locations, such as the tower manufacturing facility in Abilene, Texas that we completed in January 2009 and our constructed but not yet operational tower manufacturing facility in Brandon, South Dakota. In addition, we intend to utilize funds raised in our recently completed equity offering to establish a MW gearbox test stand and refurbishment facility during 2010. Such expansion and any future expansion will require coordinated efforts across the Company and continued enhancements to our current operating infrastructure, including management and operations personnel, systems and equipment, and property. Difficulties or delays in acquiring and effectively integrating any new facilities may adversely affect future performance. For example, we recorded higher costs in 2008 to handle a higher volume of orders, and in 2009 in connection with the startup of production at our Abilene facility. Moreover, if our expansion efforts do not adequately predict the demand of our customers and our potential customers, our future earnings may be adversely affected.
We face competition from industry participants who may have greater resources than we do.
Our businesses are subject to risks associated with competition from new or existing industry participants who may have more resources and better access to capital. Many of our competitors and potential competitors may have substantially greater financial, customer support, technical and marketing resources, larger customer bases, longer operating histories, greater name recognition and more established relationships in the industry than we do. Among other things, these industry participants compete with us based upon price, quality, location and available capacity. We cannot be sure that we will have the resources or expertise to compete successfully in the future. Some of our competitors may also be able to provide customers with additional benefits at lower overall costs to increase market share. We cannot be sure that we will be able to match cost reductions by our competitors or that we will be able to succeed in the face of current or future competition. In addition, we may face competition from our customers as they seek to be more vertically integrated and offer full service packages. Some of our customers are also performing more services themselves.
We have generated net losses and negative cash flows since our inception.
We have experienced operating losses, as well as net losses, for each of the years during which we have operated. In addition, in light of current economic conditions, we anticipate that losses and negative cash flow are possible for the foreseeable future. We have incurred significant costs in connection with the development of our businesses and there is no assurance that we will achieve sufficient revenues to offset anticipated operating costs. Although we anticipate deriving revenues from the sale of our products and services, no assurance can be given that these products can be sold on a profitable basis. If we achieve profitability, we cannot give any assurance that we would be able to sustain or increase profitability on a quarterly or annual basis in the future.
16
We may not be able to effectively utilize the additional production capacity at our new wind tower manufacturing facility in Brandon, South Dakota.
We recently completed construction of a third wind tower manufacturing facility in Brandon, South Dakota and we anticipate that the facility will become operational as business warrants and pending the installation of certain additional equipment. If there is insufficient market demand for the towers we intend to produce at this facility, it could be difficult or impossible for us to operate the facility in a profitable or cost-effective manner. If we elected not to commence operations at the facility, we would continue to incur significant fixed costs associated with ownership of the facility, and there can be no assurance that we would be able to sell or otherwise dispose of the facility on terms deemed to be commercially reasonable by us if we sought to do so in the future.
Our future operating results and the market price of our common stock could be materially adversely affected if we are required to take additional write downs to the carrying value of goodwill or intangible assets associated with any of our operating segments in the future.
We review our goodwill balances for impairment on at least an annual basis through the application of a fair-value-based test. We perform our review of goodwill based on the carrying value of these assets as of October 31 of each year and the estimate of fair-value for each of our operating segments is based primarily on projected future results, cash flows and other assumptions. The first step involves a comparison of the estimated fair value of a reporting unit to its carrying amount, including goodwill. In performing the first step, we determine the fair value of our reporting units using a combination of an income approach by preparing a discounted cash flow analysis and a market-based approach based on our market capitalization. If the estimated fair value of the reporting unit exceeds its carrying amount, goodwill of the reporting unit is not impaired and the second step of the impairment test is not necessary. If the carrying amount of a reporting unit exceeds its estimated fair value, then the second step of the goodwill impairment test must be performed. The second step of the goodwill impairment test compares the implied fair value of the reporting unit's goodwill with its carrying amount to measure the amount of impairment loss, if any. The implied fair value of goodwill is determined in the same manner as the amount of goodwill recognized in a business combination. As a result, the estimated fair value of the reporting unit is allocated to all of the assets and liabilities of that unit (including any unrecognized intangible assets) as if the reporting unit had been acquired in a business combination and the fair value of the reporting unit was the purchase price paid. If the carrying amount of the reporting unit's goodwill exceeds the implied fair value of that goodwill, an impairment loss is recognized in an amount equal to that excess.
We did not identify a triggering event during 2009 which would require an early assessment of impairment, however, in connection with our annual goodwill impairment analysis as of October 31, 2009 which was completed in March 2010, we determined that the goodwill balance attributable to our Gearing segment was impaired due to a deterioration in financial performance during 2009 and as a result of the subsequent fourth quarter revision in our projection of future operating results and cash flows in light of the continued economic downturn on the wind gearing industry.
We review our intangible assets and other long-lived assets for impairment whenever events or changes in circumstances indicate that the asset's carrying amount may not be recoverable. Due to the revision in our projections of operating results and cash flows within our Gearing segment, we deemed this a triggering event, and subsequently tested all of our intangible assets for impairment. The completion of our impairment analysis during February 2010 indicated that the customer relationship intangibles associated with our Gearing segment were impaired as a result of a decline in projected future operating results. The decline in our estimates of future operating results and corresponding discounted cash flows indicated that the fair value of these customer relationships was less than the carrying value of these assets. Additionally, we determined that the carrying value of our RBA trade name was impaired as a result of the merger of RBA's operations into our Towers segment in
17
December 2009 and that RBA's customer relationship intangible was impaired due to a revision in projected revenues and cash flows associated with this customer relationship. Accordingly, we recorded goodwill and intangible impairment charges of $24.3 million and $57.9 million, respectively. In the future, if our projected discounted cash flows associated with our operating segments do not exceed the carrying value of their net assets, we may be required to record additional write downs of the carrying value of goodwill, intangible assets or other long-lived assets associated with any of our operating segments and our operating results and the market price of our common stock may be materially adversely affected.
As of December 31, 2009, our goodwill and intangible balances were $9.7 million and $37.2 million, respectively. The 2008-2009 recession has impacted our financial results and has reduced near-term purchases from certain of our key customers and may continue to do so in the future. We may determine that our expectations of future financial results and cash flows from one or more of our businesses has decreased or a decrease in our stock valuation may occur, which could result in a review of our goodwill and intangible assets associated with these businesses. Since a large portion of the value of our intangibles has been ascribed to projected revenues from certain key customers, a change in our expectation of future cash from one or more of these customers could indicate potential impairment to the carrying value of our assets.
Disruptions in the supply of parts and raw materials, or changes in supplier relations, may negatively impact our operating results.
We are dependent upon the supply of certain raw materials used in our production process and these raw materials are exposed to price fluctuations on the open market. Raw material costs for items such as steel, the primary raw material used by us, has fluctuated significantly and may continue to fluctuate. To reduce price risk caused by market fluctuations, we have generally incorporated price adjustment clauses in our sales contracts. However, limitations on availability of raw materials or increases in the cost of raw materials (including steel), energy, transportation and other necessary services may impact our operating results if our manufacturing businesses are not able to fully pass on the costs associated with such increases to their respective customers. Alternatively, we will not realize material improvements from declines in steel prices as the terms of many of our contracts provide that we pass through these costs to our customers.
In addition, we may encounter supplier constraints, be unable to maintain favorable supplier arrangements and relations or be affected by disruptions in the supply chain caused by such events as natural disasters, power outages and the effect of labor strikes. In the event of significant increases or decreases in the price of raw materials, particularly steel, our margins and profitability could be negatively impacted.
If our projections regarding the future market demand for our products are inaccurate, our operating results and our overall business may be adversely affected.
We have made significant capital investments in anticipation of rapid growth in the U.S. wind energy market. The expansion of our internal manufacturing capabilities has required significant up-front fixed costs. If market demand for our products does not increase as quickly as we have anticipated and align with our expanded manufacturing capacity, we may be unable to offset these costs and to achieve economies of scale, and our operating results may continue to be adversely affected as a result of high operating expenses, reduced margins and underutilization of capacity. Alternatively, if we experience rapid demand for our products in excess of our estimates, our installed capital equipment and existing workforce may be insufficient to support higher production volumes, which could harm our customer relationships and overall reputation. In addition, we may not be able to expand our workforce and operations in a timely manner, procure adequate resources, or locate suitable third-party suppliers, to respond effectively to changes in demand for our existing products or to the demand for new
18
products requested by our customers, and our business could be adversely affected. Our ability to meet such excess customer demand could also depend on our ability to raise additional capital and effectively scale our manufacturing operations.
If our estimates for warranty expenses differ materially from actual claims made, or if we are unable to reasonably estimate future warranty expense for our products and services, our business and financial results could be negatively affected.
We provide warranty terms generally ranging between two and seven years to our tower and gearing customers depending upon the specific product and terms of the customer purchase agreement. We reserve for warranty claims based on industry experience and estimates made by management based upon a percentage of our product sales revenues. From time to time, customers have submitted warranty claims against us. However, we have a limited history on which to base our warranty estimates for certain products which we manufacture. Our assumptions could be materially different from the actual performance of our products in the future and could exceed the levels against which we have reserved. In some instances our customers have interpreted the scope and coverage of certain of our warranty provisions differently from our interpretation of such provisions. The expenses associated with remediation activities in the wind energy industry can be substantial and if we are required to pay such costs in connection with a customer's warranty claim we could be subject to additional unplanned cash expenditures. If our estimates prove materially incorrect, or if we are required to cover remediation expenses in addition to our regular warranty coverage, we could be required to accrue additional expenses and could face a material unplanned cash expenditure, which could harm our financial and operating results.
Material weaknesses or other deficiencies in our internal controls over financial reporting, including potential failure to prevent or detect errors or fraud, could affect the accuracy of our reported financial results.
Management identified a material weakness in internal controls over financial reporting in 2009, relating to non-routine revenue transactions, as referenced in Item 9A, "Controls and Procedures" of this Annual Report on Form 10-K. Internal control weaknesses or deficiencies may continue to affect our ability to close our financial reporting on a timely basis or report accurate numbers. In addition, acquisitions of companies lacking sufficient financial and internal control expertise may affect our ability to comply with public company reporting requirements in the future, including meeting filing deadlines established by the SEC, and ensuring that our Company-wide controls and procedures are adequate to provide financial information in a timely and reliable matter. We may incur substantial additional costs to bring acquired companies' systems into compliance with Section 404 of the Sarbanes-Oxley Act of 2002, as amended ("Sarbanes-Oxley"). Our ability to attract and retain qualified financial experts will also impact our ability to comply with financial reporting and Sarbanes-Oxley regulations. If we are not able to maintain the requirements of Section 404 of Sarbanes-Oxley in a timely manner or with adequate compliance, we may be subject to sanctions or investigation by regulatory authorities. This type of action could adversely affect our financial results or investors' confidence in our company and our ability to access capital markets and could cause our stock price to decline.
Trade restrictions may present barriers to entry in certain international markets.
Restrictions on trade with certain international markets could affect our ability to expand into those markets. In addition, the existence of government subsidies available to our competitors in certain countries may affect our ability to compete on a price basis.
19
We may be unable to keep pace with rapidly changing technology in wind turbine component manufacturing.
The global market for wind turbines is rapidly evolving technologically. Our component manufacturing equipment and technology may not be suited for future generations of products being developed by wind turbine companies. To maintain a successful business in our field, we must keep pace with technological developments and changing standards of our customers and potential customers and meet their constantly evolving demands. If we fail to adequately respond to the technological changes in our industry, or are not suited to provide components for new types of wind turbines, our net worth, financial condition and operating results may be adversely affected.
We rely on unionized labor, the loss of which could adversely affect our future success.
We are dependent on the services of unionized labor and have collective bargaining agreements with certain of our operations workforce at our Cicero and Neville Island gearing facilities. The loss of the services of these and other personnel, whether through terminations, attrition, labor strike, or otherwise, or a material change in our collective bargaining agreements, could have a material adverse impact on us and our future profitability. Collective bargaining agreements have been ratified by collective bargaining units in place at our Cicero and Neville Island facilities and expire in October 2012 and February 2014, respectively. As of December 31, 2009, our collective bargaining units represented approximately 21% of our workforce.
We need to hire additional qualified personnel, including management personnel, and the loss of our key personnel could harm our business.
Our future success will depend largely on the skills, efforts and motivation of our executive officers and other key personnel. Our success also depends, in large part, upon our ability to attract and retain highly qualified management and key personnel throughout our organization. During 2010, we will likely need to hire additional personnel, including management personnel, to fill in our organization. We face competition in the attraction and retention of personnel who possess the skill sets that we seek. In addition, key personnel may leave our company and subsequently compete against us. The loss of the services of any of our key personnel, or our failure to attract and retain other qualified and experienced personnel on acceptable terms, could have a material adverse effect on our business, results of operations, or financial condition.
Our ability to comply with regulatory requirements is critical to our future success and our current level of controls cannot guarantee that we are in compliance with all such requirements.
As a manufacturer and distributor of wind and other energy industry products we may be or become subject to the requirements of federal, state and local or foreign regulatory authorities. In addition, we are subject to a number of industry standard-setting authorities, such as the American Gear Manufacturers Association and the American Welding Society. Changes in the standards and requirements imposed by such authorities could have a material adverse effect on us. In the event we are unable to meet any such standards when adopted, our business could be adversely affected. We may not be able to obtain all regulatory approvals, licenses and permits that may be required in the future, or any necessary modifications to existing regulatory approvals, licenses and permits, or maintain all required regulatory approvals, licenses and permits.
There can be no guarantee that our businesses are in full compliance with such standards and requirements. We continue to develop our internal controls with a goal of providing a greater degree of certainty that our businesses are in compliance with applicable governmental and regulatory requirements, but our current level of internal control may fail to reveal to us material instances of non-compliance with such requirements, and such non-compliance could have a material adverse effect on our business.
20
Our principal stockholder holds a large percentage of our common stock and influences our affairs significantly.
Tontine Capital Partners, L.P. ("TCP"), Tontine Capital Overseas Master Fund, L.P. ("TMF"), Tontine Partners, L.P. ("TP"), Tontine Overseas Fund, Ltd. ("TOF"), Tontine 25 Overseas Master Fund, L.P. ("T25"), TCP Overseas Master Fund II, L.P. ("TCP2" and collectively with TP, TOF, TCP, TMF, T25 and their affiliates, "Tontine") owned approximately 47.7% of our outstanding common stock as of December 31, 2009 and owns approximately 37.5% of our common stock after completion of our equity offering in January 2010. Tontine has, and will continue to have the right to designate three individuals on our Board of Directors pursuant to a Securities Purchase Agreement entered into with Broadwind in August 2007. As a result, Tontine has, and will continue to have, the voting power to significantly influence our policies, business and affairs, and the outcome of any corporate transaction or other matter, including mergers, consolidations and the sale of all, or substantially all, of our assets. Tontine's significant ownership level may have the effect of delaying, deterring, or preventing a change in control that otherwise could result in a premium in the price of our common stock. Tontine and its affiliates may invest in entities that directly or indirectly compete with us or companies in which they currently invest may begin competing with us. As a result of these relationships, when conflicts between the interests of Tontine and the interests of our other stockholders arise, the Tontine-designated directors may have conflicts of interest. Although our directors and officers will have a duty of loyalty to us under Delaware law and our certificate of incorporation, transactions that we enter into in which a director or officer has a conflict of interest are generally permissible, if done in compliance with Delaware law. The actions of Tontine may have the effect of influencing changes in control or changes in management, or limiting the ability of our other stockholders to approve transactions that they may deem to be in their best interest.
We may not have the technical expertise and we may be unable to secure the necessary patents or other intellectual property rights needed to successfully market new products that we may develop.
A key element of our business and operating strategy is to exploit our technological ability to design new manufacturing processes and products to take advantage of the anticipated growth in the North American wind market. Historically, we have not developed patented technology or engaged in technical design work on a significant scale. If we are unable to develop new manufacturing processes and products that are attractive to our customers and potential customers, or if we are unable to secure the necessary patents or other intellectual property rights needed to prevent our competitors from developing and marketing substantially similar products, we could experience a material adverse effect on our business and results of operations.
We cannot insure against all potential risks and may have difficulty insuring our business activities or become subject to increased insurance premiums.
Our business is subject to a number of risks, including inherent risks associated with manufacturing, heavy-haul transport, and service and construction support for wind turbines. To mitigate the risks associated with our business, we have obtained various insurance policies. However, our insurance policies have high deductibles in certain instances and do not cover losses as a result of certain events such as terrorist attacks. In addition, our insurance policies are subject to annual review by our insurers and these policies may not be renewed at all or on similar or favorable terms. If we were to incur a significant uninsured loss or a loss in excess of the limits of our insurance policies, the results could have a material adverse effect on our business, financial condition and results of operations.
ITEM 1B. UNRESOLVED STAFF COMMENTS
None.
21
Our corporate headquarters is located in Naperville, Illinois, which is a suburb located west of Chicago, Illinois. In addition, our subsidiaries own or lease operating facilities, which are presented by operating segment as follows:
Operating Segment and Facility Type |
Location | Owned / Leased |
Approximate Square Footage |
|||||
|---|---|---|---|---|---|---|---|---|
Towers |
||||||||
Tower Manufacturing |
Manitowoc, WI | Leased | 200,000 | |||||
Tower Manufacturing |
Abilene, TX | Owned | 146,000 | |||||
Tower Manufacturing |
Brandon, SD(1) | Owned | 146,000 | |||||
Specialized Welding |
Manitowoc, WI | Leased | 45,000 | |||||
Specialized Welding |
Clintonville, WI | Owned | 63,000 | |||||
Gearing |
||||||||
Gearing System Manufacturing—Finishing |
Cicero, IL | Owned | 198,000 | |||||
Gearing System Manufacturing—Machining |
Cicero, IL | Leased | 301,000 | |||||
Gearing System Manufacturing—Heat Treatment |
Neville Island, PA | Owned | 70,000 | |||||
Technical and Engineering Services |
||||||||
Service and Maintenance |
Gary, SD | Leased | 25,000 | |||||
Service and Maintenance |
Abilene, TX | Leased | 297,000 | |||||
Service and Maintenance |
Howard, SD | Owned | 25,000 | |||||
Service and Maintenance |
Tehachapi, CA | Leased | 5,000 | |||||
Logistics |
||||||||
Logistics Headquarters |
Clintonville, WI | Leased | 7,000 | |||||
Corporate |
||||||||
Administrative |
Naperville, IL | Leased | 6,800 | |||||
- (1)
- Construction of the tower manufacturing facility located in Brandon, South Dakota was completed in January 2010, and we anticipate that the facility will become operational as business warrants and pending the installation of certain additional equipment.
We consider that our facilities are in good condition and are adequate for our present and future needs.
From time to time, Broadwind and its subsidiaries are involved in litigation relating to claims arising out of our operations in the normal course of business. As of December 31, 2009, we are not aware of material pending legal proceedings or threatened litigation that would have a material adverse effect on our financial condition or results of operations, although no assurance can be given with respect to the ultimate outcome of pending actions.
22
ITEM 5. MARKET FOR REGISTRANT'S COMMON EQUITY, RELATED STOCKHOLDER MATTERS AND ISSUER PURCHASES OF EQUITY SECURITIES
Prior to April 9, 2009, our common stock was quoted on the OTC Bulletin Board ("OTCBB") under the symbol "BWEN.OB." Our common stock began trading on the NASDAQ Global Select Market ("NASDAQ") on April 9, 2009 under the symbol "BWEN."
The following table sets forth the range of high and low bid quotations as reported by the OTCBB for each quarter during 2008, the first quarter of 2009 and for the second quarter for the period of April 1 through April 8, 2009. Quotations on the OTCBB reflect inter-dealer prices, which do not include retail mark-up, mark-down or commissions, and may not represent actual sale prices. For the second quarter of 2009 since April 9, 2009 and for the third and fourth quarters of 2009, the table sets forth the high and low bid prices of our common stock traded on the NASDAQ Global Select Market.
| |
Common Stock | |||||||
|---|---|---|---|---|---|---|---|---|
| |
High | Low | ||||||
2009 |
||||||||
First quarter |
$ | 5.45 | $ | 2.60 | ||||
Second quarter |
11.45 | 4.05 | ||||||
Third quarter |
12.49 | 7.18 | ||||||
Fourth quarter |
9.92 | 5.01 | ||||||
| |
High | Low | ||||||
|---|---|---|---|---|---|---|---|---|
2008 |
||||||||
First quarter |
$ | 14.45 | $ | 8.45 | ||||
Second quarter |
29.00 | 8.40 | ||||||
Third quarter |
22.00 | 8.41 | ||||||
Fourth quarter |
14.40 | 4.25 | ||||||
The most recent closing price for our common stock as of March 9, 2010 was $5.44. As of March 9, 2010, there were 61 holders of record of our common stock.
We have never paid cash dividends on our common stock and have no current plan to do so in the foreseeable future. The declaration and payment of dividends on our common stock are subject to the discretion of our Board of Directors and are further limited by our credit agreements and other contractual agreements we may have in place from time to time. The decision of our Board of Directors to pay future dividends will depend on general business conditions, the effect of a dividend payment on our financial condition, and other factors the Board of Directors may consider relevant. The current policy of our Board of Directors is to reinvest earnings in our operations to promote future growth and to fund potential acquisitions.
Performance Graph
The following Performance Graph and related information shall not be deemed "soliciting material" or "filed" under the Securities Act of 1933 or the Securities Exchange Act of 1934, each as amended, nor shall such information be incorporated by reference by any general statement incorporating by reference this Annual Report on Form 10-K into any filing under such Acts, except to the extent that the Company specifically incorporates it by reference into such filing.
The following graph compares cumulative shareholder returns for our common stock as compared with the S&P 500 and the PowerShares Global Wind Energy Index for the period from April 9, 2009
23
(the date our common stock began trading on the NASDAQ Global Select Market) to December 31, 2009. The graph assumes an investment of $100 as of April 9, 2009 and that dividends were reinvested.
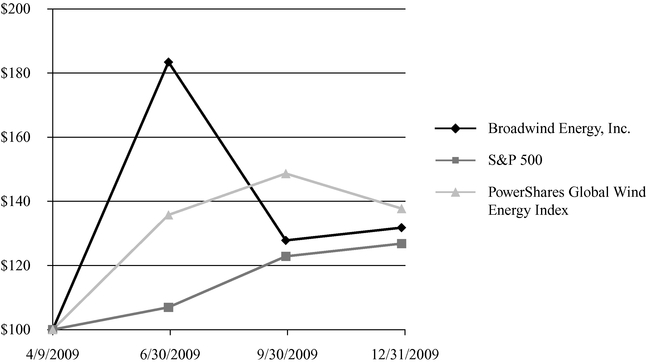
Repurchases
We did not engage in any repurchases of our common stock during the fourth quarter of 2009.
Unregistered Sales of Equity Securities
All unregistered sales of equity securities during the fourth quarter or for the year ended December 31, 2009 have been previously disclosed on our Current Reports on Form 8-K.
Securities Authorized for Issuance Under Equity Compensation Plans
See Part III, Item 12 "Security Ownership of Certain Beneficial Owners and Management and Related Stockholder Matters" of this Annual Report on Form 10-K for information as of December 31, 2009 with respect to shares of our common stock that may be issued under our existing share-based compensation plans.
ITEM 6. SELECTED FINANCIAL DATA
The following selected historical consolidated financial and other data are qualified in their entirety by reference to, and should be read in conjunction with, our consolidated financial statements and the related notes thereto appearing elsewhere herein and Part II, Item 7 "Management's Discussion and Analysis of Financial Condition and Results of Operations." Our selected statement of operations and statement of cash flows data set forth below for each of the years ended December 31, 2009, 2008, 2007, 2006 and 2005, and the balance sheet data as of December 31, 2009, 2008, 2007, 2006 and 2005, are derived from our consolidated financial statements.
24
(In thousands, except per share data)
| |
For the Year Ended December 31, | ||||||||||||||||
|---|---|---|---|---|---|---|---|---|---|---|---|---|---|---|---|---|---|
| |
2009 | 2008 | 2007 | 2006 | 2005 | ||||||||||||
Selected Statement of Operations Data |
|||||||||||||||||
Revenues |
$ | 197,830 | $ | 217,321 | $ | 29,804 | $ | 4,023 | $ | 1,967 | |||||||
Cost of sales |
186,027 | 183,951 | 25,865 | 4,822 | 4,009 | ||||||||||||
Gross profit (loss) |
11,803 | 33,370 | 3,939 | (799 | ) | (2,042 | ) | ||||||||||
Gross profit (loss) percentage |
6.0 | % | 15.4 | % | 13.2 | % | (19.9 | )% | (103.8 | )% | |||||||
Selling, general and administrative expenses |
34,825 |
41,545 |
5,724 |
1,501 |
845 |
||||||||||||
Goodwill and intangible impairment(1) |
82,211 | 2,409 | — | — | — | ||||||||||||
Intangible amortization |
10,404 | 11,159 | 1,750 | 21 | — | ||||||||||||
Operating loss |
(115,637 | ) | (21,743 | ) | (3,535 | ) | (2,321 | ) | (2,887 | ) | |||||||
Operating loss margin percentage |
(58.5 | )% | (10.0 | )% | (11.9 | )% | (57.7 | )% | (146.8 | )% | |||||||
Total other income (expense), net |
3,929 |
(2,480 |
) |
(866 |
) |
(414 |
) |
(235 |
) |
||||||||
(Benefit) provision for income taxes |
(1,589 | ) | 1,062 | (1,039 | ) | — | — | ||||||||||
Net loss |
$ | (110,119 | ) | $ | (25,285 | ) | $ | (3,362 | ) | $ | (2,735 | ) | $ | (3,122 | ) | ||
Net loss per share—basic and diluted |
$ |
(1.14 |
) |
$ |
(0.28 |
) |
$ |
(0.07 |
) |
$ |
(0.08 |
) |
$ |
(0.14 |
) |
||
Weighted average shares outstanding—basic and diluted |
96,574 |
89,899 |
51,535 |
33,772 |
22,750 |
||||||||||||
| |
As of December 31, | |||||||||||||||||
|---|---|---|---|---|---|---|---|---|---|---|---|---|---|---|---|---|---|---|
| |
2009 | 2008 | 2007 | 2006 | 2005 | |||||||||||||
Selected Balance Sheet Data |
||||||||||||||||||
Assets: |
||||||||||||||||||
Cash and cash equivalents |
$ | 4,829 | $ | 15,253 | $ | 5,782 | $ | 125 | $ | 166 | ||||||||
Accounts receivable, net |
21,920 | 36,709 | 13,541 | 161 | 180 | |||||||||||||
Inventories |
9,039 | 41,895 | 12,983 | 288 | 283 | |||||||||||||
Total current assets |
43,486 | 98,219 | 34,752 | 588 | 638 | |||||||||||||
Property and equipment, net |
136,249 | 144,707 | 58,890 | 2,799 | 2,676 | |||||||||||||
Goodwill and intangibles, net |
46,963 | 136,547 | 111,633 | — | — | |||||||||||||
Total assets |
230,036 | 379,748 | 205,818 | 3,895 | 3,330 | |||||||||||||
Liabilities: |
||||||||||||||||||
Accounts payable and accrued liabilities |
$ | 21,675 | $ | 50,611 | $ | 22,593 | $ | 3,149 | $ | 1,754 | ||||||||
Total current liabilities |
52,742 | 85,742 | 62,449 | 8,402 | 5,858 | |||||||||||||
Total long-term debt, net of current maturities |
15,778 | 25,792 | 17,620 | 807 | 897 | |||||||||||||
Total liabilities |
74,441 | 117,592 | 81,282 | 9,209 | 6,755 | |||||||||||||
Total stockholders' equity (deficit) |
$ |
155,595 |
$ |
262,156 |
$ |
124,536 |
$ |
(5,314 |
) |
$ |
(3,425 |
) |
||||||
25
| |
For the Year Ended December 31, | |||||||||||||||
|---|---|---|---|---|---|---|---|---|---|---|---|---|---|---|---|---|
| |
2009 | 2008 | 2007 | 2006 | 2005 | |||||||||||
Selected Statement of Cash Flows Data |
||||||||||||||||
Net cash provided by (used in) operating activities |
$ | 1,987 | $ | (2,359 | ) | $ | 521 | $ | (711 | ) | $ | (1,535 | ) | |||
Net cash used in investing activities |
(12,520 | ) | (106,696 | ) | (82,828 | ) | (408 | ) | (1,098 | ) | ||||||
Net cash provided by financing activities |
109 | 118,526 | 87,964 | 1,078 | 2,798 | |||||||||||
Proceeds from the issuance of common stock |
751 | 117,389 | 65,400 | — | — | |||||||||||
Capital expenditures |
11,836 | 83,720 | 5,854 | 408 | 1,098 | |||||||||||
Cash paid for acquisitions, net of acquired cash |
— | 23,016 | 76,474 | — | — | |||||||||||
| |
For the Year Ended December 31, | ||||||||||||||||
|---|---|---|---|---|---|---|---|---|---|---|---|---|---|---|---|---|---|
| |
2009 | 2008 | 2007 | 2006 | 2005 | ||||||||||||
Selected Other Data—Non GAAP Financial Measures |
|||||||||||||||||
Adjusted EBITDA(2) |
$ | 1,558 | $ | 4,327 | $ | 103 | $ | (1,643 | ) | $ | (2,656 | ) | |||||
Adjusted EBITDA margin percentage(3) |
0.8 | % | 2.0 | % | 0.3 | % | (40.8 | )% | (135.0 | )% | |||||||
- (1)
- During
the year ended December 31, 2009, we recorded goodwill and intangible impairment charges in the aggregate of $82,211 related to our Gearing
and Towers segments. During the year ended December 31, 2008, we recorded a goodwill impairment charge of $2,409 related to our Towers segment. See Note 8 "Goodwill and Intangible
Assets" in Part IV, Item 15 in the notes to our consolidated financial statements for further discussion of the impairment for these years.
- (2)
- For any period, earnings before interest, taxes, depreciation, amortization, and share-based compensation ("Adjusted EBITDA") are calculated as presented below. We believe that Adjusted EBITDA is particularly meaningful due principally to the role acquisitions have played in our development. Historically, our growth through acquisitions has resulted in significant non-cash depreciation and amortization expense because a significant portion of the purchase price of our acquired businesses is generally allocated to depreciable fixed assets and long-lived assets, which primarily consist of goodwill and amortizable intangible assets. Please note that Adjusted EBITDA should not be considered an alternative to, nor is there any implication that Adjusted EBITDA is more meaningful than, any measure of performance or liquidity promulgated under accounting principles generally accepted in the United States ("GAAP"). Additionally, the calculation of Adjusted EBITDA excludes the effect of any goodwill and intangible impairment charges.
| |
For the Year Ended December 31, | ||||||||||||||||
|---|---|---|---|---|---|---|---|---|---|---|---|---|---|---|---|---|---|
| |
2009 | 2008 | 2007 | 2006 | 2005 | ||||||||||||
Net loss |
$ | (110,119 | ) | $ | (25,285 | ) | $ | (3,362 | ) | $ | (2,735 | ) | $ | (3,122 | ) | ||
(Benefit) provision for income taxes |
(1,589 | ) | 1,062 | (1,039 | ) | — | — | ||||||||||
Interest expense, net |
2,525 | 2,276 | 839 | 411 | 222 | ||||||||||||
Goodwill and intangible impairment |
82,211 | 2,409 | — | — | — | ||||||||||||
Depreciation and amortization |
25,725 | 21,866 | 3,523 | 328 | 244 | ||||||||||||
Share-based compensation |
2,805 | 1,999 | 142 | 353 | — | ||||||||||||
Adjusted EBITDA |
$ | 1,558 | $ | 4,327 | $ | 103 | $ | (1,643 | ) | $ | (2,656 | ) | |||||
- (3)
- Adjusted EBITDA margin percentage is equal to Adjusted EBITDA divided by total revenue.
26
ITEM 7. MANAGEMENT'S DISCUSSION AND ANALYSIS OF FINANCIAL CONDITION AND RESULTS OF OPERATIONS
The discussion below contains "forward-looking statements," as defined in Section 21E of the Exchange Act, that reflect our current expectations regarding our future growth, results of operations, cash flows, performance and business prospects and opportunities, as well as assumptions made by, and information currently available to, our management. We have tried to identify forward-looking statements by using words such as "anticipate," "believe," "plan," "expect," "intend," "will," and similar expressions, but these words are not the exclusive means of identifying forward-looking statements. These statements are based on information currently available to us and are subject to various risks, uncertainties, and other factors, including, but not limited to, those matters discussed in Item 1A "Risk Factors" in Part I of this Annual Report on Form 10-K, that could cause our actual growth, results of operations, cash flows, performance and business prospects and opportunities to differ materially from those expressed in, or implied by, these statements. Except as expressly required by the federal securities laws, we undertake no obligation to update such factors or to publicly announce the results of any of the forward-looking statements contained herein to reflect future events, developments, or changed circumstances, or for any other reason.
As used in this Annual Report on Form 10-K, the terms "we," "us," "our," "Broadwind," and the "Company" refer to Broadwind Energy, Inc. and its wholly-owned subsidiaries.
(Dollars are presented in thousands unless otherwise stated)
Business Overview
Broadwind Energy provides technologically advanced high-value products and services to the U.S. wind energy industry. We believe we are the only independent company that offers our breadth of products and services to the market. Our product and service portfolio provides our customers, including wind turbine manufacturers, wind farm developers and wind farm operators, with access to a broad array of wind component and service offerings, which we believe is becoming increasingly important in today's wind market. We manufacture gearing systems and structural towers for the wind industry. We also provide technical service and precision repair and engineering and specialized logistics to the wind industry in the United States, a highly-fragmented market in which we hold a significant position. We have long standing relationships with our primary customers, who include several leading participants in the U.S. wind sector.
The adverse impact of the global economic downturn, which we began to experience during the latter half of 2008, continued during 2009. The continued global economic downturn coupled with a re-pricing of credit risk and a lack of adequate liquidity in the capital markets presented a number of challenges for us. On a year-over-year basis, our revenues declined by approximately 9%. While revenues within our Towers segment increased by approximately 29%, revenues within our other operating segments declined compared to the prior year. The decline in our other operating segments reflects the broader economic condition of the wind energy market, which resulted in the delay or scaling-back of production volumes under some of our key customer agreements, a decline in wind farm installation and maintenance service contracts and declining logistics business due to pricing pressures from our competition. Accordingly, the decline in production levels across our business units has created production volume inefficiencies within our operations and cost structures, which has had a negative effect on our operating profits and gross margins.
We responded by initiating cost-cutting measures throughout our operations as well as reducing our capital spending, amending existing credit agreements and entering into new debt agreements and sale-leaseback transactions. In October 2009, we announced our intent to sell shares of our common stock in a public offering. We completed this offering in January 2010, and raised approximately $53,900 in net proceeds through the sale of 10,000,000 shares of our common stock. A portion of the
27
proceeds from this offering was used to repay outstanding indebtedness under the BOA Debt Facilities and the ICB Line (each such term as defined below) and to settle our interest rate swap agreements. We intend to use the remainder of these proceeds for general operating purposes and specific capital expenditures to help us grow our business, including the anticipated establishment of a MW gearbox test stand and refurbishment center. We believe that these initiatives enable us to better manage our operating and liquidity needs and will facilitate investing in capital expenditures that will successfully grow our business along with establishing adequate liquidity to support our working capital needs if and when the wind energy industry rebounds. We also intend to strengthen our liquidity and operating position through the establishment of a senior credit facility.
We review our goodwill balances for impairment on at least an annual basis and review our intangible and other long-lived assets for impairment whenever events or changes in circumstances indicate that the asset's carrying value amount may not be recoverable. We performed our review of goodwill based on the carrying value of these assets as of October 31, 2009, and the estimate of fair-value for each of our operating segments was based primarily on projected future results, cash flows and other assumptions. We did not identify a triggering event during 2009 which would require an early assessment of impairment, however, in connection with our annual goodwill impairment analysis as of October 31, 2009 which we completed in March 2010, we determined that the goodwill balance attributable to our Gearing segment was impaired due to a deterioration in financial performance during 2009 and as a result of the subsequent fourth quarter revision in our projection of future operating results and cash flows in light of the effect of the continued economic downturn on the wind gearing industry. Additionally, we determined that the carrying value of our RBA trade name was impaired as a result of the merger of RBA's operations into our Towers segment in December 2009 and that RBA's customer relationship intangible was impaired due to a revision in projected revenues and cash flows associated with this customer relationship. Accordingly, we recorded goodwill and intangible impairment charges of $24,269 and $57,942, respectively, to properly reflect the carrying value of these assets. In the future, if our projected discounted cash flows associated with our operating segments do not exceed the carrying value of their net assets, we may be required to record additional write downs of the carrying value of goodwill, intangible assets or other long-lived assets associated with any of our operating segments and our operating results, and the market price of our common stock may be materially adversely affected.
Although we have recently seen signals that the wind energy industry and the broader U.S. economy may be recovering from the worst of the economic downturn that began in the latter half of 2008 and continued throughout 2009, we expect that the economic conditions we experienced in 2009 will continue to negatively affect our business through at least the first half of 2010. Based on our current expectations regarding our backlog of firm commitments, increased quoting activity, scheduled 2010 wind farm development and installation projects, and leading market indicators in the wind energy industry, we anticipate an upward trend in our production volumes. Although we anticipate that the wind energy market will improve during the second half of 2010, we cannot provide any assurance that improved conditions will occur or that we will be able to capitalize on those improved conditions. Below is a summary of recent key events that occurred during 2009:
Summary of Recent Events
- •
- In January, we completed construction and shortly thereafter commenced operations at our new wind tower manufacturing
facility located in Abilene, Texas.
- •
- In February, federal economic recovery legislation was passed by Congress and signed into law by President Obama. Within this legislation, significant provisions to benefit the renewable energy industry were included, such as: grant programs provided through the Treasury Department to renewable energy developers; the extension of the wind energy production tax credits; a provision allowing wind developers to take an investment tax credit in lieu of the
28
- •
- In April, we announced that shares of our common stock had been approved for listing on NASDAQ. Shares of our common
stock, which were previously listed and traded on the OTCBB, began trading on NASDAQ on April 9, 2009 under the same "BWEN" ticker symbol.
- •
- In April, we announced that Tower Tech had obtained construction financing from Great Western Bank ("Great Western") in
the amount of up to $10,000. Proceeds from the financing were used to finance construction of our wind tower manufacturing facility in Brandon, South Dakota.
- •
- In July, we appointed Stephanie K. Kushner as Chief Financial Officer and principal financial officer. Ms. Kushner
brought to the Company over 30 years of accounting and finance experience and has served as Chief Financial Officer and served in other senior management positions for large manufacturing and
publicly traded corporations.
- •
- In October, we filed a registration statement on Form S-1 to issue an additional 10,000,000 shares of our common stock. On January 21, 2010, we completed our public offering of Company common stock at an offering price of $5.75 per share, raising net proceeds of approximately $53,900. In the offering, we sold 10,000,000 newly issued shares, Tontine sold a combined total of 6,125,000 shares and our Chief Executive Officer, J. Cameron Drecoll, sold 1,125,000 shares. The sales included all shares subject to the underwriters' over-allotment option. After the completion of this offering, we repaid all outstanding indebtedness under the Bank of America debt agreements and the Investors Community Bank line of credit for $16,076 and $3,066, respectively. As of February 28, 2010, debt, credit agreements and capital lease obligations totaled $18,722, of which $3,842 represents our minimum debt service and capital lease payments for 2010.
production tax credit; a provision allowing wind developers to collect the investment tax credit as a cash grant; loan guarantee programs provided through the U.S. Department of Energy for renewable energy developers and manufacturers; and tax credits for advanced energy manufacturers.
29
RESULTS OF OPERATIONS
Year Ended December 31, 2009 Compared to Year Ended December 31, 2008
The summary of selected financial data table below should be referenced in connection with a review of the following discussion of our results of operations for the year ended December 31, 2009 compared to the year ended December 31, 2008.
| |
For the Year Ended December 31, | |
|
||||||||||||||||||
|---|---|---|---|---|---|---|---|---|---|---|---|---|---|---|---|---|---|---|---|---|---|
| |
2009 vs. 2008 | ||||||||||||||||||||
| |
|
% of Total Revenue |
|
% of Total Revenue |
|||||||||||||||||
| |
2009 | 2008 | $ Change | % Change | |||||||||||||||||
Revenues |
$ | 197,830 | 100.0 | % | $ | 217,321 | 100.0 | % | $ | (19,491 | ) | (9.0 | )% | ||||||||
Cost of sales |
186,027 | 94.0 | % | 183,951 | 84.6 | % | 2,076 | 1.1 | % | ||||||||||||
Gross profit |
11,803 | 6.0 | % | 33,370 | 15.4 | % | (21,567 | ) | (64.6 | )% | |||||||||||
Operating expenses |
|||||||||||||||||||||
Selling, general and administrative expenses |
34,825 | 17.6 | % | 41,545 | 19.1 | % | (6,720 | ) | (16.2 | )% | |||||||||||
Goodwill and intangible impairment |
82,211 | 41.6 | % | 2,409 | 1.1 | % | 79,802 | 3312.7 | % | ||||||||||||
Intangible amortization |
10,404 | 5.3 | % | 11,159 | 5.1 | % | (755 | ) | (6.8 | )% | |||||||||||
Total operating expenses |
127,440 | 64.5 | % | 55,113 | 25.3 | % | 72,327 | 131.2 | % | ||||||||||||
Operating loss |
(115,637 | ) | (58.5 | )% | (21,743 | ) | (9.9 | )% | (93,894 | ) | 431.8 | % | |||||||||
Other income (expense) |
|||||||||||||||||||||
Interest expense, net |
(2,525 | ) | (1.3 | )% | (2,276 | ) | (1.0 | )% | (249 | ) | 10.9 | % | |||||||||
Other, net |
6,454 | 3.3 | % | (204 | ) | (0.1 | )% | 6,658 | (3263.7 | )% | |||||||||||
Other income (expense), net |
3,929 | 2.0 | % | (2,480 | ) | (1.1 | )% | 6,409 | (258.4 | )% | |||||||||||
Net loss before provision for income taxes |
(111,708 | ) | (56.5 | )% | (24,223 | ) | (11.0 | )% | (87,485 | ) | 361.2 | % | |||||||||
(Benefit) provision for income taxes |
(1,589 | ) | (0.8 | )% | 1,062 | 0.5 | % | (2,651 | ) | 249.6 | % | ||||||||||
Net loss |
$ | (110,119 | ) | (55.7 | )% | $ | (25,285 | ) | (11.5 | )% | $ | (84,834 | ) | 335.5 | % | ||||||
Consolidated
Total revenues decreased $19,491 or 9%, from $217,321 during the year ended December 31, 2008, to $197,830 during the year ended December 31, 2009. The decrease in revenues was primarily attributable to a 38% decline in gearing revenues, which was the result of a reduction in wind turbine gearing production as compared to the prior year. Revenues in our Technical and Engineering Services segment decreased 12% due to the completion of a large blade refurbishment project that did not recur during 2009. These declines were partially offset by a 29% increase in wind turbine structural tower revenues as a result of new customer orders and increased manufacturing capacity associated with the addition of a new wind structural tower facility in Abilene, Texas in January 2009.
Total cost of sales increased $2,076 from $183,951 during the year ended December 31, 2008, to $186,027 during the year ended December 31, 2009. The change in cost of sales was primarily the result of an increase in costs of sales of 49% and 56% in our Towers and Logistics segments, respectively. The increase in cost of sales within our Towers segment was primarily attributable to a higher percentage of steel included in the selling price of wind turbine structural towers manufactured, an increase in production costs related to higher production volumes and the inclusion of start-up and production costs for our new wind tower manufacturing facility in Abilene, Texas. The increase in cost of sales within our Logistics segment was attributable to higher depreciation expense related to capital
30
expenditures made during 2008. The increase in cost of sales was partially offset by 30% and 10% declines in cost of sales within our Gearing and Technical and Engineering Services segments, respectively. The decrease in cost of sales in our Gearing segment was primarily attributable to the 38% decline in revenues as compared to the prior year. The decrease in cost of sales in our Technical and Engineering Services segment was due to lower direct labor costs for field technicians as a result of a 12% decline in revenues as compared to the prior year.
Selling, general and administrative expenses decreased from $41,545 during the year ended December 31, 2008, to $34,825 during the year ended December 31, 2009. The decrease was primarily attributable to cost reduction initiatives implemented during 2009 across all reportable segments to mitigate the effects of an overall decline in production volumes. These cost reduction initiatives were partially offset by an $806 increase in share-based compensation expense as a result of an increase in restricted stock units granted and professional fees and costs of $1,201 associated with amendments to our credit agreement with Bank of America.
We perform our annual test of goodwill impairment using a testing date as of October 31 of each year. Due to the continuing effects of the economic downturn on the wind energy industry, we revised our projected revenues and associated cash flows. The results of these revised projections indicated that the fair value of our goodwill and intangible assets related to our Gearing segment was less than the carrying value of these assets. Our analysis also indicated impairment to our trade name and customer relationship intangible assets in our Towers segment as a result of the merger of our industrial weldment business into our Towers segment in December 2009 and due to a revision in projected revenues and cash flows associated with this customer relationship. Accordingly, we recorded goodwill and intangible impairment charges of $24,269 and $57,942, to properly reflect the carrying value of these assets.
Intangible amortization expense decreased from $11,159 during the year ended December 31, 2008, to $10,404 during the year ended December 31, 2009. The decrease was primarily due to a $1,203 reduction in amortization expense in our Gearing segment as a result of the impairment to its customer relationship intangibles. This decrease in amortization expense was partially offset by increases in trademark and customer relationship amortization expense of $367 and $99 in our Logistics segment and our Technical and Engineering Services segment, respectively, resulting from full year amortization expense associated with the acquisitions of EMS and Badger, which we acquired in January 2008 and June 2008, respectively.
Total other expense, net, was $2,480 during the year ended December 31, 2008, compared to other income, net, of $3,929 during the year ended December 31, 2009. The increase was primarily attributable to the recognition of $5,082 in income related to an escrow agreement settlement with the former owners of Brad Foote during the second quarter of 2009.
During the year ended December 31, 2008, we reported a provision for income taxes of $1,062 compared to a benefit for income taxes of $1,589 during the year ended December 31, 2009. The decrease in income taxes was primarily attributable to a reduction in our deferred income tax liabilities in connection with the goodwill impairment charge recorded during 2009.
Net loss increased from $25,285 during the year ended December 31, 2008, to $110,119 during the year ended December 31, 2009, primarily as a result of the factors as described above.
31
Towers Segment
The following table summarizes the Towers segment operating results for the year ended December 31, 2009 and 2008:
| |
Twelve Months Ended December 31, |
||||||
|---|---|---|---|---|---|---|---|
| |
2009 | 2008 | |||||
Revenues |
$ | 93,316 | $ | 72,561 | |||
Operating (loss) income |
(500 | ) | 5,813 | ||||
Operating margin |
(0.5 | )% | 8.0 | % | |||
Towers segment revenues increased $20,755 from $72,561 during the year ended December 31, 2008, to $93,316 during the year ended December 31, 2009. Approximately 21% of the increase in revenues was attributable to an increase in materials included in the selling price of wind turbine structural towers manufactured. Additionally, revenues increased by approximately 28% in connection with new customer agreements and the corresponding increase in production volumes at our Manitowoc, Wisconsin and Abilene, Texas facilities
Despite higher revenues, the segment incurred an operating loss of $500 due in part to the impairment charge with respect to a customer relationship and trade name intangible in the aggregate of $1,916. The trade name intangible impairment charge was attributable to the merger of our specialty weldment operations into our Towers segment in December 2009 and the customer relationship intangible impairment was due to a revision in projected revenues and cash flows associated with this customer relationship. The decrease in operating income and operating margin was also due to production inefficiencies and increased travel and administrative expenses of approximately $3,350 associated with the start-up of our second wind structural tower manufacturing facility in Abilene, Texas and our operating margins were negatively impacted by approximately $4,200 due to less profitable customer contracts as compared to the prior year.
Gearing Segment
The following table summarizes the Gearing segment operating results for the year ended December 31, 2009 and 2008:
| |
Twelve Months Ended December 31, |
||||||
|---|---|---|---|---|---|---|---|
| |
2009 | 2008 | |||||
Revenues |
$ | 64,518 | $ | 104,553 | |||
Operating loss |
(97,059 | ) | (6,614 | ) | |||
Operating margin |
(150.4 | )% | (6.3 | )% | |||
Gearing segment revenues decreased $40,035 from $104,553 during the year ended December 31, 2008, to $64,518 during the year ended December 31, 2009. The decrease in revenues was primarily attributable to 46% and 27% declines in wind gearing and industrial revenues, respectively. The manufacture of wind turbine gearing, which typically accounts for the majority of our gearing revenues, continued to be negatively affected by reduced or delayed production orders from our key gearing customers.
Gearing operating loss increased $90,445 from $6,614 during the year ended December 31, 2008, to $97,059 during the year ended December 31, 2009. The increase in operating loss was largely attributable to goodwill and intangible impairment charges of $80,295 recorded during 2009. The impairment charges were the result of a revision in our estimates of future results of operations and associated cash flows due to a decline in production volumes. Additionally, the increase in operating
32
loss was also the result of a continued decline in wind gearing production volumes, which resulted in direct labor and manufacturing overhead inefficiencies and an under absorption of fixed operating costs. Material costs were $3,972 higher due to additional product rework costs and scrap associated with specification adjustments for new wind gearing production orders. The increase in operating loss was also impacted by higher depreciation expense of $1,792 associated with capital investments made in 2008, and expenses and fees of $1,201 incurred in connection with the negotiation of amendments to our credit facility with Bank of America, partially offset by lower outside service expenses associated with a reduced level of activity and lower selling, general and administrative expenses due to cost reduction initiatives. Gearing operating margins worsened from (6.3%) during the year ended December 31, 2008 to (150.4%) during the year ended December 31, 2009, as a result of these factors.
Technical and Engineering Services Segment
The following table summarizes the Technical and Engineering Services segment operating results for the year ended December 31, 2009 and 2008:
| |
Twelve Months Ended December 31, |
||||||
|---|---|---|---|---|---|---|---|
| |
2009 | 2008 | |||||
Revenues |
$ | 27,575 | $ | 31,249 | |||
Operating loss |
(610 | ) | (1,822 | ) | |||
Operating margin |
(2.2 | )% | (5.8 | )% | |||
Technical and Engineering Services segment revenues decreased $3,674 from $31,249 during the year ended December 31, 2008, to $27,575 during the year ended December 31, 2009. The decrease in revenues was primarily the result of 9% and 16% declines in our technical services and precision repair and engineering service revenues, respectively, during the current year. The decline in our technical services revenues was the result of a continued slowdown in operations and maintenance services performed for wind farm owners and operators, particularly in the fourth quarter of the year. The decline in engineering services revenues primarily relates to a decision by one of our large service customers to in-service work which was previously contracted to us.
Technical and Engineering Services segment operating loss improved $1,212 from $1,822 during the year ended December 31, 2008, to $610 during the year ended December 31, 2009. The operating margin improved from (5.8%) in 2008 to (2.2%) in 2009. The improvement in operating loss and operating loss margin were primarily attributable to cost reduction initiatives to align our administrative and field technicians cost structures as a result of the reduction in service contracts during the current year.
Logistics Segment
The following table summarizes the Logistics segment operating results for the year and period ended December 31, 2009 and 2008:
| |
Twelve Months Ended December 31, 2009 |
Period Ended December 31, 2008 |
|||||
|---|---|---|---|---|---|---|---|
Revenues |
$ | 13,258 | $ | 10,253 | |||
Operating (loss) income |
(3,382 | ) | 131 | ||||
Operating margin |
(25.5 | )% | 1.2 | % | |||
Logistics segment revenues increased $3,005 from $10,253 during the period ended December 31, 2008, to $13,258 during the year ended December 31, 2009. The increase in revenues was primarily
33
attributable to full year financial results for Badger, which we acquired in June 2008, compared to seven months of financial results during 2008. During the latter half of 2009, revenues were negatively affected by the impact of the economic downturn on the wind energy industry and competitive pricing pressure during 2009.
Logistics segment operating income decreased $3,513 from operating income of $131 during the period ended December 31, 2008, to an operating loss of $3,382 during the year ended December 31, 2009. The operating margin decreased similarly, from 1.2% in 2008 to (25.5%) in 2009. These decreases were primarily attributable to higher fixed overhead costs of $1,959 due to higher depreciation and lease expense associated with an expansion of the heavy haul fleet in 2008 and increased selling, general and administrative expenses of $1,373 which were primarily related to full year financial results.
Corporate and Other
Corporate and Other operating loss improved $5,165 from $19,251 during the year ended December 31, 2008, to $14,086 during the year ended December 31, 2009. The decrease in operating loss was primarily attributable to a $4,279 reduction in professional fees associated with due diligence and acquisition-related costs incurred in connection with acquisitions we did not complete during 2008 and also related to Sarbanes-Oxley and other compliance initiatives in addition to a $882 reduction in bad debt expense.
34
Year Ended December 31, 2008 Compared to Year Ended December 31, 2007
The summary of selected financial data table below should be referenced in connection with a review of the following discussion of our results of operations for the year ended December 31, 2008 compared to the year ended December 31, 2007.
| |
For the Year Ended December 31, | |
|
||||||||||||||||||
|---|---|---|---|---|---|---|---|---|---|---|---|---|---|---|---|---|---|---|---|---|---|
| |
2008 vs. 2007 | ||||||||||||||||||||
| |
|
% of Total Revenue |
|
% of Total Revenue |
|||||||||||||||||
| |
2008 | 2007 | $ Change | % Change | |||||||||||||||||
Revenues |
$ | 217,321 | 100.0 | % | $ | 29,804 | 100.0 | % | $ | 187,517 | 629.2 | % | |||||||||
Cost of sales |
183,951 | 84.6 | % | 25,865 | 86.8 | % | 158,086 | 611.2 | % | ||||||||||||
Gross profit |
33,370 | 15.4 | % | 3,939 | 13.2 | % | 29,431 | 747.2 | % | ||||||||||||
Operating expenses |
|||||||||||||||||||||
Selling, general and administrative expenses |
41,545 | 19.1 | % | 5,724 | 19.2 | % | 35,821 | 625.8 | % | ||||||||||||
Goodwill and intangible impairment |
2,409 | 1.1 | % | — | 0.0 | % | 2,409 | 100.0 | % | ||||||||||||
Intangible amortization |
11,159 | 5.2 | % | 1,750 | 5.9 | % | 9,409 | 537.7 | % | ||||||||||||
Total operating expenses |
55,113 | 25.4 | % | 7,474 | 25.1 | % | 47,639 | 637.4 | % | ||||||||||||
Operating loss |
(21,743 | ) | (10.0 | )% | (3,535 | ) | (11.9 | )% | (18,208 | ) | 515.1 | % | |||||||||
Other income (expense) |
|||||||||||||||||||||
Interest income |
584 | 0.3 | % | 400 | 1.3 | % | 184 | 46.0 | % | ||||||||||||
Interest expense |
(2,860 | ) | (1.3 | )% | (1,239 | ) | (4.1 | )% | (1,621 | ) | 130.8 | % | |||||||||
Other, net |
(204 | ) | (0.1 | )% | (27 | ) | (0.1 | )% | (177 | ) | 655.6 | % | |||||||||
Other expense, net |
(2,480 | ) | (1.1 | )% | (866 | ) | (2.9 | )% | (1,614 | ) | 186.4 | % | |||||||||
Net loss before benefit for income taxes |
(24,223 | ) | (11.1 | )% | (4,401 | ) | (14.8 | )% | (19,822 | ) | 450.4 | % | |||||||||
Provision (benefit) for income taxes |
1,062 | 0.5 | % | (1,039 | ) | (3.5 | )% | (2,101 | ) | 202.2 | % | ||||||||||
Net loss |
$ | (25,285 | ) | (11.6 | )% | $ | (3,362 | ) | (11.3 | )% | $ | (21,923 | ) | 652.1 | % | ||||||
Consolidated
Total revenues increased $187,517 or 629%, from $29,804 during the year ended December 31, 2007 to $217,321 during the year ended December 31, 2008. The increase in revenues was primarily attributable to the addition of full year operating results at Brad Foote, our subsidiary that we acquired in October 2007, which represented an increase in revenues of $87,578, increases in wind structural tower revenues of $59,672 and an increase in revenues of $31,249 and $10,253, respectively, due to the acquisitions of EMS and Badger in January 2008 and June 2008, respectively.
Total cost of sales increased $158,086 from $25,865 during the year ended December 31, 2007 compared to cost of sales of $183,951 during the year ended December 31, 2008. The change in cost of sales was primarily attributable to increases in the Gearing segment of $78,543, the Towers segment of $49,213, the Technical and Engineering Services segment of $22,043 and the Logistics segment of $8,579. The increase in cost of sales was primarily attributable to the inclusion of full year operating results at Brad Foote, in 2008, higher cost of sales from our wind turbine towers related to volume increases, the inclusion of steel in the selling price of certain wind towers during the second half of 2008 and the inclusion of cost of sales associated with our acquisitions of EMS and Badger in January 2008 and June 2008, respectively.
35
Selling, general and administrative expenses increased from $5,724 during the year ended December 31, 2007 to $41,545 during the year ended December 31, 2008. The change in selling, general and administrative expenses was primarily attributable to increases in Corporate and Other of $18,417, the Technical and Engineering Services segment of $8,567, the Towers segment of $3,187, the Gearing segment of $4,620 and the Logistics segment of $1,030. The increase was due to the addition of full year expenses at Brad Foote, which we acquired in October 2007, plus the addition of selling, general and administrative expenses associated with the acquisitions of EMS and Badger in January 2008 and June 2008, respectively.
During 2008, we recorded a goodwill impairment charge of $2,409 to our Towers segment. During the fourth quarter of 2008, we performed our annual impairment test. Our analysis indicated that the goodwill attributable to our RBA subsidiary was impaired because projected discounted cash flows from RBA's results of operations did not exceed the carrying value of its net assets.
Intangible amortization increased from $1,750 during the year ended December 31, 2007 to $11,159 during the year ended December 31, 2008. The increase in intangible amortization was primarily attributable to higher amortization expense of customer relationship intangibles as a result of our acquisitions of Brad Foote and EMS.
Other expense, net increased from $866 during the year ended December 31, 2007 to $2,480 during the year ended December 31, 2008. The increase in other expense, net was primarily due to higher interest expense on outstanding debt at Brad Foote and interest expense incurred during the first quarter of 2008 with respect to a related party note payable.
We recorded a provision for income taxes of $1,062 during the year ended December 31, 2008 as compared to a benefit for income taxes of $1,039 during the year ended December 31, 2007. The increase in income tax expense was primarily attributable to higher state income taxes and temporary timing differences related to our indefinite-lived intangibles.
Net loss for the year ended December 31, 2008 was $25,285, an increase of $21,923 compared to a net loss of $3,362 during the year ended December 31, 2007, as a result of the factors as described above.
Towers Segment
The following table summarizes the Towers segment operating results for the twelve months ended December 31, 2008 and 2007:
| |
Twelve Months Ended December 31, |
||||||
|---|---|---|---|---|---|---|---|
| |
2008 | 2007 | |||||
Revenues |
$ | 72,561 | $ | 12,889 | |||
Operating income |
5,813 | 1,030 | |||||
Operating margin |
8.0 | % | 8.0 | % | |||
Towers segment revenues increased $59,672 from $12,889 during the year ended December 31, 2007, to $72,561 during the year ended December 31, 2008. The increase in revenues was primarily attributable to volume increases and the inclusion of materials in the selling price of certain wind towers during the second half of 2008. During the year ended December 31, 2008, approximately 51% of revenue was attributable to the inclusion of steel in the selling price of wind turbine structural towers compared to 0% during the year ended December 31, 2007. Additionally, wind turbine structural tower revenues increased 149% compared to the prior year as a result of new contracts.
Towers operating income increased $4,783 from $1,030 during the year ended December 31, 2007, to $5,813 during the year ended December 31, 2008. The increase in operating income was primarily
36
attributable to the increase in revenues which was partially offset by increases in selling, general and administrative expenses, primarily attributable to start-up costs relating to our new wind tower manufacturing facilities being constructed in 2008. The operating margin was unchanged at 8.0%.
Gearing Segment
The following table summarizes the Gearing segment operating results for the twelve months ended December 31, 2008 and 2007:
| |
Twelve Months Ended December 31, |
||||||
|---|---|---|---|---|---|---|---|
| |
2008 | 2007 | |||||
Revenues |
$ | 104,553 | $ | 16,975 | |||
Operating loss |
(6,614 | ) | (4,579 | ) | |||
Operating margin |
(6.3 | )% | (27.0 | )% | |||
Gearing segment revenues increased $87,578 from $16,975 during the year ended December 31, 2007, to $104,553 during the year ended December 31, 2008. The increase in revenues was primarily attributable to increases in wind gearing revenues and industrial revenues of approximately 676% and 398%, respectively, relating to the inclusion of full year operating results at Brad Foote, which we acquired in October 2007.
Gearing operating loss increased $2,035 from $4,579 during the year ended December 31, 2007, to $6,614 during the year ended December 31, 2008. During 2008, Brad Foote ramped up production and increased capital expenditures in response to strong wind energy demand, and accordingly the operating loss increased due to higher depreciation associated with capital additions and intangible amortization expense of $12,435, which more than offset the benefit to gross profit related to higher sales volumes. The operating margin improved from (27%) in 2007 to (6.3%) in 2008 due to higher operating margin associated with strong wind energy demand.
Technical and Engineering Services Segment
The following table summarizes the Technical and Engineering Services segment operating results for the twelve months ended December 31, 2008 and 2007:
| |
Twelve Months Ended December 31, | ||||
|---|---|---|---|---|---|
| |
2008 | 2007 | |||
Revenues |
$ | 31,249 | N/A | ||
Operating loss |
(1,822 | ) | N/A | ||
Operating margin |
(5.8 | )% | N/A | ||
Technical and Engineering Services segment revenues were $31,249 during the year ended December 31, 2008 as a result of the inclusion of full year operating results of EMS, which we acquired in January 2008. The operating loss of ($1,822) included $2,461 of intangible amortization expense resulting from the acquisition of EMS.
37
Logistics Segment
The following table summarizes the Logistics segment operating results for the twelve months ended December 31, 2008 and 2007:
| |
Twelve Months Ended December 31, | ||||||
|---|---|---|---|---|---|---|---|
| |
2008 | 2007 | |||||
Revenues |
$ | 10,253 | N/A | ||||
Operating income |
131 | N/A | |||||
Operating margin |
1.2 | % | N/A | ||||
Logistics segment revenues were $10,253 during the year ended December 31, 2008 as the result of the inclusion of partial year operating results of Badger, which we acquired in June 2008. Operating income was $131, which included $513 of intangible amortization expense as a result of our acquisition of Badger in June 2008.
Corporate and Other
Corporate and Other selling, general and administrative expenses increased from ($90) during the year ended December 31, 2007, to $18,327 during the year ended December 31, 2008. During 2008, we centralized our corporate functions by staffing additional senior management, professional and administrative positions. As a percentage of selling, general and administrative expenses, professional fees, salaries and benefits and share based compensation accounted for approximately three quarters of the total increase in expenses. In addition, we incurred higher professional fees related to Sarbanes-Oxley compliance initiatives, due diligence and acquisition-related costs related to potential acquisitions that we did not complete during 2008 and expenses associated with being a public reporting company.
SUMMARY OF CRITICAL ACCOUNTING POLICIES
The methods, estimates and judgments that we use in applying our critical accounting policies have a significant impact on the results that we report in our financial statements. Some of our accounting policies require us to make difficult and subjective judgments, often as a result of the need to make estimates regarding matters that are inherently uncertain.
We have identified the accounting policies listed below to be critical to obtain an understanding of our consolidated financial statements. This section should also be read in conjunction with Note 1 "Description of Business and Summary of Significant Accounting Policies" in Part IV, Item 15 in the notes to our consolidated financial statements for further discussion of these and other significant accounting policies.
Revenue Recognition
We recognize revenue when the earnings process is complete and when persuasive evidence of an arrangement exists, transfer of title has occurred or services have been rendered, the selling price is fixed or determinable, collectability is reasonably assured, and delivery has occurred per the terms of the contract. Customer deposits and other receipts are deferred and recognized when the revenue is realized and earned.
In some instances, products are sold under terms included in bill and hold sales arrangements that result in different timing for revenue recognition. Assuming the required revenue recognition criteria are met, revenue is recognized upon completion of product manufacture and customer acceptance.
38
Warranty Liability
We provide warranty terms that range from two to seven years for various products relating to workmanship and materials supplied by us. From time to time, customers may submit warranty claims to us. In certain contracts, we have recourse provisions for items that would enable recovery from third parties for amounts paid to customers under warranty provisions. As of December 31, 2009 and 2008, our estimated product warranty liability was $918 and $890, respectively, and is recorded within accrued liabilities in our consolidated balance sheets.
Inventories
Inventories are stated at the lower of cost or market. We have recorded a reserve for excess of cost over market value in our inventory allowance. Market value of inventory, and management's judgment of the need for reserves, encompasses consideration of other business factors including physical condition, inventory holding period, contract terms, and usefulness. Inventories are valued based on an average cost method that approximates the first-in, first-out (FIFO) basis.
Inventories consist of raw materials, work-in-process, and finished goods. Raw materials consist of components and parts for general production use. Work-in-process consists of labor and overhead, processing costs, purchased subcomponents, and materials purchased for specific customer orders. Finished goods consist of components purchased from third parties as well as components manufactured by us that will be used to produce final customer products.
Goodwill and Intangible Assets
Goodwill represents the excess of cost over fair market value of identifiable net assets acquired through business purchases. We perform our annual goodwill impairment test during the fourth quarter of each year, or more frequently when events or circumstances indicate that the carrying value of our assets may not be recovered. We test intangible assets for impairment when events or circumstances indicate that the carrying value of our assets may not be recovered. In evaluating the recoverability of the carrying value of goodwill and other intangible assets, we must make assumptions regarding the fair value of our reporting units. Our method of determining the fair value is based upon our estimate of the projected future discounted cash flows of our reporting units.
If our fair value estimates or related assumptions change in the future, we may be required to record additional impairment charges related to goodwill and intangible assets.
Long-Lived Assets
We review property and equipment and other long-lived assets for impairment whenever events or circumstances indicate that carrying amounts may not be recoverable. If such events or changes in circumstances occur, we will recognize an impairment loss if the undiscounted future cash flows expected to be generated by the asset are less than the carrying value of the related asset. The impairment loss would adjust the asset to its fair value.
In evaluating the recoverability of long-lived assets, we must make assumptions regarding estimated future cash flows and other factors to determine the fair value of such assets. If our fair value estimates or related assumptions change in the future, we may be required to record impairment charges related to property and equipment and long-lived assets.
Income Taxes
We account for income taxes based upon an asset and liability approach. Deferred tax assets and liabilities represent the future tax consequences of the differences between the financial statement carrying amounts of assets and liabilities versus the tax basis of assets and liabilities. Under this
39
method, deferred tax assets are recognized for deductible temporary differences, and operating loss and tax credit carryforwards. Deferred tax liabilities are recognized for taxable temporary differences. Deferred tax assets are reduced by a valuation allowance when, in the opinion of management, it is more likely than not that some portion or all of the deferred tax assets will not be realized. The impact of tax rate changes on deferred tax assets and liabilities is recognized in the year that the change is enacted.
In connection with the preparation of our consolidated financial statements, we are required to estimate our income tax liability for each of the tax jurisdictions in which we operate. This process involves estimating our actual current income tax expense and assessing temporary differences resulting from differing treatment of certain income or expense items for income tax reporting and financial reporting purposes. We also recognize the expected future income tax benefits of net operating loss carryforwards as deferred income tax assets. In evaluating the realizability of deferred income tax assets associated with net operating loss carryforwards, we consider, among other things, expected future taxable income, the expected timing of the reversals of existing temporary reporting differences, and the expected impact of tax planning strategies that may be implemented to prevent the potential loss of future income tax benefits. Changes in, among other things, income tax legislation, statutory income tax rates, or future taxable income levels could materially impact our valuation of income tax assets and liabilities and could cause our income tax provision to vary significantly among financial reporting periods.
We also account for the uncertainty in income taxes related to the recognition and measurement of a tax position taken or expected to be taken in an income tax return. We follow the applicable pronouncement guidance on derecognition, classification, interest and penalties, accounting in interim periods, disclosure, and transition related to the uncertainty in these income tax positions.
Recent Accounting Pronouncements
Fair Value Measurements
In January 2009, we adopted guidance related to fair value measurements pertaining to non-financial assets and liabilities on a prospective basis. This guidance establishes the authoritative definition of fair value, sets out a framework for measuring fair value and expands the required disclosures about fair value measurement.
The majority of our non-financial assets, which include goodwill, intangible assets and property and equipment, are not required to be carried at fair value on a recurring basis. However, if certain triggering events occur (or at least annually for goodwill) such that a non-financial asset is required to be evaluated for impairment, a resulting asset impairment would require that the non-financial asset be recorded at the lower of historical cost or fair value. The adoption of this standard did not have a material impact on our financial position, results of operations, or cash flows.
Business Combinations
In January 2009, we adopted the guidance related to the accounting for business combinations and applying such provisions prospectively to business combinations that will have an acquisition date on or after January 1, 2009. This guidance establishes principles and requirements for how an acquirer in a business combination (i) recognizes and measures in its financial statements the identifiable assets acquired, the liabilities assumed, and any noncontrolling interest in the acquiree, (ii) recognizes and measures goodwill acquired in a business combination or a gain from a bargain purchase and (iii) determines what information to disclose to enable users of financial statements to evaluate the nature and financial effects of the business combination. In addition, changes in accounting for deferred tax asset valuation allowances and acquired income tax uncertainties after purchase accounting is completed will be recognized in earnings rather than as an adjustment to the cost of an acquisition.
40
This accounting treatment for deferred tax asset valuation allowances and acquired income tax uncertainties is applicable to acquisitions that occurred both prior and subsequent to the adoption of this guidance. The adoption of this standard did not have any impact on our financial position, results of operations, or cash flows.
Derivative Instruments and Hedging Activities
In January 2009, we adopted the guidance related to disclosure about derivative instruments and hedging activities. This guidance is intended to enhance required disclosures regarding derivatives and hedging activities, including enhanced disclosures regarding how: (a) an entity uses derivative instruments; (b) derivative instruments and related hedged items are accounted for; and (c) derivative instruments and related hedged items affect an entity's financial position, financial performance and cash flows. The adoption of this standard did not have a material impact on our financial position, results of operations, or cash flows.
Subsequent Events
In June 2009, we adopted the guidance related to the accounting for subsequent events. This guidance establishes the accounting for and disclosure of events that occur after the balance sheet date but before financial statements are issued or are available to be issued. This guidance requires that subsequent events be evaluated through the date that the financial statements are issued. The adoption of this standard did not have a material impact on our financial position, results of operations, or cash flows.
Accounting Standards Codification
The Financial Accounting Standards Board (the "FASB") implemented the FASB Accounting Standards Codification (the "Codification") effective July 1, 2009. The Codification became the source of authoritative GAAP recognized by FASB to be applied to nongovernmental entities. Rules and interpretive releases of the SEC under authority of federal securities laws are also sources of authoritative GAAP for SEC registrants. On the effective date of the Codification, the Codification superseded all then-existing non-SEC accounting and reporting standards. All other non-grandfathered non-SEC accounting literature not included in the Codification became non-authoritative. Following the effective date of the Codification, FASB will not release new standards in the form of Statements, FASB Staff Positions or Emerging Issues Task Force abstracts, but instead will issue Accounting Standards Updates ("ASU's"). ASU's are not considered authoritative in their own right, but serve only to update the Codification, provide background information about the guidance and provide the basis for conclusions on the changes in the Codification. The ASU's issued by FASB that are applicable to us are as follows:
In October 2009, FASB issued ASU 2009-13 Revenue Recognition (Topic 605). ASU 2009-05 provides accounting and financial reporting disclosure amendments for multiple-deliverable revenue arrangements. ASU 2009-13 is effective prospectively for revenue arrangements entered into or materially modified in fiscal years beginning on or after June 15, 2010. The adoption of this ASU is not anticipated to have a material impact on our financial position or results of operations.
LIQUIDITY, FINANCIAL POSITION AND CAPITAL RESOURCES
At December 31, 2009, cash and cash equivalents totaled $4,829, compared to our cash and cash equivalents which totaled $15,253 at December 31, 2008. In light of the weak economic conditions, in particular with respect to the wind and energy related markets, we implemented a number of initiatives to monitor and conserve our liquidity to ensure that we have adequate internal and external cash resources available to meet current and future operating requirements. Among these initiatives, we are
41
continuing to focus our efforts on cash management, which has included more stringent controls on capital spending, improvements in our collection of accounts receivable, renegotiating or extending credit terms for firm purchase commitments and trade payables, and entering into new financing or debt agreements. We also undertook a series of workforce reduction initiatives throughout the organization to better align our resources to the current production demands from our customers.
In October 2009, we filed a registration statement on Form S-1 to issue an additional 10,000,000 shares of our common stock. On January 21, 2010, we completed our public offering of Company common stock at an offering price of $5.75 per share, raising net proceeds of approximately $53,900. In the offering we sold 10,000,000 newly issued shares. After the completion of this offering, we repaid all outstanding indebtedness under the BOA Debt Facilities and the ICB Line in the aggregate amount of $19,142. The repayment of the indebtedness due to Bank of America released us from the related financial covenants and debt service requirements, eliminated the costs and professional fees associated with future amendments to the related debt agreements and improved our liquidity. We also intend to establish a senior credit facility in 2010 to enable us to support our working capital requirements as the wind market recovers and our sales increase
During 2009, we entered into several financing arrangements to improve our liquidity and cash positions. In April 2009, Tower Tech entered into a sale-leaseback agreement with Varilease Finance, Inc. ("Varilease") under which Varilease agreed to provide equipment financing in the amount of $2,935 (the "Varilease Financing"). Proceeds from the Varilease Financing are being used for working capital and other general corporate operating needs. In addition, Tower Tech obtained construction financing from Great Western in the amount of up to $10,000 under the Construction Loan (defined below), of which borrowings of $5,503 were outstanding at December 31, 2009. Proceeds from the Construction Loan were used to finance construction of our new wind tower manufacturing facility in Brandon, South Dakota. In September 2009, Badger obtained from General Electric Capital Corporation a term loan in the principal amount of approximately $1,000. Proceeds from this loan were used for working capital and other general operating needs. In addition, we made several favorable amendments to our credit facility with Bank of America.
As of February 28, 2010, debt credit agreements and capital lease obligations totaled $18,722, of which $3,842 represents our minimum debt service and capital lease payments for 2010. Additionally, we have cash balances of approximately $31,701 as of February 28, 2010. Our ability to make scheduled payments on our debt and other financial obligations will depend on our future financial and operating performance. While we believe that we will continue to have sufficient cash flows to operate our businesses, there can be no assurances that our operations will generate sufficient cash flows or that credit facilities will be available to us in an amount sufficient to enable us to pay our indebtedness or to fund our other liquidity needs.
Sources and Uses of Cash
Operating Cash Flows
During the year ended December 31, 2009, net cash flows provided by operating activities totaled $1,987, compared to net cash used in operating activities for the year ended December 31, 2008, which totaled $2,359. The increase in net cash provided by operating activities as compared to the prior year was attributable to a reduction in our accounts receivable and inventory balances, which was partially offset by a reduction in our accounts payable and customer deposits. The reduction in inventories was the result of the completion of contracts requiring a significant amount of raw materials and work-in-process on hand at the end of the prior year. The conversion during the current year of these inventory components into finished goods primarily within our Towers and Gearing segments resulted in higher collections of our accounts receivable balances and release of customer deposit balances. The reduction in accounts payable balances was the result of higher cash collections on accounts receivable, which we used to pay a significant amount of outstanding trade payables and accrued operating expenditures.
42
Investing Cash Flows
During the years ended December 31, 2009 and 2008, net cash flows used in investing activities totaled $12,520 and $106,696, respectively. The decrease in net cash used in investing activities as compared to the prior year was primarily attributable to a $71,884 reduction in capital expenditures and the absence of acquisitions during the current year. This reduction in capital expenditures was primarily the result of the completion in 2008 of a number of capital expansion projects associated with the construction and equipment purchases for our new wind tower manufacturing facility in Abilene, Texas, gearing equipment purchases, and the purchase of additional tractor trailers and transport vehicles for our Logistics segment. Capital expenditures of $11,836 during the year ended December 31, 2009 were primarily associated with construction and equipment purchases related to our Abilene, Texas and Brandon, South Dakota wind tower manufacturing facilities. Restricted cash increased $1,510 during the current year as a result of granting Great Western a security interest in a $2,000 collateral account in connection with the Construction Loan and the lapsing of $500 in restricted cash from a prior debt agreement.
Cash paid for acquisitions was zero during the year ended December 31, 2009, compared to $23,016 during the year ended December 31, 2008. In January 2008, we acquired EMS for $32,250, exclusive of $536 in acquisition related costs. The purchase price consisted of $18,429 in cash and 1,629,834 in unregistered shares of our common stock at a price per share of $8.48. In June 2008, we acquired Badger for $11,811, exclusive of $184 in acquisition related costs. The purchase price consisted of $5,811 in cash and 581,959 in unregistered shares of our common stock at a price per share of $10.31.
Financing Cash Flows
During the year ended December 31, 2009, net cash provided by financing activities totaled $109 compared to $118,526 during 2008. The amount in 2008 included approximately $117,389 in private equity placements completed. To finance the purchase price of the EMS acquisition, we completed a private equity placement offering in January 2008 with TP and T25 for an aggregate amount of $17,225, or 2,031,250 shares of our unregistered common stock at a price per share of $8.48, pursuant to a previously disclosed Amended and Restated Securities Purchase Agreement. In addition, we completed transactions resulting in the sale of an aggregate of $100,500 of our unregistered common stock, of which $500, or 62,814 shares, was purchased by Charles H. Beynon, a member of our Board of Directors and an aggregate of $100,000, or 12,562,814 shares, were purchased by TCP, TP, T25 and TOF.
Contributing to the decrease in financing cash flows was a $5,622 increase in payments made on lines of credit and notes payable during the current year. Payments made on lines of credit and notes payable increased from $7,702 during the year ended December 31, 2008, to $13,324 during the year ended December 31, 2009 as a result of higher debt payments made on the BOA Debt Facilities as required by amendments to these agreements in 2009. Proceeds from lines of credit and notes payable decreased from $9,315 during the year ended December 31, 2008 to $8,480 during the year ended December 31, 2009.
Credit Facilities
Brad Foote
In connection with our acquisition of Brad Foote in October 2007, we assumed outstanding debt and available lines of credit totaling approximately $25,500 under various secured debt facilities (the "BOA Debt Facilities") with Bank of America. The BOA Debt Facilities were governed by a Loan and Security Agreement dated as of January 17, 1997 (as amended and/or restated, the "Loan Agreement"). On August 7, 2009, Brad Foote and Bank of America entered into the Third Omnibus
43
Amendment of the Loan Agreement. Pursuant to this amendment, Bank of America waived Brad Foote's violation of the financial covenants for the second quarter of 2009 and reset the covenants for the remainder of 2009 and 2010. Bank of America also waived certain administrative breaches related to record keeping, timely delivery of financial information and other matters. The interest rate was increased to the London Interbank Offered Rate ("LIBOR") plus 5%, with a 7% floor. On December 22, 2009, Brad Foote and Bank of America further amended the Loan Agreement so that the quarterly debt to EBITDA ratio for the quarter ended December 31, 2009, the cumulative revenue threshold for December 2009 and the cumulative EBITDA thresholds for January and February 2010 would no longer apply. As of December 31, 2009, the total principal amount outstanding under the BOA Debt Facilities was approximately $15,964 and the effective interest was 7%.
On January 22, 2010, (i) Brad Foote repaid all of the outstanding principal and interest under the BOA Debt Facilities in the aggregate amount of approximately $16,076 from proceeds of our recently completed public offering of common stock; and (ii) the BOA Debt Facilities were terminated.
Tower Tech
ICB Line and ICB Notes
In October 2007, Tower Tech obtained a secured line of credit (the "ICB Line") from Investors Community Bank in the amount of $2,500, which was increased to $5,500 on March 21, 2008. The ICB Line is secured by substantially all of the assets of Tower Tech. Draws on the ICB Line bear interest at a variable rate equal to the greater of (A) 6.0% or (B) 0.50% above prime. Pursuant to a Commercial Debt Modification Agreement dated as of October 22, 2008, Tower Tech and Investors Community Bank extended the maturity date of the ICB Line to April 22, 2009. In connection with the extension, we provided re-executed guaranties to Investors Community Bank for all debt owed by each of Tower Tech and RBA to Investors Community Bank. In addition, Tower Tech re-executed its guaranty for debts owed to Investors Community Bank by RBA, and RBA re-executed its guaranty for debts owed to Investors Community Bank by Tower Tech. We anticipated that each of Tower Tech and RBA would be in violation of certain financial covenants relating to net worth and debt to net worth ratio as of December 31, 2008. Tower Tech and RBA each received waivers on December 29, 2008 from Investors Community Bank for the anticipated violations. On March 13, 2009, Investors Community Bank agreed to extend the maturity date of the ICB Line to March 13, 2010 (the "ICB Line Extension Agreement"). Pursuant to the ICB Line Extension Agreement, Tower Tech agreed to establish new financial covenants with respect to minimum debt service coverage ratio and minimum tangible net worth. Tower Tech also agreed to maintain its primary deposit accounts with Investors Community Bank and that no additional loans or leases would be entered into by Tower Tech without the prior approval of Investors Community Bank.
On April 7, 2008, RBA executed four (4) promissory notes in favor of Investors Community Bank (the "ICB Notes"), in the aggregate principal amount of approximately $3,781, as follows: (i) a term note in the maximum principal amount of approximately $421, bearing interest at a per annum rate of 6.85%, with a maturity date of October 5, 2012; (ii) a term note in the maximum principal amount of $700, bearing interest at a per annum rate of 5.65%, with a maturity date of April 25, 2013; (iii) a term note in the maximum principal amount of $928, bearing interest at a per annum rate of 5.65%, with a maturity date of April 25, 2013; and (iv) a line of credit note in the maximum principal amount of $1,732, bearing interest at a per annum rate of 4.48% until May 1, 2008 and thereafter at LIBOR plus 1.75%, with a maturity date of April 5, 2009 (the "Line of Credit Note"). The ICB Notes provide for multiple advances, and were secured by substantially all of the assets of RBA.
Pursuant to the merger of RBA into Tower Tech on December 31, 2009, Tower Tech became the successor by merger to RBA's interest in the loans from Investors Community Bank to RBA evidenced by the ICB Notes (other than the Line of Credit Note, which was repaid in full). In addition, pursuant
44
to a Master Amendment dated as of December 30, 2009 (the "ICB Master Amendment") among Investors Community Bank, Tower Tech and Broadwind (as guarantor), the amount of the ICB Line was increased to $6,500, subject to borrowing base availability. After giving effect to the merger of RBA into Tower Tech and the increase in the amount of the ICB Line, as of December 31, 2009: (i) Tower Tech had $1,402 available for additional borrowing under the ICB Line; (ii) the total amount of outstanding indebtedness under the ICB Line was $5,098 and the effective interest rate thereunder was 6%; (iii) the total amount of outstanding indebtedness under the ICB Notes was $1,625; and (iv) we were in compliance with all financial debt covenants. The Line of Credit Note was subsequently modified on March 13, 2009 to extend the maturity date to March 13, 2010 and to change the interest rate to the greater of (A) 5.0% or (B) prime.
Pursuant to the Master Amendment, among other provisions:
- •
- Tower Tech is required to maintain two financial debt covenants with Investors Community Bank. First, Tower Tech is required to maintain a minimum debt service coverage ratio of 1.25:1 at all times, tested quarterly using trailing 12 month financials. The coverage ratio is defined as the mathematical expression below measured with respect to Tower Tech:
net profit before taxes+depreciation and amortization+interest+impairment of goodwill
principal payments and interest payments+capital lease obligations
- •
- Tower Tech is also required to maintain a minimum tangible net worth (defined as the amount by which its total assets exceed total liabilities but excluding goodwill and other intangible assets) to be tested as follows:
| December 31, 2009 | $5.5 million | |
| January 31, 2010 | $5 million | |
| February 28, 2010 | $5 million |
- •
- Tower Tech also agreed to maintain its primary deposit accounts with Investors Community Bank and that no additional loans or leases would be entered into by Tower Tech without the prior approval of Investors Community Bank.
On January 26, 2010, Tower Tech repaid all of the outstanding indebtedness under the ICB Line in the amount of $3,066. The ICB Line is scheduled to expire on March 13, 2010, and Tower Tech does not intend to request an extension of the ICB Line prior to its expiration.
Great Western Construction Loan
On April 28, 2009 (the "Construction Loan Closing Date"), Tower Tech entered into a Construction Loan Agreement with Great Western, pursuant to which Great Western agreed to provide up to $10,000 in financing (the "Construction Loan") to fund construction of Tower Tech's wind tower manufacturing facility in Brandon, South Dakota (the "Facility"). On the Construction Loan Closing Date, Great Western agreed to advance $3,703 under the Construction Loan, representing amounts previously paid by Tower Tech relating to construction of the Facility. Subsequently, Tower Tech made additional draws under the Construction Loan relating to construction of the Facility. As of December 31, 2009, Tower Tech had received proceeds of approximately $5,503 under the Construction Loan and had the availability to borrow an additional $4,497.
On December 22, 2009, Tower Tech and Great Western agreed to extend the maturity date of the Construction Loan to March 5, 2010, and on February 16, 2010, Tower Tech and Great Western agreed to further extend the maturity date of the Construction Loan to April 5, 2010. We intend to convert the Construction Loan to a term loan on or before that date, pursuant to the conversion right described below.
45
The Construction Loan bears interest at a rate of 7.5% per annum on all advances. Tower Tech is required to make monthly payments of accrued and unpaid interest beginning June 5, 2009 and on the fifth day of each month thereafter, and must pay the outstanding principal and all accrued and unpaid interest on the maturity date, unless the Construction Loan is converted to a term loan as described below. Tower Tech was also required to pay a $100 origination fee on the Construction Loan Closing Date.
The Construction Loan is secured by a first mortgage on the Facility and all fixtures, accounts and proceeds relating thereto, pursuant to a Mortgage and a Commercial Security Agreement, each between Tower Tech and Great Western and entered into on the Construction Loan Closing Date. In addition, pursuant to an Assignment of Deposit Account entered into on the Construction Loan Closing Date, Tower Tech granted Great Western a security interest in a $2,000 deposit account. The Company also executed a Commercial Guaranty and entered into a Subordination Agreement in connection with the Construction Loan, under which it has agreed to guarantee Tower Tech's performance and to subordinate all intercompany debt with Tower Tech to the Construction Loan.
The Construction Loan may be accelerated under certain events of default (subject to applicable notice and cure provisions), including but not limited to: (i) failure to make any payment on the Construction Loan when due; (ii) failure to comply with or perform any covenants or conditions under the Construction Loan; (iii) failure to construct the Facility in accordance with the plans and specifications approved by Great Western or in accordance with the construction contracts relating to the Facility; and (iv) cessation of construction of the Facility. The Construction Loan contains representations, warranties and covenants that are customary to a construction financing arrangement and contains no financial covenants.
Pursuant to a Letter Agreement dated as of the Construction Loan Closing Date among Great Western, Tower Tech and the Company (as amended, the "Letter Agreement"), Tower Tech may, any time prior to April 5, 2010, convert the Construction Loan into a term loan for up to $6,500, with an interest rate not to exceed 8.5% per annum (the "Great Western Term Loan"). Tower Tech would be required to pay a 1.0% origination fee upon the conversion, and would be required to make monthly payments of principal and accrued interest over the life of the Great Western Term Loan, which would be not less than seventy-eight months. Following the conversion to the Great Western Term Loan, Great Western would retain its security position in the collateral given as security for the Construction Loan, except for the deposit account assigned pursuant to the Assignment of Deposit Account, which would be released upon conversion. All other customary terms and conditions would be mutually agreed upon by Great Western and Tower Tech at the time of conversion.
Badger
On March 13, 2009, Badger obtained a term loan (the "FNB Term Loan") from First National Bank ("FNB") in the principal amount of approximately $1,538. A portion of the proceeds from the FNB Term Loan was used to pay off Badger's existing term loan and revolving line of credit with FNB, with the remainder available for working capital. The FNB Term Loan is secured by the inventory, accounts receivable and certain equipment of Badger, and is guaranteed by the Company. The FNB Term Loan bears interest at a rate of 6.75% per annum, matures on March 13, 2013, and requires monthly payments of principal and interest. The FNB Term Loan contains no financial covenants. As of December 31, 2009, the total amount of outstanding indebtedness under the FNB Term Loan was $1,280.
On September 30, 2009, Badger obtained a term loan (the "GE Capital Term Loan") from General Electric Capital Corporation in the principal amount of approximately $1,000. The GE Capital Term Loan is secured by certain equipment of Badger, and is guaranteed by the Company. The GE Capital Term Loan bears interest at a rate of 7.76% per annum, matures on September 30, 2014, and
46
requires monthly payments of principal and interest. The GE Capital Term Loan contains no financial covenants. As of December 31, 2009, the total amount of outstanding indebtedness under the GE Capital Term Loan was $949.
Selling Shareholder Notes
On May 26, 2009, we entered into a settlement agreement (the "Settlement Agreement") with the former owners of Brad Foote (the "Selling Shareholders"), including J. Cameron Drecoll, our Chief Executive Officer and a member of our Board of Directors, related to the post-closing escrow established in connection with our acquisition of Brad Foote. Under the terms of the Settlement Agreement, among other terms, we issued three promissory notes to the Selling Shareholders in the aggregate principal amount of $3,000 (the "Selling Shareholder Notes"). The Selling Shareholder Notes mature on May 28, 2012 and bear interest at a rate of 7% per annum, with interest payments due quarterly. The Selling Shareholder Note issued to Mr. Drecoll in the principal amount of $2,320 and pursuant to the terms of the Settlement Agreement is deemed by us to be a related party transaction. As of December 31, 2009, principal of $3,000 and accrued interest of $53 were outstanding under the Selling Shareholder Notes. We have accounted for the Selling Shareholder Notes as long-term debt in our consolidated balance sheets as of December 31, 2009.
Contractual Obligations
The following table sets forth, as of December 31, 2009, minimum future cash payments due under contractual obligations, including, among others, our debt and credit agreements, non-cancelable operating and capital lease agreements and purchase commitments. Minimum future cash payments due under our debt and credit agreements reflect the repayment of outstanding indebtedness in the aggregate amount of $19,142 to Bank of America and Investors Community Bank in January 2010. In addition, outstanding indebtedness of $5,503 scheduled to mature on April 5, 2010 related to the Construction Loan is scheduled to be converted into a term loan on or before such maturity date, as described above.
| |
2010 | 2011 | 2012 | 2013 | 2014 | 2015 & Thereafter |
Total | |||||||||||||||
|---|---|---|---|---|---|---|---|---|---|---|---|---|---|---|---|---|---|---|---|---|---|---|
Debt and credit agreements(1) |
$ | 28,337 | $ | 1,584 | $ | 4,124 | $ | 1,297 | $ | 174 | $ | — | $ | 35,516 | ||||||||
Estimated interest payments(2) |
750 | 466 | 237 | 27 | 9 | — | 1,489 | |||||||||||||||
Operating lease obligations |
5,161 | 4,982 | 4,358 | 2,615 | 2,060 | 5,159 | 24,335 | |||||||||||||||
Capital lease obligations (3) |
1,482 | 1,385 | 1,349 | 983 | — | — | 5,199 | |||||||||||||||
Purchase commitments |
4,572 | — | — | — | — | — | 4,572 | |||||||||||||||
Total contractual cash obligations |
$ | 40,302 | $ | 8,417 | $ | 10,068 | $ | 4,922 | $ | 2,243 | $ | 5,159 | $ | 71,111 | ||||||||
- (1)
- Debt
and credit agreements represent the minimum future principal payments due under our outstanding contractual obligations. Assumptions used to derive
these amounts were based upon current interest rates as of December 31, 2009, required minimum principal payments due, maturity of our debt and credit agreements per our contractual agreements.
Actual interest payments could vary materially from those set out in this table.
- (2)
- Interest payments represent an amount calculated for expected interest payments due under our outstanding debt and credit agreements, including an adjustment to estimated interest payments associated with the repayment of outstanding indebtedness to Bank of America and Investors Community Bank in January 2010. Assumptions used to derive these amounts were based upon current interest rates as of December 31, 2009, required minimum principal payments due, maturity of our debt and credit agreements per our contractual agreements. Actual interest payments could vary materially from those set out in this table.
47
- (3)
- Capital lease obligations include both the future principal and interest payments related to these agreements.
Debt and Credit Agreements. Debt and credit agreements include outstanding borrowings under our lines of credit, term notes related to vehicle and equipment purchases, and notes payable related to an escrow agreement settlement and a purchase agreement for manufacturing equipment. See Note 10 "Debt and Credit Agreements" in Part IV, Item 15 in the notes to our consolidated financial statements for further discussion of our outstanding indebtedness and credit agreements.
Operating Lease Obligations. We lease the majority of our facilities and certain equipment under operating leases expiring at various dates through 2023. Lease terms generally range from two to 15 years with renewal options for extended terms. The amounts in the table above represent future minimum lease payments for non-cancelable operating leases.
Capital Lease Obligations. We have capital lease obligations related to certain manufacturing equipment and vehicles expiring at various dates through 2013. As of December 31, 2009, the balance of our outstanding capital lease obligations was approximately $5,199, which includes accrued interest of approximately $783.
Purchase Commitments. Purchase commitments represent remaining payments due on building purchase contracts related to the construction of our Brandon, South Dakota wind tower manufacturing facility and gearing equipment purchases.
Off-Balance Sheet Arrangements
During April 2009, Tower Tech entered into a sale-leaseback agreement with Varilease as described above, whereby Tower Tech sold certain equipment to Varilease in exchange for $2,935 in cash and agreed to lease the equipment back from Varilease for a certain period of time. The primary purpose of this arrangement was to provide additional liquidity for meeting working capital requirements. The lease agreement is for a three-year period with rental payments of $85 due monthly. In addition, the sale of the assets resulted in a gain on disposition of $40, which is being amortized to other income in our statement of operations over the life of the operating lease.
During March 2009, Badger entered into two sale-leaseback agreements, which consisted of one capital lease and one operating lease. As part of these agreements, Badger sold certain equipment to a third party financing company in exchange for $570 in cash and agreed to lease the equipment back from the purchaser for a certain period of time. The primary purpose of these arrangements was to provide additional liquidity for meeting working capital requirements. Each lease agreement is for a four-year period with rental payments due monthly. In addition, the sale of the assets resulted in a gain on disposition of $38, which is being amortized to other income in our statement of operations over the life of the operating lease.
ITEM 7A. QUANTITATIVE AND QUALITATIVE DISCLOSURES ABOUT MARKET RISK
We are exposed to financial market risks, which primarily include changes in interest rates on our variable rate obligations. We use various techniques to manage our market risk, including the use of derivative financial instruments. We do not use derivative financial instruments for speculative purposes.
Interest Rate Exposure
As of December 31, 2009, the majority of our third party borrowings under our debt and credit agreements bear annual interest at fixed interest rates as compared to higher outstanding borrowings under variable rate obligations in the prior year. The outstanding borrowings under these variable rate
48
obligations were $10,601 and $31,377 as of December 31, 2009 and 2008, respectively. Our potential interest rate exposure over a one year period that would result from a hypothetical, instantaneous and unfavorable change of 100 basis points in the interest rate of our variable rate obligations would be approximately $106 on a pre-tax basis.
In order to minimize our exposure to interest rate fluctuations related to certain of our variable interest rate obligations, we utilized two interest rate swap agreements. Our interest rate swap agreements involved the exchange of variable for fixed interest rates over the life of the debt obligation without the exchange of the underlying notional amounts. We did not elect hedge accounting treatment, and accordingly, the change in the fair value of the swap agreements was recognized in our consolidated results of operations. We reported an unrealized gain of $330 for the year ended December 31, 2009 compared to an unrealized loss of $194 and $153 for the years ended December 31, 2008 and 2007, respectively, and the fair market value of the swap agreements of $253 and $582 is recorded as a long-term liability in our consolidated balance sheets as of December 31, 2009 and 2008, respectively. Our potential derivative financial instrument exposure over a one year period that would result from a hypothetical, instantaneous and unfavorable change of 100 basis points in the interest rate associated with these respective swap agreements would be approximately $57 on a pre-tax basis.
In February 2010, subsequent to the repayment of our outstanding indebtedness to Bank of America, we settled both interest rate swap agreements for $270. See Note 13 "Interest Rate Swap Agreements" in Part IV, Item 15 in the notes to our consolidated financial statements for further discussion.
We estimate that the book value of our debt instruments and derivative financial instruments approximated their fair values as of December 31, 2009 and 2008. We believe that the exposure of our consolidated financial position and results of operations and cash flows to adverse changes in interest rates is not significant. Additionally, we believe that there are no significant counter party risks associated with our interest rate swap agreements.
Credit Risk Exposure
We are exposed to credit risk on our accounts receivable balances. Historically, our accounts receivable are highly concentrated with a select number of customers. During the years ended December 31, 2009, 2008 and 2007, sales to three or fewer customers accounted for approximately 50%, 72% and 70%, respectively, of consolidated revenues. Additionally, as of December 31, 2009, 2008 and 2007, three or fewer customers comprised approximately 21%, 61% and 63%, respectively, of our outstanding accounts receivable balances.
Commodity Risk Exposure
We are dependent upon the supply of certain raw materials used in our production processes, and these raw materials are exposed to price fluctuations on the open market. The primary raw material we use is steel. To reduce price risk caused by market fluctuations, we have incorporated price adjustment clauses in certain sales contracts. Management believes a hypothetical 10% change in the price of steel and other raw materials would not have a significant effect on our consolidated results of operations or cash flows because these costs are generally passed through to its customers.
ITEM 8. FINANCIAL STATEMENTS AND SUPPLEMENTARY DATA
The financial information required by Item 8 is contained in Part IV, Item 15 of this Annual Report on Form 10-K.
49
ITEM 9. CHANGES IN AND DISAGREEMENTS WITH ACCOUNTANTS ON ACCOUNTING AND FINANCIAL DISCLOSURE
None.
ITEM 9A. CONTROLS AND PROCEDURES
Evaluation of Disclosure Controls and Procedures
We maintain disclosure controls and procedures (as defined in Rules 13a-15(e) and 15d-15(e) under the Exchange Act) that are designed to ensure that information required to be disclosed in our reports filed under the Exchange Act is recorded, processed, summarized and reported within the time periods specified in the SEC's rules and forms. This information is also accumulated and communicated to management, including our Chief Executive Officer and Chief Financial Officer, as appropriate, to allow timely decisions regarding required disclosure. Our management, under the supervision and with the participation of our Chief Executive Officer and Chief Financial Officer, evaluated the effectiveness of the design and operation of our disclosure controls and procedures as of the end of the most recent fiscal quarter reported on herein. Based on that evaluation, our Chief Executive Officer and Chief Financial Officer concluded that our disclosure controls and procedures were not effective as of December 31, 2009 because of the material weakness discussed in the Report of Management on Internal Control Over Financial Reporting below.
Changes in Internal Control over Financial Reporting
We have made enhancements to our internal control structure to address our previously disclosed material weaknesses. We hired additional experienced and qualified financial professionals to strengthen our accounting and financial controls functions, implemented enhancements to our monthly financial reporting, developed enhancements to our overall reporting procedures and continued to enhance our control environment. The following enhancements were made to address our material weaknesses previously disclosed:
Inventory and Cost Accounting
As of December 31, 2008, material weaknesses with respect to inventory and cost accounting existed at our Brad Foote subsidiary. In response, management enhanced the control structure to remediate these material weaknesses, we hired additional personnel to assist in enhancing controls around cost accounting, performed quarterly physical inventory counts, enhanced procedures regarding timely reporting of inventory variances and continued to strengthen the internal controls over inventory and cost accounting. These changes were tested during the fourth quarter of 2009 and the controls were found to be effective.
Information Technology ("IT") Controls
As of December 31, 2008, we did not maintain effective internal control over information systems at Brad Foote. To remediate this weakness, enhancements were made to the control environment, including hiring a corporate IT manager and improving general computing controls. The enterprise resource planning ("ERP") system at Brad Foote is scheduled to be upgraded in 2010, which will continue to strengthen its internal controls. The ERP upgrade will allow better visibility into costing and inventory production planning. Based on testing during the fourth quarter of 2009, we believe that this material weakness has been remediated through the enhancements made in the inventory and cost accounting in addition to enhancements made to the IT controls.
50
Income Taxes
In conjunction with the filing of Amendment No. 2 on Form 10-Q/A for the quarter ended September 30, 2008, we identified a material weakness with respect to income taxes. In response, management enhanced the control structure to remediate this material weakness, whereby we conducted an independent review of our income tax provision, hired a tax professional to eliminate the outsourcing of this function and established enhanced interim controls surrounding our tax provision calculation. This remediation was tested during the fourth quarter of 2009 and found to be effective.
Badger Subsidiary
As of December 31, 2008, we identified material weaknesses with respect to internal financial expertise, accounting policies and procedures, IT environment and segregation of duties at our Badger subsidiary. In response, we enhanced the internal control structure to remediate these material weaknesses. We integrated Badger into our financial reporting structure, hired additional accounting and financial professionals, and integrated Badger's IT systems. As part of the new IT system integration, access controls were limited and are supplemented by other compensating controls where necessary. Where possible, we have established compensating controls to mitigate the risk presented by inadequate segregation of duties. In addition, we realigned certain personnel and security access rights, which remediated this material weakness.
Report of Management on Internal Control Over Financial Reporting
The management of the Company, including the Company's Chief Executive Officer and Chief Financial Officer, is responsible for establishing and maintaining adequate internal control over financial reporting (as defined in Rules 13a-15(f) and 15d-15(f) under the Exchange Act).
The management of the Company, including the Company's Chief Executive Officer and Chief Financial Officer, assessed the effectiveness of the Company's internal control over financial reporting as of December 31, 2009. Management based this assessment on criteria for effective internal control over financial reporting described in "Internal Control—Integrated Framework" issued by the Committee of Sponsoring Organizations of the Treadway Commission.
In conjunction with the filing of Amendment No. 2 on Form 10-Q/A for the quarter ended September 30, 2008, we identified a material weakness associated with the controls over non-routine revenue transactions, and the related accounting treatment of those transactions was appropriately reviewed to ensure compliance with GAAP. In response, management continued to enhance the control structure to address these material weaknesses; however, at our Brad Foote subsidiary, the controls implemented were not sufficient to fully remediate this material weakness as it related to our fourth quarter interim monthly financial statements.
Based on this assessment, management determined that, as of December 31, 2009, we did not maintain effective internal control over financial reporting due to the previously reported material weakness related to non-routine revenue transactions discussed above, which remained outstanding at December 31, 2009.
Grant Thornton LLP, an independent registered public accounting firm, who audited our consolidated financial statements included in this Annual Report on Form 10-K, has also audited the effectiveness of our internal control over financial reporting as stated in its report appearing below.
51
REPORT OF INDEPENDENT REGISTERED PUBLIC ACCOUNTING FIRM
To
the Board of Directors and
Stockholders of Broadwind Energy, Inc.
We have audited Broadwind Energy, Inc.'s (a Delaware Corporation) internal control over financial reporting as of December 31, 2009, based on criteria established in Internal Control—Integrated Framework issued by the Committee of Sponsoring Organizations of the Treadway Commission (COSO). Broadwind Energy, Inc.'s management is responsible for maintaining effective internal control over financial reporting and for its assessment of the effectiveness of internal control over financial reporting, included in the accompanying Management's Report on Internal Control over Financial Reporting. Our responsibility is to express an opinion on Broadwind Energy, Inc.'s internal control over financial reporting based on our audit.
We conducted our audit in accordance with the standards of the Public Company Accounting Oversight Board (United States). Those standards require that we plan and perform the audit to obtain reasonable assurance about whether effective internal control over financial reporting was maintained in all material respects. Our audit included obtaining an understanding of internal control over financial reporting, assessing the risk that a material weakness exists, testing and evaluating the design and operating effectiveness of internal control based on the assessed risk, and performing such other procedures as we considered necessary in the circumstances. We believe that our audit provides a reasonable basis for our opinion.
A company's internal control over financial reporting is a process designed to provide reasonable assurance regarding the reliability of financial reporting and the preparation of financial statements for external purposes in accordance with generally accepted accounting principles. A company's internal control over financial reporting includes those policies and procedures that (1) pertain to the maintenance of records that, in reasonable detail, accurately and fairly reflect the transactions and dispositions of the assets of the company; (2) provide reasonable assurance that transactions are recorded as necessary to permit preparation of financial statements in accordance with generally accepted accounting principles, and that receipts and expenditures of the company are being made only in accordance with authorizations of management and directors of the company; and (3) provide reasonable assurance regarding prevention or timely detection of unauthorized acquisition, use, or disposition of the company's assets that could have a material effect on the financial statements.
Because of its inherent limitations, internal control over financial reporting may not prevent or detect misstatements. Also, projections of any evaluation of effectiveness to future periods are subject to the risk that controls may become inadequate because of changes in conditions, or that the degree of compliance with the policies or procedures may deteriorate.
A material weakness is a deficiency, or combination of control deficiencies, in internal control over financial reporting, such that there is a reasonable possibility that a material misstatement of the company's annual or interim financial statements will not be prevented or detected on a timely basis. The following material weakness has been identified and included in management's assessment. The Company did not maintain effective internal control over accounting for non-routine revenue transactions.
In our opinion, because of the effect of the material weakness described above on the achievement of the objectives of the control criteria, Broadwind Energy, Inc., has not maintained effective internal control over financial reporting as of December 31, 2009, based on criteria established in Internal Control—Integrated Framework issued by COSO.
We also have audited, in accordance with the standards of the Public Company Accounting Oversight Board (United States), the consolidated balance sheets of Broadwind Energy, Inc. as of December 31, 2009 and 2008, and the related consolidated statements of operations, stockholders'
52
equity and cash flows for each of the three years in the period ended December 31, 2009. The material weakness identified above was considered in determining the nature, timing, and extent of audit tests applied in our audit of the 2009 consolidated financial statements, and this report does not affect our report dated March 12, 2010, which expressed an unqualified opinion on those financial statements.
/s/ GRANT THORNTON LLP
Milwaukee,
Wisconsin
March 12, 2010
53
None.
ITEM 10. DIRECTORS, EXECUTIVE OFFICERS AND CORPORATE GOVERNANCE
Directors and Executive Officers
With the exception of the description of our Code of Ethics below, the information required by this item is incorporated herein by reference from the discussion under the headings "Directors and Director Compensation," "Corporate Governance" and "Other Matters—Section 16(a) Beneficial Ownership Reporting Compliance" in our definitive Proxy Statement to be filed in connection with our 2010 Annual Meeting of Stockholders (the "2010 Proxy Statement").
Code of Ethics
We have adopted a Code of Ethics and Business Conduct that applies to all of our directors, executive officers and senior financial officers (including our chief executive officer, chief financial officer, chief accounting officer, controller, and any person performing similar functions). The Code of Ethics and Business Conduct is available on our website at www.broadwindenergy.com under the caption "Investors" and is available in print, free of charge, to any stockholder who sends a request for a paper copy to Broadwind Energy, Inc., Attn: Investor Relations, 47 East Chicago Avenue, Suite 332, Naperville, IL 60540. Broadwind intends to include on our website any amendment to, or waiver from, a provision of our Code of Ethics and Business Conduct that applies to our principal executive officer, principal financial officer, principal accounting officer or controller, or persons performing similar functions, that relates to any element of the code of ethics definition enumerated in Item 406(b) of Regulation S-K.
ITEM 11. EXECUTIVE COMPENSATION
Information regarding director and executive compensation is incorporated by reference from the discussion under the headings "Directors and Director Compensation" and "Compensation Discussion and Analysis" in the 2010 Proxy Statement.
ITEM 12. SECURITY OWNERSHIP OF CERTAIN BENEFICIAL OWNERS AND MANAGEMENT AND RELATED STOCKHOLDER MATTERS
Certain of the information required by this item is incorporated herein by reference from the discussion under the heading "Principal Stockholders and Management Stockholdings" in the 2010 Proxy Statement.
54
The following table provides information as of December 31, 2009, with respect to shares of our common stock that may be issued under our existing equity compensation plans:
EQUITY COMPENSATION PLAN INFORMATION
| |
(a) | (b) | (c) | ||||||||
|---|---|---|---|---|---|---|---|---|---|---|---|
Plan Category
|
Number of securities to be issued upon exercise of outstanding options, warrants, and rights |
Weighted-average exercise price of outstanding options, warrants, and rights |
Number of securities remaining available for future issuances under equity compensation plans (excluding securities reflected in column (a)) |
||||||||
Equity compensation plans approved by stockholders |
1,681,314 | (1) | $ | 10.69 | 3,563,235 | (2) | |||||
Total |
1,681,314 | $ | 10.69 | 3,563,235 | |||||||
- (1)
- Includes
outstanding stock options to purchase shares of our common stock and outstanding restricted stock awards pursuant to the Broadwind
Energy, Inc. Employee Incentive Plan ("EIP"), which was approved by our Board of Directors in October 2007 and by our stockholders in June 2008. The EIP was further amended in June 2009 to
increase the number of shares of common stock authorized for issuance under the EIP.
- (2)
- As amended, the EIP reserves a maximum amount of 5,500,000 shares of common stock for grants to officers, directors, consultants and other key employees.
ITEM 13. CERTAIN RELATIONSHIPS AND RELATED TRANSACTIONS, AND DIRECTOR INDEPENDENCE
The information required by this item is incorporated herein by reference from the discussion under the headings "Certain Transactions and Business Relationships" and "Corporate Governance" in our 2010 Proxy Statement.
ITEM 14. PRINCIPAL ACCOUNTANT FEES AND SERVICES
The information required by this item is incorporated herein by reference from the discussion under the heading "Ratification of Appointment of Independent Registered Public Accounting Firm" in our 2010 Proxy Statement.
ITEM 15. EXHIBITS AND FINANCIAL STATEMENT SCHEDULES
1. Financial Statements
The financial statements listed on the Index to Financial Statements (page 57) are filed as part of this Annual Report.
2. Financial Statement Schedules
These schedules have been omitted because the required information is included in the consolidated financial statements or notes thereto or because they are not applicable or not required.
3. Exhibits
The exhibits listed on the Index to Exhibits (pages 107 through 113) are filed as part of this Annual Report.
55
Pursuant to the requirements of Section 13 or 15(d) of the Securities Exchange Act of 1934, the registrant has duly caused this report to be signed on its behalf by the undersigned, thereunto duly authorized, on the 12th day of March, 2010.
| BROADWIND ENERGY, INC. | |||
By: |
/s/ J. CAMERON DRECOLL J. CAMERON DRECOLL Chief Executive Officer (Principal Executive Officer) |
||
Pursuant to the requirements of the Securities Exchange Act of 1934, this report has been signed below by the following persons on behalf of the registrant and in the capacities and on the dates indicated.
SIGNATURE
|
TITLE
|
DATE
|
||
|---|---|---|---|---|
| /s/ J. CAMERON DRECOLL J. Cameron Drecoll |
Chief Executive Officer and Director (Principal Executive Officer) |
March 12, 2010 | ||
/s/ STEPHANIE K. KUSHNER Stephanie K. Kushner |
Chief Financial Officer (Principal Financial Officer) |
March 12, 2010 |
||
/s/ KEVIN E. JOHNSON Kevin E. Johnson |
Corporate Controller and Chief Accounting Officer (Principal Accounting Officer) |
March 12, 2010 |
||
/s/ JAMES M. LINDSTROM James M. Lindstrom |
Director and Chairman of the Board |
March 12, 2010 |
||
/s/ DAVID P. REILAND David P. Reiland |
Director |
March 12, 2010 |
||
/s/ TERENCE P. FOX Terence P. Fox |
Director |
March 12, 2010 |
||
/s/ CHARLES H. BEYNON Charles H. Beynon |
Director |
March 12, 2010 |
||
/s/ WILLIAM T. FEJES, JR. William T. Fejes, Jr. |
Director |
March 12, 2010 |
56
57
REPORT OF INDEPENDENT REGISTERED PUBLIC ACCOUNTING FIRM
To
the Board of Directors and
Stockholders of Broadwind Energy, Inc.
We have audited the accompanying consolidated balance sheets of Broadwind Energy, Inc. (a Delaware corporation) as of December 31, 2009 and 2008, and the related consolidated statements of operations, stockholders' equity and cash flows for each of the three years in the period ended December 31, 2009. These financial statements are the responsibility of the Company's management. Our responsibility is to express an opinion on these financial statements based on our audits.
We conducted our audits in accordance with the standards of the Public Company Accounting Oversight Board (United States). Those standards require that we plan and perform the audit to obtain reasonable assurance about whether the financial statements are free of material misstatement. An audit includes examining, on a test basis, evidence supporting the amounts and disclosures in the financial statements. An audit also includes assessing the accounting principles used and significant estimates made by management, as well as evaluating the overall financial statement presentation. We believe that our audits provide a reasonable basis for our opinion.
In our opinion, the consolidated financial statements referred to above present fairly, in all material respects, the consolidated financial position of Broadwind Energy, Inc. as of December 31, 2009 and 2008, and the consolidated results of its operations and its cash flows for each of the three years in the period ended December 31, 2009 in conformity with accounting principles generally accepted in the United States of America.
We also audited, in accordance with the standards of the Public Company Accounting Oversight Board (United States), Broadwind Energy, Inc.'s internal control over financial reporting as of December 31, 2009, based on criteria established in Internal Control—Integrated Framework issued by the Committee of Sponsoring Organizations of the Treadway Commission (COSO), and our report dated March 12, 2010 expressed an adverse opinion on the Company's internal control over financial reporting.
/s/
GRANT THORNTON LLP
Milwaukee,
Wisconsin
March 12, 2010
58
BROADWIND ENERGY, INC. AND SUBSIDIARIES
CONSOLIDATED BALANCE SHEETS
(In thousands, except share data)
| |
As of December 31, | ||||||||
|---|---|---|---|---|---|---|---|---|---|
| |
2009 | 2008 | |||||||
| ASSETS | |||||||||
CURRENT ASSETS: |
|||||||||
Cash and cash equivalents |
$ | 4,829 | $ | 15,253 | |||||
Restricted cash |
2,010 | 500 | |||||||
Accounts receivable, net |
21,920 | 36,709 | |||||||
Inventories, net |
9,039 | 41,895 | |||||||
Prepaid expenses and other current assets |
5,688 | 3,862 | |||||||
Total current assets |
43,486 | 98,219 | |||||||
Property and equipment, net |
136,249 | 144,707 | |||||||
Goodwill |
9,715 | 30,954 | |||||||
Intangible assets, net |
37,248 | 105,593 | |||||||
Other assets |
3,338 | 275 | |||||||
TOTAL ASSETS |
$ | 230,036 | $ | 379,748 | |||||
|
|||||||||
CURRENT LIABILITIES: |
|||||||||
Lines of credit and notes payable |
$ | 10,717 | $ | 3,340 | |||||
Current maturities of long-term debt |
9,021 | 9,711 | |||||||
Current portions of capital lease obligations |
1,130 | 978 | |||||||
Accounts payable |
14,710 | 40,225 | |||||||
Accrued liabilities |
6,965 | 10,386 | |||||||
Customer deposits |
10,199 | 21,102 | |||||||
Total current liabilities |
52,742 | 85,742 | |||||||
LONG-TERM LIABILITIES: |
|||||||||
Long-term debt, net of current maturities |
15,778 | 25,792 | |||||||
Long-term capital lease obligations, net of current portions |
3,286 | 3,521 | |||||||
Interest rate swap agreements |
253 | 582 | |||||||
Deferred income tax liabilities |
403 | 1,497 | |||||||
Other |
1,979 | 458 | |||||||
Total long-term liabilities |
21,699 | 31,850 | |||||||
COMMITMENTS AND CONTINGENCIES |
|||||||||
STOCKHOLDERS' EQUITY: |
|||||||||
Preferred stock, $0.001 par value; 10,000,000 shares authorized; no shares issued or outstanding |
— | — | |||||||
Common stock, $0.001 par value; 150,000,000 shares authorized; 96,701,127 and 96,470,415 shares issued and outstanding as of December 31, 2009 and 2008, respectively |
97 | 96 | |||||||
Additional paid-in capital |
300,779 | 297,222 | |||||||
Accumulated deficit |
(145,281 | ) | (35,162 | ) | |||||
Total stockholders' equity |
155,595 | 262,156 | |||||||
TOTAL LIABILITIES AND STOCKHOLDERS' EQUITY |
$ | 230,036 | $ | 379,748 | |||||
The accompanying notes are an integral part of these consolidated financial statements.
59
BROADWIND ENERGY, INC. AND SUBSIDIARIES
CONSOLIDATED STATEMENTS OF OPERATIONS
(In thousands, except per share data)
| |
For the Years Ended December 31, | |||||||||||
|---|---|---|---|---|---|---|---|---|---|---|---|---|
| |
2009 | 2008 | 2007 | |||||||||
Revenues |
$ | 197,830 | $ | 217,321 | $ | 29,804 | ||||||
Cost of sales |
186,027 | 183,951 | 25,865 | |||||||||
Gross profit |
11,803 | 33,370 | 3,939 | |||||||||
OPERATING EXPENSES: |
||||||||||||
Selling, general and administrative |
34,825 | 41,545 | 5,724 | |||||||||
Goodwill and intangible impairment |
82,211 | 2,409 | — | |||||||||
Intangible amortization |
10,404 | 11,159 | 1,750 | |||||||||
Total operating expenses |
127,440 | 55,113 | 7,474 | |||||||||
Operating loss |
(115,637 | ) | (21,743 | ) | (3,535 | ) | ||||||
OTHER (EXPENSE) INCOME, net: |
||||||||||||
Interest expense, net |
(2,525 | ) | (2,276 | ) | (839 | ) | ||||||
Other, net |
6,454 | (204 | ) | (27 | ) | |||||||
Total other income (expense), net |
3,929 | (2,480 | ) | (866 | ) | |||||||
Net loss before (benefit) provision for income taxes |
(111,708 | ) | (24,223 | ) | (4,401 | ) | ||||||
(BENEFIT) PROVISION FOR INCOME TAXES |
(1,589 | ) | 1,062 | (1,039 | ) | |||||||
NET LOSS |
$ | (110,119 | ) | $ | (25,285 | ) | $ | (3,362 | ) | |||
NET LOSS PER COMMON SHARE—Basic and diluted |
$ |
(1.14 |
) |
$ |
(0.28 |
) |
$ |
(0.07 |
) |
|||
WEIGHTED AVERAGE COMMON SHARES OUTSTANDING—Basic and diluted |
96,574 |
89,899 |
51,535 |
|||||||||
The accompanying notes are an integral part of these consolidated financial statements.
60
BROADWIND ENERGY, INC. AND SUBSIDIARIES
CONSOLIDATED STATEMENTS OF STOCKHOLDERS' EQUITY
(In thousands, except share data)
| |
Common Stock | |
|
|
|
|||||||||||||||
|---|---|---|---|---|---|---|---|---|---|---|---|---|---|---|---|---|---|---|---|---|
| |
|
|
Interest in Variable Interest Entity |
|
||||||||||||||||
| |
Shares Issued and Outstanding |
Issued Amount |
Additional Paid-in Capital |
Accumulated Deficit |
Total | |||||||||||||||
BALANCE, December 31, 2006 |
35,235,500 | $ | 35 | $ | 1,261 | $ | (6,610 | ) | $ | — | $ | (5,314 | ) | |||||||
Stock issued for private placement to accredited investors, net of costs of $1,209 |
22,766,667 |
22 |
64,169 |
— |
— |
64,191 |
||||||||||||||
Stock issued for satisfaction of third-party debt |
1,500,000 | 2 | 2,248 | — | — | 2,250 | ||||||||||||||
Stock issued for satisfaction of related-party debt |
722,295 | 1 | 1,083 | — | — | 1,084 | ||||||||||||||
Stock issued for acquisition of Brad Foote Gear Works, Inc |
16,036,450 | 16 | 64,130 | — | — | 64,146 | ||||||||||||||
Share-based compensation |
— | — | 142 | — | — | 142 | ||||||||||||||
Capital contributions |
— | — | — | — | 1,399 | 1,399 | ||||||||||||||
Net loss |
— | — | — | (3,267 | ) | (95 | ) | (3,362 | ) | |||||||||||
BALANCE, December 31, 2007 |
76,260,912 | 76 | 133,033 | (9,877 | ) | 1,304 | 124,536 | |||||||||||||
Stock issued for restricted stock |
7,500 |
— |
— |
— |
— |
— |
||||||||||||||
Stock issued for the acquisition of Energy Maintenance Service, LLC |
1,629,834 | 2 | 13,819 | — | — | 13,821 | ||||||||||||||
Stock issued for the acquisition of Badger Transport, Inc |
581,959 | 1 | 5,999 | — | — | 6,000 | ||||||||||||||
Stock issued for the conversion of related-party notes |
3,333,332 | 3 | 24,997 | — | — | 25,000 | ||||||||||||||
Stock issued in private equity placements, net of costs of $336 |
14,656,878 | 14 | 117,375 | — | — | 117,389 | ||||||||||||||
Share-based compensation |
— | — | 1,999 | — | — | 1,999 | ||||||||||||||
Reclassification of variable interest entity |
— | — | — | — | (1,304 | ) | (1,304 | ) | ||||||||||||
Net loss |
— | — | — | (25,285 | ) | — | (25,285 | ) | ||||||||||||
BALANCE, December 31, 2008 |
96,470,415 | $ | 96 | $ | 297,222 | $ | (35,162 | ) | $ | — | $ | 262,156 | ||||||||
Stock issued under stock option plans |
91,940 |
— |
675 |
— |
— |
675 |
||||||||||||||
Stock issued for restricted stock |
129,715 | 1 | — | — | — | 1 | ||||||||||||||
Stock issued under defined contribution 401(k) retirement savings plan |
9,057 | — | 76 | — | — | 76 | ||||||||||||||
Share-based compensation |
— | — | 2,806 | — | — | 2,806 | ||||||||||||||
Net loss |
— | — | — | (110,119 | ) | — | (110,119 | ) | ||||||||||||
BALANCE, December 31, 2009 |
96,701,127 | $ | 97 | $ | 300,779 | $ | (145,281 | ) | $ | — | $ | 155,595 | ||||||||
The accompanying notes are an integral part of these consolidated financial statements.
61
BROADWIND ENERGY, INC. AND SUBSIDIARIES
CONSOLIDATED STATEMENTS OF CASH FLOWS
(In thousands)
| |
For the Years Ended December 31, | ||||||||||||
|---|---|---|---|---|---|---|---|---|---|---|---|---|---|
| |
2009 | 2008 | 2007 | ||||||||||
CASH FLOWS FROM OPERATING ACTIVITIES: |
|||||||||||||
Net loss |
$ | (110,119 | ) | $ | (25,285 | ) | $ | (3,362 | ) | ||||
Adjustments to reconcile net loss to net cash provided by (used in) operating activities: |
|||||||||||||
Depreciation and amortization expense |
25,725 | 21,866 | 3,523 | ||||||||||
Goodwill and intangible impairment |
82,211 | 2,409 | — | ||||||||||
Change in fair value of interest rate swap agreements |
(330 | ) | 194 | 153 | |||||||||
Deferred income taxes |
(1,094 | ) | 506 | 139 | |||||||||
Stock-based compensation |
1,870 | 1,785 | 142 | ||||||||||
Allowance for doubtful accounts |
137 | (1,703 | ) | 175 | |||||||||
(Gain) loss on disposal of assets |
162 | 113 | 2 | ||||||||||
Changes in operating assets and liabilities: |
|||||||||||||
Accounts receivable |
14,652 | (16,355 | ) | (4,963 | ) | ||||||||
Inventories |
32,856 | (28,419 | ) | 715 | |||||||||
Prepaid expenses and other current assets |
(508 | ) | (1,323 | ) | 453 | ||||||||
Accounts payable |
(25,014 | ) | 21,586 | 2,266 | |||||||||
Accrued liabilities |
(6,090 | ) | 2,656 | (259 | ) | ||||||||
Customer deposits |
(10,627 | ) | 19,674 | 1,029 | |||||||||
Other non-current assets and liabilities |
(1,844 | ) | (63 | ) | 508 | ||||||||
Net cash provided by (used in) operating activities |
1,987 | (2,359 | ) | 521 | |||||||||
CASH FLOWS FROM INVESTING ACTIVITIES: |
|||||||||||||
Cash paid for acquisitions, net of cash received |
— | (23,016 | ) | (76,474 | ) | ||||||||
Purchases of property and equipment |
(11,836 | ) | (83,720 | ) | (5,854 | ) | |||||||
Proceeds from disposals of property and equipment |
826 | 40 | — | ||||||||||
Increase in restricted cash |
(1,510 | ) | — | (500 | ) | ||||||||
Net cash used in investing activities |
(12,520 | ) | (106,696 | ) | (82,828 | ) | |||||||
CASH FLOWS FROM FINANCING ACTIVITIES: |
|||||||||||||
Proceeds from issuance of stock |
751 | 117,389 | 65,400 | ||||||||||
Payments on lines of credit and notes payable |
(13,324 | ) | (6,337 | ) | (6,292 | ) | |||||||
Payments on related party notes payable |
— | (1,365 | ) | — | |||||||||
Proceeds from lines of credit and notes payable |
8,480 | 9,315 | 29,042 | ||||||||||
Proceeds from capital and sale-leaseback transactions |
3,686 | — | — | ||||||||||
Proceeds from deposits on equipment |
665 | — | — | ||||||||||
Principal payments on capital leases |
(1,085 | ) | (690 | ) | (186 | ) | |||||||
Issuance of restricted stock grants |
936 | 214 | — | ||||||||||
Net cash provided by financing activities |
109 | 118,526 | 87,964 | ||||||||||
NET (DECREASE) INCREASE IN CASH AND CASH EQUIVALENTS |
(10,424 |
) |
9,471 |
5,657 |
|||||||||
CASH AND CASH EQUIVALENTS, beginning of the year |
15,253 | 5,782 | 125 | ||||||||||
CASH AND CASH EQUIVALENTS, end of the year |
$ | 4,829 | $ | 15,253 | $ | 5,782 | |||||||
Supplemental cash flow information: |
|||||||||||||
Interest paid, net of capitalized interest |
$ | 2,200 | $ | 2,969 | $ | 783 | |||||||
Income taxes paid |
$ | 585 | $ | 65 | $ | — | |||||||
Non-cash investing and financing activities: |
|||||||||||||
Common stock issued for acquisitions |
$ | — | $ | 19,821 | $ | 64,146 | |||||||
Conversion of related party notes payable to equity |
$ | — | $ | 25,000 | $ | 2,758 | |||||||
Issuance of restricted stock grants |
$ | 936 | $ | 214 | $ | — | |||||||
The accompanying notes are an integral part of these consolidated financial statements.
62
BROADWIND ENERGY, INC. AND SUBSIDIARIES
NOTES TO CONSOLIDATED FINANCIAL STATEMENTS
December 31, 2009, 2008, and 2007
(in
thousands, except share and per share data)
1. DESCRIPTION OF BUSINESS AND SUMMARY OF SIGNIFICANT ACCOUNTING POLICIES
Description of Business
Broadwind Energy, Inc. (the "Company") is an independent, horizontally integrated supplier of customized products and services to the U.S. wind industry. Our product and service portfolio provides our customers, including wind turbine manufacturers, wind farm developers and wind farm operators, with access to a broad array of wind component and service offerings. The Company is also a manufacturer of gearing systems and wind towers for the wind industry. The Company also provides technical service and precision repair and engineering and specialized logistics to the wind industry in the United States.
The Company has a limited history of operations and has incurred operating losses since inception. The Company anticipates that current cash resources and cash to be generated from operations in 2010 will be adequate to meet the Company's liquidity needs for at least the next twelve months. As discussed further in Note 10, "Debt and Credit Agreements" of these consolidated financial statements, the Company repaid outstanding indebtedness in the amount of $16,076 and $3,066 to Bank of America and Investors Community Bank, respectively, in January 2010. The repayment of the indebtedness due to Bank of America and Investors Community Bank released the Company from the related financial covenants and debt service requirements and improved the Company's liquidity position. However, if sales and subsequent collections from several of the Company's large customers, as well as revenues generated from new customer orders, are not materially consistent with management's plans, the Company may encounter cash flow and liquidity issues. Additional funding may not be available when needed or on terms acceptable to the Company. Furthermore, if the Company is unable to obtain additional capital, the Company will likely be required to delay, reduce the scope of or eliminate our plans for expansion and growth, and this could affect our overall operations. Any additional equity financing, if available, may be dilutive to stockholders, and additional debt financing, if available, will likely require financial covenants or other restrictions on the Company.
As of December 31, 2009, the Company had four subsidiaries which consisted of Brad Foote Gear Works, Inc. ("Brad Foote"), Tower Tech Systems Inc. ("Tower Tech"), Energy Maintenance Service, LLC ("EMS") and Badger Transport, Inc. ("Badger"). In December 2009, the Company merged the operations of its R.B.A., Inc. ("RBA") subsidiary into Tower Tech.
In December 2009, the Company revised its reporting segment presentation into four reportable operating segments: Towers, Gearing, Technical and Engineering Services, and Logistics. Accordingly, all current and prior period financial results have been revised to reflect these changes. See Note 19 "Segment Reporting" of these consolidated financial statements for further discussion of our reportable segments.
Towers
The Company manufactures wind towers, specifically the large and heavier wind towers that are designed for 2 megawatt ("MW") and larger wind turbines. Our production facilities are strategically located in close proximity to the primary U.S. wind resource regions, sited in Wisconsin and Texas, with a recently constructed third wind tower manufacturing facility in Brandon, South Dakota, which will
63
BROADWIND ENERGY, INC. AND SUBSIDIARIES
NOTES TO CONSOLIDATED FINANCIAL STATEMENTS (Continued)
December 31, 2009, 2008, and 2007
(in thousands, except share and per share data)
1. DESCRIPTION OF BUSINESS AND SUMMARY OF SIGNIFICANT ACCOUNTING POLICIES (Continued)
become operational as business warrants and pending the installation of certain additional equipment. The Company also manufactures other specialty weldments and structures for industrial customers.
Gearing
The Company manufactures precision gearing systems for the wind industry in North America and products for industrial markets including mining and oilfield equipment, with plants in Illinois and Pennsylvania. The Company uses an integrated manufacturing process, which includes our machining process in Cicero, Illinois, our heat treatment process in Neville Island, Pennsylvania and our finishing process in our Cicero factory.
Technical and Engineering Services
The Company is an independent service provider of construction support and operations and maintenance services to the wind industry. Our specialty services include oil change-out, up-tower tooling for gearing systems, drive-train and blade repairs and component replacement. Our construction support capabilities include assembly of towers, nacelles, blades and other components. The Company also provides customer support, preventive maintenance and wind technician training. Our technicians utilize our regional service centers for storage and repair of parts as well as for training. Through our precision repair and engineering services, the Company repairs and refurbishes complex wind components, including control systems, gearboxes and blades. The Company also conducts warranty inspections, commissions turbines and provides technical assistance. Additionally, the Company builds replacement control panels for kilowatt ("kW") class wind turbines and repair both kW and MW blades. Our service locations are in Illinois, California, South Dakota, Texas and Colorado.
Logistics
The Company offers specialized transportation, permitting and logistics management to the wind industry for oversize and overweight machinery and equipment. The Company delivers complete turbines to the installation site, including blades, nacelles and tower sections for final erection. The Company focuses on the project management of the delivery of complete wind turbine farms.
Summary of Significant Accounting Policies
Principles of Consolidation and Basis of Presentation
These consolidated financial statements include the accounts of Broadwind and its wholly-owned subsidiaries. All significant intercompany transactions and balances have been eliminated in consolidation. The results of operations of all acquired businesses have been consolidated for all periods subsequent to the date of acquisition.
64
BROADWIND ENERGY, INC. AND SUBSIDIARIES
NOTES TO CONSOLIDATED FINANCIAL STATEMENTS (Continued)
December 31, 2009, 2008, and 2007
(in thousands, except share and per share data)
1. DESCRIPTION OF BUSINESS AND SUMMARY OF SIGNIFICANT ACCOUNTING POLICIES (Continued)
Reclassifications
Where appropriate, certain reclassifications have been made to prior years' financial statements to conform to the current year presentation.
Management's Use of Estimates
The preparation of financial statements in conformity with accounting principles generally accepted in the U.S. ("GAAP") requires management to make certain estimates and assumptions that affect the reported amounts of assets and liabilities and the disclosure of contingent liabilities as of the date of the financial statements and reported amounts of revenues and expenses during the reported period. Significant estimates, among others, include revenue recognition, future tax rates, inventory reserves, warranty reserves, stock option fair value, allowance for doubtful accounts, and allocation of purchase price to the fair value of net assets and liabilities acquired in connection with business combinations. Although these estimates are based upon management's best knowledge of current events and actions that the Company may undertake in the future, actual results could differ from these estimates.
Cash and Cash Equivalents
Cash and cash equivalents primarily consist of cash balances and money market funds. Cash and cash equivalents were $4,829 and $15,253 as of December 31, 2009 and 2008, respectively. The Company's policy is to invest excess cash in money market account funds, which are generally of a short-term duration based upon operating requirements. Income earned on these investments is recorded to interest income in our consolidated statements of operations. For the years ended December 31, 2009, 2008 and 2007, interest income was $123, $584 and $400, respectively. Additionally, the Company is currently evaluating its risk management policies in terms of the potential impact of any significant credit risk associated with cash deposits at various financial institutions which are in excess of federally insured amounts.
Restricted Cash
Restricted cash consists of cash down payments pertaining to certain contracts under which the use of such cash is restricted as per the terms of the agreement. As of December 31, 2009 and 2008, the Company had restricted cash in the amounts of $2,010 and $500, respectively.
Revenue Recognition
The Company recognizes revenue when the earnings process is complete and when persuasive evidence of an arrangement exists, transfer of title has occurred or services have been rendered, the selling price is fixed or determinable, collectability is reasonably assured, and delivery has occurred per the terms of the contract. Customer deposits, deferred revenue, and other receipts are deferred and recognized when the revenue is realized and earned.
65
BROADWIND ENERGY, INC. AND SUBSIDIARIES
NOTES TO CONSOLIDATED FINANCIAL STATEMENTS (Continued)
December 31, 2009, 2008, and 2007
(in thousands, except share and per share data)
1. DESCRIPTION OF BUSINESS AND SUMMARY OF SIGNIFICANT ACCOUNTING POLICIES (Continued)
In some instances, products are sold under terms included in bill and hold sales arrangements that result in different timing for revenue recognition. Assuming the required revenue recognition criteria are met, revenue is recognized upon completion of product manufacture and customer acceptance.
Cost of Sales
Cost of sales represents all direct and indirect costs associated with the production of products for sale to customers. These costs include operation, repair and maintenance of our equipment, direct and indirect labor and benefit costs, insurance, equipment rentals, freight in, and depreciation. Freight out to customers is classified as a selling expense and is excluded from cost of sales. For the years ended December 31, 2009, 2008 and 2007, freight out was $11, $235 and $65, respectively.
Accounts Receivable
The Company generally grants uncollateralized credit to customers on an individual basis based upon the customer's financial condition and credit history. Credit is typically on net 30-day terms and customer deposits are frequently required at various stages of the production process to minimize credit risk.
Historically, our corresponding accounts receivable are highly concentrated with a select number of customers. During the years ended December 31, 2009, 2008 and 2007, sales to three or fewer customers accounted for approximately 50%, 72% and 70%, respectively, of consolidated revenues. In addition, as of December 31, 2009 and 2008, three or fewer customers comprised approximately 21% and 61%, respectively, of our total outstanding accounts receivable balances.
Allowance for Doubtful Accounts
Based upon past experience and judgment, the Company establishes an allowance for doubtful accounts with respect to accounts receivable. Our standard allowance estimation methodology considers a number of factors that, based on our collections experience, the Company believes will have an impact on our credit risk and the realizability of our accounts receivable. These factors include individual customer circumstances, history with the Company, and other relevant criteria.
The Company monitors our collections and write-off experience to assess whether or not adjustments to our allowance percentage estimates are necessary. Changes in trends in any of the factors that the Company believes may impact the realizability of our accounts receivable, as noted above, or modifications to our credit standards, collection practices and other related policies may impact our allowance for doubtful accounts and our financial results. Bad debt expense for the years ended December 31, 2009, 2008 and 2007 was $1,544, $1,196 and $2,983, respectively.
Inventories
Inventories are stated at the lower of cost or market. Any excess of cost over market value is included in the Company's inventory allowance. Market value of inventory, and management's
66
BROADWIND ENERGY, INC. AND SUBSIDIARIES
NOTES TO CONSOLIDATED FINANCIAL STATEMENTS (Continued)
December 31, 2009, 2008, and 2007
(in thousands, except share and per share data)
1. DESCRIPTION OF BUSINESS AND SUMMARY OF SIGNIFICANT ACCOUNTING POLICIES (Continued)
judgment of the need for reserves, encompasses consideration of other business factors including physical condition, inventory holding period, contract terms and usefulness. Inventories are valued based on an average cost method that approximates the first-in, first-out (FIFO) basis.
Inventories consist of raw materials, work-in-process and finished goods. Raw materials consist of components and parts for general production use. Work-in-process consists of labor and overhead, processing costs, purchased subcomponents and materials purchased for specific customer orders. Finished goods consist of components purchased from third parties as well as components manufactured by the Company that will be used to produce final customer products.
Property and Equipment
Property and equipment are stated at cost less accumulated depreciation. Depreciation is recognized using the straight-line method over the estimated useful lives of the related assets for financial reporting purposes and an accelerated method for income tax reporting purposes. Expenditures for additions and improvements are capitalized, while replacements, maintenance and repairs that do not improve or extend the useful lives of the respective assets are expensed as incurred. The Company capitalizes interest costs incurred on indebtedness used to construct property, plant and equipment. Capitalized interest is recorded as part of the asset to which it relates and is amortized over the asset's estimated useful life. Interest cost capitalized was $465, $230 and $18 for the years ended December 31, 2009, 2008 and 2007, respectively. Property or equipment sold or disposed of is removed from the respective property accounts, with any corresponding gains and losses recorded to other income or expense in our consolidated statement of operations.
Goodwill and Intangible Assets
Goodwill and intangible assets are reviewed for impairment on at least an annual basis by applying a fair value based test. In evaluating the recoverability of the carrying value of goodwill and other intangible assets, the Company must make assumptions regarding the fair values of our reporting units. Our estimate of the fair value of each of our reporting units is based primarily on projected future operating results and cash flows and other assumptions. The failure of a reporting unit to achieve projected future operating results and cash flows, or adjustments to other valuation assumptions, could change our estimate of reporting unit fair value, in which case the Company may be required to record an impairment charge related to goodwill and other intangible assets.
Warranty Liability
The Company provides warranty terms that range from two to seven years for various products relating to workmanship and materials supplied by the Company. From time to time, customers may submit warranty claims against the Company. In certain contracts, the Company has recourse provisions for items that would enable recovery from third parties for amounts paid to customers under warranty provisions. As of December 31, 2009 and 2008, our estimated product warranty liability was $918 and $890, respectively, and is recorded within accrued liabilities in our consolidated balance sheets.
67
BROADWIND ENERGY, INC. AND SUBSIDIARIES
NOTES TO CONSOLIDATED FINANCIAL STATEMENTS (Continued)
December 31, 2009, 2008, and 2007
(in thousands, except share and per share data)
1. DESCRIPTION OF BUSINESS AND SUMMARY OF SIGNIFICANT ACCOUNTING POLICIES (Continued)
The changes in the carrying amount of the Company's total product warranty liability for the years ended December 31, 2009 and 2008 were as follows:
| |
As of December 31, | ||||||
|---|---|---|---|---|---|---|---|
| |
2009 | 2008 | |||||
Balance, beginning of year |
$ | 890 | $ | 242 | |||
Warranty expense |
591 | 648 | |||||
Warranty claims |
(563 | ) | — | ||||
Balance, end of year |
$ | 918 | $ | 890 | |||
Income Taxes
The Company accounts for income taxes based upon an asset and liability approach. Deferred tax assets and liabilities represent the future tax consequences of the differences between the financial statement carrying amounts of assets and liabilities versus the tax basis of assets and liabilities. Under this method, deferred tax assets are recognized for deductible temporary differences, and operating loss and tax credit carryforwards. Deferred tax liabilities are recognized for taxable temporary differences. Deferred tax assets are reduced by a valuation allowance when, in the opinion of management, it is more likely than not that some portion or all of the deferred tax assets will not be realized. The impact of tax rate changes on deferred tax assets and liabilities is recognized in the year that the change is enacted.
In connection with the preparation of our consolidated financial statements, the Company is required to estimate our income tax liability for each of the tax jurisdictions in which the Company operates. This process involves estimating our actual current income tax expense and assessing temporary differences resulting from differing treatment of certain income or expense items for income tax reporting and financial reporting purposes. The Company also recognizes as deferred income tax assets the expected future income tax benefits of net operating loss carryforwards. In evaluating the realizability of deferred income tax assets associated with net operating loss carryforwards, the Company considers, among other things, expected future taxable income, the expected timing of the reversals of existing temporary reporting differences, and the expected impact of tax planning strategies that may be implemented to prevent the potential loss of future income tax benefits. Changes in, among other things, income tax legislation, statutory income tax rates, or future taxable income levels could materially impact our valuation of income tax assets and liabilities and could cause our income tax provision to vary significantly among financial reporting periods.
The Company also accounts for the uncertainty in income taxes related to the recognition and measurement of a tax position taken or expected to be taken in an income tax return. The Company follows the applicable pronouncement guidance on derecognition, classification, interest and penalties, accounting in interim periods, disclosure, and transition related to the uncertainty in these income tax positions.
68
BROADWIND ENERGY, INC. AND SUBSIDIARIES
NOTES TO CONSOLIDATED FINANCIAL STATEMENTS (Continued)
December 31, 2009, 2008, and 2007
(in thousands, except share and per share data)
1. DESCRIPTION OF BUSINESS AND SUMMARY OF SIGNIFICANT ACCOUNTING POLICIES (Continued)
Interest Rate Swap Agreements
The Company periodically uses derivative financial instruments in the form of interest rate swaps to minimize the effect of interest rate fluctuations on certain of our outstanding debt agreements. Our derivative financial instruments are recognized on our consolidated balance sheet at fair value. These derivatives do not qualify for hedge accounting treatment and, accordingly, all gains or losses on the change in the fair value of these derivative financial instruments are reported in our consolidated statements of operations.
Share-Based Compensation
The Company grants incentive stock options and restricted stock units to certain officers, directors, employees and consultants. The Company accounts for share-based compensation related to these awards based on the estimated fair value of the equity award and recognize expense ratably over the vesting term of the award. See Note 18 "Share-Based Compensation" of these consolidated financial statements for further discussion of our share-based compensation plans, the nature of share-based awards issued and our accounting for share-based compensation.
Net Income (Loss) Per Share
The Company presents both basic and diluted net income (loss) per share. Basic net income (loss) per share is based solely upon the weighted average number of common shares outstanding and excludes any dilutive effects of options, warrants and convertible securities. Diluted net income (loss) per share is based upon the weighted average number of common shares and common-share equivalents outstanding during the year excluding those common-share equivalents where the impact to basic net income (loss) per share would be anti-dilutive.
69
BROADWIND ENERGY, INC. AND SUBSIDIARIES
NOTES TO CONSOLIDATED FINANCIAL STATEMENTS (Continued)
December 31, 2009, 2008, and 2007
(in thousands, except share and per share data)
2. EARNINGS PER SHARE
The following table presents a reconciliation of basic and diluted earnings per share for the years ended December 31, 2009, 2008 and 2007 as follows:
| |
For the Years Ended December 31, | ||||||||||
|---|---|---|---|---|---|---|---|---|---|---|---|
| |
2009 | 2008 | 2007 | ||||||||
Basic earnings per share calculation: |
|||||||||||
Net loss to common stockholders |
$ | (110,119 | ) | $ | (25,285 | ) | $ | (3,362 | ) | ||
Weighted average of common shares outstanding |
96,574 | 89,899 | 51,535 | ||||||||
Basic net loss per share |
$ | (1.14 | ) | $ | (0.28 | ) | $ | (0.07 | ) | ||
Diluted earnings per share calculation: |
|||||||||||
Net loss to common stockholders |
$ | (110,119 | ) | $ | (25,285 | ) | $ | (3,362 | ) | ||
Weighted average of common shares outstanding |
96,574 | 89,899 | 51,535 | ||||||||
Common stock equivalents: |
|||||||||||
Stock options and non-vested stock awards(1) |
— | — | — | ||||||||
Convertible promissory note(2) |
— | — | — | ||||||||
Weighted average of common shares outstanding |
96,574 | 89,899 | 51,535 | ||||||||
Diluted net loss per share |
$ | (1.14 | ) | $ | (0.28 | ) | $ | (0.07 | ) | ||
- (1)
- Stock
options and restricted stock units granted and outstanding of 1,681,314; 2,157,500; and 965,000 as of December 31, 2009, 2008 and 2007,
respectively, are excluded from the computation of diluted earnings due to the anti-dilutive effect as a result of the Company's net loss for these respective years.
- (2)
- Common stock equivalents of 685,000 with respect to the conversion feature of the senior subordinated convertible promissory notes outstanding as of December 31, 2007 were excluded from the computation of diluted earnings due to the anti-dilutive effect as a result of the Company's net loss for the year ended December 31, 2007. The convertible promissory notes were converted into shares of the Company's common stock on April 4, 2008. See Note 16 "Stockholders' Equity" of these consolidated financial statements for further discussion regarding this and other equity related transactions.
3. BUSINESS ACQUISITIONS
2008 Acquisitions
Energy Maintenance Service, LLC
On January 16, 2008, the Company acquired all of the outstanding membership interests in EMS, a South Dakota based company engaged in construction support, engineering and maintenance services for the wind energy industry. The aggregate purchase price was $32,250, excluding $536 of transaction related costs. The purchase price consisted of $18,429 of cash and 1,629,834 unregistered shares of the Company's common stock at a price per share of $8.48. The Company entered into a registration rights agreement with the former owners of EMS which provides the former owners with demand and piggyback registration rights. The cash portion of the purchase price was financed by a private placement of the Company's common stock. See Note 16 "Stockholders' Equity" of these consolidated financial statements for further discussion.
70
BROADWIND ENERGY, INC. AND SUBSIDIARIES
NOTES TO CONSOLIDATED FINANCIAL STATEMENTS (Continued)
December 31, 2009, 2008, and 2007
(in thousands, except share and per share data)
3. BUSINESS ACQUISITIONS (Continued)
The following table summarizes the estimated fair values of the EMS assets acquired and liabilities assumed on the date of the acquisition:
Current assets |
$ | 4,712 | |||
Property and equipment |
1,549 | ||||
Intangible—trade name |
1,790 | ||||
Intangible—customer relationships |
24,700 | ||||
Goodwill |
4,561 | ||||
Total assets acquired |
37,312 | ||||
Current liabilities |
(3,545 | ) | |||
Long term liabilities |
(981 | ) | |||
Total purchase consideration |
$ | 32,786 | |||
Goodwill of $4,561 and other intangibles of $26,490 are expected to be deductible for income tax purposes over 15 years. The Company does not have any contingent payments or commitments in relation to the acquisition of EMS, with the exception of certain stock options that were awarded as a result of the acquisition.
Badger Transport, Inc.
On June 4, 2008, the Company acquired all of the outstanding shares of Badger, a Wisconsin based provider of transportation services for oversized/overweight equipment and machinery, primarily to the wind industry, for an aggregate purchase price of $11,811, excluding $184 of transaction related acquisition costs. The purchase price consisted of $5,811 of cash and 581,959 unregistered shares of Broadwind common stock at a price per share of $10.31. The Company entered into a registration rights agreement with the former owner of Badger that provides the former owner with limited piggyback registration rights. The Company financed the cash portion of the acquisition with cash on hand.
71
BROADWIND ENERGY, INC. AND SUBSIDIARIES
NOTES TO CONSOLIDATED FINANCIAL STATEMENTS (Continued)
December 31, 2009, 2008, and 2007
(in thousands, except share and per share data)
3. BUSINESS ACQUISITIONS (Continued)
The following table summarizes the estimated fair values of the Badger assets acquired and liabilities assumed on the date of the acquisition:
Current assets |
$ | 1,496 | |||
Property and equipment |
5,232 | ||||
Intangible—trade name |
370 | ||||
Intangible—customer relationships |
4,380 | ||||
Intangible—non-compete agreement |
1,490 | ||||
Goodwill |
5,154 | ||||
Total assets acquired |
18,122 | ||||
Current liabilities |
(2,178 | ) | |||
Capital lease obligations |
(1,052 | ) | |||
Long term debt |
(2,544 | ) | |||
Deferred tax liability |
(353 | ) | |||
Total purchase consideration |
$ | 11,995 | |||
Goodwill and intangible assets associated with the purchase of Badger are not expected to be deductible for income tax purposes. In connection with the Badger acquisition, the Company was required to and completed funding of approximately $4,400 of equipment purchases that Badger had on order for expansion. The Company has funded $4,384 of this commitment which is complete.
Pro Forma Financial Information
The following table represents the consolidated financial information for the Company on a pro forma basis, assuming that the acquisitions of Brad Foote, EMS and Badger had occurred as of January 1, 2007. The Company is excluding the pro forma results of the RBA acquisition because the impact of this acquisition is not material to our consolidated results of operations for the year ended December 31, 2007. The historical financial information has been adjusted to give effect to pro forma items that are directly attributable to the acquisition and expected to have a continuing impact on the consolidated results. These items include, among others, adjustments to increase depreciation related to the stepped-up basis in machinery and equipment, adjust inventory to fair market value, record amortization of intangible assets, increase interest expense for certain long-term notes payable, and reclassify certain items to conform to the Company's financial reporting presentation. Additionally, the following table sets forth unaudited financial information and has been compiled from historical financial statements and other information, but is not necessarily indicative of the results that actually
72
BROADWIND ENERGY, INC. AND SUBSIDIARIES
NOTES TO CONSOLIDATED FINANCIAL STATEMENTS (Continued)
December 31, 2009, 2008, and 2007
(in thousands, except share and per share data)
3. BUSINESS ACQUISITIONS (Continued)
would have been achieved had the transactions occurred on the dates indicated or that may be achieved in the future.
| |
For the Year Ended December 31, | |||||||||||||||||||
|---|---|---|---|---|---|---|---|---|---|---|---|---|---|---|---|---|---|---|---|---|
| |
2008 | 2007 | ||||||||||||||||||
| |
As reported |
Pro-forma adjustments (Unaudited) |
Pro-forma (Unaudited) |
As reported |
Pro-forma adjustments (Unaudited) |
Pro-forma (Unaudited) |
||||||||||||||
Revenues |
$ | 217,321 | $ | 5,710 | $ | 223,031 | $ | 29,804 | $ | 95,565 | $ | 125,369 | ||||||||
Net loss |
(25,285 | ) | (1,826 | ) | (27,111 | ) | (3,362 | ) | (6,501 | ) | (9,863 | ) | ||||||||
Loss per share |
||||||||||||||||||||
Basic and diluted |
($ | 0.28 | ) | ($ | 0.02 | ) | ($ | 0.30 | ) | ($ | 0.07 | ) | ($ | 0.12 | ) | ($ | 0.19 | ) | ||
4. RECENT ACCOUNTING PRONOUNCEMENTS
Fair Value Measurements
In January 2009, the Company adopted the guidance related to fair value measurements pertaining to non-financial assets and liabilities on a prospective basis. This guidance establishes the authoritative definition of fair value sets out a framework for measuring fair value and expands the required disclosures about fair value measurements.
The majority of the Company's non-financial assets, which include goodwill, intangible assets and property and equipment, are not required to be carried at fair value on a recurring basis. However, if certain triggering events occur (or at least annually for goodwill) such that a non-financial asset is required to be evaluated for impairment, a resulting asset impairment would require that the non-financial asset be recorded at the lower of historical cost or fair value. The adoption of this standard did not have a material impact on our financial position, results of operations, or cash flows.
Business Combinations
In January 2009, the Company adopted the guidance related to the accounting for business combinations and applying such provisions prospectively to business combinations that will have an acquisition date on or after January 1, 2009. This guidance establishes principles and requirements for how an acquirer in a business combination (i) recognizes and measures in its financial statements the identifiable assets acquired, the liabilities assumed, and any noncontrolling interest in the acquiree, (ii) recognizes and measures goodwill acquired in a business combination or a gain from a bargain purchase and (iii) determines what information to disclose to enable users of financial statements to evaluate the nature and financial effects of the business combination. In addition, changes in accounting for deferred tax asset valuation allowances and acquired income tax uncertainties after purchase accounting is completed will be recognized in earnings rather than as an adjustment to the cost of an acquisition. This accounting treatment for deferred tax asset valuation allowances and acquired income tax uncertainties is applicable to acquisitions that occurred both prior and subsequent to the adoption of this guidance. The adoption of this standard did not have any impact on our financial position, results of operations, or cash flows.
73
BROADWIND ENERGY, INC. AND SUBSIDIARIES
NOTES TO CONSOLIDATED FINANCIAL STATEMENTS (Continued)
December 31, 2009, 2008, and 2007
(in thousands, except share and per share data)
4. RECENT ACCOUNTING PRONOUNCEMENTS (Continued)
Derivative Instruments and Hedging Activities
In January 2009, the Company adopted the guidance related to disclosure about derivative instruments and hedging activities. This guidance is intended to enhance required disclosures regarding derivatives and hedging activities, including enhanced disclosures regarding how: (a) an entity uses derivative instruments; (b) derivative instruments and related hedged items; and (c) derivative instruments and related hedged items affect an entity's financial position, financial performance and cash flows. The adoption of this standard did not have a material impact on our financial position, results of operations, or cash flows.
Subsequent Events
In June 2009, the Company adopted the guidance related to the accounting for subsequent events. This guidance establishes the accounting for and disclosure of events that occur after the balance sheet date but before financial statements are issued. This guidance requires that subsequent events be evaluated through the date that the financial statements are issued. The adoption of this standard did not have a material impact on our financial position, results of operations, or cash flows.
Accounting Standards Codification
The Financial Accounting Standards Board (the "FASB") implemented the FASB Accounting Standards Codification (the "Codification") effective July 1, 2009. The Codification became the source of authoritative GAAP recognized by FASB to be applied to nongovernmental entities. Rules and interpretive releases of the Securities and Exchange Commission ("SEC") under authority of federal securities laws are also sources of authoritative GAAP for SEC registrants. On the effective date of the Codification, the Codification superseded all then-existing non-SEC accounting and reporting standards. All other non-grandfathered non-SEC accounting literature not included in the Codification became non-authoritative. Following the effective date of the Codification, FASB will not release new standards in the form of Statements, FASB Staff Positions or Emerging Issues Task Force abstracts, but instead will issue Accounting Standards Updates ("ASU's"). ASU's are not considered authoritative in their own right, but serve only to update the Codification, provide background information about the guidance and provide the basis for conclusions on the changes in the Codification. The ASU's issued by FASB that are applicable to the Company are as follows:
In October 2009, FASB issued ASU 2009-13 Revenue Recognition (Topic 605). ASU 2009-05 provides accounting and financial reporting disclosure amendments for multiple-deliverable revenue arrangements. ASU 2009-13 is effective prospectively for revenue arrangements entered into or materially modified in fiscal years beginning on or after June 15, 2010. The adoption of this ASU is not anticipated to have a material impact on the Company's financial position or results of operations.
74
BROADWIND ENERGY, INC. AND SUBSIDIARIES
NOTES TO CONSOLIDATED FINANCIAL STATEMENTS (Continued)
December 31, 2009, 2008, and 2007
(in thousands, except share and per share data)
5. ALLOWANCE FOR DOUBTFUL ACCOUNTS
The activity in the accounts receivable allowance for the years ended December 31, 2009 and 2008 consists of the following:
| |
For the Years Ended December 31, | ||||||
|---|---|---|---|---|---|---|---|
| |
2009 | 2008 | |||||
Balance at beginning of year |
$ | 1,504 | $ | 2,983 | |||
Bad debt expense |
1,544 | 1,196 | |||||
Write-offs |
(613 | ) | (2,899 | ) | |||
Other(1) |
(794 | ) | 224 | ||||
Balance at end of year |
$ | 1,641 | $ | 1,504 | |||
- (1)
- "Other" for the year ended December 31, 2008 represents opening balance sheet allowances for doubtful accounts as part of the acquisitions of EMS and Badger in January 2008 and June 2008, respectively.
6. INVENTORIES
Inventories are stated at the lower of cost or market value and primarily consist of raw material, work-in-process, and finished goods. Work-in-process consists of labor and overhead, processing costs, purchased subcomponents and materials purchased for specific customer orders. Finished goods consist of components purchased from third parties as well as components manufactured by the Company that will be used to produce final customer products.
The components of inventories as of December 31, 2009 and 2008 are summarized as follows:
| |
As of December 31, | ||||||
|---|---|---|---|---|---|---|---|
| |
2009 | 2008 | |||||
Raw materials |
$ | 4,957 | $ | 16,429 | |||
Restricted raw material(1) |
— | 9,936 | |||||
Work-in-process |
2,921 | 16,226 | |||||
Finished goods |
3,338 | 401 | |||||
|
11,216 | 42,992 | |||||
Less: Reserve for excess and obsolete inventory |
(2,177 | ) | (1,097 | ) | |||
Net inventories |
$ | 9,039 | $ | 41,895 | |||
- (1)
- In December, 2008, Tower Tech entered into an agreement pursuant to which it agreed to convey to a customer ownership of certain raw materials (the "Bailment Materials") that Tower Tech had acquired for use in constructing wind turbine towers for such customer, in exchange for the release of a down payment of $9,936 paid by the customer pursuant to the terms of a purchase order. In connection with the transaction, the customer caused the release/cancellation of a letter of credit securing the down-payment (the "L/C") in
75
BROADWIND ENERGY, INC. AND SUBSIDIARIES
NOTES TO CONSOLIDATED FINANCIAL STATEMENTS (Continued)
December 31, 2009, 2008, and 2007
(in thousands, except share and per share data)
6. INVENTORIES (Continued)
order for the cash being held by the L/C issuer as security for the L/C to be released to Tower Tech. The customer also granted Tower Tech a security interest in a portion of the Bailment Materials in the event the purchase order is not fully performed by the customer for any reason other than the breach or default of Tower Tech. Tower Tech issued a new performance letter of credit in the amount of $500 as a guarantee of complete performance by Tower Tech of its obligations under the purchase order. The Bailment Materials were held by Tower Tech as a bailment for the sole and exclusive benefit and use of the customer, and were intended to be used by Tower Tech for construction of the wind turbine towers for such customer under the purchase order. As a result of this transaction, $9,436 was released from restricted cash and made available for other purposes. In December 2009, Tower Tech completed construction of the final wind turbine tower as part of the bailment agreement and was subsequently released from the performance letter of credit in the amount of $500.
7. PROPERTY AND EQUIPMENT
The cost basis and estimated lives of property and equipment as of December 31, 2009 and 2008 are as follows:
| |
As of December 31, | |
||||||
|---|---|---|---|---|---|---|---|---|
| |
2009 | 2008 | Life | |||||
Land |
$ | 4,018 | $ | 2,556 | ||||
Buildings |
23,501 | 6,456 | 39 years | |||||
Machinery and equipment |
105,070 | 94,019 | 5-10 years | |||||
Office furniture and equipment |
2,518 | 1,641 | 3-20 years | |||||
Leasehold improvements |
2,613 | 2,052 | Asset life or life of lease | |||||
Construction in progress |
26,510 | 51,004 | ||||||
|
164,230 | 157,728 | ||||||
Less-accumulated depreciation |
(27,981 | ) | (13,021 | ) | ||||
|
$ | 136,249 | $ | 144,707 | ||||
76
BROADWIND ENERGY, INC. AND SUBSIDIARIES
NOTES TO CONSOLIDATED FINANCIAL STATEMENTS (Continued)
December 31, 2009, 2008, and 2007
(in thousands, except share and per share data)
8. GOODWILL AND INTANGIBLE ASSETS
Changes in the carrying value of goodwill during the years ended December 31, 2009 and 2008 are as follows:
| |
Towers | Gearing | Technical and Engineering Services |
Logistics | Total | ||||||||||||
|---|---|---|---|---|---|---|---|---|---|---|---|---|---|---|---|---|---|
Goodwill balance as of December 31, 2007 |
$ | 2,409 | $ | 25,202 | $ | — | $ | — | $ | 27,611 | |||||||
Purchase accounting adjustments |
— | (3,963 | ) | — | — | (3,963 | ) | ||||||||||
Goodwill related to acquisitions |
— | — | 4,561 | 5,154 | 9,715 | ||||||||||||
Impairment charge |
(2,409 | ) | — | — | — | (2,409 | ) | ||||||||||
Goodwill balance as of December 31, 2008 |
— | 21,239 | 4,561 | 5,154 | 30,954 | ||||||||||||
Purchase accounting adjustments |
— | 3,030 | — | — | 3,030 | ||||||||||||
Impairment charge |
— | (24,269 | ) | — | — | (24,269 | ) | ||||||||||
Goodwill balance as of December 31, 2009 |
$ | — | $ | — | $ | 4,561 | $ | 5,154 | $ | 9,715 | |||||||
The increase in goodwill during 2008 in our Technical and Engineering Services and Logistics segments is related to the acquisition of EMS in January 2008 and Badger in June 2008. Purchase accounting adjustments of $3,963 were recorded in our Gearing segment during 2008 which related to adjustments to the fair value of certain machinery and equipment, recording additional acquisition related costs and purchase price adjustments incurred as a result of our acquisition of Brad Foote in October 2007. Additionally, the Company recorded an impairment charge of $2,409 in our Towers segment as a result of the annual impairment performed in October 2008. The impairment test indicated that the goodwill attributable to one of the operating business units within the Towers segment was impaired as a result of a projected decline in the discounted cash flows associated with this operating business.
The increase in goodwill in 2009 in the Gearing segment relates to purchase accounting adjustments of $3,030 recorded in connection with an escrow settlement agreement with the former owners of Brad Foote in May 2009.
The Company reviews goodwill balances for impairment on at least an annual basis through the application of a fair-value-based test. The Company reviews goodwill based on the carrying value of these assets as of October 31of each year and the estimate of fair-value for each of our operating segments is based primarily on projected future results, cash flows and other assumptions. The first step involves a comparison of the estimated fair value of a reporting unit to its carrying amount, including goodwill. In performing the first step, the Company determines the fair value of our reporting units using a combination of an income approach by preparing a discounted cash flow analysis and a market-based approach based on our market capitalization. If the estimated fair value of the reporting unit exceeds its carrying amount, goodwill of the reporting unit is not impaired and the second step of the impairment test is not necessary. If the carrying amount of a reporting unit exceeds its estimated fair value, then the second step of the goodwill impairment test must be performed. The second step of the goodwill impairment test compares the implied fair value of the reporting unit's goodwill with its carrying amount to measure the amount of impairment loss, if any. The implied fair value of goodwill
77
BROADWIND ENERGY, INC. AND SUBSIDIARIES
NOTES TO CONSOLIDATED FINANCIAL STATEMENTS (Continued)
December 31, 2009, 2008, and 2007
(in thousands, except share and per share data)
8. GOODWILL AND INTANGIBLE ASSETS (Continued)
is determined in the same manner as the amount of goodwill recognized in a business combination. As a result, the estimated fair value of the reporting unit is allocated to all of the assets and liabilities of that unit (including any unrecognized intangible assets) as if the reporting unit had been acquired in a business combination and the fair value of the reporting unit was the purchase price paid. If the carrying amount of the reporting unit's goodwill exceeds the implied fair value of that goodwill, an impairment loss is recognized in an amount equal to that excess.
The Company did not identify a triggering event during 2009 which would indicate an early assessment of goodwill impairment, however, upon the completion of our impairment analysis in March 2010, the Company determined that the goodwill balance attributable to our Gearing segment was impaired due to a deterioration in financial performance during 2009 and as a result of the subsequent revision in our projection of future operating results and cash flows in light of the effect of the continued economic downturn on the wind gearing industry. Accordingly, our analysis indicated that projected fair value of the Gearing segment assets did not exceed the carrying value of these net assets. Our method in determining the fair value was based upon our estimate of the projected future discounted cash flows of our reporting units. As a result, the Company recorded a goodwill impairment charge of $24,269 during the fourth quarter and the impairment charge was recorded to operating expenses in our consolidated statement of operations for the year ended December 31, 2009.
As of December 31, 2009 and 2008, the cost basis, accumulated amortization and net book value of intangible assets were as follows:
| |
December 31, 2009 | December 31, 2008 | |||||||||||||||||||||||||||
|---|---|---|---|---|---|---|---|---|---|---|---|---|---|---|---|---|---|---|---|---|---|---|---|---|---|---|---|---|---|
| |
Cost | Accumulated Amortization | Impairment Charge | Net Book Value | Weighted Average Amortization Period | Cost | Accumulated Amortization | Net Book Value | Weighted Average Amortization Period | ||||||||||||||||||||
Intangible assets: |
|||||||||||||||||||||||||||||
Customer relationships |
$ | 106,638 | $ | (21,332 | ) | $ | (57,835 | ) | $ | 27,471 | 10.4 | $ | 106,638 | $ | (11,939 | ) | $ | 94,699 | 10.2 | ||||||||||
Trade names |
10,279 | (1,099 | ) | (107 | ) | 9,073 | 20.0 | 10,279 | (585 | ) | 9,694 | 20.0 | |||||||||||||||||
Noncompete agreements |
1,490 | (786 | ) | — | 704 | 3.0 | 1,490 | (290 | ) | 1,200 | 3.0 | ||||||||||||||||||
Intangible assets |
$ | 118,407 | $ | (23,217 | ) | $ | (57,942 | ) | $ | 37,248 | 12.3 | $ | 118,407 | $ | (12,814 | ) | $ | 105,593 | 11.0 | ||||||||||
The increase in intangible assets in 2008 is related to the acquisitions of Badger and EMS. See Note 3 "Business Acquisitions" of these consolidated financial statements for further discussion of these respective acquisitions.
The Company reviews intangible assets and other long-lived assets for impairment whenever events or changes in circumstances indicate that the asset's carrying amount may not be recoverable. Due to the revision in our projections of operating results and cash flows within our Gearing segment during the fourth quarter, the Company deemed this a triggering event, and subsequently tested our intangible assets for impairment. The completion of our impairment analysis in March 2010 indicated that the customer relationship intangibles associated with our Gearing segment were impaired during the fourth quarter as a result of a decline in projected future operating results. The decline in our estimates of
78
BROADWIND ENERGY, INC. AND SUBSIDIARIES
NOTES TO CONSOLIDATED FINANCIAL STATEMENTS (Continued)
December 31, 2009, 2008, and 2007
(in thousands, except share and per share data)
8. GOODWILL AND INTANGIBLE ASSETS (Continued)
future operating results and corresponding discounted cash flows indicated that the fair value of these customer relationships were less than the carrying value of these assets. Additionally, the Company determined that the carrying value of our RBA trade name was impaired as a result of the merger of RBA's operations into our Towers segment in December 2009 and that RBA's customer relationship intangible was impaired due to a revision in projected revenues and cash flows associated with this customer relationship. Accordingly, the Company recorded an intangible impairment charge of $57,942 to properly reflect the carrying value of these assets. In the future, if our projected discounted cash flows associated with our operating segments do not exceed the carrying value of their net assets, the Company may be required to record additional write downs of the carrying value of our intangible assets.
Intangible assets are amortized on a straight-line basis over their estimated useful lives, which range from 3 to 20 years. Amortization expense was $10,404, $11,159 and $1,750 for the years ended December 31, 2009, 2008 and 2007, respectively. As of December 31, 2009, estimated future amortization expense is as follows:
2010 |
$ | 4,295 | ||
2011 |
4,005 | |||
2012 |
3,798 | |||
2013 |
3,798 | |||
2014 |
3,798 | |||
2015 and thereafter |
17,554 | |||
Total |
$ | 37,248 | ||
9. ACCRUED LIABILITIES
Accrued liabilities as of December 31, 2009 and 2008 consisted of the following:
| |
December 31, | ||||||
|---|---|---|---|---|---|---|---|
| |
2009 | 2008 | |||||
Accrued operating expenditures |
$ | 954 | $ | 1,110 | |||
Accrued payroll and benefits |
2,295 | 3,631 | |||||
Accrued capital expenditures |
— | 2,204 | |||||
Accrued professional fees |
1,067 | 514 | |||||
Accrued warranty liability |
918 | 890 | |||||
Accrued other |
1,731 | 2,037 | |||||
Total accrued liabilities |
$ | 6,965 | $ | 10,386 | |||
79
BROADWIND ENERGY, INC. AND SUBSIDIARIES
NOTES TO CONSOLIDATED FINANCIAL STATEMENTS (Continued)
December 31, 2009, 2008, and 2007
(in thousands, except share and per share data)
10. DEBT AND CREDIT AGREEMENTS
The Company's outstanding debt balances as of December 31, 2009 and 2008 consisted of the following:
| |
December 31, | ||||||
|---|---|---|---|---|---|---|---|
| |
2009 | 2008 | |||||
Lines of credit |
$ | 10,601 | $ | 10,831 | |||
Term loans and notes payable |
22,595 | 28,012 | |||||
Related party note |
2,320 | — | |||||
|
35,516 | 38,843 | |||||
Less—Current portion |
(19,738 | ) | (13,051 | ) | |||
Long-term debt, net of current maturities |
$ | 15,778 | $ | 25,792 | |||
As of December 31, 2009, future annual principal payments of our outstanding debt obligations were as follows:
2010(1) |
$ | 28,337 | ||
2011 |
1,584 | |||
2012 |
4,124 | |||
2013 |
1,297 | |||
2014 |
174 | |||
Total |
$ | 35,516 | ||
- (1)
- In January 2010, the Company repaid all outstanding indebtedness to Bank of America, which included approximately $8,600 that was classified as long-term debt, net of current maturities on our consolidated balance sheets as of December 31, 2009.
Credit Facilities
Brad Foote
In connection with our acquisition of Brad Foote in October 2007, the Company assumed outstanding debt and available lines of credit totaling approximately $25,500 under various secured debt facilities (the "BOA Debt Facilities") with Bank of America. The BOA Debt Facilities were governed by a Loan and Security Agreement dated as of January 17, 1997 (as amended and/or restated, the "Loan Agreement"). On August 7, 2009, Brad Foote and Bank of America entered into the Third Omnibus Amendment of the Loan Agreement. Pursuant to this amendment, Bank of America waived Brad Foote's violation of the financial covenants for the second quarter of 2009 and reset the covenants for the remainder of 2009 and 2010. Bank of America also waived certain administrative breaches related to record keeping, timely delivery of financial information and other matters. The interest rate was increased to the London Interbank Offered Rate ("LIBOR") plus 5%, with a 7% floor. On December 22, 2009, Brad Foote and Bank of America further amended the Loan Agreement so that the quarterly debt to EBITDA ratio for the quarter ended December 31, 2009, the cumulative revenue
80
BROADWIND ENERGY, INC. AND SUBSIDIARIES
NOTES TO CONSOLIDATED FINANCIAL STATEMENTS (Continued)
December 31, 2009, 2008, and 2007
(in thousands, except share and per share data)
10. DEBT AND CREDIT AGREEMENTS (Continued)
threshold for December 2009 and the cumulative EBITDA thresholds for January and February 2010 would no longer apply. As of December 31, 2009, the total principal amount outstanding under the BOA Debt Facilities was approximately $15,964 and the effective interest was 7%.
On January 22, 2010, (i) Brad Foote repaid all of the outstanding principal and interest under the BOA Debt Facilities in the aggregate amount of approximately $16,076 from proceeds of our recently completed public offering of common stock; and (ii) the BOA Debt Facilities were terminated.
Tower Tech
ICB Line and ICB Notes
In October 2007, Tower Tech obtained a secured line of credit (the "ICB Line") from Investors Community Bank in the amount of $2,500, which was increased to $5,500 on March 21, 2008. The ICB Line is secured by substantially all of the assets of Tower Tech. Draws on the ICB Line bear interest at a variable rate equal to the greater of (A) 6.0% or (B) 0.50% above prime. Pursuant to a Commercial Debt Modification Agreement dated as of October 22, 2008, Tower Tech and Investors Community Bank extended the maturity date of the ICB Line to April 22, 2009. In connection with the extension, the Company provided re-executed guaranties to Investors Community Bank for all debt owed by each of Tower Tech and RBA to Investors Community Bank. In addition, Tower Tech re-executed its guaranty for debts owed to Investors Community Bank by RBA, and RBA re-executed its guaranty for debts owed to Investors Community Bank by Tower Tech. The Company anticipated that each of Tower Tech and RBA would be in violation of certain financial covenants relating to net worth and debt to net worth ratio as of December 31, 2008. Tower Tech and RBA each received waivers on December 29, 2008 from Investors Community Bank for the anticipated violations. On March 13, 2009, Investors Community Bank agreed to extend the maturity date of the ICB Line to March 13, 2010 (the "ICB Line Extension Agreement"). Pursuant to the ICB Line Extension Agreement, Tower Tech agreed to establish new financial covenants with respect to minimum debt service coverage ratio and minimum tangible net worth. Tower Tech also agreed to maintain its primary deposit accounts with Investors Community Bank and that no additional loans or leases would be entered into by Tower Tech without the prior approval of Investors Community Bank.
On April 7, 2008, RBA executed four (4) promissory notes in favor of Investors Community Bank (the "ICB Notes"), in the aggregate principal amount of approximately $3,781, as follows: (i) a term note in the maximum principal amount of approximately $421, bearing interest at a per annum rate of 6.85%, with a maturity date of October 5, 2012; (ii) a term note in the maximum principal amount of $700, bearing interest at a per annum rate of 5.65%, with a maturity date of April 25, 2013; (iii) a term note in the maximum principal amount of $928, bearing interest at a per annum rate of 5.65%, with a maturity date of April 25, 2013; and (iv) a line of credit note in the maximum principal amount of $1,732, bearing interest at a per annum rate of 4.48% until May 1, 2008 and thereafter at LIBOR plus 1.75%, with a maturity date of April 5, 2009 (the "Line of Credit Note"). The Line of Credit Note was subsequently modified on March 13, 2009 to extend the maturity date to March 13, 2010 and to change the interest rate to the greater of (A) 5% or (B) prime. The ICB Notes provide for multiple advances, and were secured by substantially all of the assets of RBA.
81
BROADWIND ENERGY, INC. AND SUBSIDIARIES
NOTES TO CONSOLIDATED FINANCIAL STATEMENTS (Continued)
December 31, 2009, 2008, and 2007
(in thousands, except share and per share data)
10. DEBT AND CREDIT AGREEMENTS (Continued)
Pursuant to the merger of RBA into Tower Tech on December 31, 2009, Tower Tech became the successor by merger to RBA's interest in the loans from Investors Community Bank to RBA evidenced by the ICB Notes (other than the Line of Credit Note, which was repaid in full). In addition, pursuant to a Master Amendment dated as of December 30, 2009 (the "ICB Master Amendment") among Investors Community Bank, Tower Tech and Broadwind (as guarantor), the amount of the ICB Line was increased to $6,500, subject to borrowing base availability. After giving effect to the merger of RBA into Tower Tech and the increase in the amount of the ICB Line, as of December 31, 2009: (i) Tower Tech had $1,402 available for additional borrowing under the ICB Line; (ii) the total amount of outstanding indebtedness under the ICB Line was $5,098 and the effective interest rate thereunder was 6%; and (iii) the total amount of outstanding indebtedness under the ICB Notes was $1,625.
Pursuant to the Master Amendment, among other provisions:
- •
- Tower Tech is required to maintain two financial debt covenants with Investors Community Bank. First, Tower Tech is required to maintain a minimum debt service coverage ratio of 1.25:1 at all times, tested quarterly using trailing 12 month financials. The coverage ratio is defined as the mathematical expression below measured with respect to Tower Tech:
net profit before taxes+depreciation and amortization+interest+impairment of goodwill
principal payments and interest payments+capital lease obligations
- •
- Tower Tech is also required to maintain a minimum tangible net worth (defined as the amount by which its total assets exceed total liabilities but excluding goodwill and other intangible assets) to be tested as follows:
| December 31, 2009 | $5.5 million | |
| January 31, 2010 | $5 million | |
| February 28, 2010 | $5 million |
- •
- Tower Tech also agreed to maintain its primary deposit accounts with Investors Community Bank and that no additional loans or leases would be entered into by Tower Tech without the prior approval of Investors Community Bank.
On January 26, 2010, Tower Tech repaid all of the outstanding indebtedness under the ICB Line in the amount of $3,066. The ICB Line is scheduled to expire on March 13, 2010, and Tower Tech does not intend to request an extension of the ICB Line prior to its expiration.
Great Western Construction Loan
On April 28, 2009 (the "Construction Loan Closing Date"), Tower Tech entered into a Construction Loan Agreement with Great Western Bank ("Great Western"), pursuant to which Great Western agreed to provide up to $10,000 in financing (the "Construction Loan") to fund construction of Tower Tech's wind tower manufacturing facility in Brandon, South Dakota (the "Facility"). On the Construction Loan Closing Date, Great Western agreed to advance $3,703 under the Construction Loan, representing amounts previously paid by Tower Tech relating to construction of the Facility.
82
BROADWIND ENERGY, INC. AND SUBSIDIARIES
NOTES TO CONSOLIDATED FINANCIAL STATEMENTS (Continued)
December 31, 2009, 2008, and 2007
(in thousands, except share and per share data)
10. DEBT AND CREDIT AGREEMENTS (Continued)
Subsequently, Tower Tech made additional draws under the Construction Loan relating to construction of the Facility. As of December 31, 2009, Tower Tech had received proceeds of approximately $5,503 under the Construction Loan and had the availability to borrow an additional $4,497.
On December 22, 2009, Tower Tech and Great Western agreed to extend the maturity date of the Construction Loan to March 5, 2010, and on February 16, 2010, Tower Tech and Great Western agreed to further extend the maturity date of the Construction Loan to April 5, 2010. Tower Tech intends to convert the Construction Loan to a term loan on or before that date, pursuant to the conversion right described below.
The Construction Loan bears interest at a rate of 7.5% per annum on all advances. Tower Tech is required to make monthly payments of accrued and unpaid interest beginning June 5, 2009 and on the fifth day of each month thereafter, and must pay the outstanding principal and all accrued and unpaid interest on the maturity date, unless the Construction Loan is converted to a term loan as described below. Tower Tech was also required to pay a $100 origination fee on the Construction Loan Closing Date.
The Construction Loan is secured by a first mortgage on the Facility and all fixtures, accounts and proceeds relating thereto, pursuant to a Mortgage and a Commercial Security Agreement, each between Tower Tech and Great Western and entered into on the Construction Loan Closing Date. In addition, pursuant to an Assignment of Deposit Account entered into on the Construction Loan Closing Date, Tower Tech granted Great Western a security interest in a $2,000 deposit account. The Company also executed a Commercial Guaranty and entered into a Subordination Agreement in connection with the Construction Loan, under which it has agreed to guarantee Tower Tech's performance and to subordinate all intercompany debt with Tower Tech to the Construction Loan.
The Construction Loan may be accelerated under certain events of default (subject to applicable notice and cure provisions), including but not limited to: (i) failure to make any payment on the Construction Loan when due; (ii) failure to comply with or perform any covenants or conditions under the Construction Loan; (iii) failure to construct the Facility in accordance with the plans and specifications approved by Great Western or in accordance with the construction contracts relating to the Facility; and (iv) cessation of construction of the Facility. The Construction Loan contains representations, warranties and covenants that are customary to a construction financing arrangement and contains no financial covenants.
Pursuant to a Letter Agreement dated as of the Construction Loan Closing Date among Great Western, Tower Tech and the Company (as amended, the "Letter Agreement"), Tower Tech may, any time prior to April 5, 2010, convert the Construction Loan into a term loan for up to $6,500, with an interest rate not to exceed 8.5% per annum (the "Great Western Term Loan"). Tower Tech would be required to pay a 1.0% origination fee upon the conversion, and would be required to make monthly payments of principal and accrued interest over the life of the Great Western Term Loan, which would be not less than seventy-eight months. Following the conversion to the Great Western Term Loan, Great Western would retain its security position in the collateral given as security for the Construction Loan, except for the deposit account assigned pursuant to the Assignment of Deposit Account, which
83
BROADWIND ENERGY, INC. AND SUBSIDIARIES
NOTES TO CONSOLIDATED FINANCIAL STATEMENTS (Continued)
December 31, 2009, 2008, and 2007
(in thousands, except share and per share data)
10. DEBT AND CREDIT AGREEMENTS (Continued)
would be released upon conversion. All other customary terms and conditions would be mutually agreed upon by Great Western and Tower Tech at the time of conversion.
Badger
On March 13, 2009, Badger obtained a term loan (the "FNB Term Loan") from First National Bank ("FNB") in the principal amount of approximately $1,538. A portion of the proceeds from the FNB Term Loan was used to pay off Badger's existing term loan and revolving line of credit with FNB, with the remainder available for working capital. The FNB Term Loan is secured by the inventory, accounts receivable and certain equipment of Badger, and is guaranteed by the Company. The FNB Term Loan bears interest at a rate of 6.75% per annum, matures on March 13, 2013, and requires monthly payments of principal and interest. The FNB Term Loan contains no financial covenants. As of December 31, 2009, the total amount of outstanding indebtedness under the FNB Term Loan was $1,280.
On September 30, 2009, Badger obtained a term loan (the "GE Capital Term Loan") from General Electric Capital Corporation in the principal amount of approximately $1,000. The GE Capital Term Loan is secured by certain equipment of Badger, and is guaranteed by the Company. The GE Capital Term Loan bears interest at a rate of 7.76% per annum, matures on September 30, 2014, and requires monthly payments of principal and interest. The GE Capital Term Loan contains no financial covenants. As of December 31, 2009, the total amount of outstanding indebtedness under the GE Capital Term Loan was $949.
Covenant Compliance
For each of the credit facilities described above, the Company was in compliance with all financial and other applicable loan covenants as of December 31, 2009.
Selling Shareholder Notes
On May 26, 2009, the Company entered into a settlement agreement (the "Settlement Agreement") with the former owners of Brad Foote (the "Selling Shareholders"), including J. Cameron Drecoll, our Chief Executive Officer and a member of our Board of Directors, related to the post-closing escrow established in connection with our acquisition of Brad Foote. Under the terms of the Settlement Agreement, among other terms, the Company issued three promissory notes to the Selling Shareholders in the aggregate principal amount of $3,000 (the "Selling Shareholder Notes"). The Selling Shareholder Notes mature on May 28, 2012 and bear interest at a rate of 7% per annum, with interest payments due quarterly. The Selling Shareholder Note issued to Mr. Drecoll in the principal amount of $2,320 and pursuant to the terms of the Settlement Agreement is deemed by us to be a related party transaction. As of December 31, 2009, principal of $3,000 and accrued interest of $53 were outstanding under the Selling Shareholder Notes. The Company has accounted for the Selling Shareholder Notes as long-term debt in our consolidated balance sheets as of December 31, 2009.
84
BROADWIND ENERGY, INC. AND SUBSIDIARIES
NOTES TO CONSOLIDATED FINANCIAL STATEMENTS (Continued)
December 31, 2009, 2008, and 2007
(in thousands, except share and per share data)
11. LEASES
The Company leases various property and equipment under operating lease arrangements. Lease terms generally range from 2 to 15 years with renewal options for extended terms. The Company is required to make additional payments under certain property leases for taxes, insurance and other operating expenses incurred during the operating lease period. Rental expense for the years ended December 31, 2009, 2008 and 2007 was $5,283, $3,090 and $611, respectively.
In addition, the Company has entered into capital lease arrangements to finance property and equipment and assumed capital lease obligations in connection with certain acquisitions. The cost basis and accumulated depreciation of assets recorded under capital leases, which are included in property and equipment, are as follows as of December 31, 2009 and 2008:
| |
December 31, | ||||||
|---|---|---|---|---|---|---|---|
| |
2009 | 2008 | |||||
Cost |
$ | 7,014 | $ | 6,592 | |||
Accumulated depreciation |
(1,117 | ) | (507 | ) | |||
Net book value |
$ | 5,897 | $ | 6,085 | |||
Depreciation expense recorded in connection with assets recorded under capital leases was $946, $482 and $25 for the years ended December 31, 2009, 2008 and 2007, respectively.
As of December 31, 2009, future minimum lease payments under capital leases and operating leases are as follows:
| |
Capital Leases |
Operating Leases |
Total | |||||||
|---|---|---|---|---|---|---|---|---|---|---|
2010 |
$ | 1,482 | $ | 5,161 | $ | 6,643 | ||||
2011 |
1,385 | 4,982 | 6,367 | |||||||
2012 |
1,349 | 4,358 | 5,707 | |||||||
2013 |
983 | 2,615 | 3,598 | |||||||
2014 |
— | 2,060 | 2,060 | |||||||
2015 and thereafter |
— | 5,159 | 5,159 | |||||||
Total |
5,199 | $ | 24,335 | $ | 29,534 | |||||
Less—portion representing interest at a weighted average annual rate of 8.9% |
(783 | ) | ||||||||
Principal |
4,416 | |||||||||
Less—current portion |
(1,130 | ) | ||||||||
Capital lease obligations, noncurrent portion |
$ | 3,286 | ||||||||
85
BROADWIND ENERGY, INC. AND SUBSIDIARIES
NOTES TO CONSOLIDATED FINANCIAL STATEMENTS (Continued)
December 31, 2009, 2008, and 2007
(in thousands, except share and per share data)
12. COMMITMENTS AND CONTINGENCIES
Customer Disputes
During the third quarter of 2009, the Company was involved in a contract dispute with a customer. The Company and the customer are negotiating a resolution on this matter. Based on the discussions that occurred, the Company has reserved $1,500, of which $1,200 relates to a settlement of this contract dispute and $300 is for a warranty reserve associated with this matter.
Purchase Commitments
The Company has issued building purchase commitments associated with the construction of a new wind tower manufacturing facility located in Brandon, South Dakota totaling approximately $1,100 as of December 31, 2009.
During 2009, the Company entered in a purchase agreement for equipment totaling $995. Under the terms of the purchase agreement, the Company was required to make a deposit of $249 in December 2009 and is required to make two additional payments in January and February of 2010. As of December 31, 2009, the deposit balance was $746 and is included in other assets in our consolidated balance sheets as of December 31, 2009.
During 2008, the Company entered into two purchase agreements for equipment totaling $4,888. Under the terms of the purchase agreements, the Company was required to make a $1,324 deposit and must purchase the stated equipment in the purchase agreement or equipment of equal or lesser value. If the equipment is not purchased prior to the expiration of the purchase agreement on December 31, 2010, the Company would be required to surrender its deposit for the equipment to the vendor. As of December 31, 2009, the deposit balance was $1,324 and is included in other assets in our consolidated balance sheets as of December 31, 2009.
During 2007, the Company entered into a purchase contract for equipment with a foreign vendor, which was subsequently modified on December 31, 2008. Under the terms of this amended purchase agreement, the Company agreed to equipment purchases totaling $3,674, of which $978 was paid as a down payment and the remaining $2,784 in principal plus accrued interest at 6% per annum would be paid in twelve equal monthly installments. The Company has accounted for this purchase agreement as a promissory note and the outstanding balances of $116 and $2,784 are included in lines of credit and notes payable in the current liabilities section of the Company's consolidated balance sheets as of December 31, 2009 and December 31, 2008, respectively.
Legal Proceedings
The Company is subject to legal proceedings in the normal course of business. The Company periodically evaluates the need to record liabilities in connection with loss contingencies, including, but not limited to, settlement of legal proceedings and regulatory compliance matters. The Company accrues for costs related to loss contingencies when such costs are probable and reasonably estimable.
86
BROADWIND ENERGY, INC. AND SUBSIDIARIES
NOTES TO CONSOLIDATED FINANCIAL STATEMENTS (Continued)
December 31, 2009, 2008, and 2007
(in thousands, except share and per share data)
12. COMMITMENTS AND CONTINGENCIES (Continued)
Environmental Compliance and Remediation Liabilities
Our operations and products are subject to a variety of environmental laws and regulations in the jurisdictions in which the Company operates and sell products governing, among other things, air emissions, wastewater discharges, the use, handling and disposal of hazardous materials, soil and groundwater contamination, employee health and safety, and product content, performance and packaging. Also, certain environmental laws can impose the entire cost or a portion of the cost of investigating and cleaning up a contaminated site, regardless of fault, upon any one or more of a number of parties, including the current or previous owner or operator of the site. These environmental laws also impose liability on any person who arranges for the disposal or treatment of hazardous substances at a contaminated site. Third parties may also make claims against owners or operators of sites and users of disposal sites for personal injuries and property damage associated with releases of hazardous substances from those sites.
Warranty Liability
The Company provides warranty terms that range from two to seven years for various products relating to workmanship and materials supplied by the Company. From time to time, customers may submit warranty claims against the Company. In certain contracts, the Company has recourse provisions for items that would enable recovery from third parties for amounts paid to customers under warranty provisions. As of December 31, 2009 and 2008, our estimated product warranty liability was $918 and $890, respectively, and is recorded within accrued liabilities in our consolidated balance sheets.
Sale-Leaseback Transactions
The Company has entered into sale-leaseback agreements whereby certain owned equipment is sold to a third party financing company in exchange for cash and the subsidiary then leases back the equipment from the purchaser. The primary purpose of these arrangements is to provide additional liquidity to meet working capital requirements. Depending on the terms of the lease agreement, the lease may be classified as an operating or capital lease. In addition, the sale of the assets may result in a gain or loss, which must be amortized to other income or loss in our statement of operations over the life of the operating lease. As of December 31, 2009, the minimum monthly payments due under these lease agreements totaled $98.
Other
As of December 31, 2009, approximately 21% of our employees were covered by two collective bargaining agreements with local unions in Cicero, Illinois and Neville Island, Pennsylvania. Collective bargaining agreements with our Cicero and Neville Island unions were ratified by local unions in the fourth quarter of 2009 and the first quarter of 2010, respectively, and are scheduled to remain in effect through October 2012 and February 2014, respectively.
87
BROADWIND ENERGY, INC. AND SUBSIDIARIES
NOTES TO CONSOLIDATED FINANCIAL STATEMENTS (Continued)
December 31, 2009, 2008, and 2007
(in thousands, except share and per share data)
13. INTEREST RATE SWAP AGREEMENTS
As part of our acquisition of Brad Foote in October 2007, the Company assumed two interest rate swap agreements. These swap agreements are intended to minimize the impact of interest rate fluctuations on certain debt instruments. Interest rate swap agreements involve exchanges of fixed or floating rate interest payments periodically over the life of the agreement without the exchange of the underlying principal amounts. Derivatives are measured at fair value and recognized as either assets or liabilities on the Company's balance sheet. The accounting for changes in the fair value of a derivative is dependent upon the use of the derivative and its resulting designation. Unless specific hedge accounting criteria are met, changes in the fair value of the derivative must be recognized currently in earnings. The Company's interest rate swaps do not qualify for hedge accounting, and therefore, the Company is required to recognize the swap agreements at their fair market value and record the fluctuations in the fair value of the swap agreements in current earnings. During the year ended December 31, 2009, the Company reported a gain related to the change in the fair value of these instruments of $330 compared to a loss of $194 and $153 for the years ended December 31, 2008 and 2007, respectively. The fair market value of the interest rate swaps of $253 and $582 is recorded as a long-term liability in our consolidated balance sheets as of December 31, 2009 and December 31, 2008, respectively.
In February 2010, the Company settled both interest rate swap agreements for $270 in connection with the repayment of all outstanding indebtedness to Bank of America in January 2010.
The following table presents the fair values of derivative instruments included on our consolidated balance sheets as of December 31, 2009:
| |
Liability Derivatives | |||||
|---|---|---|---|---|---|---|
Derivatives Not Designated as Hedging Instruments
|
Balance Sheet Location | Fair Value | ||||
Interest rate contracts |
Long-term liabilities(1) | $ | 253 | |||
Total derivatives not designated as hedging instruments |
$ | 253 | ||||
- (1)
- The Company's interest rate contracts are classified on a separate line item titled "Interest rate swap agreements" in the long-term liabilities section on our consolidated balance sheets.
The following table presents the pretax amounts of interest rate contracts affecting our consolidated statements of operations for the years ended December 31, 2009, 2008 and 2007:
Derivatives Not Designated as Hedging Instruments
|
Location of Gain or (Loss) Recognized in Income on Derivative |
Amount of Gain or (Loss) Recognized in Income on Derivative |
||||||||||
|---|---|---|---|---|---|---|---|---|---|---|---|---|
| |
|
Twelve Months Ended December 31, | ||||||||||
| |
|
2009 | 2008 | 2007 | ||||||||
Interest rate contracts |
Other income (expense) | $ | 330 | $ | (194 | ) | $ | (153 | ) | |||
Total |
$ | 330 | $ | (194 | ) | $ | (153 | ) | ||||
88
BROADWIND ENERGY, INC. AND SUBSIDIARIES
NOTES TO CONSOLIDATED FINANCIAL STATEMENTS (Continued)
December 31, 2009, 2008, and 2007
(in thousands, except share and per share data)
14. FAIR VALUE MEASUREMENTS
The Company measures its financial assets and liabilities at fair value. Fair value is defined as the price that would be received to sell an asset or paid to transfer a liability (i.e., exit price) in an orderly transaction between market participants at the measurement date. Additionally, the Company is required to provide disclosure and categorize assets and liabilities measured at fair value into one of three different levels depending on the assumptions (i.e., inputs) used in the valuation. Level 1 provides the most reliable measure of fair value while Level 3 generally requires significant management judgment. Financial assets and liabilities are classified in their entirety based on the lowest level of input significant to the fair value measurement. The fair value hierarchy is defined as follows:
Level 1—Valuations are based on unadjusted quoted prices in active markets for identical assets or liabilities.
Level 2—Valuations are based on quoted prices for similar assets or liabilities in active markets, or quoted prices in markets that are not active for which significant inputs are observable, either directly or indirectly.
Level 3—Valuations are based on prices or valuation techniques that require inputs that are both unobservable and significant to the overall fair value measurement. Inputs reflect management's best estimate of what market participants would use in valuing the asset or liability at the measurement date.
The following table represents the fair values of the Company's financial liabilities as of December 31, 2009 and 2008:
| |
2009 | |||||||||||||
|---|---|---|---|---|---|---|---|---|---|---|---|---|---|---|
| |
Level 1 | Level 2 | Level 3 | Total | ||||||||||
Liabilities: |
||||||||||||||
Interest rate swaps |
$ | — | $ | 253 | $ | — | $ | 253 | ||||||
Total liabilities at fair value |
$ | — | $ | 253 | $ | — | $ | 253 | ||||||
| |
2008 | |||||||||||||
|---|---|---|---|---|---|---|---|---|---|---|---|---|---|---|
| |
Level 1 | Level 2 | Level 3 | Total | ||||||||||
Liabilities: |
||||||||||||||
Interest rate swaps |
$ | — | $ | 582 | $ | — | $ | 582 | ||||||
Total liabilities at fair value |
$ | — | $ | 582 | $ | — | $ | 582 | ||||||
See Note 13 "Interest Rate Swap Agreements" of these consolidated financial statements for a discussion of the Level 2 interest rate swap agreements.
89
BROADWIND ENERGY, INC. AND SUBSIDIARIES
NOTES TO CONSOLIDATED FINANCIAL STATEMENTS (Continued)
December 31, 2009, 2008, and 2007
(in thousands, except share and per share data)
14. FAIR VALUE MEASUREMENTS (Continued)
Fair value of financial instruments
The carrying amounts of the Company's financial instruments, which include cash and cash equivalents, accounts receivable, prepaid expenses and other current assets, accounts payable, accrued liabilities and customer deposits approximate their respective fair values due to the relatively short-term nature of these instruments. Based upon interest rates currently available to the Company for debt with similar terms, the carrying value of the Company's long-term debt is approximately equal to its fair value.
Assets measured at fair value on a nonrecurring basis
The Company reviews its goodwill balances for impairment on at least an annual basis based on the carrying value of these assets as of October 31 and tests its intangible and long-lived assets whenever events or changes in circumstances indicate that its carrying value may not be recoverable. Due to the continuing effects of the economic downturn on the wind energy industry, the Company tested goodwill and intangible assets for impairment using a fair value measurement approach. The fair value measurement approach utilizes a number of significant unobservable inputs or Level 3 assumptions. These assumptions include, among others, projections of our future operating results, the implied fair value of these assets using an income approach by preparing a discounted cash flow analysis and a market based approach based on our market capitalization, and other subjective assumptions. The valuation techniques used in 2009 to measure fair value were similar to the techniques used in our analysis in 2008. Upon completion of our impairment analysis in March 2010, the Company determined that the carrying value of its goodwill and intangible assets exceeded the fair value of these assets. Accordingly, the Company recorded goodwill and intangible impairment charges of $24,269 and $57,942, respectively, to properly reflect the carrying value of these assets.
The following table presents the fair value measurements of our nonrecurring assets as of December 31, 2009:
| |
Fair Value Measurements Using | |||||||||||||||
|---|---|---|---|---|---|---|---|---|---|---|---|---|---|---|---|---|
Description
|
Year Ended 12/31/09 |
Prices in Active Markets for Identical Assets (Level 1) |
Significant Other Observable Inputs (Level 2) |
Significant Unobservable Inputs (Level 3) |
Total Gains (Losses) |
|||||||||||
Goodwill |
$ | 9,715 | $ | — | $ | — | $ | 9,715 | $ | (24,269 | ) | |||||
Intangible assets |
37,248 | — | — | 37,248 | (57,942 | ) | ||||||||||
|
$ | (82,211 | ) | |||||||||||||
15. INCOME TAXES
The Company accounts for income taxes based upon an asset and liability approach. Deferred tax assets and liabilities represent the future tax consequences of the differences between the financial statement carrying amounts of assets and liabilities versus the tax basis of assets and liabilities. Under this method, deferred tax assets are recognized for deductible temporary differences, and operating loss
90
BROADWIND ENERGY, INC. AND SUBSIDIARIES
NOTES TO CONSOLIDATED FINANCIAL STATEMENTS (Continued)
December 31, 2009, 2008, and 2007
(in thousands, except share and per share data)
15. INCOME TAXES (Continued)
and tax credit carryforwards. Deferred tax liabilities are recognized for taxable temporary differences. Deferred tax assets are reduced by a valuation allowance when, in the opinion of management, it is more likely than not that some portion or all of the deferred tax assets will not be realized. The impact of tax rate changes on deferred tax assets and liabilities is recognized in the year that the change is enacted.
The provision for income taxes for the years ended December 31, 2009, 2008 and 2007 consists of the following:
| |
For the Years Ended December 31, | ||||||||||
|---|---|---|---|---|---|---|---|---|---|---|---|
| |
2009 | 2008 | 2007 | ||||||||
Current provision |
|||||||||||
Federal |
$ | (675 | ) | $ | — | $ | — | ||||
State |
180 | 554 | — | ||||||||
Total current provision |
(495 | ) | 554 | — | |||||||
Deferred credit |
|||||||||||
Federal |
(38,199 | ) | (7,666 | ) | (1,541 | ) | |||||
State |
(5,804 | ) | (444 | ) | (229 | ) | |||||
Total deferred credit |
(44,003 | ) | (8,110 | ) | (1,770 | ) | |||||
Increase in deferred tax valuation allowance |
42,909 | 8,618 | 731 | ||||||||
Total (benefit) provision for income taxes |
$ | (1,589 | ) | $ | 1,062 | $ | (1,039 | ) | |||
The increase in the deferred tax valuation allowance was $42,909, $8,618, and $731 for the years ended December 31, 2009, 2008 and 2007, respectively. The change in the deferred tax valuation allowance in 2009 was the result of a significant increase to deferred tax assets in connection with the impairment of goodwill and intangible assets, which created additional federal and state net operating losses. The deferred tax benefit of $1,039 for the year ended December 31, 2007 was related to the change in valuation allowance due to changed expectations about the realization of deferred tax assets as a result of the acquisition of RBA.
91
BROADWIND ENERGY, INC. AND SUBSIDIARIES
NOTES TO CONSOLIDATED FINANCIAL STATEMENTS (Continued)
December 31, 2009, 2008, and 2007
(in thousands, except share and per share data)
15. INCOME TAXES (Continued)
The tax effects of the temporary differences and net operating losses that give rise to significant portions of deferred tax assets and liabilities are as follows:
| |
As of December 31, | |||||||
|---|---|---|---|---|---|---|---|---|
| |
2009 | 2008 | ||||||
Current deferred income tax assets: |
||||||||
Accrual and reserves |
$ | 2,573 | $ | 2,216 | ||||
Total current deferred tax assets |
2,573 | 2,216 | ||||||
Valuation allowance |
(2,573 | ) | (2,216 | ) | ||||
Current deferred tax assets, net of valuation allowance |
— | — | ||||||
Noncurrent deferred income tax assets: |
||||||||
Net operating loss carryforwards |
$ | 30,900 | $ | 15,225 | ||||
Intangible assets |
29,296 | — | ||||||
Other |
735 | 410 | ||||||
Total noncurrent deferred tax assets |
60,931 | 15,635 | ||||||
Valuation allowance |
(47,704 | ) | (5,152 | ) | ||||
Noncurrent deferred tax assets, net of valuation allowance |
13,227 | 10,483 | ||||||
Noncurrent deferred income tax liabilities: |
||||||||
Fixed assets |
$ | (13,630 | ) | $ | (9,624 | ) | ||
Intangible assets |
— | (2,356 | ) | |||||
Total noncurrent deferred tax liabilities |
(13,630 | ) | (11,980 | ) | ||||
Net deferred income tax liability |
$ | (403 | ) | $ | (1,497 | ) | ||
The Company has indefinite long-lived intangible assets consisting of goodwill, which are not amortized for financial reporting purposes. However, the expense related to the amortization of these assets is tax deductible, and therefore the assets are amortized for income tax purposes. As a result, deferred income tax expense and deferred income tax liabilities arise as a result of the tax-deductibility of these indefinite long-lived intangible assets. The resulting deferred tax liability, which is anticipated to continue to increase over time, has an indefinite life, resulting in what is referred to as a "naked tax credit." This deferred tax liability could remain on our consolidated balance sheets indefinitely unless there is an impairment of the related assets for financial reporting purposes, or the businesses to which the assets relate are to be disposed of.
Valuation allowances of $50,277 and $7,368 have been provided for deferred income tax assets for which realization is uncertain as of December 31, 2009 and 2008, respectively. A reconciliation of the beginning and ending amounts of the valuation was as follows:
Valuation allowance as of December 31, 2008 |
$ | (7,368 | ) | |
Gross increase for current year activity |
(42,909 | ) | ||
Valuation allowance as of December 31, 2009 |
$ | (50,277 | ) | |
92
BROADWIND ENERGY, INC. AND SUBSIDIARIES
NOTES TO CONSOLIDATED FINANCIAL STATEMENTS (Continued)
December 31, 2009, 2008, and 2007
(in thousands, except share and per share data)
15. INCOME TAXES (Continued)
As of December 31, 2009, the Company had federal net operating loss carryforwards of approximately $80,082 expiring in various years through 2029. The majority of the net operating loss carry forwards will expire in 2028 and 2029.
As of December 31, 2009, the Company had un-apportioned state net operating losses in the aggregate of approximately $80,082 expiring in various years from 2021 through 2029 based upon various net operating loss periods as designated by the different taxing jurisdictions.
The reconciliation of the tax (benefit) provision computed at the statutory rate to the effective tax rate is as follows:
| |
For the Year Ended December 31, | |||||||||
|---|---|---|---|---|---|---|---|---|---|---|
| |
2009 | 2008 | 2007 | |||||||
Statutory U.S. federal income tax rate |
35.0 | % | 35.0 | % | 35.0 | % | ||||
State and local income taxes, net of federal income tax benefit |
3.4 | (0.4 | ) | 5.2 | ||||||
Permanent differences |
(0.3 | ) | (5.0 | ) | (0.4 | ) | ||||
Change in valuation allowance |
(36.8 | ) | (34.6 | ) | (16.6 | ) | ||||
Uncertain tax positions |
(0.1 | ) | — | — | ||||||
Other |
0.2 | 0.6 | 0.4 | |||||||
Effective income tax rate |
1.4 | % | (4.4) | % | 23.6 | % | ||||
The Company accounts for the uncertainty in income taxes by prescribing a minimum recognition threshold for a tax provision taken or expected to be taken in a tax return that is required to be met
93
BROADWIND ENERGY, INC. AND SUBSIDIARIES
NOTES TO CONSOLIDATED FINANCIAL STATEMENTS (Continued)
December 31, 2009, 2008, and 2007
(in thousands, except share and per share data)
15. INCOME TAXES (Continued)
before being recognized in the financial statements. The changes in the Company's uncertain income tax positions for the years ended December 31, 2009 and 2008 consisted of the following:
| |
For the Year Ended December 31, | |||||||
|---|---|---|---|---|---|---|---|---|
| |
2009 | 2008 | ||||||
Beginning balance |
$ | 193 | $ | — | ||||
Tax positions related to current year: |
||||||||
Additions |
— | 31 | ||||||
Reductions |
— | — | ||||||
|
— | 31 | ||||||
Tax positions related to prior years: |
||||||||
Additions |
196 | 32 | ||||||
Reductions |
(17 | ) | — | |||||
Settlements |
(23 | ) | — | |||||
Lapses in statutes of limitations |
— | — | ||||||
Additions from current year acquisitions |
— | 130 | ||||||
|
156 | 162 | ||||||
Ending balance |
$ | 349 | $ | 193 | ||||
It is the Company's policy to include interest and penalties in tax expense. During the years ended December 31, 2009 and 2008, the Company recognized and accrued approximately $10 and $53, respectively, of interest and penalties.
The Company files income tax returns in the U.S. federal and state jurisdictions. As of December 31, 2009, open tax years in the federal and some state jurisdictions date back to 1996 due to the taxing authorities' ability to adjust operating loss carryforwards. No changes in settled tax years have occurred through December 31, 2009. The Company does not anticipate there will be a material change in the total amount of unrecognized tax benefits within the next 12 months.
16. STOCKHOLDERS' EQUITY
On January 16, 2008, to finance the cash portion of the EMS acquisition, the Company sold an aggregate of 2,031,250 shares of unregistered common stock in a private placement to Tontine Partners, L.P. ("TP") and Tontine 25 Overseas Master Fund, L.P. ("T25") at $8.48 per share for a total purchase price of $17,225, pursuant to a previously disclosed Amended and Restated Securities Purchase Agreement with Tontine Capital Partners, L.P. ("TCP"), TP and T25.
In connection with the acquisition of EMS, on January 16, 2008, the Company issued 1,629,834 shares of unregistered common stock to the members of EMS, calculated at $8.48 per share, for total stock consideration of $13,821. The Company entered into a registration rights agreement with the
94
BROADWIND ENERGY, INC. AND SUBSIDIARIES
NOTES TO CONSOLIDATED FINANCIAL STATEMENTS (Continued)
December 31, 2009, 2008, and 2007
(in thousands, except share and per share data)
16. STOCKHOLDERS' EQUITY (Continued)
former owners of EMS which provides the former owners with demand and piggyback registration rights. Upon consummation of the Company's acquisition of EMS, 7,500 shares of restricted stock units previously granted to certain Company executives vested; another 7,500 restricted shares vested as of January 16, 2009.
In the second quarter of 2008, the Company completed transactions resulting in the sale of an aggregate of $100,500 of its unregistered common stock, as follows: (A) $500, or 62,814 shares, was purchased by a member of the Company's Board of Directors at a price of $7.96 per share, in connection with this transaction , the Company entered into a registration rights agreement with the applicable director that provides the director with piggyback registration rights; and (B) an aggregate of $100,000 worth, or 12,562,814 shares, was purchased by TCP, TP, Tontine Overseas Fund, Ltd. ("TOF"), and T25 at a price of $7.96 per share.
On April 24, 2008, Tontine Capital Overseas Master Fund, L.P. ("TMF"), TP, and TOF each converted the full original principal amount of their respective 9.5% notes into shares of Company common stock. Upon conversion, an aggregate of 3,333,332 shares of the Company's common stock were issued to TMF, TP and TOF.
On June 4, 2008, the Company acquired all of the outstanding capital stock of Badger for total purchase price of $11,811, exclusive of transaction related acquisition costs. A portion of the purchase price consisted of 581,959 unregistered shares of Broadwind's common stock at a price per share of $10.31. The Company entered into a registration rights agreement with a former owner of Badger that provides the former owner with limited piggyback registration rights.
On June 25, 2008, at the 2008 Annual Meeting of Stockholders, the stockholders of the Company approved an amendment to the Company's Articles of Incorporation, which increased the authorized number of shares of common stock from 100,000,000 to 150,000,000.
Tontine Registration Rights Agreement
In March 2007, the Company entered into a Registration Rights Agreement (as amended, the "Tontine Registration Rights Agreement") with TCP and TOF. The Tontine Registration Rights Agreement was subsequently amended on October 19, 2007, July 18, 2008, September 12, 2008 and October 31, 2008. Pursuant to the Tontine Registration Rights Agreement, the Company agreed to register the shares of TP, TOF, TCP, TMF, T25, and TCP Overseas Master Fund II, L.P. (collectively with their affiliates, "Tontine") for resale and have provided Tontine with certain demand and piggyback registration rights.
Under the terms of the Tontine Registration Rights Agreement, in certain circumstances, Tontine was entitled to deliver a demand notice to the Company, which then triggered the obligation of the Company to file a registration statement with the SEC to register the shares held by Tontine as soon as reasonably practicable thereafter. Additionally, whenever the Company proposed to register any of its securities under the Securities Act of 1933, as amended, with certain exceptions, the Company was obligated to give notice to Tontine and provide an opportunity for piggyback registration of the shares held by Tontine.
95
BROADWIND ENERGY, INC. AND SUBSIDIARIES
NOTES TO CONSOLIDATED FINANCIAL STATEMENTS (Continued)
December 31, 2009, 2008, and 2007
(in thousands, except share and per share data)
16. STOCKHOLDERS' EQUITY (Continued)
The amendment to the Tontine Registration Rights Agreement dated October 31, 2008 extended the deadline for our obligation to file a registration statement to December 31, 2008. On January 9, 2009, Tontine executed a Waiver (the "Waiver") relating to the Registration Rights Agreement. The Waiver waived the requirement that the Company file a registration statement to register shares held by Tontine no later than December 31, 2008 and extended the deadline for our obligation to file the Selling Stockholder Registration Statement to March 31, 2009. On April 15, 2009, Tontine provided written notice to us with a demand that the Company file the Selling Stockholder Registration Statement as soon as possible and reserving all of Tontine's rights under the Tontine Registration Rights Agreement. Tontine's shares became registered for resale when the Company filed a registration statement on Form S-1, which became effective on August 17, 2009.
See Note 10 "Debt and Credit Agreements" and Note 17 "Related Party Transactions" of these consolidated financial statements for further discussion regarding transactions between the Company and Tontine.
17. RELATED PARTY TRANSACTIONS
On May 26, 2009, the Company entered into the Settlement Agreement with the Selling Shareholders, including J. Cameron Drecoll, the Company's Chief Executive Officer and a member of the Company's Board of Directors, related to the post-closing escrow established in connection with the Company's acquisition of Brad Foote. The post-closing escrow fund was created to provide a source of funds for claims for indemnification made by the Company and certain other indemnified persons against the Selling Shareholders under the Stock Purchase Agreement executed in connection with the Company's acquisition of Brad Foote. On October 19, 2007, the date the Company consummated its acquisition of Brad Foote, the Company deposited a portion of its total purchase price for Brad Foote (in the amount of $5,000 in cash and 2,500,000 shares of its common stock) into the escrow fund. The consideration deposited into the escrow fund was to be held by an escrow agent until five business days after the eighteen month anniversary of the Brad Foote acquisition. Under the terms of the Settlement Agreement, the Company received the entire cash escrow balance of $5,000 plus accrued interest income of $82, which was recorded as other income. In exchange, the Company agreed to cause the release to the Selling Shareholders of 2,500,000 shares of the Company's common stock held under the escrow agreement in proportion to their ownership interest in Brad Foote prior to its acquisition by the Company. In addition, the Company agreed to make a cash payment of $30 to one Selling Shareholder and issued promissory notes to the three Selling Shareholders in the aggregate principal amount of $3,000 (each a "Selling Shareholder Note", and collectively the "Selling Shareholder Notes"). The cash payment and promissory notes were recorded as an increase to the purchase price through goodwill as these amounts were calculated in accordance with the purchase agreement. The Company also paid to Mr. Drecoll certain tax refunds in the aggregate amount of approximately $2,212 related to our acquisition of Brad Foote and tax payments in respect of the period prior to the acquisition to which the Company believes the Selling Shareholders are entitled (or to which the Company is entitled on their behalf). The Selling Shareholder Notes mature on May 28, 2012 and bear interest at a rate of 7% per annum, with interest payments due quarterly. The Selling Shareholder Note issued to Mr. Drecoll in the principal amount of $2,320 and pursuant to the terms of the Settlement Agreement is deemed by
96
BROADWIND ENERGY, INC. AND SUBSIDIARIES
NOTES TO CONSOLIDATED FINANCIAL STATEMENTS (Continued)
December 31, 2009, 2008, and 2007
(in thousands, except share and per share data)
17. RELATED PARTY TRANSACTIONS (Continued)
the Company to be a related party transaction. As of December 31, 2009, principal of $3,000 and accrued interest of $53 was outstanding under the Selling Shareholder Notes. The Company has accounted for the Selling Shareholder Notes as long-term debt in our consolidated balance sheets as of December 31, 2009.
During the years ended December 31, 2009, 2008 and 2007, interest expense of $128, $1,226 and $547, respectively, was incurred on shareholder and related party notes.
In April 2008, EMS purchased its Howard West facility from the former majority owner of EMS and its former president, and concurrently terminated its lease agreement, which required a monthly payment of $5. EMS continues to lease its primary administrative offices, a machine shop, a residential property, and storage facilities from the former majority owner of EMS, and its former president. The agreement provides for a lease term expiring on December 31, 2012 and requires a monthly payment of $3.
In February 2008, Brad Foote completed the purchase of two real estate parcels located in Cicero, Illinois and Pittsburgh, Pennsylvania. Brad Foote previously leased these properties pursuant to a lease agreements dated August 22, 2007. Brad Foote acquired the Cicero property from BFG Cicero LLC, an Illinois limited liability company ("BFG Cicero") and acquired the Pittsburgh property from BFG Pittsburgh LLC, a Pennsylvania limited liability company ("BFG Pittsburgh") pursuant to two Real Property Purchase Agreements that were executed on February 14, 2008 and effective February 11, 2008 (together, the "Purchase Agreements"). The sole member of each of BFG Cicero and BFG Pittsburgh is BFG Acquisition LLC, an Illinois limited liability company whose sole member is the wife of the Company's Chief Executive Officer.
See Note 16 "Stockholders' Equity" of these consolidated financial statements for further discussion regarding transactions between the Company and related parties.
18. SHARE-BASED COMPENSATION
Overview of Share-Based Compensation Plan
The Company grants incentive stock options and other equity awards pursuant to the Broadwind Energy, Inc. 2007 Equity Incentive Plan (the "EIP"), which was approved by the Company's Board of Directors in October 2007 and by the Company's stockholders in June 2008. The EIP was subsequently amended in August 2008 by the Company's Board of Directors to include certain non-material amendments to clarify the terms and conditions of restricted stock awards and to provide that the administrator of the EIP has the authority to authorize future amendments to the EIP. The EIP was further amended by the Company's stockholders in June 2009 to increase the number of shares of common stock authorized for issuance under the EIP. As amended, the EIP reserves 5,500,000 shares of our common stock for grants to officers, directors, employees, consultants and advisors upon whose efforts the success of the Company and its affiliates will depend to a large degree. As of December 31, 2009, the Company had reserved 1,402,163 shares for the exercise of stock options outstanding, 279,151 shares for restricted stock unit awards outstanding and 3,563,235 additional shares for future stock
97
BROADWIND ENERGY, INC. AND SUBSIDIARIES
NOTES TO CONSOLIDATED FINANCIAL STATEMENTS (Continued)
December 31, 2009, 2008, and 2007
(in thousands, except share and per share data)
18. SHARE-BASED COMPENSATION (Continued)
awards under the EIP. As of December 31, 2009, 255,451 shares of common stock reserved for stock options and restricted stock unit awards under the EIP have been issued in the form of common stock.
Stock Options. The exercise price of stock options granted under the EIP is equal to the closing price of our common stock on the date of grant. Stock options generally become exercisable on the anniversary of the grant date, with vesting terms that may range from one to five years from the date of grant. Additionally, stock options expire ten years after the date of grant. If a plan participant's employment is terminated during the vesting period, he or she forfeits the right to unvested stock option awards.
Restricted Stock. The granting of restricted stock units is provided for under the EIP. Restricted stock units generally vest on the anniversary of the grant date, with vesting terms that range from immediate vesting to five years from the date of grant. The fair value of each unit granted is equal to the closing price of our common stock on the date of grant and is expensed ratably over the vesting term of the restricted stock award. If a plan participant's employment is terminated during the vesting period, he or she forfeits the right to any unvested portion of the restricted stock units.
Stock option activity during the years ended December 31, 2009 and 2008 under the EIP was as follows:
| |
Options | Weighted Average Exercise Price |
Weighted Average Remaining Contractual Term |
Aggregate Intrinsic Value (in thousands) |
|||||||||
|---|---|---|---|---|---|---|---|---|---|---|---|---|---|
Outstanding as of December 31, 2007 |
950,000 | $ | 7.92 | ||||||||||
Granted |
1,165,000 | $ | 14.59 | ||||||||||
Exercised |
— | — | |||||||||||
Forfeited |
(85,000 | ) | $ | 11.38 | |||||||||
Expired |
— | — | |||||||||||
Outstanding as of December 31, 2008 |
2,030,000 | $ | 11.60 | ||||||||||
Granted |
209,193 | $ | 7.66 | ||||||||||
Exercised |
(91,940 | ) | $ | 7.34 | |||||||||
Forfeited |
(723,257 | ) | $ | 12.05 | |||||||||
Expired |
(21,833 | ) | $ | 10.23 | |||||||||
Outstanding as of December 31, 2009 |
1,402,163 | $ | 11.08 | 8.4 years | $ | 2,304 | |||||||
Exercisable as of December 31, 2009 |
392,393 |
$ |
11.12 |
8.2 years |
$ |
824 |
|||||||
98
BROADWIND ENERGY, INC. AND SUBSIDIARIES
NOTES TO CONSOLIDATED FINANCIAL STATEMENTS (Continued)
December 31, 2009, 2008, and 2007
(in thousands, except share and per share data)
18. SHARE-BASED COMPENSATION (Continued)
The following table summarizes information with respect to all outstanding and exercisable stock options under the EIP as of December 31, 2009:
| |
Options Outstanding | Options Exercisable | |||||||||||||
|---|---|---|---|---|---|---|---|---|---|---|---|---|---|---|---|
Exercise Price Ranges
|
Number of options outstanding |
Weighted Average Exercise Price |
Weighted Average Remaining Contractual Term |
Number Exercisable |
Weighted Average Exercise Price |
||||||||||
$4.60 - $7.78 |
142,103 | $ | 7.78 | 9.3 years | — | $ | — | ||||||||
$8.00 - $12.85 |
965,060 | 9.22 | 8.2 years | 313,393 | 8.83 | ||||||||||
$17.21 - $18.20 |
270,000 | 18.06 | 8.5 years | 58,000 | 18.06 | ||||||||||
$25.20 - $26.30 |
25,000 | 26.08 | 8.4 years | 21,000 | 26.25 | ||||||||||
|
1,402,163 | $ | 11.08 | 8.4 years | 392,393 | $ | 11.12 | ||||||||
The following table summarizes information with respect to outstanding restricted stock units as of December 31, 2009 and 2008:
| |
Number of Units | Weighted Average Grant-Date Fair Value Per Units |
||||||
|---|---|---|---|---|---|---|---|---|
Outstanding as of December 31, 2007 |
15,000 | $ | 10.90 | |||||
Granted |
120,000 | $ | 10.70 | |||||
Vested |
(7,500 | ) | $ | 10.90 | ||||
Forfeited |
— | — | ||||||
Outstanding as of December 31, 2008 |
127,500 | $ | 10.71 | |||||
Granted |
367,215 | $ | 6.86 | |||||
Vested |
(176,663 | ) | $ | 5.79 | ||||
Forfeited |
(38,901 | ) | $ | 9.63 | ||||
Outstanding as of December 31, 2009 |
279,151 | $ | 8.76 | |||||
The fair value of each stock option award is estimated on the date of grant using the Black-Scholes option pricing model. Our determination of the fair value of each stock option is affected by our stock price on the date of grant, as well as assumptions regarding a number of highly complex and subjective variables. These variables include, but are not limited to, our expected stock price volatility over the expected life of the awards and actual and projected stock option exercise behavior. The
99
BROADWIND ENERGY, INC. AND SUBSIDIARIES
NOTES TO CONSOLIDATED FINANCIAL STATEMENTS (Continued)
December 31, 2009, 2008, and 2007
(in thousands, except share and per share data)
18. SHARE-BASED COMPENSATION (Continued)
weighted average fair value per share of stock option awards granted during the years ended December 31, 2009 and 2008, and assumptions used to value stock options, are as follows:
| |
For the Years Ended December 31, |
||||||
|---|---|---|---|---|---|---|---|
| |
2009 | 2008 | |||||
Dividend yield |
— | — | |||||
Risk-free interest rate |
2.6 | % | 3.1 | % | |||
Weighted average volatility |
85.0 | % | 65.5 | % | |||
Expected life (in years) |
6.5 | 6.5 | |||||
Weighted average grant date fair value per share of options granted |
$ | 5.64 | $ | 7.18 | |||
Dividend yield is zero as the Company currently does not pay a dividend.
Risk-free rate is based on the implied yield currently available on U.S. Treasury zero coupon issues with a remaining term equal to the expected life of the award.
During the year ended December 31, 2009, the Company utilized a standard volatility assumption of 85% for estimating the fair value of stock options awarded based on comparable volatility averages for the energy related sector. During the year ended December 31, 2008, the Company utilized a range of expected volatility assumptions for such purposes, with such volatility assumptions ranging from 60% to 70%.
The expected life of each stock option award granted is derived using the "simplified method" for estimating the expected term of a "vanilla-option" in accordance with Staff Accounting Bulletin ("SAB") No. 107, "Share-Based Payment," as amended by SAB No. 110, "Share-Based Payment." The fair value of each unit of restricted stock is equal to the fair market value of our common stock as of the date of grant.
During the years ended December 31, 2009 and 2008, the Company utilized a forfeiture rate of 10% for estimating the forfeitures of stock options granted.
100
BROADWIND ENERGY, INC. AND SUBSIDIARIES
NOTES TO CONSOLIDATED FINANCIAL STATEMENTS (Continued)
December 31, 2009, 2008, and 2007
(in thousands, except share and per share data)
18. SHARE-BASED COMPENSATION (Continued)
The following table summarizes share-based compensation expense included in our consolidated statements of operations for the years ended December 31, 2009, 2008 and 2007 as follows:
| |
For the Years Ended December 31, | |||||||||||
|---|---|---|---|---|---|---|---|---|---|---|---|---|
| |
2009 | 2008 | 2007 | |||||||||
Share-based compensation expense: |
||||||||||||
Selling, general and administrative |
$ | 2,805 | $ | 1,999 | $ | 142 | ||||||
Income tax benefit(1) |
— | — | — | |||||||||
Net effect of share-based compensation expense on net loss |
$ | 2,805 | $ | 1,999 | $ | 142 | ||||||
Reduction in earnings per share: |
||||||||||||
Basic and diluted earnings per share(2) |
$ | 0.03 | $ | 0.02 | $ | 0.00 | ||||||
- (1)
- Income
tax benefit is not illustrated because the Company is currently operating at a loss and an actual income tax benefit was not realized for the years
ended December 31, 2009, 2008 and 2007. The result of the loss situation creates a timing difference, resulting in a deferred tax asset, which is fully reserved for in the valuation allowance.
- (2)
- Diluted earnings per share for the years ended December 31, 2009, 2008 and 2007 does not include common stock equivalents due to their anti-dilutive nature as a result of the Company's net losses for these respective periods. Accordingly, basic earnings per share and diluted earnings per share are identical for all periods presented.
As of December 31, 2009, the Company estimates that pre-tax compensation expense for all unvested share-based awards, including both stock options and restricted stock units, in the amount of approximately $7,649 will be recognized through the year 2014. The Company expects to satisfy the exercise of stock options and future distribution of shares of restricted stock by issuing new shares of common stock.
19. SEGMENT REPORTING
In December 2009, the Company revised its reporting segments. The revised reporting structure includes four reportable segments: "Towers" (formerly "Products"), "Gearing" (formerly "Products), "Technical and Engineering Services" (formerly "Services") and "Logistics"(formerly "Services"). Accordingly, all prior period segment information has been reclassified to properly reflect our current reportable segments.
The Company's segments and their product and service offerings are summarized below:
Towers
The Company manufactures wind towers, specifically the large and heavier wind towers that are designed for 2 megawatt ("MW") and larger wind turbines. Our production facilities are strategically
101
BROADWIND ENERGY, INC. AND SUBSIDIARIES
NOTES TO CONSOLIDATED FINANCIAL STATEMENTS (Continued)
December 31, 2009, 2008, and 2007
(in thousands, except share and per share data)
19. SEGMENT REPORTING (Continued)
located in close proximity to the primary U.S. wind resource regions, sited in Wisconsin and Texas, with a recently constructed third wind tower manufacturing facility in Brandon, South Dakota, which will become operational as business warrants and pending the installation of certain additional equipment. The Company also manufactures other specialty weldments and structures for industrial customers.
Gearing
The Company manufactures precision gearing systems for the wind industry in North America and products for industrial markets including mining and oilfield equipment, with plants in Illinois and Pennsylvania. The Company uses an integrated manufacturing process, which includes our machining process in Cicero, Illinois, our heat treatment process in Neville Island, Pennsylvania and our finishing process in our Cicero factory.
Technical and Engineering Services
The Company is an independent service provider of construction support and operations and maintenance services to the wind industry. Our specialty services include oil change-out, up-tower tooling for gearing systems, drive-train and blade repairs and component replacement. Our construction support capabilities include assembly of towers, nacelles, blades and other components. The Company also provides customer support, preventive maintenance and wind technician training. Our technicians utilize our regional service centers for storage and repair of parts as well as our training offerings. Through our precision repair and engineering services, the Company repairs and refurbishes complex wind components, including control systems, gearboxes and blades. The Company also conducts warranty inspections, commission turbines and provides technical assistance. Additionally, the Company builds replacement control panels for kW class wind turbines and repairs both kW and MW blades. Our service locations are in Illinois, California, South Dakota, Texas and Colorado.
Logistics
The Company offers specialized transportation, permitting and logistics management to the wind industry for oversize and overweight machinery and equipment. The Company delivers complete turbines to the installation site, including blades, nacelles and tower sections for final erection. The Company focuses on the project management of the delivery of complete wind turbine farms.
Corporate and Other
"Corporate and Other" is comprised of adjustments to reconcile segment results to consolidated results, which primarily includes corporate administrative expenses and intercompany eliminations.
102
BROADWIND ENERGY, INC. AND SUBSIDIARIES
NOTES TO CONSOLIDATED FINANCIAL STATEMENTS (Continued)
December 31, 2009, 2008, and 2007
(in thousands, except share and per share data)
19. SEGMENT REPORTING (Continued)
Summary financial information by reportable segment is as follows:
| |
Revenues For the Years Ended | Operating (Loss) Profit For the Years Ended |
|||||||||||||||||
|---|---|---|---|---|---|---|---|---|---|---|---|---|---|---|---|---|---|---|---|
| |
2009 | 2008 | 2007 | 2009 | 2008 | 2007 | |||||||||||||
Segments: |
|||||||||||||||||||
Towers |
$ | 93,316 | $ | 72,561 | $ | 12,889 | $ | (500 | ) | $ | 5,813 | $ | 1,030 | ||||||
Gearing |
64,518 | 104,553 | 16,975 | (97,059 | ) | (6,614 | ) | (4,579 | ) | ||||||||||
Technical and engineering services |
27,575 | 31,249 | — | (610 | ) | (1,822 | ) | — | |||||||||||
Logistics |
13,258 | 10,253 | — | (3,382 | ) | 131 | — | ||||||||||||
Corporate and Other(1) |
(837 | ) | (1,295 | ) | (60 | ) | (14,086 | ) | (19,251 | ) | 14 | ||||||||
|
$ | 197,830 | $ | 217,321 | $ | 29,804 | $ | (115,637 | ) | $ | (21,743 | ) | $ | (3,535 | ) | ||||
| |
Depreciation and Amortization For the Years Ended |
Capital Expenditures For the Years Ended |
|||||||||||||||||
|---|---|---|---|---|---|---|---|---|---|---|---|---|---|---|---|---|---|---|---|
| |
2009 | 2008 | 2007 | 2009 | 2008 | 2007 | |||||||||||||
Segments: |
|||||||||||||||||||
Towers |
$ | 3,393 | $ | 1,626 | $ | 587 | $ | 10,294 | $ | 47,523 | $ | 4,921 | |||||||
Gearing |
15,929 | 15,341 | 2,906 | 262 | 26,566 | 933 | |||||||||||||
Technical and engineering services |
3,250 | 3,023 | — | 485 | 3,267 | — | |||||||||||||
Logistics |
3,029 | 1,774 | — | 566 | 4,628 | — | |||||||||||||
Corporate and Other(1) |
124 | 102 | 30 | 229 | 1,736 | — | |||||||||||||
|
$ | 25,725 | $ | 21,866 | $ | 3,523 | $ | 11,836 | $ | 83,720 | $ | 5,854 | |||||||
| |
Total Assets as of December 31, | ||||||
|---|---|---|---|---|---|---|---|
| |
2009 | 2008 | |||||
Segments: |
|||||||
Towers |
$ | 80,146 | $ | 108,261 | |||
Gearing |
92,665 | 199,612 | |||||
Technical and engineering services |
36,417 | 43,622 | |||||
Logistics |
21,259 | 24,980 | |||||
Corporate and Other(2) |
(451 | ) | 3,273 | ||||
|
$ | 230,036 | $ | 379,748 | |||
- (1)
- "Corporate
and Other" includes corporate administrative expenses and intercompany eliminations. Corporate selling, general and administrative expenses
includes corporate salaries and benefits, share-based compensation, and professional fees.
- (2)
- "Corporate and Other" includes assets of the corporate headquarters and intercompany eliminations.
103
BROADWIND ENERGY, INC. AND SUBSIDIARIES
NOTES TO CONSOLIDATED FINANCIAL STATEMENTS (Continued)
December 31, 2009, 2008, and 2007
(in thousands, except share and per share data)
19. SEGMENT REPORTING (Continued)
The Company generates revenues entirely from transactions completed in the United States and our long-lived assets are located in the United States. During 2009, four customers each accounted for more than 10% of total net revenues. During the years ended December 31, 2009, 2008, and 2007, three or fewer customers accounted for 50%, 72% and 70%, respectively, of total net revenues. In addition, as of December 31, 2009 and 2008, three or fewer customers comprised approximately 21% and 61%, respectively, of our total outstanding accounts receivable balances.
20. EMPLOYEE BENEFIT PLANS
Retirement Savings and Profit Sharing Plans
In October 2007, the Company began sponsoring a defined contribution 401(k) retirement savings plan covering substantially all of its corporate employees and employees at its Brad Foote and Tower Tech subsidiaries. Under the terms of the plan, an eligible employee may elect to contribute a portion of salary on a pre-tax basis, subject to federal statutory limitations. The plan allowed for a discretionary match in an amount up to 50% of each participant's first 4% of compensation contributed.
As part of the acquisitions of RBA in October 2007, EMS in January 2008, and Badger in June 2008, the Company adopted the defined contribution 401(k) retirement savings plan provisions that were previously in effect at these respective companies. Under the RBA defined contribution 401(k) retirement savings plan, which covered substantially all of its employees, the plan allowed for the Company to provide a discretionary match of 100% of the participants' contributions up to 4% of the participants' compensation. Under the EMS defined contribution 401(k) retirement savings plan, which covered substantially all of its employees, the plan allowed for the Company to provide a discretionary match or profit sharing contribution each year. Under the Badger defined contribution 401(k) retirement savings plan, which covered substantially all of its employees, the plan required the Company to match 100% of the participants' contributions up to 3% of the participants' compensation and an additional 50% up to 5% of the participants' compensation.
Effective January 1, 2009, the Company replaced all of its defined contribution 401(k) retirement savings plans with one defined contribution 401(k) safe harbor plan covering substantially all of the Company's non-union employees. Under the new plan, an eligible employee may elect to contribute a portion of salary on a pre-tax basis, subject to federal statutory limitations. The plan requires the Company to make basic matching contributions equal to 100% of the first 3% of the eligible participant's plan compensation contributed as elective deferral contributions and 50% of the next 2% of the eligible participant's plan compensation contributed as an elective deferral contribution. Under the plan, elective deferrals and basic company matching will be 100% vested at all times. Effective for the fourth quarter of 2009 and for all subsequent Company matching contributions, the Company will fund these contributions in shares of the Company's common stock in lieu of a cash contribution. For the Company's union employees, in 2009 the Company continued its discretionary match in an amount up to 50% of each participant's first 4% of compensation contributed.
Effective January 1, 2010, based on the collective bargaining agreement with the Brad Foote union employees in Pennsylvania, a discretionary match will be made in an amount equal to 100% of the first 3% of the eligible participant's plan compensation contributed as elective deferral contributions and
104
BROADWIND ENERGY, INC. AND SUBSIDIARIES
NOTES TO CONSOLIDATED FINANCIAL STATEMENTS (Continued)
December 31, 2009, 2008, and 2007
(in thousands, except share and per share data)
20. EMPLOYEE BENEFIT PLANS (Continued)
50% of the next 2% of the eligible participant's plan compensation contributed as an elective deferral contribution.
For the years ended December 31, 2009, 2008 and 2007, the Company recorded expense under these plans of approximately $786, $368 and $74, respectively.
Deferred Compensation Plan
The Company maintains a deferred compensation plan for certain key employees and nonemployee directors, whereby certain wages earned, compensation for services rendered, and discretionary company-matching contributions are deferred and deemed to be invested in the Company's common stock. Changes in the fair value of the plan liability are recorded as charges or credits to compensation expense. Compensation expense recorded during the years ended December 31, 2009, 2008, and 2007, was $587, $170 and $0, respectively. The fair value of the plan liability to the Company is included in accrued liabilities in our consolidated balance sheets. As of December 31, 2009 and 2008, the fair value of plan liability to the Company was $215 and $80, respectively.
In addition to the employee benefit plans described above, the Company participates in certain customary employee benefits plans, including those which provide health and life insurance benefits to employees.
21. QUARTERLY FINANCIAL SUMMARY (UNAUDITED)
The following table provides a summary of selected financial results of operations by quarter for the years ended December 31, 2009 and 2008 as follows:
2009
|
First | Second | Third | Fourth | ||||||||||
|---|---|---|---|---|---|---|---|---|---|---|---|---|---|---|
Revenues |
$ | 53,062 | $ | 52,313 | $ | 59,507 | $ | 32,948 | ||||||
Gross profit (loss) |
4,685 | 3,151 | 6,582 | (2,615 | ) | |||||||||
Operating loss |
(7,137 | ) | (10,280 | ) | (4,571 | ) | (93,649 | ) | ||||||
Net loss |
(7,150 | ) | (5,426 | ) | (4,944 | ) | (92,599 | ) | ||||||
Net loss per share: |
||||||||||||||
Basic and Diluted |
$ | (0.09 | ) | $ | (0.06 | ) | $ | (0.05 | ) | $ | (0.96 | ) | ||
2008
|
First | Second | Third | Fourth | ||||||||||
|---|---|---|---|---|---|---|---|---|---|---|---|---|---|---|
Revenues |
$ | 35,164 | $ | 40,830 | $ | 63,688 | $ | 77,639 | ||||||
Gross profit |
8,010 | 10,091 | 8,982 | 6,287 | ||||||||||
Operating loss |
(1,939 | ) | (1,642 | ) | (6,060 | ) | (12,102 | ) | ||||||
Net loss |
(3,443 | ) | (1,973 | ) | (7,499 | ) | (12,370 | ) | ||||||
Net loss per share: |
||||||||||||||
Basic and Diluted |
$ | (0.04 | ) | $ | (0.02 | ) | $ | (0.08 | ) | $ | (0.14 | ) | ||
105
BROADWIND ENERGY, INC. AND SUBSIDIARIES
NOTES TO CONSOLIDATED FINANCIAL STATEMENTS (Continued)
December 31, 2009, 2008, and 2007
(in thousands, except share and per share data)
22. SUBSEQUENT EVENTS
On January 22, 2010, the Company announced the completion of its public offering of common stock, par value $0.001 per share, at an offering price of $5.75 per share. In the offering, the Company sold 10,000,000 newly issued shares of its common stock for approximately $53,900 in proceeds net of underwriter commissions. As part of this offering, Tontine sold a combined total of 6,125,000 shares of common stock and J. Cameron Drecoll, the Company's Chief Executive Officer, sold 1,125,000 shares of common stock. The sales by Tontine and J. Cameron Drecoll included all shares subject to the over-allotment option by the Company's underwriters.
In January 2010, the Company repaid all outstanding indebtedness due under the BOA Debt Facilities and all outstanding indebtedness due under the Investors Community Bank Line in the amounts of $16,076 and $3,066, respectively. In February 2010, the Company settled two interest rate swap agreements for $270. The interest rate swap agreements related to the underlying notional amounts of two term notes, which were included in the Bank of America Debt Facilities repayment in January 2010.
On February 16, 2010, Tower Tech and Great Western entered into an agreement to extend the maturity date of the Construction Loan from March 5, 2010 to April 5, 2010.
106
| Exhibit Number |
Description | ||
|---|---|---|---|
| 2.1 | Share Exchange Agreement by and among Blackfoot Enterprises, Inc. and the shareholders of Tower Tech Systems Inc. and Tower Tech Systems Inc. dated as of November 7, 2005 (incorporated by reference to Exhibit 2.1 to the Company's Current Report on Form 8-K filed November 21, 2005) | ||
2.2 |
Stock Purchase Agreement dated September 13, 2007 among the Company, R.B.A. Inc. and the stockholders of R.B.A. Inc. (incorporated by reference to Exhibit 2.1 to the Company's Current Report on Form 8-K filed September 17, 2007) |
||
2.3 |
Stock Purchase Agreement dated August 22, 2007 among the Company, Brad Foote Gear Works, Inc. and the shareholders of Brad Foote Gear Works, Inc. (incorporated by reference to Exhibit 2.1 to the Company's Current Report on Form 8-K filed August 24, 2007) |
||
2.4 |
Stock Purchase Agreement dated April 24, 2008 among Broadwind Energy, Inc., Badger Transport, Inc. and the shareholders of Badger Transport, Inc. (incorporated by reference to Exhibit 2.1 to the Company's Current Report on Form 8-K filed April 30, 2008) |
||
2.5 |
Membership Interest Purchase Agreement dated December 9, 2007 among the Company, Energy Maintenance Service, LLC, Joseph A. Kolbach and the members of Energy Maintenance Service, LLC (incorporated by reference to Exhibit 2.1 to the Company's Current Report on Form 8-K filed December 13, 2007) |
||
2.6 |
Amendment No. 1 to the Membership Interest Purchase Agreement dated December 9, 2007 among the Company, Energy Maintenance Service, LLC, Joseph A. Kolbach and the members of Energy Maintenance Service, LLC (incorporated by reference to Exhibit 2.1 to the Company's Current Report on Form 8-K filed January 14, 2008) |
||
3.1 |
Certificate of Incorporation of the Company (incorporated by reference to Exhibit 3.1 to the Company's Quarterly Report on Form 10-Q for the quarterly period ended June 30, 2008) |
||
3.2 |
Bylaws, as amended and restated through June 20, 2008 (incorporated by reference to Exhibit 3.2 to the Company's Quarterly Report on Form 10-Q for the quarterly period ended June 30, 2008) |
||
10.1 |
Form of Irrevocable Proxy of each of Christopher Allie, Raymond L. Brickner, III, Terence P. Fox and Daniel P. Wergin, each dated March 1, 2007, pursuant to the Securities Purchase Agreement by and among Tontine Capital Partners, L.P., Tontine Capital Overseas Master Fund, L.P. and Tower Tech Holdings Inc. dated March 1, 2007 (incorporated by reference to Exhibit 5 to Schedule 13D filed by Tontine Capital Partners, L.P., Tontine Capital Management, L.L.C., Tontine Capital Overseas Master Fund, L.P., Tontine Capital Overseas GP, L.L.C. and Jeffrey L. Gendell on March 5, 2007) |
||
10.2 |
Proxy Agreement between Tontine Capital Partners, L.P., Tontine Capital Overseas Master Fund, L.P., J. Cameron Drecoll, Patrick Rosmonowski, Dennis Palmer and Noel Davis dated August 22, 2007 (incorporated by reference to Exhibit 4 to Schedule 13D filed by J. Cameron Drecoll on October 26, 2007) |
||
10.3 |
Lease agreement dated January 1, 2005 between Tower Tech Systems Inc. and City Centre, LLC (incorporated by reference to Exhibit 10.4 to the Company's Annual Report on Form 10-KSB for the fiscal year ended December 31, 2005) |
||
107
| Exhibit Number |
Description | ||
|---|---|---|---|
| 10.4 | Amendment, dated December 1, 2007, to Lease agreement dated January 1, 2005 between Tower Tech Systems Inc. and City Centre, LLC (incorporated by reference to Exhibit 10.2 to the Company's Annual Report on Form 10-KSB for the fiscal year ended December 31, 2007) | ||
10.5 |
Lease Agreement dated December 26, 2007 between Tower Tech Systems Inc. and City Centre, LLC (incorporated by reference to Exhibit 10.2 to the Company's Annual Report on Form 10-KSB for the fiscal year ended December 31, 2007) |
||
10.6 |
Purchase Agreement Addendum effective February 11, 2008 between Brad Foote Gear Works, Inc. and BFG Cicero LLC (incorporated by reference to Exhibit 10.1 to the Company's Current Report on Form 8-K filed February 21, 2008) |
||
10.7 |
Assignment and Assumption of Purchase Agreement effective February 11, 2008 between Brad Foote Gear Works, Inc. and 1309 South Cicero Avenue, LLC (incorporated by reference to Exhibit 10.2 to the Company's Current Report on Form 8-K filed February 21, 2008) |
||
10.8 |
Purchase Agreement effective February 11, 2008 between Brad Foote Gear Works, Inc. and BFG Pittsburgh LLC (incorporated by reference to Exhibit 10.3 to the Company's Current Report on Form 8-K filed February 21, 2008) |
||
10.9 |
Assignment and Assumption of Purchase Agreement effective February 11, 2008 between Brad Foote Gear Works, Inc. and 5100 Neville Road, LLC (incorporated by reference to Exhibit 10.4 to the Company's Current Report on Form 8-K filed February 21, 2008) |
||
10.10 |
Securities Purchase Agreement dated March 1, 2007 among the Company, Tontine Capital Partners, L.P. and Tontine Capital Overseas Master Fund, L.P. (incorporated by reference to Exhibit 10.2 to the Company's Current Report on Form 8-K filed March 5, 2007) |
||
10.11 |
Securities Purchase Agreement dated August 22, 2007 among the Company, Tontine Capital Partners, L.P., Tontine Capital Overseas Master Fund, L.P., Tontine Partners, L.P., Tontine Overseas Fund, Ltd. and Tontine 25 Overseas Master Fund, L.P. (incorporated by reference to Exhibit 10.1 to the Company's Current Report on Form 8-K filed August 24, 2007) |
||
10.12 |
Amended and Restated Securities Purchase Agreement dated January 3, 2008 by and among the Company, Tontine Capital Partners, L.P., Tontine Partners, L.P., and Tontine 25 Overseas Master Fund, L.P. (incorporated by reference to Exhibit 10.1 to the Company's Current Report on Form 8-K filed January 4, 2008) |
||
10.13 |
Securities Purchase Agreement dated April 22, 2008 between Broadwind Energy, Inc., Tontine Capital Partners, L.P., Tontine Partners, L.P., Tontine Overseas Fund, Ltd., and Tontine 25 Overseas Master Fund, L.P. (incorporated by reference to Exhibit 10.2 to the Company's Current Report on Form 8-K filed April 28, 2008) |
||
10.14 |
Securities Purchase Agreement dated April 22, 2008 between Broadwind Energy, Inc. and Charles H. Beynon (incorporated by reference to Exhibit 10.2 to the Company's Current Report on Form 8-K filed April 28, 2008) |
||
10.15 |
Registration Rights Agreement dated March 1, 2007 among the Company, Tontine Capital Partners, L.P., and Tontine Capital Overseas Master Fund, L.P. (incorporated by reference to Exhibit 10.3 to the Company's Current Report on Form 8-K filed March 5, 2007) |
||
108
| Exhibit Number |
Description | ||
|---|---|---|---|
| 10.16 | Amendment to Registration Rights Agreement dated October 19, 2007, among the Company, Tontine Capital Partners, L.P., Tontine Capital Overseas Master Fund, L.P., Tontine Partners, L.P., Tontine Overseas Fund, Ltd. and Tontine 25 Overseas Master Fund, L.P. (incorporated by reference to Exhibit 10.6 to the Company's Current Report on Form 8-K filed October 24, 2007) | ||
10.17 |
Amendment No. 2 to Registration Rights Agreement among the Company, Tontine Capital Partners L.P., Tontine Partners, L.P., Tontine Capital Overseas Master Fund, L.P., Tontine 25 Overseas Master Fund, L.P., and Tontine Overseas Fund, Ltd. dated July 18, 2008 (incorporated by reference to Exhibit 10.1 to the Company's Current Report on Form 8-K filed July 23, 2008) |
||
10.18 |
Amendment No. 3 to Registration Rights Agreement among the Company, Tontine Capital Partners L.P., Tontine Partners, L.P., Tontine Capital Overseas Master Fund, L.P., Tontine 25 Overseas Master Fund, L.P., and Tontine Overseas Fund, Ltd. dated September 12, 2008 (incorporated by reference to Exhibit 10.1 to the Company's Current Report on Form 8-K filed September 12, 2008) |
||
10.19 |
Amendment No. 4, dated October 31, 2008, to Registration Rights Agreement dated March 1, 2007 and amended October 19, 2007, July 18, 2008 and September 12, 2008, among Broadwind Energy, Inc., Tontine Capital Partners, L.P., Tontine Capital Overseas Master Fund, L.P., Tontine Partners, L.P., Tontine Overseas Fund, Ltd. and Tontine 25 Overseas Master Fund, L.P. (incorporated by reference to Exhibit 10.1 to the Company's Current Report on Form 8-K filed November 4, 2008) |
||
10.20 |
Waiver relating to Registration Rights Agreement, dated January 9, 2009, by Tontine Capital Partners, L.P., Tontine Capital Overseas Master Fund, L.P., Tontine Partners, L.P., Tontine Overseas Fund, Ltd. and Tontine 25 Overseas Master Fund, L.P. (incorporated by reference to Exhibit 10.1 to the Company's Current Report on Form 8-K filed January 15, 2009) |
||
10.21 |
Registration Rights Agreement dated October 19, 2007 among the Company, J. Cameron Drecoll, Pat Rosmonowski, Dennis Palmer and Noel Davis (incorporated by reference to Exhibit 10.2 to the Company's Current Report on Form 8-K filed October 24, 2007) |
||
10.22 |
Registration Rights Agreement dated January 16, 2008 among the Company, EMS, Inc., Fagen, Inc., Joseph A. Kolbach and Daniel A. Yarano (incorporated by reference to Exhibit 10.2 to the Company's Current Report on Form 8-K filed January 23, 2008) |
||
10.23 |
Registration Rights Agreement dated April 24, 2008 between Broadwind Energy, Inc. and Charles H. Beynon (incorporated by reference to Exhibit 10.3 to the Company's Current Report on Form 8-K filed April 28, 2008) |
||
10.24 |
Registration Rights Agreement dated June 4, 2008 between Broadwind Energy, Inc. and the shareholders of Badger Transport, Inc. (incorporated by reference to Exhibit 10.1 to the Company's Current Report on Form 8-K filed June 10, 2008) |
||
10.25 |
† |
Employment Agreement dated October 19, 2007 between the Company and J. Cameron Drecoll (incorporated by reference to Exhibit 10.7 to the Company's Current Report on Form 8-K filed October 24, 2007) |
|
10.26 |
† |
Amended and Restated Employment Agreement dated November 12, 2008 between the Company and Lars Moller (incorporated by reference to Exhibit 10.1 to the Company's Current Report on Form 8-K/A filed November 18, 2008) |
|
109
| Exhibit Number |
Description | ||
|---|---|---|---|
| 10.27 | † | Amended and Restated Employment Agreement dated November 12, 2008 between the Company and Matthew J. Gadow (incorporated by reference to Exhibit 10.2 to the Company's Current Report on Form 8-K/A filed November 18, 2008) | |
10.28 |
† |
Employment Agreement dated as of June 30, 2008 between the Company and Robert A. Paxton (incorporated by reference to Exhibit 10.2 to the Company's Current Report on Form 8-K filed March 16, 2009)(1) |
|
10.29 |
† |
Employment Agreement dated as of August 1, 2008 between the Company and Jesse E. Collins, Jr. (incorporated by reference to Exhibit 99.2 to the Company's Current Report on Form 8-K filed January 14, 2010) |
|
10.30 |
† |
Employment Agreement dated as of June 30, 2008 between the Company and J.D. Rubin (incorporated by reference to Exhibit 10.3 to the Company's Current Report on Form 8-K filed March 16, 2009) |
|
10.31 |
† |
Employment Agreement dated as of July 29, 2009 between the Company and Stephanie K. Kushner (incorporated by reference to Exhibit 10.1 to the Company's Current Report on Form 8-K filed August 3, 2009) |
|
10.32 |
† |
Separation Agreement and Release dated as of April 30, 2009, by and between Broadwind Energy, Inc. and Matthew Gadow (incorporated by reference to Exhibit 10.9 to the Company's Current Report on Form 8-K filed May 1, 2009) |
|
10.33 |
† |
Deferred Compensation Plan (incorporated by reference to Exhibit 10.2 to the Company's Current Report on Form 8-K filed October 26, 2007) |
|
10.34 |
† |
2007 Equity Incentive Plan, as amended through August 8, 2008 (incorporated by reference to Exhibit 10.3 to the Company's Quarterly Report on Form 10-Q for the quarterly period ended June 30, 2008) |
|
10.35 |
† |
Form of Executive Incentive Stock Option Agreement (incorporated by reference to Exhibit 10.4 to the Company's Current Report on Form 8-K filed March 16, 2009) |
|
10.36 |
† |
Form of Incentive Stock Option Agreement (incorporated by reference to Exhibit 10.5 to the Company's Current Report on Form 8-K filed March 16, 2009) |
|
10.37 |
† |
Form of Nonqualified Option Agreement (incorporated by reference to Exhibit 10.6 to the Company's Current Report on Form 8-K filed March 16, 2009) |
|
10.38 |
† |
Form of Restricted Stock Award Agreement (incorporated by reference to Exhibit 10.7 to the Company's Current Report on Form 8-K filed March 16, 2009) |
|
10.39 |
† |
Form of Restricted Stock Unit Award Agreement (incorporated by reference to Exhibit 10.8 to the Company's Current Report on Form 8-K filed March 16, 2009) |
|
10.40 |
† |
Form of Performance Award Agreement (incorporated by reference to Exhibit 10.9 to the Company's Current Report on Form 8-K filed March 16, 2009) |
|
10.41 |
† |
Form of Stock Appreciation Rights Agreement (incorporated by reference to Exhibit 10.10 to the Company's Current Report on Form 8-K filed March 16, 2009) |
|
10.42 |
† |
Broadwind Energy, Inc. Executive Short-Term Incentive Plan (incorporated by reference to Exhibit 10.1 to the Company's Current Report on Form 8-K filed March 16, 2009) |
|
110
| Exhibit Number |
Description | ||
|---|---|---|---|
| 10.43 | Agreement Governing Extensions of Credit dated October 4, 2007 between Tower Tech Systems Inc. and Investors Community Bank (incorporated by reference to Exhibit 10.35 to the Company's Annual Report on Form 10-KSB for the fiscal year ended December 31, 2007) | ||
10.44 |
Commercial Promissory Note dated October 4, 2007, from Tower Tech Systems Inc. to Investors Community Bank (incorporated by reference to Exhibit 10.36 to the Company's Annual Report on Form 10-KSB for the fiscal year ended December 31, 2007) |
||
10.45 |
Commercial Loan Agreement dated October 4, 2007 between Tower Tech Systems Inc. and Investors Community Bank (incorporated by reference to Exhibit 10.37 to the Company's Annual Report on Form 10-KSB for the fiscal year ended December 31, 2007) |
||
10.46 |
Commercial Security Agreement dated October 4, 2007 between Tower Tech Systems Inc. and Investors Community Bank (incorporated by reference to Exhibit 10.38 to the Company's Annual Report on Form 10-KSB for the fiscal year ended December 31, 2007) |
||
10.47 |
Agreement Governing Extensions of Credit dated March 21, 2008 between Tower Tech Systems Inc. and Investors Community Bank (incorporated by reference to Exhibit 10.39 to the Company's Annual Report on Form 10-KSB for the fiscal year ended December 31, 2007) |
||
10.48 |
Commercial Promissory Note dated March 21, 2008, from Tower Tech Systems Inc. to Investors Community Bank (incorporated by reference to Exhibit 10.40 to the Company's Annual Report on Form 10-KSB for the fiscal year ended December 31, 2007) |
||
10.49 |
Commercial Loan Agreement dated March 21, 2008 between Tower Tech Systems Inc. and Investors Community Bank (incorporated by reference to Exhibit 10.41 to the Company's Annual Report on Form 10-KSB for the fiscal year ended December 31, 2007) |
||
10.50 |
Guaranty dated October 22, 2008, by the Company to Investors Community Bank for R.B.A. Inc. (incorporated by reference to Exhibit 10.56 to the Company's Annual Report on Form 10-K for the fiscal year ended December 31, 2008) |
||
10.51 |
Guaranty dated October 22, 2008, by the Company to Investors Community Bank for Tower Tech Systems Inc. (incorporated by reference to Exhibit 10.57 to the Company's Annual Report on Form 10-K for the fiscal year ended December 31, 2008) |
||
10.52 |
Commercial Debt Modification Agreement dated as of October 22, 2008 between Tower Tech Systems Inc. and Investors Community Bank (incorporated by reference to Exhibit 10.58 to the Company's Annual Report on Form 10-K for the fiscal year ended December 31, 2008) |
||
10.53 |
Guaranty dated October 22, 2008, by R.B.A. Inc. to Investors Community Bank for Tower Tech Systems Inc. (incorporated by reference to Exhibit 10.59 to the Company's Annual Report on Form 10-K for the fiscal year ended December 31, 2008) |
||
10.54 |
Guaranty dated October 22, 2008, by Tower Tech Systems Inc. to Investors Community Bank for R.B.A. Inc. (incorporated by reference to Exhibit 10.60 to the Company's Annual Report on Form 10-K for the fiscal year ended December 31, 2008) |
||
10.55 |
Agreement Governing Extensions of Credit dated March 13, 2009 between Tower Tech Systems Inc. and Investors Community Bank (incorporated by reference to Exhibit 10.88 to the Company's Annual Report on Form 10-K for the fiscal year ended December 31, 2008) |
||
111
| Exhibit Number |
Description | ||
|---|---|---|---|
| 10.56 | Commercial Debt Modification Agreement dated March 13, 2009 between Tower Tech Systems Inc. and Investors Community Bank (incorporated by reference to Exhibit 10.89 to the Company's Annual Report on Form 10-K for the fiscal year ended December 31, 2008) | ||
10.57 |
Agreement Governing Extensions of Credit dated March 13, 2009 between R.B.A. Inc. and Investors Community Bank (incorporated by reference to Exhibit 10.90 to the Company's Annual Report on Form 10-K for the fiscal year ended December 31, 2008) |
||
10.58 |
Commercial Debt Modification Agreement dated March 13, 2009 between R.B.A. Inc. and Investors Community Bank (incorporated by reference to Exhibit 10.91 to the Company's Annual Report on Form 10-K for the fiscal year ended December 31, 2008) |
||
10.59 |
Agreement Governing Extensions of Credit dated April 22, 2009 between Investors Community Bank and R.B.A. Inc. (incorporated by reference to Exhibit 10.1 to the Company's Quarterly Report on Form 10-Q for the quarterly period ended March 31, 2009) |
||
10.60 |
Master Amendment dated as of December 30, 2009 among Investors Community Bank, Tower Tech Systems Inc., and Broadwind Energy, Inc. (incorporated by reference to Exhibit 10.63 to the Company's Registration Statement on S-1 filed on January 5, 2010) |
||
10.61 |
Construction Loan Agreement, dated April 28, 2009, by and between Tower Tech Systems Inc. and Great Western Bank (incorporated by reference to Exhibit 10.1 to the Company's Current Report on Form 8-K filed May 1, 2009) |
||
10.62 |
Promissory Note, dated April 28, 2009, from Tower Tech Systems Inc. to Great Western Bank (incorporated by reference to Exhibit 10.2 to the Company's Current Report on Form 8-K filed May 1, 2009) |
||
10.63 |
Letter Agreement, dated April 28, 2009, by and among Broadwind Energy, Inc., Tower Tech Systems Inc. and Great Western Bank (incorporated by reference to Exhibit 10.96 to Amendment No. 1 to the Company's Registration Statement on Form S-1) |
||
10.64 |
Commercial Security Agreement, dated April 28, 2009, by and between Tower Tech Systems Inc. and Great Western Bank (incorporated by reference to Exhibit 10.4 to the Company's Current Report on Form 8-K filed May 1, 2009) |
||
10.65 |
Mortgage, dated April 28, 2009, from Tower Tech Systems Inc. to Great Western Bank (incorporated by reference to Exhibit 10.5 to the Company's Current Report on Form 8-K filed May 1, 2009) |
||
10.66 |
Assignment of Deposit Account, dated April 28, 2009, by and between Tower Tech Systems Inc. and Great Western Bank (incorporated by reference to Exhibit 10.6 to the Company's Current Report on Form 8-K filed May 1, 2009) |
||
10.67 |
Subordination Agreement, dated April 27, 2009, by and between Broadwind Energy, Inc. and Great Western Bank (incorporated by reference to Exhibit 10.7 to the Company's Current Report on Form 8-K filed May 1, 2009) |
||
10.68 |
Commercial Guaranty, dated April 27, 2009, from Broadwind Energy, Inc. to Great Western Bank (incorporated by reference to Exhibit 10.8 to the Company's Current Report on Form 8-K filed May 1, 2009) |
||
10.69 |
Change in Terms Agreement, dated December 22, 2009, by and between Tower Tech Systems Inc. and Great Western Bank (filed herewith) |
||
112
| Exhibit Number |
Description | ||
|---|---|---|---|
| 10.70 | Letter Agreement, dated December 22, 2009, by and among Broadwind Energy, Inc., Tower Tech Systems Inc. and Great Western Bank (filed herewith) | ||
10.71 |
Change in Terms Agreement, dated February 16, 2010, by and between Tower Tech Systems Inc. and Great Western Bank (filed herewith) |
||
10.72 |
Letter Agreement, dated February 16, 2010, by and among Broadwind Energy, Inc., Tower Tech Systems Inc. and Great Western Bank (filed herewith) |
||
21.1 |
Subsidiaries of Broadwind Energy, Inc. (filed herewith) |
||
23.1 |
Consent of Grant Thornton LLP (filed herewith) |
||
31.1 |
Rule 13a-14(a) Certification of Chief Executive Officer (filed herewith) |
||
31.2 |
Rule 13a-14(a) Certification of Chief Financial Officer (filed herewith) |
||
32.1 |
Certification Pursuant to 18 U.S.C. Section 1350, as Adopted Pursuant to Section 906 of the Sarbanes-Oxley Act of 2002 of Chief Executive Officer (filed herewith) |
||
32.2 |
Certification Pursuant to 18 U.S.C. Section 1350, as Adopted Pursuant to Section 906 of the Sarbanes-Oxley Act of 2002 of Chief Financial Officer (filed herewith) |
||
- †
- Indicates management contract or compensation plan or arrangement.
113