Attached files
| file | filename |
|---|---|
| EX-99.1 - EX-99.1 - Trinity Capital Inc. | tcpp-20210506xex99d1.htm |
| 8-K - 8-K - Trinity Capital Inc. | tcpp-20210506x8k.htm |
Exhibit 99.2
| A National Leader in Growth Stage Lending First Quarter 2021 Investor Presentation Exhibit 99.2 |

| © 2021 Trinity Capital Inc. | 2 Trinity Capital Inc. (the “Company”) cautions that this presentation may contain forward-looking statements that are based on current expectations and assumptions about future events, and which are not based in historical fact. The forward-looking statements in this presentation are based on current conditions as of the date of this presentation, and include, but are not limited to, statements regarding our financial objectives, beliefs, strategies, anticipated future operating results and cash flows, operating expenses, investment originations and performance, available capital, and payment of future dividends and stockholder returns. Although our management believes that the expectations reflected in any forward-looking statements are reasonable, actual results could differ materially from those expressed or implied in the forward-looking statements. By their nature, these forward-looking statements involve numerous assumptions, uncertainties and risks, both general and specific. The risk exists that these statements may not be fulfilled. We caution readers of this presentation not to place undue reliance on these forward-looking statements, as a number of factors could cause future Company results to differ materially from these statements. Forward-looking statements may be influenced in particular by factors such as fluctuations in interest rates and stock indices, the effects of competition in the areas in which we operate, and changes in economic, political and regulatory conditions, including as a result of the coronavirus (COVID-19) pandemic. When relying on forward-looking statements to make decisions, investors should carefully consider the aforementioned factors as well as other uncertainties and events. Historical results discussed in this presentation are not indicative of future results. The information disclosed in this presentation is made as of the date hereof and reflects Trinity Capital Inc.’s current assessment of its financial performance for the most recent period reported. Actual financial results filed with the Securities and Exchange Commission in the future may differ from those contained herein in the event of additional adjustments recorded prior to the filing of its financial statements. The information contained in this presentation should be viewed in conjunction with Trinity Capital Inc.'s most recently filed Quarterly Report on Form 10-Q, Annual Report on Form 10-K or Registration Statement on Form 424B1. We undertake no obligation to update the information contained herein to reflect subsequently occurring events or circumstances, except as required by applicable securities laws and regulations. This presentation does not constitute a prospectus and should under no circumstances be understood as an offer to sell or the solicitation of an offer to buy our common stock or any other securities nor will there be any sale of the common stock or any other securities referred to in this presentation in any state or jurisdiction in which such offer, solicitation or sale would be unlawful prior to the registration or qualification under the securities laws of such state or jurisdiction. Nothing in these materials should be construed as a recommendation to invest in any securities that may be issued by Trinity Capital Inc. or as legal, accounting or tax advice. FORWARD LOOKING STATEMENTS | DISCLAIMER |
| © 2021 Trinity Capital Inc. | 3 Company & Strategic Overview Financial Highlights Portfolio Highlights Venture Capital and Lending Market 4 13 23 30 34 Supplemental Information 36 Analyst Coverage INVESTOR PRESENTATION | AGENDA |
| COMPANY OVERVIEW |

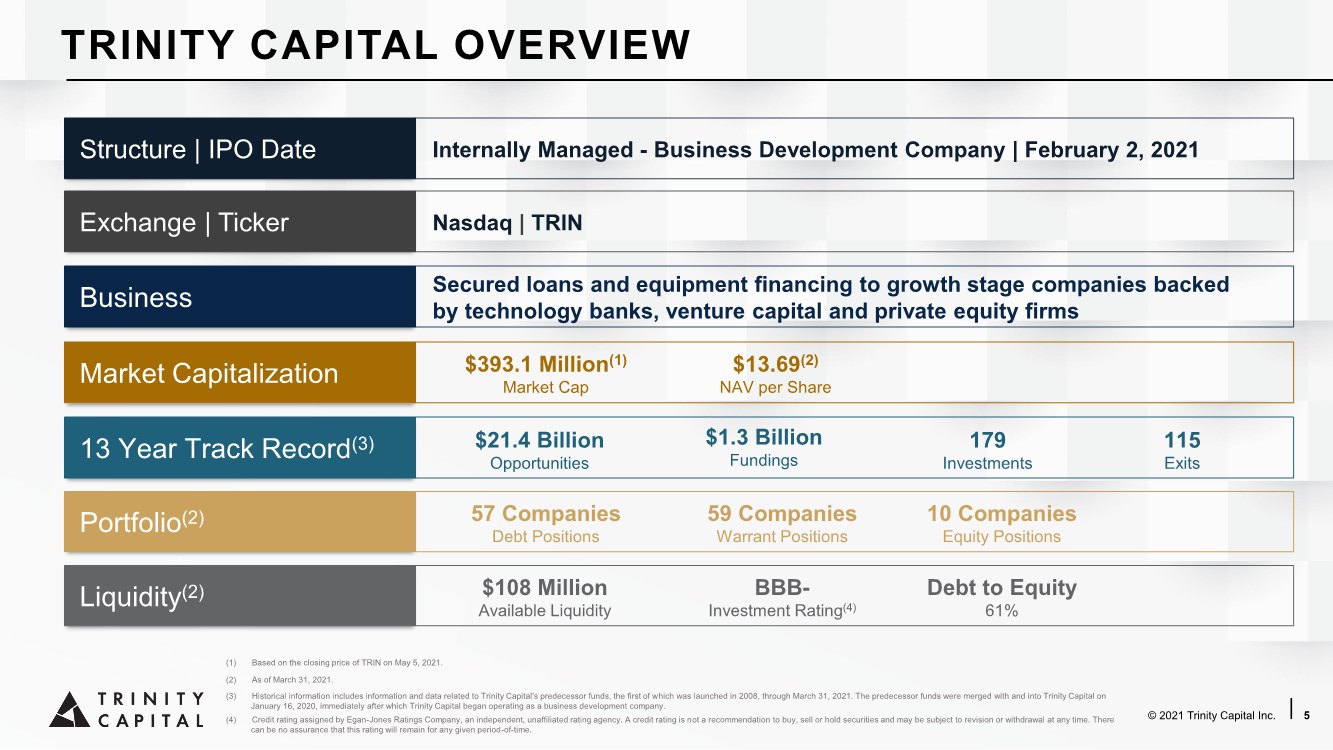
| © 2021 Trinity Capital Inc. | 5 Business Secured loans and equipment financing to growth stage companies backed by technology banks, venture capital and private equity firms 13 Year Track Record(3) Market Capitalization $13.69(2) NAV per Share Portfolio(2) $108 Million Available Liquidity Liquidity(2) $393.1 Million(1) Market Cap 59 Companies Warrant Positions 10 Companies Equity Positions $21.4 Billion Opportunities $1.3 Billion Fundings 179 Investments 115 Exits 57 Companies Debt Positions Internally Managed - Business Development Company | February 2, 2021 Structure | IPO Date BBB- Investment Rating(4) Debt to Equity 61% TRINITY CAPITAL OVERVIEW Nasdaq | TRIN Exchange | Ticker (3) Historical information includes information and data related to Trinity Capital's predecessor funds, the first of which was launched in 2008, through March 31, 2021. The predecessor funds were merged with and into Trinity Capital on January 16, 2020, immediately after which Trinity Capital began operating as a business development company. (1) Based on the closing price of TRIN on May 5, 2021. (4) Credit rating assigned by Egan-Jones Ratings Company, an independent, unaffiliated rating agency. A credit rating is not a recommendation to buy, sell or hold securities and may be subject to revision or withdrawal at any time. There can be no assurance that this rating will remain for any given period-of-time. (2) As of March 31, 2021. |
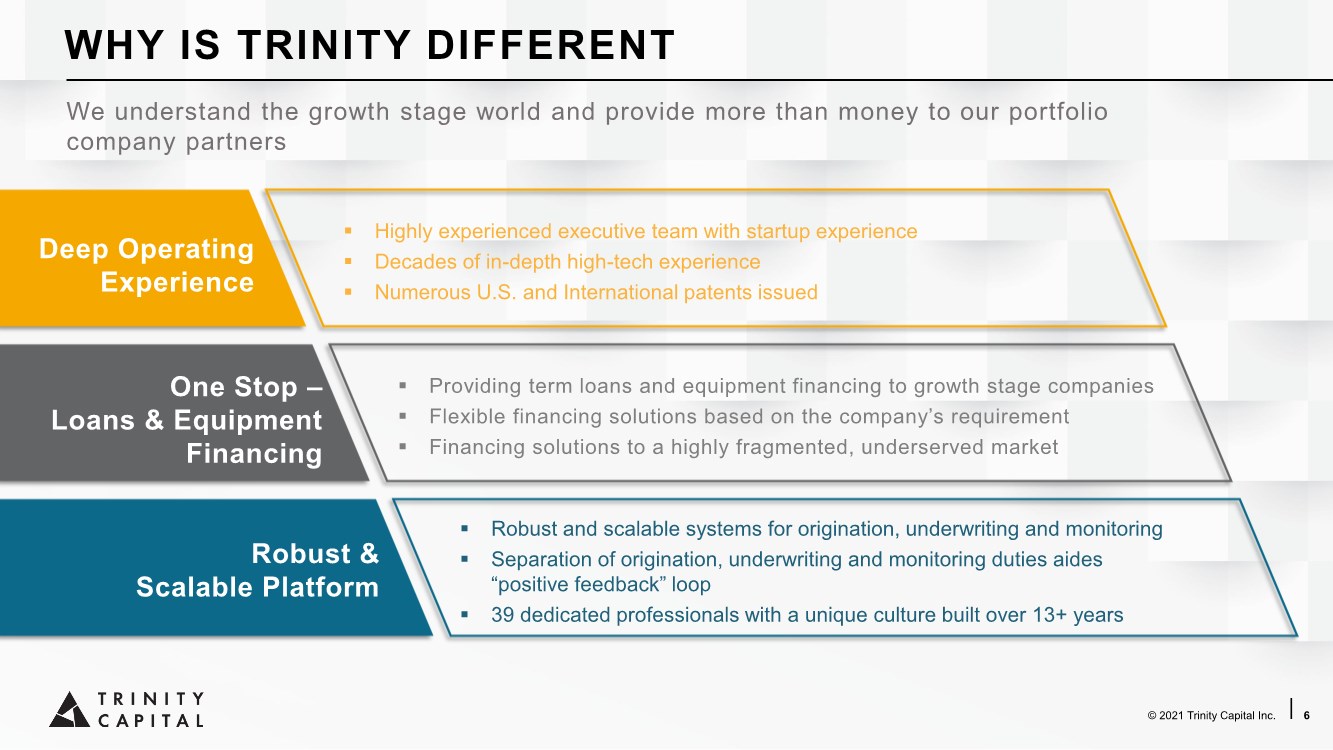
| © 2021 Trinity Capital Inc. | 6 We understand the growth stage world and provide more than money to our portfolio company partners Deep Operating Experience ▪ Highly experienced executive team with startup experience ▪ Decades of in-depth high-tech experience ▪ Numerous U.S. and International patents issued One Stop – Loans & Equipment Financing ▪ Providing term loans and equipment financing to growth stage companies ▪ Flexible financing solutions based on the company’s requirement ▪ Financing solutions to a highly fragmented, underserved market Robust & Scalable Platform ▪ Robust and scalable systems for origination, underwriting and monitoring ▪ Separation of origination, underwriting and monitoring duties aides “positive feedback” loop ▪ 39 dedicated professionals with a unique culture built over 13+ years WHY IS TRINITY DIFFERENT |
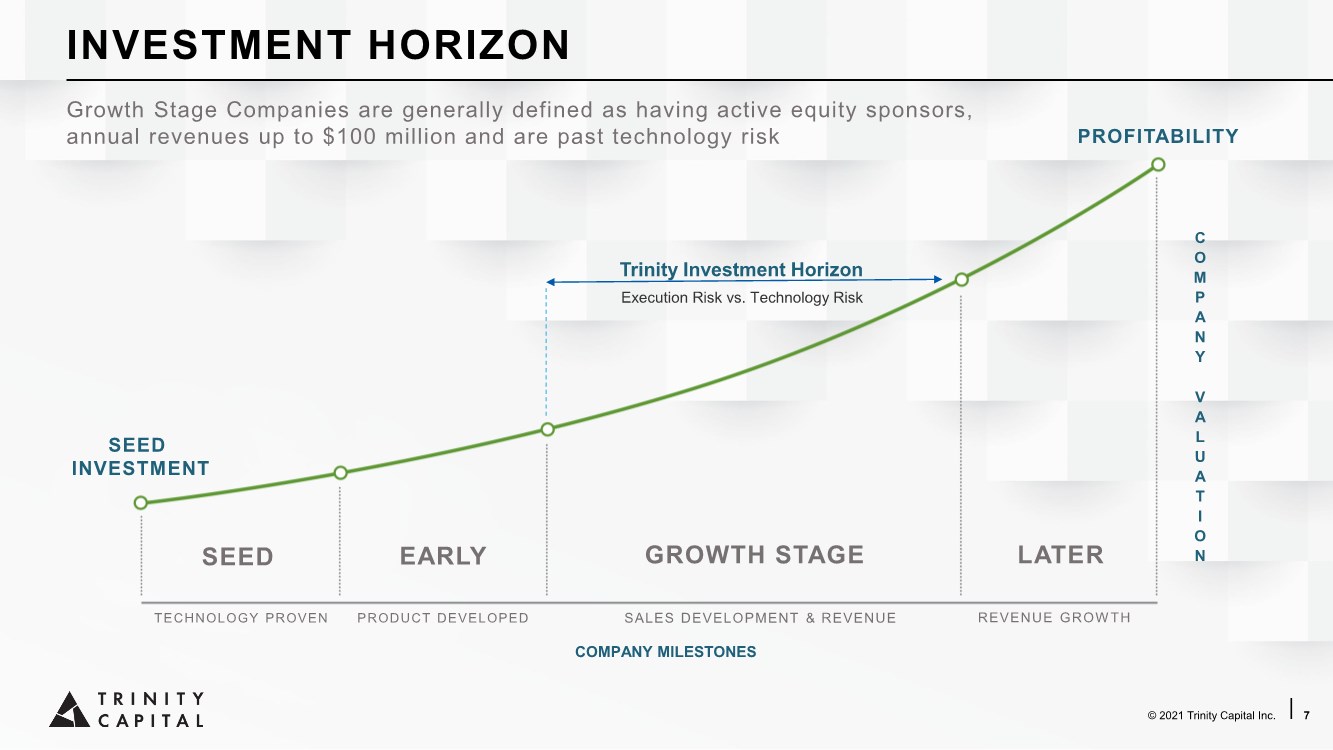
| © 2021 Trinity Capital Inc. | 7 SEED SEED INVESTMENT PROFITABILITY EARLY GROWTH STAGE LATER TECHNOLOGY PROVEN PRODUCT DEVELOPED SALES DEVELOPMENT & REVENUE REVENUE GROWTH C O M P A N Y V A L U A T I O N COMPANY MILESTONES Trinity Investment Horizon Execution Risk vs. Technology Risk INVESTMENT HORIZON Growth Stage Companies are generally defined as having active equity sponsors, annual revenues up to $100 million and are past technology risk |
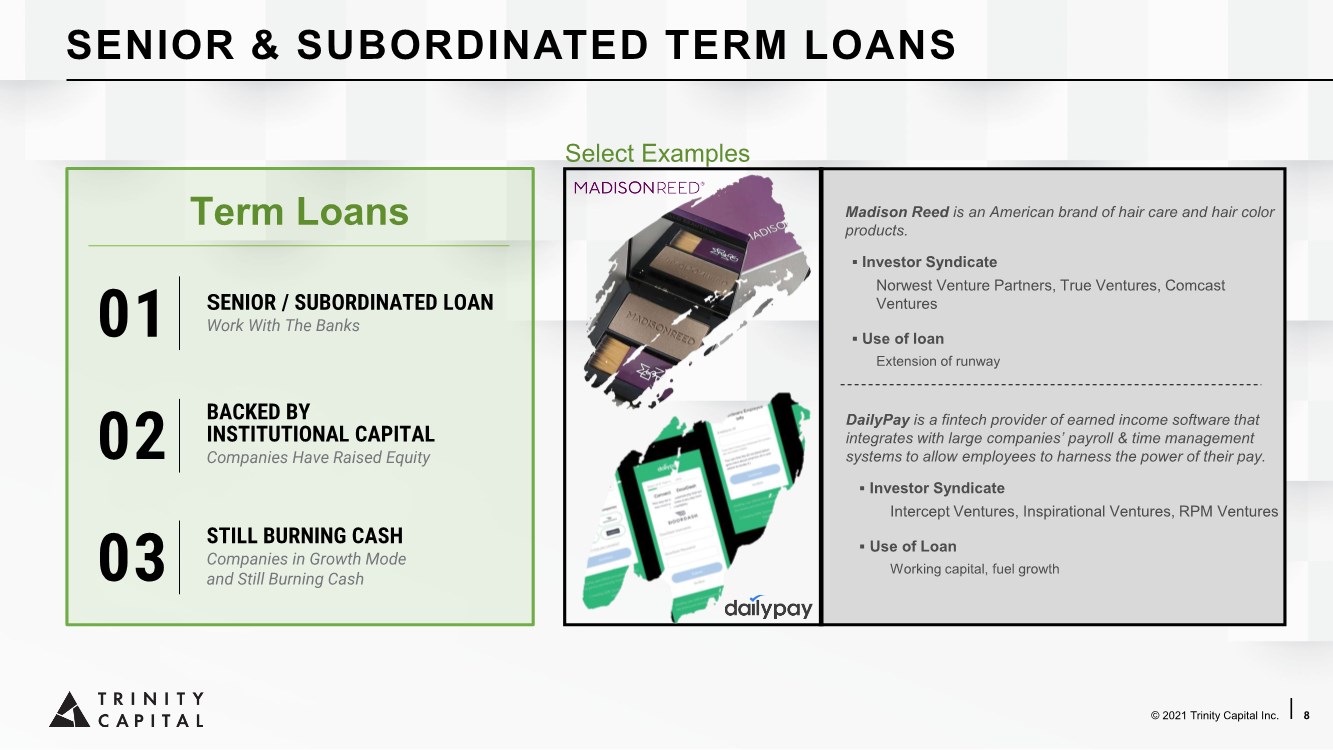
| © 2021 Trinity Capital Inc. | 8 Term Loans Madison Reed is an American brand of hair care and hair color products. ▪ Investor Syndicate Norwest Venture Partners, True Ventures, Comcast Ventures ▪ Use of loan Extension of runway DailyPay is a fintech provider of earned income software that integrates with large companies’ payroll & time management systems to allow employees to harness the power of their pay. ▪ Investor Syndicate Intercept Ventures, Inspirational Ventures, RPM Ventures ▪ Use of Loan Working capital, fuel growth Select Examples SENIOR & SUBORDINATED TERM LOANS 01 SENIOR / SUBORDINATED LOAN Work With The Banks 02 BACKED BY INSTITUTIONAL CAPITAL Companies Have Raised Equity 03 STILL BURNING CASH Companies in Growth Mode and Still Burning Cash |
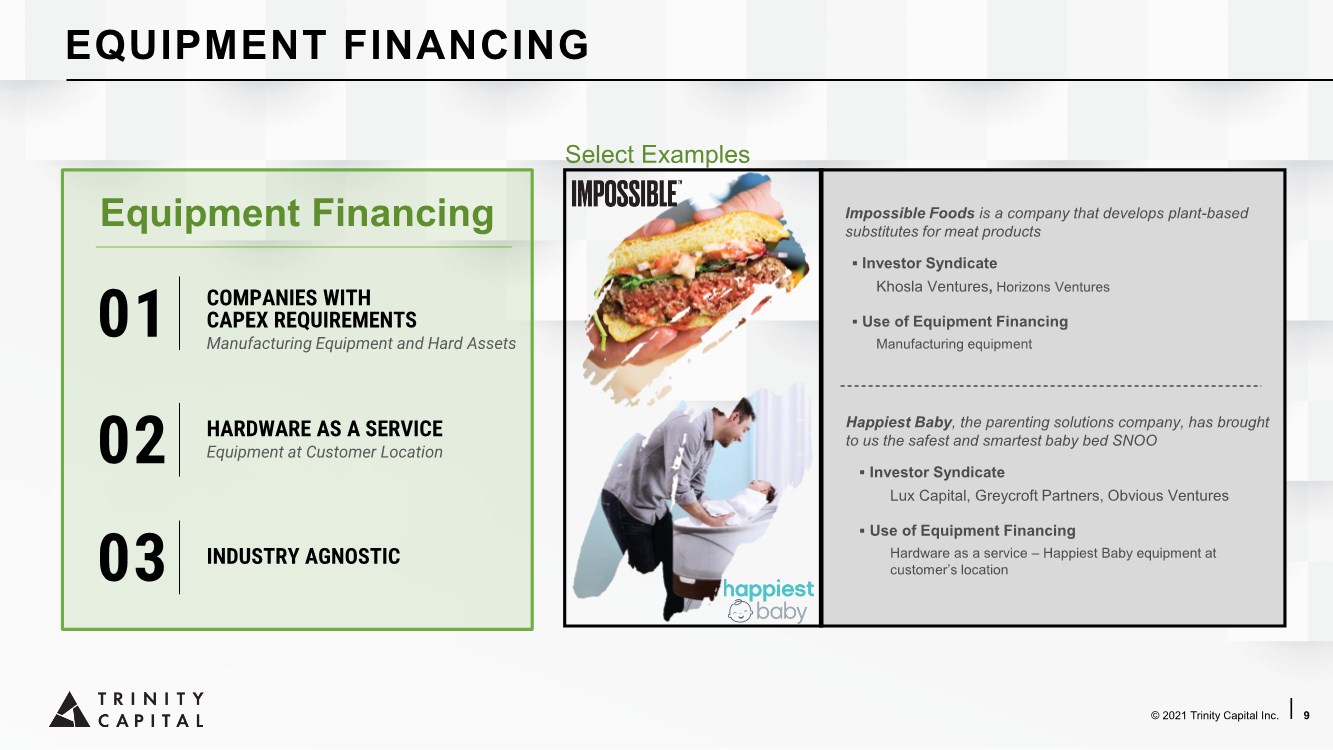
| © 2021 Trinity Capital Inc. | 9 Equipment Financing Impossible Foods is a company that develops plant-based substitutes for meat products ▪ Investor Syndicate Khosla Ventures, Horizons Ventures ▪ Use of Equipment Financing Manufacturing equipment Happiest Baby, the parenting solutions company, has brought to us the safest and smartest baby bed SNOO ▪ Investor Syndicate Lux Capital, Greycroft Partners, Obvious Ventures ▪ Use of Equipment Financing Hardware as a service – Happiest Baby equipment at customer’s location Select Examples EQUIPMENT FINANCING 01 COMPANIES WITH CAPEX REQUIREMENTS Manufacturing Equipment and Hard Assets 02 HARDWARE AS A SERVICE Equipment at Customer Location 03 INDUSTRY AGNOSTIC |
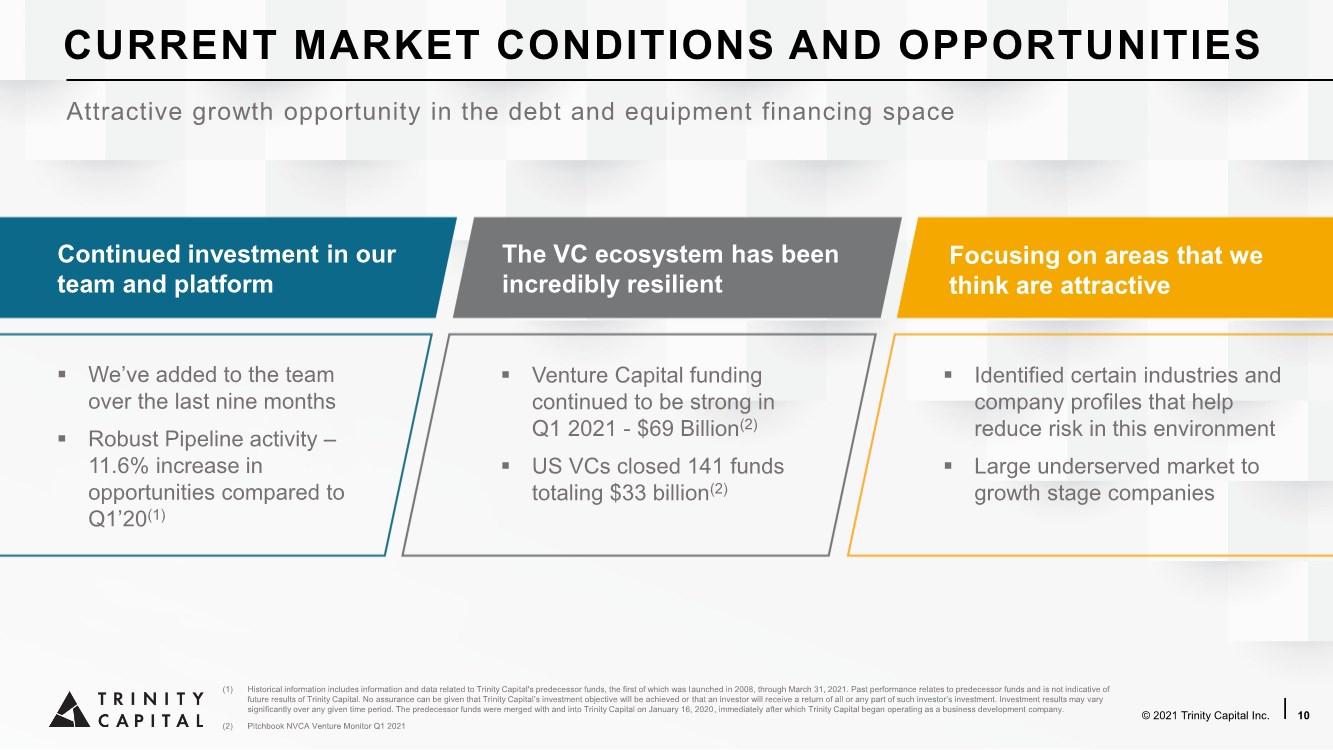
| © 2021 Trinity Capital Inc. | 10 Continued investment in our team and platform ▪ We’ve added to the team over the last nine months ▪ Robust Pipeline activity – 11.6% increase in opportunities compared to Q1’20(1) The VC ecosystem has been incredibly resilient ▪ Venture Capital funding continued to be strong in Q1 2021 - $69 Billion(2) ▪ US VCs closed 141 funds totaling $33 billion(2) Focusing on areas that we think are attractive ▪ Identified certain industries and company profiles that help reduce risk in this environment ▪ Large underserved market to growth stage companies (1) Historical information includes information and data related to Trinity Capital's predecessor funds, the first of which was launched in 2008, through March 31, 2021. Past performance relates to predecessor funds and is not indicative of future results of Trinity Capital. No assurance can be given that Trinity Capital’s investment objective will be achieved or that an investor will receive a return of all or any part of such investor’s investment. Investment results may vary significantly over any given time period. The predecessor funds were merged with and into Trinity Capital on January 16, 2020, immediately after which Trinity Capital began operating as a business development company. (2) Pitchbook NVCA Venture Monitor Q1 2021 CURRENT MARKET CONDITIONS AND OPPORTUNITIES Attractive growth opportunity in the debt and equipment financing space |
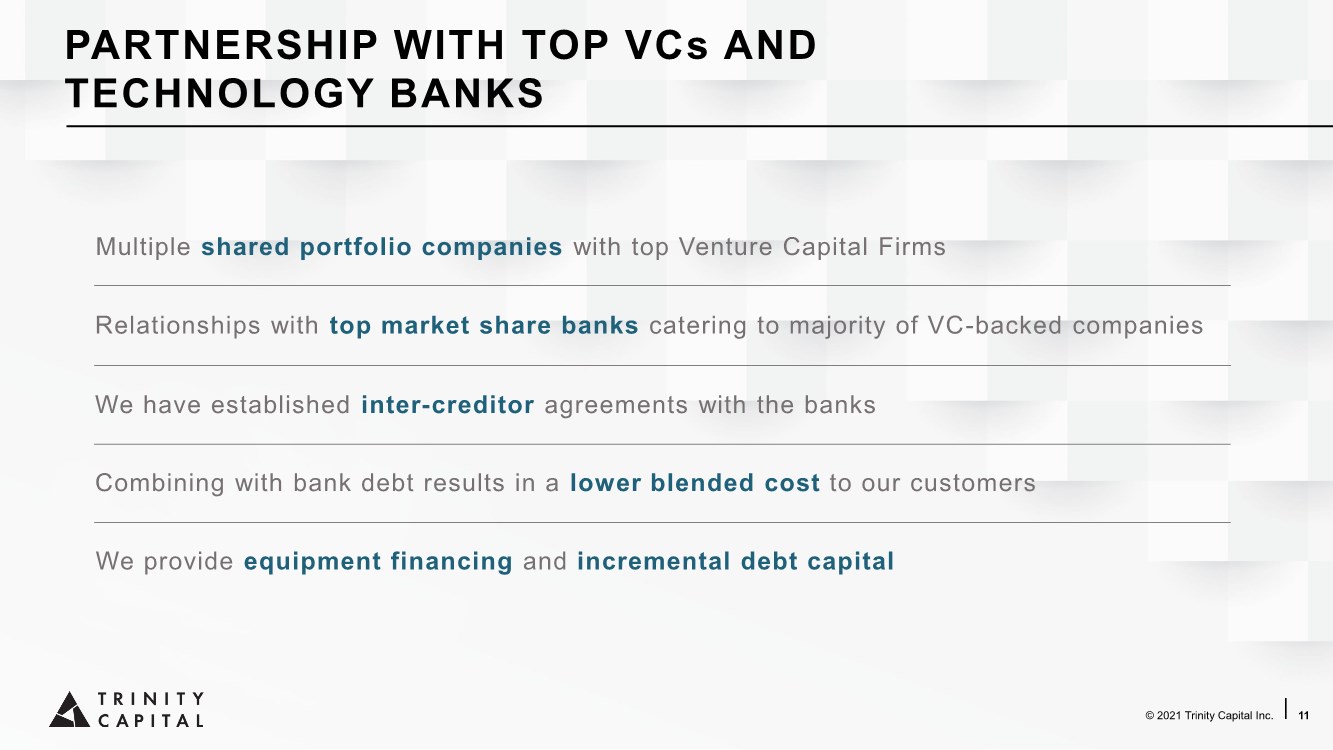
| © 2021 Trinity Capital Inc. | 11 Multiple shared portfolio companies with top Venture Capital Firms We have established inter-creditor agreements with the banks Combining with bank debt results in a lower blended cost to our customers We provide equipment financing and incremental debt capital Relationships with top market share banks catering to majority of VC-backed companies PARTNERSHIP WITH TOP VCs AND TECHNOLOGY BANKS |
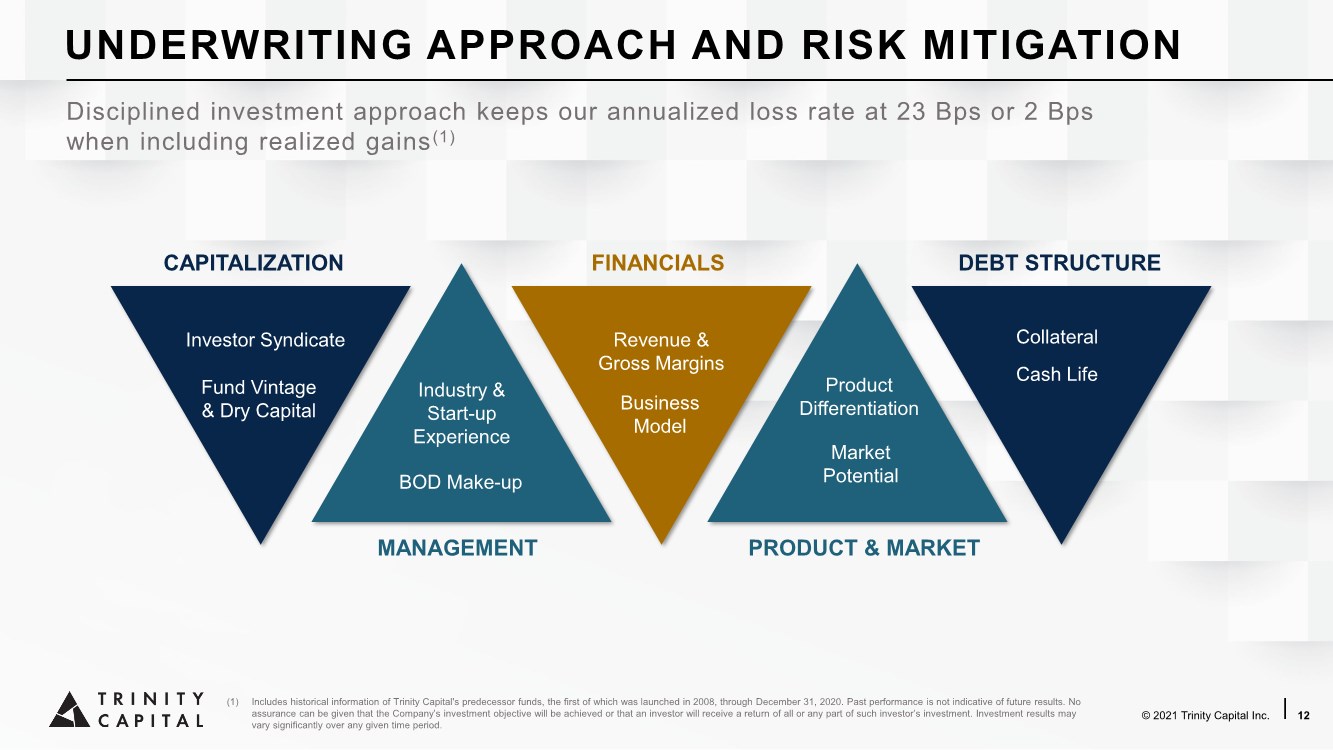
| © 2021 Trinity Capital Inc. | 12 Investor Syndicate Revenue & Gross Margins Business Model (1) Includes historical information of Trinity Capital's predecessor funds, the first of which was launched in 2008, through December 31, 2020. Past performance is not indicative of future results. No assurance can be given that the Company’s investment objective will be achieved or that an investor will receive a return of all or any part of such investor’s investment. Investment results may vary significantly over any given time period. FINANCIALS DEBT STRUCTURE CAPITALIZATION MANAGEMENT PRODUCT & MARKET Product Differentiation Market Potential Industry & Start-up Experience BOD Make-up Fund Vintage & Dry Capital Collateral Cash Life UNDERWRITING APPROACH AND RISK MITIGATION Disciplined investment approach keeps our annualized loss rate at 23 Bps or 2 Bps when including realized gains(1) |
| FINANCIAL HIGHLIGHTS |

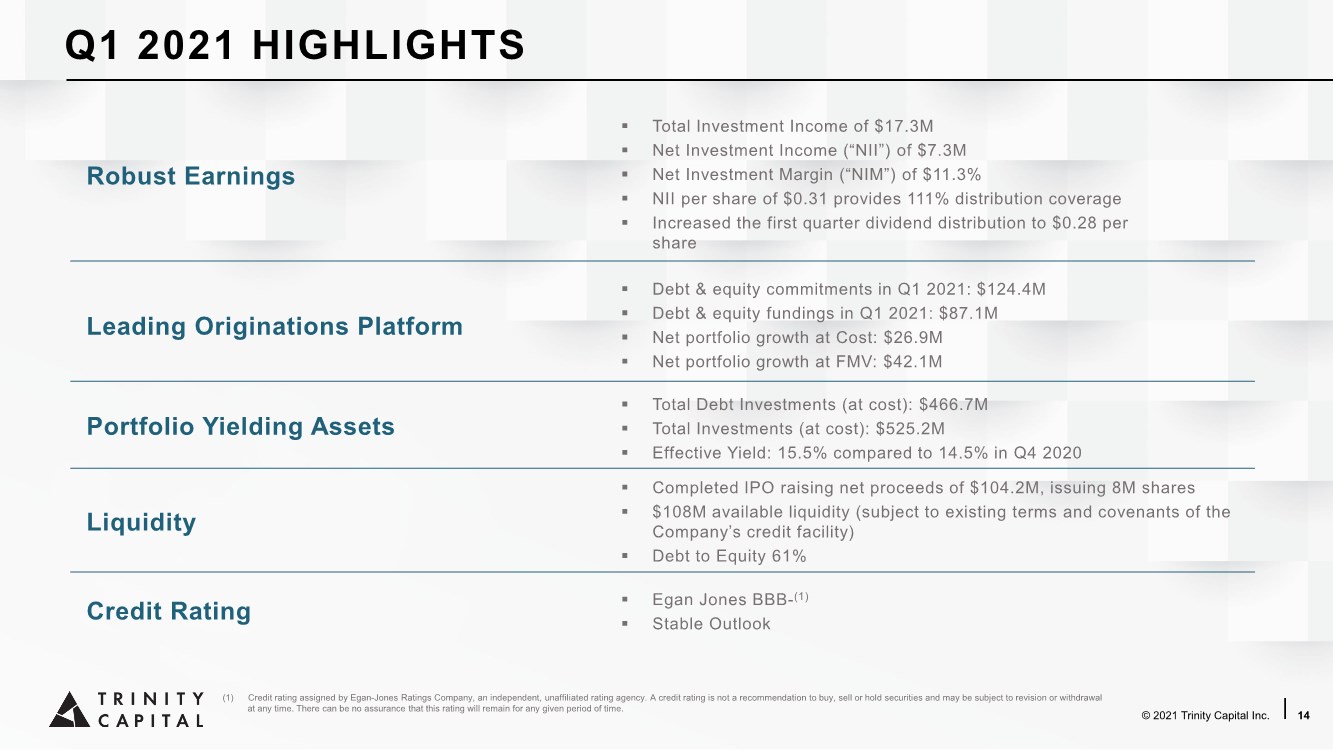
| © 2021 Trinity Capital Inc. | 14 ▪ Total Investment Income of $17.3M ▪ Net Investment Income (“NII”) of $7.3M ▪ Net Investment Margin (“NIM”) of $11.3% ▪ NII per share of $0.31 provides 111% distribution coverage ▪ Increased the first quarter dividend distribution to $0.28 per share Robust Earnings Leading Originations Platform Portfolio Yielding Assets Liquidity Credit Rating ▪ Total Debt Investments (at cost): $466.7M ▪ Total Investments (at cost): $525.2M ▪ Effective Yield: 15.5% compared to 14.5% in Q4 2020 ▪ Debt & equity commitments in Q1 2021: $124.4M ▪ Debt & equity fundings in Q1 2021: $87.1M ▪ Net portfolio growth at Cost: $26.9M ▪ Net portfolio growth at FMV: $42.1M ▪ Completed IPO raising net proceeds of $104.2M, issuing 8M shares ▪ $108M available liquidity (subject to existing terms and covenants of the Company’s credit facility) ▪ Debt to Equity 61% ▪ Egan Jones BBB-(1) ▪ Stable Outlook Q1 2021 HIGHLIGHTS (1) Credit rating assigned by Egan-Jones Ratings Company, an independent, unaffiliated rating agency. A credit rating is not a recommendation to buy, sell or hold securities and may be subject to revision or withdrawal at any time. There can be no assurance that this rating will remain for any given period of time. |
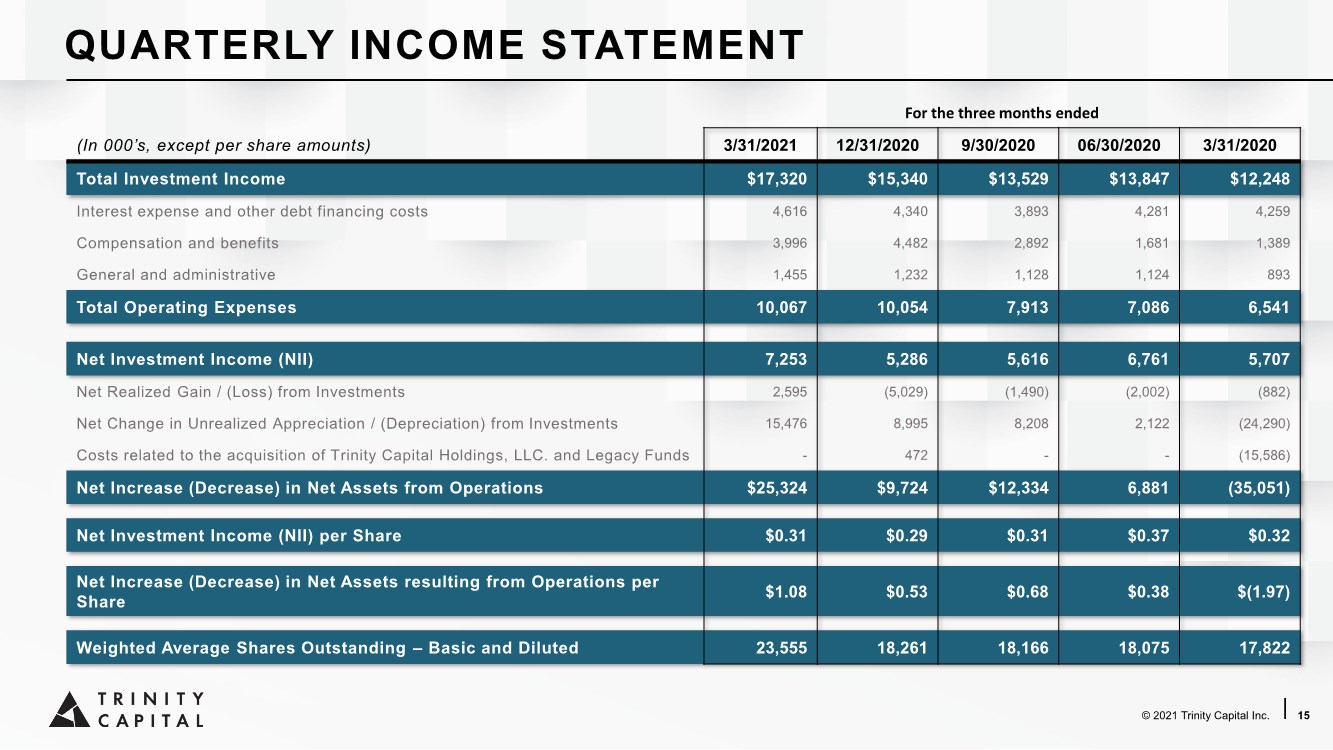
| © 2021 Trinity Capital Inc. | 15 For the three months ended (In 000’s, except per share amounts) 3/31/2021 12/31/2020 9/30/2020 06/30/2020 3/31/2020 Total Investment Income $17,320 $15,340 $13,529 $13,847 $12,248 Interest expense and other debt financing costs 4,616 4,340 3,893 4,281 4,259 Compensation and benefits 3,996 4,482 2,892 1,681 1,389 General and administrative 1,455 1,232 1,128 1,124 893 Total Operating Expenses 10,067 10,054 7,913 7,086 6,541 Net Investment Income (NII) 7,253 5,286 5,616 6,761 5,707 Net Realized Gain / (Loss) from Investments 2,595 (5,029) (1,490) (2,002) (882) Net Change in Unrealized Appreciation / (Depreciation) from Investments 15,476 8,995 8,208 2,122 (24,290) Costs related to the acquisition of Trinity Capital Holdings, LLC. and Legacy Funds - 472 --(15,586) Net Increase (Decrease) in Net Assets from Operations $25,324 $9,724 $12,334 6,881 (35,051) Net Investment Income (NII) per Share $0.31 $0.29 $0.31 $0.37 $0.32 Net Increase (Decrease) in Net Assets resulting from Operations per Share $1.08 $0.53 $0.68 $0.38 $(1.97) Weighted Average Shares Outstanding – Basic and Diluted 23,555 18,261 18,166 18,075 17,822 QUARTERLY INCOME STATEMENT |
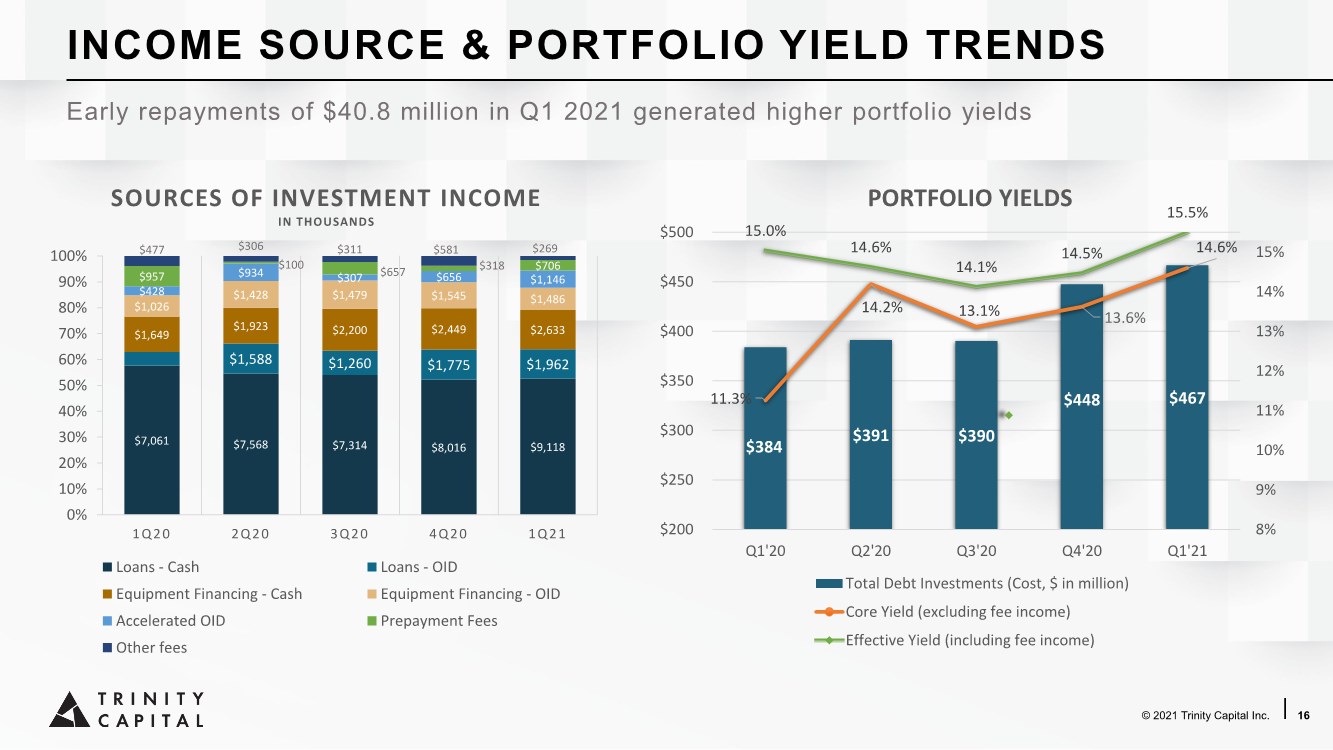
| © 2021 Trinity Capital Inc. | 16 INCOME SOURCE & PORTFOLIO YIELD TRENDS $384 $391 $390 $448 $467 11.3% 14.2% 13.1% 13.6% 14.6% 15.0% 14.6% 14.1% 14.5% 15.5% 8% 9% 10% 11% 12% 13% 14% 15% $200 $250 $300 $350 $400 $450 $500 Q1'20 Q2'20 Q3'20 Q4'20 Q1'21 PORTFOLIO YIELDS Total Debt Investments (Cost, $ in million) Core Yield (excluding fee income) Effective Yield (including fee income) Early repayments of $40.8 million in Q1 2021 generated higher portfolio yields $7,061 $7,568 $7,314 $8,016 $9,118 $1,588 $1,260 $1,775 $1,962 $1,649 $1,923 $2,200 $2,449 $2,633 $1,026 $1,428 $1,479 $1,545 $1,486 $428 $934 $307 $656 $1,146 $957 $100 $657 $318 $706 $477 $306 $311 $581 $269 0% 10% 20% 30% 40% 50% 60% 70% 80% 90% 100% 1Q20 2Q20 3Q20 4Q20 1Q21 SOURCES OF INVESTMENT INCOME IN THOUSANDS Loans - Cash Loans - OID Equipment Financing - Cash Equipment Financing - OID Accelerated OID Prepayment Fees Other fees |
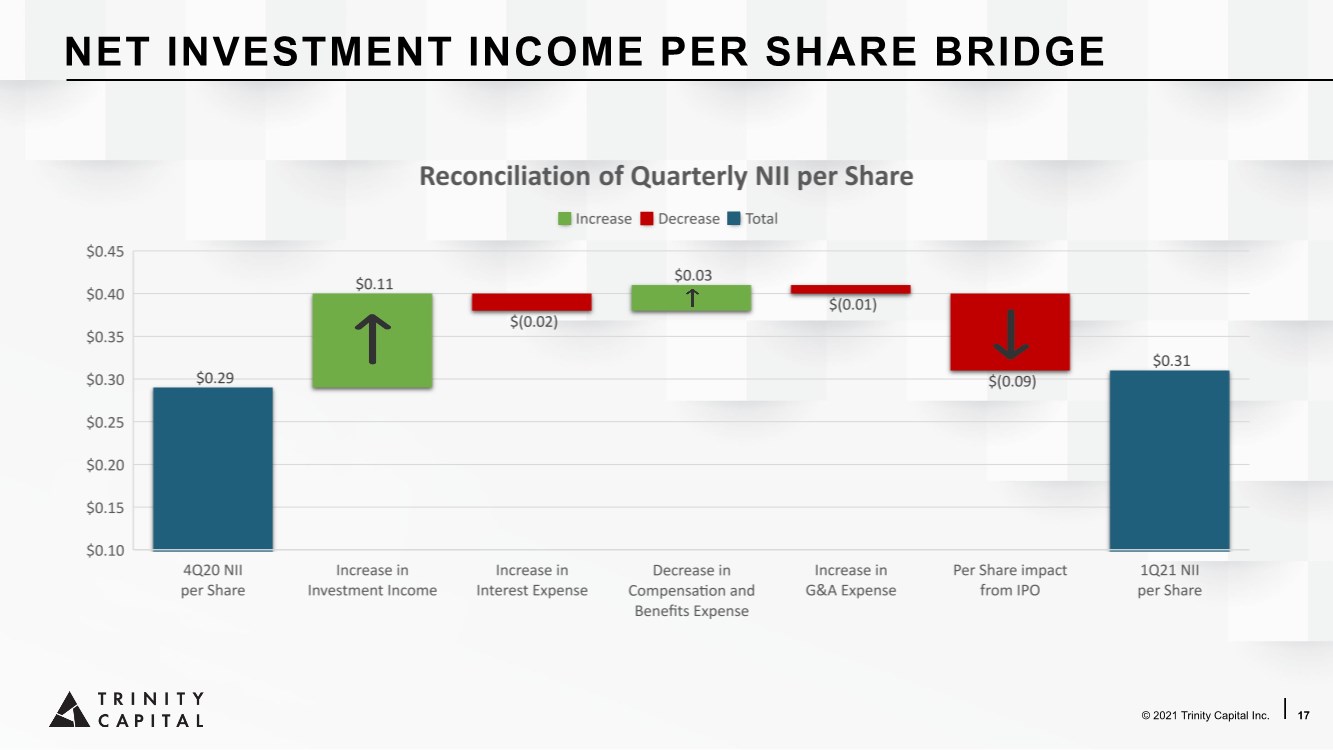
| © 2021 Trinity Capital Inc. | 17 NET INVESTMENT INCOME PER SHARE BRIDGE |
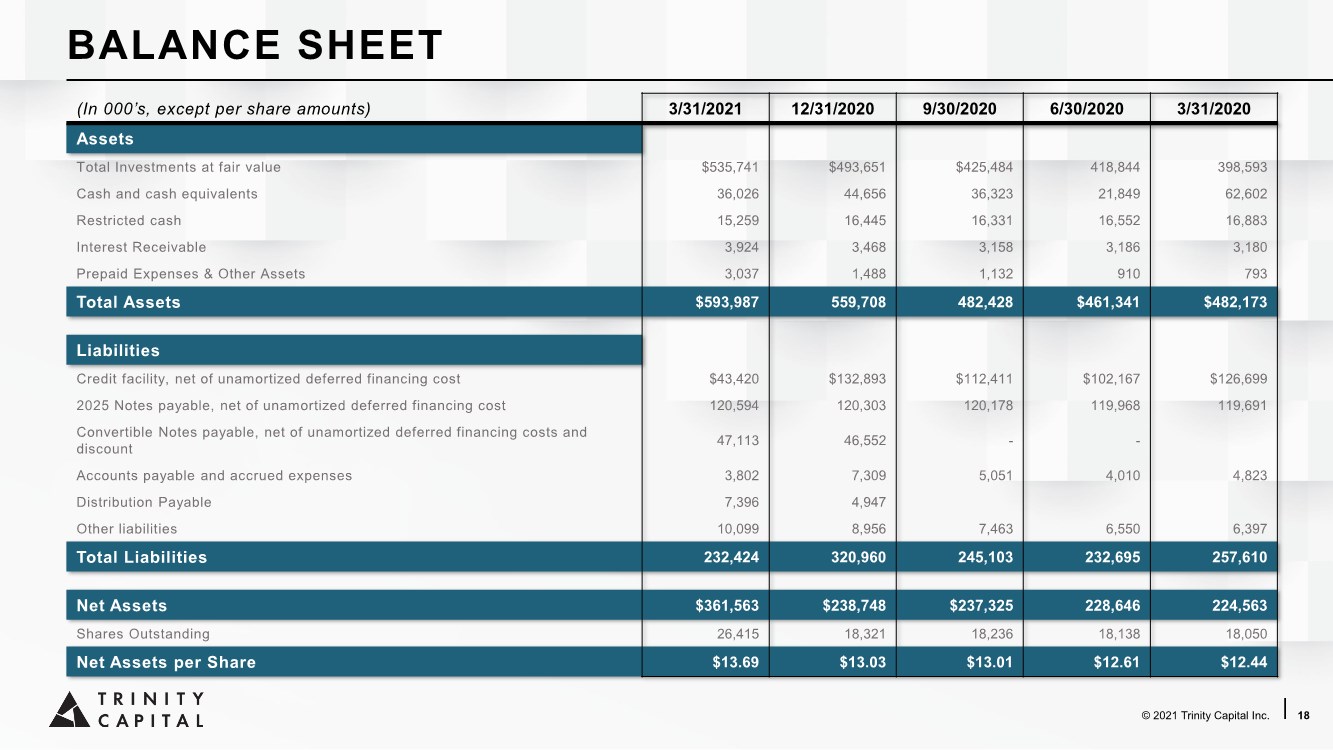
| © 2021 Trinity Capital Inc. | 18 (In 000’s, except per share amounts) 3/31/2021 12/31/2020 9/30/2020 6/30/2020 3/31/2020 Assets Total Investments at fair value $535,741 $493,651 $425,484 418,844 398,593 Cash and cash equivalents 36,026 44,656 36,323 21,849 62,602 Restricted cash 15,259 16,445 16,331 16,552 16,883 Interest Receivable 3,924 3,468 3,158 3,186 3,180 Prepaid Expenses & Other Assets 3,037 1,488 1,132 910 793 Total Assets $593,987 559,708 482,428 $461,341 $482,173 Liabilities Credit facility, net of unamortized deferred financing cost $43,420 $132,893 $112,411 $102,167 $126,699 2025 Notes payable, net of unamortized deferred financing cost 120,594 120,303 120,178 119,968 119,691 Convertible Notes payable, net of unamortized deferred financing costs and discount 47,113 46,552 -- Accounts payable and accrued expenses 3,802 7,309 5,051 4,010 4,823 Distribution Payable 7,396 4,947 Other liabilities 10,099 8,956 7,463 6,550 6,397 Total Liabilities 232,424 320,960 245,103 232,695 257,610 Net Assets $361,563 $238,748 $237,325 228,646 224,563 Shares Outstanding 26,415 18,321 18,236 18,138 18,050 Net Assets per Share $13.69 $13.03 $13.01 $12.61 $12.44 BALANCE SHEET |
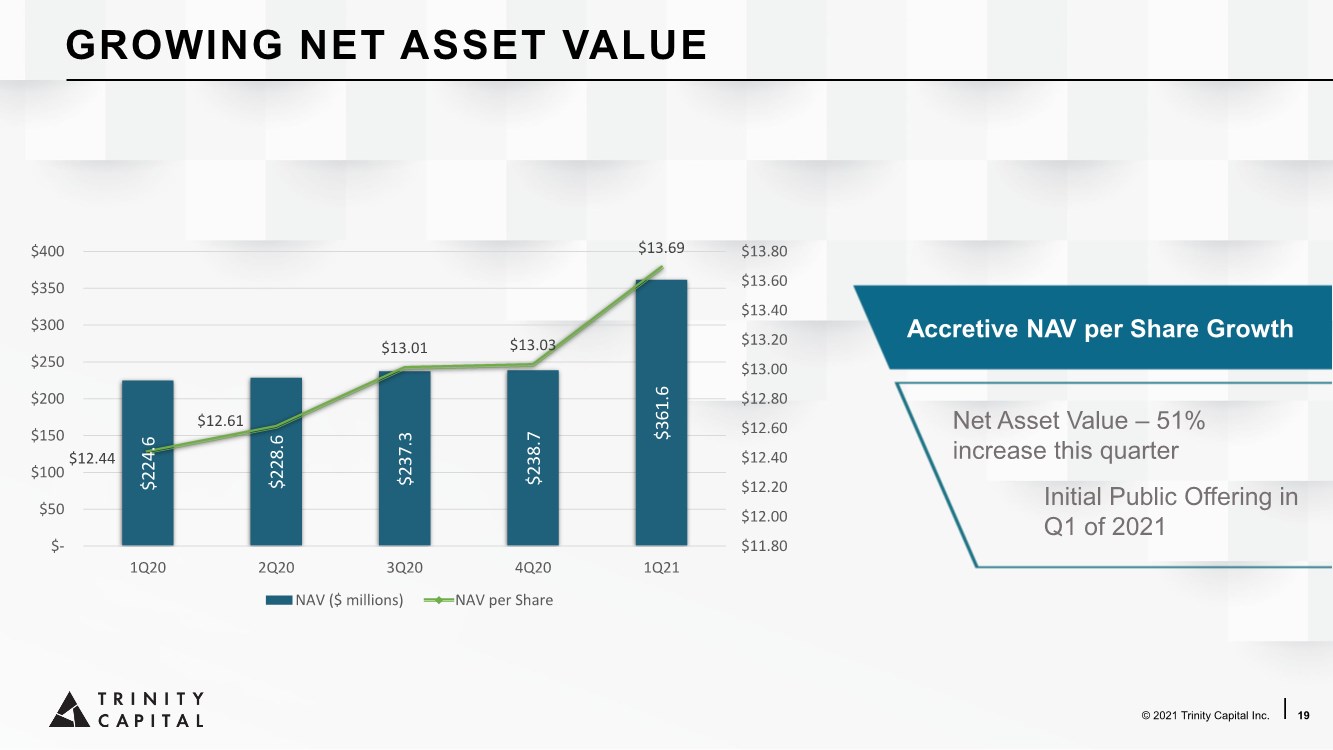
| © 2021 Trinity Capital Inc. | 19 GROWING NET ASSET VALUE Accretive NAV per Share Growth Net Asset Value – 51% increase this quarter Initial Public Offering in Q1 of 2021 $224.6 $228.6 $237.3 $238.7 $361.6 $12.44 $12.61 $13.01 $13.03 $13.69 $11.80 $12.00 $12.20 $12.40 $12.60 $12.80 $13.00 $13.20 $13.40 $13.60 $13.80 $- $50 $100 $150 $200 $250 $300 $350 $400 1Q20 2Q20 3Q20 4Q20 1Q21 NAV ($ millions) NAV per Share |
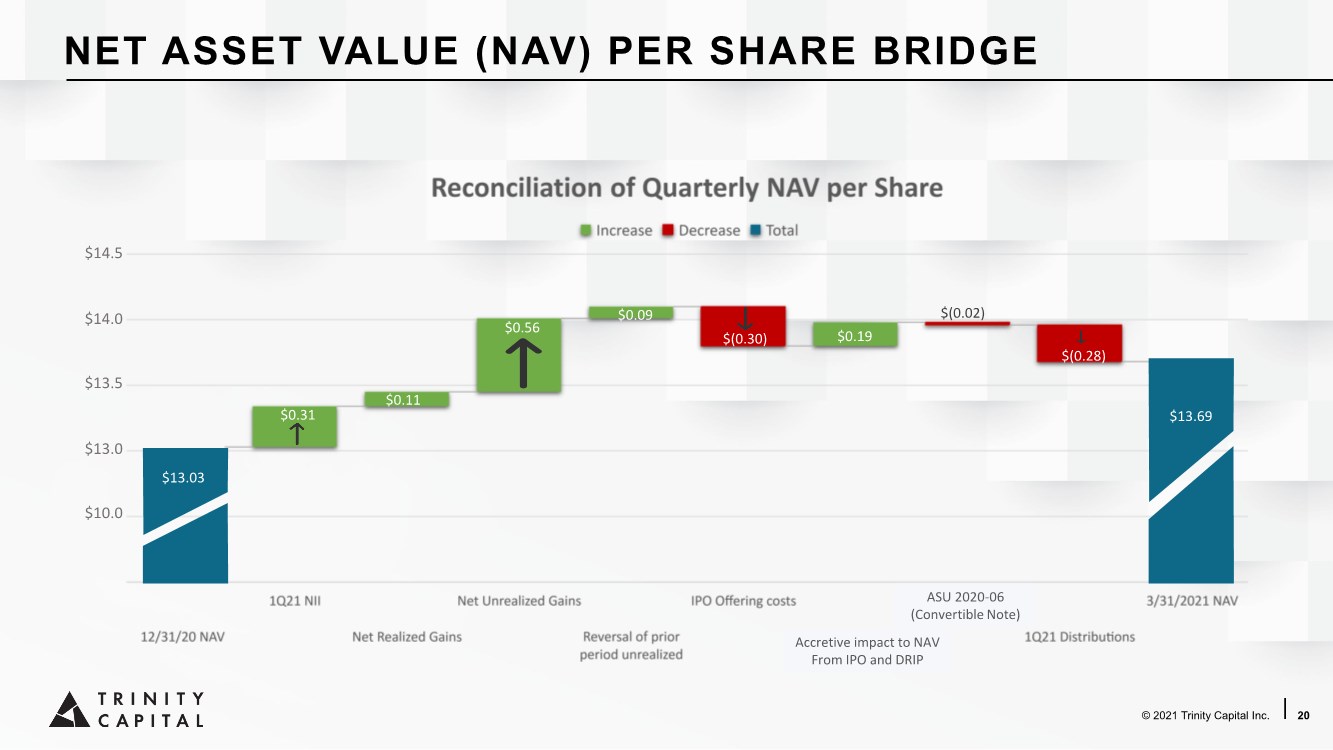
| © 2021 Trinity Capital Inc. | 20 NET ASSET VALUE (NAV) PER SHARE BRIDGE $10.0 $13.0 $13.5 $14.0 $14.5 $13.03 $0.31 $0.11 $0.56 $0.09 $(0.30) $0.19 $(0.02) $(0.28) $13.69 ASU 2020-06 (Convertible Note) Accretive impact to NAV From IPO and DRIP |
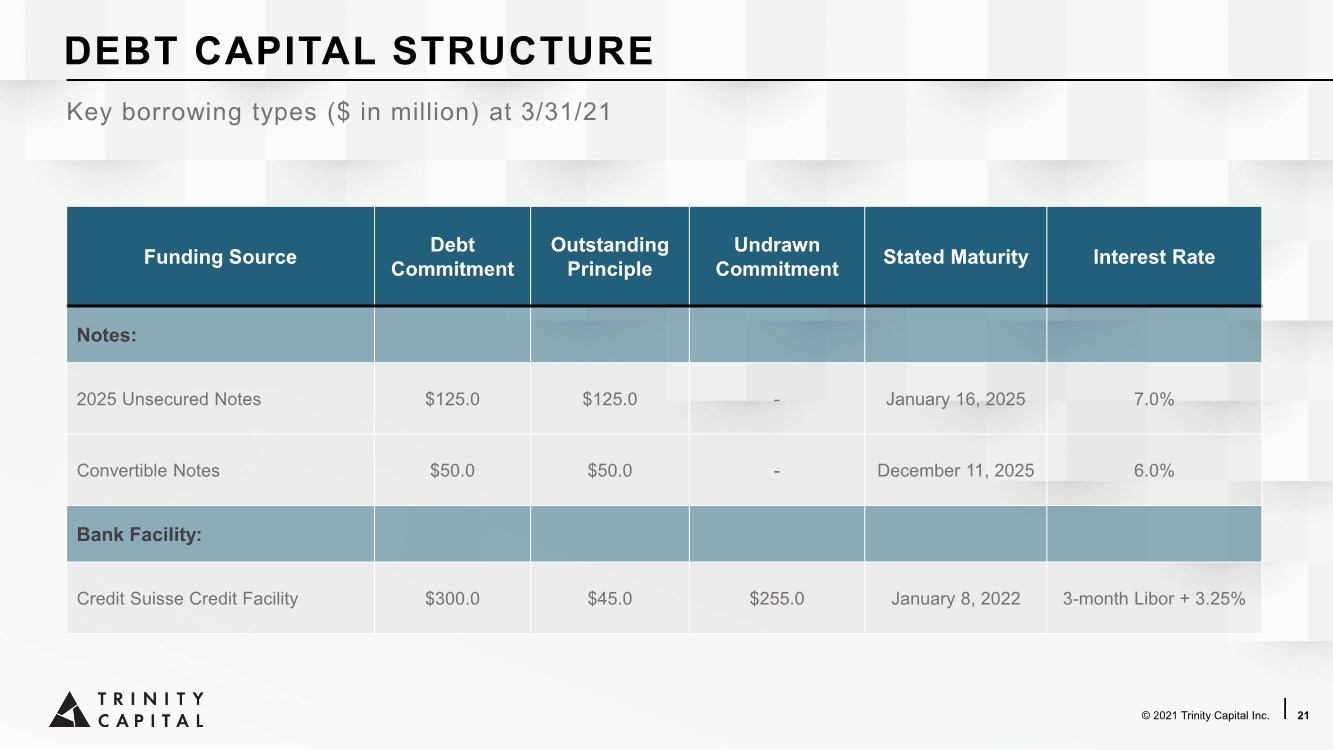
| © 2021 Trinity Capital Inc. | 21 Key borrowing types ($ in million) at 3/31/21 Funding Source Debt Commitment Outstanding Principle Undrawn Commitment Stated Maturity Interest Rate Notes: 2025 Unsecured Notes $125.0 $125.0 - January 16, 2025 7.0% Convertible Notes $50.0 $50.0 - December 11, 2025 6.0% Bank Facility: Credit Suisse Credit Facility $300.0 $45.0 $255.0 January 8, 2022 3-month Libor + 3.25% DEBT CAPITAL STRUCTURE |
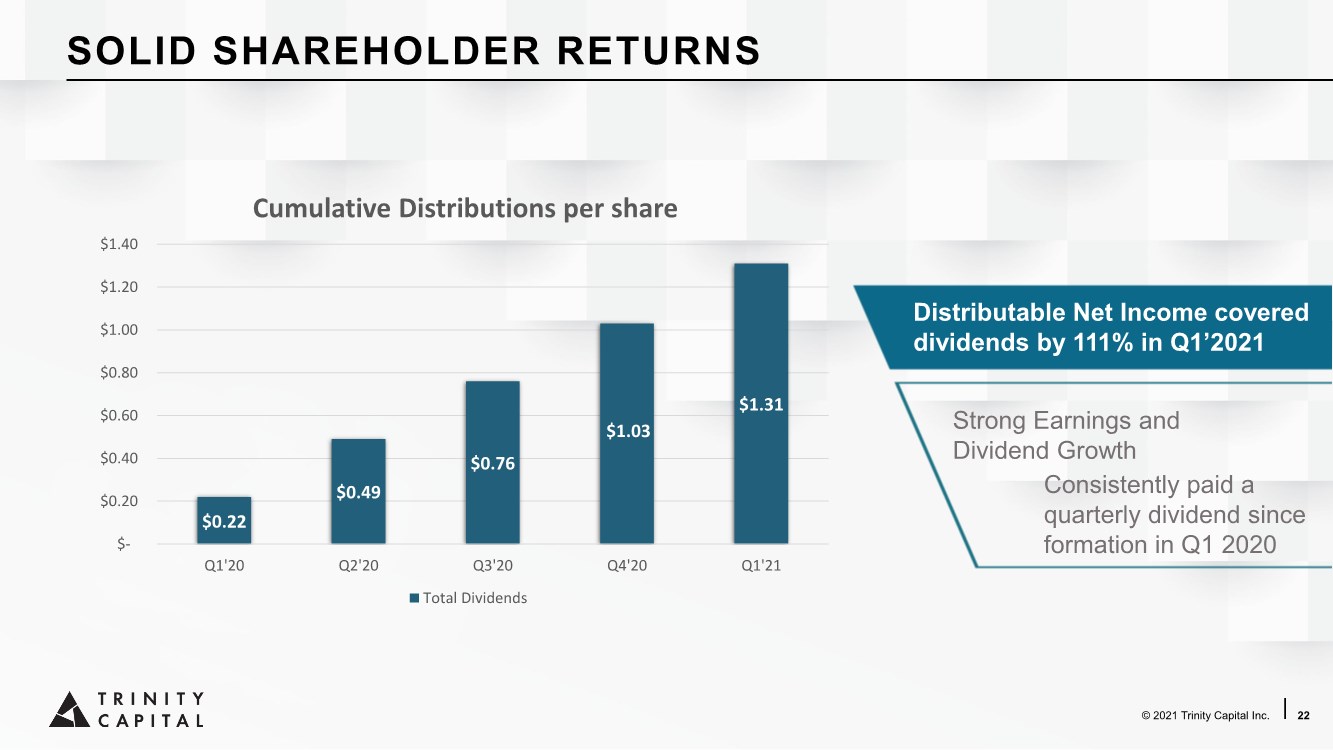
| © 2021 Trinity Capital Inc. | 22 $0.22 $0.49 $0.76 $1.03 $1.31 $- $0.20 $0.40 $0.60 $0.80 $1.00 $1.20 $1.40 Q1'20 Q2'20 Q3'20 Q4'20 Q1'21 Cumulative Distributions per share Total Dividends Distributable Net Income covered dividends by 111% in Q1’2021 Strong Earnings and Dividend Growth Consistently paid a quarterly dividend since formation in Q1 2020 SOLID SHAREHOLDER RETURNS |
| PORTFOLIO HIGHLIGHTS |

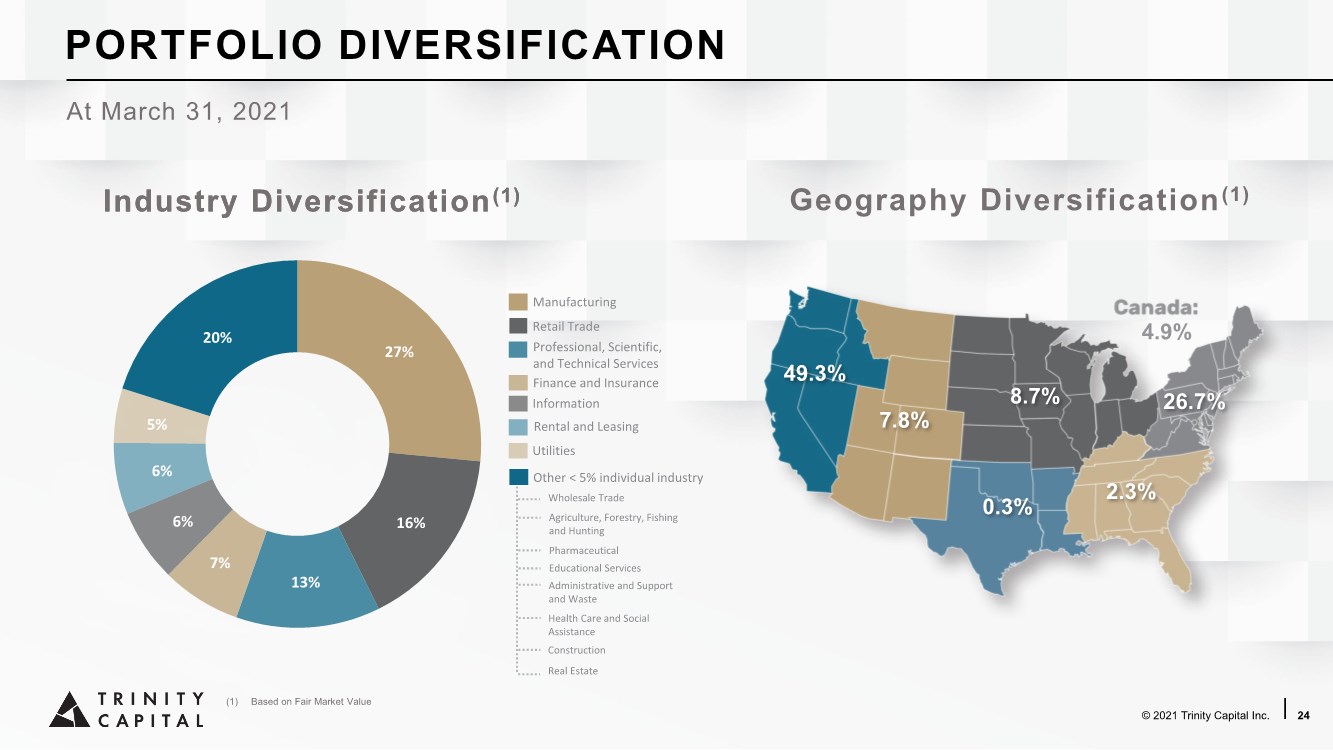
| (1) Based on Fair Market Value © 2021 Trinity Capital Inc. | 24 Industry Diversification(1) Geography Diversification(1) 27% 16% 13% 7% 6% 6% 5% 20% Professional, Scientific, and Technical Services Manufacturing Retail Trade Information Utilities Rental and Leasing Wholesale Trade Finance and Insurance Industry Diversification(1) Other < 5% individual industry Agriculture, Forestry, Fishing and Hunting Pharmaceutical Educational Services Administrative and Support and Waste Health Care and Social Assistance Construction Real Estate 49.3% 7.8% 8.7% 0.3% 2.3% 26.7% 4.9% PORTFOLIO DIVERSIFICATION At March 31, 2021 |
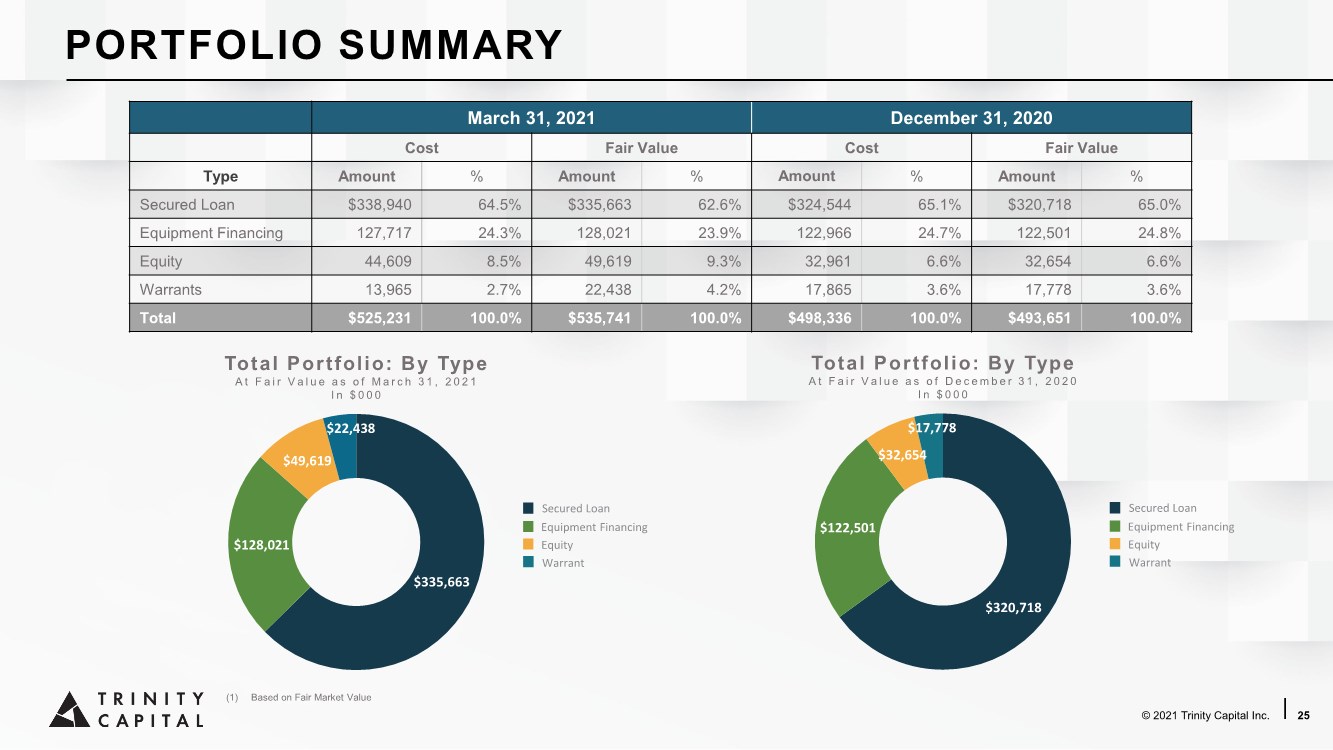
| © 2021 Trinity Capital Inc. | 25 PORTFOLIO SUMMARY (1) Based on Fair Market Value $128,021 $49,619 $22,438 Total Portfolio: By Type At Fair Value as of March 31, 2021 I n $ 0 0 0 Secured Loan Equipment Financing Equity Warrant $122,501 $32,654 $17,778 Total Portfolio: By Type At Fair Value as of December 31, 2020 I n $ 0 0 0 Secured Loan Equipment Financing Equity Warrant March 31, 2021 December 31, 2020 Cost Fair Value Cost Fair Value Type Amount % Amount % Amount % Amount % Secured Loan $338,940 64.5% $335,663 62.6% $324,544 65.1% $320,718 65.0% Equipment Financing 127,717 24.3% 128,021 23.9% 122,966 24.7% 122,501 24.8% Equity 44,609 8.5% 49,619 9.3% 32,961 6.6% 32,654 6.6% Warrants 13,965 2.7% 22,438 4.2% 17,865 3.6% 17,778 3.6% Total $525,231 100.0% $535,741 100.0% $498,336 100.0% $493,651 100.0% $335,663 $320,718 |
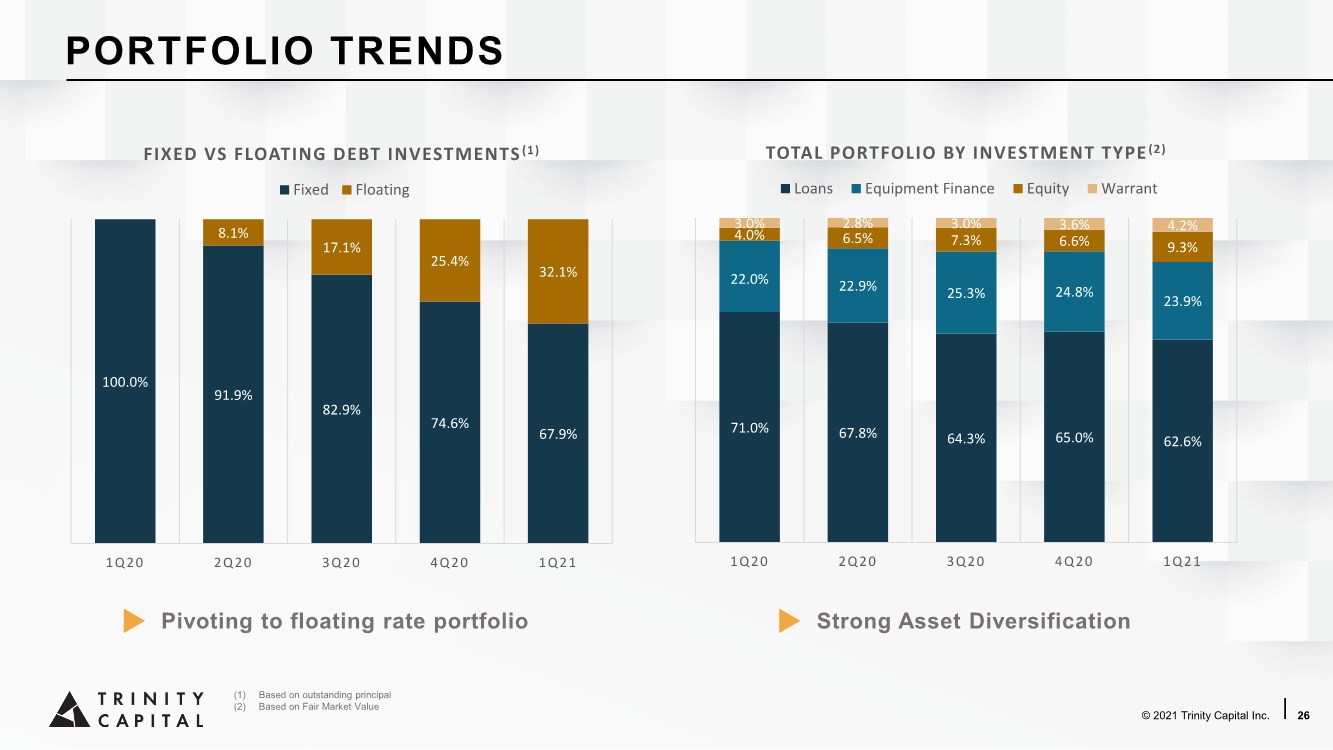
| © 2021 Trinity Capital Inc. | 26 PORTFOLIO TRENDS (1) Based on outstanding principal (2) Based on Fair Market Value 100.0% 91.9% 82.9% 74.6% 67.9% 8.1% 17.1% 25.4% 32.1% 1Q20 2Q20 3Q20 4Q20 1Q21 FIXED VS FLOATING DEBT INVESTMENTS (1) Fixed Floating 71.0% 67.8% 64.3% 65.0% 62.6% 22.9% 25.3% 24.8% 23.9% 4.0% 6.5% 7.3% 6.6% 9.3% 3.0% 2.8% 3.0% 3.6% 4.2% 1Q20 2Q20 3Q20 4Q20 1Q21 TOTAL PORTFOLIO BY INVESTMENT TYPE (2) Loans Equipment Finance Equity Warrant 22.0% Pivoting to floating rate portfolio Strong Asset Diversification |
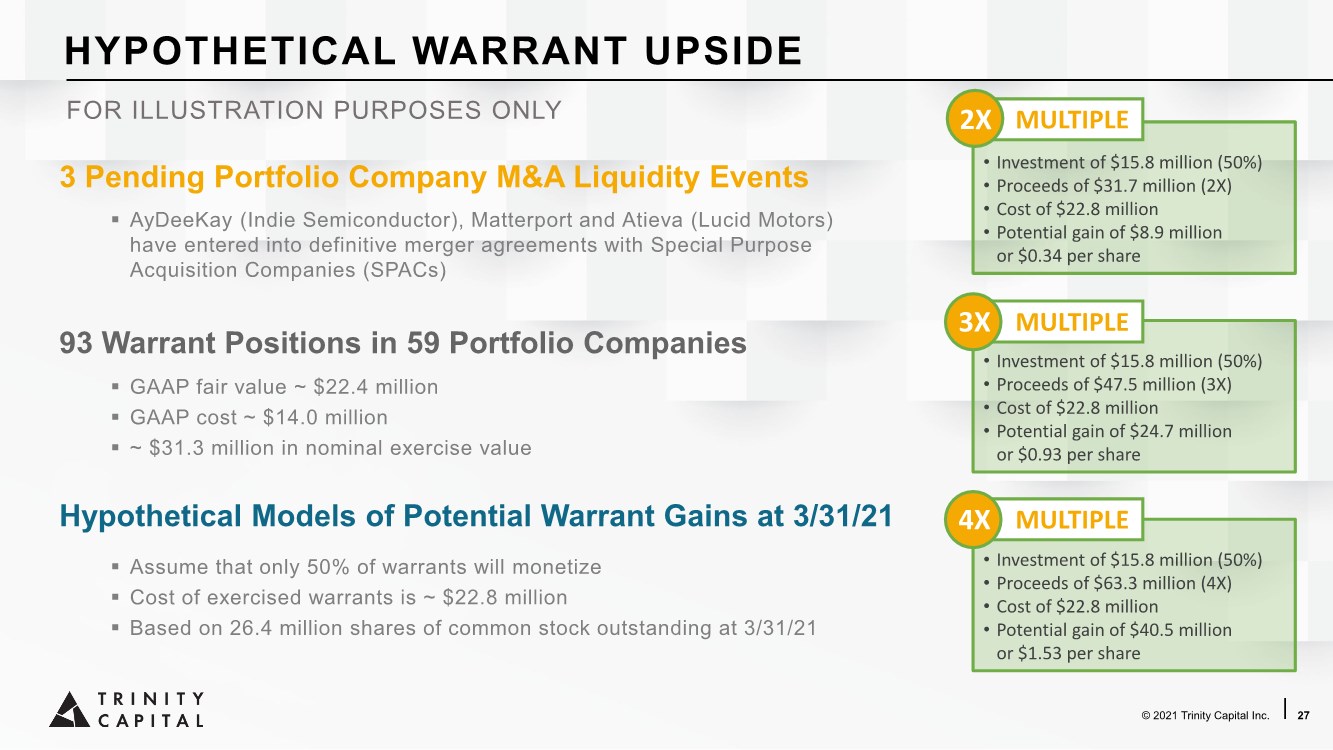
| © 2021 Trinity Capital Inc. | 27 HYPOTHETICAL WARRANT UPSIDE • Investment of $15.8 million (50%) • Proceeds of $31.7 million (2X) • Cost of $22.8 million • Potential gain of $8.9 million or $0.34 per share • Investment of $15.8 million (50%) • Proceeds of $47.5 million (3X) • Cost of $22.8 million • Potential gain of $24.7 million or $0.93 per share • Investment of $15.8 million (50%) • Proceeds of $63.3 million (4X) • Cost of $22.8 million • Potential gain of $40.5 million or $1.53 per share 3 Pending Portfolio Company M&A Liquidity Events ▪ AyDeeKay (Indie Semiconductor), Matterport and Atieva (Lucid Motors) have entered into definitive merger agreements with Special Purpose Acquisition Companies (SPACs) 93 Warrant Positions in 59 Portfolio Companies ▪ GAAP fair value ~ $22.4 million ▪ GAAP cost ~ $14.0 million ▪ ~ $31.3 million in nominal exercise value Hypothetical Models of Potential Warrant Gains at 3/31/21 ▪ Assume that only 50% of warrants will monetize ▪ Cost of exercised warrants is ~ $22.8 million ▪ Based on 26.4 million shares of common stock outstanding at 3/31/21 MULTIPLE MULTIPLE MULTIPLE 2X 3X 4X FOR ILLUSTRATION PURPOSES ONLY |
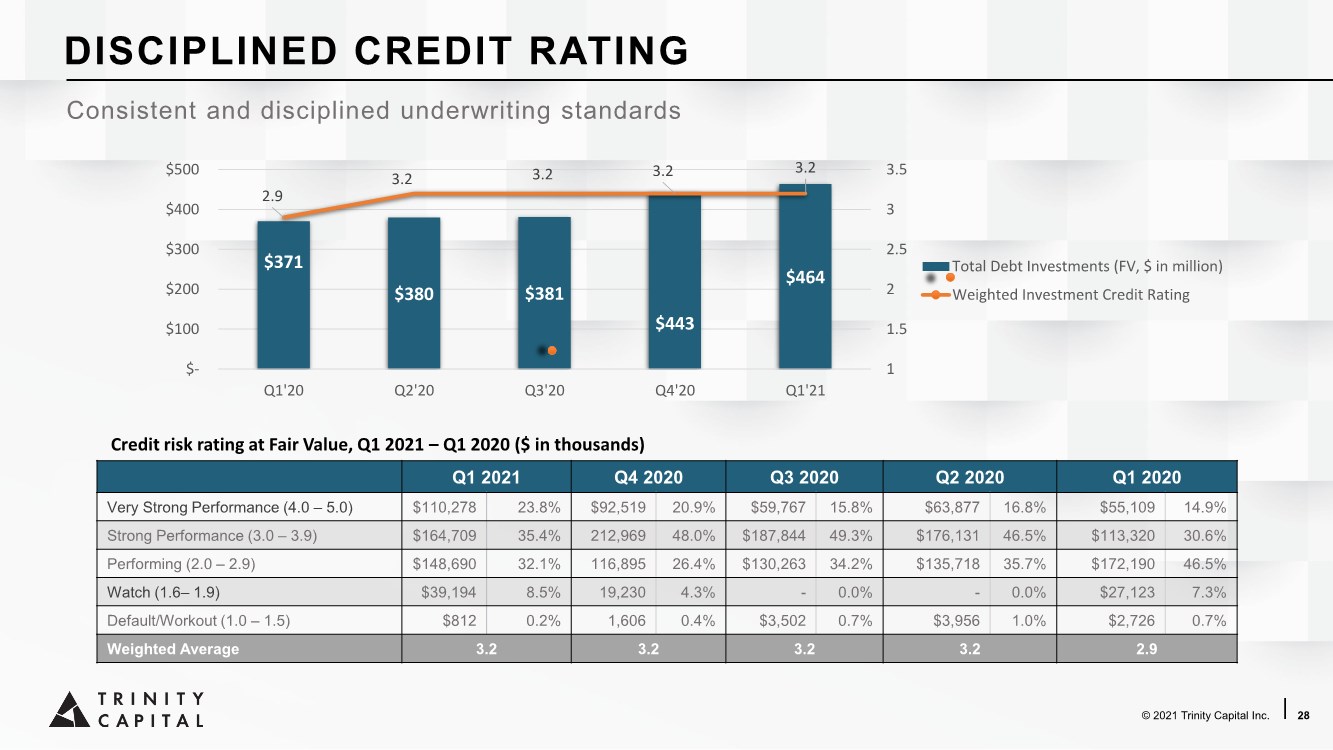
| © 2021 Trinity Capital Inc. | 28 $371 $380 $381 $443 $464 2.9 3.2 3.2 3.2 3.2 1 1.5 2 2.5 3 3.5 $- $100 $200 $300 $400 $500 Q1'20 Q2'20 Q3'20 Q4'20 Q1'21 Total Debt Investments (FV, $ in million) Weighted Investment Credit Rating Q1 2021 Q4 2020 Q3 2020 Q2 2020 Q1 2020 Very Strong Performance (4.0 – 5.0) $110,278 23.8% $92,519 20.9% $59,767 15.8% $63,877 16.8% $55,109 14.9% Strong Performance (3.0 – 3.9) $164,709 35.4% 212,969 48.0% $187,844 49.3% $176,131 46.5% $113,320 30.6% Performing (2.0 – 2.9) $148,690 32.1% 116,895 26.4% $130,263 34.2% $135,718 35.7% $172,190 46.5% Watch (1.6– 1.9) $39,194 8.5% 19,230 4.3% - 0.0% - 0.0% $27,123 7.3% Default/Workout (1.0 – 1.5) $812 0.2% 1,606 0.4% $3,502 0.7% $3,956 1.0% $2,726 0.7% Weighted Average 3.2 3.2 3.2 3.2 2.9 Credit risk rating at Fair Value, Q1 2021 – Q1 2020 ($ in thousands) Consistent and disciplined underwriting standards DISCIPLINED CREDIT RATING |
| © 2021 Trinity Capital Inc. | 29 Select List of Current & Historical Investments DIVERSIFIED PORTFOLIO |
| VENTURE CAPITAL AND LENDING MARKET |

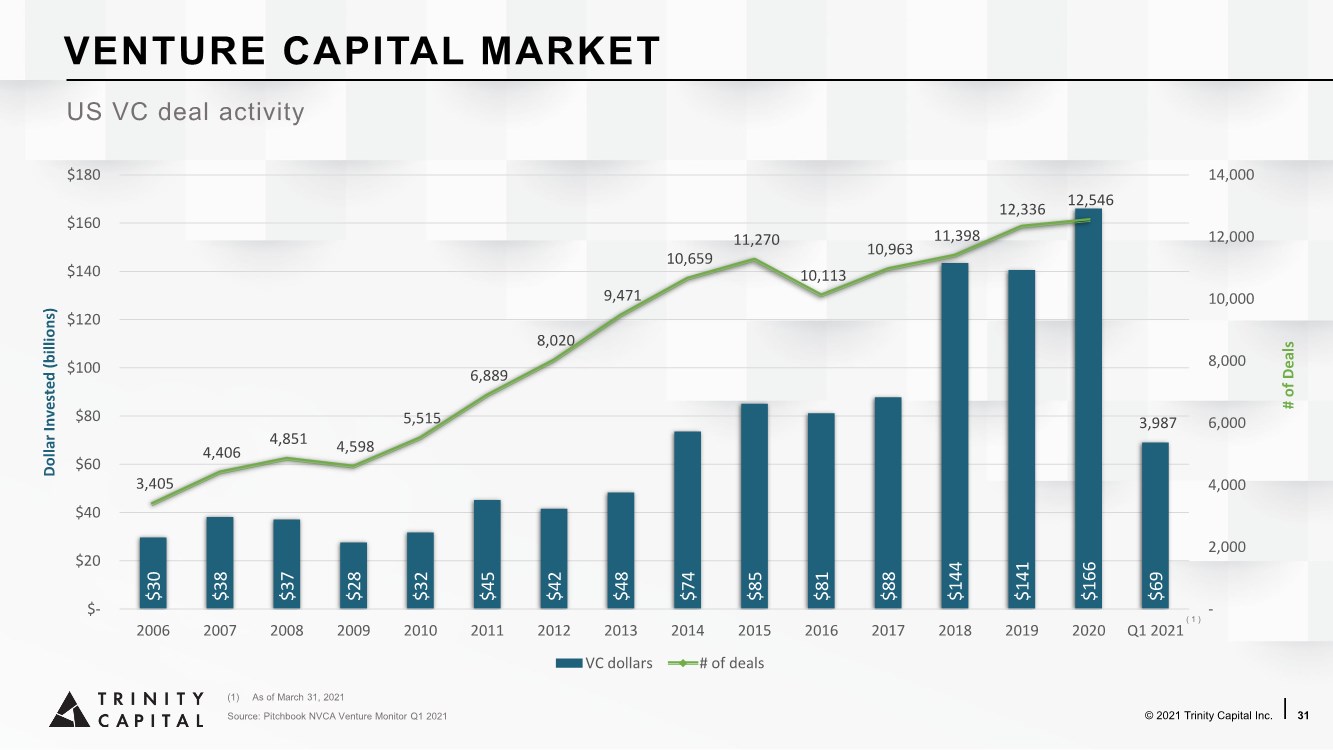
| Source: Pitchbook NVCA Venture Monitor Q1 2021 © 2021 Trinity Capital Inc. | 31 $30 $38 $37 $28 $32 $45 $42 $48 $74 $85 $81 $88 $144 $141 $166 $69 3,405 4,406 4,851 4,598 5,515 6,889 8,020 9,471 10,659 11,270 10,113 10,963 11,398 12,336 12,546 3,987 - 2,000 4,000 6,000 8,000 10,000 12,000 14,000 $- $20 $40 $60 $80 $100 $120 $140 $160 $180 2006 2007 2008 2009 2010 2011 2012 2013 2014 2015 2016 2017 2018 2019 2020 Q1 2021 # of Deals Dollar Invested (billions) VC dollars # of deals US VC deal activity ( 1 ) (1) As of March 31, 2021 VENTURE CAPITAL MARKET |
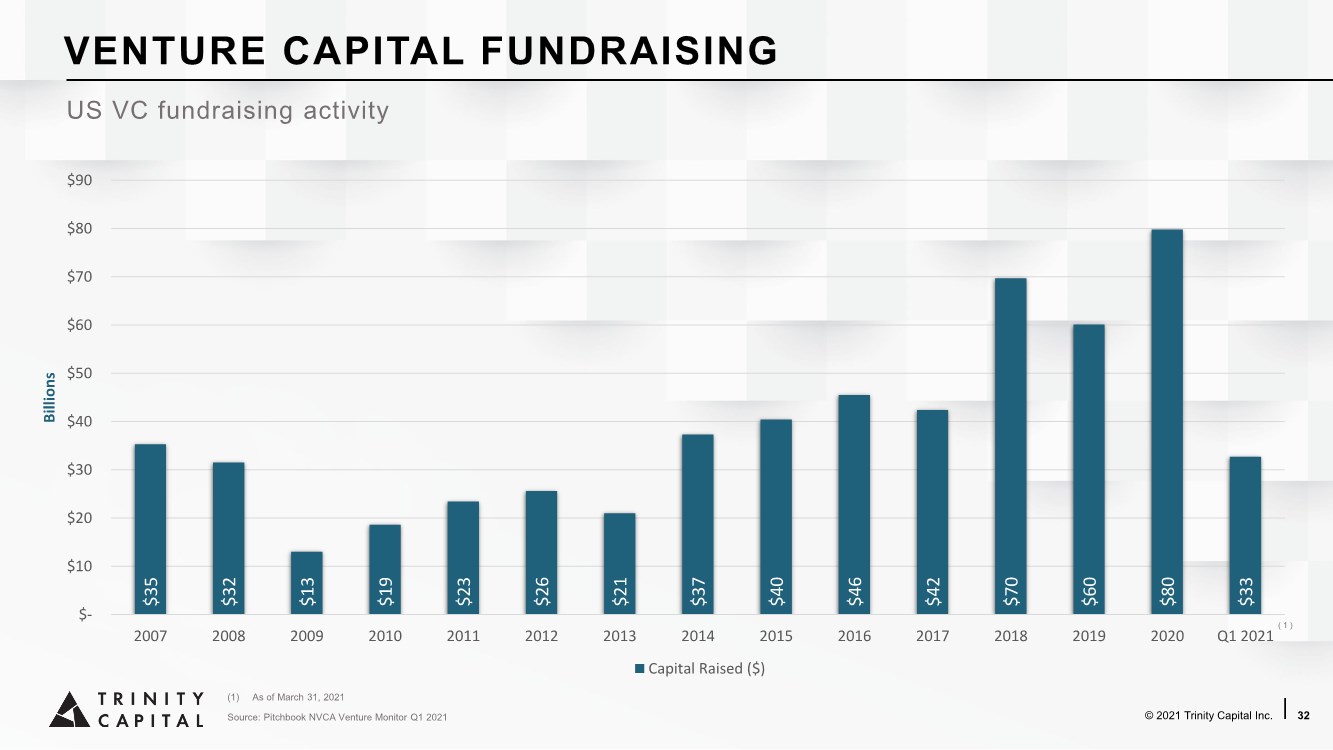
| © 2021 Trinity Capital Inc. | 32 $35 $32 $13 $19 $23 $26 $21 $37 $40 $46 $42 $70 $60 $80 $33 $- $10 $20 $30 $40 $50 $60 $70 $80 $90 2007 2008 2009 2010 2011 2012 2013 2014 2015 2016 2017 2018 2019 2020 Q1 2021 Billions Capital Raised ($) US VC fundraising activity Source: Pitchbook NVCA Venture Monitor Q1 2021 ( 1 ) (1) As of March 31, 2021 VENTURE CAPITAL FUNDRAISING |
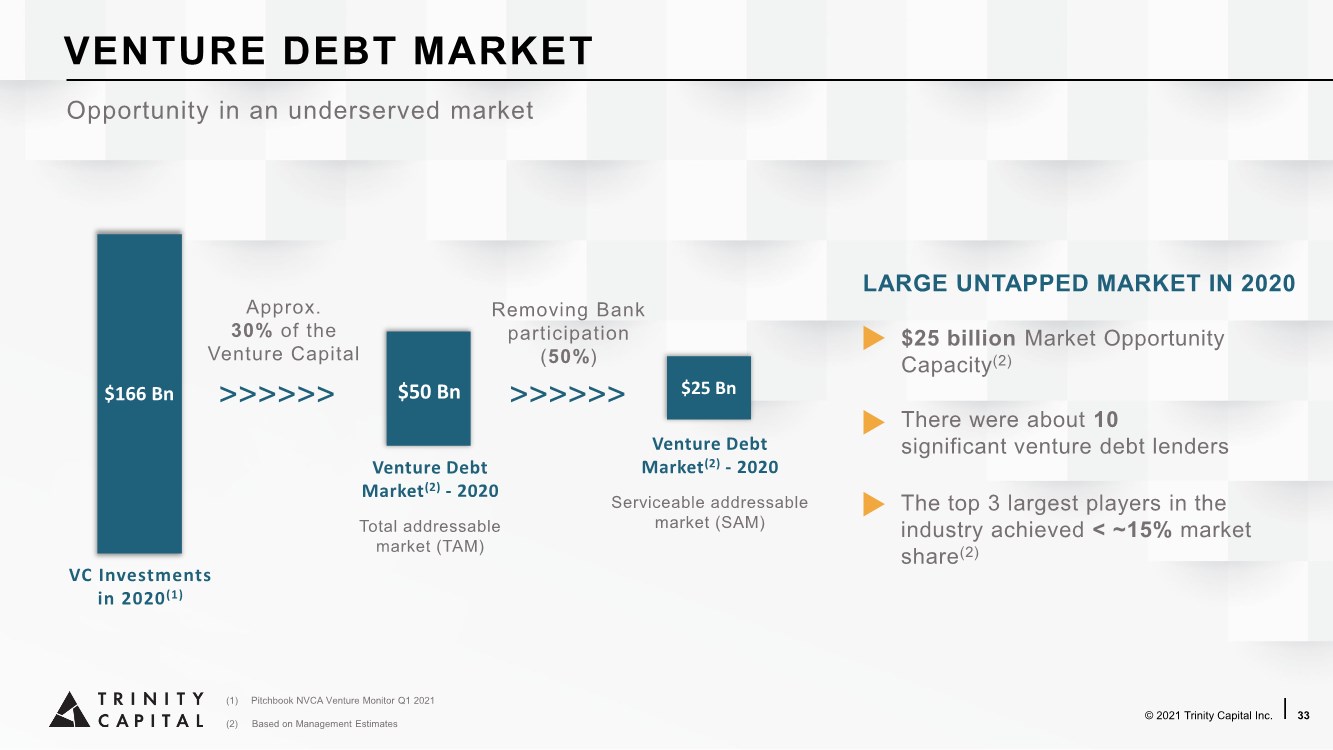
| © 2021 Trinity Capital Inc. | 33 (1) Pitchbook NVCA Venture Monitor Q1 2021 (2) Based on Management Estimates Opportunity in an underserved market There were about 10 significant venture debt lenders The top 3 largest players in the industry achieved < ~15% market share(2) $25 billion Market Opportunity Capacity(2) LARGE UNTAPPED MARKET IN 2020 VC Investments in 2020(1) $166 Bn $50 Bn Venture Debt Market(2) - 2020 Approx. 30% of the Venture Capital Removing Bank participation (50%) Venture Debt Market(2) - 2020 $25 Bn Total addressable market (TAM) Serviceable addressable market (SAM) >>>>>> >>>>>> VENTURE DEBT MARKET |
| ANALYST COVERAGE |

| © 2021 Trinity Capital Inc. | 35 Followed by seven firms Trinity Capital is followed by the analysts listed above. Please note that any opinions, estimates or forecasts regarding Trinity Capital’s performance made by these analysts are theirs alone and do not represent opinions, forecasts or predictions of Trinity Capital or its management. Trinity Capital does not by its reference above or distribution imply its endorsement of or concurrence with such information, conclusions or recommendations. Ryan Lynch (initiating coverage 2/23/21) Finian O’Shea (initiating coverage 2/23/21) Brock Vandervliet (initiating coverage 2/23/21) Sarkis Sherbetchyan (initiating coverage 2/23/21) Casey Alexander (initiating coverage 2/23/21) Christopher Nolan (initiating coverage 2/23/21) EXTENSIVE INDUSTRY ANALYST COVERAGE Mitchell Penn (initiating coverage 5/3/21) |
| SUPPLEMENTAL INFORMATION |

| © 2021 Trinity Capital Inc. | 37 BUSINESS DEVELOPMENT COMPANY (BDC) REGULATED INVESTMENT COMPANY (RIC) Trinity Capital Inc. is an Internally Managed BDC under the 1940 Act and Intends to Elect be treated as a RIC for Federal Income Tax Purposes beginning with its Taxable Year ending December 31, 2020 ▪ Regulated by the SEC under the Investment Company Act of 1940 (the “1940 Act”) ▪ Leverage limited to approximately 2:1 debt/equity ▪ Investments are required to be carried at fair value ▪ Majority of Board of Directors must be independent ▪ Offer managerial assistance to portfolio companies ▪ Distribute taxable income as dividend distributions to shareholders, subject to approval by Trinity Capital’s Board of Directors ▪ Mandates asset diversification ▪ Eliminates corporate taxation ▪ Allows for the retention of capital gains and/or spillover of taxable income REGULATION & STRUCTURE |
| We look forward to our growing partnership. THANK YOU |