Attached files
| file | filename |
|---|---|
| EX-99.3 - EX-99.3 - IRON MOUNTAIN INC | srpq12021final.htm |
| EX-99.1 - EX-99.1 - IRON MOUNTAIN INC | q12021earningspressrelease.htm |
| 8-K - 8-K - IRON MOUNTAIN INC | irm-20210506.htm |

Q1 2021 Earnings Call May 6, 2021

2 We have made statements in this presentation that constitute "forward-looking statements" as that term is defined in the Private Securities Litigation Reform Act of 1995 and other securities laws. These forward-looking statements concern our operations, economic performance, financial condition, goals, beliefs, future growth strategies, investment objectives, plans and current expectations, such as our (1) 2021 guidance as well as our expectations for growth, including growth opportunities and growth rates for revenue by segment, organic revenue, organic volume and other metrics, (2) expectations and assumptions regarding the impact from the COVID-19 pandemic on us and our customers, including on our businesses, financial position, results of operations and cash flows, (3) expected benefits, costs and actions related to, and timing of, Project Summit, (4) expectations as to our capital allocation strategy, including our future investments, leverage ratio, dividend payments and possible funding sources (including real estate monetization) and capital expenditures, (5) expectations regarding the closing of pending acquisitions and investments, and (6) other forward-looking statements related to our business, results of operations and financial condition. These forward-looking statements are subject to various known and unknown risks, uncertainties and other factors, and you should not rely upon them except as statements of our present intentions and of our present expectations, which may or may not occur. When we use words such as "believes," "expects," "anticipates," "estimates," “plans” or similar expressions, we are making forward-looking statements. Although we believe that our forward-looking statements are based on reasonable assumptions, our expected results may not be achieved, and actual results may differ materially from our expectations. In addition, important factors that could cause actual results to differ from expectations include, among others: (i) the severity and duration of the COVID-19 pandemic and its effects on the global economy, including its effects on us, the markets we serve and our customers and the third parties with whom we do business within those markets; (ii) our ability to execute on Project Summit and the potential impacts of Project Summit on our ability to retain and recruit employees; (iii) our ability to remain qualified for taxation as a real estate investment trust for United States federal income tax purposes; (iv) changes in customer preferences and demand for our storage and information management services, including as a result of the shift from paper and tape storage to alternative technologies that require less physical space; (v) our ability or inability to execute our strategic growth plan, including our ability to invest according to plan, incorporate new digital information technologies into our offerings, achieve satisfactory returns on new product offerings, continue our revenue management, expand internationally, complete acquisitions on satisfactory terms, integrate acquired companies efficiently and grow our business through joint ventures; (vi) changes in the amount of our capital expenditures; (vii) our ability to raise debt or equity capital and changes in the cost of our debt; (viii) the cost and our ability to comply with laws, regulations and customer demands, including those relating to data security and privacy issues, as well as fire and safety and environmental standards; (ix) the impact of litigation or disputes that may arise in connection with incidents in which we fail to protect our customers' information or our internal records or information technology systems and the impact of such incidents on our reputation and ability to compete; (x) changes in the price for our storage and information management services relative to the cost of providing such storage and information management services; (xi) changes in the political and economic environments in the countries in which our international subsidiaries operate and changes in the global political climate, particularly as we consolidate operations and move records and data across borders; (xii) our ability to comply with our existing debt obligations and restrictions in our debt instruments; (xiii) the impact of service interruptions or equipment damage and the cost of power on our data center operations; (xiv) the cost or potential liabilities associated with real estate necessary for our business; (xv) failures in our adoption of new IT systems; (xvi) other trends in competitive or economic conditions affecting our financial condition or results of operations not presently contemplated; and (xvii) the other risks described in our periodic reports filed with the SEC, including under the caption “Risk Factors” in Part I, Item 1A of our Annual Report. Except as required by law, we undertake no obligation to update any forward-looking statements appearing in this report. Reconciliation of Non-GAAP Measures: Throughout this release, Iron Mountain discusses (1) Adjusted EBITDA, (2) Adjusted Earnings per Share (“Adjusted EPS”), (3) Funds from Operations (“FFO Nareit”), (4) FFO (Normalized) and (5) Adjusted Funds from Operations (“AFFO”). These measures do not conform to accounting principles generally accepted in the United States (“GAAP”). These non-GAAP measures are supplemental metrics designed to enhance our disclosure and to provide additional information that we believe to be important for investors to consider in addition to, but not as a substitute for, other measures of financial performance reported in accordance with GAAP, such as operating income,net income (loss) attributable to Iron Mountain Incorporated or cash flows from operating activities (as determined in accordance with GAAP). The reconciliation of these measures to the appropriate GAAP measure, as required by Regulation G under the Securities Exchange Act of 1934, as amended, and their definitions are included later in this release. Forward looking statements

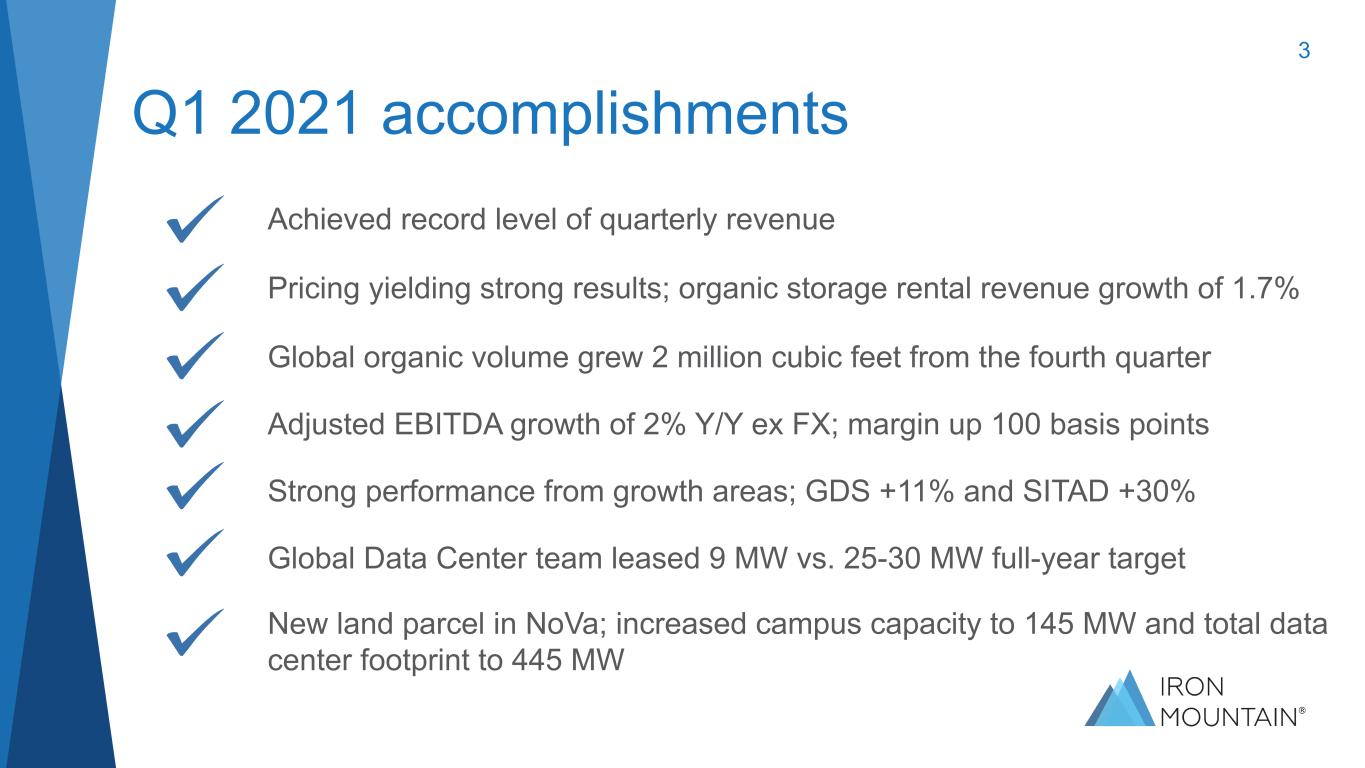
3 Q1 2021 accomplishments Achieved record level of quarterly revenue Pricing yielding strong results; organic storage rental revenue growth of 1.7% Global organic volume grew 2 million cubic feet from the fourth quarter Adjusted EBITDA growth of 2% Y/Y ex FX; margin up 100 basis points Strong performance from growth areas; GDS +11% and SITAD +30% Global Data Center team leased 9 MW vs. 25-30 MW full-year target New land parcel in NoVa; increased campus capacity to 145 MW and total data center footprint to 445 MW

4 Our exciting growth opportunities Global Commercial Excellence Fine Arts / Entertainment Services Consumer Storage Data Centers Secure IT Asset Disposition Digital Solutions

5 Our Total Addressable Market (TAM) 2020 $80B+ ~ 13% TAM and revenue growth rate of Data Centers, Fine Art & Entertainment Services, Consumer, SITAD, Digital Solutions, SMB 2015 $10B ~ low-single % Global RIM TAM and revenue growth rate

6 Total organic volume grew 2M cubic feet vs. Q4 Durable global physical storage portfolio

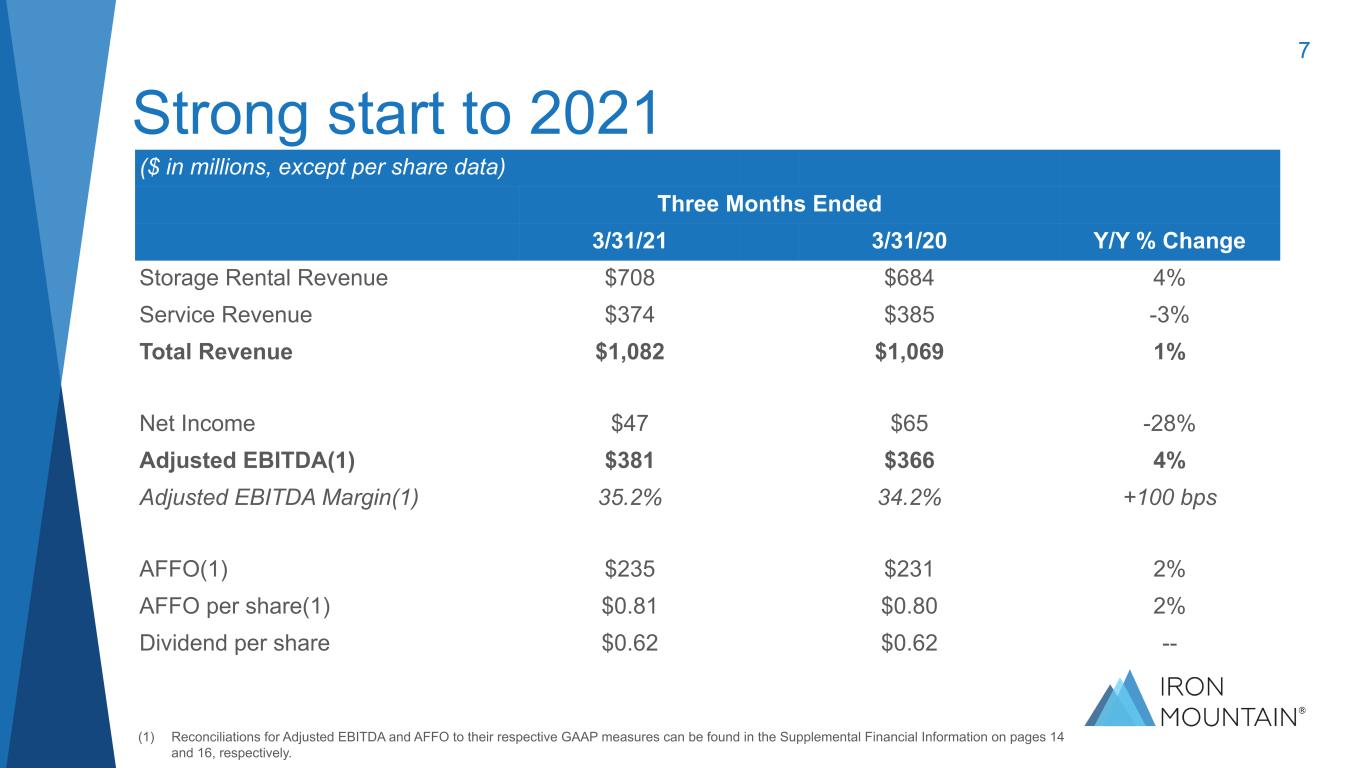
7 (1) Reconciliations for Adjusted EBITDA and AFFO to their respective GAAP measures can be found in the Supplemental Financial Information on pages 14 and 16, respectively. ($ in millions, except per share data) Three Months Ended 3/31/21 3/31/20 Y/Y % Change Storage Rental Revenue $708 $684 4% Service Revenue $374 $385 -3% Total Revenue $1,082 $1,069 1% Net Income $47 $65 -28% Adjusted EBITDA(1) $381 $366 4% Adjusted EBITDA Margin(1) 35.2% 34.2% +100 bps AFFO(1) $235 $231 2% AFFO per share(1) $0.81 $0.80 2% Dividend per share $0.62 $0.62 -- Strong start to 2021

Source: J.P. Morgan REIT Weekly U.S. Real Estate report April 4, 2021 and company reports 8 Balance sheet remains well positioned • ~$1.8 billion of liquidity • ~85% Fixed Rate Debt • 4.6% weighted average interest rate • 7.6 years weighted-average maturity Balance Sheet Highlights as of 3/31/21 Net Lease Adjusted Leverage 5.5x1 (1) Excluding the approximately $260 million of proceeds from a large sale leaseback transaction in the fourth quarter of 2020 that we plan to invest in 2021, net lease adjusted leverage was 5.5x. ~

9 • Sustain the dividend at current level • Long-term target AFFO payout ratio of low to mid-60s • Long-term target leverage ratio of 4.5x – 5.5x • Reinvest in the business through growth Capital Expenditures • Invest in accretive M&A • Growth capital from capital recycling as well as debt finance in line with Adjusted EBITDA growth Capital allocation strategy

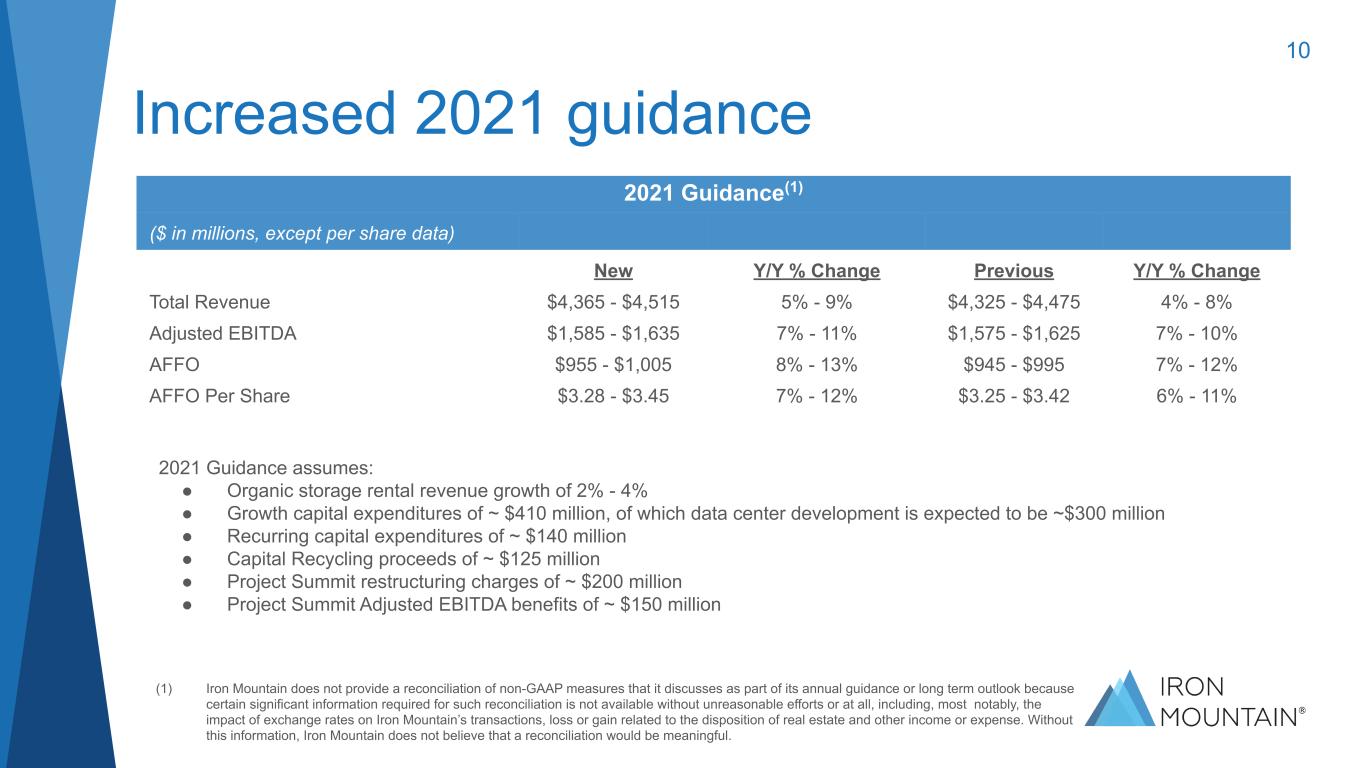
10 Increased 2021 guidance 2021 Guidance assumes: ● Organic storage rental revenue growth of 2% - 4% ● Growth capital expenditures of ~ $410 million, of which data center development is expected to be ~$300 million ● Recurring capital expenditures of ~ $140 million ● Capital Recycling proceeds of ~ $125 million ● Project Summit restructuring charges of ~ $200 million ● Project Summit Adjusted EBITDA benefits of ~ $150 million (1) Iron Mountain does not provide a reconciliation of non-GAAP measures that it discusses as part of its annual guidance or long term outlook because certain significant information required for such reconciliation is not available without unreasonable efforts or at all, including, most notably, the impact of exchange rates on Iron Mountain’s transactions, loss or gain related to the disposition of real estate and other income or expense. Without this information, Iron Mountain does not believe that a reconciliation would be meaningful. 2021 Guidance(1) ($ in millions, except per share data) New Y/Y % Change Previous Y/Y % Change Total Revenue $4,365 - $4,515 5% - 9% $4,325 - $4,475 4% - 8% Adjusted EBITDA $1,585 - $1,635 7% - 11% $1,575 - $1,625 7% - 10% AFFO $955 - $1,005 8% - 13% $945 - $995 7% - 12% AFFO Per Share $3.28 - $3.45 7% - 12% $3.25 - $3.42 6% - 11%

11 ● Proud of the continued performance of core business in spite of COVID ● Project Summit progressing well; on track to realize structural cost savings of $375 million per year exiting 2021 ● Our Global Strategic Accounts team continues to deliver growth in the core as well as new digital solutions ● Strong start to the year with 9 megawatts leased, and we continue to grow our data center footprint organically and through expansion into India ● Q1 results demonstrate accelerating earnings growth, the resiliency of our business, revenue growth in new areas, and the benefits of our culture Key takeaways
