Attached files
| file | filename |
|---|---|
| 8-K - 8-K - Ryerson Holding Corp | ryi-8k_20210505.htm |
| EX-99.1 - EX-99.1 - Ryerson Holding Corp | ryi-ex991_6.htm |

Exhibit 99.2
31 Important Information About Ryerson Holding Corporation These materials do not constitute an offer or solicitation to purchase or sell securities of Ryerson Holding Corporation (“Ryerson” or “the Company”) or its subsidiaries and no investment decision should be made based upon the information provided herein. Ryerson strongly urges you to review its filings with the Securities and Exchange Commission, which can be found at https://ir.ryerson.com/financials/sec-filings/default.aspx. This site also provides additional information about Ryerson. Safe Harbor Provision Certain statements made in this presentation and other written or oral statements made by or on behalf of the Company constitute "forward-looking statements" within the meaning of the federal securities laws, including statements regarding our future performance, as well as management's expectations, beliefs, intentions, plans, estimates, objectives, or projections relating to the future. Such statements can be identified by the use of forward-looking terminology such as “objectives,” “goals,” “preliminary,” “range,” "believes," "expects," "may," "estimates," "will," "should," "plans," or "anticipates" or the negative thereof or other variations thereon or comparable terminology, or by discussions of strategy. The Company cautions that any such forward-looking statements are not guarantees of future performance and may involve significant risks and uncertainties, and that actual results may vary materially from those in the forward-looking statements as a result of various factors. Among the factors that significantly impact our business are: the cyclicality of our business; the highly competitive, volatile, and fragmented metals industry in which we operate; fluctuating metal prices; our substantial indebtedness and the covenants in instruments governing such indebtedness; the integration of acquired operations; regulatory and other operational risks associated with our operations located inside and outside of the United States; impacts and implications of adverse health events, including the COVID-19 pandemic; work stoppages; obligations under certain employee retirement benefit plans; the ownership of a majority of our equity securities by a single investor group; currency fluctuations; and consolidation in the metals industry. Forward-looking statements should, therefore, be considered in light of various factors, including those set forth above and those set forth under "Risk Factors" in our annual report on Form 10-K for the year ended December 31, 2020, and in our other filings with the Securities and Exchange Commission. Moreover, we caution against placing undue reliance on these statements, which speak only as of the date they were made. The Company does not undertake any obligation to publicly update or revise any forward-looking statements to reflect future events or circumstances, new information or otherwise. Non-GAAP Measures Certain measures contained in these slides or the related presentation are not measures calculated in accordance with generally accepted accounting principles (“GAAP”). They should not be considered a replacement for GAAP results. Non-GAAP financial measures appearing in these slides are identified in the footnotes. A reconciliation of these non-GAAP measures to the most directly comparable GAAP financial measures is included in the Appendix. 2
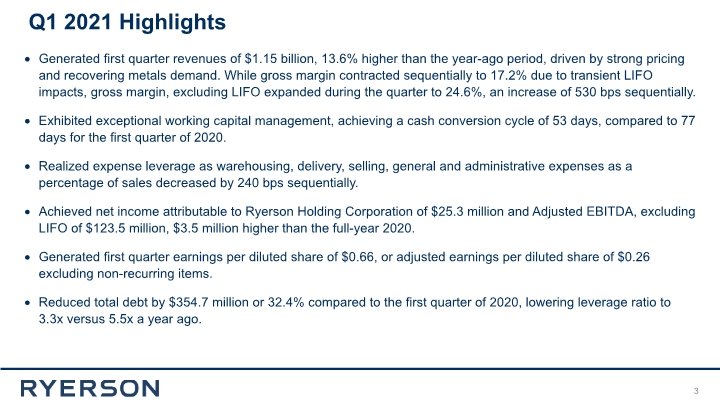
3 Q1 2021 Highlights Generated first quarter revenues of $1.15 billion, 13.6% higher than the year-ago period, driven by strong pricing and recovering metals demand. While gross margin contracted sequentially to 17.2% due to transient LIFO impacts, gross margin, excluding LIFO expanded during the quarter to 24.6%, an increase of 530 bps sequentially. Exhibited exceptional working capital management, achieving a cash conversion cycle of 53 days, compared to 77 days for the first quarter of 2020. Realized expense leverage as warehousing, delivery, selling, general and administrative expenses as a percentage of sales decreased by 240 bps sequentially. Achieved net income attributable to Ryerson Holding Corporation of $25.3 million and Adjusted EBITDA, excluding LIFO of $123.5 million, $3.5 million higher than the full-year 2020. Generated first quarter earnings per diluted share of $0.66, or adjusted earnings per diluted share of $0.26 excluding non-recurring items. Reduced total debt by $354.7 million or 32.4% compared to the first quarter of 2020, lowering leverage ratio to 3.3x versus 5.5x a year ago.
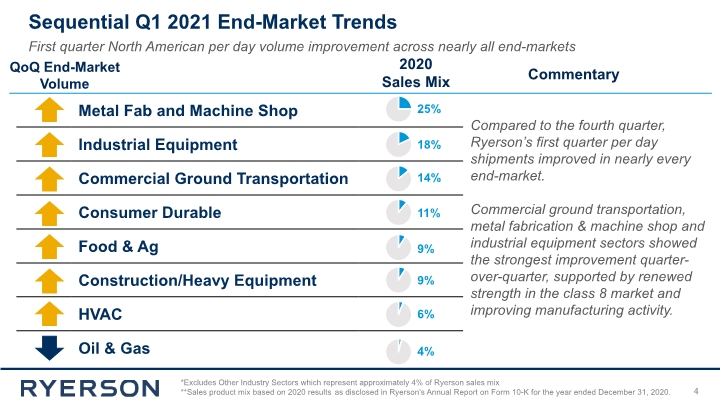
Sequential Q1 2021 End-Market Trends 4 First quarter North American per day volume improvement across nearly all end-markets *Excludes Other Industry Sectors which represent approximately 4% of Ryerson sales mix **Sales product mix based on 2020 results as disclosed in Ryerson’s Annual Report on Form 10-K for the year ended December 31, 2020. Compared to the fourth quarter, Ryerson’s first quarter per day shipments improved in nearly every end-market. Commercial ground transportation, metal fabrication & machine shop and industrial equipment sectors showed the strongest improvement quarter-over-quarter, supported by renewed strength in the class 8 market and improving manufacturing activity. 2020 Sales Mix Commentary QoQ End-Market Volume
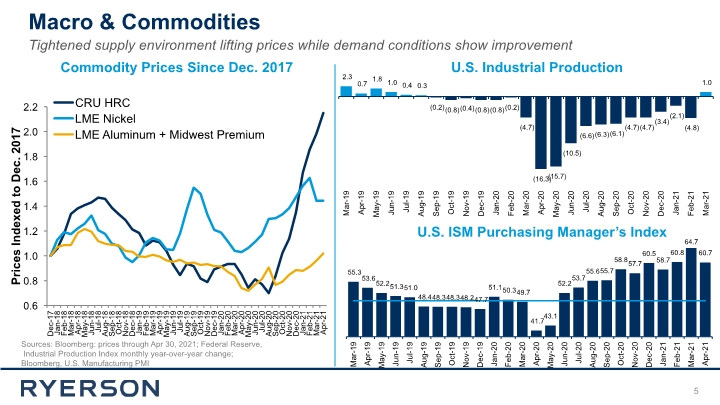
Macro & Commodities 5 Tightened supply environment lifting prices while demand conditions show improvement Sources: Bloomberg: prices through Apr 30, 2021; Federal Reserve, Industrial Production Index monthly year-over-year change; Bloomberg, U.S. Manufacturing PMI Commodity Prices Since Dec. 2017 U.S. Industrial Production U.S. ISM Purchasing Manager’s Index
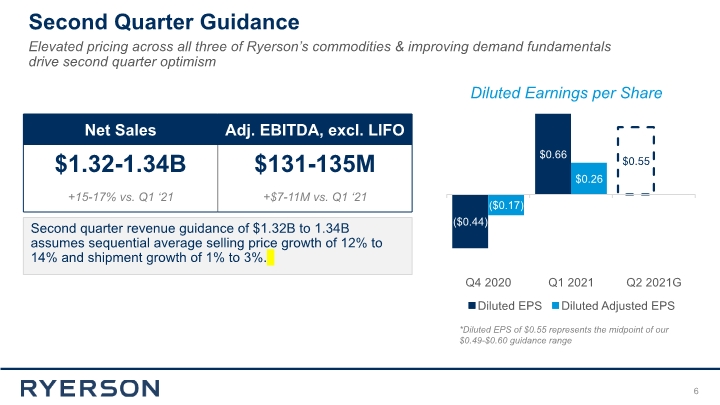
Second Quarter Guidance Second quarter revenue guidance of $1.32B to 1.34B assumes sequential average selling price growth of 12% to 14% and shipment growth of 1% to 3%. 6 Elevated pricing across all three of Ryerson’s commodities & improving demand fundamentals drive second quarter optimism Diluted Earnings per Share *Diluted EPS of $0.55 represents the midpoint of our $0.49-$0.60 guidance range
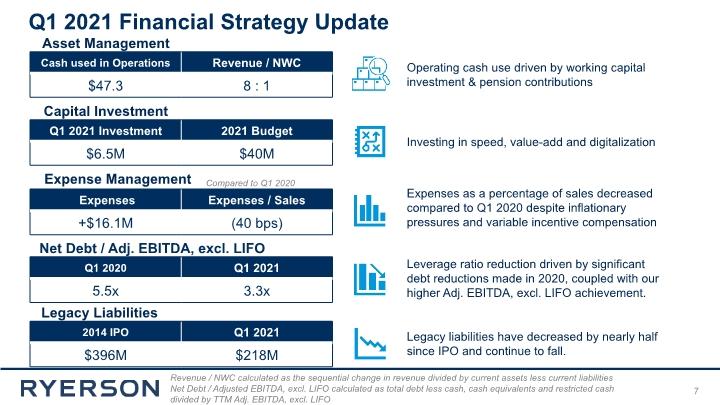
7 Q1 2021 Financial Strategy Update Capital Investment Investing in speed, value-add and digitalization Expense Management Compared to Q1 2020 Expenses as a percentage of sales decreased compared to Q1 2020 despite inflationary pressures and variable incentive compensation Asset Management Operating cash use driven by working capital investment & pension contributions Net Debt / Adj. EBITDA, excl. LIFO Legacy Liabilities Leverage ratio reduction driven by significant debt reductions made in 2020, coupled with our higher Adj. EBITDA, excl. LIFO achievement. Revenue / NWC calculated as the sequential change in revenue divided by current assets less current liabilities Net Debt / Adjusted EBITDA, excl. LIFO calculated as total debt less cash, cash equivalents and restricted cash divided by TTM Adj. EBITDA, excl. LIFO Legacy liabilities have decreased by nearly half since IPO and continue to fall.
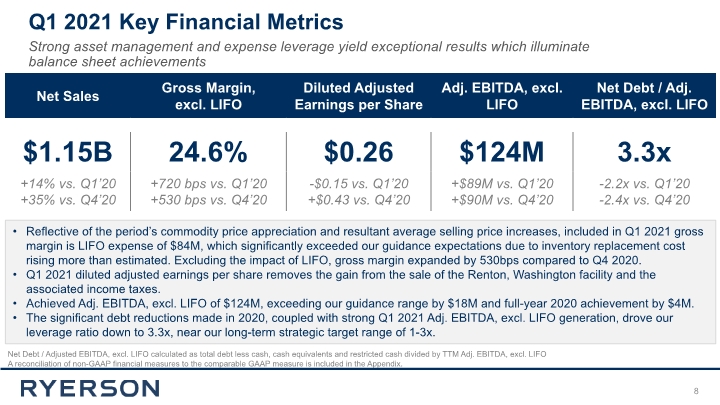
Net Debt / Adjusted EBITDA, excl. LIFO calculated as total debt less cash, cash equivalents and restricted cash divided by TTM Adj. EBITDA, excl. LIFO A reconciliation of non-GAAP financial measures to the comparable GAAP measure is included in the Appendix. Q1 2021 Key Financial Metrics 8 Strong asset management and expense leverage yield exceptional results which illuminate balance sheet achievements Reflective of the period’s commodity price appreciation and resultant average selling price increases, included in Q1 2021 gross margin is LIFO expense of $84M, which significantly exceeded our guidance expectations due to inventory replacement cost rising more than estimated. Excluding the impact of LIFO, gross margin expanded by 530bps compared to Q4 2020. Q1 2021 diluted adjusted earnings per share removes the gain from the sale of the Renton, Washington facility and the associated income taxes. Achieved Adj. EBITDA, excl. LIFO of $124M, exceeding our guidance range by $18M and full-year 2020 achievement by $4M. The significant debt reductions made in 2020, coupled with strong Q1 2021 Adj. EBITDA, excl. LIFO generation, drove our leverage ratio down to 3.3x, near our long-term strategic target range of 1-3x.
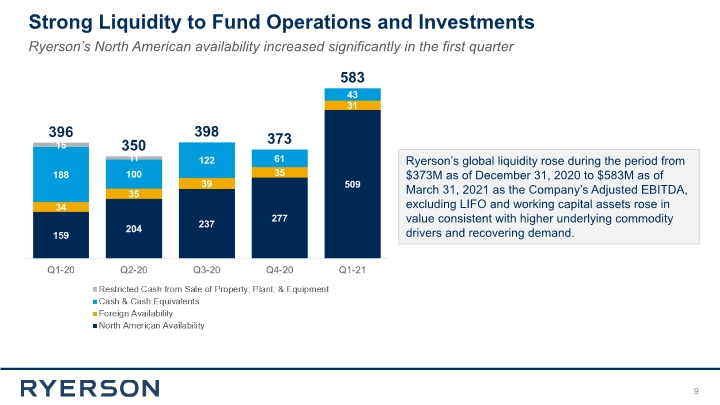
Strong Liquidity to Fund Operations and Investments 9 Ryerson’s North American availability increased significantly in the first quarter Ryerson’s global liquidity rose during the period from $373M as of December 31, 2020 to $583M as of March 31, 2021 as the Company’s Adjusted EBITDA, excluding LIFO and working capital assets rose in value consistent with higher underlying commodity drivers and recovering demand.

97 Locations 179 Years 40,000Customers 75,000 Products Focused on creating great customer experiences at Speed, Scale, & Consistency The Ryerson Customer Experience Eco-System Intelligently Connected Network of Service Centers
Appendix
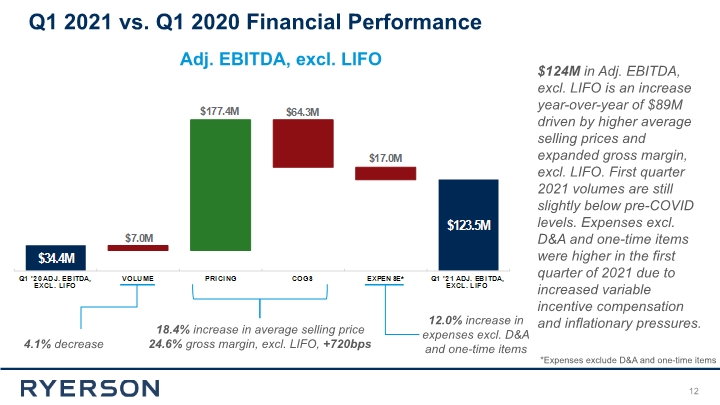
12 18.4% increase in average selling price 24.6% gross margin, excl. LIFO, +720bps Adj. EBITDA, excl. LIFO 4.1% decrease 12.0% increase in expenses excl. D&A and one-time items $124M in Adj. EBITDA, excl. LIFO is an increase year-over-year of $89M driven by higher average selling prices and expanded gross margin, excl. LIFO. First quarter 2021 volumes are still slightly below pre-COVID levels. Expenses excl. D&A and one-time items were higher in the first quarter of 2021 due to increased variable incentive compensation and inflationary pressures. Q1 2021 vs. Q1 2020 Financial Performance *Expenses exclude D&A and one-time items
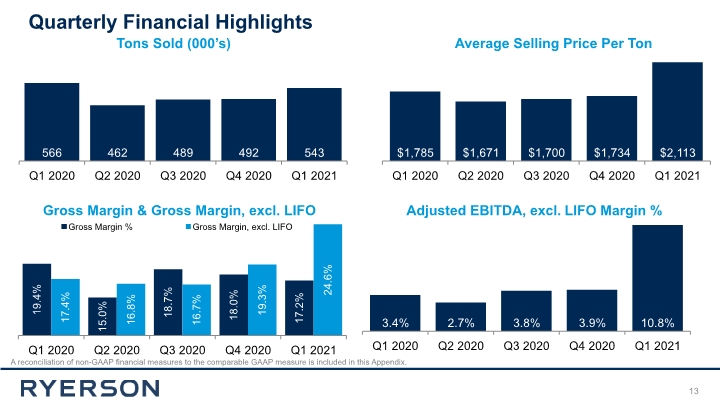
Quarterly Financial Highlights A reconciliation of non-GAAP financial measures to the comparable GAAP measure is included in this Appendix. Tons Sold (000’s) Average Selling Price Per Ton Adjusted EBITDA, excl. LIFO Margin % 13 Gross Margin & Gross Margin, excl. LIFO
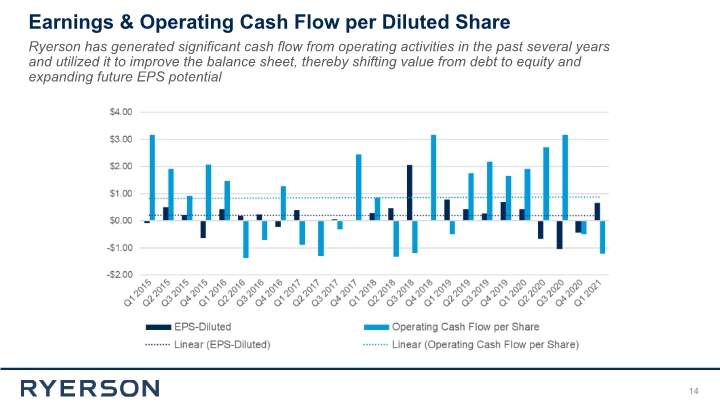
Earnings & Operating Cash Flow per Diluted Share 14 Ryerson has generated significant cash flow from operating activities in the past several years and utilized it to improve the balance sheet, thereby shifting value from debt to equity and expanding future EPS potential
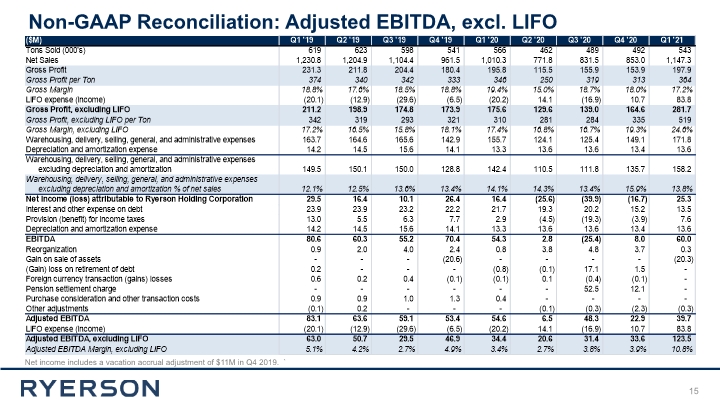
15 Non-GAAP Reconciliation: Adjusted EBITDA, excl. LIFO Net income includes a vacation accrual adjustment of $11M in Q4 2019. `
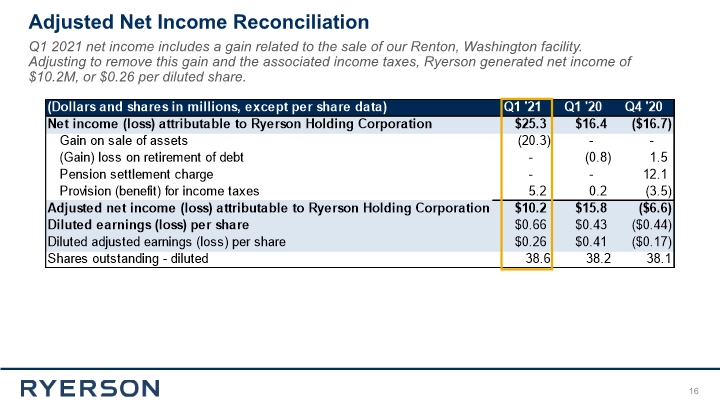
Adjusted Net Income Reconciliation 16 Q1 2021 net income includes a gain related to the sale of our Renton, Washington facility. Adjusting to remove this gain and the associated income taxes, Ryerson generated net income of $10.2M, or $0.26 per diluted share.
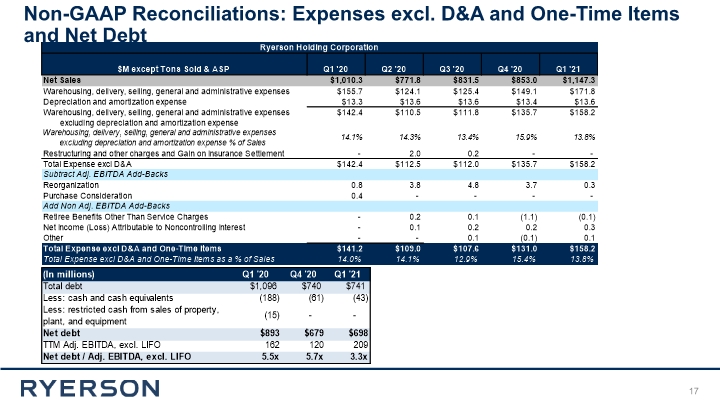
Non-GAAP Reconciliations: Expenses excl. D&A and One-Time Items and Net Debt 17
31 Note: EBITDA represents net income before interest and other expense on debt, provision for income taxes, depreciation, and amortization. Adjusted EBITDA gives further effect to, among other things, reorganization expenses, gain on sale of assets, gain or loss on retirement of debt, loss on pension settlement, purchase consideration and other transaction costs, and foreign currency transaction gains and losses. We believe that the presentation of EBITDA, Adjusted EBITDA, and Adjusted EBITDA, excluding LIFO expense (income), provides useful information to investors regarding our operational performance because they enhance an investor’s overall understanding of our core financial performance and provide a basis of comparison of results between current, past, and future periods. We also disclose the metric Adjusted EBITDA, excluding LIFO expense (income), to provide a means of comparison amongst our competitors who may not use the same basis of accounting for inventories. EBITDA, Adjusted EBITDA, and Adjusted EBITDA, excluding LIFO expense (income), are three of the primary metrics management uses for planning and forecasting in future periods, including trending and analyzing the core operating performance of our business without the effect of U.S. generally accepted accounting principles, or GAAP, expenses, revenues, and gains (losses) that are unrelated to the day to day performance of our business. We also establish compensation programs for our executive management and regional employees that are based upon the achievement of pre-established EBITDA, Adjusted EBITDA, and Adjusted EBITDA, excluding LIFO expense (income), targets. We also use EBITDA, Adjusted EBITDA, and Adjusted EBITDA, excluding LIFO expense (income), to benchmark our operating performance to that of our competitors. EBITDA, Adjusted EBITDA, and Adjusted EBITDA, excluding LIFO expense (income), do not represent, and should not be used as a substitute for, net income or cash flows from operations as determined in accordance with generally accepted accounting principles, and neither EBITDA, Adjusted EBITDA, and Adjusted EBITDA, excluding LIFO expense (income), is necessarily an indication of whether cash flow will be sufficient to fund our cash requirements. This release also presents gross margin, excluding LIFO expense (income), which is calculated as gross profit minus LIFO expense (income), divided by net sales. We have excluded LIFO expense (income) from gross margin and Adjusted EBITDA as a percentage of net sales metrics in order to provide a means of comparison amongst our competitors who may not use the same basis of accounting for inventories as we do. Our definitions of EBITDA, Adjusted EBITDA, Adjusted EBITDA, excluding LIFO expense (income), gross margin, excluding LIFO expense (income), and Adjusted EBITDA, excluding LIFO expense (income), as a percentage of sales may differ from that of other companies. Adjusted Net income (loss) and Adjusted Earnings (loss) per share is presented to provide a means of comparison with periods that do not include similar adjustments. 18 Non-GAAP Reconciliation
