Attached files
| file | filename |
|---|---|
| EX-99.1 - EX-99.1 - Santander Consumer USA Holdings Inc. | a2021q1exhibit991.htm |
| 8-K - 8-K - Santander Consumer USA Holdings Inc. | sc-20210428.htm |
First Quarter 2021 April 28, 2021 Exhibit 99.2

IMPORTANT INFORMATION 2 Forward-Looking Statements This press release contains forward-looking statements within the meaning of the Private Securities Litigation Reform Act of 1995. Any statements about our expectations, beliefs, plans, predictions, forecasts, objectives, assumptions, or future events or performance are not historical facts and may be forward-looking. These statements are often, but not always, made through the use of words or phrases such as anticipates, believes, can, could, may, predicts, potential, should, will, estimates, plans, projects, continuing, ongoing, expects, intends, and similar words or phrases. Although we believe that the expectations reflected in these forward-looking statements are reasonable, these statements are not guarantees of future performance and involve risks and uncertainties that are subject to change based on various important factors, some of which are beyond our control. For additional discussion of these risks, refer to the section entitled Risk Factors and elsewhere in our Annual Report on Form 10-K and our Quarterly Reports on Form 10- Q or Current Reports on Form 8-K, or other applicable documents that are filed or furnished with the U.S. Securities and Exchange Commission (collectively, our "SEC filings"). Among the factors that could cause the forward-looking statements in this press release and/or our financial performance to differ materially from that suggested by the forward- looking statements are (a) the adverse impact of COVID-19 on our business, financial condition, liquidity and results of operations; (b) continually changing federal, state, and local laws and regulations could materially adversely affect our business; (c) adverse economic conditions in the United States and worldwide may negatively impact our results; (d) a reduction in our access to funding a reduction in ; (e) significant risks we face implementing our growth strategy, some of which are outside our control; (f) our agreement with FCA US LLC may not result in currently anticipated levels of growth and is subject to certain conditions that could result in termination of the agreement; (g) our business could suffer if we are unsuccessful in developing and maintaining relationships with automobile dealerships; (h) our financial condition, liquidity, and results of operations depend on the credit performance of our loans; (i) loss of our key management or other personnel, or an inability to attract such management and personnel; (j) certain regulations, including but not limited to oversight by the Office of the Comptroller of the Currency, the Consumer Financial Protection Bureau, the European Central Bank, and the Federal Reserve, whose oversight and regulation may limit certain of our activities, including the timing and amount of dividends and other limitations on our business; and (k) future changes in our relationship with SHUSA and Banco Santander that could adversely affect our operations. If one or more of the factors affecting our forward-looking information and statements proves incorrect, our actual results, performance or achievements could differ materially from those expressed in, or implied by, forward-looking information and statements. Therefore, we caution the reader not to place undue reliance on any forward-looking information or statements. The effect of these factors is difficult to predict. Factors other than these also could adversely affect our results, and the reader should not consider these factors to be a complete set of all potential risks or uncertainties as new factors emerge from time to time. Any forward-looking statements only speak as of the date of this document, and we undertake no obligation to update any forward-looking information or statements, whether written or oral, to reflect any change, except as required by law. All forward-looking statements attributable to us are expressly qualified by these cautionary statements.

Record Q1 results reflect strong business model, resilient US consumer and robust used vehicle prices 3 Q1 2021 Earnings Highlights Results Capital & Liquidity Credit Performance ► Net income of $742 million in Q1 2021, or $2.42 of diluted EPS ► Net interest margin of 10.7%, up 150bps YoY ► Total auto originations of $8.6 billion in Q1 2021, up 24% YoY ► Through Santander Bank, originated $2.0 billion in auto loans in Q1 2021 ► CET1 ratio of 16.5% ► Declared and paid a $0.22 ordinary dividend and a $0.22 special dividend in March 2021 ► Issued ~$3.5B of ABS across two transactions, both achieved lowest cost of funds and largest deal size in platform history ► Executed ~$2.4 billion in off-balance sheet prime loan sales, adding to the serviced for others platform ► 30 to 59 delinquency ratio of 4.4%, down 390 bps YoY ► 59-plus delinquency ratio of 2.2%, down 240 bps YoY ► Gross charge-off ratio of 9.7%, down 580 bps YoY ► Recovery rate of 69.1%, up from 50.1% YoY ► Net charge-off ratio of 3.0%, down 470 bps YoY ► CECL allowance ratio of 18.9% Strategic Highlights ► Termination of the Federal Reserve Written Agreement dated March 21, 2017 ► Executed the sale of the $1.3 billion held for sale, personal loan portfolio as well as entered into a forward flow agreement to fund future obligations ► Named Bruce Jackson as Head of Chrysler Capital & Auto Relationships

64.5 26.0 52.5 63.4 70.2 59.7 82.3 101.3 96.2 125.6 127.7 124.1 120.0 109.7 08 09 10 11 12 13 14 15 16 17 18 19 20 21 Mar Mar Mar Mar Mar Mar Mar Mar Mar Mar Mar Mar Mar Mar 5.1% 8.7% 9.9% 9.0% 8.2% 7.5% 6.7% 5.4% 5.0% 4.4% 4.0% 3.8% 4.4% 6.0% 1.1% -3.5% 1.6% 1.9% 2.8% 1.1% 1.7% 2.9% 1.4% 1.4% 2.2% 3.1% -5.0% 6.0% 4 Economic Indicators Consumer Confidence1 U.S. Unemployment Statistics2 U.S. GDP QoQ Change3 Consumer confidence index remains low due to the economic impact of the pandemic Unemployment rate of 6.0% in March improved from peak levels experienced during the pandemic but remains well above pre-pandemic levels US GDP increased 6% in Q1 2021 vs. Q4 2020, as the economy continued to recover relative to levels experienced during 2020 1 The Conference Board’s consumer confidence index, monthly data as of March 31, 2021 2 U.S. Bureau of Labor Statistics, monthly data as of March 31, 2021 3 U.S. Bureau of Economic (BEA) Analysis, quarterly data as of December 31, 2020 * U.S. GDP Q1 2021: Federal Reserve Bank of Atlanta, GDPNow advance estimate as of April 9, 2021 *

136.0 140.5 139.9 141.1 141.9 149.3 161.2 161.1 179.2 118.4 122.0 121.8 117.9 121.6 126.8 139.5 135.1 151.4 1Q 2019 2Q 2019 3Q 2019 4Q 2019 1Q 2020 2Q 2020 3Q 2020 4Q 2020 1Q 2021 1 U.S. Bureau of Economic Analysis, Light Weight Vehicle Sales: Autos and Light Trucks, monthly data as of March 31, 2021 2 Cox Automotive, 13-Month Rolling Used-Vehicle SAAR, monthly data as of March 31, 2021 3 Manheim, Inc.; Indexed to a basis of 100 at 1995 levels; JD Power Used-Vehicle Price Index (not seasonally adjusted), both monthly, quarter end 39.2 39.8 39.8 40.0 32.0 36.0 38.0 38.0 40.5 17.3 17.2 17.1 16.6 11.4 13.0 17.0 16.3 17.7 5 Auto Industry Overview Used Vehicle Price Indices3 Used Vehicle SAAR2 Used vehicle prices increased to record levels as demand outpaces supply Used auto sales of 40.5M, up 7% QoQ driven by consumer demand and low levels of new car supply JDP Manheim New Vehicle SAAR1 Auto sales of 17.7M, up 9% QoQ driven by strong consumer demand

Three Months Ended Originations ($ in Millions) Q1 2021 Q4 2020 Q1 2020 QoQ YoY Total Core Retail Auto 2,797$ 2,482$ 2,306$ 13% 21% Chrysler Capital Loans (<640) 1 1,317 1,141 1,190 15% 11% Chrysler Capital Loans (≥640) 1 2,343 1,863 1,432 26% 64% Total Chrysler Capital Retail 3,660 3,005 2,622 22% 40% Total Leases 2 2,157 1,960 2,024 10% 7% Total Auto Originations 3 8,614$ 7,446$ 6,951$ 16% 24% SBNA Originations 4 1,977$ 1,531$ 1,081$ 29% 83% % Variance 6 Quarterly Originations 1 Approximate FICOs 2 Includes nominal capital lease originations 3 4 Includes SBNA Originations SBNA Originations remain off of SC’s balance sheet in the Service For Others portfolio

$0 $200 $400 $600 $800 $1,000 $1,200 $1,400 Jan Feb Mar Apr May Jun Jul Aug Sep Oct Nov Dec '20 v '21 YoY 9% 68% 126% '19 v '21 YoY 33% 104%228% Jan Feb Mar Apr May Jun Jul Aug Sep Oct Nov Dec '20 v '21 YoY -6% -6% 41% '19 v '21 YoY -12% -18% 24% $0 $100 $200 $300 $400 $500 $600 $700 Jan Feb Mar Apr May Jun Jul Aug Sep Oct Nov Dec '20 v '21 YoY -8% -12% 47% '19 v '21 YoY 5% 2% 20% $0 $200 $400 $600 $800 $1,000 Jan Feb Mar Apr May Jun Jul Aug Sep Oct Nov Dec '20 v '21 YoY 5% 3% 52% '19 v '21 YoY 1% -11% 26% $0 $200 $400 $600 $800 $1,000 $1,200 $1,400 Core Retail Auto ($ in Millions) Chrysler Lease ($ in Millions) Chrysler Capital Loans, <6401 ($ in Millions) Chrysler Capital Loans, ≥6401 ($ in Millions) 2019 2020 2021 1 Approximate FICOs 7 Monthly Originations

38.9% 37.1% 32.5% 28.0% 36.2% 1Q20 2Q20 3Q20 4Q20 1Q21 447 367 507 499 470 1Q20 2Q20 3Q20 4Q20 1Q21 8 Stellantis Relationship Stellantis Sales1 (units in ‘000s) Chrysler Capital Penetration Rate SC continues to partner with Stellantis to drive sales • Support both retail and lease incentives • Penetration rate of 36.2%, down 270 bps due to fewer CCAP exclusive incentives than prior year 1 Stellantis filings; sales as reported on 04/01/2021

85% 85% 83% 86% 74% 15% 15% 17% 14% 26% $10,331 $11,211 $11,511 $11,563 $14,216 1Q20 2Q20 3Q20 4Q20 1Q21 Related Party 3rd Party 9 Serviced for Others (SFO) Platform Serviced for others balance growth driven by prime originations through Stellantis ~$2.0B in SBNA originations ~$2.4B in off-balance sheet prime loan sales also increased SFO balances • Diverse investor base through ABS and privately negotiated third-party sales Serviced for Others Balances, End of Period ($ in Millions)
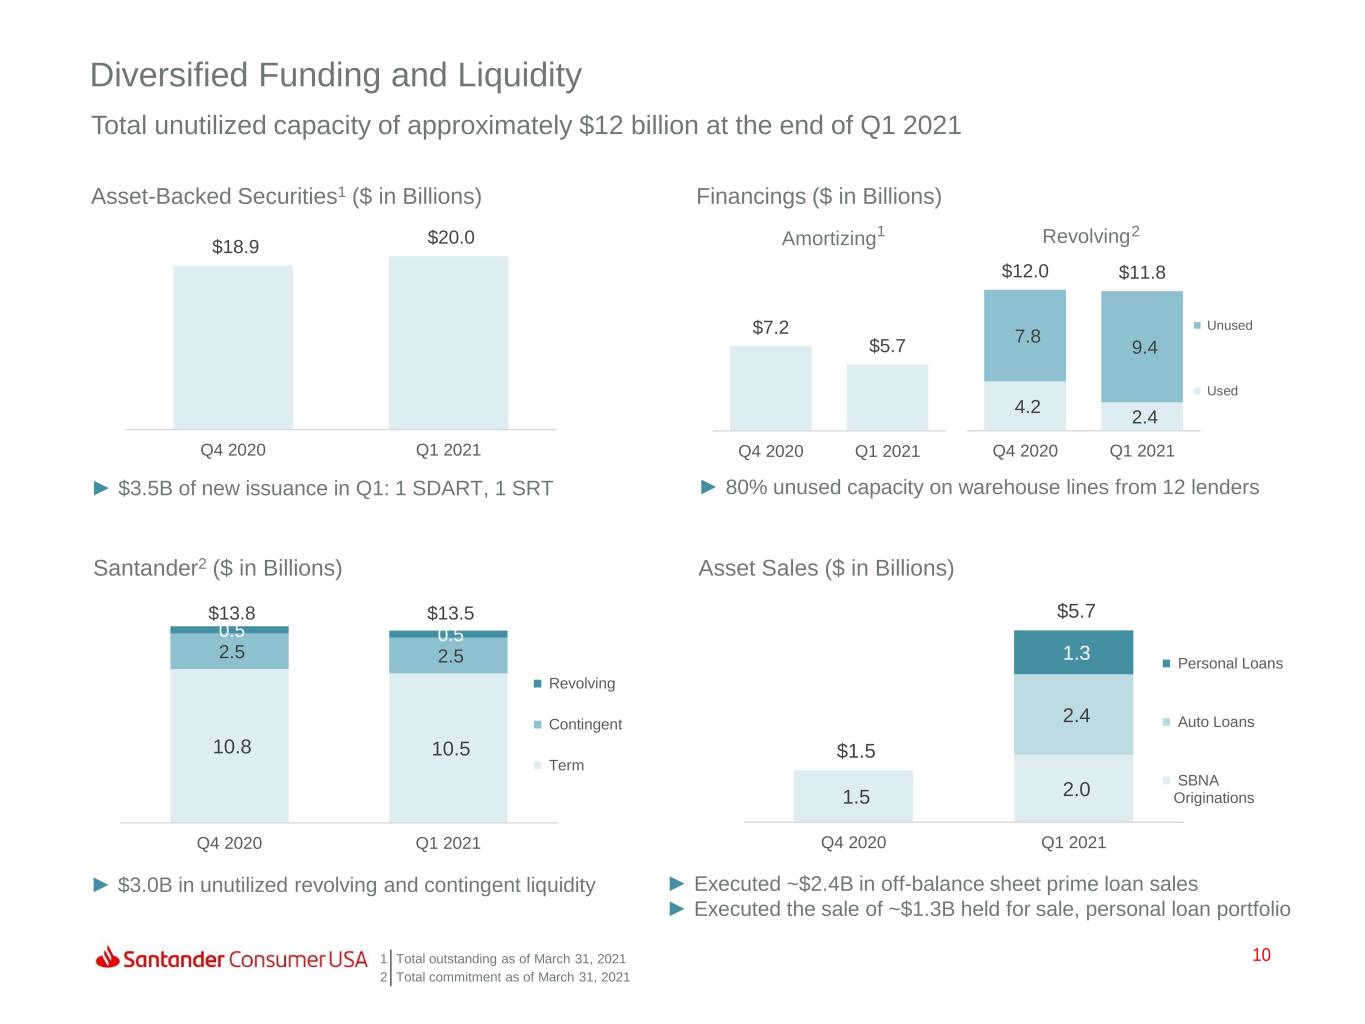
1.5 2.0 2.4 1.3 $1.5 $5.7 Q4 2020 Q1 2021 Personal Loans Auto Loans SBNA Originations 10.8 10.5 2.5 2.5 0.5 0.5 $13.8 $13.5 Q4 2020 Q1 2021 Revolving Contingent Term 4.2 2.4 7.8 9.4 $12.0 $11.8 Q4 2020 Q1 2021 Revolving Unused Used $7.2 $5.7 Q4 2020 Q1 2021 Amortizing$18.9 $20.0 Q4 2020 Q1 2021 ► $3.5B of new issuance in Q1: 1 SDART, 1 SRT Total unutilized capacity of approximately $12 billion at the end of Q1 2021 Diversified Funding and Liquidity Asset-Backed Securities1 ($ in Billions) Financings ($ in Billions) Santander2 ($ in Billions) Asset Sales ($ in Billions) ► 80% unused capacity on warehouse lines from 12 lenders ► $3.0B in unutilized revolving and contingent liquidity ► Executed ~$2.4B in off-balance sheet prime loan sales ► Executed the sale of ~$1.3B held for sale, personal loan portfolio 1 2 1 Total outstanding as of March 31, 2021 2 Total commitment as of March 31, 2021 10

11 Q1 2021 Financial Results Three Months Ended (Unaudited, Dollars in Thousands, except per share) March 31, 2021 December 31, 2020 March 31, 2020 Interest on finance receivables and loans $1,304,651 $1,315,290 $1,273,819 Net leased vehicle income 317,089 293,143 195,067 Other finance and interest income 1,426 1,508 7,551 Interest expense 253,537 274,400 328,834 Net finance and other interest income $1,369,629 $1,335,541 $1,147,603 Credit Loss Expense 136,209 254,129 907,887 Profit sharing 67,326 64,518 14,295 Total other income 104,510 (15,367) 50,807 Total operating expenses 294,492 318,307 282,673 Income before tax $976,112 $683,220 ($6,445) Income tax expense 234,457 161,760 (2,458) Net income $741,655 $521,460 ($3,987) Diluted EPS ($) $2.42 $1.70 ($0.01) Average total assets $48,262,590 $48,678,394 $47,690,751 Average managed assets $63,779,438 $63,600,301 $60,207,338

7.7% 6.0% 0.6% 3.5% 3.0% 1Q 2020 2Q 2020 Q3 2020 Q4 2020 1Q 2021 50.1% 45.7% 91.4% 64.2% 69.1% 15.5% 11.1% 6.8% 9.9% 9.7% 4.6% 2.4% 2.4% 3.1% 2.2% 8.3% 4.3% 5.0% 6.0% 4.4% SC Recovery Rates1 (% of Gross Loss) Net Charge-off Rates2 12 Quarterly Delinquency & Loss Delinquency Ratios: 30-59 Days Delinquent, RICs, HFI Delinquency Ratios: >59 Days Delinquent, RICs, HFI Gross Charge-off Rates Late stage delinquencies decreased 240 bps YoY Gross charge-off rate decreased 580 bps YoY 1 Recovery Rate – Per the financial statements includes insurance proceeds, bankruptcy/deficiency sales, and timing impacts 2 Net Charge-off rates on retail installment contracts, held for investment SC’s Q1 recovery rate of 69% remains elevated due to low gross losses and continued strength in wholesale auction prices Net charge-off rate decreased 470 bps YoY Early stage delinquencies decreased 390 bps YoY Delinquencies and charge-offs remain low due to disciplined underwriting, government stimulus and strong used vehicle prices

-3.0 0.0 3.0 6.0 9.0 12.0 15.0 Jan Feb Mar Apr May Jun Jul Aug Sep Oct Nov Dec 2019 11.3 8.7 5.8 6.1 6.1 7.0 8.0 7.5 8.6 8.6 7.3 8.7 2020 9.3 7.3 6.6 8.7 6.4 3.1 1.2 -1.4 1.9 2.1 3.7 4.8 2021 4.2 3.5 1.2 -3.0% 0. % 3.0% 6.0% 9.0% 12.0% 15.0% 0.0 25.0 50.0 75.0 100.0 125.0 Jan Feb Mar Apr May Jun Jul Aug Sep Oct Nov Dec 2019 49.0 54.6 66.1 62.5 62.4 56.0 55.2 59.2 53.2 52.9 57.5 46.2 2020 46.0 53.0 52.1 32.1 49.1 62.1 81.7 126.1 76.4 78.2 60.5 54.8 2021 58.9 63.1 86.8 Jan Feb Mar Apr May Jun Jul Aug Sep Oct Nov Dec 2019 22.3 19.1 17.0 16.1 16.1 15.8 17.9 18.4 18.5 18.3 17.1 16.1 2020 17.2 15.6 13.7 12.9 12.6 8.1 6.7 5.5 7.9 9.5 9.5 10.7 2021 10.3 9.4 9.4 13 Loss and Recovery Ratios (Annualized) Gross Charge-off Ratio (%) Recovery Rates (% of Gross Loss) Net Charge-off Ratio (%) 0.0% 5.0% 10.0% 15.0% 20.0% 25.0% 0.0% 25.0% 50.0% 75.0% 10 .0% 125.0% 2019 2020 2021

$593 $244 $97 ($279) ($167) Q1 2020 Balance & Other Gross Loss Performance Recoveries Q1 2021 14 Loss Detail Net Charge-off Walk, ($ in Millions) Net charge-offs for RICs decreased to $244M, down $349M YoY $97M increase in losses due to higher loan balances and other items $279M decrease due to lower gross charge-off rate $167M decrease due to improved recovery performance

$6,107 $6,001 $75 ($100) ($81) 4Q 2020 Credit & Portfolio Mix Economic Factors Balance 1Q 2021 594 462 48 296 243 314 400 293 (42) (107) $908 $862 $341 $254 $136 Q1 2020 Q2 2020 Q3 2020 Q4 2020 Q1 2021 Net Charge-offs Build Release 15 Allowance Walk Q4 2020 to Q1 2021 Allowance for Credit Loss Walk (RICs, HFI 1 $ in Millions) Allowance for credit loss decreased by $106M QoQ $75M increase due to credit & portfolio mix $100M decrease due to improved macroeconomic factors $81M decrease due to lower asset balances Credit loss expense decreased to $136M in Q1 2021 $772M decrease YoY driven by lower net charge-offs in Q1 2021 and a macroeconomic related build in Q1 2020 Credit Loss Expense ($ in Millions) 1 Allowance for credit loss related to retail installment contracts, held for investment

16 Allowance Ratios Dollars in Millions (Unaudited) (Unaudited) (Unaudited) Allowance Ratios March 31, 2021 December 31, 2020 March 31, 2020 TDR Unpaid principal balance $4,357 $3,945 $3,460 TDR Impairment $1,339 $1,314 $973 TDR Allowance ratio 30.7% 33.3% 28.1% Non-TDR Unpaid principal balance $27,443 $28,977 $27,262 Non-TDR Allowance $4,663 $4,792 $4,483 Non-TDR Allowance ratio 17.0% 16.5% 16.4% Total Unpaid principal balance $31,800 $32,922 $30,722 Total Allowance $6,001 $6,107 $5,456 Total Allowance ratio 18.9% 18.5% 17.8% TDR allowance ratio decreased 260bps QoQ, due to improved portfolio and macroeconomic outlook Non-TDR allowance ratio increased 50 bps, due to prime asset sales Total allowance ratio increased to 18.9%, due to remaining uncertainty related to level and timing of economic recovery
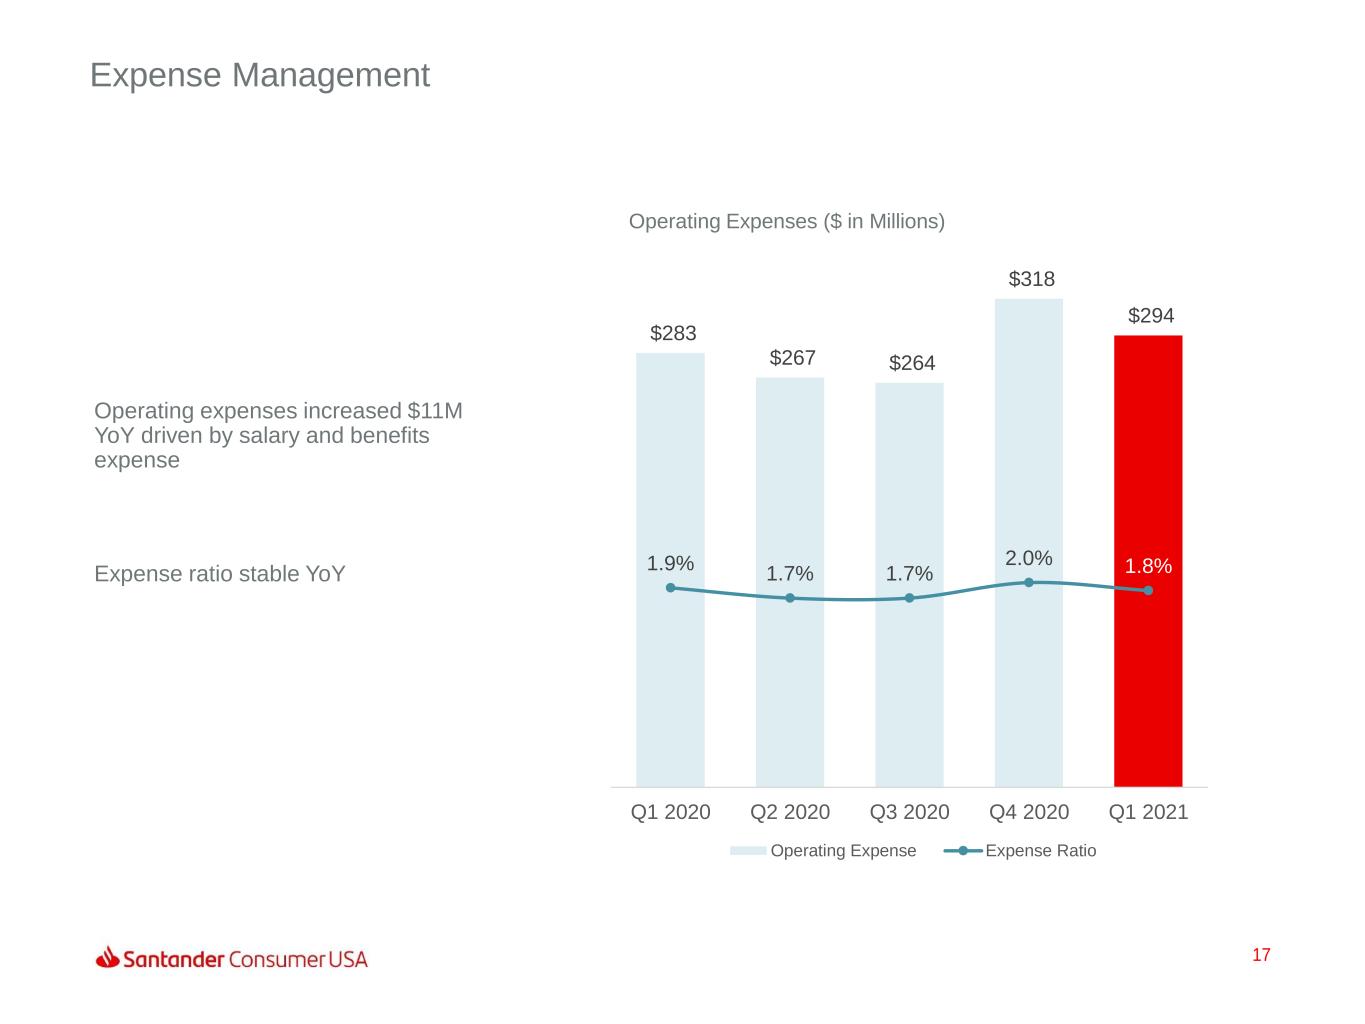
$283 $267 $264 $318 $294 1.9% 1.7% 1.7% 2.0% 1.8% -2.0% 0.0% 2.0% 4.0% 6.0% 8.0% 10.0% $- $50 $100 $150 $200 $250 $300 $350 $400 Q1 2020 Q2 2020 Q3 2020 Q4 2020 Q1 2021 Operating Expense Expense Ratio 17 Expense Management Operating Expenses ($ in Millions) Operating expenses increased $11M YoY driven by salary and benefits expense Expense ratio stable YoY

Q1 2020 Q2 2020 Q3 2020 Q4 2020 Q1 2021 Tier 1 common capital $6,726 $6,574 $6,834 $7,341 $7,916 Risk weighted assets $48,830 $48,998 $49,883 $50,424 $47,996 CET1 13.8% 13.4% 13.7% 14.6% 16.5% 13.8% 13.4% 13.7% 14.6% 16.5% 0.0% 2.0% 4.0% 6.0% 8.0% 10.0% 12.0% 14.0% 16.0% 18.0% $60,000 $70,000 $80,000 $90,000 $100,000 $110,000 $120,000 18 CET1 Ratio SC maintains strong capital levels in addition to its loan loss reserves and declared and paid a $0.22 ordinary dividend and a $0.22 special dividend in March 2021 1 CET1 is calculated under Basel III regulations required as of January 1, 2015. Please see the appendix for further details related to CECL phase-in impact. 2 Under the banking agencies' risk-based capital guidelines, assets and credit equivalent amounts of derivatives and off-balance sheet exposures are assigned to .broad risk .categories. The aggregate dollar amount in each risk category is multiplied by the associated risk weight of the category. The resulting weighted values are added together with the measure for market risk, resulting in the Company's and the Bank's total Risk weighted assets Common Equity Tier 1 Capital Ratio 1 2

APPENDIX

55% 66% 58% 55% 55% 45% 34% 42% 45% 45% $4,927 $6,823 $6,525 $5,486 $6,456 1Q20 4Q19 3Q20 4Q20 1Q21 New Used 11% 7% 9% 10% 9% 12% 7% 8% 8% 8% 23% 15% 21% 22% 21% 15% 10% 14% 15% 15% 39% 61% 48% 45% 47% $4,927 $6,823 $6,525 $5,486 $6,456 1Q20 2Q20 3Q20 4Q20 1Q21 No FICOs <540 540-599 600-639 >=6402 20 Diversified Underwriting Across Full Credit Spectrum Originations by Credit (RICs)1 New/Used Originations 1 RIC; Retail Installment Contract 2 No FICO score obtained; Includes commercial loans. $24,776 $28,820 $25,781 $26,584 $26,725 Average Loan Balance in Dollars
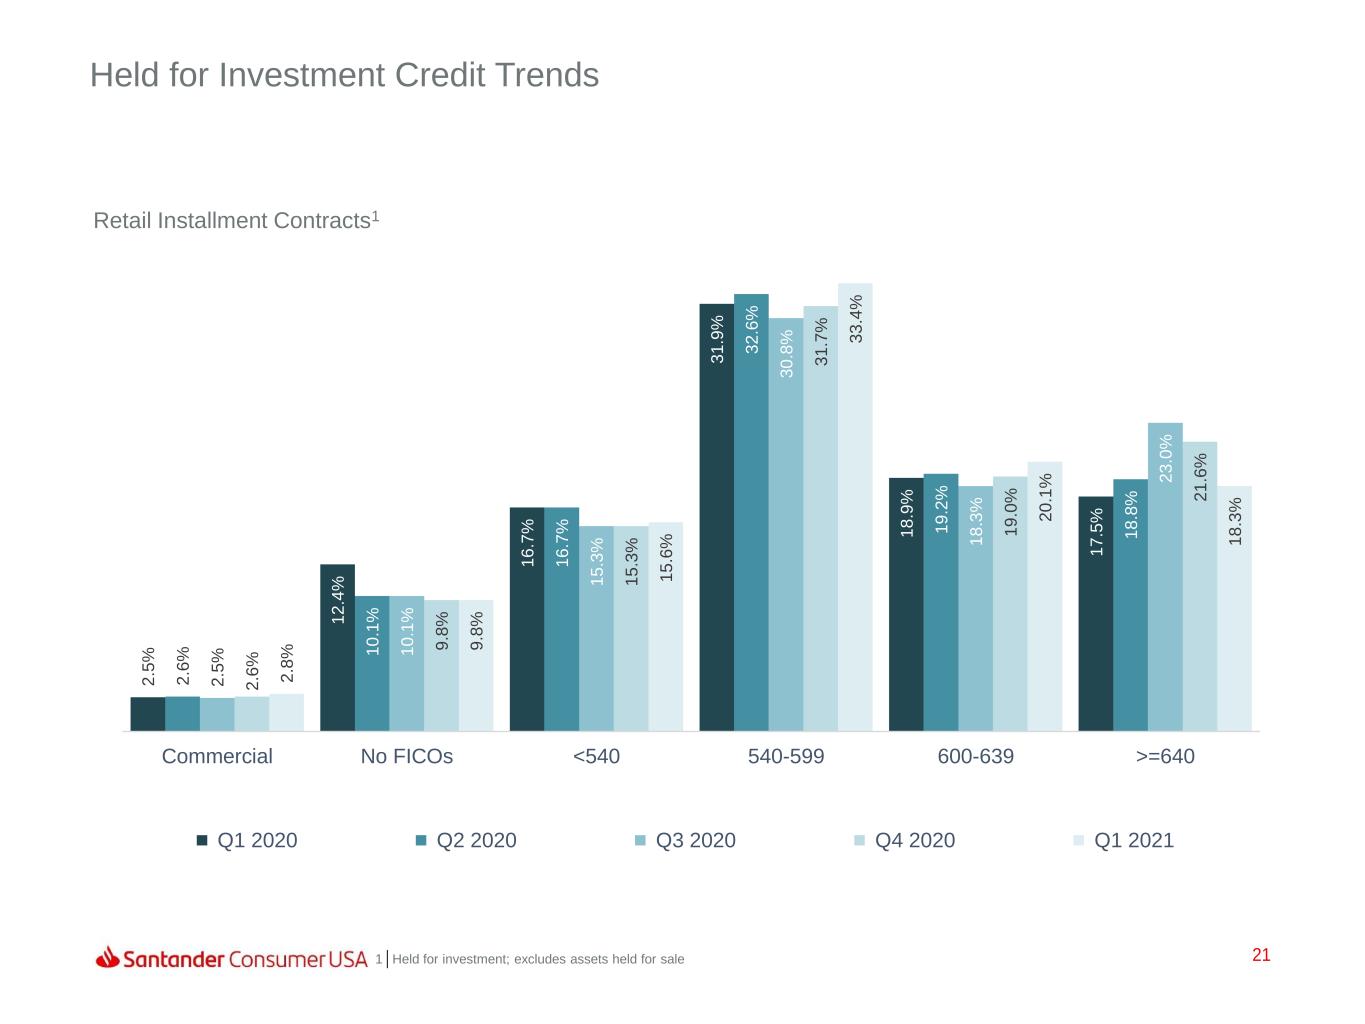
2 .5 % 1 2 .4 % 1 6 .7 % 3 1 .9 % 1 8 .9 % 1 7 .5 % 2 .6 % 1 0 .1 % 1 6 .7 % 3 2 .6 % 1 9 .2 % 1 8 .8 % 2 .5 % 1 0 .1 % 1 5 .3 % 3 0 .8 % 1 8 .3 % 2 3 .0 % 2 .6 % 9 .8 % 1 5 .3 % 3 1 .7 % 1 9 .0 % 2 1 .6 % 2 .8 % 9 .8 % 1 5 .6 % 3 3 .4 % 2 0 .1 % 1 8 .3 % Commercial No FICOs <540 540-599 600-639 >=640 Q1 2020 Q2 2020 Q3 2020 Q4 2020 Q1 2021 21 Held for Investment Credit Trends Retail Installment Contracts1 1 Held for investment; excludes assets held for sale
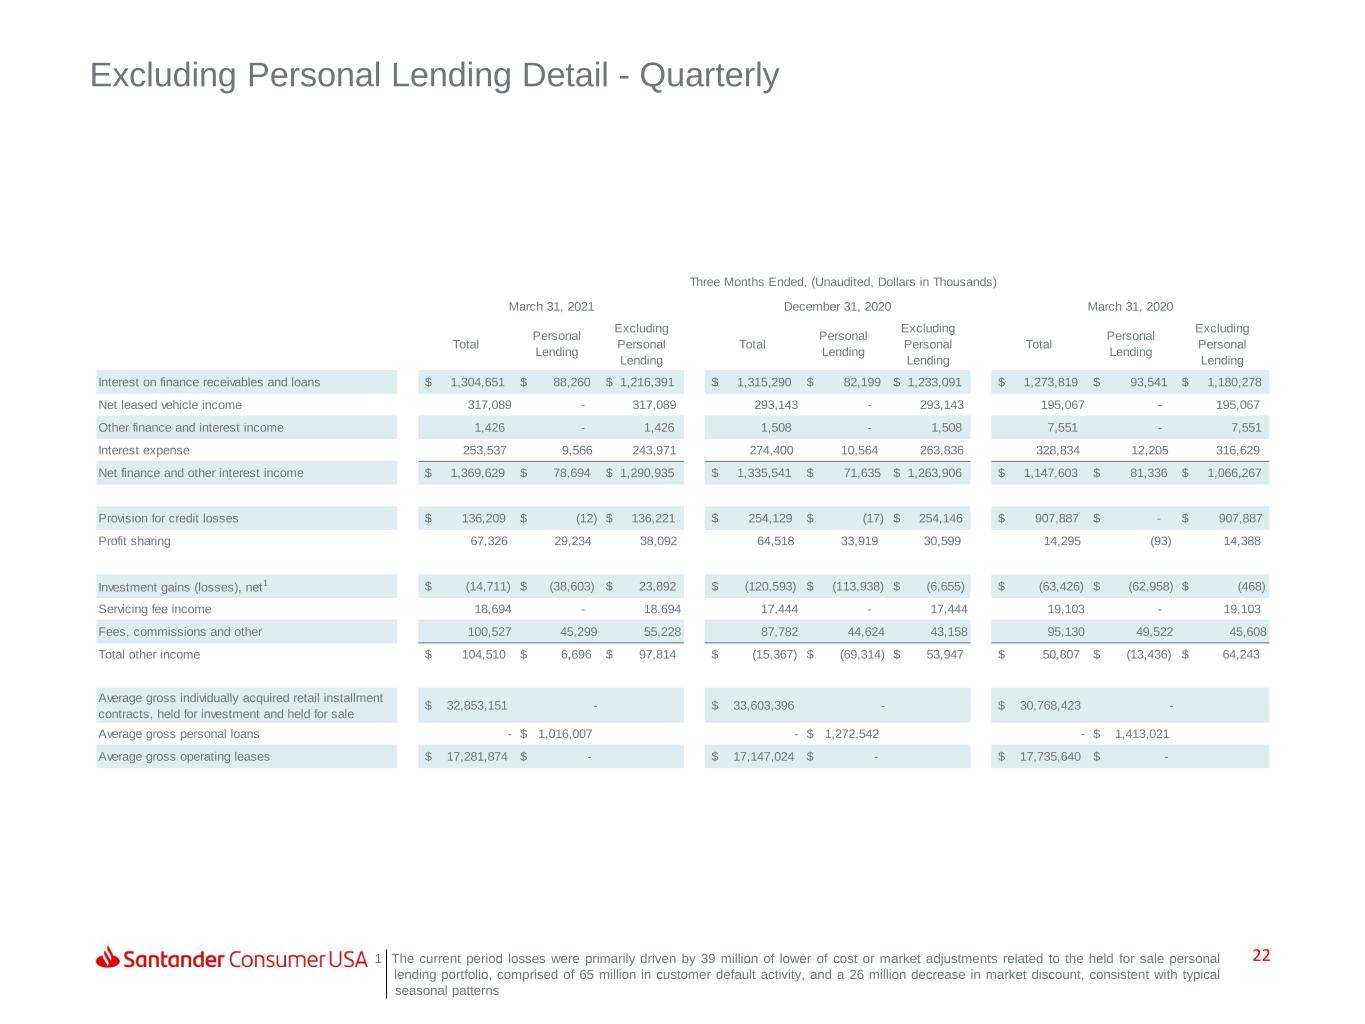
22 Excluding Personal Lending Detail - Quarterly 1 The current period losses were primarily driven by 39 million of lower of cost or market adjustments related to the held for sale personal ..lending portfolio, comprised of 65 million in customer default activity, and a 26 million decrease in market discount, consistent with typical ..seasonal patterns Total Personal Lending Excluding Personal Lending Total Personal Lending Excluding Personal Lending Total Personal Lending Excluding Personal Lending Interest on finance receivables and loans $ 1,304,651 $ 88,260 $ 1,216,391 $ 1,315,290 $ 82,199 $ 1,233,091 $ 1,273,819 $ 93,541 $ 1,180,278 Net leased vehicle income 317,089 - 317,089 293,143 - 293,143 195,067 - 195,067 Other finance and interest income 1,426 - 1,426 1,508 - 1,508 7,551 - 7,551 Interest expense 253,537 9,566 243,971 274,400 10,564 263,836 328,834 12,205 316,629 Net finance and other interest income $ 1,369,629 $ 78,694 $ 1,290,935 $ 1,335,541 $ 71,635 $ 1,263,906 $ 1,147,603 $ 81,336 $ 1,066,267 Provision for credit losses $ 136,209 $ (12) $ 136,221 $ 254,129 $ (17) $ 254,146 $ 907,887 $ - $ 907,887 Profit sharing 67,326 29,234 38,092 64,518 33,919 30,599 14,295 (93) 14,388 Investment gains (losses), net 1 $ (14,711) $ (38,603) $ 23,892 $ (120,593) $ (113,938) $ (6,655) $ (63,426) (62,958)$ $ (468) Servicing fee income 18,694 - 18,694 17,444 - 17,444 19,103 - 19,103 Fees, commissions and other 100,527 45,299 55,228 87,782 44,624 43,158 95,130 49,522 45,608 Total other income $ 104,510 $ 6,696 $ 97,814 $ (15,367) $ (69,314) $ 53,947 $ 50,807 $ (13,436) $ 64,243 Average gross individually acquired retail installment contracts, held for investment and held for sale $ 32,853,151 - $ 33,603,396 - $ 30,768,423 - Average gross personal loans - $ 1,016,007 - $ 1,272,542 - $ 1,413,021 Average gross operating leases $ 17,281,874 $ - $ 17,147,024 $ - $ 17,735,640 $ - March 31, 2020 Three Months Ended, (Unaudited, Dollars in Thousands) March 31, 2021 December 31, 2020

23 Reconciliation of Non-GAAP Measures a Under the banking agencies' risk-based capital guidelines, assets and credit equivalent amounts of derivatives and off-balance sheet exposures are assigned to broad risk categories. The aggregate dollar amount in each risk category is multiplied by the associated risk weight of the category. The resulting weighted values are added together with the measure for market risk, resulting in the Company's total Risk weighted assets. b CET1 is calculated under Basel III regulations required as of January 1, 2015. The fully phased-in capital ratios are non-GAAP financial measures. c As described in our 2020 annual report on Form 10-K, on January 1, 2020, we adopted ASU 2016-13, Financial Instruments -Credit Losses (“CECL”), which upon adoption resulted in a reduction to our opening retained earnings balance, net of income tax, and increase to the allowance for credit losses of approximately $2 billion. As also described in our 2019 10-K, the U.S. banking agencies in December 2018 had approved a final rule to address the impact of CECL on regulatory capital by allowing banking organizations, including the Company, the option to phase in the day-one impact of CECL until the first quarter of 2023. In March 2020, the U.S. banking agencies issued an interim final rule that provides banking organizations with an alternative option to delay for two years an estimate of CECL’s effect on regulatory capital, relative to the incurred loss methodology’s effect on regulatory capital, followed by a three-year transition period. The Company elected this alternative option instead of the one described in the December 2018 rule. Three Months Ended (Unaudited, Dollars in Thousands) Mar 31, 2021 Dec 31, 2020 Sep 30, 2020 Jun 30, 2020 Mar 31, 2020 Total equity $6,231,853 $5,621,961 $5,094,812 $4,895,465 $5,146,103 Deduct: Goodwill and intangibles 147,889 144,184 136,397 127,215 121,879 Tangible common equity $6,083,964 $5,477,777 $4,958,415 $4,768,250 $5,024,224 Total assets $47,234,002 $48,887,493 $48,448,921 $47,268,695 $47,106,931 Deduct: Goodwill and intangibles 147,889 144,184 136,397 127,215 121,879 Tangible assets $47,086,113 $48,743,309 $48,312,524 $47,141,480 $46,985,052 Equity to assets ratio 13.2% 11.5% 10.5% 10.4% 10.9% Tangible common equity to tangible assets 12.9% 11.2% 10.3% 10.1% 10.7% Total equity $6,231,853 $5,621,961 $5,094,812 $4,895,465 $5,146,103 Add: Adjustment due to CECL capital relief (c) 1,805,720 1,832,099 1,842,536 1,769,430 1,669,466 Deduct: Goodwill and other intangible assets, net of DTL 163,359 163,659 159,907 154,943 153,712 Deduct: Accumulated other comprehensive income, net (41,818) (50,566) (56,882) (63,705) (63,655) Tier 1 common capital $7,916,032 $7,340,967 $6,834,323 $6,573,657 $6,725,512 Risk weighted assets (a)(c) $47,995,845 $50,424,476 $49,882,540 $48,997,902 $48,829,941 Common Equity Tier 1 capital ratio (b)(c) 16.5% 14.6% 13.7% 13.4% 13.8%

Our purpose is to help people and business prosper. Our culture is based on believing that everything we do should be: Thank You
