Attached files
| file | filename |
|---|---|
| EX-99.1 - EX-99.1 - Matson, Inc. | matx-20210427xex99d1.htm |
| 8-K - 8-K - Matson, Inc. | matx-20210427x8k.htm |
Exhibit 99.2
| 1 First Quarter 2021 Earnings Conference Call First Quarter 2021 Earnings Conference Call April 27, 2021 |

| 2 First Quarter 2021 Earnings Conference Call Forward-Looking Statements Statements made during this presentation that set forth expectations, predictions, projections or are about future events are based on facts and situations that are known to us as of April 27, 2021. We believe that our expectations and assumptions are reasonable. Actual results may differ materially, due to risks and uncertainties, such as those described on pages 12-21 of our Form 10-K filed on February 26, 2021 and other subsequent filings by Matson with the SEC. Statements made during this presentation are not guarantees of future performance. We do not undertake any obligation to update our forward-looking statements. |
| 3 First Quarter 2021 Earnings Conference Call Opening Remarks • Recap of Matson’s 1Q21 results: – Off to a strong start to 2021 with continued solid performance in Ocean Transportation and Logistics – Ocean Transportation: • China strength – CLX+ voyages and increased capacity in the CLX service • In other core tradelanes, continued to see steady demand for sustenance and home improvement goods with higher year-over-year volumes – Logistics: • Continued elevated goods consumption and inventory restocking in addition to favorable supply and demand fundamentals in our core markets • Matson is focused on reliable services and helping customers during this unique period of supply chain congestion |
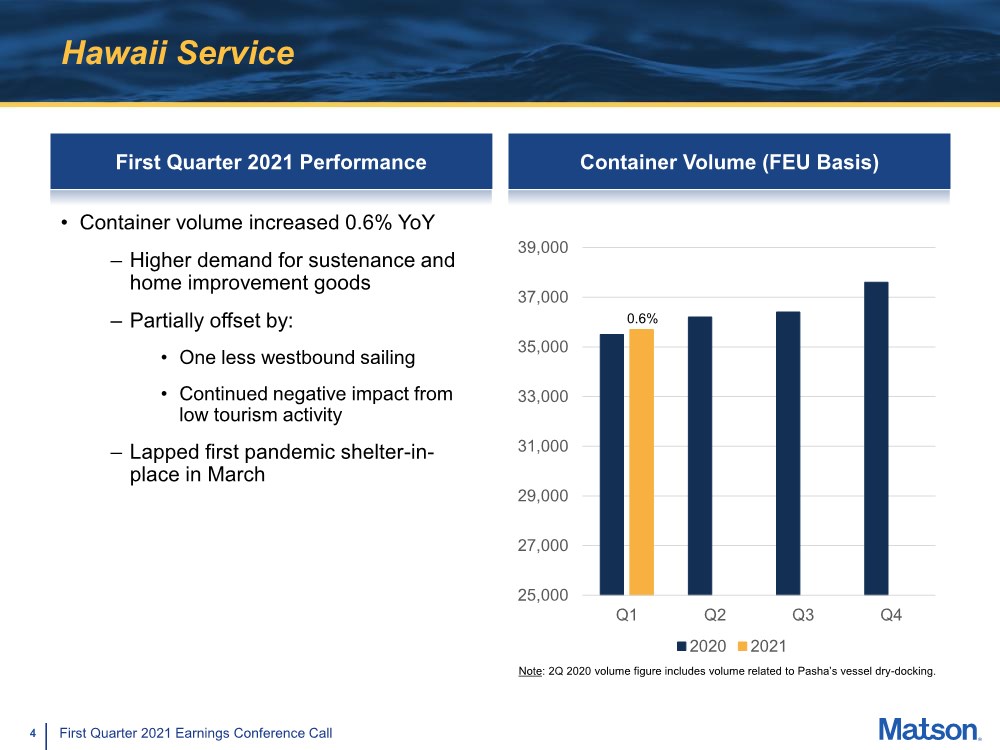
| 4 First Quarter 2021 Earnings Conference Call Hawaii Service First Quarter 2021 Performance • Container volume increased 0.6% YoY – Higher demand for sustenance and home improvement goods – Partially offset by: • One less westbound sailing • Continued negative impact from low tourism activity – Lapped first pandemic shelter-in- place in March Container Volume (FEU Basis) 25,000 27,000 29,000 31,000 33,000 35,000 37,000 39,000 Q1 Q2 Q3 Q4 2020 2021 Note: 2Q 2020 volume figure includes volume related to Pasha’s vessel dry-docking. 0.6% |
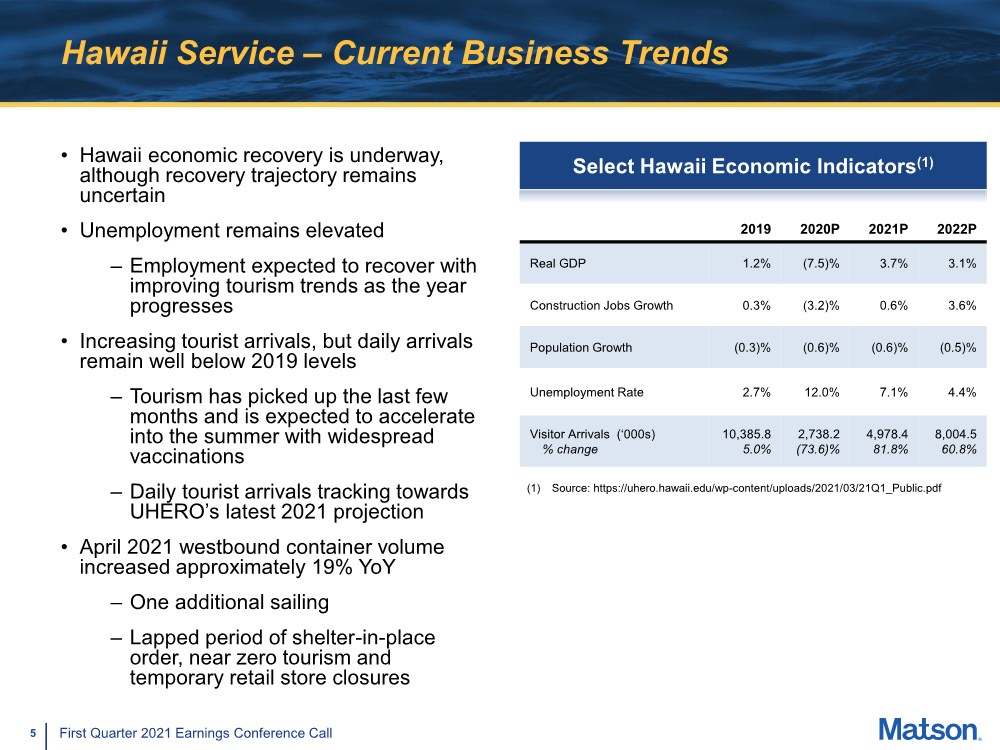
| 5 First Quarter 2021 Earnings Conference Call Hawaii Service – Current Business Trends Select Hawaii Economic Indicators(1) (1) Source: https://uhero.hawaii.edu/wp-content/uploads/2021/03/21Q1_Public.pdf 2019 2020P 2021P 2022P Real GDP 1.2% (7.5)% 3.7% 3.1% Construction Jobs Growth 0.3% (3.2)% 0.6% 3.6% Population Growth (0.3)% (0.6)% (0.6)% (0.5)% Unemployment Rate 2.7% 12.0% 7.1% 4.4% Visitor Arrivals (‘000s) % change 10,385.8 5.0% 2,738.2 (73.6)% 4,978.4 81.8% 8,004.5 60.8% • Hawaii economic recovery is underway, although recovery trajectory remains uncertain • Unemployment remains elevated – Employment expected to recover with improving tourism trends as the year progresses • Increasing tourist arrivals, but daily arrivals remain well below 2019 levels – Tourism has picked up the last few months and is expected to accelerate into the summer with widespread vaccinations – Daily tourist arrivals tracking towards UHERO’s latest 2021 projection • April 2021 westbound container volume increased approximately 19% YoY – One additional sailing – Lapped period of shelter-in-place order, near zero tourism and temporary retail store closures |
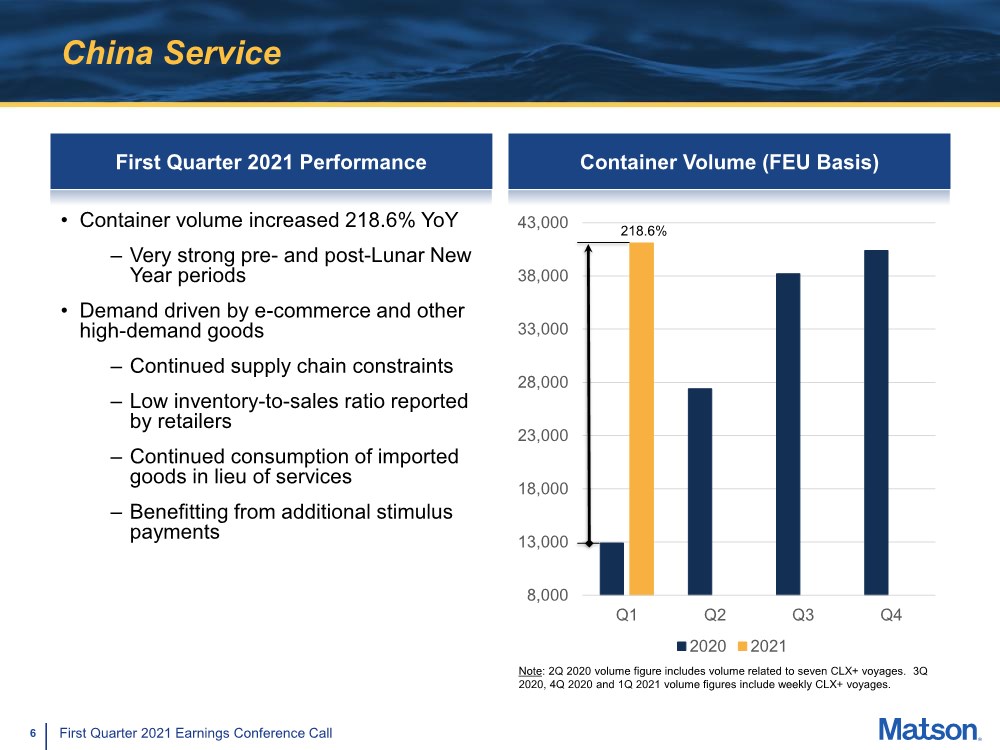
| 6 First Quarter 2021 Earnings Conference Call China Service First Quarter 2021 Performance Container Volume (FEU Basis) 8,000 13,000 18,000 23,000 28,000 33,000 38,000 43,000 Q1 Q2 Q3 Q4 2020 2021 Note: 2Q 2020 volume figure includes volume related to seven CLX+ voyages. 3Q 2020, 4Q 2020 and 1Q 2021 volume figures include weekly CLX+ voyages. 218.6% • Container volume increased 218.6% YoY – Very strong pre- and post-Lunar New Year periods • Demand driven by e-commerce and other high-demand goods – Continued supply chain constraints – Low inventory-to-sales ratio reported by retailers – Continued consumption of imported goods in lieu of services – Benefitting from additional stimulus payments |
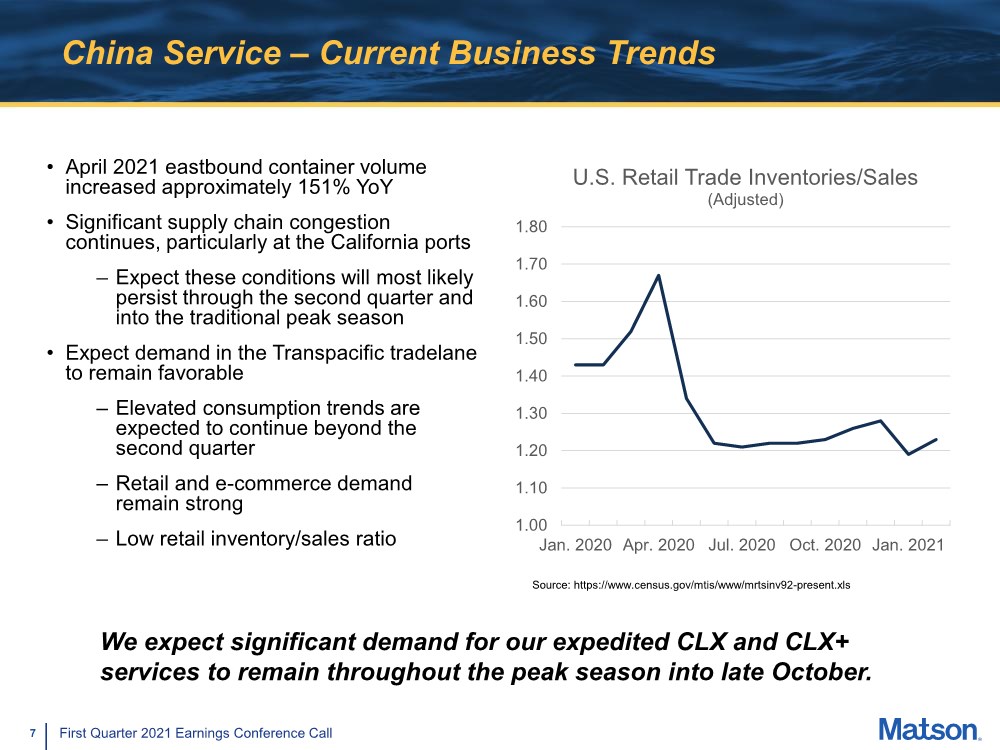
| 7 First Quarter 2021 Earnings Conference Call China Service – Current Business Trends 1.00 1.10 1.20 1.30 1.40 1.50 1.60 1.70 1.80 Jan. 2020 Apr. 2020 Jul. 2020 Oct. 2020 Jan. 2021 U.S. Retail Trade Inventories/Sales (Adjusted) Source: https://www.census.gov/mtis/www/mrtsinv92-present.xls • April 2021 eastbound container volume increased approximately 151% YoY • Significant supply chain congestion continues, particularly at the California ports – Expect these conditions will most likely persist through the second quarter and into the traditional peak season • Expect demand in the Transpacific tradelane to remain favorable – Elevated consumption trends are expected to continue beyond the second quarter – Retail and e-commerce demand remain strong – Low retail inventory/sales ratio We expect significant demand for our expedited CLX and CLX+ services to remain throughout the peak season into late October. |
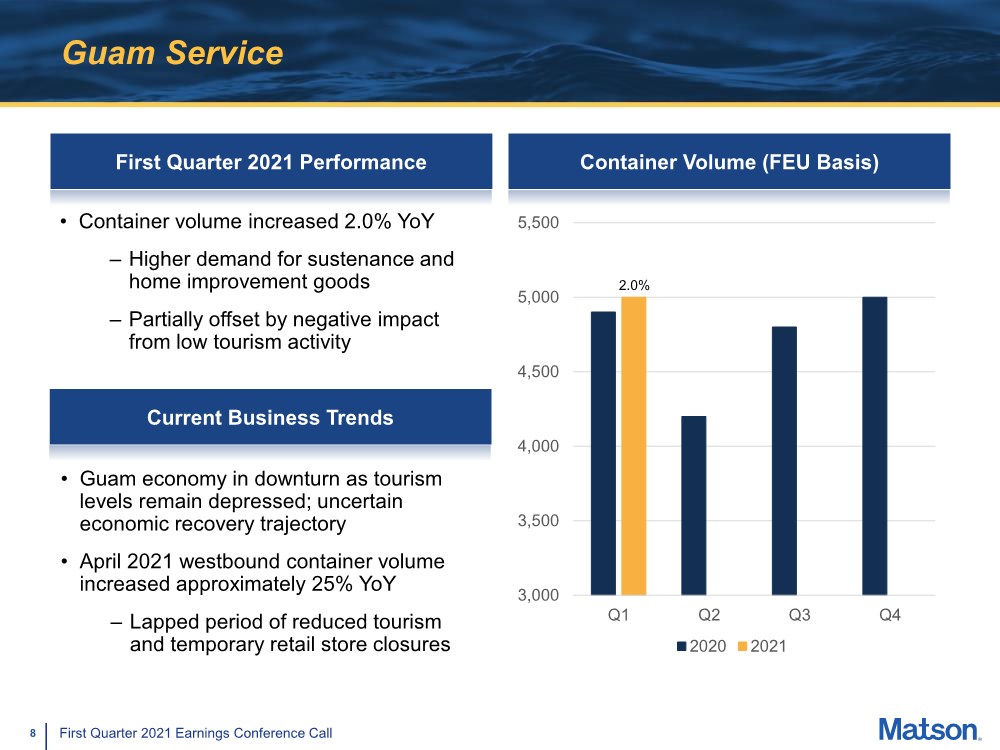
| 8 First Quarter 2021 Earnings Conference Call Guam Service First Quarter 2021 Performance Container Volume (FEU Basis) 3,000 3,500 4,000 4,500 5,000 5,500 Q1 Q2 Q3 Q4 2020 2021 2.0% • Container volume increased 2.0% YoY – Higher demand for sustenance and home improvement goods – Partially offset by negative impact from low tourism activity Current Business Trends • Guam economy in downturn as tourism levels remain depressed; uncertain economic recovery trajectory • April 2021 westbound container volume increased approximately 25% YoY – Lapped period of reduced tourism and temporary retail store closures |
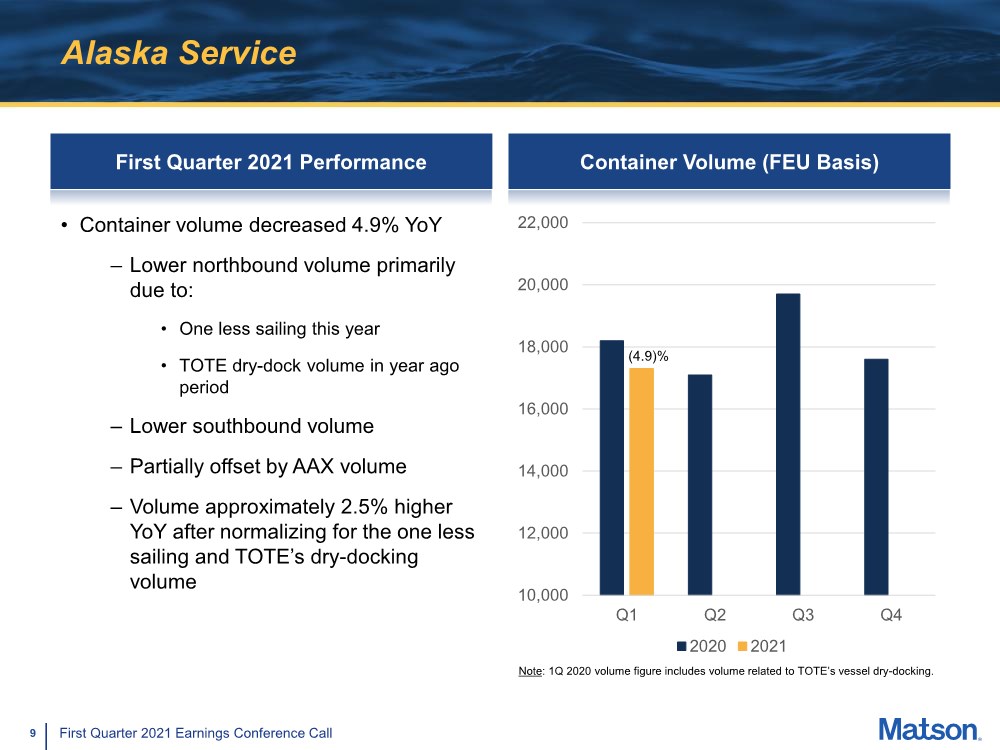
| 9 First Quarter 2021 Earnings Conference Call Alaska Service First Quarter 2021 Performance • Container volume decreased 4.9% YoY – Lower northbound volume primarily due to: • One less sailing this year • TOTE dry-dock volume in year ago period – Lower southbound volume – Partially offset by AAX volume – Volume approximately 2.5% higher YoY after normalizing for the one less sailing and TOTE’s dry-docking volume Container Volume (FEU Basis) 10,000 12,000 14,000 16,000 18,000 20,000 22,000 Q1 Q2 Q3 Q4 2020 2021 (4.9)% Note: 1Q 2020 volume figure includes volume related to TOTE’s vessel dry-docking. |
| 10 First Quarter 2021 Earnings Conference Call Alaska Service – Current Business Trends • Expect the Alaska economy to slowly recover –Unemployment rate slightly higher than national average at 6.6% (February 2021)(1) – Retail industry most impacted by pandemic and is expected to recover slowly – Economic recovery trajectory remains highly uncertain • Tourism to remain challenged in near term – No cruise tourism activity this summer • Modest pick up in oil production and exploration activity with improvement in oil prices • Delayed start to ‘A’ fishing season in 1Q21 due to pandemic challenges, extending into early 2Q21 • April 2021 northbound container volume increased approximately 11% YoY (1) Source: https://labor.alaska.gov/trends/apr21.pdf |
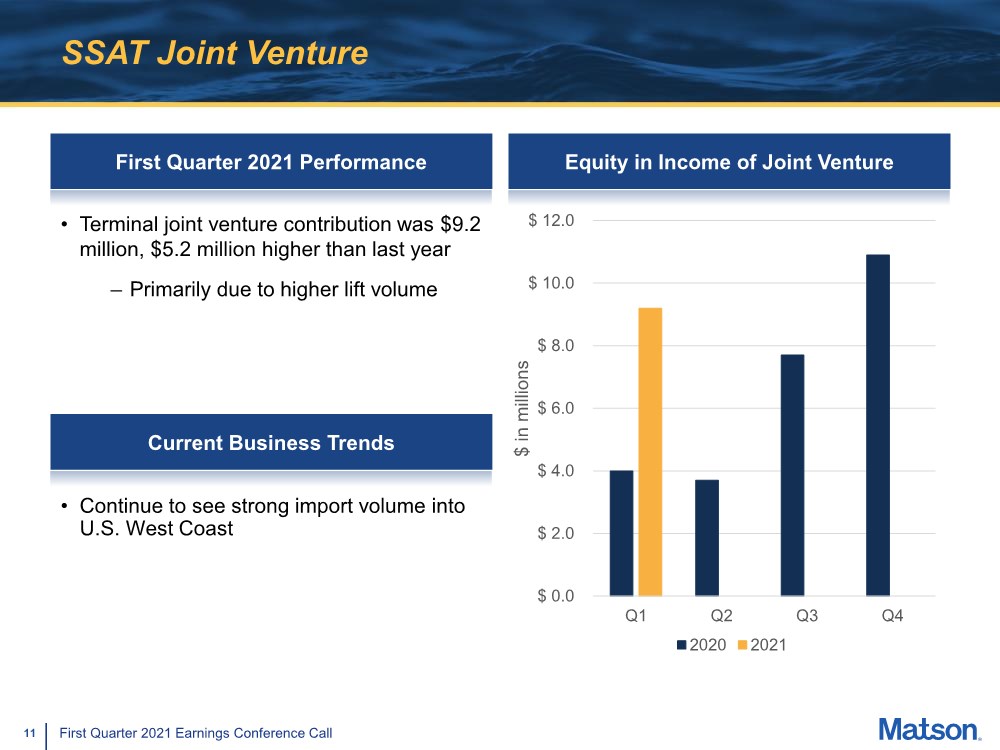
| 11 First Quarter 2021 Earnings Conference Call SSAT Joint Venture First Quarter 2021 Performance Equity in Income of Joint Venture $ 0.0 $ 2.0 $ 4.0 $ 6.0 $ 8.0 $ 10.0 $ 12.0 Q1 Q2 Q3 Q4 $ in millions 2020 2021 Current Business Trends • Terminal joint venture contribution was $9.2 million, $5.2 million higher than last year – Primarily due to higher lift volume • Continue to see strong import volume into U.S. West Coast |
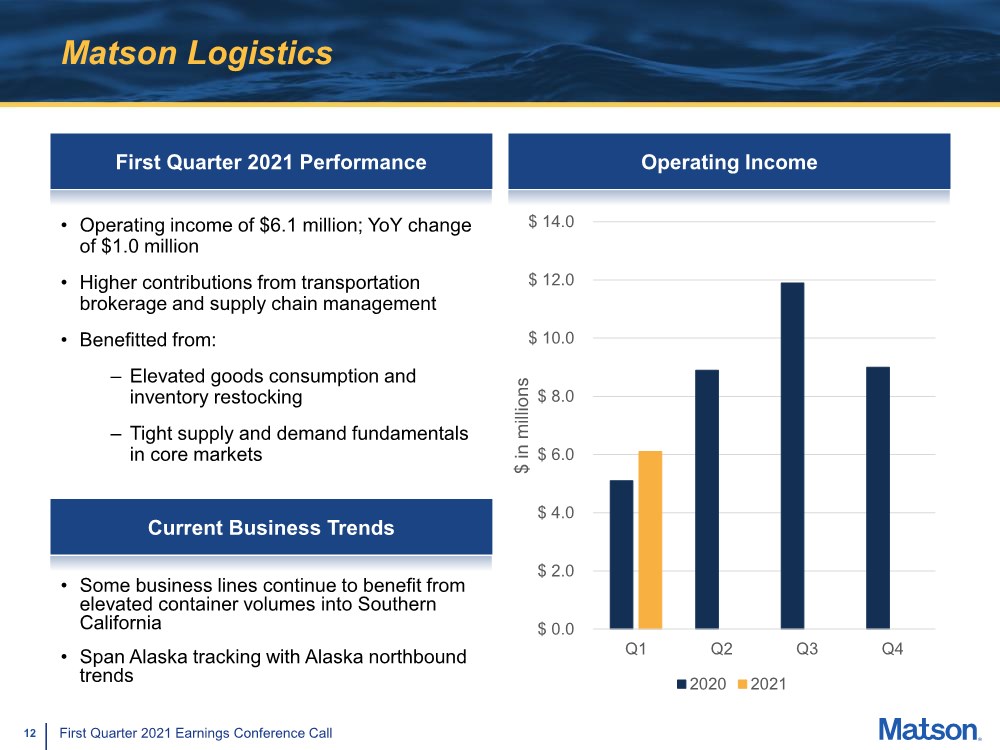
| 12 First Quarter 2021 Earnings Conference Call Matson Logistics First Quarter 2021 Performance Operating Income $ 0.0 $ 2.0 $ 4.0 $ 6.0 $ 8.0 $ 10.0 $ 12.0 $ 14.0 Q1 Q2 Q3 Q4 $ in millions 2020 2021 • Operating income of $6.1 million; YoY change of $1.0 million • Higher contributions from transportation brokerage and supply chain management • Benefitted from: – Elevated goods consumption and inventory restocking – Tight supply and demand fundamentals in core markets Current Business Trends • Some business lines continue to benefit from elevated container volumes into Southern California • Span Alaska tracking with Alaska northbound trends |
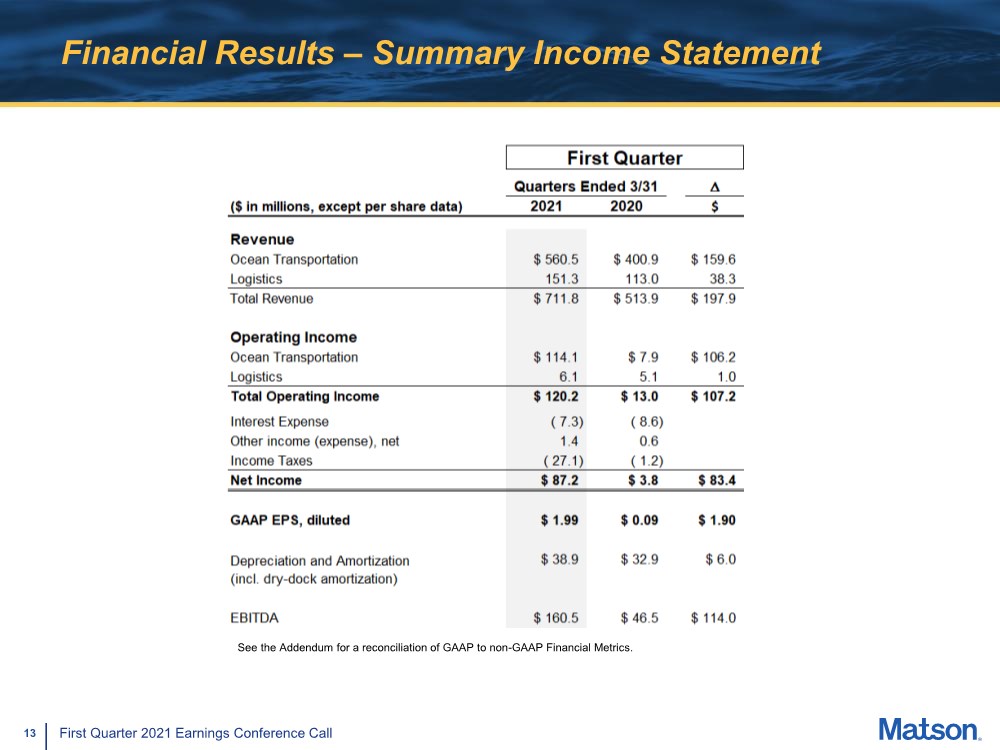
| 13 First Quarter 2021 Earnings Conference Call Financial Results – Summary Income Statement See the Addendum for a reconciliation of GAAP to non-GAAP Financial Metrics. |
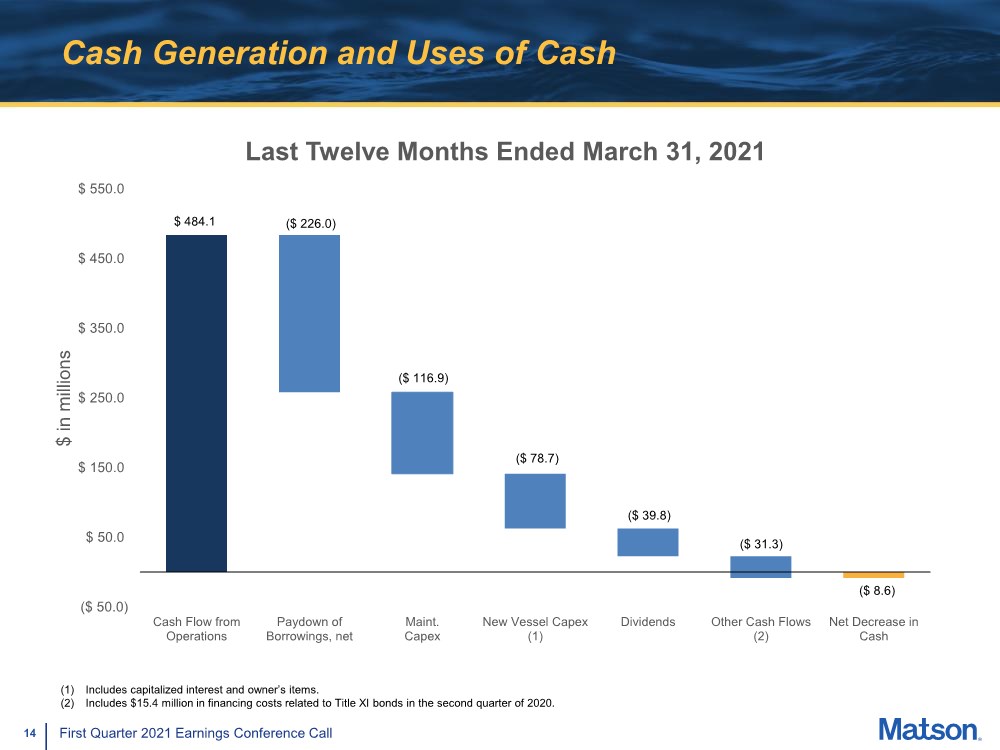
| 14 First Quarter 2021 Earnings Conference Call Cash Generation and Uses of Cash ($ 50.0) $ 50.0 $ 150.0 $ 250.0 $ 350.0 $ 450.0 $ 550.0 Cash Flow from Operations Paydown of Borrowings, net Maint. Capex New Vessel Capex (1) Dividends Other Cash Flows (2) Net Decrease in Cash $ in millions Last Twelve Months Ended March 31, 2021 $ 484.1 ($ 226.0) ($ 116.9) ($ 78.7) ($ 39.8) ($ 8.6) ($ 31.3) (1) Includes capitalized interest and owner’s items. (2) Includes $15.4 million in financing costs related to Title XI bonds in the second quarter of 2020. |
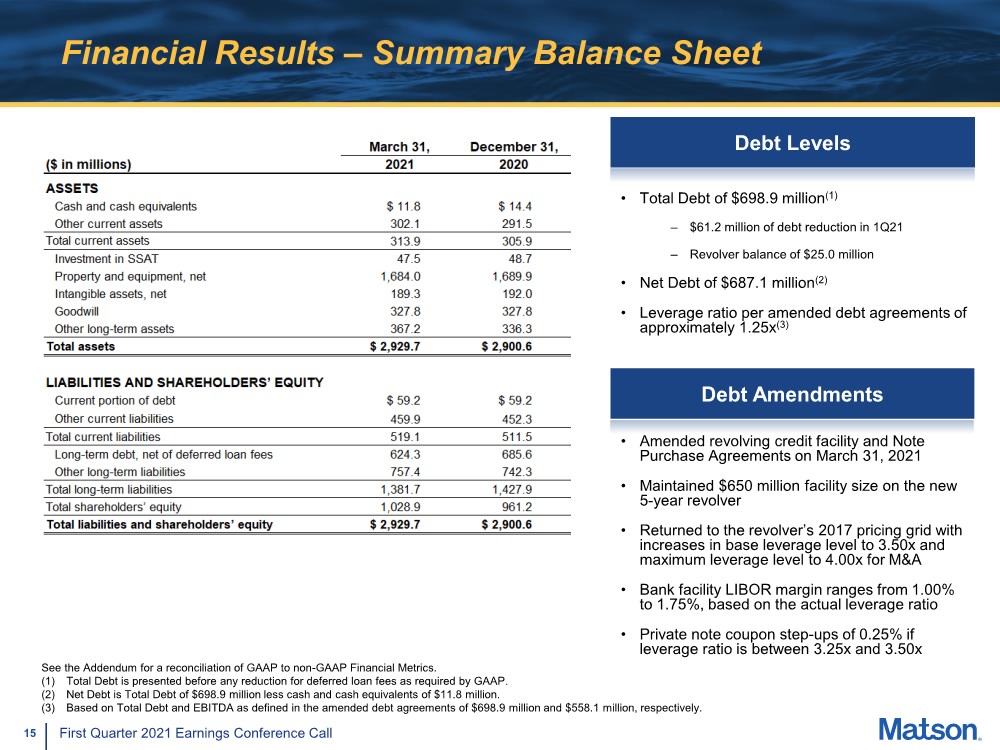
| 15 First Quarter 2021 Earnings Conference Call Financial Results – Summary Balance Sheet • Total Debt of $698.9 million(1) – $61.2 million of debt reduction in 1Q21 – Revolver balance of $25.0 million • Net Debt of $687.1 million(2) • Leverage ratio per amended debt agreements of approximately 1.25x(3) See the Addendum for a reconciliation of GAAP to non-GAAP Financial Metrics. (1) Total Debt is presented before any reduction for deferred loan fees as required by GAAP. (2) Net Debt is Total Debt of $698.9 million less cash and cash equivalents of $11.8 million. (3) Based on Total Debt and EBITDA as defined in the amended debt agreements of $698.9 million and $558.1 million, respectively. Debt Levels Debt Amendments • Amended revolving credit facility and Note Purchase Agreements on March 31, 2021 • Maintained $650 million facility size on the new 5-year revolver • Returned to the revolver’s 2017 pricing grid with increases in base leverage level to 3.50x and maximum leverage level to 4.00x for M&A • Bank facility LIBOR margin ranges from 1.00% to 1.75%, based on the actual leverage ratio • Private note coupon step-ups of 0.25% if leverage ratio is between 3.25x and 3.50x |
| 16 First Quarter 2021 Earnings Conference Call Appendix |
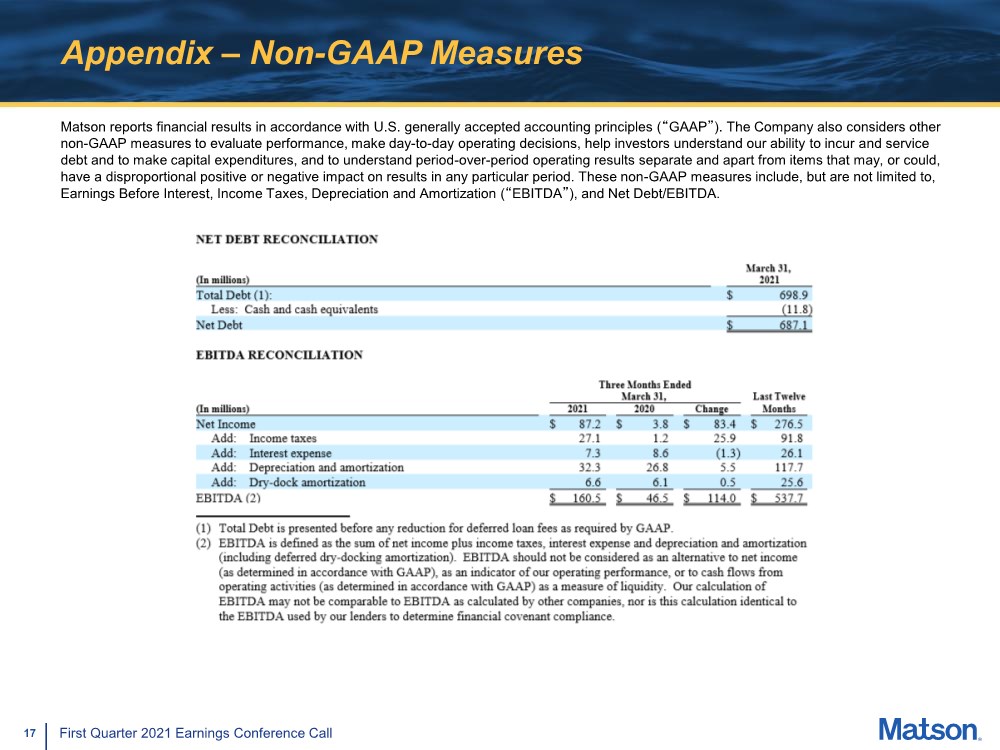
| 17 First Quarter 2021 Earnings Conference Call Appendix – Non-GAAP Measures Matson reports financial results in accordance with U.S. generally accepted accounting principles (“GAAP”). The Company also considers other non-GAAP measures to evaluate performance, make day-to-day operating decisions, help investors understand our ability to incur and service debt and to make capital expenditures, and to understand period-over-period operating results separate and apart from items that may, or could, have a disproportional positive or negative impact on results in any particular period. These non-GAAP measures include, but are not limited to, Earnings Before Interest, Income Taxes, Depreciation and Amortization (“EBITDA”), and Net Debt/EBITDA. |