Attached files
UNITED
STATES
SECURITIES
AND EXCHANGE COMMISSION
Washington,
D.C. 20549
FORM
10-K
x ANNUAL
REPORT PURSUANT TO SECTION 13 OR 15(d) OF
THE
SECURITIES EXCHANGE ACT OF 1934
For the
fiscal year ended December 31, 2009
OR
[ ]
TRANSITION REPORT PURSUANT TO SECTION 13 OR 15(d) OF
THE
SECURITIES EXCHANGE ACT OF 1934
For the
transition period from _______ to _______
Commission
file number 000-00565

(Exact
name of registrant as specified in its charter)
|
Hawaii
|
99-0032630
|
|
|
(State
or other jurisdiction of
|
(I.R.S.
Employer
|
|
|
incorporation
or organization)
|
Identification
No.)
|
822
Bishop Street
Post
Office Box 3440, Honolulu, Hawaii 96801
(Address
of principal executive offices and zip code)
808-525-6611
(Registrant’s
telephone number, including area code)
Securities
registered pursuant to Section 12(b) of the Act:
|
Name
of each exchange
|
|
|
Title of each class
|
on which registered
|
|
Common
Stock, without par value
|
NYSE
|
Securities
registered pursuant to Section 12(g) of the Act:
None
Number
of shares of Common Stock outstanding at February 11, 2010:
41,071,571
Aggregate
market value of Common Stock held by non-affiliates at June 30,
2009:
$937,803,905
Indicate
by check mark if the registrant is a well-known seasoned issuer, as defined in
Rule 405 of the Securities Act. Yes x No o
Indicate
by check mark if the registrant is not required to file reports pursuant to
Section 13 or Section 15(d) of the Act. Yes o No x
Indicate
by check mark whether the registrant (1) has filed all reports required to
be filed by Section 13 or 15(d) of the Securities Exchange Act of 1934 during
the preceding 12 months (or for such shorter period that the registrant was
required to file such reports), and (2) has been subject to such filing
requirements for the past 90 days. Yes x No o
Indicate
by check mark whether the registrant has submitted electronically and posted on
its corporate Web site, if any, every Interactive Data File required
to be submitted and posted pursuant to Rule 405 of Regulation S-T during the
preceding 12 months (or for such shorter period that the registrant was required
to submit and post such files). Yes o No o
Indicate
by check mark if disclosure of delinquent filers pursuant to Item 405 of
Regulation S-K is not contained herein, and will not be contained, to the best
of registrant’s knowledge, in definitive proxy or information statements
incorporated by reference in Part III of this Form 10-K or any
amendment to this Form 10-K. o
Indicate
by check mark whether the registrant is a large accelerated filer, an
accelerated filer, a non-accelerated filer, or a smaller reporting
company. See definition of “large accelerated filer,” “accelerated
filer” and “smaller reporting company” in Rule 12b-2 of the Exchange
Act.
|
Large
accelerated filer x
|
Accelerated filer o
|
|
Non-accelerated
filer o (Do not check if
a smaller reporting company)
|
Smaller
reporting company o
|
Indicate
by check mark whether the registrant is a shell company (as defined in
Rule 12b-2 of the Exchange Act). Yes o No x
Documents
Incorporated By Reference
Portions
of Registrant’s Proxy Statement dated March 11, 2010 (Part III of Form
10-K)
TABLE
OF CONTENTS
PART
I
|
Page
|
||||
|
Items
1 & 2.
|
Business
and
Properties
|
1
|
||
|
A.
|
Transportation
|
1
|
||
|
(1)
|
Freight
Services
|
1
|
||
|
(2)
|
Vessels
|
2
|
||
|
(3)
|
Terminals
|
2
|
||
|
(4)
|
Logistics
and Other Services
|
3
|
||
|
(5)
|
Competition
|
3
|
||
|
(6)
|
Labor
Relations
|
5
|
||
|
(7)
|
Rate
Regulation
|
5
|
||
|
B.
|
Real
Estate
|
6
|
||
|
(1)
|
General
|
6
|
||
|
(2)
|
Planning
and
Zoning
|
7
|
||
|
(3)
|
Residential
Projects
|
7
|
||
|
(4)
|
Commercial
Properties
|
9
|
||
|
C.
|
Agribusiness
|
12
|
||
|
(1)
|
Production
|
12
|
||
|
(2)
|
Marketing
of Sugar and
Coffee
|
12
|
||
|
(3)
|
Sugar
Competition and
Legislation
|
13
|
||
|
(4)
|
Coffee
Competition and
Prices
|
14
|
||
|
(5)
|
Land
Designations and
Water
|
14
|
||
|
D.
|
Employees
and Labor
Relations
|
15
|
||
|
E.
|
Energy
|
16
|
||
|
F.
|
Available
Information
|
17
|
||
|
Item
1A.
|
Risk
Factors
|
17
|
||
|
Item
1B.
|
Unresolved
Staff
Comments
|
26
|
||
|
Item
3.
|
Legal
Proceedings
|
26
|
||
|
Item
4.
|
Submission
of Matters to a Vote of Security
Holders
|
27
|
||
|
Executive
Officers of the
Registrant
|
27
|
|||
PART
II
|
Item
5.
|
Market
for Registrant’s Common Equity, Related Stockholder Matters and Issuer
Purchases of Equity Securities
|
28
|
|
|
Item
6.
|
Selected
Financial
Data
|
30
|
|
|
Item
7.
|
Management’s
Discussion and Analysis of Financial Condition and Results of
Operations
|
33
|
|
Page
|
|||
|
Items
7A.
|
Quantitative
and Qualitative Disclosures About Market Risk
|
55
|
|
|
Item
8.
|
Financial
Statements and Supplementary
Data
|
56
|
|
|
Item
9.
|
Changes
in and Disagreements With Accountants on Accounting and Financial
Disclosure
|
103
|
|
|
Item
9A.
|
Controls
and
Procedures
|
103
|
|
|
A.
|
Disclosure
Controls and
Procedures
|
103
|
|
|
B.
|
Internal
Control over Financial
Reporting
|
103
|
|
|
Item
9B.
|
Other
Information
|
103
|
|
PART
III
|
Item
10.
|
Directors,
Executive Officers and Corporate
Governance
|
104
|
|
|
A.
|
Directors
|
104
|
|
|
B.
|
Executive
Officers
|
104
|
|
|
C.
|
Corporate
Governance
|
105
|
|
|
D.
|
Code
of
Ethics
|
105
|
|
|
Item
11.
|
Executive
Compensation
|
105
|
|
|
Item
12.
|
Security
Ownership of Certain Beneficial Owners and Management and Related
Stockholder Matters
|
105
|
|
|
Item
13.
|
Certain
Relationships and Related Transactions, and Director
Independence
|
105
|
|
|
Item
14.
|
Principal
Accounting Fees and
Services
|
105
|
PART
IV
|
Item
15.
|
Exhibits
and Financial Statement
Schedules
|
106
|
|
|
A.
|
Financial
Statements
|
106
|
|
|
B.
|
Financial
Statement
Schedules
|
106
|
|
|
C.
|
Exhibits
Required by Item 601 of Regulation
S-K
|
106
|
|
|
Signatures
|
115
|
||
|
Consent
of Independent Registered Public Accounting
Firm
|
117
|
||
ALEXANDER
& BALDWIN, INC.
FORM
10-K
Annual
Report for the Fiscal Year
Ended
December 31, 2009
PART
I
ITEMS
1 & 2. BUSINESS AND PROPERTIES
Alexander
& Baldwin, Inc. (“A&B”) is a multi-industry corporation with its primary
operations centered in Hawaii. It was founded in 1870 and
incorporated in 1900. Ocean transportation operations, related
shoreside operations in Hawaii, and intermodal, truck brokerage and logistics
services are conducted by a wholly-owned subsidiary, Matson Navigation Company,
Inc. (“Matson”), and two Matson subsidiaries. Property development
and agribusiness operations are conducted by A&B and certain other
subsidiaries of A&B.
The
business industries of A&B are generally as follows:
|
|
A.
|
Transportation -
carrying freight, primarily between various U.S. Pacific Coast, Hawaii,
Guam, China and other Pacific island ports; arranging domestic and
international rail intermodal service, long-haul and regional highway
brokerage, specialized hauling, flat-bed and project work,
less-than-truckload, expedited/air freight services, and warehousing and
distribution services; and providing terminal, stevedoring and container
equipment maintenance services in
Hawaii.
|
|
|
B.
|
Real Estate - engaging
in real estate development and ownership activities, including planning,
zoning, financing, constructing, purchasing, managing and leasing, selling
and exchanging, and investing in real
property.
|
|
|
C.
|
Agribusiness - growing
sugar cane and coffee in Hawaii; producing bulk raw sugar, specialty
food-grade sugars, molasses, green coffee and roasted coffee; marketing
and distributing green coffee, roasted coffee and specialty food-grade
sugars; generating and selling, to the extent not used in A&B’s
operations, electricity; and providing general trucking services in
Hawaii, including sugar and molasses hauling, and mobile equipment
maintenance and repair services.
|
For
information about the revenue, operating profits and identifiable assets of
A&B’s industry segments for the three years ended December 31, 2009,
see Note 13 (“Industry Segments”) to A&B’s financial statements in
Item 8 of Part II below.
DESCRIPTION
OF BUSINESS AND PROPERTIES
A. Transportation
(1) Freight
Services
Matson’s
Hawaii Service offers containership freight services between the ports of Long
Beach, Oakland, Seattle, and the major ports in Hawaii on the islands of Oahu,
Kauai, Maui and Hawaii. Roll-on/roll-off service is provided between
California and the major ports in Hawaii. Matson is the principal
carrier of ocean cargo between the U.S. Pacific Coast and
Hawaii. Principal westbound cargoes carried by Matson to Hawaii
include dry containers of mixed commodities, refrigerated commodities, building
materials, packaged foods, household goods and automobiles. Principal
eastbound cargoes carried by Matson from Hawaii include automobiles, household
goods, refrigerated containers of fresh pineapple, livestock and dry containers
of mixed commodities. The majority of Matson’s Hawaii Service revenue
is derived from the westbound carriage of containerized freight and
automobiles.
Matson’s
Guam Service provides weekly containership freight services between the U.S.
Pacific Coast and Guam. Additional freight destined to and from the
Commonwealth of the Marianas Islands, the Republic of Palau and the island of
Yap in the Federated States of Micronesia is transferred at Guam to and from
connecting carriers for delivery to and from those locations.
Matson’s
Micronesia Service offers container and conventional freight service between the
U.S. Pacific Coast and the islands of Kwajalein, Ebeye and Majuro in the
Republic of the Marshall Islands and the islands of Pohnpei, Chuuk and Kosrae in
the Federated States of Micronesia. Cargo is transferred at Guam to a
Matson-operated ship that provides consistent, reliable bi-weekly service to and
from those islands. Matson also carries cargo originating in Asia to
these islands by receiving cargo transferred from other carriers in
Guam.
Matson’s
China Service is part of an integrated Hawaii/Guam/China
service. This service employs five Matson containerships in a weekly
service that carries cargo from the U.S. Pacific Coast to Honolulu, then to
Guam. The vessels continue to China, where they are loaded with cargo
to be discharged in Long Beach. These ships also carry cargo destined
to and originating from Guam, the Commonwealth of Northern Marianas, the
Republic of Palau and the Republic of the Marshall Islands.
See “Rate
Regulation” below for a discussion of Matson’s freight rates.
(2) Vessels
Matson’s
fleet consists of 10 containerships, excluding one containership time-chartered
from a third party that serves Micronesia; three combination
container/roll-on/roll-off ships; one roll-on/roll-off barge and two container
barges equipped with cranes that serve the neighbor islands of Hawaii; and one
container barge equipped with cranes that is available for
charter. The 17 Matson-owned vessels in the fleet represent an
investment of approximately $1.2 billion expended over the past 30
years. The majority of vessels in the Matson fleet have been acquired
with the assistance of withdrawals from a Capital Construction Fund (“CCF”)
established under Section 607 of the Merchant Marine Act, 1936, as
amended.
Vessels
owned by Matson are described on page 4.
As a
complement to its fleet, Matson owns approximately 23,500 containers, 14,300
container chassis and generators, 900 auto-frames and miscellaneous other
equipment. Capital expenditures incurred by Matson in 2009 for
vessels, equipment and systems totaled approximately
$10 million.
(3) Terminals
Matson
Terminals, Inc. (“Matson Terminals”), a wholly-owned subsidiary of Matson,
provides container stevedoring, container equipment maintenance and other
terminal services for Matson and other ocean carriers at its 105-acre marine
terminal in Honolulu. Matson Terminals owns and operates seven cranes
at the terminal, which handled approximately 335,400 lifts in 2009 (compared
with 373,900 lifts in 2008). The number of lifts decreased primarily
due to the further softening of the construction and tourism industries in
2009. The terminal can accommodate three vessels at one
time. Matson Terminals’ lease with the State of Hawaii runs through
September 2016. Matson Terminals also provides container stevedoring
and other terminal services to Matson and for other vessels operators on the
islands of Hawaii, Maui and Kauai. Capital expenditures incurred by
Matson Terminals in 2009 for terminals and equipment totaled approximately
$2 million.
SSA
Terminals, LLC (“SSAT”), a joint venture of Matson Ventures, Inc., a
wholly-owned subsidiary of Matson, and SSA Ventures, Inc. (“SSA”), provides
terminal and stevedoring services at U.S. Pacific Coast terminal facilities to
Matson and numerous international carriers, which include Mediterranean Shipping
Company (“MSC”), Hapag Lloyd, OOCL, NYK Line and Maersk. SSAT
operates six terminals: two in Seattle, one of which is operated by SSA
Terminals (Seattle), LLC, a joint venture with China Shipping Terminals (USA)
LLC (“China Shipping”) where ownership is split SSAT 66.7% and China Shipping
33.3%, two in Oakland, one of which is operated by SSA Terminals (Oakland), LLC,
a joint venture with NYK Terminals (Oakland), Inc. (“NYK”) where ownership is
split SSAT 80% and NYK 20%, and two in Long Beach, one of which is operated by
SSA Terminals (Long Beach), LLC, a joint venture with ownership divided equally
between SSAT and Terminal Investment Limited, an affiliate of MSC.
(4) Logistics
and Other Services
Matson
Integrated Logistics, Inc. (“Matson Integrated Logistics”), a wholly-owned
subsidiary of Matson, is a transportation intermediary that provides rail,
highway, air and other third-party logistics services for North American
customers and international ocean carrier customers, including
Matson. Through volume purchases of rail, motor carrier, air and
ocean transportation services, augmented by such services as shipment tracking
and tracing and single-vendor invoicing, Matson Integrated Logistics is able to
reduce transportation costs for its customers. Matson Integrated
Logistics is headquartered in Concord, California, operates six regional
operating centers, has sales offices in over 40 cities nationwide, and operates
through a network of agents throughout the U.S. Mainland.
Matson
Global Distribution Services, Inc. (“Matson Global”) is a wholly-owned
subsidiary of Matson Integrated Logistics that principally provides warehousing
and distribution services. With the acquisition of a regional warehouse company
in Northern California in 2008, Matson Global’s service menu was expanded to
include operating a Foreign Trade Zone. Through Matson Global, Matson
Integrated Logistics provides customers with a full suite of domestic and
international transportation services.
(5) Competition
Matson’s
Hawaii Service and Guam Service have one major containership competitor, Horizon
Lines, Inc., that serves Long Beach, Oakland, Tacoma, Honolulu and
Guam. The Hawaii Service also has one additional liner competitor,
Pasha Hawaii Transport Lines, LLC, that operates a pure car carrier ship,
specializing in the carriage of automobiles and large pieces of rolling stock
such as trucks and buses.
Other
competitors in the Hawaii Service include two common carrier barge services,
unregulated proprietary and contract carriers of bulk cargoes, and air cargo
service providers. Although air freight competition is intense for
time-sensitive and perishable cargoes, inroads by such competition in terms of
cargo volume are limited by the amount of cargo space available in passenger
aircraft and by generally higher air freight rates. Over the years,
additional barge competitors periodically have entered and left the U.S.-Hawaii
trades, mostly from the Pacific Northwest.
Matson
vessels are operated on schedules that make available to shippers and consignees
regular day-of-the-week sailings from the U.S. Pacific Coast and day-of-the-week
arrivals in Hawaii. Matson generally offers an average of three to
four sailings per week, though this amount may be adjusted according to seasonal
demand and market conditions. Matson provides over 160 sailings per
year, which is greater than all of its domestic ocean competitors
combined. One westbound sailing each week continues on to Guam and
China, so the number of eastbound sailings from Hawaii to the U.S. Mainland
averages two to three per week with the potential for additional
sailings. This service is attractive to customers because more
frequent arrivals permit customers to reduce inventory costs. Matson
also competes by offering a more comprehensive service to customers, supported
by the scope of its equipment, its efficiency and experience in handling
containerized cargo, and competitive pricing.
The
carriage of cargo between the U.S. Pacific Coast and Hawaii on foreign-built or
foreign-documented vessels is prohibited by Section 27 of the Merchant
Marine Act, 1920, commonly referred to as the Jones Act. However,
foreign-flag vessels carrying cargo to Hawaii from non-U.S. locations provide
indirect competition for Matson’s Hawaii Service. Asia, Australia,
New Zealand, Mexico and South Pacific islands have direct foreign-flag services
to Hawaii.
MATSON
NAVIGATION COMPANY, INC.
OWNED
FLEET
|
Usable
Cargo Capacity
|
||||||||||||||
|
Maximum
|
Maximum
|
Containers
|
Vehicles
|
Molasses
|
||||||||||
|
Official
|
Year
|
Speed
|
Deadweight
|
Reefer
|
||||||||||
|
Vessel
Name
|
Number
|
Built
|
Length
|
(Knots)
|
(Long
Tons)
|
20’
|
24’
|
40’
|
45’
|
Slots
|
TEUs(1)
|
Autos
|
Trailers
|
Short
Tons
|
|
Diesel-Powered Ships
|
||||||||||||||
|
R.
J. PFEIFFER
|
979814
|
1992
|
713’
6”
|
23.0
|
27,100
|
107
|
--
|
1,069
|
--
|
300
|
2,245
|
--
|
--
|
--
|
|
MOKIHANA
|
655397
|
1983
|
860’
2”
|
23.0
|
29,484
|
146
|
--
|
924
|
--
|
342
|
1,994
|
1,323
|
38
|
--
|
|
MANULANI
|
1168529
|
2005
|
712’
0”
|
23.0
|
29,517
|
4
|
--
|
1,040
|
128
|
284
|
2,372
|
--
|
--
|
--
|
|
MAHIMAHI
|
653424
|
1982
|
860’
2”
|
23.0
|
30,167
|
150
|
--
|
1,494
|
--
|
408
|
3,138
|
--
|
--
|
--
|
|
MANOA
|
651627
|
1982
|
860’
2”
|
23.0
|
30,187
|
150
|
--
|
1,494
|
--
|
408
|
3,138
|
--
|
--
|
3,000
|
|
MANUKAI
|
1141163
|
2003
|
711’
9”
|
23.0
|
29,517
|
4
|
--
|
1,115
|
64
|
284
|
2,378
|
--
|
--
|
--
|
|
MAUNAWILI
|
1153166
|
2004
|
711’
9”
|
23.0
|
29,517
|
4
|
--
|
1,115
|
64
|
284
|
2,378
|
--
|
--
|
--
|
|
MAUNALEI
|
1181627
|
2006
|
681’
1”
|
22.1
|
33,771
|
424
|
--
|
984
|
--
|
328
|
1,992
|
--
|
--
|
--
|
|
Steam-Powered Ships
|
||||||||||||||
|
KAUAI
|
621042
|
1980
|
720’
5-1/2”
|
22.5
|
26,308
|
--
|
202
|
706
|
--
|
270
|
1,654
|
44
|
--
|
2,600
|
|
MAUI
|
591709
|
1978
|
720’
5-1/2”
|
22.5
|
26,623
|
74
|
128
|
708
|
--
|
270
|
1,644
|
--
|
--
|
2,600
|
|
MATSONIA
|
553090
|
1973
|
760’
0”
|
21.5
|
22,501
|
36
|
45
|
789
|
26
|
258
|
1,727
|
450
|
85
|
4,300
|
|
LURLINE
|
549900
|
1973
|
826’
6”
|
21.5
|
22,213
|
6
|
--
|
777
|
38
|
246
|
1,646
|
761
|
55
|
2,100
|
|
LIHUE
|
530137
|
1971
|
787’
8”
|
21.0
|
38,656
|
296
|
--
|
861
|
--
|
188
|
2,018
|
--
|
--
|
--
|
|
Barges
|
||||||||||||||
|
WAIALEALE
(2)
|
978516
|
1991
|
345’
0”
|
--
|
5,621
|
--
|
--
|
--
|
--
|
36
|
--
|
230
|
45
|
--
|
|
MAUNA
KEA (3)
|
933804
|
1988
|
372’
0”
|
--
|
6,837
|
--
|
276
|
24
|
--
|
70
|
379
|
--
|
--
|
--
|
|
MAUNA
LOA (3)
|
676973
|
1984
|
350’
0”
|
--
|
4,658
|
24
|
24
|
132
|
8
|
78
|
335
|
--
|
--
|
2,100
|
|
HALEAKALA
(3)
|
676972
|
1984
|
350’
0”
|
--
|
4,658
|
24
|
24
|
132
|
8
|
78
|
335
|
--
|
--
|
2,100
|
______________________________________________________
|
(1)
|
“Twenty-foot
Equivalent Units” (including trailers). TEU is a standard
measure of cargo volume correlated to the volume of a standard 20-foot dry
cargo container.
|
|
(2)
|
Roll-on/Roll-off
Barge.
|
|
(3)
|
Container
Barge.
|
Matson is
a member of Maritime Cabotage Task Force, which supports the retention of the
Jones Act and other cabotage laws that regulate the transport of goods between
U.S. ports. Repeal of the Jones Act would allow foreign-flag vessel
operators, which do not have to abide by U.S. laws and regulations, to sail
between U.S. ports in direct competition with Matson and other U.S. operators,
which must comply with such laws and regulations. The Task Force
seeks to inform elected officials and the public about the economic, national
security, commercial, safety and environmental benefits of the Jones Act and
similar cabotage laws.
Matson
has operated its China Long Beach Express Service since February
2006. Matson provides weekly containership service between the ports
of Xiamen, Ningbo and Shanghai and the port of Long Beach. Enroute to
China, the ships stop at Honolulu, then Guam, carrying cargo destined to those
areas. From Honolulu, connecting service is provided to other ports
in Hawaii. From Guam, connecting service is provided to other Pacific
islands. The ships then continue from Guam to the ports of Xiamen,
added in 2009, Ningbo and Shanghai, and return directly to Long
Beach. Major competitors in the China Service include well-known
international carriers such as Maersk, COSCO, Evergreen, Hanjin, APL, China
Shipping, Hyundai and NYK Line. Matson competes by offering the
fastest and most reliable freight availability from Shanghai to Long Beach,
providing fixed Sunday arrivals in Long Beach and next-day cargo availability,
offering a dedicated Long Beach terminal providing fast truck turn times, an
off-dock container yard and one-stop intermodal connections, using its newest
and most fuel efficient U.S. flag ships and providing state-of-the-art
technology and world-class customer service. Matson operates offices
in Xiamen, Ningbo and Shanghai, and has contracted with terminal operators in
those locations.
Matson
Integrated Logistics competes with thousands of local, regional, national and
international companies that provide transportation and third-party logistics
services. The industry is highly fragmented and, therefore, competition varies
by geography and areas of service. At a national level, Matson Integrated
Logistics competes most directly with C.H. Robinson Worldwide and the Hub Group.
Competition is differentiated by the depth, scale and scope of customer
relationships; vendor relationships and rates; network capacity; and real-time
visibility into the movement of customers’ goods and other technology solutions.
Additionally, while Matson Integrated Logistics primarily provides surface
transportation brokerage, it also competes to a lesser degree with other forms
of transportation for the movement of cargo, including air
services.
(6) Labor
Relations
The
absence of strikes and the availability of labor through hiring halls are
important to the maintenance of profitable operations by Matson. In
the last 38 years, only once-in 2002, when
International Longshore and Warehouse Union (“ILWU”) workers were locked out for
ten days on the U.S. Pacific Coast-has Matson’s
operations been disrupted significantly by labor disputes. See
“Employees and Labor Relations” below for a description of labor agreements to
which Matson and Matson Terminals are parties and information about certain
unfunded liabilities for multiemployer pension plans to which Matson and Matson
Terminals contribute.
(7) Rate
Regulation
Matson is
subject to the jurisdiction of the Surface Transportation Board with respect to
its domestic rates. A rate in the noncontiguous domestic trade is
presumed reasonable and will not be subject to investigation if the aggregate of
increases and decreases is not more than 7.5 percent above, or more than 10
percent below, the rate in effect one year before the effective date of the
proposed rate, subject to increase or decrease by the percentage change in the
U.S. Producer Price Index (“zone of reasonableness”). Matson raised
its rates in its Hawaii service, effective January 4, 2009, by $120 per
westbound container and $60 per eastbound container and its terminal handling
charges by $175 per westbound container and $90 per eastbound
container. Matson raised its rates in its Guam service, effective
February 1, 2009, by $120 per westbound and eastbound container and its terminal
handling charges by $175 per westbound and eastbound
container. Increases in bunker fuel prices and other energy-related
costs caused Matson to raise its fuel-related surcharge from 15 percent to 16.5
percent in its Hawaii service and from 16.5 percent to 18 percent in its Guam
service, effective May 24, 2009; to 20 percent in its Hawaii service and to 21.5
percent in its Guam service, effective June 21, 2009; to 28 percent in its
Hawaii service and to 29.5 percent in its Guam service, effective July 5,
2009. As a result of subsequent declines in bunker fuel prices,
Matson decreased its fuel-related surcharge to 24 percent in its Hawaii service
and to 25.5 percent in its Guam service, effective October 4,
2009. Matson raised its rates in its Hawaii service, effective
January 3, 2010, by $120 per westbound container and $60 per eastbound container
and its terminal handling charges by $125 per westbound container and $60 per
eastbound container. Matson raised its rates in its Guam service,
effective January 31, 2010, by $120 per westbound and eastbound container
and its West Coast terminal handling charge by $125 for westbound and eastbound
containers. As a result of increasing bunker fuel prices and other
fuel-related costs since its last fuel surcharge adjustment, Matson increased
its fuel-related surcharge to 27.5 percent in its Hawaii service and to 29.0
percent in its Guam service, effective February 7, 2010. Matson’s
China Service is subject to the jurisdiction of the Federal Maritime Commission
(“FMC”). No such zone of reasonableness applies under FMC
regulation.
B. Real
Estate
(1) General
As of
December 31, 2009, A&B and its subsidiaries, including A&B Properties,
Inc., owned approximately 88,925 acres, consisting of approximately 88,475 acres
in Hawaii and approximately 450 acres on the U.S. Mainland, as
follows:
|
Location
|
No. of Acres
|
||
|
Maui
|
67,940
|
||
|
Kauai
|
20,495
|
||
|
Oahu
|
40
|
||
|
TOTAL
HAWAII
|
88,475
|
||
|
California
|
118
|
||
|
Texas
|
164
|
||
|
Georgia
|
63
|
||
|
Utah
|
35
|
||
|
Arizona
|
19
|
||
|
Nevada
|
21
|
||
|
Colorado
|
17
|
||
|
Washington
|
13
|
||
|
TOTAL
MAINLAND
|
450
|
||
As
described more fully in the table below, the bulk of this acreage currently is
used for agricultural, pasture, watershed and conservation
purposes. A portion of these lands is used or planned for development
or other urban uses. An additional 2,915 acres on Maui, Kauai and
Oahu are leased from third parties, and are not included in the
tables. The tables do not include acreage under joint venture
development.
|
Current Use
|
No. of Acres
|
||
|
Hawaii
|
|||
|
Fully
entitled Urban (defined below)
|
725
|
||
|
Agricultural,
pasture and miscellaneous
|
58,550
|
||
|
Watershed/conservation
|
29,200
|
||
|
U.S.
Mainland
|
|||
|
Fully
entitled Urban
|
450
|
||
|
TOTAL
|
88,925
|
||
A&B
and its subsidiaries are actively involved in the entire spectrum of real estate
development and ownership, including planning, zoning, financing, constructing,
purchasing, managing and leasing, selling and exchanging, and investing in real
property.
(2) Planning
and Zoning
The
entitlement process for development of property in Hawaii is complex,
time-consuming and costly, involving numerous State and County regulatory
approvals. For example, conversion of an agriculturally-zoned parcel
to residential zoning usually requires the following approvals:
|
|
·
|
amendment
of the County general plan to reflect the desired residential
use;
|
|
|
·
|
approval
by the State Land Use Commission to reclassify the parcel from the
Agricultural district to the Urban district;
and
|
|
|
·
|
County
approval to rezone the property to the precise residential use
desired.
|
The
entitlement process is complicated by the conditions, restrictions and exactions
that are placed on these approvals, including, among others, the construction of
infrastructure improvements, payment of impact fees, restrictions on the
permitted uses of the land, provision of affordable housing and mandatory fee
sale of portions of the project.
A&B
actively works with regulatory agencies, commissions and legislative bodies at
various levels of government to obtain zoning reclassification of land to its
highest and best use. A&B designates a parcel as “fully entitled”
or “fully zoned” when all of the above-mentioned land use approvals described
above have been obtained.
(3) Residential
Projects
A&B
is pursuing a number of residential projects in Hawaii, including:
Maui:
(a) Wailea. In October
2003, A&B acquired 270 acres of fully-zoned, undeveloped residential and
commercial land at the Wailea Resort on Maui, planned for up to 1,200 homes, for
$67.1 million. A&B was the original developer of the Wailea
Resort, beginning in the 1970s and continuing until A&B sold the Resort to
the Shinwa Golf Group in 1989.
From 2004
to 2007, A&B sold 29 single-family homesites at Wailea’s Golf Vistas
subdivision and four bulk parcels: MF-4 (10.5 acres), MF-15 (9.4
acres), MF-5 (8.4 acres) and MF-9 (30.2 acres), a three-acre business parcel
within the 10.4-acre MF-11 parcel and a 4.6-acre portion of the 15.6-acre B I
& II parcel. The joint venture development of Kai Malu on the
25-acre MF-8 parcel is described below. Construction was completed on
12 single-family lots at MF-11 (7.4 net acres) and nine half-acre estate lots at
MF-19 (6.7 acres) in 2008 and 2009, respectively. The economic
downturn has adversely affected Maui’s resort market in a significant manner, as
reflected in no closings at A&B’s projects in 2009. However, in
anticipation of future market recovery, A&B continues its planning, design
and permitting activities, including the 13-acre MF-7 parcel, planned for 75
multi-family units; the 13-acre SF-8 parcel, to meet affordable housing
requirements for various Wailea projects; and the 13.7-acre MF-10 parcel,
planned for a 65,000-square-foot commercial center, nine single-family lots
fronting the Blue Course, and a 36-unit condominium project.
(b) Kai Malu at
Wailea. In April 2004, A&B entered into a joint venture
with Armstrong Builders, Ltd. for development of the 25-acre MF-8 parcel at
Wailea into 150 duplex units, averaging 1,800 square feet per
unit. Sales commenced in 2006, with 135 units closed as of
December 31, 2008 and no closings in 2009. One unit closed in
February 2010 and six of the remaining 14 units have been leased.
(c) Haliimaile
Subdivision. A&B’s application to rezone 63 acres and
amend the community plan for the development of a 150- to 200-lot residential
subdivision in Haliimaile (Upcountry, Maui) was approved by the Maui County
Council in September 2005. In 2006, onsite infrastructure design work
was submitted to County agencies, but design approval has been deferred until an
acceptable water source can be confirmed. A&B continues to work
with the County and is also evaluating the feasibility of a private water system
to serve this project and other lands in the vicinity.
(d) Kane Street
Development. Aina ‘O Kane is planned to consist of 103
residential condominium units in five four-story buildings, with 20,000
square-feet of ground-floor commercial space, in
Kahului. Construction plans continue to be processed with the County,
but the timing of development will require improved market
conditions.
(e) Kahului Town
Center. The redevelopment plan for the 19-acre Kahului
Shopping Center block reflects the creation of a traditional “town center,”
consisting of approximately 440 residential condominium units, as well as
approximately 240,000 square feet of retail/office space. In 2008,
construction plans for offsite and onsite civil improvements and Phase I
vertical improvements (86,000 square feet of commercial space) were submitted to
the County. In April 2009, condominium public reports were
approved for the initial phase of development. Based on limited
market demand, the timing of this project has been delayed. Work
continues on securing permits and approvals to position this project for
development when market conditions improve.
Kauai:
(f) Kukui`ula. In
April 2002, A&B entered into a joint venture with DMB Communities II
(“DMBC”), an affiliate of DMB Associates, Inc., an Arizona-based developer of
master-planned communities, for the development of Kukui`ula, a 1,000-acre
master planned resort residential community located in Poipu, Kauai, planned for
approximately 1,000 to 1,200 high-end residential units. In 2004,
A&B exercised its option to contribute to the joint venture up to 40 percent
of the project’s future capital requirements. In May 2009, A&B
entered into an amended agreement with DMBC to increase A&B’s ownership
participation in Kukui`ula in exchange for more favorable participation in
rights to future cash and profit distributions, while DMBC’s future
contributions would be limited to $35 million. Construction is now
complete on the project’s two major roadways, subdivision improvements for
parcels Y (88 lots), M1/M4 (35 lots) and M2/M3 (55 lots). The
first eight holes of the golf course, driving range and putting green are
complete. Construction of 83,200 square feet of the project’s
commercial center, Kukui`ula Village, was completed, and the center opened for
business in August 2009. Construction of the community clubhouse, spa
and golf clubhouse commenced in September 2008, October 2009 and
December 2009, respectively. The entire golf course and all of the
other aforementioned amenities are expected to be substantially completed by the
end of 2010. A total of 80 lots had closed as of December 31, 2008,
with no closings in 2009. Marketing efforts are expected to resume in
the second half of 2010 as the project’s amenities near
completion. The capital contributed by A&B to the joint venture,
including the value of land initially contributed, was $138 million as of
December 31, 2009. DMBC has contributed $161 million, which includes
$15 million of its amended $35 million future contribution limit.
(g) Port Allen. This
project covers 17 acres in Port Allen, and is planned for 75 condominium units
and 58 single-family homes. In 2008, construction was completed on
the 58 homes, and the remaining two homes closed in 2009. The
construction of the condominium units has been deferred pending market
recovery.
Oahu:
(h) Keola La`i. In 2008,
A&B completed construction of a 42-story condominium project near downtown
Honolulu, consisting of 352 residential units, averaging 970 square feet, and
four commercial units, with 337 residential units and two commercial units
closed to date. Sales activity slowed in 2009 due to market
conditions, with seven closings in 2009. One unit closed in February 2010 and 11
of the remaining 14 units have been leased.
(i) Waiawa. In August
2006, A&B entered into a joint venture agreement with an affiliate of Gentry
Investment Properties, for the development of a 1,000-acre master-planned
primary residential community (530 residential-zoned acres) in Central
Oahu. Although the master development agreement for the Waiawa lands
between Kamehameha Schools and Gentry was terminated, the A&B/Gentry venture
has fee simple ownership of, or the right to acquire at no cost, approximately
58 acres of developable land, in addition to 125 acres of gulch land required
for the major project land bridge and road leading to the
project. The venture and A&B will continue to evaluate their
options for the development of this master-planned community.
Big
Island of Hawaii:
(j) Ka Milo at Mauna
Lani. In April 2004, A&B entered into a joint venture with
Brookfield Homes Hawaii Inc. to acquire and develop a 30.5-acre residential
parcel in the Mauna Lani Resort on the island of Hawaii. The project
was originally planned for 37 single-family units and 100 duplex
townhomes. A total of 27 units were constructed in 2007 and 2008 and,
as of year-end 2009, 20 units had closed, with eight closings in 2009, plus one
closing in February 2010. In December 2009, the project’s
construction loan, with a year-end balance of $15.8 million, matured (for
further information, see Note 12 (“Commitments, Guarantees and Contingencies”)
to A&B’s financial statements in Item 8 of Part II below). The
venture is negotiating with the lender to refinance the loan. Due to
market conditions, the Company recorded an impairment loss of approximately $2.5
million in December 2009. A new business plan is being evaluated by
the venture for the future construction of the remaining units.
U.S.
Mainland:
(k) Santa Barbara
Ranch. In November 2007, A&B entered into a joint venture
with Vintage Communities, LLC, a residential developer headquartered in Newport
Beach, California, for the planned development of a 1,040-acre exclusive
large-lot subdivision, located 12 miles north of the City of Santa
Barbara. In 2008, due to worsening economic conditions, A&B
suspended further investment in the project and recognized a $3.0 million
impairment. A&B continues to evaluate alternatives to maximize
the value of venture assets that served as collateral for the repayment of
A&B’s investment.
(4) Commercial
Properties
An
important source of property revenue is the lease rental income A&B receives
from its portfolio of commercial income properties, consisting of approximately
8.3 million leasable square feet of commercial building space as of December 31,
2009.
(a) Hawaii
Properties
A&B’s
Hawaii commercial properties portfolio consists of retail, office and industrial
properties, comprising approximately 1.3 million square feet of leasable
space as of December 31, 2009. Most of the commercial properties are
located on Maui and Oahu, with smaller holdings in the area of Port Allen, on
Kauai. The average occupancy for the Hawaii portfolio was 95 percent
in 2009, versus 98 percent in 2008. In 2009, A&B sold the
130,600-square-foot Pacific Guardian Tower office building, 85,200-square-foot
Hawaii Business Park industrial facility on Oahu and several leased fee parcels
on Maui. Also in 2009, A&B acquired two properties on Oahu—the
158,400-square-foot Waipio Industrial property and 113,800-square-foot Waipio
Shopping Center. A&B’s joint venture with DMB Kukui’ula Village
LLC completed construction on the 83,600-square-foot Kukui`ula Village
commercial center, which opened for business in August 2009. Joint
venture developments are not included in the following table. A&B
sold the 180,300-square-foot Mililani Shopping Center on Oahu and the 14,800
square-foot building Kele Center on Maui in January and February 2010,
respectively.
The
primary Hawaii commercial properties owned as of year-end 2009 are as
follows:
|
Property
|
Location
|
Type
|
Leasable
Area
(sq. ft.)
|
|
Maui
Mall
|
Kahului,
Maui
|
Retail
|
186,300
|
|
Mililani
Shopping Center
|
Mililani,
Oahu
|
Retail
|
180,300
|
|
Waipio
Industrial
|
Waipahu,
Oahu
|
Industrial
|
158,400
|
|
Kaneohe
Bay Shopping Center
|
Kaneohe,
Oahu
|
Retail
|
127,500
|
|
Waipio
Shopping Center
|
Waipahu,
Oahu
|
Retail
|
113,800
|
|
P&L
Warehouse
|
Kahului,
Maui
|
Industrial
|
104,100
|
|
Port
Allen (4 buildings)
|
Port
Allen, Kauai
|
Industrial/Retail
|
87,600
|
|
Wakea
Business Center II
|
Kahului,
Maui
|
Industrial/Retail
|
61,500
|
|
Kunia
Shopping Center
|
Waipahu,
Oahu
|
Retail
|
60,600
|
|
Kahului
Office Building
|
Kahului,
Maui
|
Office
|
57,700
|
|
Kahului
Office Center
|
Kahului,
Maui
|
Office
|
32,900
|
|
Apex
Building
|
Kahului,
Maui
|
Retail
|
28,100
|
|
Stangenwald
Building
|
Honolulu,
Oahu
|
Office
|
27,100
|
|
Judd
Building
|
Honolulu,
Oahu
|
Office
|
20,200
|
|
Kahului
Shopping Center
|
Kahului,
Maui
|
Retail
|
18,600
|
|
Maui
Clinic Building
|
Kahului,
Maui
|
Office
|
16,600
|
|
Kele
Center
|
Kahului,
Maui
|
Retail
|
14,800
|
|
Lono
Center
|
Kahului,
Maui
|
Office
|
13,100
|
Maui Business Park
II. In 2008, A&B received final zoning approval for 179
acres in Kahului, Maui, representing the second phase of its Maui Business Park
project, from agriculture to light industrial. The zoning change
approval is subject to various conditions, such as providing land for affordable
housing and a wastewater treatment plant. In 2008, design and
engineering of the infrastructure commenced and subdivision applications were
filed with the County. In 2009, the County granted preliminary
approval of several subdivision applications, preliminary design of project
infrastructure was completed, and construction drawings for a water system were
submitted for approvals. Construction plan and subdivision approvals
are anticipated for portions of the project in 2010.
(b) U.S. Mainland
Properties
On the
U.S. Mainland, A&B owns a portfolio of commercial properties, acquired
primarily by way of tax-deferred exchanges under Internal Revenue Code
Section 1031. In 2009, A&B completed the sales of the
120,800 square-foot Southbank II office building in Phoenix, Arizona, the
126,000 square-foot San Jose Avenue Warehouse in City of Industry, California
and the 104,600 square-foot Village at Indian Wells retail center in Indian
Wells, California. In February 2009, A&B transferred Savannah
Logistics Park Building B (324,800 square feet) from development to its leased
portfolio, for a combined 1.0-million-square-foot logistics/industrial facility
in Savannah, Georgia. In 2009, A&B acquired Activity Distribution
Center, a 252,300-square-foot industrial facility in San Diego, California,
Northpoint Properties, a 119,400-square-foot industrial property in Fullerton,
California, and Firestone Avenue Building, a 28,100 square-foot flex-office
building in La Mirada, California. In January 2010, A&B completed
the acquisition of the 216,400-square-foot Meadows on the Parkway Shopping
Center in Boulder, Colorado.
As of
year-end 2009, A&B’s mainland portfolio included 7.0 million square feet of
leasable area, as follows:
|
Property
|
Location
|
Type
|
Leasable
Area
(sq. ft.)
|
|
Heritage
Business Park
|
Dallas,
TX
|
Industrial
|
1,316,400
|
|
Savannah
Logistics Park
|
Savannah,
GA
|
Industrial
|
1,035,700
|
|
Ontario
Distribution Center
|
Ontario,
CA
|
Industrial
|
898,400
|
|
Midstate
99 Distribution Center
|
Visalia,
CA
|
Industrial
|
790,400
|
|
Sparks
Business Center
|
Sparks,
NV
|
Industrial
|
396,100
|
|
Republic
Distribution Center
|
Pasadena,
TX
|
Industrial
|
312,500
|
|
Activity
Distribution Center
|
San
Diego, CA
|
Industrial
|
252,300
|
|
Centennial
Plaza
|
Salt
Lake City, UT
|
Industrial
|
244,000
|
|
Valley
Freeway Corporate Park
|
Kent,
WA
|
Industrial
|
228,200
|
|
1800
and 1820 Preston Park
|
Plano,
TX
|
Office
|
198,600
|
|
Ninigret
Office Park X and XI
|
Salt
Lake City, UT
|
Office
|
185,200
|
|
San
Pedro Plaza
|
San
Antonio, TX
|
Office/Retail
|
171,900
|
|
2868
Prospect Park
|
Sacramento,
CA
|
Office
|
162,900
|
|
Concorde
Commerce Center
|
Phoenix,
AZ
|
Office
|
140,700
|
|
Arbor
Park Shopping Center
|
San
Antonio, TX
|
Retail
|
139,500
|
|
Deer
Valley Financial Center
|
Phoenix,
AZ
|
Office
|
126,600
|
|
Northpoint
Properties
|
Fullerton,
CA
|
Industrial
|
119,400
|
|
Broadlands
Marketplace
|
Broomfield,
CO
|
Retail
|
103,900
|
|
2890
Gateway Oaks
|
Sacramento,
CA
|
Office
|
58,700
|
|
Wilshire
Center
|
Greeley,
CO
|
Retail
|
46,500
|
|
Royal
MacArthur Center
|
Dallas,
TX
|
Retail
|
44,000
|
|
Firestone
Avenue Building
|
La
Mirada, CA
|
Office
|
28,100
|
A&B’s
mainland commercial properties’ occupancy rate decreased to 85 percent in 2009,
compared to 95 percent in 2008, reflecting the difficult leasing environment in
certain mainland markets as well as the placement of Savannah Logistics Park
Building B into service in March 2009.
A&B’s
mainland joint venture commercial developments are summarized
below:
(i)Crossroads
Plaza. In June 2004, A&B entered into a joint venture with
Intertex Hasley, LLC, for the development of a 56,000-square-foot mixed-use
neighborhood retail center on 6.5 acres in Valencia, California. The
property was acquired in August 2004. The sale of a pad site building
closed in 2007, and construction of the center was completed in
2008. The property was 85 percent occupied as of year-end
2009.
(ii)Centre Pointe
Marketplace. In April 2005, A&B entered into a joint
venture with Intertex Centre Pointe Marketplace, LLC for the development of a
105,700-square-foot retail center on a 10.2-acre parcel in Valencia,
California. The sale of several pad site buildings closed in 2007.
Vertical construction was substantially completed in 2008, with five of seven
buildings closed in 2008, one building closed in 2009, and the remaining
building expected to be sold in 2010.
(iii)Bridgeport
Marketplace. In July 2005, A&B entered into a joint
venture with Intertex Bridgeport Marketplace, LLC for the development of a
27.8-acre parcel in Valencia, California. The parcel was subdivided
into a 5-acre parcel for a public park, a 7.3-acre parcel sold to a church in
2007, and a 15.5-acre parcel for the development of a 127,000-square-foot retail
center. Construction of the center was completed in 2009 and is 95 percent
leased.
(iv)Bakersfield. In
November 2006, A&B entered into a joint venture with Intertex P&G
Retail, LLC, for the planned development of a 575,000-square-foot retail center
on a 57.3-acre commercial parcel in Bakersfield, California. The
parcel was acquired in November 2006. Development plans remain on
hold due to current economic conditions.
(v)Palmdale Trade & Commerce
Center. In December 2007, A&B entered into a joint venture
with Intertex Palmdale Trade & Commerce Center LLC, for the planned
development of a 315,000-square-foot mixed-use commercial office and light
industrial condominium complex on 18.2 acres in Palmdale, California, located 60
miles northeast of Los Angeles and 25 miles northeast of
Valencia. The parcel was contributed to the venture in
2008. Development plans remain on hold due to current market
conditions.
C. Agribusiness
(1) Production
A&B
has been engaged in the production of cane sugar in Hawaii since 1870, and the
production of coffee in Hawaii since 1987. A&B’s current
agribusiness and related operations consist of: (1) a sugar
plantation on the island of Maui, operated by its Hawaiian Commercial &
Sugar Company (“HC&S”) division, (2) a coffee plantation on the island
of Kauai, operated by its Kauai Coffee Company, Inc. (“Kauai Coffee”)
subsidiary, and (3) its Kahului Trucking & Storage, Inc.
(“KT&S”) and Kauai Commercial Company, Incorporated (“KCC”) subsidiaries,
which provide several types of trucking services, including sugar and molasses
hauling on Maui, mobile equipment maintenance and repair services on Maui,
Kauai, and the Big Island, and self-service storage facilities on Maui and
Kauai.
HC&S
is Hawaii’s largest producer of raw sugar, producing approximately 126,800 tons
of raw sugar in 2009, or about 72 percent of the raw sugar produced in Hawaii
for the year (compared with 145,200 tons, or about 75 percent, in
2008). The primary reason for the decline in sugar production was the
unprecedented drought conditions affecting the island of Maui in 2007 and
2008. In 2008, HC&S had the lowest East Maui water deliveries on
record since A&B first began recording deliveries in 1925, and 2007-2008
marked two consecutive years of the lowest rainfall recorded. The
two-year crop harvested in 2009 suffered from lack of water throughout its
lifecycle, which significantly reduced crop yields. HC&S
harvested 15,028 acres of sugar cane in 2009 (compared with 16,961 in
2008). This reduction in harvest acres was designed to improve
future-year yields by increasing the average age of the crop. Yields
averaged 8.4 tons of sugar per acre in 2009 (compared with 8.6 in
2008). As a by-product of sugar production, HC&S also produced
approximately 41,700 tons of molasses in 2009 (compared with 52,200 in
2008).
In 2009,
approximately 34,300 tons of sugar (compared with 27,500 tons in 2008) were
processed by HC&S into specialty food-grade sugars under HC&S’s Maui
Brand®
trademark or repackaged by distributors under their own labels. A
multi-phase expansion of the production facilities for these sugars was
completed in early 2008, with the ramp up of volumes continuing in
2009.
During
2009, Kauai Coffee had approximately 3,000 acres of coffee trees under
cultivation. The 2009 harvest yielded approximately 2.6 million
pounds of green coffee, compared with 3.0 million pounds in 2008. The
preliminary mix of green coffee indicates an average quality distribution for
the crop.
HC&S
and McBryde Sugar Company, Limited (“McBryde”), a subsidiary of A&B and the
parent company of Kauai Coffee, produce electricity for internal use and for
sale to the local electric utility companies. HC&S’s power is
produced by burning bagasse (the residual fiber of the sugar cane plant), by
hydroelectric power generation and, when necessary, by burning fossil
fuels. McBryde produces power solely by hydroelectric
generation. The price for the power sold by HC&S and McBryde is
equal to the utility companies’ “avoided cost” of not producing such power
themselves. In addition, HC&S receives a capacity payment to
provide a guaranteed power generation capacity to the local
utility. See “Energy” below for power production and sales
data.
(2) Marketing
of Sugar and Coffee
Approximately
73 percent of the bulk raw sugar produced by HC&S in 2009 was purchased by
C&H Sugar Company, Inc. (“C&H”). C&H processes the raw
cane sugar at its refinery at Crockett, California and markets the refined
products primarily in the western and central United States.
The
remaining 27 percent of the raw sugar was used by HC&S to produce specialty
food-grade sugars, which are sold by HC&S to food and beverage producers and
to retail stores under its Maui Brand®
label, and to distributors that repackage the sugars under their own
labels. HC&S’s largest food-grade sugar customers are Cumberland
Packing Corp. and Sugar Foods Corporation, which repackage HC&S’s turbinado
sugar for their “Sugar in the Raw” product line.
Hawaiian
Sugar & Transportation Cooperative (“HS&TC”), a sugar grower cooperative
in Hawaii (of which HC&S currently is the only member), has a supply
contract with C&H ending in December 2012. This supply contract,
entered into in October 2009, replaced a prior contract that was due to expire
on December 31, 2009. Pursuant to the supply contract, the
cooperative sells raw sugar to C&H at a price equal to the New York
No. 16 Contract settlement price, less a discount and less costs of sugar
vessel discharge and stevedoring. This price, after deducting the
marketing, operating, distribution, transportation and interest costs of
HS&TC, reflects the gross revenue to the Hawaii sugar growers, including
HC&S. Throughout most of 2009, HS&TC consisted of two
members, HC&S and the Gay & Robinson plantation on Kauai
(“G&R”). In November 2009, G&R ceased operations and its
membership in the cooperative ended concurrently. Various
implications of G&R’s withdrawal from the cooperative are discussed in Item
7 (“Management’s Discussion and Analysis of Financial Condition and Results of
Operation”) of Part II below.
Most of
Kauai Coffee’s crop is being marketed on the U.S. Mainland as green bean
coffee. In addition to the sale of green bean coffee, Kauai Coffee
produces and sells roasted, packaged coffee under the Kauai Coffee®
trademark. Kauai Coffee’s customers include specialty and commodity
brokers, hotels, and large regional roasters.
(3) Sugar
Competition and Legislation
Hawaii
sugar growers have traditionally produced more sugar per acre than most other
major producing areas of the world, but that advantage is offset by Hawaii’s
high labor costs and the distance to the U.S. Mainland
market. Hawaiian refined sugar is marketed primarily west of
Chicago. This is also the largest beet sugar growing and processing
area and, as a result, the only market area in the United States that produces
more sugar than it consumes. Sugar from sugar beets is the greatest
source of competition in the refined sugar market for the Hawaiian sugar
industry.
The U.S.
Congress historically has sought, through legislation, to assure a reliable
domestic supply of sugar at stable and reasonable prices. The current
legislation is the Food Conservation and Energy Act of 2008, which expires on
December 31, 2012 (“2008 Farm Bill”). The two main elements of
U.S. sugar policy are the tariff-rate quota (“TRQ”) import system and the price
support loan program. The TRQ system limits imports from countries
other than Canada and Mexico by allowing only a quota amount to enter the U.S.
after payment of a relatively low tariff. A higher, over-quota tariff
is imposed for imported quantities above the quota amount. Also, a
new but limited sucrose ethanol program was added in 2008, which allows sugar to
be diverted into ethanol when the market is deemed to be
oversupplied.
The 2008
Farm Bill reauthorized the sugar price support loan program, which supports the
U.S. price of sugar by providing for commodity-secured loans to
producers. A loan rate (support price) of 18.25 cents per pound
(“c/lb”) for raw cane sugar is in effect for the 2009 crop. The loan rate
increases to 18.50 c/lb for the 2010 crop and to 18.75 c/lb for the 2012 and
2013 crops (the last year of the bill). The U.S. rates are adjusted by region to
reflect the cost of transportation. The 2009 crop loan rate in Hawaii is 15.88
c/lb.
In 2005,
the U.S. approved a trade pact with Central America and the Dominican Republic,
known as the Central America-Dominican Republic-United States Free Trade
Agreement. In 2006, the first year of the agreement, additional sugar
market access for participating countries amounted to about 1.2 percent of
current U.S. sugar consumption (107,000 metric tons), which will grow to about
1.7 percent (151,000 metric tons) in its fifteenth year.
Implementation
of the North American Free Trade Agreement (NAFTA) began in
1994. This agreement removed most barriers to trade and investment
among the U.S., Canada and Mexico. Under NAFTA, all non-tariff
barriers to agricultural trade between the U.S. and Mexico were
eliminated. In addition, many tariffs were eliminated immediately or
phased out. Starting in 2008, Mexico can ship an unlimited quantity
of sugar duty-free to the U.S. each year.
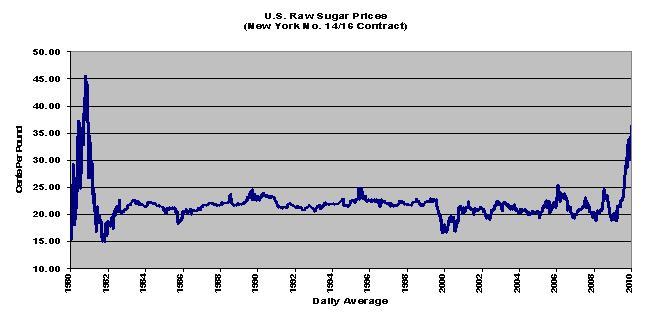
U.S. raw
sugar prices remained relatively stable and flat for over thirty
years. The full implementation of NAFTA in 2008, which unified the
U.S. and Mexican sugar markets, increased price volatility. In 2009,
a tight NAFTA supply/demand outlook and a soaring world raw sugar market
combined to push U.S. raw sugar prices to 29-year highs. A
chronological chart of the average U.S. domestic raw sugar prices, based on the
average daily New York No. 14 Contract settlement price for domestic raw sugar,
is shown below (not adjusted for inflation):
(4) Coffee Competition and
Prices
Kauai
Coffee competes with coffee growers located worldwide, including in Hawaii. The
market for specialty coffee in the United States is highly competitive. Relative
to other Hawaii growers, Kauai Coffee produces a large amount of green coffee
beans each year, with its crop divided among specialty, midrange and commodity
grades. It has been successful at selling its specialty and midgrade coffees at
a premium to world commodity market prices. Kauai Coffee sells its specialty and
midgrade green beans primarily to long-term, repeat customers, though there is
strong competition and pricing and other terms are subject to annual
renegotiations. These grades are also utilized in Kauai Coffee’s wholesale and
direct retail roasted programs. Kauai Coffee also produces commodity-grade green
beans, whose prices are more closely tied to world commodity market
prices.
Kauai
Coffee’s green bean coffee total production volume, volume by grade and unit
costs vary each year depending upon growing and harvesting conditions. The unit
cost per pound impacts the profitability of green bean sales as well as the cost
of goods for Kauai Coffee’s wholesale roasted and retail programs.
(5) Land
Designations and Water
The
HC&S sugar plantation, the largest in Hawaii, consists of approximately
43,300 acres, including a small portion of leased
lands. Approximately 34,700 acres are under cultivation, and the
balance is leased to third parties, is not suitable for cane cultivation, or is
used for plantation purposes such as roads, reservoirs, ditches and plant
sites.
On Kauai,
approximately 3,000 acres are cultivated by Kauai Coffee.
The
Hawaii Legislature, in 2005, passed Important Agricultural Lands (“IAL”)
legislation to fulfill the State constitutional mandate to protect agricultural
lands, promote diversified agriculture, increase the State’s agricultural
self-sufficiency, and assure the availability of agriculturally suitable
lands. In 2008, the Legislature passed a package of incentives, which
is necessary to trigger the IAL system of land designation. In 2009,
A&B received approval from the State Land Use Commission for the designation
of over 27,000 acres on Maui and over 3,700 acres on Kauai as
IAL. These designations were the result of voluntary petitions filed
by A&B.
It is
crucial for HC&S and Kauai Coffee to have access to reliable sources of
water supply and efficient irrigation systems. A&B’s plantations
conserve water by using “drip” irrigation systems that distribute water to the
roots through small holes in plastic tubes. All but a small area of
the cultivated cane land farmed by HC&S is drip irrigated. All of
Kauai Coffee’s fields are drip irrigated.
A&B
owns 16,000 acres of watershed lands in East Maui, which supply a portion of the
irrigation water used by HC&S. A&B also held four water
licenses to another 30,000 acres owned by the State of Hawaii in East Maui,
which over the years have supplied approximately two-thirds of the irrigation
water used by HC&S. The last of these water license agreements
expired in 1986, and all four agreements were then extended as revocable permits
that were renewed annually. In 2001, a request was made to the State
Board of Land and Natural Resources (the “BLNR”) to replace these revocable
permits with a long-term water lease. Pending the conclusion by the
BLNR of this contested case hearing on the request for the long-term lease, the
BLNR has renewed the existing permits on a holdover basis. A&B
also holds rights to an irrigation system in West Maui, which provides
approximately one-sixth of the irrigation water used by HC&S. For
information regarding legal proceedings involving A&B’s irrigation systems,
see “Legal Proceedings” below.
D. Employees
and Labor Relations
As of
December 31, 2009, A&B and its subsidiaries had approximately 2,110
regular full-time employees. About 924 regular full-time employees
were engaged in the agribusiness segment, 1,076 were engaged in the
transportation segment, 44 were engaged in the real estate segment, and the
remaining were in administration. Approximately 49 percent were
covered by collective bargaining agreements with unions.
At
December 31, 2009, the active Matson fleet employed seagoing personnel in
196 billets. Each billet corresponds to a position on a ship that
typically is filled by two or more employees because seagoing personnel rotate
between active sea duty and time ashore. Approximately 24 percent of
Matson’s regular full-time employees and all of the seagoing employees were
covered by collective bargaining agreements.
Historically,
collective bargaining with longshore and seagoing unions has been complex and
difficult. However, Matson and Matson Terminals consider their
relations with those unions, other unions and their non-union employees
generally to be satisfactory.
Matson’s
seagoing employees are represented by six unions, three representing unlicensed
crew members and three representing licensed crew members. Matson
negotiates directly with these unions. Matson’s agreements with the
Seafarer’s International Union, the Sailors Union of the Pacific and the Marine
Firemen’s Union were renewed in mid-2008 through June 2013 without service
interruption. Contracts that Matson has with the American Radio
Association were renewed in mid-2009 through August 15, 2013 after a one-day job
action in the Port of Seattle. Contracts that Matson has with the
Masters, Mates & Pilots (“MM&P”) and the Marine Engineers Beneficial
Association (“MEBA”) for ships built prior to 2003 were renewed in mid-2009
through August 15, 2013. Contracts that Matson has with MM&P and
the MEBA for ships built after 2003 expire on August 15, 2013 and include
provisions for a wage reopener, which was negotiated in mid-2009 to cover the
remaining contract period.
SSAT, the
previously-described joint venture of Matson and SSA, provides stevedoring and
terminal services for Matson vessels calling at U.S. Pacific Coast
ports. Matson, SSA and SSAT are members of the Pacific Maritime
Association (“PMA”) which, on behalf of its members, negotiates collective
bargaining agreements with the ILWU on the U.S. Pacific Coast. A new
six-year PMA/ILWU Master Contract, which covers all Pacific Coast longshore
labor, was negotiated in 2008 without significant disruption and will expire on
July 1, 2014. Matson Terminals provides stevedoring and terminal
services to Matson and other vessel operators calling at Honolulu and on the
islands of Hawaii, Maui and Kauai. Matson Terminals is a member of
the Hawaii Stevedore Industry Committee, which negotiates with the ILWU in
Hawaii on behalf of its members. The ILWU contracts in Hawaii expired
on June 30, 2008 and Matson has signed new six-year agreements with each of
the ILWU units. The new contracts will expire on June 30,
2014.
During
2009, Matson maintained its collective bargaining agreement with ILWU clerical
workers at Honolulu and Oakland, which are in effect through June
2014. The bargaining agreement with ILWU clerical workers in Long
Beach will be negotiated during 2010 as it will expire in June
2010.
During
2009, Matson contributed to multiemployer pension plans for vessel
crews. If Matson were to withdraw from or significantly reduce its
obligation to contribute to one of the plans, Matson would review and evaluate
data, actuarial assumptions, calculations and other factors used in determining
its withdrawal liability, if any. In the event that any third parties
materially disagree with Matson’s determination, Matson would pursue the various
means available to it under federal law for the adjustment or removal of its
withdrawal liability. Matson Terminals participates in a
multiemployer pension plan for its Hawaii ILWU non-clerical
employees. For a discussion of withdrawal liabilities under the
Hawaii longshore and seagoing plans, see Note 9 (“Employee Benefit Plans”)
to A&B’s financial statements in Item 8 of Part II
below.
Bargaining
unit employees of HC&S are covered by two collective bargaining agreements
with the ILWU. The agreements with the HC&S production unit
employees and clerical bargaining unit employees covering approximately 640
workers, expired on January 31, 2010, were extended through February 2010,
and are being renegotiated. The bargaining unit employees at KT&S also are
covered by two collective bargaining agreements with the ILWU. The
bulk sugar employees agreement expires on June 30, 2014, and the agreement
with all other employees expires on March 31, 2010, with renegotiations
expected to begin in spring of 2010. There are two collective
bargaining agreements with KCC employees represented by the
ILWU. These agreements expire on April 30, 2010, with
renegotiations expected to begin in spring of 2010. There is a
collective bargaining agreement with the ILWU for the production unit employees
of Kauai Coffee. This contract was renegotiated and will expire on
January 31, 2011.
E. Energy
Matson
and Matson Terminals purchase residual fuel oil, lubricants, gasoline and diesel
fuel for their operations. Residual fuel oil is by far Matson’s
largest energy-related expense. In 2009, Matson vessels purchased
approximately 1.8 million barrels of residual fuel oil (compared with 2.0
million barrels in 2008).
Residual
fuel oil prices paid by Matson in 2009 started at $44.50 per barrel and ended
the year at $78.62. The low for the year was the price of $35.69 per
barrel in April, the high was the price of $105.55 in
June. Sufficient fuel for Matson’s requirements is expected to be
available in 2010.
As has
been the practice with sugar plantations throughout Hawaii, HC&S uses
bagasse, the residual fiber of the sugar cane plant, as a fuel to generate steam
for the production of most of the electrical power for sugar milling and
irrigation pumping operations. In addition to bagasse, HC&S uses
coal, diesel, fuel oil, and recycled motor oil to generate power during factory
shutdown periods when bagasse is not being produced. HC&S also
generates a limited amount of hydroelectric power. To the extent it
is not used in A&B’s factory and farming operations, HC&S sells
electricity. In 2009, HC&S produced and sold, respectively,
approximately 188,000 MWH and 72,800 MWH of electric power (compared with
211,000 MWH produced and 91,300 MWH sold in 2008). The decrease in power sold
was due to increased power used for irrigation pumps to improve soil moisture
levels and yields, and also to a mechanical failure in the HC&S power plant
that reduced production capacity. HC&S’s use of oil in 2009 of
28,800 barrels was 8 percent greater than the 26,600 barrels used in
2008. The increase was due to additional supplies of low-cost,
recycled motor and vegetable oils. Coal used for power generation was
89,300 short tons, about 7,100 tons less than that used in 2008. Less
coal was required primarily because of the reduced volume of power production
and sales, as mentioned above.
In 2009,
McBryde produced approximately 30,800 MWH of hydroelectric power (compared with
approximately 32,000 MWH in 2008). To the extent it is not used in
A&B’s coffee operations, McBryde sells electricity to Kauai Island Utility
Cooperative. Power sales in 2009 amounted to approximately 22,800 MWH
(compared with 23,700 MWH in 2008).
In the
third quarter of 2008, HC&S was notified that the Hawaii Public Utilities
Commission (“PUC”) had issued a decision that provides for a new methodology of
calculating avoided energy costs, which resulted in a reduction in the avoided
energy cost payable to energy producers, beginning in August
2008. The decision affects A&B’s power sales on Maui, but not on
Kauai. Despite efforts to gain an exemption from or modification to
the decision, HC&S remains subject to the new methodology and received
approximately $4.0 million lower power revenue in 2009 than it would have under
the former methodology. A&B is currently pursuing efforts to
modify the mechanism through which its energy rate is calculated, although the
final outcome of these efforts cannot yet be determined.
F. Available
Information
A&B
files reports with the Securities and Exchange Commission (the
“SEC”). The reports and other information filed
include: annual reports on Form 10-K, quarterly reports on
Form 10-Q, current reports on Form 8-K and other reports and
information filed under the Securities Exchange Act of 1934 (the “Exchange
Act”).
The
public may read and copy any materials A&B files with the SEC at the SEC’s
Public Reference Room at 100 F Street, NE, Washington, DC
20549. The public may obtain information on the operation of the
Public Reference Room by calling the SEC at 1-800-SEC-0330. The SEC
maintains an Internet website that contains reports, proxy and information
statements, and other information regarding A&B and other issuers that file
electronically with the SEC. The address of that website is
www.sec.gov.
A&B
makes available, free of charge on or through its Internet website, A&B’s
annual reports on Form 10-K, quarterly reports on Form 10-Q, current
reports on Form 8-K and amendments to those reports filed or furnished pursuant
to Section 13(a) or 15(d) of the Exchange Act as soon as reasonably practicable
after it electronically files such material with, or furnishes it to, the
SEC. The address of A&B’s Internet website is
www.alexanderbaldwin.com.
ITEM
1A. RISK FACTORS
The
business of A&B and its subsidiaries (collectively, the “Company”) faces
numerous risks, including those set forth below or those described elsewhere in
this Form 10-K or in the Company’s filings with the SEC. The
risks described below are not the only risks that the Company faces, nor are
they necessarily listed in order of significance. Other risks and
uncertainties may also impair its business operations. Any of these
risks may have a material adverse effect on the Company’s business, liquidity,
financial condition, results of operations and cash flows. All
forward-looking statements made by the Company or on the Company’s behalf are
qualified by the risks described below.
Changes
in U.S., global, or regional economic conditions that result in a further
decrease in consumer confidence or market demand for the Company’s services and
products in Hawaii, the U.S. Mainland, Guam or Asia may adversely affect the
Company’s financial position, results of operations, liquidity, or cash
flows.
A
continuation or further weakening of the U.S., Guam, Asian or global economies
may adversely impact the level of freight volumes, freight rates, and real
estate leasing and development activity. Within the U.S., a continuation or
further weakening of economic drivers in Hawaii, which include tourism, military
spending, construction starts, personal income growth, and employment, and/or
the further weakening of consumer confidence, market demand or the economy in
the U.S. Mainland, may further reduce the demand for goods to and from Hawaii
and Asia, travel to Hawaii and domestic transportation of goods, adversely
affecting inland and ocean transportation volumes and/or rates, the sale of
Hawaii real estate to mainland buyers, and the real estate leasing and
development markets. In addition, continued overcapacity in the global ocean
transportation market may adversely affect freight volumes and/or rates in the
Company’s China service. Additionally, a change in the cost of goods or currency
exchange rates may cause these adverse effects as well.
The
Company may face new or increased competition.
The
Company’s transportation segment may face new competition by established or
start-up shipping operators that enter the Company’s markets. The
entry of a new competitor or the addition of ships or capacity by existing
competition on any of the Company’s routes could result in a significant
increase in available shipping capacity that could have an adverse effect on
volumes and/or rates. See also discussion under “Business and
Properties - Transportation - Competition”
above.
For the
Company’s real estate segments, there are numerous other developers, managers
and owners of commercial and residential real estate and undeveloped land that
compete or may compete with the Company for management and leasing revenues,
land for development, properties for acquisition and disposition, and for
tenants and purchasers for properties. Increased vacancies or lack of
development opportunities may lead to a deterioration in results from the
Company’s real estate business.
The
Company’s significant operating agreements and leases could be replaced on less
favorable terms or may not be replaced.
The
significant operating agreements and leases of the Company in its various
businesses expire at various points in the future and may not be replaced or
could be replaced on less favorable terms, thereby adversely affecting future
revenue generation.
The
reduction in availability of mortgage financing and the volatility and reduction
in liquidity in the financial markets may adversely affect the Company’s real
estate business.
During
2008 and 2009, the financial industry continued to experience significant
instability due to, among other things, declining property values and increasing
defaults on loans. This has led to tightened credit requirements, reduced
liquidity and increased credit risk premiums for virtually all borrowers. Fewer
loan products and tighter loan qualifications will make it more difficult for
borrowers to finance the purchase of units in the Company’s residential
projects. The tightening of credit in the commercial markets may adversely
affect the Company’s ability to secure construction and/or other financing for
the Company’s residential and commercial projects, working capital requirements,
and/or investment needs. The absence of financing for buyers of commercial
properties will make it significantly more difficult for the Company to sell
commercial properties and will negatively impact the sales prices and other
terms of such sales. Additionally, continuation or worsening of the liquidity
crisis may impact the Company in other ways, including the credit or solvency of
customers, vendors, or joint venture partners, and the ability of partners to
fund their equity obligations to the joint venture.
A
future downgrade in the Company’s credit rating or disruptions on the credit
markets could restrict its ability to access the debt capital markets and/or
increase the cost of debt.
In June
2009, the Company’s Standard and Poor’s credit rating was changed from A- with a
Stable outlook to BBB+ with a Negative outlook. Further changes in the Company’s
credit ratings may ultimately have an adverse impact on the Company’s ability to
access debt in the private or public market and also may increase its borrowing
costs. If the Company’s credit ratings fall below investment grade, its access
to the debt capital markets may become restricted. Furthermore, the tightening
in the credit markets and the constrained liquidity in the financial
markets resulting from recent turmoil in the financial industry may
adversely affect the Company’s ability to access the debt capital markets or to
renew its committed lines of credit in the future and/or increase the Company’s
cost of capital. Because the Company relies on its ability to draw on its
revolving credit facilities to support its operations, when required, continued
volatility in the credit and financial markets that prevents the Company from
accessing funds (for example, a lender that does not fulfill its lending
obligation), could have an adverse effect on the Company’s financial condition
and cash flows. Additionally, the Company’s credit agreements generally include
an increase in borrowing rates if the Company’s ratings are downgraded, and
renegotiation of the Company’s primary revolving credit line upon its expiration
in 2011 could be affected negatively by ratings downgrades.
Failure
to comply with certain restrictive financial covenants contained in the
Company’s credit facilities could preclude the payment of dividends, impose
restrictions on the Company’s business segments, capital resources or other
activities or otherwise adversely affect the Company.
The
Company’s credit facilities contain certain restrictive financial covenants, the
most restrictive of which include the maintenance of minimum shareholders’
equity levels, a maximum ratio of debt to earnings before interest,
depreciation, amortization, and taxes, and the maintenance of a minimum
unencumbered property investment value. If the Company does not maintain the
required covenants, and that breach of covenants is not cured timely or waived
by the lenders, resulting in default, the Company’s access to credit may be
limited or terminated, dividends may be suspended, and the lenders could declare
any outstanding amounts due and payable.
The
Company is subject to potential insolvency of insurance carriers.
The
Company purchases a variety of insurance products to transfer financial risk.
Accordingly, the Company is subject to the risk that one or more of the insurers
may become insolvent and would be unable to pay one or more claims that may be
made in the future.
An
increase in fuel prices, or changes in the Company’s ability to collect fuel
surcharges, may adversely affect the Company’s profits.
Fuel is a
significant operating expense for the Company’s shipping and agribusiness
operations. The price and supply of fuel is unpredictable and
fluctuates based on events beyond the Company’s control. Increases in
the price of fuel may adversely affect the Company’s results of operations based
on market and competitive conditions. Increases in fuel costs also can lead to
other expense increases, through, for example, increased costs of energy,
petroleum-based raw materials and purchased transportation
services. In the Company’s ocean transportation and logistics
services segments, the Company is able to utilize fuel surcharges to partially
recover increases in fuel expense, although increases in the fuel surcharge may
adversely affect the Company’s competitive position and may not correspond
exactly with the timing of increases in fuel expense. Changes in the Company’s
ability to collect fuel surcharges may adversely affect its results of
operations. Increases in energy costs for the Company’s leased real estate
portfolio are typically recovered from lessees, although the Company’s share of
energy costs increases as a result of lower occupancies and higher operating
cost reimbursements impact the ability to increase underlying rents. Rising fuel
prices may also increase the cost of construction, including delivery costs to
Hawaii, and the cost of materials that are petroleum-based, thus affecting the
Company’s development projects. Finally, rising fuel prices will impact the cost
of producing and transporting sugar.
Noncompliance
with, or changes to, federal, state or local law or regulations, including
passage of climate change legislation or regulation, may adversely affect the
Company’s business.
The
Company is subject to federal, state and local laws and regulations, including
government rate regulations, land use regulations, government administration of
the U.S. sugar program, environmental regulations including those relating to
air quality initiatives at port locations, and cabotage laws. Noncompliance
with, or changes to, the laws and regulations governing the Company’s business
could impose significant additional costs on the Company and adversely affect
the Company’s financial condition and results of operations. For example, if the
Jones Act and the regulations promulgated thereunder were repealed, amended, or
otherwise modified, non-U.S. competitors with significantly lower costs may
consequently enter any of the Jones Act routes or the Company’s business may be
significantly altered, all of which may have an adverse effect on the Company’s
shipping business. In addition, changes in environmental laws impacting the
shipping business, including passage of climate change legislation or other
regulatory initiatives that restrict emissions of greenhouse gasses, may require
costly vessel modifications, the use of higher-priced fuel and changes in
operating practices that may not all be able to be recovered through increased
payments from customers. The real estate segments are subject to
numerous federal, state and local laws and regulations, which, if changed, may
adversely affect the Company’s business. The agribusiness segment is subject to
the federal government’s administration of the U.S. sugar program, such as the
2008 Farm Bill, and the Hawaii Public Utilities Commission’s regulation of
avoided energy cost rates paid to the Company in connection with it sale of
electric power. Further changes to these laws and regulations could adversely
affect the Company. Pending climate change legislation, such as limiting and
reducing greenhouse gas emissions through a “cap and trade” system of allowances
and credits, if enacted, may have an adverse effect on the Company’s
business.
Work
stoppages or other labor disruptions by the unionized employees of the Company
or other companies in related industries may adversely affect the Company’s
operations.
As of
December 31, 2009, the Company had approximately 2,110 regular full-time
employees, of which approximately 49 percent were covered by collective
bargaining agreements with unions. The Company’s transportation, real estate and
agribusiness segments may be adversely affected by actions taken by employees of
the Company or other companies in related industries against efforts by
management to control labor costs, restrain wage increases or modify work
practices. Strikes and disruptions may occur as a result of the failure of the
Company or other companies in its industry to negotiate collective bargaining
agreements with such unions successfully. For example, in its real
estate sales segment, the Company may be unable to complete construction of its
projects if building materials or labor is unavailable due to labor disruptions
in the relevant trade groups.
The
loss of or damage to key vendor and customer relationships may adversely affect
the Company’s business.
The
Company’s business is dependent on its relationships with key vendors, customers
and tenants. The ocean transportation business relies on its relationships with
freight forwarders, large retailers and consumer goods and automobile
manufacturers, as well as other larger customers. Relationships with railroads
and shipping companies are important in the Company’s intermodal business. For
agribusiness, HC&S’s relationship with C&H Sugar Company, Inc. is
critical. The loss of or damage to any of these key relationships may affect the
Company’s business adversely.
Interruption
or failure of the Company’s information technology and communications systems
could impair the Company’s ability to operate and adversely affect its
business.
The
Company is highly dependent on information technology systems. For example, in
the ocean transportation segment, these dependencies include accounting,
billing, disbursement, cargo booking and tracking, vessel scheduling and
stowage, equipment tracking, customer service, banking, payroll and employee
communication systems. All information technology and communication systems are
subject to reliability issues, integration and compatibility concerns, and
security-threatening intrusions. The Company may experience failures
caused by the occurrence of a natural disaster, or other unanticipated problems
at the Company’s facilities. Any failure of the Company’s systems could result
in interruptions in its service or production, reductions in its revenue and
profits and damage to its reputation.
The
Company is susceptible to weather and natural disasters.
The
Company’s transportation operations are vulnerable to disruption as a result of
weather and natural disasters such as bad weather at sea, hurricanes, typhoons,
tsunamis, floods and earthquakes. Such events will interfere with the Company’s
ability to provide on-time scheduled service, resulting in increased expenses
and potential loss of business associated with such events. In
addition, severe weather and natural disasters can result in interference with
the Company’s terminal operations, and may cause serious damage to its vessels,
loss or damage to containers, cargo and other equipment, and loss of life or
physical injury to its employees, all of which could have an adverse effect on
the Company’s business.
For the
real estate segments, the occurrence of natural disasters, such as hurricanes,
earthquakes, tsunamis, floods, fires, tornados and unusually heavy or prolonged
rain, could damage its real estate holdings, resulting in substantial repair or
replacement costs to the extent not covered by insurance, a reduction in
property values, or a loss of revenue, and could have an adverse effect on its
ability to develop, lease and sell properties. The occurrence of natural
disasters could also cause increases in property insurance rates and
deductibles, which could reduce demand for, or increase the cost of owning or
developing, the Company’s properties.
For the
agribusiness segment, drought, greater than normal rainfall, hurricanes,
earthquakes, tsunamis, floods, fires, other natural disasters or agricultural
pestilence may have an adverse effect on the sugar and coffee planting,
harvesting and production, and the agribusiness segment’s facilities, including
dams and reservoirs.
Heightened
security measures, war, actual or threatened terrorist attacks, efforts to
combat terrorism and other acts of violence may adversely impact the Company’s
operations and profitability.
War,
terrorist attacks and other acts of violence may cause consumer confidence and
spending to decrease, or may affect the ability or willingness of tourists to
travel to Hawaii, thereby adversely affecting Hawaii’s economy and the
Company. Additionally, future terrorist attacks could increase the
volatility in the U.S. and worldwide financial markets. Acts of war or terrorism
may be directed at the Company’s shipping operations or real estate holdings, or
may cause the U.S. government to take control of Matson’s vessels for military
operation. Heightened security measures are likely to slow the
movement and increase the cost of freight through U.S. or foreign ports, across
borders or on U.S. or foreign railroads or highways and could adversely affect
the Company’s business and results of operations.
Loss
of the Company’s key personnel could adversely affect its business.
The
Company’s future success will depend, in significant part, upon the continued
services of its key personnel, including its senior management and skilled
employees. The loss of the services of key personnel could adversely affect its
future operating results because of such employee’s experience and knowledge of
its business and customer relationships. If key employees depart, the Company
may have to incur significant costs to replace them, and the Company’s ability
to execute its business model could be impaired if it cannot replace them in a
timely manner. The Company does not expect to maintain key person insurance on
any of its key personnel.
The
Company is involved in joint ventures and is subject to risks associated with
joint venture relationships.
The
Company is involved in joint venture relationships, and may initiate future
joint venture projects. A joint venture involves certain risks such
as:
|
|
•
|
the
Company may not have voting control over the joint
venture;
|
|
|
•
|
the
Company may not be able to maintain good relationships with its venture
partners;
|
|
|
•
|
the
venture partner at any time may have economic or business interests that
are inconsistent with the
Company’s;
|
|
|
•
|
the
venture partner may fail to fund its share of capital for operations and
development activities, or to fulfill its other commitments, including
providing accurate and timely accounting and financial information to the
Company;
|
|
|
•
|
the
joint venture or venture partner could lose key personnel;
and
|
|
|
•
|
the
venture partner could become insolvent, requiring the Company to assume
all risks and capital requirements related to the joint venture
project.
|
In
connection with its real estate joint ventures, the Company is sometimes asked
to guarantee completion of a joint venture’s construction and development of a
project, or to indemnify a third party serving as surety for a joint venture’s
bonds for such completion. If the Company were to become obligated to perform
under such arrangement, the Company may be adversely affected.
The
Company is subject to, and may in the future be subject to, disputes, legal or
other proceedings, or government inquiries or investigations, that could have an
adverse effect on the Company.
The
nature of the Company’s business exposes it to the potential for disputes, legal
or other proceedings, or government inquiries or investigations, relating to
antitrust matters, labor and employment matters, personal injury and property
damage, environmental matters, construction litigation, and other matters, as
discussed in the other risk factors disclosed in this section or in other
Company filings with the SEC. For example, Matson is a common carrier, whose
tariffs, rates, rules and practices in dealing with its customers are governed
by extensive and complex foreign, federal, state and local regulations, which
may be the subject of disputes or administrative and/or judicial proceedings.
These disputes, individually or collectively, could harm the Company’s business
by distracting its management from the operation of its business. If these
disputes develop into proceedings, these proceedings, individually or
collectively, could involve or result in significant expenditures or losses by
the Company, or result in significant changes to Matson’s tariffs, rates, rules
and practices in dealing with its customers, all of which could have an adverse
effect on the Company’s future operating results, including profitability, cash
flows, and financial condition. As a real estate developer, the
Company may face warranty and construction defect claims, as described below in
the “Real Estate” section of this “Risk Factors” item. For a
description of significant legal proceedings involving the Company, including
proceedings involving the Company’s irrigation systems on Maui, and a grand jury
subpoena served on Matson on April 21, 2008 and the status of the subsequently
filed and dismissed civil lawsuits purporting to be class actions in which the
Company and Matson are named as defendants, and which allege violations of the
antitrust laws and seek treble damages and injunctive relief, see “Legal
Proceedings” below.
Earnings
on pension assets, or a change in pension law or key assumptions, may adversely
affect the Company’s financial performance.
The
amount of the Company’s employee pension and postretirement benefit costs and
obligations are calculated on assumptions used in the relevant actuarial
calculations. Adverse changes in any of these assumptions due to economic or
other factors, changes in discount rates, higher health care costs, or lower
actual or expected returns on plan assets, may adversely affect the Company’s
operating results, cash flows, and financial condition. In addition, a change in
federal law, including changes to the Employee Retirement Income Security Act
and Pension Benefit Guaranty Corporation premiums, may adversely affect the
Company’s single-employer and multiemployer pension plans and plan
funding. These factors, as well as a continued decline in the fair
value of pension plan assets, may put upward pressure on the cost of providing
pension and medical benefits and may increase future pension expense and
required funding contributions. Although the Company has actively sought to
control increases in these costs, there can be no assurance that it will be
successful in limiting future cost and expense increases, and continued upward
pressure in costs and expenses could further reduce the profitability of the
Company’s businesses.
The
Company may have exposure under its multiemployer plans in which it participates
that extends beyond its funding obligation with respect to the Company’s
employees.
The
Company contributes to various multiemployer pension plans. In the event of a
partial or complete withdrawal by the Company from any plan that is underfunded,
the Company would be liable for a proportionate share of such plan’s unfunded
vested benefits. Based on the limited information available from plan
administrators, which the Company cannot independently validate, the Company
believes that its portion of the contingent liability in the case of a full
withdrawal or termination may be material to its financial position and results
of operations. In the event that any other contributing employer withdraws from
any plan that is underfunded, and such employer (or any member in its controlled
group) cannot satisfy its obligations under the plan at the time of withdrawal,
then the Company, along with the other remaining contributing employers, would
be liable for its proportionate share of such plan’s unfunded vested benefits.
In addition, if a multiemployer plan fails to satisfy the minimum funding
requirements, the Internal Revenue Service will impose certain penalties and
taxes.
The
Company is required to evaluate its internal controls over financial reporting
under Section 404 of the Sarbanes-Oxley Act of 2002, and any adverse results
from such evaluation could result in a loss of investor confidence in the
Company’s financial reports and have an adverse effect on the Company’s stock
price.
Section
404 of the Sarbanes-Oxley Act requires that publicly reporting companies cause
their managements to perform annual assessments of the effectiveness of their
internal controls over financial reporting. Although the Company has concluded
that its internal controls over financial reporting were effective as of
December 31, 2009, there can be no assurances that the Company will reach
the same conclusion at the end of future years. If the Company is unable to
assert that its internal control over financial reporting is effective, or if
the Company’s auditors are unable to express an opinion on the effectiveness of
the Company’s internal controls, the Company could lose investor confidence in
the accuracy and completeness of its financial reports, which would have an
adverse effect on the Company’s stock price.
TRANSPORTATION
The
Company is subject to risks associated with conducting business in a foreign
shipping market.
The
Company, through Matson’s Hawaii/Guam/China service, is subject to risks
associated with conducting business in a foreign shipping market, which
include:
|
|
•
|
challenges
in operating in a foreign country and doing business and developing
relationships with foreign
companies;
|
|
|
•
|
difficulties
in staffing and managing foreign
operations;
|
|
|
•
|
legal
and regulatory restrictions, including compliance with Foreign Corrupt
Practices Act;
|
|
|
•
|
global
vessel overcapacity that may lead to decreases in volumes and/or shipping
rates;
|
|
|
•
|
competition
with established and new shippers;
|
|
|
•
|
currency
exchange rate fluctuations;
|
|
|
•
|
political
and economic instability;
|
|
|
•
|
protectionist
measures that may affect the Company’s operation of its wholly-owned
foreign enterprise; and
|
|
|
•
|
challenges
caused by cultural differences.
|
Any of
these risks has the potential to adversely affect the Company’s operating
results.
Compliance
with environmental laws and regulations may adversely affect the Company’s
business.
The
Company’s vessel operations are subject to various federal, state and local
environmental laws and regulations, including, but not limited to, the Oil
Pollution Act of 1990, the Comprehensive Environmental Response Compensation
& Liability Act of 1980, the Clean Water Act, the Invasive Species Act and
the Clean Air Act. Continued compliance with these laws and regulations may
result in additional costs and changes in operating procedures that may
adversely affect the Company’s business.
Acquisitions
may have an adverse effect on the Company’s business.
The
Company’s growth strategy includes expansion through
acquisitions. Acquisitions may result in difficulties in assimilating
acquired companies, and may result in the diversion of the Company’s capital and
its management’s attention from other business issues and opportunities. The
Company may not be able to integrate companies that it acquires successfully,
including their personnel, financial systems, distribution, operations and
general operating procedures. The Company may also encounter challenges in
achieving appropriate internal control over financial reporting in connection
with the integration of an acquired company. The Company may pay a premium for
an acquisition, resulting in goodwill that may later be determined to be
impaired, adversely affecting the Company’s financial condition and results of
operations.
The
Company’s logistics services are dependent upon third parties for equipment,
capacity and services essential to operate the Company’s logistics business, and
if the Company fails to secure sufficient third party services, its business
could be adversely affected.
The
Company’s logistics services are dependent upon rail, truck and ocean
transportation services provided by independent third parties. If the Company
cannot secure sufficient transportation equipment, capacity or services from
these third parties at a reasonable rate to meet its customers’ needs and
schedules, customers may seek to have their transportation and logistics needs
met by other third parties on a temporary or permanent basis. As a result, the
Company’s business, consolidated results of operations and financial condition
could be adversely affected.
The
loss of several of the Company’s major customers could have an adverse effect on
the revenue and business of the Company’s logistics business.
The
Company’s logistics business derives a significant portion of its revenues from
its largest customers. For 2009, the Company’s logistics business’s largest ten
customers accounted for approximately 33 percent of the business’s
revenue. A reduction in or termination of the Company’s logistics services
by several of the logistics business’s largest customers could have an adverse
effect on the Company’s revenue and business.
REAL
ESTATE
The
Company is subject to risks associated with real estate construction and
development.
The
Company’s development projects are subject to risks relating to the Company’s
ability to complete its projects on time and on budget. Factors that may result
in a development project exceeding budget or being prevented from completion
include:
|
|
•
|
an
inability of the Company or buyers to secure sufficient financing or
insurance on favorable terms, or at
all;
|
|
|
•
|
construction
delays, defects, or cost overruns, which may increase project development
costs;
|
|
|
•
|
an
increase in commodity or construction costs, including labor
costs;
|
|
|
•
|
the
discovery of hazardous or toxic substances, or other environmental,
culturally-sensitive, or related
issues;
|
|
|
•
|
an
inability to obtain, or significant delay in obtaining, zoning, occupancy
and other required governmental permits and
authorizations;
|
|
|
•
|
difficulty
in complying with local, city, county and state rules and regulations
regarding permitting, zoning, subdivision, utilities, affordable housing,
and water quality as well as federal rules and regulations regarding air
and water quality and protection of endangered species and their
habitats;
|
|
|
•
|
an
inability to have access to sufficient and reliable sources of water or to
secure water service or meters for its
projects;
|
|
|
•
|
an
inability to secure tenants necessary to support the project or maintain
compliance with debt covenants;
|
|
|
•
|
failure
to achieve or sustain anticipated occupancy or sales
levels;
|
|
|
•
|
buyer
defaults, including defaults under executed or binding contracts;
and
|
|
|
•
|
an
inability to sell the Company’s constructed
inventory.
|
Any of
these risks has the potential to adversely affect the Company’s operating
results.
A
decline in leasing rental income could adversely affect the
Company.
The
Company owns a portfolio of commercial income properties. Factors
that may adversely affect the portfolio’s profitability include:
|
|
•
|
a
significant number of the Company’s tenants are unable to meet their
obligations;
|
|
|
•
|
increases
in non-recoverable operating and ownership
costs;
|
|
|
•
|
the
Company is unable to lease space at its properties when the space becomes
available;
|
|
|
•
|
the
rental rates upon a renewal or a new lease are significantly lower than
prior rents or do not increase sufficiently to cover increases in
operating and ownership costs;
|
|
|
•
|
the
providing of lease concessions, such as free or discounted rents and
tenant improvement allowances; and
|
|
|
•
|
the
discovery of hazardous or toxic substances, or other environmental,
culturally-sensitive, or related issues at the
property.
|
Governmental
entities have adopted or may adopt regulatory requirements that may restrict the
Company’s development activity.
The
Company is subject to extensive and complex laws and regulations that affect the
land development process, including laws and regulations related to zoning and
permitted land uses. Government entities have adopted or may approve
regulations or laws that could negatively impact the availability of land and
development opportunities within those areas. For example, in
December 2007, Maui County adopted an ordinance requiring verification of water
source availability and sustainability for all developments prior to submission
of subdivision construction plans. This requirement adds further
process delays and burdens the developer with identifying and developing new
water sources. It is possible that increasingly stringent
requirements will be imposed on developers in the future that could adversely
affect the Company’s ability to develop projects in the affected markets or
could require that the Company satisfy additional administrative and regulatory
requirements, which could delay development progress or increase the development
costs of the Company. Any such delays or costs could have an adverse
effect on the Company’s revenues and earnings.
Real
estate development projects are subject to warranty and construction defect
claims in the ordinary course of business that can be significant.
As a
developer, the Company is subject to warranty and construction defect claims
arising in the ordinary course of business. The amounts payable under these
claims, both in legal fees and remedying any construction defects, can be
significant and exceed the profits made from the project. As a consequence, the
Company may maintain liability insurance, obtain indemnities and certificates of
insurance from contractors generally covering claims related to workmanship and
materials, and create warranty and other reserves for projects based on
historical experience and qualitative risks associated with the type of project
built. Because of the uncertainties inherent to these matters, the Company
cannot provide any assurance that its insurance coverage, contractor
arrangements and reserves will be adequate to address some or all of the
Company’s warranty and construction defect claims in the future. For example,
contractual indemnities may be difficult to enforce, the Company may be
responsible for applicable self-insured retentions, and certain claims may not
be covered by insurance or may exceed applicable coverage limits. Additionally,
the coverage offered and the availability of liability insurance for
construction defects could be limited and/or costly. Accordingly, the Company
cannot provide any assurance that such coverage will be adequate or available at
all, or available at an acceptable cost.
AGRIBUSINESS
The
lack of water for agricultural irrigation could adversely affect the
Company.
It is
crucial for the Company’s agribusiness segment to have access to reliable
sources of water for the irrigation of sugar cane and coffee. As further
described in “Legal Proceedings” below, there are administrative hearing
processes challenging the Company’s ability to divert water from streams in
Maui. In addition, the Company’s access to water is subject to weather patterns
that cannot be reliably predicted. If the Company is not permitted to
divert stream waters for its use or there is insufficient rainfall, it would
have an adverse effect on the Company’s sugar operations, including possible
cessation of operations.
A
decline in raw sugar or coffee prices will adversely affect the Company’s
business.
The
business and results of operations of the Company’s agribusiness segment are
substantially affected by market factors, particularly the domestic prices for
raw cane sugar. These market factors are influenced by a variety of forces,
including prices of competing crops and suppliers, weather conditions, and
United States farm and trade policies. If the price for sugar or coffee were to
decline, the Company’s agribusiness segment would be adversely affected. See
also discussion under “Business and Properties - Agribusiness -
Competition and Sugar Legislation” above.
The
Company is subject to risks associated with raw sugar and coffee
production.
The
Company’s production of raw sugar and coffee is subject to numerous risks that
could adversely affect the volume and quality of sugar or coffee produced,
including:
|
|
•
|
weather
and natural disasters;
|
|
|
•
|
disease;
|
|
|
•
|
weed
control;
|
|
|
•
|
uncontrolled
fires, including arson;
|
|
|
•
|
government
restrictions on farming practices due to cane
burning;
|
|
|
•
|
increases
in costs, including, but not limited to fuel, fertilizer, herbicide, and
drip tubing;
|
|
|
•
|
water
availability (see risk factor above regarding lack of
water);
|
|
|
•
|
equipment
failures in factory or power plant;
|
|
|
•
|
labor,
including labor availability (see risk factor above regarding labor
disruptions) and loss of qualified personnel;
and
|
|
|
•
|
lack
of demand for the Company’s
production.
|
Any of
these risks has the potential to adversely affect the Company’s future
agribusiness operating results.
A
reorganization or termination of the Company’s sugar business could result in
impairment losses and restructuring costs.
If the
Company’s sugar business continues to generate operating losses or negative cash
flows, the Company may reorganize or terminate its sugar operations. The
reorganization or termination of sugar operations may result in an impairment
loss and restructuring costs that would adversely affect the Company’s financial
performance.
The
Company’s power sales contract may not be favorably modified and may adversely
affect the Company’s Agribusiness segment.
As
mentioned under “Business and Properties - Energy” above, HC&S was
notified that the PUC had issued a decision that provides for a new methodology
of calculating avoided energy cost, which resulted in a reduction in the avoided
energy cost payable to energy producers, beginning in August 2008. If no changes
were to occur to the decision or the terms of HC&S’s power sales contract
with MECO, this decision will continue to adversely affect HC&S’s power
revenue and profitability. The Company is currently pursuing efforts to modify
the mechanism through which its energy rate is calculated, although the final
outcome of these efforts cannot yet be determined. The inability to
favorably address this matter may adversely affect the Company’s agribusiness
operations.
The
foregoing should not be construed as an exhaustive list of all factors that
could cause actual results to differ materially from those expressed in
forward-looking statements made by the Company or on its
behalf.
ITEM
1B. UNRESOLVED STAFF COMMENTS
None.
ITEM
3. LEGAL PROCEEDINGS
See
“Business and Properties - Transportation - Rate Regulation” above for a
discussion of rate and other regulatory matters in which Matson is routinely
involved.
A&B
owns 16,000 acres of watershed lands in East Maui that supply a significant
portion of the irrigation water used by HC&S. A&B also held
four water licenses to another 30,000 acres owned by the State of Hawaii in East
Maui, which over the years has supplied approximately two-thirds of the
irrigation water used by HC&S. The last of these water license
agreements expired in 1986, and all four agreements were then extended as
revocable permits that were renewed annually. In 2001, a request was
made to the State Board of Land and Natural Resources (the “BLNR”) to replace
these revocable permits with a long-term water lease. Pending the
conclusion by the BLNR of this contested case hearing on the request for the
long-term lease, the BLNR has renewed the existing permits on a holdover
basis. If the Company is not permitted to divert stream waters from
State lands in East Maui for its use, it would have a material adverse effect on
the Company’s sugar-growing operations.
In
addition, on May 24, 2001, petitions were filed by a third party, requesting
that the Commission on Water Resource Management of the State of Hawaii (“Water
Commission”) amend interim instream flow standards (“IIFS”) in 27 East Maui
streams that feed the Company’s irrigation system. On September 25,
2008, the Water Commission took action on eight of the petitions, resulting in
some quantity of water being returned to the streams rather than being utilized
for irrigation purposes. While the loss of the water as a result of the Water
Commission’s action on the eight petitions may not significantly impair the
Company’s sugar-growing operations, similar losses of water on the remaining 19
streams would have a material adverse effect on the Company’s sugar-growing
operations. In December 2009, the Water Commission conducted deliberations on
the amendment of IIFS for the remaining 19 East Maui streams, deferring action
for at least a three month period. The Company, at this time, is unable to
determine what action the Water Commission will take with respect to all 27
streams.
On
June 25, 2004, two organizations filed with the Water Commission a petition
to amend IIFS for four streams in West Maui to increase the amount of water to
be returned to these streams. The West Maui irrigation system
provides approximately one-sixth of the irrigation water used by
HC&S. The Water Commission’s deliberations on whether to amend
the current IIFS for the West Maui streams are currently ongoing, and an adverse
decision could result in some quantity of water being returned to the streams,
rather than being utilized for irrigation purposes, which may have a material
adverse effect on the Company’s sugar-growing operations. A decision
by the Water Commission is not expected until mid-2010.
On
December 10, 2007, the Shipbuilders Council of America, Inc. and Pasha
Hawaii Transport Lines LLC filed a complaint against the U.S. Department of
Homeland Security, the U.S. Coast Guard and the National Vessel Documentation
Center in the U.S. District Court for the Eastern District of
Virginia. The complaint sought review of a certificate of
documentation with a coastwise endorsement issued by the National Vessel
Documentation Center after concluding that Matson’s C9 vessel Mokihana had not
been rebuilt abroad. Matson intervened in the action. On
December 4, 2009, the court granted summary judgment in favor of the government
and Matson, and dismissed the plaintiffs’ complaint with
prejudice. The time to seek appellate review of this matter has
expired.
On April
21, 2008, Matson was served with a grand jury subpoena from the U.S. District
Court for the Middle District of Florida for documents and information relating
to water carriage in connection with the Department of Justice’s investigation
into the pricing and other competitive practices of carriers operating in the
domestic trades. Matson understands that while the investigation
currently is focused on the Puerto Rico trade, it also includes pricing and
other competitive practices in connection with all domestic trades, including
the Alaska, Hawaii and Guam trades. Matson does not operate vessels
in the Puerto Rico and Alaska trades. It does operate vessels in the
Hawaii and Guam trades. Matson has cooperated, and will continue to
cooperate, fully with the Department of Justice. If the Department of
Justice believes that any violations have occurred on the part of Matson or the
Company, it could seek civil or criminal sanctions, including monetary
fines. The Company is unable to predict, at this time, the outcome or
financial impact, if any, of this investigation.
The
Company and Matson were named as defendants in a consolidated civil lawsuit
purporting to be a class action in the U.S. District Court for the Western
District of Washington in Seattle. The lawsuit alleged violations of
the antitrust laws and also named as a defendant Horizon Lines, Inc., another
domestic shipping carrier operating in the Hawaii and Guam trades. On
August 18, 2009, the court granted the defendants’ motion to dismiss the
complaint. The court granted the plaintiffs leave to amend the
complaint by May 10, 2010 to allege claims consistent with the court’s
order. If the plaintiffs file an amended complaint, the Company and
Matson will continue to vigorously defend themselves in this
lawsuit. The Company is unable to predict, at this time, the outcome
or financial impact, if any, of this lawsuit if an amended complaint is
filed.
A&B
and its subsidiaries are parties to, or may be contingently liable in connection
with, other legal actions arising in the normal conduct of their businesses, the
outcomes of which, in the opinion of management after consultation with counsel,
would not have a material adverse effect on A&B’s results of operations or
financial position.
ITEM
4. SUBMISSION OF MATTERS TO A VOTE OF SECURITY HOLDERS
Not
applicable.
EXECUTIVE
OFFICERS OF THE REGISTRANT
For the
information about executive officers of A&B required to be included in this
Part I, see section B (“Executive Officers”) in Item 10 of
Part III below, which is incorporated herein by reference.
PART
II
ITEM
5. MARKET FOR REGISTRANT’S COMMON EQUITY, RELATED STOCKHOLDER MATTERS AND ISSUER
PURCHASES OF EQUITY SECURITIES
A&B common stock is listed on the
New York Stock Exchange and trades under the symbol “ALEX.” As of
February 12, 2010, there were 3,199 shareholders of record of A&B
common stock. In addition, Cede & Co., which appears as a single record
holder, represents the holdings of thousands of beneficial owners of A&B
common stock.
A summary of daily stock transactions
is listed in the New York Stock Exchange section of major newspapers. Trading
volume averaged 292,309 shares a day in 2009 compared with 441,867 shares a day
in 2008 and 264,577 shares a day in 2007.
The quarterly intra-day high and low
sales prices and end of quarter closing prices, as reported by the New York
Stock Exchange, and cash dividends paid per share of common stock, for 2009 and
2008, were as follows:
|
Dividends
|
Market
Price
|
|||||||||||||||
|
Paid
|
High
|
Low
|
Close
|
|||||||||||||
|
2009
|
||||||||||||||||
|
First
Quarter
|
$
|
0.315
|
$
|
25.79
|
$
|
15.73
|
$
|
19.03
|
||||||||
|
Second
Quarter
|
$
|
0.315
|
$
|
28.31
|
$
|
18.54
|
$
|
23.44
|
||||||||
|
Third
Quarter
|
$
|
0.315
|
$
|
35.43
|
$
|
22.85
|
$
|
32.09
|
||||||||
|
Fourth
Quarter
|
$
|
0.315
|
$
|
35.63
|
$
|
26.47
|
$
|
34.23
|
||||||||
|
2008
|
||||||||||||||||
|
First
Quarter
|
$
|
0.290
|
$
|
51.43
|
$
|
41.00
|
$
|
43.08
|
||||||||
|
Second
Quarter
|
$
|
0.315
|
$
|
53.50
|
$
|
43.46
|
$
|
45.55
|
||||||||
|
Third
Quarter
|
$
|
0.315
|
$
|
48.94
|
$
|
41.07
|
$
|
44.03
|
||||||||
|
Fourth
Quarter
|
$
|
0.315
|
$
|
45.64
|
$
|
20.64
|
$
|
25.06
|
||||||||
Although A&B expects to continue
paying quarterly cash dividends on its common stock, the declaration and payment
of dividends in the future are subject to the discretion of the Board of
Directors and will depend upon A&B’s financial condition, results of
operations, cash requirements and other factors deemed relevant by the Board of
Directors. A&B has paid cash dividends each year since 1903. The most recent
increase in the dividend rate was effective the second quarter of 2008 when the
quarterly dividend rate was increased from 29 cents per share to 31.5 cents per
share. In 2009, dividend payments to shareholders totaled $52 million. The
following dividend schedule for 2010 has been set, subject to final approval by
the Board of Directors:
|
Quarterly Dividend
|
Declaration Date
|
Record Date
|
Payment Date
|
|
First
|
January
28, 2010
|
February
11, 2010
|
March
4, 2010
|
|
Second
|
April
29, 2010
|
May
13, 2010
|
June
3, 2010
|
|
Third
|
June
24, 2010
|
August
5, 2010
|
September
2, 2010
|
|
Fourth
|
October
28, 2010
|
November
11, 2010
|
December
2, 2010
|
Matson
is subject to restrictions on the transfer of net assets to A&B under
certain debt agreements; however, these restrictions have not had any effect on
the Company’s shareholder dividend policy, and the Company does not anticipate
that these restrictions will have any impact in the future. At December 31,
2009, the amount of net assets of Matson that may not be transferred to the
Company was approximately $286 million.
A&B common stock is included in the
Dow Jones U.S. Transportation Average, the Russell 1000 Index, the Russell 3000
Index, the Dow Jones U.S. Composite Average, and the S&P MidCap
400.
The Company has share ownership
guidelines for non-employee Directors. At present, all Directors own A&B
stock, and it is expected that each Director will meet the guidelines within the
specified five-year period. Stock ownership guidelines also are in place for
senior executives of the Company, and all such executives currently meet, or are
expected to meet (within the specified five-year period), the required stock
ownership guidelines.
Securities
authorized for issuance under equity compensation plans as of December 31, 2009,
included:
|
Plan
Category
|
Number
of securities to be issued upon exercise of outstanding options, warrants
and rights
|
Weighted-average
exercise price of outstanding options, warrants and rights
|
Number
of securities remaining available for future issuance under equity
compensation plans (excluding securities reflected in column
(a))
|
|||||||||
|
(a)
|
(b)
|
(c)
|
||||||||||
|
Equity
compensation plans approved by security holders
|
2,445,341 | $ | 36.80 | 826,480 | * | |||||||
|
Equity
compensation plans not approved by security holders
|
-- | -- | -- | |||||||||
|
Total
|
2,445,341 | $ | 36.80 | 826,480 | ||||||||
|
|
*
|
Under
the 2007 Incentive Compensation Plan, 826,480 shares may be issued either
as restricted stock grants, restricted stock units grants, or stock option
grants.
|
On December 10, 2009, A&B’s Board
of Directors authorized A&B to repurchase up to two million shares of its
common stock beginning January 1, 2010. The authorization, which replaced a
previous authorization expiring December 31, 2009, will expire on December 31,
2011.
The Company did not repurchase any of
its common stock in 2009. During 2008, the Company repurchased 1,476,449 shares
of its common stock for approximately $59 million, or an average of $40.33 per
share. During 2007, the Company repurchased 671,728 shares of its common stock
for $33 million, or an average price of $48.62 per share.
ITEM
6. SELECTED FINANCIAL DATA
The following financial data should be
read in conjunction with Item 8, “Financial Statements and Supplementary Data,”
and Item 7, “Management’s Discussion and Analysis of Financial Condition and
Results of Operations” (dollars and shares in millions, except per-share
amounts):
|
2009
|
2008
|
2007
|
2006
|
2005
|
||||||||||||||||
|
Revenue:
|
||||||||||||||||||||
|
Transportation:
|
||||||||||||||||||||
|
Ocean
transportation
|
$ | 888.6 | $ | 1,023.7 | $ | 1,006.9 | $ | 945.8 | $ | 878.3 | ||||||||||
|
Logistics
services
|
320.9 | 436.0 | 433.5 | 444.2 | 431.6 | |||||||||||||||
|
Real
Estate:
|
||||||||||||||||||||
|
Leasing
|
103.2 | 107.8 | 108.5 | 100.6 | 89.7 | |||||||||||||||
|
Sales
|
125.6 | 350.2 | 117.8 | 97.3 | 148.9 | |||||||||||||||
|
Less
amounts reported in discontinued operations1
|
(124.2 | ) | (151.5 | ) | (130.2 | ) | (128.4 | ) | (91.3 | ) | ||||||||||
|
Agribusiness6
|
107.0 | 124.3 | 123.7 | 127.4 | 123.2 | |||||||||||||||
|
Reconciling
Items2
|
(16.3 | ) | (10.7 | ) | (9.2 | ) | (14.2 | ) | (8.4 | ) | ||||||||||
|
Total
revenue
|
$ | 1,404.8 | $ | 1,879.8 | $ | 1,651.0 | $ | 1,572.7 | $ | 1,572.0 | ||||||||||
|
Operating
Profit:
|
||||||||||||||||||||
|
Transportation:
|
||||||||||||||||||||
|
Ocean
transportation3
|
$ | 58.3 | $ | 105.8 | $ | 126.5 | $ | 105.6 | $ | 128.0 | ||||||||||
|
Logistics
services
|
6.7 | 18.5 | 21.8 | 20.8 | 14.4 | |||||||||||||||
|
Real
Estate:
|
||||||||||||||||||||
|
Leasing
|
43.2 | 47.8 | 51.6 | 50.3 | 43.7 | |||||||||||||||
|
Sales3
|
39.1 | 95.6 | 74.4 | 49.7 | 44.1 | |||||||||||||||
|
Less
amounts reported in discontinued operations1
|
(52.3 | ) | (69.3 | ) | (71.2 | ) | (62.6 | ) | (36.1 | ) | ||||||||||
|
Agribusiness6
|
(27.8 | ) | (12.9 | ) | 0.2 | 6.9 | 11.2 | |||||||||||||
|
Total
operating profit
|
67.2 | 185.5 | 203.3 | 170.7 | 205.3 | |||||||||||||||
|
Write-down
of long-lived assets4
|
-- | -- | -- | -- | (2.3 | ) | ||||||||||||||
|
Interest
expense, net5
|
(25.9 | ) | (23.7 | ) | (18.8 | ) | (15.0 | ) | (13.3 | ) | ||||||||||
|
General
corporate expenses
|
(21.8 | ) | (21.0 | ) | (27.3 | ) | (22.3 | ) | (24.1 | ) | ||||||||||
|
Income
from continuing operations before income taxes
|
19.5 | 140.8 | 157.2 | 133.4 | 165.6 | |||||||||||||||
|
Income
taxes
|
7.6 | 51.5 | 59.3 | 49.8 | 62.0 | |||||||||||||||
|
Income
from continuing operations
|
11.9 | 89.3 | 97.9 | 83.6 | 103.6 | |||||||||||||||
|
Income
from discontinued operations
|
32.3 | 43.1 | 44.3 | 38.9 | 22.4 | |||||||||||||||
|
Net
Income
|
$ | 44.2 | $ | 132.4 | $ | 142.2 | $ | 122.5 | $ | 126.0 | ||||||||||
|
1
|
Prior
year amounts restated for amounts treated as discontinued
operations.
|
|
2
|
Includes
inter-segment revenue, interest income, and other income classified as
revenue for segment reporting
purposes.
|
|
3
|
The Ocean Transportation segment
includes approximately $6.2 million, $5.2 million, $10.7 million, $13.3
million, and $17.1 million of equity in earnings from its investment in
SSAT for 2009, 2008, 2007, 2006, and 2005, respectively. The Real Estate
Sales segment includes approximately $9.0 million, $22.6 million, $14.4
million, and $3.3 million in equity in earnings from its various real
estate joint ventures for 2008, 2007, 2006, and 2005, respectively. Equity
in earnings from joint ventures in 2009 was
negligible.
|
|
4
|
The
2005 write-down was for an impairment in the Company’s investment in
C&H Sugar Company, Inc. (“C&H”) which was subsequently
sold.
|
|
5
|
Includes
Ocean Transportation interest expense of $9.0 million for 2009, $11.6
million for 2008, $13.9 million for 2007, $13.3 million for 2006, and $9.6
million for 2005. Substantially all other interest expense was incurred at
the parent company.
|
|
6
|
Includes
a $5.4 million gain recorded upon consolidation of HS&TC in
2009.
|
SELECTED
FINANCIAL DATA (CONTINUED)
|
2009
|
2008
|
2007
|
2006
|
2005
|
||||||||||||||||
|
Identifiable
Assets:
|
||||||||||||||||||||
|
Transportation:
|
||||||||||||||||||||
|
Ocean
transportation7
|
$ | 1,095.2 | $ | 1,153.9 | $ | 1,215.0 | $ | 1,185.3 | $ | 1,113.0 | ||||||||||
|
Logistics
services
|
72.4 | 74.2 | 58.6 | 56.4 | 70.3 | |||||||||||||||
|
Real
Estate:
|
||||||||||||||||||||
|
Leasing
|
627.4 | 590.2 | 595.4 | 525.5 | 478.6 | |||||||||||||||
|
Sales7
|
415.6 | 344.6 | 408.9 | 295.0 | 227.3 | |||||||||||||||
|
Agribusiness
|
156.8 | 172.2 | 174.6 | 168.7 | 159.0 | |||||||||||||||
|
Other
|
12.2 | 15.1 | 26.6 | 20.3 | 22.7 | |||||||||||||||
|
Total
assets
|
$ | 2,379.6 | $ | 2,350.2 | $ | 2,479.1 | $ | 2,251.2 | $ | 2,070.9 | ||||||||||
|
Capital
Expenditures:
|
||||||||||||||||||||
|
Transportation:
|
||||||||||||||||||||
|
Ocean
transportation
|
$ | 12.7 | $ | 35.5 | $ | 65.8 | $ | 217.1 | $ | 173.9 | ||||||||||
|
Logistics
services8
|
0.6 | 2.4 | 2.0 | 1.7 | 1.3 | |||||||||||||||
|
Real
Estate:
|
||||||||||||||||||||
|
Leasing9
|
108.8 | 100.2 | 124.5 | 93.0 | 78.8 | |||||||||||||||
|
Sales10
|
0.1 | 0.6 | 0.3 | 1.3 | 0.2 | |||||||||||||||
|
Agribusiness
|
3.4 | 15.2 | 20.5 | 15.0 | 13.0 | |||||||||||||||
|
Other
|
0.3 | 0.8 | 0.3 | 1.5 | 1.4 | |||||||||||||||
|
Total
capital expenditures
|
$ | 125.9 | $ | 154.7 | $ | 213.4 | $ | 329.6 | $ | 268.6 | ||||||||||
|
Depreciation
and Amortization:
|
||||||||||||||||||||
|
Transportation:
|
||||||||||||||||||||
|
Ocean
transportation
|
$ | 67.1 | $ | 66.1 | $ | 63.2 | $ | 58.1 | $ | 59.5 | ||||||||||
|
Logistics
services
|
3.5 | 2.3 | 1.5 | 1.5 | 1.4 | |||||||||||||||
|
Real
Estate:
|
||||||||||||||||||||
|
Leasing1
|
19.5 | 17.9 | 15.7 | 14.1 | 12.4 | |||||||||||||||
|
Sales
|
0.3 | 0.2 | 0.2 | 0.1 | 0.1 | |||||||||||||||
|
Agribusiness
|
11.9 | 11.5 | 10.7 | 10.1 | 9.4 | |||||||||||||||
|
Other
|
3.1 | 2.7 | 1.3 | 0.9 | 0.5 | |||||||||||||||
|
Total
depreciation and amortization
|
$ | 105.4 | $ | 100.7 | $ | 92.6 | $ | 84.8 | $ | 83.3 | ||||||||||
|
7
|
The
Ocean Transportation segment includes approximately $47.2 million, $44.6
million, $48.6 million, $49.8 million, and $39.8 million related to its
investment in SSAT as of December 31, 2009, 2008, 2007, 2006, and 2005,
respectively. The Real Estate Sales segment includes approximately $193.3
million, $162.1 million, $134.1 million, $98.4 million, and $114.1 million
related to its investment in various real estate joint ventures as of
December 31, 2009, 2008, 2007, 2006, and 2005,
respectively.
|
|
8
|
Excludes
expenditures related to Matson Integrated Logistics’ acquisitions, which
are classified as Payments for Purchases of Investments in Cash Flows from
Investing Activities within the Consolidated Statements of Cash
Flows.
|
|
9
|
Represents
gross capital additions to the leasing portfolio, including gross
tax-deferred property purchases that are reflected as non-cash
transactions in the Consolidated Statements of Cash
Flows.
|
|
10
|
Excludes
capital expenditures for real estate developments held for sale which are
classified as Cash Flows from Operating Activities within the Consolidated
Statements of Cash Flows. Operating cash flows for capital expenditures
related to real estate developments were $6 million, $39 million, $110
million, $69 million, and $34 million for 2009, 2008, 2007, 2006, and
2005, respectively.
|
SELECTED
FINANCIAL DATA (CONTINUED)
|
2009
|
2008
|
2007
|
2006
|
2005
|
||||||||||||||||
|
Earnings
per share:
|
||||||||||||||||||||
|
From
continuing operations:
|
||||||||||||||||||||
|
Basic
|
$
|
0.29
|
$
|
2.17
|
$
|
2.30
|
$
|
1.93
|
$
|
2.38
|
||||||||||
|
Diluted
|
$
|
0.29
|
$
|
2.15
|
$
|
2.27
|
$
|
1.92
|
$
|
2.35
|
||||||||||
|
Net
income:
|
||||||||||||||||||||
|
Basic
|
$
|
1.08
|
$
|
3.21
|
$
|
3.34
|
$
|
2.84
|
$
|
2.89
|
||||||||||
|
Diluted
|
$
|
1.08
|
$
|
3.19
|
$
|
3.30
|
$
|
2.81
|
$
|
2.86
|
||||||||||
|
Return
on beginning equity
|
4.1
|
%
|
11.7
|
%
|
13.8
|
%
|
12.1
|
%
|
13.9
|
%
|
||||||||||
|
Cash
dividends per share
|
$
|
1.26
|
$
|
1.235
|
$
|
1.12
|
$
|
0.975
|
$
|
0.90
|
||||||||||
|
At
Year End
|
||||||||||||||||||||
|
Shareholders
of record
|
3,197
|
3,269
|
3,381
|
3,506
|
3,628
|
|||||||||||||||
|
Shares
outstanding
|
41.0
|
41.0
|
42.4
|
42.6
|
44.0
|
|||||||||||||||
|
Long-term
debt – non-current
|
$
|
406
|
$
|
452
|
$
|
452
|
$
|
401
|
$
|
296
|
||||||||||
ITEM
7. MANAGEMENT’S DISCUSSION AND ANALYSIS OF FINANCIAL CONDITION AND RESULTS OF
OPERATIONS
FORWARD-LOOKING
STATEMENTS AND RISK FACTORS
The Company, from time to time, may
make or may have made certain forward-looking statements, whether orally or in
writing, such as forecasts and projections of the Company’s future performance
or statements of management’s plans and objectives. These statements are
“forward-looking” statements as that term is defined in the Private Securities
Litigation Reform Act of 1995. Such forward-looking statements may be contained
in, among other things, SEC filings, such as the Forms 10-K, 10-Q and 8-K, the
Annual Report to Shareholders, press releases made by the Company, the Company’s
Internet Web sites (including Web sites of its subsidiaries), and oral
statements made by the officers of the Company. Except for historical
information contained in these written or oral communications, such
communications contain forward-looking statements. These include, for example,
all references to 2010 or future years. New risk factors emerge from time to
time and it is not possible for the Company to predict all such risk factors,
nor can it assess the impact of all such risk factors on the Company’s business
or the extent to which any factor, or combination of factors, may cause actual
results to differ materially from those contained in any forward-looking
statements. Accordingly, forward-looking statements cannot be relied upon as a
guarantee of future results and involve a number of risks and uncertainties that
could cause actual results to differ materially from those projected in the
statements, including, but not limited to the factors that are described in Part
I, Item 1A under the caption of “Risk Factors” of this Form 10-K, which section
is incorporated herein by reference. The Company is not required, and undertakes
no obligation, to revise or update forward-looking statements or any factors
that may affect actual results, whether as a result of new information, future
events, or circumstances occurring after the date of this report.
OVERVIEW
Management’s Discussion and Analysis of
Financial Condition and Results of Operations (“MD&A”) is designed to
provide a discussion of the Company’s financial condition, results of
operations, liquidity and certain other factors that may affect its future
results from the perspective of management. The discussion that follows is
intended to provide information that will assist in understanding the changes in
the Company’s financial statements from year to year, the primary factors that
accounted for those changes, and how certain accounting principles, policies and
estimates affect the Company’s financial statements. MD&A is provided as a
supplement to, and should be read in conjunction with, the consolidated
financial statements and the accompanying notes to the financial statements.
MD&A is presented in the following sections:
|
|
•
|
Business
Overview
|
|
|
•
|
Critical
Accounting Estimates
|
|
|
•
|
Consolidated
Results of Operations
|
|
|
•
|
Analysis
of Operating Revenue and Profit by
Segment
|
|
|
•
|
Liquidity
and Capital Resources
|
|
|
•
|
Contractual
Obligations, Commitments, Contingencies and Off-Balance-Sheet
Arrangements
|
|
|
•
|
Business
Outlook
|
|
|
•
|
Other
Matters
|
BUSINESS
OVERVIEW
Alexander & Baldwin, Inc.
(“A&B”), founded in 1870, is a multi-industry corporation headquartered in
Honolulu that operates in five segments in three industries—Transportation, Real
Estate, and Agribusiness.
Transportation: The Transportation
Industry consists of Ocean Transportation and Logistics Services segments. The
Ocean Transportation segment, which is conducted through Matson Navigation
Company, Inc. (“Matson”), a wholly-owned subsidiary of A&B, is an
asset-based business that derives its revenue primarily through the carriage of
containerized freight between various U.S. Pacific Coast, Hawaii, Guam, China
and other Pacific island ports. Additionally, the Ocean Transportation segment
has a 35 percent interest in an entity that provides terminal and stevedoring
services at U.S. Pacific Coast facilities.
The Logistics Services segment, which
is conducted through Matson Integrated Logistics, Inc. (“MIL”), a wholly-owned
subsidiary of Matson, is a non-asset based business that is a provider of
domestic and international rail intermodal service (“Intermodal”), long-haul and
regional highway brokerage, specialized hauling, flat-bed and project work,
less-than-truckload, expedited/air freight services, and warehousing and
distribution services (collectively “Highway”). Warehousing and distribution
services are provided by Matson Global Distribution Services, Inc. (“MGDS”), a
wholly-owned subsidiary of MIL. MGDS’s operations also include Pacific American
Services, LLC (“PACAM”), a San Francisco bay-area regional warehousing,
packaging, and distribution company acquired in the third quarter of
2008.
The Transportation Industry accounted
for 78 percent, 54 percent, and 49 percent of the revenue, operating
profit, and identifiable assets, respectively, in 2009 on a consolidated basis
before discontinued operations.
Real
Estate: The Real Estate Industry consists of two segments, both of which
have operations in Hawaii and on the U.S. Mainland. The Real Estate Sales
segment generates its revenues through the development and sale of land and
commercial and residential properties. The Real Estate Leasing segment owns,
operates, and manages retail, office, and industrial properties. Real estate
activities are conducted through A&B Properties, Inc. and various other
wholly-owned subsidiaries of A&B.
The Real Estate Industry accounted for
15 percent, 69 percent, and 44 percent of the revenue, operating profit, and
identifiable assets, respectively, in 2009 on a consolidated basis before
discontinued operations.
Agribusiness:
Agribusiness, a division of A&B, contains one segment and produces and
transports bulk raw sugar, specialty food grade sugars, and molasses; produces,
markets, and distributes green coffee, roasted coffee, and specialty food-grade
sugars; provides general trucking services, mobile equipment maintenance, and
repair services; and generates and sells, to the extent not used in the
Company’s Agribusiness operations, electricity.
In the
fourth quarter of 2009, the Company became the sole member in Hawaiian Sugar
& Transportation Cooperative (“HS&TC”), a cooperative that provides raw
sugar marketing and transportation services to its members, and therefore, the
Company consolidated HS&TC beginning December 1, 2009 in accordance with
Financial Accounting Standards Board (“FASB”) Accounting Standards Codification
(“ASC”) Topic 810 related to consolidation.
The Agribusiness Industry accounted for
7 percent of revenue and identifiable assets in 2009 on a consolidated basis
before discontinued operations.
CRITICAL
ACCOUNTING ESTIMATES
The Company’s significant accounting
policies are described in Note 1 to the Consolidated Financial Statements. The
preparation of financial statements in conformity with accounting principles
generally accepted in the United States of America, upon which the MD&A is
based, requires that management exercise judgment when making estimates and
assumptions about future events that may affect the amounts reported in the
financial statements and accompanying notes. Future events and their effects
cannot be determined with absolute certainty and actual results will,
inevitably, differ from those critical accounting estimates. These differences
could be material.
The Company considers an accounting
estimate to be critical if: (i)(a) the accounting estimate requires the Company
to make assumptions that are difficult or subjective about matters that were
highly uncertain at the time that the accounting estimate was made, (b) changes
in the estimate are reasonably likely to occur in periods subsequent to the
period in which the estimate was made, or (c) use of different estimates by the
Company could have been used, and (ii) changes in those assumptions or estimates
would have had a material impact on the financial condition or results of
operations of the Company. The critical accounting estimates inherent in the
preparation of the Company’s financial statements are described
below.
Impairment of Long-Lived Assets:
The Company’s long-lived assets are reviewed for possible impairment when
events or circumstances indicate that the carrying value may not be recoverable.
In such an evaluation, the estimated future undiscounted cash flows generated by
the asset are compared with the amount recorded for the asset to determine if
its carrying value is not recoverable. If this review determines that the
recorded value will not be recovered, the amount recorded for the asset is
reduced to estimated fair value. The Company has evaluated certain long-lived
assets for impairment; however, no impairment charges were recorded as a result
of this process. These asset impairment loss analyses are highly subjective
because they require management to make assumptions and apply considerable
judgments to, among others, estimates of the timing and amount of future cash
flows, expected useful lives of the assets, uncertainty about future events,
including changes in economic conditions, changes in operating performance,
changes in the use of the assets, and ongoing costs of maintenance and
improvements of the assets, and thus, the accounting estimates may change from
period to period. If management uses different assumptions or if different
conditions occur in future periods, the Company’s financial condition or its
future operating results could be materially impacted.
Impairment of Investments: The
Company’s investments in unconsolidated affiliates are reviewed for impairment
whenever there is evidence that fair value may be below carrying cost. An
investment is written down to fair value if fair value is below carrying cost
and the impairment is other-than-temporary. In evaluating the fair value of an
investment, the Company reviews discounted projected cash flows associated with
the investment and other relevant information. In evaluating whether
an impairment is other-than-temporary, the Company considers all available
information, including the length of time and extent of the impairment, the
financial condition and near-term prospects of the affiliate, the Company’s
ability and intent to hold the investment for a period of time sufficient to
allow for any anticipated recovery in market value, and projected industry and
economic trends, among others.
In determining the fair value of an
investment and assessing whether any identified impairment is
other-than-temporary, significant estimates and considerable judgments are
involved. These estimates and judgments are based, in part, on the Company’s
current and future evaluation of economic conditions in general, as well as a
joint venture’s current and future plans. These impairment calculations are
highly subjective because they also require management to make assumptions and
apply judgments to, among others, estimates of the timing and amount of future
cash flows, probabilities related to various cash flow scenarios, and
appropriate discount rates. Changes in these and other assumptions could affect
the projected operational results of the unconsolidated affiliates, and
accordingly, may require valuation adjustments to the Company’s investments that
may materially impact the Company’s financial condition or its future operating
results. For example, if the current market conditions continue to deteriorate
or a joint venture’s plans change, additional impairment charges may be required
in future periods, and those charges could be material.
In 2009, the Company evaluated certain
investments in unconsolidated affiliates for impairment. As a result of this
process, the Company recorded an impairment loss of approximately $2.5 million
related to its Ka Milo joint venture investment. Continued weakness in the real
estate sector or difficulty in obtaining or renewing project-level financing may
affect the value or feasibility of certain development projects owned by the
Company or by its joint ventures and could lead to additional impairment charges
in the future.
Legal Contingencies: The
Company’s results of operations could be affected by significant litigation
adverse to the Company, including, but not limited to, liability claims,
antitrust claims, and claims related to coastwise trading matters. The Company
records accruals for legal matters when the information available indicates that
it is probable that a liability has been incurred and the amount of the loss can
be reasonably estimated. Management makes adjustments to these accruals to
reflect the impact and status of negotiations, settlements, rulings, advice of
counsel and other information and events that may pertain to a particular
matter. Predicting the outcome of claims and lawsuits and estimating related
costs and exposure involves substantial uncertainties that could cause actual
costs to vary materially from those estimates. In making determinations of
likely outcomes of litigation matters, the Company considers many factors. These
factors include, but are not limited to, the nature of specific claims including
unasserted claims, the Company’s experience with similar types of claims, the
jurisdiction in which the matter is filed, input from outside legal counsel, the
likelihood of resolving the matter through alternative dispute resolution
mechanisms and the matter’s current status. A detailed discussion of significant
litigation matters is contained in Note 12 to the Consolidated Financial
Statements.
Allowance for Doubtful Accounts:
Receivables are recorded net of an allowance for doubtful accounts. The
Company estimates future write-offs based on delinquencies, credit ratings,
aging trends, and historical experience. The Company believes the allowance for
doubtful accounts is adequate to cover anticipated losses; however, significant
deterioration in any of the aforementioned factors or in general economic
conditions could change these expectations, and accordingly, the Company’s
financial condition and/or its future operating results could be materially
impacted.
Revenue Recognition for Certain
Long-term Real Estate Developments: As discussed in
Note 1 to the Consolidated Financial Statements, revenues from real estate
sales are generally recognized when sales are closed and title, risk and rewards
passes to the buyer. For certain real estate sales, the Company and its joint
venture partners account for revenues on long-term real estate development
projects that have material continuing post-closing involvement, such as
Kukui`ula, using the percentage-of-completion method. Following this method, the
amount of revenue recognized is based on the percentage of development costs
that have been incurred through the reporting period in relation to total
expected development cost associated with the subject property. Accordingly, if
material changes to total expected development costs or revenues occur, the
Company’s financial condition and/or its future operating results could be
materially impacted.
Self-Insured Liabilities: The
Company is self-insured for certain losses related to, including, but not
limited to, employee health, workers’ compensation, general liability, real and
personal property, and real estate construction warranty and defect claims.
Where feasible, the Company obtains third-party insurance coverage to limit its
exposure to these claims. When estimating its self-insured liabilities, the
Company considers a number of factors, including historical claims experience,
demographic factors, current trends, and analyses provided by independent
third-parties. Periodically, management reviews its assumptions and the analyses
provided by independent third-parties to determine the adequacy of the Company’s
self-insured liabilities. The Company’s self-insured liabilities contain
uncertainties because management is required to apply judgment and make
long-term assumptions to estimate the ultimate cost to settle reported claims
and claims incurred, but not reported, as of the balance sheet date. If
management uses different assumptions or if different conditions occur in future
periods, the Company’s financial condition and/or its future operating results
could be materially impacted.
Goodwill & Intangible
Assets: The Company reviews goodwill and intangible assets for impairment
whenever events or changes in circumstances indicate that the carrying amount of
these assets may not be recoverable and also reviews goodwill for impairment
annually. In estimating the fair value of a reporting unit, the Company uses a
combination of a discounted cash flow model and fair value based on market
multiples of earnings before interest, taxes, depreciation and amortization
(“EBITDA”). The discounted cash flow approach requires the Company to use a
number of assumptions, including market factors specific to the business, the
amount and timing of estimated future cash flows to be generated by the business
over an extended period of time, long-term growth rates for the business, and a
discount rate that considers the relative risk of achieving the cash flows and
the time value of money. Although the assumptions used by the Company in its
discounted cash flow model are consistent with the assumptions the Company used
to generate its internal strategic plans and forecasts, significant judgment is
required to estimate the amount and timing of future cash flows from the
reporting unit and the relative risk of achieving those cash flows. When using
market multiples of EBITDA, the Company must make judgments about the
comparability of those multiples in closed and proposed transactions.
Accordingly, changes in assumptions and estimates, including, but not limited
to, changes driven by external factors, such as industry and economic trends,
and those driven by internal factors, such as changes in the Company’s business
strategy and its internal forecasts, could have a material adverse effect on the
Company’s business, financial condition and results of operations.
Pension and Post-Retirement
Estimates: The estimation of the Company’s pension and
post-retirement expenses and liabilities requires that the Company make various
assumptions. These assumptions include the following key factors:
|
|
•
|
Discount
rates
|
|
|
•
|
Expected
long-term rate of return on pension plan
assets
|
|
|
•
|
Salary
growth
|
|
|
•
|
Health
care cost trend rates
|
|
|
•
|
Inflation
|
|
|
•
|
Retirement
rates
|
|
|
•
|
Mortality
rates
|
|
|
•
|
Expected
contributions
|
Actual results that differ from the
assumptions made with respect to the above factors could materially affect the
Company’s financial condition and/or its future operating results. The effects
of changing assumptions are included in unamortized net gains and losses, which
directly affect accumulated other comprehensive income. Additionally, these
unamortized gains and losses are amortized and reclassified to income (loss)
over future periods.
The 2009 net periodic cost and
obligations for qualified pension and post-retirement plans were determined
using a discount rate of 6.25 percent. For the Company’s non-qualified benefit
plans, the 2009 net periodic cost was determined using a discount rate of 6.00
percent and the December 31, 2009 obligation was determined using a discount
rate of 5.00 percent. The discount rate used for determining the year-end
benefit plan obligation was generally calculated using a weighting of expected
benefit payments and rates associated with high-quality U.S. corporate bonds for
each year of expected payment to derive a single estimated rate at which the
benefits could be effectively settled at December 31, 2009, rounded to the
nearest quarter percent.
The estimated return on plan assets
of 8.5 percent was based on historical trends combined with long-term
expectations, the mix of plan assets, asset class returns, and long-term
inflation assumptions. One-, three-, and five-year pension returns were 16.8
percent, (3.7) percent, and 3.0 percent, respectively. The Company’s long-term
rate of return (since inception in 1989) was 8.3 percent.
For 2009, the Company’s post-retirement
obligations were measured using an initial 9 percent health care cost trend
rate, decreasing by 1 percent annually until the ultimate rate of 5 percent is
reached in 2014.
Lowering the expected long-term rate
of return on the Company’s qualified plan assets by one-half of one percent
would have increased pre-tax pension expense for 2009 by approximately $1.2
million. Lowering the discount rate assumption by one-half of one percentage
point would have increased pre-tax pension expense by $2.1 million. Additional
information about the Company’s benefit plans is included in Note 9 to the
Consolidated Financial Statements.
As of December 31, 2009, the market
value of the Company’s defined benefit plans totaled approximately $260 million,
compared with $244 million as of December 31, 2008. The recorded net pension
liability was approximately $62 million as of December 31, 2009 and
approximately $70 million as of December 31, 2008. The Company expects to make
contributions totaling $0.5 million to certain of its defined benefit pension
plans in 2010. There were no contributions required in 2009 and
2008.
Income Taxes: The Company
makes certain estimates and judgments in determining income tax expense for
financial statement purposes. These estimates and judgments are applied in the
calculation of tax credits, tax benefits and deductions, and in the calculation
of certain tax assets and liabilities, which arise from differences in the
timing of recognition of revenue and expense for tax and financial statement
purposes. Significant changes to these estimates may result in an increase or
decrease to the Company’s tax provision in a subsequent period.
In addition, the calculation of tax
liabilities involves significant judgment in estimating the impact of uncertain
tax positions taken or expected to be taken with respect to the application of
complex tax laws. Resolution of these uncertainties in a manner inconsistent
with management’s expectations could materially affect the Company’s financial
condition and/or its future operating results.
Recent Accounting
Pronouncements: See Note 1 to the Consolidated Financial Statements
for a full description of the impact of recently issued accounting standards,
which is incorporated herein by reference, including the expected dates of
adoption and estimated effects on the Company’s results of operations and
financial condition.
CONSOLIDATED
RESULTS OF OPERATIONS
The following analysis of the
consolidated financial condition and results of operations of
Alexander & Baldwin, Inc. and its subsidiaries (collectively, the
“Company”) should be read in conjunction with the consolidated financial
statements and related notes thereto. Amounts in this narrative are rounded to
millions, but per-share calculations and percentages were calculated based on
thousands. Accordingly, a recalculation of some per-share amounts and
percentages, if based on the reported data, may be slightly different than the
more accurate amounts included herein.
|
(dollars
in millions, except per-share amounts)
|
2009
|
Chg.
|
2008
|
Chg.
|
2007
|
|||||||||
|
Operating
Revenue
|
$
|
1,405
|
-25
|
%
|
$
|
1,880
|
14
|
%
|
$
|
1,651
|
||||
|
Operating
Costs and Expenses
|
1,363
|
-21
|
%
|
1,731
|
15
|
%
|
1,502
|
|||||||
|
Operating
Income
|
42
|
-72
|
%
|
149
|
--
|
%
|
149
|
|||||||
|
Other
Income and (Expense)
|
(22
|
)
|
-3
|
X
|
(8
|
)
|
NM
|
8
|
||||||
|
Income
Taxes
|
(8
|
)
|
-85
|
%
|
(52
|
)
|
-12
|
%
|
(59
|
)
|
||||
|
Discontinued
Operations (net of taxes)
|
32
|
-26
|
%
|
43
|
-2
|
%
|
44
|
|||||||
|
Net
Income
|
$
|
44
|
-67
|
%
|
$
|
132
|
-7
|
%
|
$
|
142
|
||||
|
Basic
Earnings Per Share
|
$
|
1.08
|
-66
|
%
|
$
|
3.21
|
-4
|
%
|
$
|
3.34
|
||||
|
Diluted
Earnings Per Share
|
$
|
1.08
|
-66
|
%
|
$
|
3.19
|
-3
|
%
|
$
|
3.30
|
||||
2009
vs. 2008
Operating Revenue for 2009
decreased 25 percent, or $475 million, to $1,405 million. Real estate sales
revenue decreased 93 percent in 2009 (after subtracting revenue from
discontinued operations) due principally to sales at the Company’s Keola La’i
condominium project in 2008. Ocean transportation revenue decreased 13 percent,
principally due to lower Hawaii volumes, lower China yields and lower fuel
surcharge revenues, partially offset by improved Hawaii service yields and cargo
mix. Logistics services revenue decreased 26 percent, principally due to lower
volumes and yields, partially offset by revenue from MGDS’s warehousing and
distribution business, which acquired Pacific American Services, LLC (“PACAM”),
a San Francisco bay-area regional warehousing, packaging and distribution
company, in August 2008. Agribusiness revenue decreased 18 percent, primarily
due to lower power sales volume and pricing and lower bulk raw sugar sales
volume. Real estate leasing revenue increased 6 percent in 2009 (after
subtracting leasing revenue from assets classified as discontinued operations),
primarily due to a positive effect from the timing of property acquisitions and
dispositions, partially offset by lower mainland occupancy and rents. The
reasons for business- and segment-specific year-to-year fluctuations in revenue
growth are further described below in the Analysis of Operating Revenue and
Profit by Segment.
Because of the recurring nature of
property sales, the Company views changes in real estate sales and real estate
leasing revenues on a year-over-year basis before the reclassification of
revenue to discontinued operations to be more meaningful in assessing segment
performance. Additionally, due to the timing of sales for development properties
and the mix of properties sold, management believes performance is more
appropriately assessed over a multi-year period. Furthermore, year-over-year
comparisons of revenue are not complete without the consideration of results
from the Company’s investment in its real estate joint ventures, which are not
included in consolidated operating revenue, but are included in segment
operating profit. The Analysis of Operating Revenue and Profit by Segment that
follows, provides additional information on changes in real estate sales revenue
and operating profit before reclassifications to discontinued
operations.
Operating Costs and Expenses
for 2009 decreased by 21 percent, or $368 million, to $1,363 million. Real
estate sales and leasing costs decreased by 74 percent, primarily related to
cost of sales for condominiums sold at Keola La’i in 2008, partially offset by
higher depreciation expenses on commercial properties. Logistics services cost
decreased 27 percent due primarily to lower volumes. Ocean transportation costs
decreased 10 percent, primarily due to lower volume-related expenses, partially
offset by higher contractual stevedoring rates and higher vessel repair costs.
Selling, General and Administrative costs (“SG&A”), decreased 6 percent due
principally to cost reduction initiatives, including workforce and benefit
reductions, as well as lower performance-based compensation. Agribusiness costs
decreased 2 percent due principally to personnel cost savings and lower volume
of sugar sold. These cost decreases were partially offset by a $24 million
year-over-year increase in non-cash pension expense, which is embedded in the
segment figures and general and administrative expenses, was principally due to
plan asset losses in 2008. The reasons for changes in business- and
segment-specific year-to-year fluctuations in operating costs, which affect
segment operating profit, are more fully described below in the Analysis of
Operating Revenue and Profit by Segment.
Income Taxes were lower in
2009 compared with 2008 on an absolute basis due principally to lower income.
The effective tax rate in 2009 was higher than the rate in 2008 principally due
to an adjustment to prior year taxes, non-deductible expenses that had a greater
impact on the effective rate as a result of lower income relative to 2008, the
recognition of certain tax benefits in 2008 as a result of certain statute of
limitations expirations, and newly enacted tax legislation which unfavorably
affected the effective rate.
Other Income and Expense in
2009 decreased $14 million in 2009 compared with 2008, due primarily to $9
million in lower real estate joint venture income, an $8 million gain on a fire
insurance settlement recognized in 2008, and $1 million in higher interest
expense in 2009 resulting from lower capitalized interest and a higher
weighted-average interest rate, partially offset by a $5 million gain recorded
upon consolidation of HS&TC (as further described in Note 3 to the
Consolidated Financial Statements).
2008
vs. 2007
Operating Revenue for 2008
increased 14 percent, or $229 million over 2007 results, to $1,880 million. Real
estate sales revenue increased more than ninefold in 2008 (after subtracting
revenue from discontinued operations) due principally to sales at the Company’s
Keola La’i condominium project. Real estate leasing revenue increased 10 percent
in 2008 (after subtracting leasing revenue from assets classified as
discontinued operations), primarily due to the favorable effect from the timing
of acquisitions and dispositions, partially offset by lower mainland occupancy.
Ocean transportation revenue increased 2 percent, principally due to higher fuel
surcharge revenues, improved Hawaii service yields and cargo mix, and higher
China service yields, partially offset by lower volumes. Logistics services
revenue increased 1 percent, principally due to the commencement of MGDS’s
warehousing operations, the acquisition of PACAM, and higher rates, principally
fuel surcharges. Agribusiness revenue decreased modestly, primarily due to lower
bulk raw sugar sales volumes.
Operating Costs and Expenses
for 2008 increased by 15 percent, or $229 million, to $1,731 million. Real
estate sales and leasing costs more than quadrupled, primarily related to cost
of sales for condominiums sold at Keola La’i, and to a lesser extent higher
depreciation expenses on commercial properties. Ocean transportation costs
increased 5 percent, primarily due to higher vessel and terminal handling costs,
partially offset by lower operations overhead costs, principally lower westbound
container repositioning costs. Agribusiness costs increased 11 percent due
principally to higher crop production costs. These increases were partially
offset by lower consolidated SG&A, which decreased 1 percent due principally
to lower performance-based compensation.
Other Income and Expense in
2008 is comprised of equity in earnings of real estate joint ventures, interest
revenue and interest expense. Equity in income of real estate affiliates was $14
million lower in 2008 due principally to $12.1 million higher earnings from the
Company’s Kai Malu joint venture project in 2007. Interest expense of $24
million in 2008 was $5 million higher than 2007 due to higher average debt
balances. Impairment losses related to the Company’s investments totaled
approximately $3 million and interest income in 2008 was $2 million lower than
2007 due to lower average rates and lower average invested balances. These
decreases in 2008 were partially offset by an $8 million gain recognized in 2008
for an insurance settlement related to a 2005 casualty loss.
Income Taxes were lower in
2008 compared with 2007 on an absolute and percentage basis due to lower income
and a reduction in the effective income tax rate. The lower effective income tax
rate in 2008 was principally due to the recognition of $2 million in
unrecognized tax benefits as a result of the expiration of certain statute of
limitations, tax credits related to renewable energy and investments, and a
decrease in certain non-deductible expenses.
ANALYSIS
OF OPERATING REVENUE AND PROFIT BY SEGMENT
Additional detailed information related
to the operations and financial performance of the Company’s Industry Segments
is included in Part II Item 6 and Note 13 to the Consolidated Financial
Statements. The following information should be read in relation to the
information contained in those sections.
Transportation
Industry
Ocean
Transportation;
2009 compared with 2008
|
(dollars
in millions)
|
2009
|
2008
|
Change
|
||||||
|
Revenue
|
$
|
888.6
|
$
|
1,023.7
|
-13
|
%
|
|||
|
Operating
profit
|
$
|
58.3
|
$
|
105.8
|
-45
|
%
|
|||
|
Operating
profit margin
|
6.6
|
%
|
10.3
|
%
|
|||||
|
Volume*
(units):
|
|||||||||
|
Hawaii
containers
|
136,100
|
152,700
|
-11
|
%
|
|||||
|
Hawaii
automobiles
|
83,400
|
86,300
|
-3
|
%
|
|||||
|
China
containers
|
46,600
|
47,800
|
-3
|
%
|
|||||
|
Guam
containers
|
14,100
|
13,900
|
1
|
%
|
|||||
*
Container volumes included for the period are based on the voyage departure
date, but revenue and operating profit are adjusted to reflect the percentage of
revenue and operating profit earned during the reporting period for voyages that
straddle the beginning and/or end of the reporting period.
Ocean Transportation revenue decreased
$135.1 million, or 13 percent, in 2009 compared to 2008. This decrease was
principally due to $82.5 million of lower revenue, resulting from lower net
volumes and $76.1 million in reduced fuel surcharges resulting from a reduction
in average bunker fuel prices. These decreases were partially offset by a $21.0
million net improvement in yields and cargo mix and revenue of $5.2 million in
higher revenue from a U.S. Government charter in 2009. The net improvement in
yields were driven by improved yields in the Hawaii trade, but was partially
offset by rate deterioration in China.
Total Hawaii container volume was down
11 percent in 2009 compared with 2008, reflecting a broad-based decline in
demand caused by the ongoing softness in Hawaii’s economy. Matson’s Hawaii
automobile volume for the year was 3 percent lower than 2008, also reflecting
economic weakness that is negatively impacting new car shipments from
manufacturers to Hawaii auto dealers and rental car companies. China container
volume decreased 3 percent in 2009, compared with 2008, principally due to weak
demand for U.S. bound imports. Guam container volumes were essentially
unchanged.
Operating profit decreased $47.5
million, or 45 percent, in 2009 compared to 2008. The decrease in operating
profit was principally due to $59.7 million related to lower net volumes, $11.4
million from higher terminal costs as a result of higher contractual stevedoring
rates, $2.2 million in higher general and administrative expenses, and $1.9
million in higher vessel costs. General and administrative expenses were higher
principally due to $10 million in higher pension costs and a first quarter 2009
expense of $6.0 million related to Matson’s headcount reduction program, which
was partially offset by the ongoing benefit of the headcount reduction. Vessel
expenses were impacted by the direct and indirect costs associated with
emergency rudder repairs, totaling $6.3 million, and increased drydock and
insurance expenses totaling $5.3 million, partially offset by $9.7 million in
reduced expenses that were principally the result of efficient fleet deployment
initiatives. The decrease in operating profit was partially offset by a $21.0
million improvement in yields and cargo mix, net of the impact resulting from
China rate deterioration, the increased contribution of $2.8 million from U.S.
Government charters, and $2.3 million in lower outside transportation expenses
resulting from reduced truck and ocean carrier costs.
Ocean
Transportation;
2008 compared with 2007
|
(dollars
in millions)
|
2008
|
2007
|
Change
|
||||||
|
Revenue
|
$
|
1,023.7
|
$
|
1,006.9
|
2
|
%
|
|||
|
Operating
profit
|
$
|
105.8
|
$
|
126.5
|
-16
|
%
|
|||
|
Operating
profit margin
|
10.3
|
%
|
12.6
|
%
|
|||||
|
Volume*
(units):
|
|||||||||
|
Hawaii
containers
|
152,700
|
167,500
|
-9
|
%
|
|||||
|
Hawaii
automobiles
|
86,300
|
110,100
|
-22
|
%
|
|||||
|
China
containers
|
47,800
|
51,200
|
-7
|
%
|
|||||
|
Guam
containers
|
13,900
|
14,600
|
-5
|
%
|
|||||
*
Container volumes included for the period are based on the voyage departure
date, but revenue and operating profit are adjusted to reflect the percentage of
revenue and operating profit earned during the reporting period for voyages that
straddle the beginning and/or end of the reporting period.
Ocean Transportation revenue increased
$16.8 million, or 2 percent, in 2008 compared to 2007. Fuel surcharge revenues
increased $59.8 million, which included a bunker adjustment factor in the China
trade, and improved yields and cargo mix contributed an additional $42.0 million
increase. These increases were partially offset by $84.2 million reduction due
to overall lower volumes, primarily in the Hawaii trade.
Total Hawaii container volume was down
9 percent in 2008 compared with 2007, reflecting a broad-based decline in demand
caused by the continuing softness in Hawaii’s economy. Matson’s Hawaii
automobile volume for the year was 22 percent lower than 2007, also reflecting
economic weakness that is negatively impacting new car shipments from
manufacturers to Hawaii auto dealers and rental car companies. China container
volume decreased 7 percent in 2008, compared with 2007, principally due to
weaker U.S. economic conditions that are slowing the demand for container
imports. Guam container volumes decreased 5 percent, also due to economic
weakness in the service, as well as reductions in the eastbound garment
production and military cargo.
Operating profit decreased $20.7
million, or 16 percent, in 2008 compared to 2007. This decrease was primarily
the result of a net overall volume decrease described above, and from the
following operating expense changes, which offset revenue increases. Vessel
costs increased by a net $48.5 million due principally to higher direct and
indirect fuel costs, higher repair costs, and higher dry-dock expenses,
partially offset by fleet optimization initiatives that resulted in fewer
operating vessel days in line with the lower volumes in the Hawaii service.
Terminal handling costs increased by $15.4 million, principally the result of
higher contractual stevedoring rates. The expense increases were partially
offset by reduced transportation expenses of $10.9 million due to lower usage of
third-party inter-island barge services and $4.5 million in lower operations
overhead costs, principally resulting from lower westbound container
repositioning expenses. Additionally, earnings from Matson’s SSAT joint venture
contributed $5.5 million less in 2008 compared with 2007 due to lower volumes
and higher operating expenses. Earnings from joint ventures are not included in
revenue, but are included in operating profit.
Logistics
Services; 2009
compared with 2008
|
(dollars
in millions)
|
2009
|
2008
|
Change
|
||||||
|
Intermodal
revenue
|
$
|
188.0
|
$
|
271.0
|
-31
|
%
|
|||
|
Highway
revenue
|
132.9
|
165.0
|
-19
|
%
|
|||||
|
Total
Revenue
|
$
|
320.9
|
$
|
436.0
|
-26
|
%
|
|||
|
Operating
profit
|
$
|
6.7
|
$
|
18.5
|
-64
|
%
|
|||
|
Operating
profit margin
|
2.1
|
%
|
4.2
|
%
|
|||||
Logistics Services revenue decreased
$115.1 million, or 26 percent, in 2009 compared with 2008. This decrease was
principally due to lower Intermodal and Highway volume, which decreased by 19
percent and 6 percent, respectively, as well as lower Intermodal and Highway
rates driven primarily by lower fuel surcharges and competitive pricing
pressures. The reduction in Highway volume is reflective of a general softening
in the Highway market as a result of the U.S. recession. The reduction in
Intermodal volumes, while also impacted by the U.S. recession, was also impacted
by competitive actions resulting from direct agreements between steamship lines
and rail providers. The decrease in Highway revenue was partially offset by
MGDS’s warehousing operations revenue, which was $14.5 million higher than the
prior year. MGDS’s revenue increase in 2009 was primarily due to the acquisition
of PACAM in the third quarter of 2008.
Logistics Services operating profit
decreased $11.8 million, or 64 percent, in 2009 compared with 2008. Operating
profit decreased principally due to lower volume and rates previously cited, but
was also due to margin compression resulting from excess capacity in the market.
These factors were partially offset by lower general and administrative expenses
as a result of cost containment initiatives in 2009.
Logistics
Services; 2008
compared with 2007
|
(dollars
in millions)
|
2008
|
2007
|
Change
|
||||||
|
Intermodal
revenue
|
$
|
271.0
|
$
|
280.2
|
-3
|
%
|
|||
|
Highway
revenue
|
165.0
|
153.3
|
8
|
%
|
|||||
|
Total
Revenue
|
$
|
436.0
|
$
|
433.5
|
1
|
%
|
|||
|
Operating
profit
|
$
|
18.5
|
$
|
21.8
|
-15
|
%
|
|||
|
Operating
profit margin
|
4.2
|
%
|
5.0
|
%
|
|||||
Logistics Services revenue increased
$2.5 million, or 1 percent, in 2008 compared with 2007. The increase was
principally due to $13.4 million of revenue related to the commencement of
MGDS’s warehousing operations in the second quarter of 2008 and the acquisition
of PACAM during the third quarter of 2008. This increase was partially offset by
a $9.2 million decrease in Intermodal revenue and a $1.7 million decrease in
Highway brokerage revenue. The decrease in Intermodal revenue was principally
the result of a 12 percent reduction in volumes, which is reflective of a
general softening in the Intermodal market driven, in part, by declines in U.S.
import cargo. Highway volumes decreased 8 percent due to the loss of agents and
greater market softness in certain agents’ business segments.
Logistics Services operating profit
decreased $3.3 million, or 15 percent, in 2008 compared with 2007. The decrease
in operating profit was due to a number of factors, including: lower aggregate
volumes; lower provision for bad debt in 2007; and higher general and
administrative expenses as a result of the commencement of MGDS’s operations
referenced above. These factors were partially offset by higher yields, and the
contribution related to the commencement of MGDS’s Savannah warehouse operations
in 2008.
Real
Estate Industry
Real estate leasing and sales revenue
and operating profit are analyzed before subtracting amounts related to
discontinued operations. This is consistent with how the Company’s
management evaluates and makes decisions regarding capital allocation,
acquisitions, and dispositions for the Company’s real estate
businesses. A discussion of discontinued operations for the real
estate business is included separately.
Effect of Property Sales Mix on
Operating Results: Direct year-over-year comparison of the real
estate sales results may not provide a consistent, measurable barometer of
future performance because results from period to period are significantly
affected by joint venture income and the mix of property sales. Operating
results, by virtue of each project’s asset class, geography, and timing, are
inherently episodic. Earnings from joint venture investments are not included in
segment revenue, but are included in operating profit. The mix of real estate
sales in any year or quarter can be diverse and can include developed
residential real estate, commercial properties, developable subdivision lots,
undeveloped land, and property sold under threat of condemnation. The sale of
undeveloped land and vacant parcels in Hawaii generally provides a greater
relative contribution to earnings than does the sale of developed and commercial
property, due to the low historical-cost basis of the Company’s Hawaii
land.
Consequently, real estate sales
revenue trends, cash flows from the sales of real estate, and the amount of real
estate held for sale on the balance sheets, do not necessarily indicate future
profitability trends for this segment. Additionally, the operating profit
reported in each period does not necessarily follow a percentage of sales trends
because the cost basis of property sold can differ significantly between
transactions. The reporting of real estate sales is also affected by the
classification of certain real estate sales as discontinued
operations.
Leasing; 2009 compared with
2008
|
(dollars
in millions)
|
2009
|
2008
|
Change
|
||||||
|
Revenue
|
$
|
103.2
|
$
|
107.8
|
-4
|
%
|
|||
|
Operating
profit
|
$
|
43.2
|
$
|
47.8
|
-10
|
%
|
|||
|
Operating
profit margin
|
41.9
|
%
|
44.3
|
%
|
|||||
|
Average
Occupancy Rates:
|
|||||||||
|
Mainland*
|
85
|
%
|
95
|
%
|
|||||
|
Hawaii
|
95
|
%
|
98
|
%
|
|||||
|
Leasable
Space (million sq. ft.) - Improved
|
|||||||||
|
Mainland
|
7.0
|
6.6
|
6
|
%
|
|||||
|
Hawaii
|
1.3
|
1.3
|
--
|
%
|
|||||
* 2008
excluded Building B at Savannah Logistics Park (approximately 0.3 million square
feet), which was placed into service in March 2009.
Real Estate Leasing revenue for 2009
was 4 percent lower than the amount reported for 2008. The decrease was
principally due to lower mainland occupancies and rents, the partial
non-reinvestment of 1031 proceeds from the sale of Marina Shores that occurred
in the third quarter of 2008, and a final $1.4 million business interruption
insurance payment for a 2005 fire at Kahului Shopping Center that was received
in the first quarter of 2008. Occupancy for the mainland portfolio decreased 10
percentage points in 2009 as compared to 2008, primarily due to the placement of
Savannah Logistics Park Building B into service in March 2009 and the
acquisition of Republic Distribution Center subsequent to the second quarter of
2008, as well as a reduction in occupancy levels principally related to two
other industrial properties.
Operating profit was 10 percent lower
in 2009, compared with 2008, principally due to the same reasons cited for the
revenue decrease, but was also due to higher depreciation and amortization
expenses resulting from the increase in the lease portfolio’s depreciable basis
as proceeds from leased property sales under 1031 exchange transactions are
reinvested. Depreciation expenses are expected to continue to increase as
tax-deferred proceeds from sales of commercial properties with lower depreciated
bases are reinvested in commercial properties at a higher relative book
basis.
Leasable space increased in 2009
compared with 2008, principally due to the following activity:
|
Acquisitions
|
Dispositions
|
|||||
|
Date
|
Property
|
Leasable
sq. ft
|
Date
|
Property
|
Leasable
sq. ft
|
|
|
2-09
|
Activity
Distribution Center (CA)
|
252,300
|
3-09
|
Southbank
II (AZ)
|
120,800
|
|
|
3-09
|
Waipio
Industrial Court (HI)
|
158,400
|
6-09
|
Hawaii
Business Park (HI)
|
85,200
|
|
|
3-09
|
Savannah
Logistics Park Bldg. B* (GA)
|
324,800
|
9-09
|
San
Jose Avenue Warehouse (CA)
|
126,000
|
|
|
8-09
|
Northpoint
Industrial (CA)
|
119,400
|
10-09
|
Pacific
Guardian Tower (HI)
|
130,600
|
|
|
9-09
|
Waipio
Shopping Center (HI)
|
113,800
|
12-09
|
Village
at Indian Wells (CA)
|
104,600
|
|
|
12-09
|
Firestone
Boulevard Building (CA)
|
28,100
|
||||
*
Savannah Logistics Park Building B was acquired in 2008, but placed into service
in March 2009
Savannah Logistics Park (Building A and
a portion of Building B) is leased to MGDS, a wholly-owned subsidiary of MIL.
Accordingly, the revenues and expenses related to the intercompany lease
transaction between Real Estate Leasing and MGDS, respectively, are eliminated
in consolidation, but are shown at their gross amounts for segment purposes. The
revenue and expense recorded by Real Estate Leasing and MGDS was approximately
$3.3 million in 2009 and $2.2 million in 2008. In a separate transaction, MGDS
contracted with third parties to provide warehousing and storage services
utilizing all of Building A, in the second quarter of 2008, and a portion of
Building B in the fourth quarter of 2009.
Leasing; 2008 compared with
2007
|
(dollars
in millions)
|
2008
|
2007
|
Change
|
||||||
|
Revenue
|
$
|
107.8
|
$
|
108.5
|
-1
|
%
|
|||
|
Operating
profit
|
$
|
47.8
|
$
|
51.6
|
-7
|
%
|
|||
|
Operating
profit margin
|
44.3
|
%
|
47.6
|
%
|
|||||
|
Average
Occupancy Rates:
|
|||||||||
|
Mainland
|
95
|
%
|
97
|
%
|
|||||
|
Hawaii
|
98
|
%
|
98
|
%
|
|||||
|
Leasable
Space (million sq. ft.) - Improved
|
|||||||||
|
Mainland
|
6.6
|
5.2
|
27
|
%
|
|||||
|
Hawaii
|
1.3
|
1.4
|
-7
|
%
|
|||||
Real Estate Leasing revenue for 2008
was 1 percent lower than the amount reported for 2007. The decrease was
principally due to lower mainland occupancy, partially offset by the net
improvement resulting from acquisitions and dispositions activity. Revenue from
the acquisitions of Heritage Business Park in November 2007, Savannah Logistics
Park (Building A) in February 2008, Republic Distribution Center in September
2008, and the Midstate 99 Distribution Center in November 2008 (buildings 2 and
4) and December 2008 (buildings 1 and 3), partially offset lower revenue due to
the sale of several properties, which included the sales of Boardwalk Shopping
Center in Texas, Marina Shores Shopping Center in California, Venture Oaks in
California, and several improved properties and unimproved parcels on Maui, in
August, September, November, and December 2008, respectively. Additionally, the
decrease in leasing revenue was partially due to the net effect of $1.7 million
of favorable nonrecurring items recorded in 2007 partially offset by a final
$1.4 million business interruption insurance payment for a 2005 fire at Kahului
Shopping Center that was received in the first quarter of 2008.
Operating profit was 7 percent lower
in 2008, compared with 2007, principally due to higher depreciation and
amortization expense and lower mainland occupancy related to higher-margin
office properties, partially offset by lower general and administrative costs.
Depreciation expenses increased primarily due to the sale of a non-depreciable
asset (land that was ground leased to a retail tenant) in 2007, and the
subsequent tax-deferred reinvestment of these sale proceeds into depreciable
commercial property.
Leasable space increased by a net 1.3
million square feet in 2008 compared with 2007, due principally to the
acquisitions of Savannah Logistics Park, Republic Distribution Center, and the
Midstate 99 Distribution Center previously cited.
Real-Estate
Sales; 2009
compared with 2008 and 2007
|
(dollars
in millions)
|
2009
|
2008
|
2007
|
|||||||||
|
Hawaii
improved
|
$
|
50.9
|
$
|
21.8
|
$
|
83.4
|
||||||
|
Mainland
improved
|
48.7
|
81.8
|
6.8
|
|||||||||
|
Hawaii
development sales
|
6.0
|
217.4
|
14.9
|
|||||||||
|
Hawaii
unimproved/other
|
20.0
|
29.2
|
12.7
|
|||||||||
|
Total
Revenue
|
$
|
125.6
|
$
|
350.2
|
$
|
117.8
|
||||||
|
Operating
profit before joint ventures
|
$
|
39.1
|
$
|
86.6
|
$
|
51.8
|
||||||
|
Earnings
from joint ventures
|
--
|
9.0
|
22.6
|
|||||||||
|
Total
Operating Profit
|
$
|
39.1
|
$
|
95.6
|
$
|
74.4
|
||||||
|
Operating
profit margin
|
31.1
|
%
|
27.3
|
%
|
63.2
|
%
|
||||||
The lower revenue and operating profit
results in 2009 were due to the mix and timing of real estate sales in 2009
compared with 2008, as well as the treatment of income earned from the Company’s
joint ventures. The composition of these sales is described below.
2009:
Real Estate Sales revenue included the sale of seven residential units at the
Company’s Keola La’i high-rise development on Oahu, three mainland properties
(office, retail, industrial), an office building and an industrial facility on
Oahu, a 214-acre agricultural parcel on Maui, several leased fee parcels and
other land parcels on Maui, and two single-family homes on Kauai. Joint venture
income from completed development projects, principally related to Bridgeport
and Centre Point retail/office developments in Valencia, California, were offset
by the Company’s share of marketing and other operating expenses of its
Kukui’ula development projects. Additionally, the Company recorded a $2.5
million impairment loss related to its investment in its Ka Milo joint venture
project.
2008: Real Estate Sales revenue
included the sale of 330 residential units and two commercial units at the
Company’s Keola La’i high-rise development in Honolulu, two mainland shopping
centers, one mainland office property, the Kahului Town Terrace rental project,
three improved Maui properties, a 130-acre agricultural parcel on Maui, several
leased fee parcels and other land parcels on Maui, and 30 Keala’ula
single-family homes on Kauai. Operating profit included joint venture income of
$9.0 million, principally related to sales at the Company’s Kai Malu residential
development on Maui and the sale of several buildings at the Company’s Centre
Pointe retail/office development in Valencia, California, partially offset by
the Company’s share of marketing and other operating expenses of its Kukui’ula
projects. Real Estate Sales operating profit for 2008 included $7.7 million,
representing a final insurance settlement for the 2005 fire at Kahului Shopping
Center that was received in the first quarter of 2008. Finally, the Company
recorded a $3 million impairment loss related to its investment in its Santa
Barbara joint venture project.
2007: Real Estate Sales revenue
included the sale of a four-acre land parcel ground leased to a retail tenant in
Honolulu, two retail centers on Maui, two small commercial buildings on a
four-acre land parcel on Maui sold to the State of Hawaii, a commercial property
in California, the final payment on an installment sale of an agricultural
parcel on Kauai, and a commercial parcel on Maui. Closings also commenced on a
single-family residential development on Kauai. Operating profit included the
margin on the sales referenced above as well as $22.6 million of joint venture
earnings, principally representing the results from the Company’s Kai Malu and
Valencia joint venture projects, partially offset by the Company’s share of
marketing and other operating expenses of its Kukui’ula joint venture
project.
Discontinued
Operations;
Real-Estate –
The revenue, operating profit, and after-tax effects of discontinued
operations for 2009, 2008 and 2007 were as follows (in millions, except
per-share amounts):
|
2009
|
2008
|
2007
|
||||||||||
|
Sales
Revenue
|
$
|
109.6
|
$
|
125.4
|
$
|
94.8
|
||||||
|
Leasing
Revenue
|
$
|
14.6
|
$
|
26.1
|
$
|
35.4
|
||||||
|
Sales
Operating Profit
|
$
|
44.3
|
$
|
55.0
|
$
|
50.8
|
||||||
|
Leasing
Operating Profit
|
$
|
8.0
|
$
|
14.3
|
$
|
20.4
|
||||||
|
After-tax
Earnings
|
$
|
32.3
|
$
|
43.1
|
$
|
44.3
|
||||||
|
Basic
Earnings Per Share
|
$
|
0.79
|
$
|
1.04
|
$
|
1.04
|
||||||
|
Diluted
Earnings Per Share
|
$
|
0.79
|
$
|
1.04
|
$
|
1.03
|
||||||
2009: The revenue and
expenses of Hawaii Business Park, an industrial property on Oahu, Southbank II,
an office building in Arizona, San Jose Avenue Warehouse, an industrial property
in California, Pacific Guardian Tower, an office property on Oahu, Village at
Indian Wells, an office property in California, and various parcels on Maui have
been classified as discontinued operations. Additionally, a retail property on
Oahu was classified as discontinued operations.
2008: The revenue and
expenses of two retail properties on the mainland, one mainland office property,
a multi-tenant residential rental property, three commercial properties on Maui,
land previously leased to a telecommunications tenant on Maui, and several land
parcels on Maui, and have been classified as discontinued
operations.
2007: The revenue and
expenses of land leased to a retail tenant on Oahu, several commercial
properties on Maui, a leased fee parcel on Maui, and a commercial property in
California have been classified as discontinued operations.
Agribusiness
The
Company’s Hawaiian Commercial & Sugar Company division and Gay &
Robinson (“G&R”) were members in Hawaiian Sugar & Transportation
Cooperative (“HS&TC”), a cooperative that provides raw sugar marketing and
transportation services to its members. In the fourth quarter of 2009, G&R
ceased production of raw sugar. As a result, G&R’s membership in the
cooperative terminated because a cooperative member must be an active producer.
Consequently, upon G&R’s withdrawal, the Company became the sole member in
HS&TC and consolidated HS&TC beginning December 1, 2009 in
accordance with FASB ASC Topic 810 related to consolidation.
The
identifiable assets and liabilities from HS&TC were recorded based upon
their estimated fair values at December 1, 2009. Approximately $5 million of
identifiable assets, net of liabilities, measured at fair value, was recorded as
a gain and classified as Other Income (Expense) in the consolidated statements
of income.
Agribusiness; 2009 compared with
2008
|
(dollars
in millions)
|
2009
|
2008
|
Change
|
||||||
|
Revenue
|
$
|
107.0
|
$
|
124.3
|
-14
|
%
|
|||
|
Operating
loss
|
$
|
(27.8
|
)
|
$
|
(12.9
|
)
|
-2
|
X
|
|
|
Tons
sugar produced
|
126,800
|
145,200
|
-13
|
%
|
|||||
Agribusiness revenue decreased $17.3
million in 2009 compared with 2008. The decrease was primarily due to a $16.6
million reduction in power revenue stemming from lower power prices and volume
and $9.2 million in lower raw sugar sales volume, partially offset by a $5.4
million non-operating gain recognized upon consolidation of HS&TC and
$3.4 million in higher specialty sugar volume. Power prices, which
decreased by more than 50 percent compared to the prior year, are determined by
an avoided cost calculation for the public utilities in Hawaii, and have been
negatively impacted by a reduction in fossil fuel costs as well as a regulatory
change in the avoided cost formula.
Operating loss increased $14.9 million
in 2009 compared with 2008. The increase in operating loss was
primarily due to $18.8 million reduction in power sales margin resulting from
lower sales prices and volume and higher boiler fuel consumption and prices. The
increase in operating loss was partially offset by a $5.4 million non-operating
gain recorded upon consolidation of HS&TC.
Sugar production in 2009 was 13 percent
lower than in 2008 due to the ongoing effects of severe drought conditions in
2007-2008. Additionally, fewer acres were harvested in 2009 to allow growing
cane to mature more fully before harvest. The average revenue per ton of sugar
for 2009 was $352, or 1 percent lower than the average revenue per ton of $355
in 2008.
Approximately 73 percent of the
Company’s sugar production was sold to Hawaiian Sugar & Transportation
Cooperative (“HS&TC”) during 2009 under a marketing contract. The remainder
was sold as specialty sugar. HS&TC sells its raw sugar to C&H Sugar
Company, Inc. at a price equal to the New York No. 16 Contract settlement price,
less a discount and less costs for sugar vessel discharge and stevedoring. This
price, after deducting the marketing, operating, distribution, transportation
and interest costs of HS&TC, reflects the gross revenue to the Company. In
2009, HS&TC entered into a new contract for the delivery and sale of raw
sugar with C&H Sugar Company, Inc., which replaced the contract that was set
to expire in December 2009. The new contract was executed in October 2009 and
has 3-year term.
Agribusiness; 2008 compared with
2007
|
(dollars
in millions)
|
2008
|
2007
|
Change
|
|||||
|
Revenue
|
$
|
124.3
|
$
|
123.7
|
--
|
%
|
||
|
Operating
profit (loss)
|
$
|
(12.9
|
)
|
$
|
0.2
|
NM
|
||
|
Tons
sugar produced
|
145,200
|
164,500
|
-12
|
%
|
||||
Agribusiness revenue increased $0.6
million in 2008 compared with 2007. The increase was principally due to $6.1
million in higher power prices and volumes, $4.6 million in higher specialty
sugar sales volumes, and $1.5 million in higher raw sugar prices, partially
offset by $8.8 million in lower raw sugar sales volumes and $2.9 million in
lower revenue from soil and molasses sales.
Operating loss for 2008 was $12.9
million compared with an operating profit of $0.2 million for
2007. The operating loss was primarily due to $14.9 million in lower
sugar margins that were the result of lower production volumes and higher
operating costs than 2007, $1.6 million in lower soil sales, $1.5 million in
lower profits from other operations and $1.2 million in lower molasses sales
prices. This unfavorable variance was partially offset by $6.1 million in higher
power revenue from higher prices.
Compared with 2007, sugar production in
2008 was 12 percent, or 19,300 tons, lower due to lower yields. Lower sugar
yields were principally the result of extended drought conditions. The average
revenue per ton of sugar for 2008 was $355, or 4 percent higher than the average
revenue per ton of $342 in 2007.
LIQUIDITY
AND CAPITAL RESOURCES
Overview: The Company has a
$325 million revolving credit facility, which expires in December 2011. As of
December 31, 2009, the Company had approximately $281 million of available
capacity under the facility. Additionally, as of December 31, 2009, the Company
had access to approximately $71 million of remaining capacity on a $400 million
term facility, under which the ability to draw additional amounts under the
facility expires in April 2012, and $74 million of remaining capacity on a
facility that expires in June 2015. The Company has discussed credit
availability with its lenders and currently believes that its lenders are able
and willing to lend pursuant to the terms of the respective credit facilities.
Additionally, the Company is currently in compliance with all of its covenants
under its debt agreements. As a result, the Company believes its ability to
access cash under its facilities will be adequate to meet anticipated future
cash requirements to fund working capital, capital expenditures, dividends,
potential acquisitions, stock repurchases, and other cash needs for the
foreseeable future. There can be no assurance, however, that the Company will
continue to generate cash flows at or above current levels or that it will be
able to maintain its ability to borrow under its available credit
facilities.
While Matson is subject to restrictions
on the transfer of net assets to A&B under certain debt agreements, these
restrictions have not had any effect on the Company’s shareholder dividend
policy, and the Company does not anticipate that these restrictions will have
any impact in the future. At December 31, 2009, the amount of net assets of
Matson that may not be transferred to the Company was approximately $286
million.
On January 29, 2009, the Company
committed to a fourth series of senior promissory notes, Series D notes,
totaling $100 million under its Prudential facility more fully described in Note
7 to the Consolidated Financial Statements. The notes carry interest at an
annual fixed-rate of 6.9 percent with a final maturity on March 9, 2020.
Interest is paid semi-annually and the principal under the note will be repaid
in annual installments commencing in March 2012.
Cash Flows: Cash
flows provided by operating activities continue to be the Company’s most
significant source of liquidity. Cash flows from operating activities totaled
$115 million for 2009, $275 million for 2008, and $124 million for 2007. The
decrease in 2009 over 2008 was due principally to proceeds from the sale of 330
residential units and two commercial units at the Company’s Keola La’i
condominium project in 2008 and lower Agribusiness and Matson earnings in 2009.
The increase in 2008 over 2007 was due principally to proceeds from the sale of
units at Keola La’i previously mentioned, lower 2008 spending on real estate
development inventory, partially offset by lower 2008 Agribusiness and Matson
earnings and higher 2008 income tax payments.
Cash flows used in investing activities
were $31 million for 2009, $149 million for 2008, and $145 million for 2007. Of
the 2009 amount, $31 million was for capital expenditures, including $14 million
related to real estate investments, $13 million related to the purchase of
transportation-related assets, and $4 million principally related to routine
replacements for agricultural operations. Other cash flows used in investing
activities included $48 million related principally to additional investments in
joint venture projects. These cash outflows were offset by $32 million in cash
proceeds received that were primarily related to property sales, $10 million due
principally to the consolidation of HS&TC, and $6 million principally
related to distributions from joint ventures. The cash used in investing
activities for 2009 excludes $95 million of 1031 tax-deferred purchases since
the Company did not actually take control of the cash during the exchange
period.
Of the 2008 amount, $109 million was
for capital expenditures, including $54 million related to real estate
investments, such as the reverse 1031 acquisition of Savannah Logistics Center
and other leasing portfolio improvements, $38 million related to the purchase of
transportation-related assets, and $15 million principally related to routine
replacements for agricultural operations. Other cash flows used in investing
activities included $41 million related to additional investments in joint
venture projects, and $24 million for the acquisition of PACAM. These cash
outflows were partially offset by $27 million in cash proceeds received that
were primarily related to property sales. The $149 million of cash used in
investing activities for 2008 excludes $46 million of 1031 tax-deferred
purchases since the Company did not actually take control of the cash during the
exchange period. Additionally, expenditures for real estate held-for-sale are
excluded from capital expenditures and included in Cash Flows from Operating
Activities because they are considered an operating activity of the
Company.
Of the 2007 amount, $122 million was
for capital expenditures that included $68 million for the purchase of
transportation-related assets, $34 million for real estate leasing and property
improvements (excluding non-cash 1031 transactions and real estate development
activity), and $20 million related to agricultural operations, primarily for the
expansion of specialty sugar facilities. The $122 million for 2007 excludes $91
million of 1031 tax-deferred purchases since the Company did not actually take
control of the cash during the exchange period.
In
2010, the Company expects that its required minimum capital expenditures will
approximate the amount required in 2009. However, in 2010, the Company’s total
capital budget is expected to be approximately $335 million, which includes
spending for new, but currently unidentified, investment opportunities as well
as expenditures for real estate developments and currently unidentified 1031
lease portfolio acquisitions that are not included in the caption entitled
“Capital expenditures for property and developments” under investing activities
in the statement of cash flows. These real estate expenditures are excluded from
“Capital expenditures for property and developments” because the expenditures
either relate to the Company’s real estate held-for-sale inventory that is
treated as an operating activity, and therefore, reflected in operating cash
flows, or are expenditures that are made using tax-deferred proceeds from prior
tax-deferred sales, and therefore, reflected as non-cash activities (since the
Company does not take control of the cash during the exchange period).
Approximately $130 million of the total projected capital budget relate to
ongoing real estate development and maintenance capital, including the Company’s
Kukui’ula project, approximately $130 million relate to currently unidentified
1031 lease portfolio acquisitions, and approximately $75 million relate to
currently unidentified real estate development opportunities. The $205 million
budgeted for capital expenditures related to currently unidentified investments
will be highly dependent on the identification of attractive investment
opportunities. However, should these investment opportunities arise, the Company
believes it has adequate sources of liquidity to fund these
investments.
Cash flows used in financing activities
for 2009 totaled $87 million, compared with $124 million and $7 million used in
2008 and 2007, respectively. The decrease in cash used in financing activities
for 2009, relative to 2008, was principally due to 2008 share repurchases
totaling approximately $59 million, partially offset by a net reduction in debt
of $34 million in 2009 compared with a net decrease in debt of $16 million in
2008. The increase in cash used in financing activities for 2008, relative to
2007, was principally due to a net reduction in debt of $16 million in 2008
compared with a net increase in debt of $66 million in 2007, share repurchases
totaling approximately $59 million, compared with approximately $33 million for
2007, and $3 million in higher dividends in 2008.
In December 2009, the Company’s board
of directors authorized the repurchase of up to two million shares of its common
stock in the open market, in privately-negotiated transactions or by other
means. The authorization expires on December 31, 2011. In 2009, the Company did
not repurchase shares of its common stock. In 2008, A&B purchased 1,476,449
shares of its common stock on the open market at an average price of $40.33, a
portion of which was purchased under a previous share authorization that expired
December 31, 2009.
Other Sources of
Liquidity: Additional sources of liquidity for the Company
consisted of cash and cash equivalents, receivables, sugar and coffee
inventories that totaled approximately $215 million at December 31, 2009, an
increase of $20 million from December 31, 2008. This net increase was due
primarily to $14 million in higher sugar and coffee inventories and $9 million
in higher account receivables balances, partially offset by $3 million in lower
cash balances.
The Company also has various revolving
credit and term facilities that provide additional sources of liquidity for
working capital requirements or investment opportunities on a short-term as well
as longer-term basis. Total debt was $471 million at the end of 2009 compared
with $504 million at the end of 2008. As of December 31, 2009, available
borrowings under these facilities, which are more fully described below, totaled
$426 million.
The Company has a replenishing $400
million three-year unsecured note purchase and private shelf agreement with
Prudential Investment Management, Inc. and its affiliates (collectively,
“Prudential”) under which the Company may issue notes in an aggregate amount up
to $400 million, less the sum of all principal amounts then outstanding on any
notes issued by the Company or any of its subsidiaries to Prudential and the
amounts of any notes that are committed under the note purchase agreement. The
ability to draw additional amounts under the facility expires in April 2012. On
January 29, 2009, A&B committed to a fourth series of senior promissory
notes, Series D notes, totaling $100 million under the facility, as more fully
described in Note 7 to the consolidated financial statements. The notes carry
interest at an annual fixed-rate of 6.9 percent with a final maturity on March
9, 2020. Interest is paid semi-annually and the principal under the note will be
repaid in annual installments commencing in March 2012. At December 31, 2009,
approximately $71 million was available under the facility.
The Company has two revolving senior
credit facilities with six commercial banks that expire in December 2011. The
revolving credit facilities provide for an aggregate commitment of $325 million,
which consists of $225 million and $100 million facilities for A&B and
Matson, respectively. Amounts drawn under the facilities bear interest at London
Interbank Offered Rate (“LIBOR”) plus a spread ranging from 0.225 percent to
0.475 percent based on
the Company’s S&P rating. At December 31, 2009, $34 million was outstanding
and classified as current, $10 million in letters of credit had been issued
against the facilities, and $281 million remained available for
borrowing.
Matson has a $105 million secured
reducing revolving credit agreement with DnB NOR Bank ASA and ING Bank N.V.
which provides for a 10-year commitment beginning in June 2005. The maximum
amount that can be outstanding under the facility declines in eight annual
commitment reductions of $10.5 million each, commencing on the second
anniversary of the closing date. The incremental cost to borrow under the
facility is 0.225 percent above LIBOR through June 2010. For the remaining term,
the incremental borrowing rate is 0.300 percent over LIBOR. As of December 31,
2009, no amount was outstanding under the facility and approximately $74 million
remained available.
The Company’s ability to access
its credit facilities is subject to its compliance with the terms and conditions
of the credit facilities, including financial covenants. The financial covenants
require the Company to maintain certain financial covenants, such as minimum
consolidated shareholders’ equity and maximum debt to EBITDA ratios. At December
31, 2009, the Company was in compliance with all such covenants. While there can
be no assurance that the Company will remain in compliance with its covenants,
the Company expects that it will remain in compliance. Credit facilities are
more fully described in Note 7 to the Consolidated Financial
Statements.
The
Company’s and Matson’s credit ratings from Standard and Poor’s (“S&P”) were
both BBB+ with a negative outlook, as indicated in an S&P research update
issued June 12, 2009. Factors that can impact the Company’s and Matson’s credit
ratings include changes in operating performance, the economic environment,
conditions in industries in which the Company has operations, and the Company’s
and Matson’s financial position. If a credit downgrade were to occur, it could
adversely impact, among other things, future borrowing costs and access to
capital markets.
Debt is maintained at levels the
Company considers prudent based on its cash flows, interest coverage ratio, and
percentage of debt to capital. From current levels, the Company expects its
leverage will remain at levels comparable to 2009.
Tax-Deferred Real Estate
Transactions: Sales – During 2009, sales
and condemnation proceeds that qualified for potential tax-deferral treatment
under the Internal Revenue Code Sections 1031 and 1033 totaled approximately
$116 million. The proceeds were generated primarily from the sales of Southbank
II, Pacific Guardian Tower, the Village at Indian Wells, Hawaii Business Park,
and San Jose Avenue Warehouse.
Purchases – During 2009, the
Company utilized $102 million in proceeds from tax-deferred sales. The
properties acquired with tax-deferred proceeds in 2009 included the purchase of
Activity Distribution Center, Waipio Industrial Court, North Point, Waipio
Shopping Center, and the Firestone Boulevard Building.
The proceeds from 1031 tax-deferred
sales are held in escrow pending future use to purchase new real estate assets.
The proceeds from 1033 condemnations are held by the Company until the funds are
redeployed. As of December 31, 2009, approximately $61 million of proceeds from
tax-deferred sales had not been reinvested, which includes $1 million that will
not be reinvested. The proceeds must be reinvested in qualifying property within
180 days from the date of the sale in order to qualify for tax deferral
treatment under section 1031 of the Internal Revenue Code.
The funds related to 1031 transactions
are not included in the Statement of Cash Flows but are included as non-cash
activities below the Statement. For “reverse 1031” transactions, the Company
purchases a property in anticipation of receiving funds from a future property
sale. Funds used for reverse 1031 purchases are included as capital expenditures
on the Statement of Cash Flows and the related sales of property, for which the
proceeds are linked, are included as property sales in the
Statement.
CONTRACTUAL
OBLIGATIONS, COMMITMENTS, CONTINGENCIES AND OFF-BALANCE SHEET
ARRANGEMENTS
Contractual
Obligations: At December 31, 2009, the Company had the
following estimated contractual obligations (in millions):
|
Payment
due by period
|
|||||||||||||||||||||
|
Contractual
Obligations
|
Total
|
2010
|
2011-2012
|
2013-2014
|
Thereafter
|
||||||||||||||||
|
Long-term
debt obligations
(including current
portion)
|
(a)
|
$
|
471
|
$
|
65
|
$
|
66
|
$
|
88
|
$
|
252
|
||||||||||
|
Estimated
interest on debt
|
(b)
|
154
|
24
|
44
|
34
|
52
|
|||||||||||||||
|
Purchase
obligations
|
(c)
|
19
|
10
|
7
|
2
|
--
|
|||||||||||||||
|
Post-retirement
obligations
|
(d)
|
40
|
3
|
8
|
8
|
21
|
|||||||||||||||
|
Non-qualified
benefit obligations
|
(e)
|
37
|
23
|
2
|
3
|
9
|
|||||||||||||||
|
Operating
lease obligations
|
(f)
|
87
|
14
|
25
|
23
|
25
|
|||||||||||||||
|
Total
|
$
|
808
|
$
|
139
|
$
|
152
|
$
|
158
|
$
|
359
|
|||||||||||
|
|
(a)
|
Long-term
debt obligations (including current portion) include principal repayments
of short-term and long-term debt as described in Note 7 to the
Consolidated Financial Statements. Short-term debt includes amounts
borrowed under revolving credit facilities, and therefore, the revolving
debt balances could be rolled over through December 2011. However, these
revolving debt balances have been reflected as payments due in
2010.
|
|
|
(b)
|
Estimated
cash paid for interest on debt is determined based on (1) the stated
interest rate for fixed debt and (2) the rate in effect on December 31,
2009 for variable rate debt. Because the Company’s variable rate date may
be rolled over, actual interest may be greater or less than the amounts
indicated.
|
|
|
(c)
|
Purchase
obligations include only non-cancellable contractual obligations for the
purchases of goods and services. Arrangements are considered purchase
obligations if a contract specifies all significant terms, including fixed
or minimum quantities to be purchased, a pricing structure and approximate
timing of the transaction. Any amounts reflected on the consolidated
balance sheet as accounts payable and accrued liabilities are excluded
from the table above.
|
|
|
(d)
|
Post-retirement
obligations include expected payments to medical service providers in
connection with providing benefits to the Company’s employees and
retirees. The $21 million noted in the column labeled “Thereafter”
comprises estimated benefit payments for 2015 through 2019.
Post-retirement obligations are described further in Note 9 to the
Consolidated Financial Statements. The obligation for pensions reflected
on the Company’s consolidated balance sheet is excluded from the table
above because the Company is unable to estimate the timing and amount of
contributions.
|
|
|
(e)
|
Non-qualified
benefit obligations includes estimated payments to executives and
directors under the Company’s four non-qualified plans. The $9 million
noted in the column labeled “Thereafter” comprises estimated benefit
payments for 2015 through 2019. Additional information about the Company’s
non-qualified plans is included in Note 9 to the Consolidated Financial
Statements.
|
|
|
(f)
|
Operating
lease obligations include principally land, office and terminal
facilities, containers and equipment under non-cancelable, long-term lease
arrangements that do not transfer the rights and risks of ownership to the
Company. These amounts are further described in Note 8 to the Consolidated
Financial Statements.
|
The
Company has not provided a detailed estimate of the timing and amount of
payments related to uncertain tax position liabilities due to the uncertainty of
when the related tax settlements are due. At December 31, 2009, the Company’s
uncertain tax position liabilities totaled approximately $7
million.
Other Commitments and
Contingencies: A description of other commitments,
contingencies, and off-balance sheet arrangements, and incorporated herein by
reference, is described in Note 12 to the Consolidated Financial Statements of
Item 8 in this Form 10-K
BUSINESS
OUTLOOK
During
2009, the Hawaii economy continued to weaken as a result of macro-economic
trends that first affected U.S. Mainland and international markets. The weakness
in the Hawaii economy was reflected in various measures, most notably higher
unemployment and a reduction in real personal income. These declines were driven
by significantly lower levels of construction activity; significantly lower
occupancy levels at hotels; reduced visitor spending in the state; reduced
consumer demand for automobiles and other “big-ticket” discretionary items; and
reduction in real estate sales activity. For 2010, the Company expects that
economic conditions in Hawaii will begin to stabilize, but the Company does not
anticipate an appreciable return to growth in 2010.
While
economic conditions on the U.S. Mainland are expected to improve in 2010
relative to 2009, the Company expects that challenges will remain in markets in
which the Company operates, including: the Western U.S. where the Company has
commercial property and limited development interests; Asia-U.S. West Coast
trade lanes, upon which the Company’s international shipping and stevedoring
volumes are dependent; and throughout the U.S. Mainland, whose economic activity
drives logistics volume.
While
economic activity is not expected to improve markedly in the near-term, the
Company expects that the current economic environment will create additional
opportunities for growth. For example, the Company is seeing an increasing
number of real estate investment opportunities at more attractive prices that
could be pursued under the Company’s “Project X” real estate growth initiative.
In 2010, in addition to “Project X” initiatives, the Company expects to
reinvest, through 1031 exchanges, real estate sales proceeds, on a tax-deferred
basis, to acquire quality, income producing commercial properties. The Company
also anticipates it will invest in property development projects and joint
venture investments that meet its strict underwriting criteria. Additionally,
the Company will pursue further expansion of its product and service offerings
in its transportation businesses where it believes it can leverage its core
competencies.
The
Company is committed to maintaining its strong balance sheet. Beginning in 2008
and continuing through 2009, the Company implemented a series of company-wide
cost containment and capital reduction initiatives to preserve its financial
position and prepare its businesses for expected lower levels of economic
activity. These efforts included: fleet cost-reduction initiatives; deferral or
elimination of non-essential capital expenditures; non-union workforce
reductions; salary freezes; benefit and management incentive program reductions;
and mandatory furloughs and forced vacations in its sugar operations. These
actions have positioned the Company well and provide a stable platform to
benefit from a pickup in business activity as the economy recovers.
A
significant driver of the decline in reported earnings for the Company and its
operating units in 2009, as compared to 2008, was a significant year-over-year
negative shift in pension cost of $24 million, from pension income of $4 million
in 2008 to a net pension cost of $20 million in 2009. This non-cash cost is not
expected to change materially in 2010 as compared with 2009.
Transportation: Matson’s 2009
operating and financial performance was impacted by significant volume
contraction, principally in the Hawaii trade lane, as a result of deteriorating
economic conditions, as well as significant rate reductions in the China trade
lane. Matson has been able to offset a portion of the impact from these factors
through improved yields and better cargo mix in Hawaii and Guam, improved
efficiencies in its fleet and shore-side asset deployment, and implementation of
cost containment initiatives. Matson’s vessel utilization has improved steadily
throughout the year, stemming principally from a transition to a nine-fleet
deployment as well as the addition of a weekly call on the port of Xiamen,
China. These actions, along with aggressive cost containment activities, have
been an important factor in mitigating the impact of difficult economic
conditions. At SSAT, the Company’s joint venture that operates terminals on the
U.S. West Coast, previously expected benefits stemming from the addition of a
large customer in the summer of 2009 began to materialize during the second half
of 2009.
In 2010,
the Company expects that container volume in Hawaii will flatten as economic
conditions begin to stabilize. In Guam, the Company expects slight volume
expansion. Rates in both of these markets are expected to remain stable. In
China, volumes improved in the most recent quarter, but volatility in rates is
expected to continue as the amount of excess capacity in the market fluctuates
based on competing carrier actions. However, based on market trends seen since
January 1, 2010, Matson believes that some firming in China trade rates from the
lows in 2009 could occur during 2010, but the extent to which improved rates
will persist throughout the year is dependent largely upon the rate setting
process that will occur during the second quarter 2010 contracting season. The
potential benefit of China rate increases in the second half of 2010 may
positively impact the results in those quarters, offsetting likely negative
year-over-year comparisons in the first half of 2010. Volume and operating
profit at SSAT will continue to be impacted by reduced import volume from Asia
until demand for imports improves, but the reduced volume projections are
expected to be partially mitigated by the addition of a large customer in
mid-2009 and prior cost-cutting initiatives.
In 2009,
Matson Integrated Logistics experienced significantly lower volume and rate
levels, as compared to prior year’s levels, which was reflective of the general
economic contraction in the U.S., the excess capacity in the market, and
competitive actions resulting from direct agreements between steamship lines and
rail providers. This loss of intermodal volume may further impact MIL’s earnings
prospects in the future. In 2010, no significant demand improvement in the
industry is forecasted, although some volume improvement in certain of the
Company’s highway brokerage business is expected. Warehousing and distribution
revenue and volume are expected to increase in 2010 relative to 2009. The
Company remains focused both on organic growth opportunities and operational
efficiencies in its core logistics businesses while continuing to evaluate
potential acquisition candidates.
Real Estate: During
2009, occupancy levels in the Company’s commercial property portfolio declined,
relative to 2008, as economic activity slowed. Occupancy levels remained high in
Hawaii at 95 percent, but occupancy levels in the Company’s U.S. Mainland
commercial property portfolio declined to 85 percent from 95 percent in 2008.
Reduced mainland occupancy levels are primarily due to the addition of over
490,000 acquired and untenanted square feet at two logistics facilities, as well
as higher vacancies in two other industrial properties. In 2010, the Company
expects that occupancy levels will begin to stabilize, but also expects earnings
to be negatively impacted by continued rent pressures and higher lease
incentives while the economy recovers. Additionally, the Company will experience
higher depreciation levels in its portfolio as a result of recent acquisition
activity, which will further dampen 2010 operating profit. Other cash and
non-cash fixed costs, such as property taxes, are expected to have a
disproportionate negative impact to earnings if occupancy levels decline
further.
In 2009,
sales of commercial properties and land parcels were consummated at attractive
prices, despite a challenging market environment. These sales, which are cash
flow accretive, allow the Company to realize value created through appreciation
and the Company’s active property and asset management efforts. At the same
time, these sales allow for proceeds to be redeployed in assets offering higher
future appreciation potential with the added benefit of tax deferral through
1031 exchanges. In 2010, the Company expects to continue its 1031 exchange
program, but the timing, pricing and volume are difficult to forecast precisely
and will be influenced by the attractiveness of potential sales prices as well
as the return potential of the replacement property.
In 2010,
the Company expects to see an increase in real estate investment opportunities
that meet its underwriting criteria. Accordingly, the Company expects to
increase its placement of capital for the real estate segments relative to 2009.
In making these investments, the Company intends to focus primarily on
investment opportunities in Hawaii. However, the timing and scale of these
investments is not certain and will be dependent upon a number of factors,
including, but not limited to, return and risk thresholds, underlying
valuations, and the availability of alternative capital investment
opportunities.
In 2009,
unit sales activity for the Company’s residential development projects
(including joint ventures) declined significantly from levels experienced in
2008. In 2010, the Company expects that residential development sales activity
will remain suppressed. The Company will continue to vigorously pursue
entitlement, design and permitting at various projects, which will position the
Company well to meet demand that is expected to materialize over the longer-term
as the real estate markets recover.
Agribusiness: In 2009, the
Company’s Agribusiness operations generated significant losses due to reduced
power sales, low sugar production and higher non-cash pension expenses. Power
revenue was impacted by lower rates, stemming from lower crude oil prices and
from a mid-2008 public utility commission ruling that modified the avoided cost
formula, as well as by lower volume. In 2010, the Company expects that losses
will moderate significantly, primarily due to improved sugar pricing and
forecasted higher sugar production levels.
A
comprehensive review of the Company’s sugar operations led to a decision to
continue operations through 2010. This decision was based, among other
factors, primarily on the recent spike in sugar prices, as well as prospects
for increased sugar production. Continuation of operations beyond 2010,
however, remains subject to a favorable outcome in the water cases pending
before the State Commission on Water Resource Management, as well as other
factors, such as the Company’s ability to attain higher sugar production levels.
Favorable water rulings are critical to the long-term viability of the
plantation. Resolution of the water cases is expected in the first half of
2010.
OTHER
MATTERS
Management
Changes: The following management changes occurred during 2009
and through February 25, 2010.
On October 22, 2009, the Company
announced the retirement of W. Allen Doane, chairman of the board and chief
executive officer. Effective January 1, 2010, Stanley M. Kuriyama, A&B
president, succeeded Mr. Doane as chief executive officer. Mr.
Kuriyama was also named to serve on the A&B board of directors, effective
January 1, 2010. Mr. Doane will continue to serve A&B as a director. Walter
A. Dods, Jr., who had served as Lead Independent Director since 2006, became
chairman of the A&B board, also effective January 1, 2010.
G. Stephen Holaday retired from his
position as president, Agribusiness, where he held oversight responsibility for
A&B’s Kauai Coffee Company, Inc., Kahului Trucking & Storage, Inc., and
Kauai Commercial Company, Incorporated. His retirement was effective as of April
15, 2009.
Frank E. Kiger, formerly general
manager of Hawaiian Commercial & Sugar Company, retired effective June 1,
2009.
Christopher J. Benjamin was appointed
general manager, Hawaiian Commercial & Sugar Company, effective March 9,
2009, replacing Mr. Kiger. Mr. Benjamin also has assumed oversight
responsibilities for A&B’s other Agribusiness units and continues to serve
as senior vice president, chief financial officer and treasurer of Alexander
& Baldwin, Inc.
James S. Andrasick, chairman of the
board of Matson Navigation Company, Inc., retired effective August 31, 2009.
Stanley M. Kuriyama was appointed chairman of the board of Matson effective
September 1, 2009.
Robert C. Papworth, President of Matson
Integrated Logistics, Inc., retired effective December 1, 2009.
Robert K. Sasaki, Vice Chairman of
A&B Properties, Inc. retired effective January 1, 2010.
Kevin L. Halloran, vice president of
corporate development and investor relations of A&B, announced his
resignation, which will be effective February 28, 2010.
ITEM
7A. QUANTITATIVE AND QUALITATIVE DISCLOSURES ABOUT MARKET RISK
A&B is exposed to changes in
interest rates, primarily as a result of its borrowing and investing activities
used to maintain liquidity and to fund business operations. In order to manage
its exposure to changes in interest rates, A&B utilizes a balanced mix of
debt maturities, along with both fixed-rate and variable-rate debt. The nature
and amount of A&B’s long-term and short-term debt can be expected to
fluctuate as a result of future business requirements, market conditions, and
other factors.
The Company’s fixed rate debt consists
of $437 million in principal term notes. The Company’s variable rate debt
consists of $34 million under its revolving credit facilities. Other than in
default, the Company does not have an obligation to prepay its fixed-rate debt
prior to maturity and, as a result, interest rate fluctuations and the resulting
changes in fair value would not have an impact on the Company’s financial
condition or results of operations unless the Company was required to refinance
such debt. For the Company’s variable rate debt, a one percent increase in
interest rates would not have a material impact on the Company’s results of
operations.
The following table summarizes
A&B’s debt obligations at December 31, 2009, presenting principal cash flows
and related interest rates by the expected fiscal year of
repayment.
|
Expected
Fiscal Year of Repayment as of December 31, 2009 (dollars in
millions)
|
||||||||||||||||||||||||||||||||
|
Fair
Value at
|
||||||||||||||||||||||||||||||||
|
December
31,
|
||||||||||||||||||||||||||||||||
|
2010
|
2011
|
2012
|
2013
|
2014
|
Thereafter
|
Total
|
2009
|
|||||||||||||||||||||||||
|
Fixed
rate
|
$ | 31 | $ | 27 | $ | 39 | $ | 40 | $ | 48 | $ | 252 | $ | 437 | $ | 441 | ||||||||||||||||
|
Average
interest rate
|
5.68 | % | 5.74 | % | 5.77 | % | 5.79 | % | 5.81 | % | 5.73 | % | 5.75 | % | ||||||||||||||||||
|
Variable
rate
|
$ | 34 | $ | -- | $ | -- | $ | -- | $ | -- | $ | -- | $ | 34 | $ | 34 | ||||||||||||||||
|
Average
interest rate*
|
0.68 | % | -- | -- | -- | -- | -- | 0.68 | % | |||||||||||||||||||||||
* Estimated interest rates on variable
debt is determined based on the rate in effect on December 31, 2009. Actual
interest rates may be greater or less than the amounts indicated when variable
rate debt is rolled over.
From time-to-time, the Company may
invest its excess cash in short-term money market funds that purchase government
securities and/or corporate debt securities. At December 31, 2009, the Company
had a negligible amount invested in money market funds. These money market funds
maintain a weighted average maturity of less than 90 days, and accordingly, a
one percent change in interest rates is not expected to have a material impact
on the fair value of these investments or on interest income. Through its
Capital Construction Fund, the Company may, from time-to-time, invest in
mortgage-backed securities. At December 31, 2009 and 2008, these investments
were not material.
A&B has no material exposure to
foreign currency risks, although it is indirectly affected by changes in
currency rates to the extent that changes in rates affect tourism in Hawaii.
Transactions related to its China Service are primarily denominated in U.S.
dollars, and therefore, a one percent change in the renminbi exchange rate would
not have a material effect on the Company’s results of operations.
ITEM
8. FINANCIAL STATEMENTS AND SUPPLEMENTARY DATA
|
Page
|
|||
|
Management’s
Annual Report on Internal Control Over Financial Reporting
|
57
|
||
|
Report
of Independent Registered Public Accounting Firm
|
58
|
||
|
Consolidated
Statements of Income
|
59
|
||
|
Consolidated
Statements of Cash Flows
|
60
|
||
|
Consolidated
Balance Sheets
|
61
|
||
|
Consolidated
Statements of Shareholders’ Equity
|
62
|
||
|
Notes
to Consolidated Financial Statements
|
63
|
||
|
1.
|
Summary
of Significant Accounting Policies
|
63
|
|
|
2.
|
Discontinued
Operations
|
71
|
|
|
3.
|
Acquisitions
and Related-Party Transactions
|
71
|
|
|
4.
|
Investments
in Affiliates
|
72
|
|
|
5.
|
Property
|
75
|
|
|
6.
|
Capital
Construction Fund
|
75
|
|
|
7.
|
Notes
Payable and Long-Term Debt
|
76
|
|
|
8.
|
Leases
|
78
|
|
|
9.
|
Employee
Benefit Plans
|
79
|
|
|
10.
|
Income
Taxes
|
86
|
|
|
11.
|
Share-Based
Awards
|
87
|
|
|
12.
|
Commitments,
Guarantees and Contingencies
|
90
|
|
|
13.
|
Industry
Segments
|
94
|
|
|
14.
|
Quarterly
Information (Unaudited)
|
97
|
|
|
15.
|
Parent
Company Condensed Financial Information
|
99
|
|
MANAGEMENT’S
ANNUAL REPORT ON INTERNAL CONTROL OVER FINANCIAL REPORTING
The management of Alexander &
Baldwin, Inc. has the responsibility for establishing and maintaining adequate
internal control over financial reporting. Internal control over financial
reporting is defined in Rule 13a-15(f) and 15d-15(f) under the Securities
Exchange Act of 1934, as amended, as a process designed by, or under the
supervision of, the company’s principal executive and principal financial
officers and effected by the company’s board of directors, management and other
personnel to provide reasonable assurance regarding the reliability of financial
reporting and the preparation of financial statements for external purposes in
accordance with accounting principles generally accepted in the United States of
America and includes those policies and procedures that:
|
|
•
|
Pertain
to the maintenance of records that, in reasonable detail, accurately and
fairly reflect the transactions and dispositions of assets of the
company;
|
|
|
•
|
Provide
reasonable assurance that transactions are recorded as necessary to permit
preparation of financial statements in accordance with accounting
principles generally accepted in the United States of America, and that
receipts and expenditures of the company are being made only in accordance
with authorizations of management and directors of the company;
and
|
|
|
•
|
Provide
reasonable assurance regarding prevention or timely detection of
unauthorized acquisition, use or disposition of the company’s assets that
could have a material effect on the financial
statements.
|
Because of its inherent limitations,
internal control over financial reporting only provides reasonable assurance
with respect to financial statement presentation and preparation. Projections of
any evaluation of effectiveness to future periods are subject to the risks that
controls may become inadequate because of changes in conditions, or that the
degree of compliance with the policies or procedures may
deteriorate.
Management assessed the effectiveness
of the Company’s internal control over financial reporting as of December 31,
2009. In making this assessment, management used the criteria set forth by the
Committee of Sponsoring Organizations of the Treadway Commission (COSO) in Internal Control-Integrated
Framework. Based on its assessment, management believes that, as of
December 31, 2009, the Company’s internal control over financial reporting is
effective. The Company’s independent registered public accounting firm, Deloitte
& Touche LLP, has issued an audit report on the Company’s internal control
over financial reporting. That report appears on page 58 of this Form
10-K.
| /s/ Stanley M. Kuriyama | /s/ Christopher J. Benjamin |
|
Stanley
M. Kuriyama
|
Christopher
J. Benjamin
|
|
President
and Chief Executive Officer
|
Senior
Vice President, Chief Financial Officer
and Treasurer
|
|
February
25, 2010
|
February
25, 2010
|
REPORT
OF INDEPENDENT REGISTERED PUBLIC ACCOUNTING FIRM
To the
Board of Directors and Stockholders of
Alexander
& Baldwin, Inc.
Honolulu,
Hawaii
We have
audited the accompanying consolidated balance sheets of Alexander & Baldwin,
Inc. and subsidiaries (the "Company") as of December 31, 2009 and 2008, and the
related consolidated statements of income, stockholders' equity, and cash flows
for each of the three years in the period ended December 31, 2009. We
also have audited the Company's internal control over financial reporting as of
December 31, 2009, based on criteria established in Internal Control — Integrated
Framework issued by the Committee of Sponsoring Organizations of the
Treadway Commission. The Company's management is responsible for these financial
statements, for maintaining effective internal control over financial reporting,
and for its assessment of the effectiveness of internal control over financial
reporting, included in the accompanying Management’s Annual Report on
Internal Control Over Financial Reporting. Our responsibility is to
express an opinion on these financial statements and an opinion on the Company's
internal control over financial reporting based on our audits.
We
conducted our audits in accordance with the standards of the Public Company
Accounting Oversight Board (United States). Those standards require that we plan
and perform the audit to obtain reasonable assurance about whether the financial
statements are free of material misstatement and whether effective internal
control over financial reporting was maintained in all material respects. Our
audits of the financial statements included examining, on a test basis, evidence
supporting the amounts and disclosures in the financial statements, assessing
the accounting principles used and significant estimates made by management, and
evaluating the overall financial statement presentation. Our audit of internal
control over financial reporting included obtaining an understanding of internal
control over financial reporting, assessing the risk that a material weakness
exists, and testing and evaluating the design and operating effectiveness of
internal control based on the assessed risk. Our audits also included performing
such other procedures as we considered necessary in the circumstances. We
believe that our audits provide a reasonable basis for our
opinions.
A
company's internal control over financial reporting is a process designed by, or
under the supervision of, the company's principal executive and principal
financial officers, or persons performing similar functions, and effected by the
company's board of directors, management, and other personnel to provide
reasonable assurance regarding the reliability of financial reporting and the
preparation of financial statements for external purposes in accordance with
generally accepted accounting principles. A company's internal control over
financial reporting includes those policies and procedures that (1) pertain to
the maintenance of records that, in reasonable detail, accurately and fairly
reflect the transactions and dispositions of the assets of the company; (2)
provide reasonable assurance that transactions are recorded as necessary to
permit preparation of financial statements in accordance with generally accepted
accounting principles, and that receipts and expenditures of the company are
being made only in accordance with authorizations of management and directors of
the company; and (3) provide reasonable assurance regarding prevention or timely
detection of unauthorized acquisition, use, or disposition of the company's
assets that could have a material effect on the financial
statements
Because
of the inherent limitations of internal control over financial reporting,
including the possibility of collusion or improper management override of
controls, material misstatements due to error or fraud may not be prevented or
detected on a timely basis. Also, projections of any evaluation of the
effectiveness of the internal control over financial reporting to future periods
are subject to the risk that the controls may become inadequate because of
changes in conditions, or that the degree of compliance with the policies or
procedures may deteriorate.
In our
opinion, the consolidated financial statements referred to above present fairly,
in all material respects, the financial position of Alexander & Baldwin,
Inc. and subsidiaries as of December 31, 2009 and 2008, and the results of their
operations and their cash flows for each of the three years in the period ended
December 31, 2009, in conformity with accounting principles generally accepted
in the United States of America. Also, in our opinion, the Company maintained,
in all material respects, effective internal control over financial reporting as
of December 31, 2009, based on the criteria established in Internal Control — Integrated
Framework issued by the Committee of Sponsoring Organizations of the
Treadway Commission.
/s/ Deloitte & Touche
LLP
Honolulu,
Hawaii
February
25, 2010
ALEXANDER
& BALDWIN, INC.
CONSOLIDATED
STATEMENTS OF INCOME
(In
millions, except per-share amounts)
|
Year
Ended December 31,
|
||||||||||||
|
2009
|
2008
|
2007
|
||||||||||
|
Operating
Revenue:
|
||||||||||||
|
Ocean
transportation
|
$ | 887 | $ | 1,021 | $ | 1,003 | ||||||
|
Logistics
services
|
321 | 436 | 433 | |||||||||
|
Real
estate leasing
|
84 | 79 | 72 | |||||||||
|
Real
estate sales
|
16 | 225 | 23 | |||||||||
|
Agribusiness
|
97 | 119 | 120 | |||||||||
|
Total
operating revenue
|
1,405 | 1,880 | 1,651 | |||||||||
|
Operating
Costs and Expenses:
|
||||||||||||
|
Cost
of ocean transportation services
|
740 | 825 | 789 | |||||||||
|
Cost
of logistics services
|
280 | 381 | 381 | |||||||||
|
Cost
of real estate sales and leasing
|
59 | 229 | 47 | |||||||||
|
Cost
of agribusiness goods and services
|
130 | 133 | 120 | |||||||||
|
Selling,
general and administrative
|
154 | 163 | 165 | |||||||||
|
Total
operating costs and expenses
|
1,363 | 1,731 | 1,502 | |||||||||
|
Operating
Income
|
42 | 149 | 149 | |||||||||
|
Other
Income and (Expense):
|
||||||||||||
|
Gain
on insurance settlement and other
|
-- | 8 | 1 | |||||||||
|
Gain
on consolidation of HS&TC (Note 3)
|
5 | -- | -- | |||||||||
|
Equity
in income of real estate affiliates
|
-- | 9 | 23 | |||||||||
|
Impairment
loss on investment
|
(2 | ) | (2 | ) | -- | |||||||
|
Interest
income
|
-- | 1 | 3 | |||||||||
|
Interest
expense
|
(25 | ) | (24 | ) | (19 | ) | ||||||
|
Income
From Continuing Operations Before Income Taxes
|
20 | 141 | 157 | |||||||||
|
Income
taxes
|
8 | 52 | 59 | |||||||||
|
Income
From Continuing Operations
|
12 | 89 | 98 | |||||||||
|
Income
from discontinued operations, net of income taxes (Note 2)
|
32 | 43 | 44 | |||||||||
|
Net
Income
|
$ | 44 | $ | 132 | $ | 142 | ||||||
|
Basic
Earnings per Share of Common Stock:
|
||||||||||||
|
Continuing
operations
|
$ | 0.29 | $ | 2.17 | $ | 2.30 | ||||||
|
Discontinued
operations
|
0.79 | 1.04 | 1.04 | |||||||||
|
Net
income
|
$ | 1.08 | $ | 3.21 | $ | 3.34 | ||||||
|
Diluted
Earnings per Share of Common Stock:
|
||||||||||||
|
Continuing
operations
|
$ | 0.29 | $ | 2.15 | $ | 2.27 | ||||||
|
Discontinued
operations
|
0.79 | 1.04 | 1.03 | |||||||||
|
Net
income
|
$ | 1.08 | $ | 3.19 | $ | 3.30 | ||||||
|
Weighted
Average Number of Shares Outstanding:
|
||||||||||||
|
Basic
|
41.0 | 41.2 | 42.5 | |||||||||
|
Diluted
|
41.1 | 41.5 | 43.1 | |||||||||
See notes
to consolidated financial statements.
ALEXANDER
& BALDWIN, INC.
CONSOLIDATED
STATEMENTS OF CASH FLOWS
(In
millions)
|
Year
Ended December 31,
|
||||||||||||
|
2009
|
2008
|
2007
|
||||||||||
|
Cash
Flow from Operating Activities:
|
||||||||||||
|
Net
income
|
$ | 44 | $ | 132 | $ | 142 | ||||||
|
Adjustments
to reconcile net income to net cash provided by
operations:
|
||||||||||||
|
Depreciation
and amortization
|
105 | 101 | 93 | |||||||||
|
Deferred
income taxes
|
1 | 19 | 26 | |||||||||
|
Gains
on disposal of assets, net of impairment losses
|
(51 | ) | (91 | ) | (64 | ) | ||||||
|
Casualty
gain from receipt of insurance proceeds
|
-- | (8 | ) | -- | ||||||||
|
Gain
on consolidation of HS&TC
|
(5 | ) | -- | -- | ||||||||
|
Share-based
expense
|
9 | 11 | 17 | |||||||||
|
Equity
in income of affiliates, net of distributions
|
(1 | ) | 11 | 1 | ||||||||
|
Changes
in operating assets and liabilities:
|
||||||||||||
|
Accounts
and notes receivable
|
(16 | ) | 24 | (9 | ) | |||||||
|
Inventories
|
(6 | ) | (6 | ) | (3 | ) | ||||||
|
Prepaid
expenses and other assets
|
(5 | ) | 3 | 12 | ||||||||
|
Deferred
dry-docking costs
|
10 | (9 | ) | (22 | ) | |||||||
|
Liability
for employee benefit plans
|
-- | (3 | ) | (3 | ) | |||||||
|
Accounts
and income taxes payable
|
20 | (37 | ) | 19 | ||||||||
|
Other
liabilities
|
11 | (17 | ) | 14 | ||||||||
|
Real
Estate Developments Held for Sale:
|
||||||||||||
|
Real
estate inventory sales
|
5 | 184 | 11 | |||||||||
|
Expenditures
for real estate inventory
|
(6 | ) | (39 | ) | (110 | ) | ||||||
|
Net
cash provided by operations
|
115 | 275 | 124 | |||||||||
|
Cash
Flows from Investing Activities:
|
||||||||||||
|
Capital
expenditures for property and developments
|
(31 | ) | (109 | ) | (122 | ) | ||||||
|
Proceeds
from disposal of income-producing property, investments and other
assets
|
32 | 19 | 18 | |||||||||
|
Proceeds
from insurance settlement related to 2005 casualty loss
|
-- | 8 | -- | |||||||||
|
Deposits
into Capital Construction Fund
|
(4 | ) | (7 | ) | (30 | ) | ||||||
|
Withdrawals
from Capital Construction Fund
|
4 | 8 | 30 | |||||||||
|
Acquisition
of businesses, net of cash acquired
|
10 | (27 | ) | -- | ||||||||
|
Payments
for purchases of investments
|
(48 | ) | (60 | ) | (43 | ) | ||||||
|
Proceeds
from sale and maturity of investments
|
6 | 19 | 2 | |||||||||
|
Net
cash used in investing activities
|
(31 | ) | (149 | ) | (145 | ) | ||||||
|
Cash
Flows from Financing Activities:
|
||||||||||||
|
Proceeds
from issuance of long-term debt
|
241 | 127 | 139 | |||||||||
|
Payments
of long-term debt and deferred financing costs
|
(288 | ) | (138 | ) | (88 | ) | ||||||
|
Proceeds
from (payments on) short-term borrowings, net
|
13 | (5 | ) | 15 | ||||||||
|
Repurchases
of capital stock
|
-- | (59 | ) | (33 | ) | |||||||
|
Proceeds
from issuance of capital stock, net of excess tax benefit
|
(1 | ) | 2 | 8 | ||||||||
|
Dividends
paid
|
(52 | ) | (51 | ) | (48 | ) | ||||||
|
Net
cash used in financing activities
|
(87 | ) | (124 | ) | (7 | ) | ||||||
|
Cash
and Cash Equivalents:
|
||||||||||||
|
Net
increase (decrease) for the year
|
(3 | ) | 2 | (28 | ) | |||||||
|
Balance,
beginning of year
|
19 | 17 | 45 | |||||||||
|
Balance,
end of year
|
$ | 16 | $ | 19 | $ | 17 | ||||||
|
Other
Cash Flow Information:
|
||||||||||||
|
Interest
paid, net of amounts capitalized
|
$ | (24 | ) | $ | (25 | ) | $ | (25 | ) | |||
|
Income
taxes paid
|
$ | (38 | ) | $ | (63 | ) | $ | (55 | ) | |||
|
Non-cash
Activities:
|
||||||||||||
|
Debt
assumed in real estate purchase
|
$ | -- | $ | 11 | $ | -- | ||||||
|
Tax-deferred
property sales
|
$ | 109 | $ | 112 | $ | 83 | ||||||
|
Tax-deferred
property purchases
|
$ | (95 | ) | $ | (46 | ) | $ | (91 | ) | |||
See notes
to consolidated financial statements.
ALEXANDER
& BALDWIN, INC.
CONSOLIDATED
BALANCE SHEETS
(In
millions, except per-share amount)
|
December
31,
|
||||||||
|
2009
|
2008
|
|||||||
|
ASSETS
|
||||||||
|
Current
Assets
|
||||||||
|
Cash
and cash equivalents
|
$
|
16
|
$
|
19
|
||||
|
Accounts and notes receivable, less allowances of $10 for 2009 and $8 for
2008
|
172
|
163
|
||||||
|
Inventories
|
43
|
28
|
||||||
|
Real
estate held for sale
|
36
|
20
|
||||||
|
Deferred
income taxes
|
6
|
--
|
||||||
|
Section
1031 exchange proceeds
|
1
|
23
|
||||||
|
Prepaid
expenses and other assets
|
33
|
31
|
||||||
|
Total
current assets
|
307
|
284
|
||||||
|
Investments
in Affiliates
|
242
|
208
|
||||||
|
Real
Estate Developments
|
88
|
78
|
||||||
|
Property
– net
|
1,536
|
1,590
|
||||||
|
Employee
Benefit Plan Assets
|
3
|
3
|
||||||
|
Other
Assets
|
204
|
187
|
||||||
|
Total
|
$
|
2,380
|
$
|
2,350
|
||||
|
LIABILITIES
AND SHAREHOLDERS’ EQUITY
|
||||||||
|
Current
Liabilities
|
||||||||
|
Notes
payable and current portion of long-term debt
|
$
|
65
|
$
|
52
|
||||
|
Accounts payable
|
132
|
105
|
||||||
|
Payroll
and vacation benefits
|
18
|
18
|
||||||
|
Uninsured
claims
|
9
|
10
|
||||||
|
Deferred income taxes
|
--
|
1
|
||||||
|
Accrued and other liabilities
|
73
|
52
|
||||||
|
Total
current liabilities
|
297
|
238
|
||||||
|
Long-term
Liabilities
|
||||||||
|
Long-term
debt
|
406
|
452
|
||||||
|
Deferred
income taxes
|
428
|
414
|
||||||
|
Employee
benefit plans
|
116
|
122
|
||||||
|
Uninsured
claims and other liabilities
|
48
|
52
|
||||||
|
Total
long-term liabilities
|
998
|
1,040
|
||||||
|
Commitments
and Contingencies (Note 12)
|
||||||||
|
Shareholders’
Equity
|
||||||||
|
Capital stock – common stock without par value; authorized, 150 million
shares ($0.75 stated value per share); outstanding, 41.0 million shares in
2009 and 2008
|
33
|
33
|
||||||
|
Additional capital
|
210
|
204
|
||||||
|
Accumulated other comprehensive loss
|
(81
|
)
|
(96
|
)
|
||||
|
Retained
earnings
|
934
|
942
|
||||||
|
Cost
of treasury stock
|
(11
|
)
|
(11
|
)
|
||||
|
Total
shareholders’ equity
|
1,085
|
1,072
|
||||||
|
Total
|
$
|
2,380
|
$
|
2,350
|
||||
See notes
to consolidated financial statements.
ALEXANDER
& BALDWIN, INC.
CONSOLIDATED
STATEMENTS OF SHAREHOLDERS’ EQUITY
For
the three years ended December 31, 2009
(In
millions, except per-share amounts)
|
Accumulated
|
|||||||||||||||||||||||||||
|
Capital
Stock
|
Other
|
||||||||||||||||||||||||||
|
Issued
|
In
Treasury
|
Compre-
|
|||||||||||||||||||||||||
|
Stated
|
Additional
|
hensive
|
Retained
|
||||||||||||||||||||||||
|
Shares
|
Value
|
Shares
|
Cost
|
Capital
|
Loss
|
Earnings
|
Total
|
||||||||||||||||||||
|
Balance,
December 31, 2006
|
46.2
|
35
|
3.6
|
(11
|
)
|
179
|
(19
|
)
|
843
|
1,027
|
|||||||||||||||||
|
Net
income
|
—
|
—
|
—
|
—
|
—
|
—
|
142
|
142
|
|||||||||||||||||||
|
Other
comprehensive income,
net of tax:
|
|||||||||||||||||||||||||||
|
Defined benefit
plans:
|
|||||||||||||||||||||||||||
|
Net
gain (loss)
|
—
|
—
|
—
|
—
|
—
|
14
|
—
|
14
|
|||||||||||||||||||
|
Less:
Amortization of net (gain) loss
|
—
|
—
|
—
|
—
|
—
|
1
|
—
|
1
|
|||||||||||||||||||
|
Total
comprehensive income
|
157
|
||||||||||||||||||||||||||
|
Shares
repurchased
|
(0.7
|
)
|
(1
|
)
|
—
|
—
|
(4
|
)
|
—
|
(28
|
)
|
(33
|
)
|
||||||||||||||
|
Shares
issued
|
0.5
|
—
|
—
|
—
|
8
|
—
|
—
|
8
|
|||||||||||||||||||
|
Share-based
compensation
|
—
|
—
|
—
|
—
|
17
|
—
|
—
|
17
|
|||||||||||||||||||
|
Adjustment
to initially adopt accounting for uncertain tax positions
|
—
|
—
|
—
|
—
|
—
|
—
|
2
|
2
|
|||||||||||||||||||
|
Dividends
($1.12 per share)
|
—
|
—
|
—
|
—
|
—
|
—
|
(48
|
)
|
(48
|
)
|
|||||||||||||||||
|
Balance,
December 31, 2007
|
46.0
|
34
|
3.6
|
(11
|
)
|
200
|
(4
|
)
|
911
|
1,130
|
|||||||||||||||||
|
Net
income
|
—
|
—
|
—
|
—
|
—
|
—
|
132
|
132
|
|||||||||||||||||||
|
Other
comprehensive income, net of tax:
|
|||||||||||||||||||||||||||
|
Defined
benefit plans:
|
|||||||||||||||||||||||||||
|
Net
loss/prior service cost
|
—
|
—
|
—
|
—
|
—
|
(93
|
)
|
—
|
(93
|
)
|
|||||||||||||||||
|
Less:
Amortization of net loss/prior service cost
|
—
|
—
|
—
|
—
|
—
|
1
|
—
|
1
|
|||||||||||||||||||
|
Total
comprehensive income
|
40
|
||||||||||||||||||||||||||
|
Shares
repurchased
|
(1.4
|
)
|
(1
|
)
|
—
|
—
|
(8
|
)
|
—
|
(50
|
)
|
(59
|
)
|
||||||||||||||
|
Shares
issued
|
—
|
—
|
—
|
—
|
1
|
—
|
—
|
1
|
|||||||||||||||||||
|
Share-based
compensation
|
—
|
—
|
—
|
—
|
11
|
—
|
—
|
11
|
|||||||||||||||||||
|
Dividends
($1.23 per share)
|
—
|
—
|
—
|
—
|
—
|
—
|
(51
|
)
|
(51
|
)
|
|||||||||||||||||
|
Balance,
December 31, 2008
|
44.6
|
33
|
3.6
|
(11
|
)
|
204
|
(96
|
)
|
942
|
1,072
|
|||||||||||||||||
|
Net
income
|
—
|
—
|
—
|
—
|
—
|
—
|
44
|
44
|
|||||||||||||||||||
|
Other
comprehensive income, net of tax:
|
|||||||||||||||||||||||||||
|
Defined
benefit plans:
|
|||||||||||||||||||||||||||
|
Net
gain/prior service (cost)
|
—
|
—
|
—
|
—
|
—
|
7
|
—
|
7
|
|||||||||||||||||||
|
Less:
Amortization of net loss/prior service cost
|
—
|
—
|
—
|
—
|
—
|
8
|
—
|
8
|
|||||||||||||||||||
|
Total
comprehensive income
|
59
|
||||||||||||||||||||||||||
|
Excess
tax benefit and share withholding
|
—
|
—
|
—
|
—
|
(3
|
)
|
—
|
—
|
(3
|
)
|
|||||||||||||||||
|
Share-based
compensation
|
—
|
—
|
—
|
—
|
9
|
—
|
—
|
9
|
|||||||||||||||||||
|
Dividends
($1.26 per share)
|
—
|
—
|
—
|
—
|
—
|
—
|
(52
|
)
|
(52
|
)
|
|||||||||||||||||
|
Balance,
December 31, 2009
|
44.6
|
$
|
33
|
3.6
|
$
|
(11
|
)
|
$
|
210
|
$
|
(81
|
)
|
$
|
934
|
$
|
1,085
|
|||||||||||
See notes
to consolidated financial statements.
ALEXANDER
& BALDWIN, INC.
NOTES
TO CONSOLIDATED FINANCIAL STATEMENTS
1. SUMMARY
OF SIGNIFICANT ACCOUNTING POLICIES
Description of Business:
Founded in 1870, Alexander & Baldwin, Inc. (“A&B” or the “Company”) is
incorporated under the laws of the State of Hawaii. A&B operates in five
segments in three industries: Transportation, Real Estate and
Agribusiness. These industries are described below:
Transportation: The
Transportation Industry consists of Ocean Transportation and Logistics Services
segments. The Ocean Transportation segment, which is conducted through Matson
Navigation Company, Inc. (“Matson”), a wholly-owned subsidiary of A&B, is an
asset-based business that derives its revenue primarily through the carriage of
containerized freight between various U.S. Pacific Coast, Hawaii, Guam, China
and other Pacific island ports. Additionally, the Ocean Transportation segment
has a 35 percent interest in an entity (SSA Terminals, LLC or “SSAT”) that
provides terminal and stevedoring services at U.S. Pacific Coast facilities. The
Logistics Services segment, which is conducted through Matson Integrated
Logistics, Inc. (“MIL”), a wholly-owned subsidiary of Matson, is a non-asset
based business that is a provider of domestic and international rail intermodal
service (“Intermodal”), long-haul and regional highway brokerage, specialized
hauling, flat-bed and project work, less-than-truckload, expedited/air freight
services and warehousing and distribution services (collectively “Highway”).
Warehousing and distribution services are provided by Matson Global Distribution
Services, Inc. (“MGDS”), a wholly-owned subsidiary of MIL. MGDS’s operations
also include Pacific American Services, LLC (“PACAM”), a San Francisco bay-area
regional warehousing, packaging, and distribution company.
Real Estate: The Real Estate
Industry consists of two segments, both of which have operations in Hawaii and
on the U.S. Mainland. The Real Estate Sales segment generates its revenues
through the development and sale of land and commercial and residential
properties. The Real Estate Leasing segment owns, operates and manages retail,
office and industrial properties. Real estate activities are conducted through
A&B Properties, Inc. and various other wholly-owned subsidiaries of
A&B.
Agribusiness: Agribusiness,
which contains one segment, produces and transports bulk raw sugar, specialty
food-grade sugars, and molasses; produces, markets, and distributes roasted
coffee, green coffee and specialty food-grade sugars; provides general trucking
services, mobile equipment maintenance and repair services, and self-service
storage in Hawaii; and generates and sells, to the extent not used in the
Company’s operations, electricity. In the fourth quarter of 2009, the Company
became the sole member in Hawaiian Sugar & Transportation Cooperative
(“HS&TC”), a cooperative that provides raw sugar marketing and
transportation services to its members, and therefore, the Company consolidated
HS&TC beginning December 1, 2009 in accordance with Financial Accounting
Standard Board (“FASB”) Accounting Standards Codification (“ASC”) Topic 810
related to consolidation.
Principles of
Consolidation: The consolidated
financial statements include the accounts of Alexander & Baldwin, Inc.
and all wholly-owned and controlled subsidiaries, after elimination of
significant intercompany amounts. Significant investments in businesses,
partnerships, and limited liability companies in which the Company does not have
a controlling financial interest, but has the ability to exercise significant
influence, are accounted for under the equity method. A controlling financial
interest is one in which the Company has a majority voting interest or one in
which the Company is the primary beneficiary that absorbs the majority of the
expected losses, or receives a majority of the expected residual returns, or
both, of a variable interest entity.
Risks and Uncertainties:
Factors that could adversely impact the Company’s operations or financial
results include, but are not limited to, the following: unfavorable economic
conditions in the U.S., Guam, or Asian markets that result in a further decrease
in consumer confidence or market demand for the Company’s services and products;
increased competition; replacement of the Company’s significant operating
agreements; reduction in credit availability; downgrade in the Company’s credit
rating that affects its ability to secure adequate financing and/or increase the
cost of financing; failure to comply with restrictive financial covenants in the
Company’s credit facilities; insolvency of the Company’s insurance carriers;
insolvency and/or failure of joint venture partner to perform; loss and/or
insolvency of significant agents, customers, or vendors; unfavorable political
conditions in domestic or international markets; strikes or work stoppages;
increased cost of energy or labor; noncompliance with and/or changes in laws and
regulations relating to the Company’s business; unfavorable litigation or legal
proceedings or government inquiries or investigations; adverse weather
conditions; changes in the legal and regulatory environment; changes in
accounting and taxation standards, including an increase in tax rates; an
inability to achieve the Company’s overall long-term goals; an inability to
protect the Company’s information systems; future impairment charges; increased
pension costs; inadequate internal controls; and global or regional catastrophic
events.
Use of Estimates: The preparation of the
consolidated financial statements in conformity with accounting principles
generally accepted in the United States of America requires management to make
estimates and assumptions that affect the amounts reported. Significant estimates
and assumptions are used for, but not limited to: (i) asset impairments, (ii)
legal contingencies, (iii) allowance for doubtful accounts, (iv) revenue
recognition for long-term real estate developments, (v) self-insured
liabilities, (vi) pension and postretirement estimates, and (vii) income
taxes. Future
results could be materially affected if actual results differ from these
estimates and assumptions.
Cash and Cash Equivalents:
Cash equivalents consist of highly liquid investments with a weighted-average
maturity of three months or less at the date of purchase. The Company carries
these investments at cost, which approximates fair value. Outstanding checks in
excess of funds on deposit totaled $22 million and $15 million at December 31,
2009 and 2008, respectively, and are reflected as current liabilities in the
consolidated balance sheets.
Fair Value of Financial
Instruments: The fair values of cash and cash equivalents,
receivables and short-term borrowings approximate their carrying values due to
the short-term nature of the instruments. The carrying amount and fair value of
the Company’s long-term debt at December 31, 2009 was $471 million and $475
million, respectively and $504 million and $471 million at December 31, 2008,
respectively.
Allowance for Doubtful
Accounts: Allowance for doubtful accounts are established by
management based on estimates of collectibility. The changes in the allowance
for doubtful accounts, included on the consolidated balance sheets as an offset
to “Accounts and notes receivable,” for the three years ended December 31, 2009
were as follows (in millions):
|
Balance
at
Beginning of year
|
Expense
|
Write-offs
and Other
|
Balance
at
End of Year
|
|||||||||||||
|
2007
|
$ | 14 | $ | -- | $ | (2 | ) | $ | 12 | |||||||
|
2008
|
$ | 12 | $ | 1 | $ | (5 | ) | $ | 8 | |||||||
|
2009
|
$ | 8 | $ | 3 | $ | (1 | ) | $ | 10 | |||||||
Inventories: Sugar and coffee
inventories are stated at the lower of cost (first-in, first-out basis) or
market value. Materials and supplies inventory are stated at the lower of cost
(principally average cost) or market value. Inventories at December
31, 2009 and 2008 were as follows (in millions):
|
2009
|
2008
|
|||||||
|
Sugar
and coffee inventories
|
$
|
28
|
$
|
13
|
||||
|
Materials
and supplies inventories
|
15
|
15
|
||||||
|
Total
|
$
|
43
|
$
|
28
|
||||
Dry-docking: Under
U.S. Coast Guard rules, administered through the American Bureau of Shipping’s
alternative compliance program, all vessels must meet specified seaworthiness
standards to remain in service. Vessels must undergo regular inspection,
monitoring and maintenance, referred to as “dry-docking,” to maintain the
required operating certificates. These dry-docks occur on scheduled intervals
ranging from two to five years, depending on the vessel’s age. Because the
dry-docks enable the vessel to continue operating in compliance with U.S. Coast
Guard requirements and provide future economic benefits, the costs of these
scheduled dry-docks are deferred and amortized until the next regularly
scheduled dry-dock period. Routine vessel maintenance and repairs that do not
improve or extend asset lives are charged to expense as incurred. Deferred
amounts are included on the consolidated balance sheets in non-current other
assets. Amortized amounts are charged to operating expenses in the consolidated
statements of income. Changes in deferred dry-docking costs are included in the
consolidated statements of cash flows in cash flows from operating
activities.
Property: Property
is stated at cost, net of accumulated depreciation and amortization.
Expenditures for major renewals and betterments are capitalized. Replacements,
maintenance, and repairs that do not improve or extend asset lives are charged
to expense as incurred. Costs of developing coffee orchards are capitalized
during the development period and depreciated over the estimated productive
lives. Upon acquiring commercial real estate that is deemed a business, the
Company records land, buildings, leases above and below market, and other
intangibles based on their fair values. Due diligence costs are expensed as
incurred.
Depreciation: Depreciation
and amortization is computed using the straight-line method over the estimated
useful lives of the assets. Estimated useful lives of property are as
follows:
|
Classification
|
Range of Life (in years)
|
|
Vessels
|
10
to 40
|
|
Buildings
|
10
to 40
|
|
Water,
power and sewer systems
|
5
to 50
|
|
Machinery
and equipment
|
2
to 35
|
|
Other
property improvements
|
3
to 35
|
Real Estate
Developments: Expenditures for real estate developments are
capitalized during construction and are classified as Real Estate Developments
on the consolidated balance sheets. When construction is substantially
complete, the costs are reclassified as either Real Estate Held for Sale or
Property, based upon the Company’s intent to either sell the completed asset or
to hold it as an investment property, respectively. Cash flows related to real
estate developments are classified as either operating or investing activities,
based upon the Company’s intention to sell the property or to retain ownership
of the property as an investment following completion of
construction.
For development projects, capitalized
costs are allocated using the direct method for expenditures that are
specifically associated with the unit being sold and the relative-sales-value
method for expenditures that benefit the entire project. Capitalized development
costs typically include costs related to land acquisition, grading, roads, water
and sewage systems, landscaping, capitalized interest, and project amenities.
Direct overhead costs incurred after the development project is substantially
complete, such as utilities, maintenance, and real estate taxes, are charged to
selling, general, and administrative expense as incurred. All indirect overhead
costs are charged to selling, general, and administrative costs as
incurred.
Capitalized
Interest: Interest costs incurred in connection with
significant expenditures for real estate developments, the construction of
assets, or investments in joint ventures are capitalized during the period in
which activities necessary to get the asset ready for its intended use are in
progress. Capitalization of interest is discontinued when the asset is
substantially complete and ready for its intended use. Capitalization of
interest on investments in joint ventures is recorded until the underlying
investee commences its principal operations, which is typically when the
investee has other-than-ancillary revenue generation. Total interest cost
incurred was $26 million, $25 million, and $26 million in 2009, 2008, and 2007,
respectively. Capitalized interest was $1 million and $7 million in 2008 and
2007, respectively. Capitalized interest in 2009 was not material.
Impairment of Long-Lived
Assets: Long-lived assets are reviewed for possible impairment
when events or circumstances indicate that the carrying value may not be
recoverable. In such an evaluation, the estimated future undiscounted cash flows
generated by the asset are compared with the amount recorded for the asset to
determine if its carrying value is not recoverable. If this review determines
that the recorded value will not be recovered, the amount recorded for the asset
is reduced to estimated fair value. The Company has evaluated certain long-lived
assets for impairment; however, no impairment charges were recorded as a result
of this process. These asset impairment loss analyses are highly subjective
because they require management to make assumptions and apply considerable
judgments to, among others, estimates of the timing and amount of future cash
flows, expected useful lives of the assets, uncertainty about future events,
including changes in economic conditions, changes in operating performance,
changes in the use of the assets, and ongoing cost of maintenance and
improvements of the assets, and thus, the accounting estimates may change from
period to period. If management uses different assumptions or if different
conditions occur in future periods, the Company’s financial condition or its
future operating results could be materially impacted.
Impairment of Investments:
The Company’s investments in unconsolidated affiliates are reviewed for
impairment whenever there is evidence that fair value may be below carrying
cost. An investment is written down to fair value if fair value is below
carrying cost and the impairment is considered other-than-temporary. In
evaluating the fair value of an investment, the Company reviews discounted
projected cash flows associated with the investment and other relevant
information. In evaluating whether an impairment is
other-than-temporary, the Company considers all available information, including
the length of time and extent of the impairment, the financial condition and
near-term prospects of the affiliate, the Company’s ability and intent to hold
the investment for a period of time sufficient to allow for any anticipated
recovery in market value, and projected industry and economic trends, among
others.
In determining the fair value of an
investment and assessing whether any identified impairment is
other-than-temporary, significant estimates and considerable judgments are
involved. These estimates and judgments are based, in part, on the Company’s
current and future evaluation of economic conditions in general, as well as a
joint venture’s current and future plans. These impairment calculations are
highly subjective because they also require management to make assumptions and
apply judgments to, among others, estimates of the timing and amount of future
cash flows, probabilities related to various cash flow scenarios, and
appropriate discount rates. Changes in these and other assumptions could affect
the projected operational results of the unconsolidated affiliates, and
accordingly, may require valuation adjustments to the Company’s investments that
may materially impact the Company’s financial condition or its future operating
results. For example, if the current market conditions continue to deteriorate
or a joint venture’s plans change, additional impairment charges may be required
in future periods, and those charges could be material.
In 2009, the Company evaluated certain
investments in unconsolidated affiliates for impairment. As a result of this
process, the Company recorded an impairment loss of approximately $2.5 million
related to its Ka Milo joint venture investment. Continued weakness in the real
estate sector or difficulty in obtaining or renewing project-level financing may
affect the value or feasibility of certain development projects owned by the
Company or by its joint ventures and could lead to additional impairment charges
in the future.
Goodwill and Intangible
Assets: Goodwill and intangibles are recorded on the
consolidated balance sheets as other non-current assets. Recorded goodwill is
related to the acquisition of logistic service entities and earnout obligations
(see Note 3). Recorded intangible assets are related to logistic service entity
acquisitions as well as the acquisition of commercial properties. The Company
reviews goodwill for potential impairment on an annual basis, or more frequently
if indications of impairment exist. Intangible assets are reviewed for
impairment whenever events or changes in circumstances would indicate the
carrying amount of the intangible assets may not be recoverable. There were no
impairments of goodwill or intangible assets in 2009, 2008, or
2007.
The changes in the carrying amount of
goodwill for the years ended December 31, 2009 and 2008 were as follows (in
millions):
|
Goodwill
|
||||
|
Balance,
December 31, 2007
|
$
|
12
|
||
|
Additions
|
14
|
|||
|
Balance,
December 31, 2008
|
26
|
|||
|
Additions
|
1
|
|||
|
Balance,
December 31, 2009
|
$
|
27
|
||
Intangible assets for the years ended
December 31 included the following (in millions):
|
2009
|
2008
|
|||||||||||||||
|
Gross
|
Gross
|
|||||||||||||||
|
Carrying
|
Accumulated
|
Carrying
|
Accumulated
|
|||||||||||||
|
Amount
|
Amortization
|
Amount
|
Amortization
|
|||||||||||||
|
Amortized
intangible assets:
|
||||||||||||||||
|
Customer lists
|
$
|
12
|
$
|
(4
|
)
|
$
|
12
|
$
|
(3
|
)
|
||||||
|
In-place leases
|
11
|
(4
|
)
|
8
|
(2
|
)
|
||||||||||
|
Other
|
8
|
(4
|
)
|
6
|
(3
|
)
|
||||||||||
|
Total
assets
|
$
|
31
|
$
|
(12
|
)
|
$
|
26
|
$
|
(8
|
)
|
||||||
Aggregate intangible asset amortization
was $4 million, $3 million, and $2 million for 2009, 2008, and 2007,
respectively. Future estimated amortization expense related to intangibles are
as follows (in millions):
|
Estimated
Amortization
|
||||
|
2010
|
$ | 4 | ||
|
2011
|
3 | |||
|
2012
|
2 | |||
|
2013
|
2 | |||
|
2014
|
1 | |||
Investment in Note Receivable:
As of December 31, 2009, the Company had invested, as part of its real
estate investment strategy, $11 million in a note receivable secured by
real estate. The note was classified as a non-current asset. At acquisition, due
to evidence of deterioration of credit quality, it was probable that the Company
would not be able to collect all contractually required payments. Accordingly,
the note receivable was acquired at a discount. The note receivable was recorded
at cost with no valuation allowance, and no interest income is being accrued.
1031 Exchange Proceeds: As of
December 31, 2009 and 2008, the Company had $61 million and $71 million,
respectively, of proceeds related to qualifying 1031 tax-deferred sales. These
proceeds are classified as non-current assets on the consolidated balance sheets
until reinvested in qualifying property.
Revenue Recognition: The Company has a wide
range of revenue sources, including, shipping revenue, logistics revenue,
property sales, rental income, and sales of raw sugar, molasses and coffee.
Before recognizing revenue, the Company assesses the underlying terms of the
transaction to ensure that recognition meets the requirements of relevant
accounting standards. In general, the Company recognizes revenue when persuasive
evidence of an arrangement exists, delivery of the service or product has
occurred, the sales price is fixed or determinable, and collectibility is
reasonably assured.
Voyage Revenue
Recognition: Voyage revenue is recognized ratably over the
duration of a voyage based on the relative transit time in each reporting
period, commonly referred to as the percentage-of-completion method. Voyage
expenses are recognized as incurred.
Logistics Services Revenue
Recognition: The revenue for logistics services includes the
total amount billed to customers for transportation services. The primary costs
include purchased transportation services. Revenue and the related
purchased transportation costs are recognized based on relative transit time,
commonly referred to as the percentage-of-completion method. The Company reports
revenue on a gross basis. The Company serves as principal in transactions
because it is responsible for the contractual relationship with the customer,
has latitude in establishing prices, has discretion in supplier selection, and
retains credit risk.
Real Estate Sales Revenue
Recognition: Sales are recorded when the risks and
rewards of ownership have passed to the buyers (generally on closing dates),
adequate initial and continuing investments have been received, and collection
of remaining balances is reasonably assured. For certain development projects
that have material continuing post-closing involvement and for which total
revenue and capital costs are reasonably estimable, the Company uses the
percentage-of-completion method for revenue recognition. Under this method, the
amount of revenue recognized is based on development costs that have been
incurred through the reporting period as a percentage of total expected
development cost associated with the development project. This generally results
in a stabilized gross margin percentage, but requires significant judgment and
estimates.
Real Estate Leasing Revenue
Recognition: Real estate leasing revenue is recognized on a
straight-line basis over the terms of the related leases, including periods for
which no rent is due (typically referred to as “rent holidays”). Differences
between revenue recognized and amounts due under respective lease agreements are
recorded as increases or decreases, as applicable, to deferred rent receivable.
Also included in rental revenue are certain tenant reimbursements and percentage
rents determined in accordance with the terms of the leases. Income arising from
tenant rents that are contingent upon the sales of the tenant exceeding a
defined threshold are recognized only after the contingency has been resolved
(e.g., sales thresholds have been achieved).
Sugar and Coffee Revenue
Recognition: Revenue from bulk raw
sugar sales and coffee sales is recorded when title to the product and risk of
loss passes to third parties (generally this occurs when the product is shipped
or delivered to customers) and when collection is reasonably
assured.
Non-voyage Ocean Transportation
Costs: Depreciation, charter hire, terminal operating
overhead, and general and administrative expenses are charged to expense as
incurred.
Agricultural
Costs: Costs of growing and harvesting sugar cane are charged
to the cost of inventory in the year incurred and to cost of sales as raw sugar
is sold. Costs of growing coffee, excluding orchard development costs, are
charged to inventory in the year incurred and to cost of sales as coffee is
sold.
Discontinued Operations: The
sales of certain income-producing assets are classified as discontinued
operations if the operations and cash flows of the assets clearly can be
distinguished from the remaining assets of the Company, if cash flows for the
assets have been, or will be, eliminated from the ongoing operations of the
Company, if the Company will not have a significant continuing involvement in
the operations of the assets sold, and if the amount is considered material.
Certain assets that are “held-for-sale,” based on the likelihood and intention
of selling the property within 12 months, are also treated as discontinued
operations. Upon reclassification, depreciation ceases on assets reclassified as
“held-for-sale.” Sales of land and residential houses are generally considered
inventory and are not included in discontinued operations.
Employee Benefit
Plans: Certain Ocean Transportation subsidiaries are members
of the Pacific Maritime Association (“PMA”) and the Hawaii Stevedoring Industry
Committee, which negotiate multiemployer pension plans covering certain
shoreside bargaining unit personnel. The subsidiaries directly negotiate
multiemployer pension plans covering other bargaining unit personnel. Pension
costs are accrued in accordance with contribution rates established by the PMA,
the parties to a plan or the trustees of a plan. Several trusteed,
non-contributory, single-employer defined benefit plans and defined contribution
plans cover substantially all other employees.
Share-Based
Compensation: The Company records compensation expense for all
share-based payment awards made to employees and directors. The Company’s
various equity plans are more fully described in Note 11.
Basic and Diluted Earnings per Share
(“EPS”) of Common Stock: Basic earnings per share is
determined by dividing net income by the weighted-average common shares
outstanding during the year. The calculation of diluted earnings per share
includes the dilutive effect of unexercised non-qualified stock options,
non-vested common stock, and non-vested stock units. The computation of average
dilutive shares outstanding excluded non-qualified stock options to purchase 1.8
million, 1.1 million, and 0.2 million shares of common stock for 2009, 2008, and
2007, respectively. These amounts were excluded because the options’ exercise
prices were greater than the average market price of the Company’s common stock
for the periods presented and, therefore, the effect would be
anti-dilutive.
The
denominator used to compute basic and diluted earnings per share is as follows
(in millions):
|
2009
|
2008
|
2007
|
|||||
|
Denominator
for basic EPS: weighted average shares outstanding
|
41.0
|
41.2
|
42.5
|
||||
|
Effect
of dilutive securities:
|
|||||||
|
Outstanding
stock options, non-vested stock, and non-vested stock
units
|
0.1
|
0.3
|
0.6
|
||||
|
Denominator
for diluted EPS: weighted average shares outstanding
|
41.1
|
41.5
|
43.1
|
On January 27, 2010, the Company
granted to employees, non-qualified stock options exercisable into 422,156
shares of common stock at $33.02 per share, 69,540 shares of time-based
restricted stock units, and 92,743 shares of performance-based restricted stock
units. The time-based restricted stock units vests ratably over three years and
the performance-based restricted stock units vests ratably over three years,
provided that the one-year performance target is achieved.
Income Taxes: Significant
judgment is required in determining the Company’s tax liabilities in the
multiple jurisdictions in which the Company operates. Deferred income taxes are
provided for the tax effect of temporary differences between the tax basis of
assets and liabilities and their reported amounts in the financial statements.
Deferred tax assets and deferred tax liabilities are adjusted to the extent
necessary to reflect tax rates expected to be in effect when the temporary
differences reverse. Adjustments may be required to deferred tax assets and
deferred tax liabilities due to changes in tax laws and audit adjustments by tax
authorities. To the extent adjustments are required in any given period, the
adjustments would be included within the tax provision in the consolidated
statements of income and/or consolidated balance sheets.
The Company has not recorded a
valuation allowance for its deferred tax assets. A valuation allowance would be
established if, based on the weight of available evidence, management believes
that it is more likely than not that some portion or all of a recorded deferred
tax asset would not be realized in future periods.
Restricted Net Assets of
Subsidiaries: Matson is subject to restrictions on the transfer of net
assets under certain debt agreements. These restrictions have not had any effect
on the Company’s shareholder dividend policy, and the Company does not
anticipate that these restrictions will have any impact in the future. At
December 31, 2009, the amount of net assets of Matson that may not be
transferred to the Company was approximately $286 million.
Derivative Financial
Instruments: The Company periodically uses derivative
financial instruments such as interest rate and foreign currency hedging
products to mitigate risks. The Company’s use of derivative instruments is
limited to reducing its risk exposure by utilizing interest rate or currency
agreements that are accounted for as hedges. The Company does not hold or issue
derivative instruments for trading or other speculative purposes nor does it use
leveraged financial instruments. All derivatives are recognized in the
consolidated balance sheets at their fair value. At December 31, 2009 and 2008,
there were no material derivative instruments held by the Company.
Comprehensive Income (Loss):
Comprehensive
income (loss) includes all changes in Shareholders’ Equity, except those
resulting from capital stock transactions. Accumulated other comprehensive loss
principally includes amortization of deferred pension/postretirement costs. The
components of other comprehensive loss, net of taxes, were as follows for the
years ended December 31 (in millions):
|
2009
|
2008
|
2007
|
||||||||||
|
Unrealized
components of benefit plans:
|
||||||||||||
|
Pension plans
|
$
|
(73
|
)
|
$
|
(90
|
)
|
$
|
2
|
||||
|
Postretirement
plans
|
--
|
1
|
3
|
|||||||||
|
Non-qualified benefit
plans
|
(6
|
)
|
(5
|
)
|
(6
|
)
|
||||||
|
SSAT pension plan and
other
|
(2
|
)
|
(2
|
)
|
(3
|
)
|
||||||
|
Accumulated
other comprehensive loss
|
$
|
(81
|
)
|
$
|
(96
|
)
|
$
|
(4
|
)
|
|||
Environmental Costs: Environmental exposures
are recorded as a liability and charged to operating expense when the
environmental liability has been incurred and can be estimated. If the aggregate
amount of the liability and the amount and timing of cash payments for the
liability are fixed or reliably determinable, the environmental liability is
discounted. An environmental liability has been incurred when both of the
following conditions have been met: (i) litigation has commenced or a claim or
an assessment has been asserted, or, based on available information,
commencement of litigation or assertion of a claim or an assessment is probable,
and (ii) based on available information, it is probable that the outcome of such
litigation, claim, or assessment will be unfavorable. If a range of probable
loss is determined, the Company will record the obligation at the low end of the
range unless another amount in the range better reflects the expected loss.
Certain costs, however, are capitalized in Property when the obligation is
recorded, if the cost (1) extends the life, increases the capacity or
improves the safety and efficiency of property owned by the Company,
(2) mitigates or prevents environmental contamination that has yet to occur
and that otherwise may result from future operations or activities, or
(3) is incurred or discovered in preparing for sale property that is
classified as “held–for-sale.” The amounts of capitalized environmental costs
were not material at December 31, 2009 or 2008.
Self-Insured Liabilities: The Company is self-insured
for certain losses that include, but are not limited to, employee health,
workers’ compensation, general liability, real and personal property, and real
estate construction warranty and defect claims. When feasible, the Company
obtains third-party insurance coverage to limit its exposure to these claims.
When estimating its self-insured liabilities, the Company considers a number of
factors, including historical claims experience, demographic factors, and
valuations provided by independent third-parties. Periodically, management
reviews its assumptions and the valuations provided by independent third-parties
to determine the adequacy of the Company’s self-insured
liabilities.
Impact of Recently Issued Accounting
Standards: In October 2009, the FASB issued guidance on
revenue arrangements with multiple deliverables effective for the Company’s 2010
fiscal year, although early adoption is permitted. The guidance revises the
criteria for separating, measuring, and allocating arrangement consideration to
each deliverable in a multiple element arrangement. The guidance requires
companies to allocate revenue using the relative selling price of each
deliverable, which must be estimated if there is no history of selling the
deliverable on a stand-alone basis nor third-party evidence of selling price.
The adoption of this standard is not expected to have a material impact on the
Company’s financial position or results of operations.
In June
2009, the FASB issued guidance to revise the approach to determine when a
variable interest entity (“VIE”) should be consolidated. The new consolidation
model for VIEs considers whether the Company has the power to direct the
activities that most significantly impact the VIE’s economic performance and
shares in the significant risks and rewards of the entity. The guidance on VIEs
requires companies to continually reassess VIEs to determine if consolidation is
appropriate and provide additional disclosures. The guidance is effective for
the Company in 2010. The Company is currently assessing the potential effect of
this guidance on its consolidated financial statements.
In April
2009, the FASB issued authoritative guidance on accounting for assets acquired
and liabilities assumed in a business combination that arise from contingencies
that amend the provisions related to the initial recognition and measurement,
subsequent measurement and disclosure of assets and liabilities arising from
contingencies in a business combination under previously issued guidance. The
revised authoritative guidance requires that such contingencies be recognized at
fair value on the acquisition date if fair value can be reasonably estimated
during the allocation period. This authoritative guidance will be effective for
the Company in 2010. The adoption of this standard is not expected to have a
material impact on the Company’s financial position or results of
operations.
Rounding: Amounts
in the consolidated financial statements and Notes are rounded to millions, but
per-share calculations and percentages were determined based on amounts before
rounding. Accordingly, a recalculation of some per-share amounts and
percentages, if based on the reported data, may be slightly
different.
2. DISCONTINUED
OPERATIONS
During 2009, the sales of an
office/retail property on Oahu for $37.9 million, a retail shopping center in
California for $20.3 million, an office building in Arizona for $20.1 million,
an industrial property on Oahu for $13.0 million, an industrial property in
California for $8.3 million, and various parcels on Maui have been classified as
discontinued operations. Additionally, a retail property on Oahu was classified
as discontinued operations (the Company sold the property in January
2010).
During 2008, the sales of two retail
properties on the mainland for $61.2 million, one mainland office property for
$20.6 million, a multi-tenant residential rental property for $12.1 million,
three commercial properties on Maui for $12.9 million, land previously leased to
a telecommunications tenant on Maui for $8.1 million, several commercial leased
fee parcels on Maui for $8.1 million, and various land parcels on Maui for $2.4
million have been classified as discontinued operations.
During 2007, the sales of land leased
to a retail tenant on Oahu for approximately $46 million, five commercial
properties on Maui for approximately $42 million, a commercial property in
California for approximately $7 million, and a commercial property on Maui sold
in 2008 have been classified as discontinued operations.
The revenue, operating profit, income
tax expense and after-tax effects of these transactions for 2009, 2008, and 2007
were as follows (in millions, except per share amounts):
|
2009
|
2008
|
2007
|
||||||||||
|
Sales
Revenue
|
$
|
110
|
$
|
125
|
$
|
95
|
||||||
|
Leasing
Revenue
|
$
|
14
|
$
|
26
|
$
|
35
|
||||||
|
Sales
Operating Profit
|
$
|
44
|
$
|
55
|
$
|
51
|
||||||
|
Leasing
Operating Profit
|
$
|
8
|
$
|
14
|
$
|
20
|
||||||
|
Income
Tax Expense
|
$
|
20
|
$
|
26
|
$
|
27
|
||||||
|
Income
from Discontinued Operations
|
$
|
32
|
$
|
43
|
$
|
44
|
||||||
|
Basic
Earnings Per Share
|
$
|
0.79
|
$
|
1.04
|
$
|
1.04
|
||||||
|
Diluted
Earnings Per Share
|
$
|
0.79
|
$
|
1.04
|
$
|
1.03
|
||||||
The results of operations from these
properties in prior years were reclassified from continuing operations to
discontinued operations to conform to the current year’s accounting
presentation. Consistent with the Company’s intention to reinvest the sales
proceeds into new investment property, the proceeds from the sales of property
treated as discontinued operations were deposited in escrow accounts for
tax-deferred reinvestment in accordance with Section 1031 of the Internal
Revenue Code.
3. ACQUISITIONS
AND RELATED-PARTY TRANSACTIONS
The
Company’s Hawaiian Commercial & Sugar Company division and Gay &
Robinson (“G&R”) were members in Hawaiian Sugar & Transportation
Cooperative (“HS&TC”), a cooperative that provides raw sugar marketing and
transportation services to its members. In the fourth quarter of 2009, G&R
ceased the production of raw sugar. As a result of G&R’s cessation of raw
sugar production in the fourth quarter of 2009, G&R’s membership in the
cooperative terminated because a cooperative member must be an active producer.
Consequently, upon G&R’s withdrawal, the Company became the sole member in
HS&TC and consolidated HS&TC beginning December 1, 2009.
The
identifiable assets and liabilities from HS&TC were recorded based upon
their estimated fair values at December 1, 2009. Approximately $5 million of
identifiable assets, net of liabilities, measured at fair value, was recorded as
a gain and classified as Other Income (Expense) in the consolidated statements
of income. In consolidation, approximately $11 million of cash, $6 million in
fixed assets, $8 million in inventory, $2 million in prepaid and other assets,
and $22 million in accrued and other liabilities were recorded.
The Company consolidated the results of
operations of HS&TC effective December 1, 2009. The Company has not
presented unaudited pro forma results of operations because the consolidation of
HS&TC is not material to its consolidated results of operations, financial
position or cash flows.
Under the terms of a supply contract
between HS&TC and C&H Sugar Company, Inc. (“C&H”), C&H is
obligated to purchase, and HS&TC is obligated to sell, all of the raw sugar
delivered to HS&TC by the Hawaii sugar growers, at prices determined by the
quoted domestic sugar market. Revenue from raw sugar and molasses sold to
HS&TC, prior to December 1, 2009, was $38 million, $45 million, and $53
million during 2009, 2008, and 2007, respectively.
On August 29, 2008, Matson Global
Distribution Services (“MGDS”), a wholly owned subsidiary of Matson Integrated
Logistics, acquired substantially all of the assets and assumed certain
liabilities of Pacific American Services, LLC (“PACAM”), a regional,
warehousing, packaging and distribution company specializing in value-added
handling of domestic, import and export goods, headquartered in Oakland,
California. The acquired net tangible assets of PACAM consisted primarily of
cash and cash equivalents, accounts receivable, prepaid expenses and fixed
assets, partially offset by accounts payable, and other current and long-term
liabilities that MGDS assumed. PACAM was acquired to expand the Company’s
warehousing and distribution service capabilities.
The purchase price was approximately
$24 million in cash, including transaction costs. The total purchase price was
allocated to the tangible and intangible assets acquired and liabilities assumed
based upon their estimated fair values at the acquisition date, with the excess
purchase price allocated to goodwill. Approximately $3 million was allocated to
fixed assets, $1 million was allocated to accounts receivable, accounts payable
and other accrued liabilities, $9 million was allocated to identifiable
intangibles, principally customer relationships, and $11 million was allocated
to goodwill. Commencing with the date of the acquisition, identifiable
intangibles are being amortized to general and administrative expense over an
average useful life of 13 years. The goodwill recorded is deductible for tax
purposes.
The results of operations of PACAM were
included in the Company’s consolidated financial statements effective August 29,
2008. The Company has not presented unaudited pro forma results of operations
because the acquisition of PACAM is not material to its consolidated results of
operations, financial position or cash flows.
4. INVESTMENTS
IN AFFILIATES
At December 31, 2009 and 2008,
investments consisted principally of equity in limited liability companies. The
Company does not have a controlling financial interest in any of these
investments and, accordingly, accounts for its investments using the equity
method of accounting. Consolidated retained earnings at December 31, 2009 that
represent undistributed earnings of investments in affiliates was approximately
$32 million. Dividends and distributions from unconsolidated affiliates totaled
$8 million, $30 million, and $36 million for the years ended December 31, 2009,
2008, and 2007, respectively.
The
Company’s investments in affiliates are summarized, by industry, as follows (in
millions):
|
2009
|
2008
|
|||||||
|
Investment
in Unconsolidated Affiliated Companies:
|
||||||||
|
Real
Estate and Other
|
$
|
195
|
$
|
164
|
||||
|
Transportation
|
47
|
44
|
||||||
|
Total
Investments
|
$
|
242
|
$
|
208
|
||||
Operating results include the
Company’s proportionate share of net income from its equity method investments.
A summary of financial information for the Company’s equity method investments
by industry at December 31 is as follows (in millions):
|
2009
|
2008
|
|||||||||||||||
|
Real
Estate
|
Transportation
|
Real
Estate
|
Transportation
|
|||||||||||||
|
Current
assets
|
$
|
48
|
$
|
60
|
$
|
61
|
$
|
46
|
||||||||
|
Noncurrent
assets
|
554
|
118
|
497
|
113
|
||||||||||||
|
Total
assets
|
$
|
602
|
$
|
178
|
$
|
558
|
$
|
159
|
||||||||
|
|
||||||||||||||||
|
Current
liabilities
|
$
|
97
|
$
|
29
|
$
|
61
|
$
|
35
|
||||||||
|
Noncurrent
liabilities
|
111
|
26
|
148
|
11
|
||||||||||||
|
Total
liabilities
|
$
|
208
|
$
|
55
|
$
|
209
|
$
|
46
|
||||||||
|
Year
Ended December 31,
|
||||||||||||
|
2009
|
2008
|
2007
|
||||||||||
|
Real
Estate:
|
||||||||||||
|
Operating
revenue
|
$
|
14
|
$
|
73
|
$
|
132
|
||||||
|
Operating
costs and expenses
|
9
|
47
|
90
|
|||||||||
|
Operating
income
|
$
|
5
|
$
|
26
|
$
|
42
|
||||||
|
Income
from continuing operations
|
$
|
1
|
$
|
22
|
$
|
38
|
||||||
|
Net
income
|
$
|
1
|
$
|
22
|
$
|
38
|
||||||
|
Transportation:
|
||||||||||||
|
Operating
revenue
|
$
|
476
|
$
|
505
|
$
|
519
|
||||||
|
Operating
costs and expenses
|
470
|
502
|
494
|
|||||||||
|
Operating
income
|
$
|
6
|
$
|
3
|
$
|
25
|
||||||
|
Income
from continuing operations*
|
$
|
20
|
$
|
13
|
$
|
32
|
||||||
|
Net
income
|
$
|
20
|
$
|
13
|
$
|
32
|
||||||
* Includes earnings from equity
method investments held by the investee.
Real Estate: At December 31,
2009, the Company and its real estate subsidiaries had investments in various
joint ventures that operate and/or develop real estate. The Company does not
have a controlling financial interest in any of these ventures and, accordingly,
accounts for its investments in the real estate ventures using the equity method
of accounting. A summary of the Company’s principal investments is as
follows:
|
a)
|
Kukui’ula: In
April 2002, the Company entered into a joint venture with DMB Communities
II, an affiliate of DMB Associates, Inc., an Arizona-based developer of
master-planned communities (“DMB”), for the development of Kukui’ula, a
1,000-acre master planned resort residential community located in Poipu,
Kauai, planned for approximately 1,000 to 1,200 high-end residential
units. The capital contributed by A&B to the joint venture, including
the value of land initially contributed, was $138 million as of December
31, 2009, and DMB has contributed $161 million. The Company has a
50-percent voting interest in the
venture.
|
|
b)
|
Kai
Malu at Wailea: In April 2004, the Company entered into a joint
venture with Armstrong Builders, Ltd. for development of the 25-acre MF-8
parcel at Wailea into 150 duplex units. Sales commenced in
2006, with 135 units closed as of year end. As of December 31, 2009, six
of the remaining 15 units have been leased. The Company has a 50-percent
voting interest in the venture.
|
|
c)
|
Ka
Milo at Mauna Lani: In April 2004, the Company entered into a
joint venture with Brookfield Homes Hawaii Inc. to develop a 30.5-acre
residential parcel in the Mauna Lani Resort on the island of Hawaii. A
total of 27 units were constructed in 2007 and 2008 and, as of year-end
2009, 20 units had closed. In December 2009, the project’s construction
loan, with a year-end balance of $15.8 million, matured. The venture is
negotiating with the lender to refinance the loan (see Note 12). Due to
market conditions, the Company recorded an impairment loss of
approximately $2.5 million in December 2009. Construction of the remaining
units in the project has been deferred until a new business plan is
evaluated for the future construction of the remaining units. The Company
has a 50-percent voting interest in the
venture.
|
|
d)
|
Crossroads
Plaza: In June 2004, the Company entered into a joint venture with
Intertex Hasley, LLC, for the development of a 56,000-square-foot
mixed-use neighborhood retail center on 6.5 acres of commercial-zoned land
in Valencia, California. The property was acquired in August 2004 and
construction of the center was completed in 2008. In August 2009, a $12
million construction loan held by the venture matured. The joint venture
is currently negotiating with the lender to extend the maturity date of
the loan (see Note 12). As of December 31, 2009, occupancy was 85 percent.
The Company has a 50-percent voting interest in the
venture.
|
|
e)
|
Bridgeport
Marketplace: In July 2005, the Company entered into a joint venture with
Intertex Bridgeport Marketplace, LLC for the development of a 27.8
acres in Valencia, California. Construction of the center was completed in
2009 and is 95 percent leased. The Company has a 50-percent voting
interest in the venture.
|
|
f)
|
Waiawa: In
August 2006, the Company entered into a joint venture with an affiliate of
Gentry Investment Properties, for the development of a 1,000-acre
master-planned primary residential community (530 residential-zoned acres)
in Central Oahu. In the second half of 2009, the master development
agreement for the Waiawa lands between Kamehameha Schools and Gentry was
terminated. However, because the joint venture has fee simple ownership,
or the right to acquire at no cost, approximately 58 acres of developable
land, in addition to 125 acres of gulch land required for the major
project land bridge and road leading to the project, the venture and the
Company continue to evaluate their options for the development of this
master-planned community. The Company has a 50-percent voting interest in
the venture.
|
|
g)
|
Bakersfield: In
November 2006, the Company entered into a joint venture with Intertex
P&G Retail, LLC, for the planned development of a 575,000 square-foot
retail center on a 57.3-acre commercial parcel in Bakersfield, California.
The parcel was acquired in November 2006. Development plans remain on hold
due to current economic conditions. The Company has a
50-percent voting interest in the
venture.
|
|
h)
|
Kukui’ula
Village: In August 2007, the Company entered into a joint
venture with DMB Kukui`ula Village LLC for the development of Kukui’ula
Village, a planned 91,700 square-foot commercial center located at the
entrance of the Kukui’ula project. Construction on 83,600 square feet
commenced in 2008, was completed in March 2009, and the center opened for
business in August 2009. As of December 31, 2009, the center was 56
percent leased. The Company has a 50-percent voting interest in the
venture.
|
|
i)
|
Santa
Barbara Ranch: In November 2007, the Company entered into a
joint venture with Vintage Communities, LLC (“Vintage”), a residential
developer headquartered in Newport Beach, California. Vintage and its
affiliates intend to develop 1,040 acres for an exclusive large-lot
subdivision, located 12 miles north of the City of Santa Barbara. The
joint venture owns approximately 22 acres in the project. In 2008, due to
the deterioration in the local real estate market, the Company recorded a
$3 million impairment loss. Additionally, in 2008, because the Company
declined to provide any further equity funding, Vintage and its affiliate
had the option to purchase the Company’s investment for $15 million plus a
12 percent preferred return (“Preferred Return”). Since Vintage and its
affiliate failed to exercise this option, the Company, in its sole
discretion, has the right to cause the joint venture to sell certain Santa
Barbara land parcels to satisfy the Company’s investment basis plus the
Preferred Return. The Company continues to evaluate alternatives to
maximize the value of the venture’s assets that serve as collateral for
the repayment of its investment. The Company has a 50-percent voting
interest in the venture.
|
|
j)
|
Palmdale
Trade & Commerce Center: In December 2007, the Company
entered into a joint venture with Intertex Palmdale Trade & Commerce
Center LLC, for the planned development of a 315,000 square-foot mixed-use
commercial office and light industrial condominium complex on 18.2 acres
in Palmdale, California, located 60 miles northeast of Los Angeles and 25
miles northeast of Valencia. The parcel was contributed to the venture in
2008. Development plans were placed on hold due to current market
conditions, although the venture is continuing with water infrastructure
work. The Company has a 50-percent voting interest in the
venture.
|
Transportation: Matson
owns a 35-percent membership interest in an LLC with SSA Marine Inc., named SSA
Terminals, LLC (“SSAT”), which provides stevedoring and terminal services at
five terminals in three West Coast ports to the Company and other shipping
lines. Matson accounts for its interest in SSAT under the equity method of
accounting. The “Cost of transportation services” included approximately $135
million, $145 million, and $150 million for 2009, 2008, and 2007, respectively,
paid to this unconsolidated affiliate for terminal services.
The Company’s equity in earnings of
its unconsolidated transportation affiliate of $6 million, $5 million, and $11
million for 2009, 2008, and 2007, respectively, were included on the
consolidated statements of income with costs of transportation services because
the affiliate is integrally related to the Company’s Ocean Transportation
segment, providing all terminal services to Matson on the U.S. West
Coast.
5. PROPERTY
Property on the consolidated balance
sheets includes the following (in millions):
|
2009
|
2008
|
|||||||
|
Vessels
|
$
|
1,216
|
$
|
1,209
|
||||
|
Machinery
and equipment
|
609
|
596
|
||||||
|
Buildings
|
507
|
522
|
||||||
|
Land
|
165
|
146
|
||||||
|
Water,
power and sewer systems
|
119
|
115
|
||||||
|
Other
property improvements
|
99
|
112
|
||||||
|
Total
|
2,715
|
2,700
|
||||||
|
Less
accumulated depreciation and amortization
|
(1,179
|
)
|
(1,110
|
)
|
||||
|
Property
– net
|
$
|
1,536
|
$
|
1,590
|
||||
6. CAPITAL
CONSTRUCTION FUND
Matson is party to an agreement with
the United States government that established a Capital Construction Fund
(“CCF”) under provisions of the Merchant Marine Act, 1936, as amended. The
agreement has program objectives for the acquisition, construction, or
reconstruction of vessels and for repayment of existing vessel indebtedness.
Deposits to the CCF are limited by certain applicable earnings. Such deposits
are tax deductions in the year made; however, they are taxable, with interest
payable from the year of deposit, if withdrawn for general corporate purposes or
other non-qualified purposes, or upon termination of the agreement. Qualified
withdrawals for investment in vessels and certain related equipment do not give
rise to a current tax liability, but reduce the depreciable bases of the vessels
or other assets for income tax purposes.
Amounts deposited into the CCF are a
preference item for calculating federal alternative minimum taxable income.
Deposits not committed for qualified purposes within 25 years from the date of
deposit will be treated as non-qualified withdrawals over the subsequent five
years.
Under the terms of the CCF agreement,
Matson may designate certain qualified earnings as “accrued deposits” or may
designate, as obligations of the CCF, qualified withdrawals to reimburse
qualified expenditures initially made with operating funds. Such accrued
deposits to, and withdrawals from, the CCF are reflected on the consolidated
balance sheets either as obligations of the Company’s current assets or as
receivables from the CCF. At December 31, 2009, Matson has accrued a $4.4
million withdrawal from the CCF and a $4.4 million deposit to the CCF,
reflecting a zero net balance in the consolidated balance sheets.
As of December 31, 2009, there was no
CCF deposit balance. As of December 31, 2008, the balance on deposit in the CCF
totaled $0.1 million.
7. NOTES
PAYABLE AND LONG-TERM DEBT
At
December 31, 2009 and 2008, notes payable and long-term debt consisted of the
following (in millions):
|
2009
|
2008
|
|||||||
|
Revolving
Credit loans, (0.68% for 2009 and 1.16% for
2008)
|
$
|
34
|
$
|
135
|
||||
|
Title
XI Bonds:
|
||||||||
|
5.27%,
payable through 2029
|
44
|
46
|
||||||
|
5.34%,
payable through 2028
|
42
|
44
|
||||||
|
Term
Loans:
|
||||||||
|
6.90%,
payable through 2020
|
100
|
--
|
||||||
|
4.79%,
payable through 2020
|
73
|
81
|
||||||
|
5.55%,
payable through 2017
|
50
|
50
|
||||||
|
5.53%,
payable through 2016
|
50
|
50
|
||||||
|
4.10%,
payable through 2012
|
25
|
30
|
||||||
|
5.56%,
payable through 2016
|
25
|
25
|
||||||
|
6.20%,
payable through 2013
|
11
|
11
|
||||||
|
6.38%,
payable through 2017
|
8
|
8
|
||||||
|
7.42%,
payable through 2010
|
3
|
6
|
||||||
|
4.31%,
payable through 2010
|
3
|
6
|
||||||
|
5.88%,
payable through 2014
|
3
|
3
|
||||||
|
7.55%,
payable through 2009
|
--
|
7
|
||||||
|
7.57%,
payable through 2009
|
--
|
2
|
||||||
|
Total
debt
|
471
|
504
|
||||||
|
Less
current portion
|
(65
|
)
|
(52
|
)
|
||||
|
Long-term
debt
|
$
|
406
|
$
|
452
|
||||
Long-term Debt
Maturities: At December 31, 2009,
debt maturities during the next five years and thereafter are $65 million in
2010, $27 million in 2011, $39 million in 2012, $40 million in 2013, $48 million
in 2014 and $252 million thereafter.
Revolving Credit
Facilities:
The Company has two revolving senior credit facilities with six commercial banks
that expire in December 2011. The revolving credit facilities provide for an
aggregate commitment of $325 million, which consists of $225 million and $100
million facilities for A&B and Matson, respectively. Amounts drawn under the
facilities bear interest at London Interbank Offered Rate (“LIBOR”) plus a
spread ranging from 0.225 percent to 0.475 percent based on the Company’s
S&P rating. The agreement contains certain restrictive covenants, the most
significant of which requires the maintenance of minimum shareholders’ equity
levels, minimum unencumbered property investment values, and a maximum ratio of
debt to earnings before interest, depreciation, amortization and taxes. At
December 31, 2009, $34 million was outstanding and classified as current, $10
million in letters of credit had been issued against the facility, and $281
million remained available for borrowing.
Matson has a $105 million secured
reducing revolving credit agreement with DnB NOR Bank ASA and ING Bank N.V. that
expires in June 2015. The maximum amount that can be outstanding on the facility
declines in eight annual commitment reductions of $10.5 million each, commencing
in June 2007. The incremental borrowing rate for the facility is 0.225 percent
over LIBOR through June 2010. For the remaining term, the incremental borrowing
rate is 0.300 percent over LIBOR. The agreement contains certain restrictive
covenants, the most significant of which requires the maintenance of minimum net
worth levels, minimum working capital levels, and maximum ratio of long-term
debt to net worth. At December 31, 2009, no amount was outstanding and
approximately $74 million remained available for borrowing.
The Company has a replenishing $400
million three-year unsecured note purchase and private shelf agreement with
Prudential Investment Management, Inc. and its affiliates (collectively,
“Prudential”) under which the Company may issue notes in an aggregate amount up
to $400 million, less the sum of all principal amounts then outstanding on any
notes issued by the Company or any of its subsidiaries to Prudential and the
amount of any notes that are committed under the note purchase agreement. The
Prudential agreement contains certain restrictive covenants that are
substantially the same as the covenants contained in the aggregate $325 million
revolving senior credit facilities. In 2009, the Company borrowed $100 million
at 6.9% with a final maturity in March 2020. The ability to draw additional
amounts under the Prudential facility expires on April 19, 2012 and borrowings
under the shelf facility bear interest at rates that are determined at the time
of the borrowing. At December 31, 2009, approximately $71 million was available
under the facility.
The unused borrowing capacity under all
revolving credit and term facilities as of December 31, 2009 totaled $426
million.
Title XI Bonds: In
August 2004, Matson partially financed the delivery of the MV Maunawili with
$55 million of 5.27 percent fixed-rate, 25-year term, U.S. government
Guaranteed Ship Financing Bonds, more commonly known as Title XI bonds. These
bonds, which are secured by the MV Maunawili, are payable in
$1.1 million semiannual payments.
In September 2003, Matson partially
financed the delivery of the MV Manukai with
$55 million of 5.34 percent fixed-rate, 25-year term, Title XI bonds. These
bonds, which are secured by the MV Manukai, are payable in
$1.1 million semiannual payments.
Vessel Secured Term
Debt: Matson has an Amended and Restated Note Agreement with
The Prudential Insurance Company of America and Pruco Life Insurance for $120
million. Included in the agreement are Series A and Series B notes. Series A
represents a $15 million note and Series B represents 15-year term notes
totaling $105 million. Both series are secured by the MV Manulani. The Series A
note carries interest at 4.31 percent with $3 million currently outstanding. The
Series B notes carry interest at 4.79 percent with $73 million currently
outstanding.
Real Estate Secured Term
Debt: In June 2005, A&B Properties, Inc., a wholly owned
subsidiary of the Company, assumed $11.4 million of secured debt in connection
with the purchase of an office building in Phoenix, Arizona. This term loan,
with an outstanding amount of $11 million at December 31, 2009, carries interest
at 6.2 percent and matures in October 2013.
In December 2008, A&B Properties,
Inc. assumed approximately $13 million of secured debt, with a fair value of $11
million at the time of acquisition, under two notes in connection with the
purchase of the Midstate 99 Distribution Center in Visalia, California. At
December 31, 2009, the notes had outstanding amounts of $8 million and $3
million, and carry interest at 6.38 percent and 5.88 percent, respectively. The
$9 million note matures in August 2017 and the $4 million note matures in April
2014.
8. LEASES
The Company as Lessee: Principal non-cancelable
operating leases include land, office and terminal facilities, containers and
equipment, leased for periods that expire through 2036. Management expects that,
in the normal course of business, most operating leases will be renewed or
replaced by other similar leases. Rental expense under operating leases totaled
$30 million, $31 million, and $32 million for 2009, 2008, and 2007,
respectively. Rental expense for operating leases that provide for future
escalations are accounted for on a straight-line basis. Future minimum payments
under non-cancelable operating leases as of December 31, 2009 were as follows
(in millions):
|
Operating
Leases
|
||||
|
2010
|
$
|
14
|
||
|
2011
|
13
|
|||
|
2012
|
12
|
|||
|
2013
|
12
|
|||
|
2014
|
11
|
|||
|
Thereafter
|
25
|
|||
|
Total
minimum lease payments
|
$
|
87
|
||
In addition to the future minimum lease
payments above, the Company has an operating lease for terminal facilities in
Honolulu that includes a minimum annual commitment, which is calculated by the
lessor based on capital improvements by the lessor and an allocation of lessor
operating expenses. The Company’s payments of volume-based charges to the lessor
must meet or exceed the minimum annual commitment. The Company’s volume-based
payments to the lessor were approximately $16 million in 2009, $16 million in
2008, and $17 million in 2007, and there were no minimum annual guarantee
payments in any year.
The Company as Lessor: The Company leases
land, buildings, and land improvements under operating leases. The historical
cost of, and accumulated depreciation on, leased property at December 31, 2009
and 2008 were as follows (in millions):
|
2009
|
2008
|
|||||||
|
Leased
property - real estate
|
$
|
694
|
$
|
693
|
||||
|
Less
accumulated depreciation
|
(101
|
)
|
(102
|
)
|
||||
|
Property
under operating leases - net
|
$
|
593
|
$
|
591
|
||||
Total rental income under these
operating leases for each of the three years in the period ended December 31,
2009 was as follows (in millions):
|
2009
|
2008
|
2007
|
||||||||||
|
Minimum
rentals
|
$
|
78
|
$
|
82
|
$
|
80
|
||||||
|
Contingent
rentals (based on sales volume)
|
3
|
4
|
4
|
|||||||||
|
Total
|
$
|
81
|
$
|
86
|
$
|
84
|
||||||
Future
minimum rentals on non-cancelable leases at December 31, 2009 were as follows
(in millions):
|
Operating
Leases
|
||||
|
2010
|
$
|
67
|
||
|
2011
|
57
|
|||
|
2012
|
43
|
|||
|
2013
|
33
|
|||
|
2014
|
24
|
|||
|
Thereafter
|
80
|
|||
|
Total
|
$
|
304
|
||
9. EMPLOYEE
BENEFIT PLANS
The Company has funded single-employer
defined benefit pension plans that cover substantially all non-bargaining unit
employees and certain bargaining unit employees. In addition, the
Company has plans that provide certain retiree health care and life insurance
benefits to substantially all salaried and to certain hourly employees.
Employees are generally eligible for such benefits upon retirement and
completion of a specified number of years of credited service. The Company does
not pre-fund these benefits and has the right to modify or terminate certain of
these plans in the future. Certain groups of retirees pay a portion of the
benefit costs.
Plan Administration, Investments and
Asset Allocations: The Company has an Investment Committee
that meets regularly with investment advisors to establish investment policies,
direct investments and select investment options. The Investment Committee is
also responsible for appointing investment managers. The Company’s investment
policy permits investments in marketable equity securities, such as domestic and
foreign stocks, domestic and foreign bonds, venture capital, real estate
investments, and cash equivalents. The Company’s investment policy does not
permit investment in certain types of assets, such as options, commodities, or
real estate mortgages, or the use of certain strategies, such as short selling
or the purchase of securities on margin.
The Company’s investment strategy for
its pension plan assets is to achieve a diversified mix of investments that
provides for attractive long-term growth with an acceptable level of risk, but
also to provide sufficient liquidity to fund ongoing benefit payments. The
Company has engaged a number of investment managers to implement various
investment strategies to achieve the desired asset class mix, liquidity and risk
diversification objectives. The Company’s weighted-average asset allocations at
December 31, 2009 and 2008, and 2009 year-end target allocation, by asset
category, were as follows:
|
Target
|
2009
|
2008
|
|||||||
|
Domestic
equity securities
|
60
|
%
|
61
|
%
|
50
|
%
|
|||
|
International
equity securities
|
10
|
%
|
11
|
%
|
12
|
%
|
|||
|
Debt
securities
|
15
|
%
|
15
|
%
|
9
|
%
|
|||
|
Real
estate
|
15
|
%
|
8
|
%
|
16
|
%
|
|||
|
Other
and cash
|
-
|
-
|
5
|
%
|
13
|
%
|
|||
|
Total
|
100
|
%
|
100
|
%
|
100
|
%
|
|||
The Company’s investments in equity
securities primarily include domestic large-cap and mid-cap companies, but also
include an allocation to international equity securities. Equity investments in
the defined benefit plan assets do not include any direct holdings of the
Company’s stock but may include such holdings to the extent that the stock is
included as part of certain mutual fund holdings. Debt securities include
investment-grade and high-yield corporate bonds from diversified industries,
mortgage-backed securities, and U.S. Treasuries. Other types of investments
include private equity investments in commercial real estate assets, and to a
lesser extent, private equity investments in technology companies.
The expected return on plan assets is
principally based on the Company’s historical returns combined with the
Company’s long-term future expectations regarding asset class returns, the mix
of plan assets, and inflation assumptions. One-, three-, and five-year pension
returns (losses) were 16.8 percent, (3.7) percent, and 3.0 percent,
respectively, and the long-term average return (since plan inception in 1989)
has been approximately 8.3 percent. Over the long-term, the actual returns
have generally exceeded the benchmark returns used by the Company to evaluate
performance of its fund managers. Due to volatile market performance in recent
years, the Company has reduced its long-term rate of return assumption from 8.5%
in 2009 to 8.25% in 2010 and believes that the change is appropriate given the
Company’s investment portfolio’s historical performance and the Company’s target
asset allocation.
The Company’s pension plan assets are
held in a master trust and stated at estimated fair value, which is based on the
fair values of the underlying investments. Purchases and sales of securities are
recorded on a trade-date basis. Interest income is recorded on the accrual
basis. Dividends are recorded on the ex-dividend date.
FASB ASC Topic 820, Fair Value Measurements and
Disclosures, establishes a fair value hierarchy, which requires the
pension plans to maximize the use of observable inputs and minimize the use of
unobservable inputs when measuring fair value. The hierarchy places the highest
priority on unadjusted quoted market prices in active markets for identical
assets or liabilities (level 1 measurements) and assigns the lowest priority to
unobservable inputs (level 3 measurements). The three levels of inputs within
the hierarchy are defined as follows:
Level 1:
Quoted prices (unadjusted) for identical assets or liabilities in active
markets.
Level 2:
Significant other observable inputs other than level 1 prices such as quoted
prices for similar assets or liabilities; quoted prices in markets that are not
active; or other inputs that are observable or can be corroborated by observable
market data.
Level 3:
Significant unobservable inputs that reflect the pension plans’ own assumptions
about the assumptions that market participants would use in pricing an asset or
liability.
If the technique used to measure fair
value includes inputs from multiple levels of the fair value hierarchy, the
lowest level of significant input determines the placement of the entire fair
value measurement in the hierarchy.
Equity
Securities: Domestic and
international common stocks are valued by obtaining quoted prices on recognized
and highly liquid exchanges.
Fixed Income Securities:
Corporate bonds and U.S. government treasury and agency securities are valued
based upon the closing price reported in the active market in which the security
is traded. U.S. government agency and corporate asset-backed securities may
utilize models, such as a matrix pricing model, that incorporates other
observable inputs such as cash flow, security structure, or market information,
when broker/dealer quotes are not available.
Real Estate, Private Equity, and
Insurance Contract Interests: The fair value of real estate, private
equity, and insurance contract interests are determined by the issuer based on
the unit values of the funds. Unit values are determined by dividing the fund’s
net assets by the number of units outstanding at the valuation date. Fair value
for underlying investments in real estate is determined through independent
property appraisals. Fair value of underlying investments in private equity
assets is determined based on information provided by the general partner taking
into consideration the purchase price of the underlying securities, developments
concerning the investee company subsequent to the acquisition of the investment,
financial data and projections of the investee company provided to the general
partner, and such other factors as the general partner deems relevant. Insurance
contracts are principally invested in real estate assets, which are valued based
on independent appraisals.
The fair values of the Company’s
pension plan assets at December 31, 2009, by asset category, are as follows (in
millions):
|
Fair
Value Measurements as of
|
||||||||||||||
|
December
31, 2009
|
||||||||||||||
|
Total
|
Quoted
Prices in Active Markets
(Level
1)
|
Significant
Observable Inputs (Level 2)
|
Significant
Unobservable Inputs (Level 3)
|
|||||||||||
|
Asset
Category
|
||||||||||||||
|
Cash
|
$
|
7
|
$
|
7
|
$
|
--
|
$
|
--
|
||||||
|
Equity
securities:
|
||||||||||||||
|
U.S. large-cap
|
121
|
121
|
--
|
--
|
||||||||||
|
U.S. mid- and
small-cap
|
36
|
36
|
--
|
--
|
||||||||||
|
International
large-cap
|
30
|
30
|
--
|
--
|
||||||||||
|
Fixed
income securities:
|
||||||||||||||
|
U.S.
Treasuries
|
1
|
--
|
1
|
--
|
||||||||||
|
Investment grade U.S.
corporate bonds
|
2
|
--
|
2
|
--
|
||||||||||
|
High-yield U.S. corporate
bonds
|
8
|
--
|
8
|
--
|
||||||||||
|
Mortgage-backed
securities
|
28
|
--
|
28
|
--
|
||||||||||
|
Other
types of investments:
|
||||||||||||||
|
Real estate partnerships
interests
|
23
|
--
|
--
|
23
|
||||||||||
|
Private equity partnership
interests (a)
|
3
|
--
|
--
|
3
|
||||||||||
|
Insurance
contracts
|
1
|
--
|
--
|
1
|
||||||||||
|
Total
|
$
|
260
|
$
|
194
|
$
|
39
|
$
|
27
|
||||||
|
(a)
|
This
category represents private equity funds that invest principally in U.S.
technology companies.
|
The table below presents a
reconciliation of all pension plan investments measured at fair value on a
recurring basis using significant unobservable inputs (level 3) for the year
ended December 31, 2009 (in millions):
|
Fair
Value Measurements Using Significant
|
|||||||||||||||
|
Unobservable
Inputs (Level 3)
|
|||||||||||||||
|
Real
Estate
|
Private
Equity
|
Insurance
|
Total
|
||||||||||||
|
Beginning
balance, January 1, 2009
|
$
|
38
|
$
|
4
|
$
|
1
|
$
|
43
|
|||||||
|
Actual
return on plan assets:
|
|||||||||||||||
|
Assets held at the reporting
date
|
(13
|
)
|
(1
|
)
|
--
|
(14
|
)
|
||||||||
|
Assets sold during the
period
|
--
|
--
|
--
|
--
|
|||||||||||
|
Purchases,
sales and settlements
|
(2
|
)
|
--
|
--
|
(2
|
)
|
|||||||||
|
Ending
balance, December 31, 2009
|
$
|
23
|
$
|
3
|
$
|
1
|
$
|
27
|
|||||||
Contributions are determined annually
for each plan by the Company’s pension administrative committee, based upon the
actuarially determined minimum required contribution under the Employee
Retirement Income Security Act of 1974 (“ERISA”), as amended, the Pension
Protection Act of 2006 (the “Act”), and the maximum deductible contribution
allowed for tax purposes. For the plans covering employees who are members of
collective bargaining units, the benefit formulas are determined according to
the collective bargaining agreements, either using career average pay as the
base or a flat dollar amount per year of service. The benefit formulas for the
remaining defined benefit plans are based on final average pay. The Company did
not make any contributions during 2009 or 2008 to its defined benefit pension
plans. In 2010, the Company expects to make required contributions of
approximately $0.5 million. The Company’s funding policy is to contribute cash
to its pension plans so that it meets at least the minimum contribution
requirements.
New employees earn retirement benefits
based on a fixed percentage of their eligible compensation, plus interest. The
plan interest credit rate will vary from year-to-year based on the ten-year U.S.
Treasury rate. Employees hired on or after January 1, 2008 are fully vested upon
completion of three years of service.
Benefit Plan Assets and
Obligations: The measurement date for the Company’s benefit
plan disclosures is December 31st of
each year. The status of the funded defined benefit pension plan and the
unfunded accumulated post-retirement benefit plans at December 31, 2009 and
2008 are shown below (in millions):
|
Pension
Benefits
|
Other
Post-retirement Benefits
|
|||||||||||||||
|
2009
|
2008
|
2009
|
2008
|
|||||||||||||
|
Change
in Benefit Obligation
|
||||||||||||||||
|
Benefit
obligation at beginning of year
|
$
|
314
|
$
|
303
|
$
|
52
|
$
|
48
|
||||||||
|
Service
cost
|
8
|
8
|
1
|
1
|
||||||||||||
|
Interest
cost
|
19
|
19
|
3
|
3
|
||||||||||||
|
Plan
participants’ contributions
|
--
|
--
|
2
|
2
|
||||||||||||
|
Actuarial
(gain) loss
|
(3
|
)
|
(1
|
)
|
1
|
2
|
||||||||||
|
Benefits
paid
|
(17
|
)
|
(16
|
)
|
(5
|
)
|
(5
|
)
|
||||||||
|
Settlements
|
--
|
(1
|
)
|
--
|
--
|
|||||||||||
|
Amendments
|
1
|
2
|
--
|
1
|
||||||||||||
|
Benefit
obligation at end of year
|
$
|
322
|
$
|
314
|
$
|
54
|
$
|
52
|
||||||||
|
Change
in Plan Assets
|
||||||||||||||||
|
Fair
value of plan assets at beginning of year
|
244
|
379
|
--
|
--
|
||||||||||||
|
Actual
return on plan assets
|
33
|
(118
|
)
|
--
|
--
|
|||||||||||
|
Settlements
|
--
|
(1
|
)
|
--
|
--
|
|||||||||||
|
Benefits
paid
|
(17
|
)
|
(16
|
)
|
--
|
--
|
||||||||||
|
Fair
value of plan assets at end of year
|
$
|
260
|
$
|
244
|
$
|
--
|
$
|
--
|
||||||||
|
Funded
Status and Recognized Liability
|
$
|
(62
|
)
|
$
|
(70
|
)
|
$
|
(54
|
)
|
$
|
(52
|
)
|
||||
The accumulated benefit obligation for
the Company’s qualified pension plans were $297 million and $284 million as of
December 31, 2009 and 2008, respectively. Amounts recognized on the consolidated
balance sheets and in accumulated other comprehensive loss at December 31, 2009
and 2008 are as follows (in millions):
|
Pension
Benefits
|
Other
Post-retirement Benefits
|
|||||||||||||||
|
2009
|
2008
|
2009
|
2008
|
|||||||||||||
|
Non-current
assets
|
$
|
3
|
$
|
3
|
$
|
--
|
$
|
--
|
||||||||
|
Current
liabilities
|
--
|
--
|
(3
|
)
|
(3
|
)
|
||||||||||
|
Non-current
liabilities
|
(65
|
)
|
(73
|
)
|
(51
|
)
|
(49
|
)
|
||||||||
|
Total
|
$
|
(62
|
)
|
$
|
(70
|
)
|
$
|
(54
|
)
|
$
|
(52
|
)
|
||||
|
Net
loss (gain) (net of taxes)
|
$
|
70
|
$
|
87
|
$
|
--
|
$
|
(1
|
)
|
|||||||
|
Unrecognized
prior service cost (net of taxes)
|
3
|
3
|
--
|
--
|
||||||||||||
|
Total
|
$
|
73
|
$
|
90
|
$
|
--
|
$
|
(1
|
)
|
|||||||
The
information for qualified pension plans with an accumulated benefit obligation
in excess of plan assets at December 31, 2009 and 2008 is shown below (in
millions):
|
2009
|
2008
|
|||||||
|
Projected
benefit obligation
|
$
|
269
|
$
|
248
|
||||
|
Accumulated
benefit obligation
|
$
|
248
|
$
|
221
|
||||
|
Fair
value of plan assets
|
$
|
208
|
$
|
177
|
||||
The estimated prior service cost for
the defined benefit pension plans that will be amortized from accumulated other
comprehensive loss into net periodic benefit cost in 2010 is $0.7 million. The
estimated net loss that will be recognized in net periodic pension cost for the
defined benefit pension plans in 2010 is $8.3 million. The estimated prior
service cost and estimated net gain for the other defined benefit postretirement
plans that will be amortized from accumulated other comprehensive loss into net
periodic pension benefit in 2010 is negligible.
Unrecognized gains and losses of the
post-retirement benefit plans are amortized over five years. Although current
health costs are expected to increase, the Company attempts to mitigate these
increases by maintaining caps on certain of its benefit plans, using lower cost
health care plan options where possible, requiring that certain groups of
employees pay a portion of their benefit costs, self-insuring for certain
insurance plans, encouraging wellness programs for employees, and implementing
measures to mitigate future benefit cost increases.
The Company has determined that its
post-retirement prescription drug plans are actuarially equivalent to Part D of
the Medicare Prescription Drug Improvement and Modernization Act of 2003. The
2009 post-retirement obligations include the benefits of the Act’s subsidy.
These amounts are not material.
Components of the net periodic benefit
cost and other amounts recognized in other comprehensive loss for the defined
benefit pension plans and the post-retirement health care and life insurance
benefit plans during 2009, 2008, and 2007, are shown below (in
millions):
|
Pension
Benefits
|
Other
Post-retirement Benefits
|
||||||||||||||||||||||
|
2009
|
2008
|
2007
|
2009
|
2008
|
2007
|
||||||||||||||||||
|
Components
of Net Periodic
|
|||||||||||||||||||||||
|
Benefit
Cost/(Income)
|
|||||||||||||||||||||||
|
Service
cost
|
$
|
8
|
$
|
8
|
$
|
7
|
$
|
1
|
$
|
1
|
$
|
1
|
|||||||||||
|
Interest
cost
|
19
|
18
|
17
|
3
|
3
|
3
|
|||||||||||||||||
|
Expected
return on plan assets
|
(20
|
)
|
(32
|
)
|
(28
|
)
|
--
|
--
|
--
|
||||||||||||||
|
Amortization
of net (gain) loss
|
12
|
--
|
--
|
--
|
(1
|
)
|
--
|
||||||||||||||||
|
Amortization
of prior service cost
|
1
|
1
|
--
|
--
|
--
|
--
|
|||||||||||||||||
|
Recognition
of loss (gain) due to settlement
|
--
|
1
|
--
|
--
|
--
|
(1
|
)
|
||||||||||||||||
|
Net
periodic benefit cost/(income)
|
20
|
(4
|
)
|
(4
|
)
|
4
|
3
|
3
|
|||||||||||||||
|
Other
Changes in Plan Assets and Benefit Obligations Recognized in Other
Comprehensive Income (net of tax)
|
|||||||||||||||||||||||
|
Net
loss (gain)
|
(10
|
)
|
90
|
(12
|
)
|
1
|
1
|
(2
|
)
|
||||||||||||||
|
Amortization
of unrecognized (loss) gain
|
(7
|
)
|
--
|
--
|
--
|
1
|
--
|
||||||||||||||||
|
Prior
service cost
|
1
|
1
|
--
|
--
|
--
|
--
|
|||||||||||||||||
|
Amortization
of prior service cost
|
(1
|
)
|
--
|
--
|
--
|
--
|
--
|
||||||||||||||||
|
Total
recognized in other comprehensive income
|
(17
|
)
|
91
|
(12
|
)
|
1
|
2
|
(2
|
)
|
||||||||||||||
|
Total
recognized in net periodic benefit cost and
|
|||||||||||||||||||||||
|
other comprehensive
income
|
$
|
3
|
$
|
87
|
$
|
(16
|
)
|
$
|
5
|
$
|
5
|
$
|
1
|
||||||||||
The weighted average assumptions used
to determine benefit information during 2009, 2008, and 2007, were as
follows:
|
Pension
Benefits
|
Other
Post-retirement Benefits
|
||||||||||||||||||||||
|
2009
|
2008
|
2007
|
2009
|
2008
|
2007
|
||||||||||||||||||
|
Weighted
Average Assumptions:
|
|||||||||||||||||||||||
|
Discount
rate
|
6.25
|
%
|
6.25
|
%
|
6.25
|
%
|
6.25
|
%
|
6.25
|
%
|
6.25
|
%
|
|||||||||||
|
Expected
return on plan assets
|
8.50
|
%
|
8.50
|
%
|
8.50
|
%
|
|||||||||||||||||
|
Rate
of compensation increase
|
4.00
|
%
|
4.00
|
%
|
4.00
|
%
|
4.00
|
%
|
4.00
|
%
|
4.00
|
%
|
|||||||||||
|
Initial
health care cost trend rate
|
9.00
|
9.00
|
%
|
9.00
|
%
|
||||||||||||||||||
|
Ultimate
rate
|
5.00
|
5.00
|
%
|
5.00
|
%
|
||||||||||||||||||
|
Year
ultimate rate is reached
|
2014
|
2013
|
2012
|
||||||||||||||||||||
As a result of a decline in the
market value of the Company’s plan assets in 2008, the expected return on plan
assets had decreased in 2009 and the amortization of net loss had increased,
resulting in a net periodic pension cost of $20 million for 2009.
If the assumed health care cost trend
rate were increased or decreased by one percentage point, the accumulated
post-retirement benefit obligation, as of December 31, 2009, 2008, and 2007 and
the net periodic post-retirement benefit cost for 2009, 2008 and 2007, would
have increased or decreased as follows (in millions):
|
Other
Post-retirement Benefits
|
||||||||||||||||||||||
|
One
Percentage Point
|
||||||||||||||||||||||
|
Increase
|
Decrease
|
|||||||||||||||||||||
|
2009
|
2008
|
2007
|
2009
|
2008
|
2007
|
|||||||||||||||||
|
Effect
on total of service and interest cost components
|
$
|
--
|
$
|
--
|
$
|
--
|
$
|
--
|
$
|
--
|
$
|
--
|
||||||||||
|
Effect
on post-retirement benefit obligation
|
$
|
5
|
$
|
5
|
$
|
5
|
$
|
(4
|
)
|
$
|
(4
|
)
|
$
|
(4
|
)
|
|||||||
Non-qualified Benefit
Plans: The Company has non-qualified supplemental pension
plans covering certain employees and retirees, which provide for incremental
pension payments from the Company’s general funds so that total pension benefits
would be substantially equal to amounts that would have been payable from the
Company’s qualified pension plans if it were not for limitations imposed by
income tax regulations. The funded status, relating to these unfunded plans,
totaled $(34) million at December 31, 2009. A 5.0 percent discount rate was used
to determine the 2009 obligation. The expense associated with the non-qualified
plans was $3 million for the year ended December 31, 2009 and $4 million in each
year ended December 31, 2008 and 2007. As of December 31, 2009, the amount
recognized in accumulated other comprehensive income for unrecognized loss, net
of tax, was approximately $6 million, and the amount recognized as unrecognized
prior service credit, net of tax, was negligible. The estimated net loss and
prior service credit that will be recognized in net periodic pension cost in
2010 is negligible.
Estimated Benefit
Payments: The estimated future benefit payments for the next
ten years are as follows (in millions):
|
Pension
|
Non-qualified
|
Post-retirement
|
||||||||||
|
Year
|
Benefits
|
Plan
Benefits
|
Benefits
|
|||||||||
|
2010
|
$
|
18
|
$
|
23
|
$
|
3
|
||||||
|
2011
|
18
|
1
|
4
|
|||||||||
|
2012
|
19
|
1
|
4
|
|||||||||
|
2013
|
20
|
2
|
4
|
|||||||||
|
2014
|
21
|
1
|
4
|
|||||||||
|
2015-2019
|
118
|
9
|
21
|
|||||||||
Current liabilities of approximately
$26 million, related to non-qualified plan and postretirement benefits, are
classified as accrued and other liabilities in the consolidated balance sheet as
of December 31, 2009.
Multiemployer
Plans: Matson participates in 11 multiemployer plans and has
an estimated withdrawal obligation with respect to four of these plans that
totals approximately $89 million. Management has no present intention of
withdrawing from and does not anticipate termination of any of these plans.
Total contributions to the multiemployer pension plans covering personnel in
shoreside and seagoing bargaining units were $12 million in 2009, $13 million in
2008, and $12 million in 2007.
Union collective bargaining
agreements provide that total employer contributions during the terms of the
agreements must be sufficient to meet the normal costs and amortization payments
required to be funded during those periods. Contributions are generally based on
union labor paid or cargo volume. A portion of such contributions is for
unfunded accrued actuarial liabilities of the plans being funded over periods of
25 to 40 years, which began between 1967 and 1976.
The multiemployer plans are subject to
the plan termination insurance provisions of ERISA and are paying premiums to
the Pension Benefit Guaranty Corporation (“PBGC”). The statutes provide that an
employer who withdraws from, or significantly reduces its contribution
obligation to, a multiemployer plan generally will be required to continue
funding its proportional share of the plan’s unfunded vested
benefits.
Under special rules approved by the
PBGC and adopted by the Pacific Coast longshore plan in 1984, Matson could cease
Pacific Coast cargo-handling operations permanently and stop contributing to the
plan without any withdrawal liability, provided that the plan meets certain
funding obligations as defined in the plan. Accordingly, no withdrawal
obligation for this plan is included in the total estimated withdrawal
obligation.
Defined Contribution Plans:
The Company sponsors defined contribution plans that qualify under Section
401(k) of the Internal Revenue Code and provides matching contributions of up to
4% of eligible employee compensation. During 2009, the 401(k) matching
contributions were suspended for all employees who are participants in the
Company’s defined benefit plan. The Company’s matching contributions expensed
under these plans totaled $1.4 million, $2.0 million, and $1.9 million for the
years ended December 31, 2009, 2008, and 2007, respectively. The Company also
maintains profit sharing plans, and if a minimum threshold of Company
performance is achieved, provides contributions of 1 percent to 3 percent,
depending upon Company performance above the minimum threshold. In 2010, the
profit sharing plan was suspended. The contribution expense for these plans
totaled $1 million and $2 million for the years ended December 31, 2008 and
2007, respectively. There was no profit sharing contribution expense recorded in
2009.
10. INCOME
TAXES
The income tax expense on income from
continuing operations for each of the three years in the period ended
December 31, 2009 consisted of the following (in millions):
|
2009
|
2008
|
2007
|
||||||||||
|
Current:
|
||||||||||||
|
Federal
|
$
|
26
|
$
|
56
|
$
|
55
|
||||||
|
State
and Foreign
|
2
|
4
|
4
|
|||||||||
|
Current
|
28
|
60
|
59
|
|||||||||
|
Deferred
|
(20
|
)
|
(8
|
)
|
--
|
|||||||
|
Total
continuing operations tax expense
|
$
|
8
|
$
|
52
|
$
|
59
|
||||||
Income tax expense for 2009, 2008, and
2007 differs from amounts computed by applying the statutory federal rate to
income from continuing operations before income taxes for the following reasons
(in millions):
|
2009
|
2008
|
2007
|
||||||||||
|
Computed
federal income tax expense
|
$
|
7
|
$
|
49
|
$
|
55
|
||||||
|
State
income taxes
|
4
|
4
|
5
|
|||||||||
|
Tax
effect of HS&TC consolidation
|
(2
|
)
|
--
|
--
|
||||||||
|
Other—net
|
(1
|
)
|
(1
|
)
|
(1
|
)
|
||||||
|
Income
tax expense
|
$
|
8
|
$
|
52
|
$
|
59
|
||||||
The tax effects of temporary
differences that give rise to significant portions of the deferred tax assets
and deferred tax liabilities at December 31 of each year are as follows (in
millions):
|
2009
|
2008
|
|||||||
|
Deferred
tax assets:
|
||||||||
|
Capital
loss carry-forward
|
$
|
--
|
$
|
3
|
||||
|
Benefit
plans
|
70
|
75
|
||||||
|
Insurance
reserves
|
10
|
9
|
||||||
|
Other
|
12
|
11
|
||||||
|
Total
deferred tax assets
|
92
|
98
|
||||||
|
Deferred
tax liabilities:
|
||||||||
|
Basis
differences for property and equipment
|
287
|
304
|
||||||
|
Tax-deferred
gains on real estate transactions
|
197
|
181
|
||||||
|
Capital
Construction Fund
|
3
|
5
|
||||||
|
Joint
ventures and other investments
|
5
|
6
|
||||||
|
Other
|
22
|
17
|
||||||
|
Total
deferred tax liabilities
|
514
|
513
|
||||||
|
Net
deferred tax liability
|
$
|
422
|
$
|
415
|
||||
The realization of the deferred tax
assets related to the capital loss carryover is dependent upon the future
generation of capital gains. Management considers projected future transactions
and tax planning strategies in making this assessment. As of December 31, 2009,
the federal capital loss carryover has been fully utilized, and the Hawaii state
capital loss carryover was not material.
The Company also has California
alternative minimum tax credit carryforwards of approximately $1 million at
December 31, 2009 to reduce future California state income taxes over an
indefinite period.
The Company’s income taxes payable has
been reduced by the tax benefits from share-based compensation. The Company
receives an income tax benefit for exercised stock options calculated as the
difference between the fair market value of the stock issued at the time of
exercise and the option exercise price, tax effected. The Company also receives
an income tax benefit for non-vested stock and restricted stock units when they
vest, measured as the fair market value of the stock at the time of vesting, tax
effected. The net tax benefits from share-based transactions were $1.3 million
and $1.1 million for 2009 and 2008, respectively, and the portion of the tax
benefit related to the excess of the amount reported as expense over the tax
deduction was reflected as a reduction to additional capital in the consolidated
statements of shareholders’ equity.
A reconciliation of the beginning and
ending amount of gross unrecognized tax benefits is as follows (in
millions):
|
Balance
at January 1, 2007
|
$
|
10
|
||
|
Additions
for tax positions of prior years
|
3
|
|||
|
Reductions
for tax positions of prior years
|
(2
|
)
|
||
|
Reductions
for lapse of statute of limitations
|
(1
|
)
|
||
|
Balance
at December 31, 2007
|
10
|
|||
|
Additions
for tax positions of prior years
|
--
|
|||
|
Reductions
for tax positions of prior years
|
(1
|
)
|
||
|
Reductions
for lapse of statute of limitations
|
(3
|
)
|
||
|
Balance
at December 31, 2008
|
6
|
|||
|
Additions
for tax positions of prior years
|
--
|
|||
|
Additions
for tax positions of current year
|
3
|
|||
|
Reductions
for tax positions of prior years
|
|
--
|
||
|
Reductions
for lapse of statute of limitations
|
(1
|
)
|
||
|
Balance
at December 31, 2009
|
$
|
8
|
Of the total unrecognized benefits,
$8 million at December 31, 2009 and $6 million at December 31, 2008, represent
the amount that, if recognized, would favorably affect the Company’s effective
rate in future periods. The Company does not expect a material change
in gross unrecognized benefits in the next 12 months.
The
Company recognizes potential accrued interest and penalties related to
unrecognized tax benefits in income tax expense. To the extent interest and
penalties are not ultimately assessed with respect to the settlement of
uncertain tax positions, amounts accrued will be reduced and reflected as a
reduction of the overall income tax provision. As of December 31, 2009 the
amounts of accrued interest and penalty were not material.
The Company is no longer
subject to U.S. federal income tax audits for years before 2005. The Internal
Revenue Service may audit the Company’s federal income tax returns for years
subsequent to 2004. Additionally, the Company is routinely involved in state and
local income tax audits. Substantially all material income tax matters have been
concluded for years through 2004.
11. SHARE-BASED
AWARDS
2007 Incentive Compensation
Plan: The 2007 Incentive Compensation Plan (the “2007 Plan”) serves as a
successor to the 1998 Stock Option/Stock Incentive Plan, the 1998 Non-Employee
Director Stock Option Plan, the Restricted Stock Bonus Plan and the Non-Employee
Director Stock Retainer Plan (the “Predecessor Plans”). Under the 2007 Plan,
2,215,000 shares of common stock were initially reserved for issuance. As of
December 31, 2009, 826,480 shares of its common stock were reserved for future
issuance of share-based awards under the 2007 Plan. On January 28, 2010, the
Board of Directors adopted an amended and restated 2007 Plan, subject to
shareholder approval at the 2010 Annual Meeting of Shareholders, which, among
other things, authorizes the issuance of an additional 2,200,000 shares of
A&B stock under the 2007 Plan.
The 2007 Plan consists of four separate
incentive compensation programs: (i) the discretionary grant program, (ii) the
stock issuance program, (iii) the incentive bonus program and (iv) the automatic
grant program for the non-employee members of the Company’s Board of Directors.
Share-based compensation is generally awarded under three of the four programs,
as more fully described below.
Discretionary Grant Program –
Under the Discretionary Grant Program, stock options may be granted with an
exercise price no less than 100 percent of the fair market value (defined as the
closing market price) of the Company’s common stock on the date of the grant.
Options generally become exercisable ratably over three years and have a maximum
contractual term of 10 years. The Company estimates the grant-date fair value of
its stock options using a Black-Scholes-Merton option valuation
model.
Stock Issuance Program –
Under the Stock Issuance Program, shares of common stock or restricted stock
units may be granted. Time-based equity awards vest ratably over three years.
Provided certain performance targets are achieved, performance-based equity
awards (granted prior to December 31, 2008) vest after one year, and
performance-based equity awards granted after December 31, 2008 vest over three
years.
Automatic Grant Program – The
Automatic Grant Program supersedes and replaces the Company’s 1998 Non-Employee
Director Stock Option Plan and the Non-Employee Director Stock Retainer Plan. At
each annual shareholder meeting, non-employee directors will receive an award of
restricted stock units that entitle the holder to an equivalent number of shares
of common stock upon vesting. Awards of restricted stock units granted under the
program generally vest ratably over three years.
The shares of common stock authorized
to be issued under the 2007 Plan may be drawn from shares of the Company’s
authorized but unissued common stock or from shares of its common stock that the
Company acquires, including shares purchased on the open market or in private
transactions.
Predecessor Plans: Adopted in
1998, the Company’s 1998 Stock Option/Stock Incentive Plan (“1998 Plan”)
provided for the issuance of non-qualified stock options and common stock to
employees of the Company. Under the 1998 Plan, option prices could not be less
than the fair market value of the Company’s common stock on the dates of grant
and the options became exercisable over periods determined, at the dates of
grant, by the Compensation Committee of the A&B Board of Directors that
administers the plan. Generally, options vested ratably over three years and
expired ten years from the date of grant. Payments for options exercised may be
made in cash or in shares of the Company’s stock. If an option to purchase
shares is exercised within five years of the date of grant and if payment is
made in shares of the Company’s stock, the option holder may receive, under a
reload feature, a new stock option grant for such number of shares as is equal
to the number surrendered, with an option price not less than the greater of the
fair market value of the Company’s stock on the date of exercise or one and
one-half times the original option price. The 1998 Plan also permitted the
issuance of shares of the Company’s common stock. Generally, grants of
time-based, non-vested stock vests ratably over three years and
performance-based, non-vested stock vests in one year, provided that certain
performance targets are achieved. The 1998 Plan was superseded by the 2007 Plan
and no further grants will be made under the 1998 Plan.
Director Stock Option
Plans: The
1998 Director Stock Option Plan (“1998 Director Plan”) was superseded by the
2007 Plan. Under the 1998 Non-Employee Director Stock Option Plan, each
non-employee Director of the Company, elected at an Annual Meeting of
Shareholders, was automatically granted, on the date of each such Annual
Meeting, an option to purchase 8,000 shares of the Company’s common stock at the
fair market value of the shares on the date of grant. Each option to purchase
shares generally became exercisable ratably over three years following the date
granted.
The Company estimates the grant-date
fair value of its stock options using a Black-Scholes-Merton option-pricing
model.
The weighted average grant-date fair
values of the options granted during 2009, 2008, and 2007 were
$2.79, $7.88, and $10.91, respectively, per option, using the range
of assumptions provided in the table below:
|
2009
|
2008
|
2007
|
||||
|
Expected
volatility
|
24.8%
|
19.5%-19.8%
|
19.0%-19.5%
|
|||
|
Expected
term (in years)
|
5.8
|
5.8
|
5.8-5.9
|
|||
|
Risk-free
interest rate
|
1.9%
|
3.1%-3.5%
|
4.8%-5.0%
|
|||
|
Dividend
yield
|
5.4%
|
2.6%
|
2.1%-2.2%
|
|
|
•
|
Expected
volatility was primarily determined using the historical volatility of
A&B common stock over the expected term, but the Company may also
consider future events and other factors that it reasonably concludes
marketplace participants might
consider.
|
|
|
•
|
The
expected term of the awards represents expectations of future employee
exercise and post-vesting termination behavior and was primarily based on
historical experience. The Company analyzed various groups of employees
and considers expected or unusual trends that would likely affect this
assumption.
|
|
|
|
|
•
|
The
risk free interest rate was based on U.S. Government treasury yields for
periods equal to the expected term of the option on the grant
date.
|
|
|
•
|
The
expected dividend yield is based on the Company’s current and historical
dividend policy.
|
Application of alternative assumptions
could produce significantly different estimates of the fair value of share-based
compensation and, consequently, significantly affect the related amounts
recognized in the consolidated statements of income.
The following table summarizes 2009
stock option activity for the Company’s plans (in thousands, except exercise
price amounts):
|
Weighted
|
Weighted
|
|||||||||||||||||||||||||||
|
1998
|
1998
|
Average
|
Average
|
Aggregate
|
||||||||||||||||||||||||
|
2007
|
Employee
|
Director
|
Total
|
Exercise
|
Contractual
|
Intrinsic
|
||||||||||||||||||||||
|
Plan
|
Plan
|
Plan
|
Shares
|
Price
|
Life
|
Value
|
||||||||||||||||||||||
|
Outstanding
January 1, 2009
|
480 | 1,316 | 239 | 2,035 | $ | 39.71 | ||||||||||||||||||||||
|
Granted
|
478 | -- | -- | 478 | $ | 23.33 | ||||||||||||||||||||||
|
Exercised
|
-- | (11 | ) | -- | (11 | ) | $ | 26.24 | ||||||||||||||||||||
|
Forfeited
and expired
|
-- | (14 | ) | (43 | ) | (57 | ) | $ | 29.77 | |||||||||||||||||||
|
Outstanding
December 31, 2009
|
958 | 1,291 | 196 | 2,445 | $ | 36.80 | 5.5 | $ | 9,367 | |||||||||||||||||||
|
Vested
or expected to vest
|
948 | 1,278 | 194 | 2,420 | $ | 36.80 | 5.5 | $ | 9,273 | |||||||||||||||||||
|
Exercisable
December 31, 2009
|
161 | 1,199 | 196 | 1,556 | $ | 38.50 | 4.3 | $ | 4,002 | |||||||||||||||||||
The following table summarizes 2009
non-vested common stock and restricted stock unit activity (in thousands, except
weighted-average, grant-date fair value amounts):
|
Predecessor
|
||||||||||||||||
|
2007
|
Plans
|
|||||||||||||||
|
Plan
|
Weighted
|
Non-Vested
|
Weighted
|
|||||||||||||
|
Restricted
|
Average
|
Common
|
Average
|
|||||||||||||
|
Stock
|
Grant-Date
|
Stock
|
Grant-Date
|
|||||||||||||
|
Units
|
Fair
Value
|
Shares
|
Fair
Value
|
|||||||||||||
|
January
1, 2009
|
160 | $ | 46.68 | 94 | $ | 47.48 | ||||||||||
|
Granted
|
389 | $ | 23.59 | -- | -- | |||||||||||
|
Vested
|
(100 | ) | $ | 44.70 | (79 | ) | 47.34 | |||||||||
|
Forfeited
|
(22 | ) | $ | 28.47 | -- | -- | ||||||||||
|
Outstanding
December 31, 2009
|
427 | $ | 27.06 | 15 | 48.19 | |||||||||||
A summary of the compensation cost and
other measures related to share-based payments is as follows (in
millions):
|
2009
|
2008
|
2007
|
||||||||||
|
Share-based
expense (net of estimated forfeitures):
|
||||||||||||
|
Stock
options
|
$
|
4
|
$
|
3
|
$
|
3
|
||||||
|
Non-vested
stock & restricted stock units
|
5
|
8
|
13
|
|||||||||
|
Total
share-based expense
|
9
|
11
|
16
|
|||||||||
|
Total
recognized tax benefit
|
(3
|
)
|
(3
|
)
|
(4
|
)
|
||||||
|
Share-based
expense (net of tax)
|
$
|
6
|
$
|
8
|
$
|
12
|
||||||
|
Cash
received upon option exercise
|
$
|
--
|
$
|
2
|
$
|
6
|
||||||
|
Intrinsic
value of options exercised
|
$
|
--
|
$
|
1
|
$
|
5
|
||||||
|
Tax
benefit realized upon option exercise
|
$
|
--
|
$
|
1
|
$
|
2
|
||||||
|
Fair
value of stock vested
|
$
|
3
|
$
|
13
|
$
|
7
|
||||||
As of December 31, 2009, there was $1.3
million of total unrecognized compensation cost related to unvested stock
options. That cost is expected to be recognized over a weighted average period
of approximately 1.5 years. As of December 31, 2009, unrecognized compensation
cost related to non-vested stock and restricted stock units was $4.8 million.
The unrecognized cost for non-vested stock and restricted stock units is
expected to be recognized over a weighted average period of 1.4
years.
12. COMMITMENTS,
GUARANTEES AND CONTINGENCIES
Commitments, Guarantees and
Contingencies: Commitments and financial arrangements,
excluding capital lease commitments that are described in Note 8, included the
following as of December 31, 2009 (in millions):
|
Standby
letters of credit
|
(a)
|
$ | 10 | ||
|
Bonds
|
(b)
|
$ | 19 | ||
|
Benefit
plan withdrawal obligations
|
(c)
|
$ | 89 |
These amounts are not recorded on the
Company’s consolidated balance sheet and it is not expected that the Company or
its subsidiaries will be called upon to advance funds under these
commitments.
|
|
(a)
|
Consists
of standby letters of credit, issued by the Company’s lenders under the
Company’s revolving credit facilities. Approximately $8 million of the
letters of credit are required to allow the Company to qualify as a
self-insurer for state and federal workers’ compensation liabilities. The
balance includes approximately $2 million for insurance-related matters,
principally in the Company’s real estate business. In the event the
letters of credit are drawn upon, the Company would be obligated to
reimburse the issuer of the letter of credit. None of the letters of
credit has been drawn upon to date, and the Company believes it is
unlikely that any of these letters of credit will be drawn
upon.
|
|
|
(b)
|
Consists
of approximately $1 million of construction bonds related to real estate
projects in Hawaii, approximately $16 million in U.S. customs bonds, and
approximately $2 million related to transportation and other matters. In
the event the bonds are drawn upon, the Company would be obligated to
reimburse the surety that issued the bond. None of the bonds has been
drawn upon to date, and the Company believes it is unlikely that any of
these bonds will be drawn upon.
|
|
|
(c)
|
Represents
the withdrawal liabilities for multiemployer pension plans, in which
Matson is a participant. The withdrawal liability aggregated approximately
$89 million as of the most recent valuation date. Management has no
present intention of withdrawing from and does not anticipate termination
of any of the aforementioned plans.
|
Indemnity Agreements: For
certain real estate joint ventures, the Company may be obligated under bond
indemnities in order to complete construction of the real estate development if
the joint venture does not perform. These indemnities are designed to protect
the surety. The Company recorded liabilities at fair value for three indemnities
it provided in connection with surety bonds issued to cover construction
activities, such as project amenities, roads, utilities, and other
infrastructure, at three of its joint ventures. The recorded amount of the
liabilities were not material at December 31, 2009 and 2008. Under the
indemnities, the Company and its joint venture partners agreed to indemnify the
surety bond issuer from all loss and expense arising from the failure of the
joint venture to complete the specified bonded construction. The maximum
potential amount of aggregate future payments is a function of the amount
covered by outstanding bonds at the time of default by the joint venture,
reduced by the amount of work completed to date. As of December 31, 2009, the
maximum potential amount of aggregate future payments under bonds outstanding
was $67 million, computed as $166 million of bonds outstanding, less the value
of work completed, which totaled approximately $99 million. The Company and its
joint venture partners also entered into mutual indemnification agreements under
which each partner agrees to indemnify the other partner for its share of the
obligation under the bonds. Including amounts recoverable from the Company’s
joint venture partners under the mutual indemnification agreements, the
Company’s maximum potential amount of aggregate future payments under
indemnities at December 31, 2009 was approximately $37 million.
Completion Guarantees: For
certain real estate joint ventures, the Company may be required to perform work
to complete construction if the joint venture fails to complete construction.
These guarantees are intended to assure the joint venture’s lender that the
project will be completed as represented to the lender. The Company recorded
liabilities at fair value for two completion guarantees it provided in
connection with joint venture development projects. The recorded amount of these
liabilities were not material at December 31, 2009 and 2008. Under the
completion guarantees, the Company and its joint venture partners agree to
complete development of specified development work if the joint venture fails to
complete development. The maximum potential amount of aggregate future payments
related to the Company’s completion guarantees is a function of the work agreed
to be completed, reduced by the amount of work completed to date at the time of
default by the joint venture. As of December 31, 2009, the maximum potential
amount of aggregate future payments under completion guarantees outstanding was
$3 million, computed as $15 million of project work guaranteed, less the value
of work completed, which totaled approximately $12 million. The Company’s share
of the maximum potential amount of aggregate future payments under indemnities
at December 31, 2009 was approximately $2 million.
Other Obligations: Certain of
the businesses in which the Company holds a non-controlling interest have
long-term debt obligations. In August 2009, a $12 million construction loan held
by one of the Company’s real estate joint ventures matured. The joint venture is
currently negotiating with the lender to extend the maturity date of the loan.
The lender has tentatively agreed to a 36-month extension of the loan,
conditioned upon a $1.8 million payment from the joint venture, an agreement to
convert the loan to a 25-year amortization schedule, and certain other
conditions. If the joint venture is not successful in consummating an extension
of the loan and remains in default, the Company may be obligated to pay
approximately $2 million under a “re-margin” guarantee, under which the joint
venture must maintain a minimum debt service coverage ratio of 1.3 to 1. As of
December 31, 2009, the Company had not paid any amounts under the re-margin
guarantee, but a liability of $2 million was recorded with a corresponding
increase to the Company’s investment in the joint venture. In December 2009, a
$16 million construction loan held by one of the Company’s real estate joint
ventures matured. The joint venture is currently negotiating with the lender to
extend the maturity date of the loan. If the joint venture is not successful in
consummating an extension of the loan and remains in default, the Company may be
obligated to pay $1.8 million. As of December 31, 2009, the Company had not paid
any amounts to the lender, but a liability of $1.8 million was recorded with a
corresponding increase to the Company’s investment in the joint
venture.
Other than obligations described above,
investee obligations do not have recourse to the Company and the Company’s
“at-risk” amounts are limited to its investment. These investments are more
fully described in Note 4.
Environmental
Matters: As with most transportation, industrial and land
development companies of its size, the Company’s shipping, real estate, and
agricultural businesses have certain risks that could result in expenditures for
environmental remediation. It is the Company’s policy, as part of its due
diligence process for all acquisitions, to use third-party environmental
consultants to investigate the environmental risks and to require disclosure
from land sellers of known environmental risks. Despite these precautions, there
can be no assurance that the Company will avoid material liabilities relating to
environmental matters affecting properties currently or previously owned by the
Company. No estimate of such potential liabilities can be made although the
Company may, from time to time, purchase property which requires modest
environmental clean-up costs after appropriate due diligence. In such instances,
the Company takes steps prior to acquisition to gain assurance as to the precise
scope of work required and costs associated with removal, site restoration
and/or monitoring, using detailed investigations by environmental consultants.
The Company believes that based on all information available to it, the Company
is in compliance, in all material respects, with applicable environmental laws
and regulations.
In late 2003, the Company paid $1.6
million to settle a claim for payment of environmental remediation costs
incurred by the current owner of a sugar refinery site in Hawaii that previously
was sold by the Company in 1994. In connection with this settlement, the Company
assumed responsibility to remediate certain parcels of the site and accrued an
undiscounted obligation of approximately $2 million for the estimated
remediation costs. The commencement of environmental cleanup is dependent upon
studies to be approved by the Department of Health of the State of Hawaii, which
has not occurred as of December 31, 2009.
Other Contingencies: A&B owns 16,000 acres
of watershed lands in East Maui that supply a significant portion of the
irrigation water used by HC&S. A&B also held four water licenses to
another 30,000 acres owned by the State of Hawaii in East Maui, which over the
years has supplied approximately two-thirds of the irrigation water used by
HC&S. The last of these water license agreements expired in 1986, and all
four agreements were then extended as revocable permits that were renewed
annually. In 2001, a request was made to the State Board of Land and Natural
Resources (the “BLNR”) to replace these revocable permits with a long-term water
lease. Pending the conclusion by the BLNR of this contested case hearing on the
request for the long-term lease, the BLNR has renewed the existing permits on a
holdover basis. If the Company is not permitted to divert stream waters from
State lands in East Maui for its use, it would have a material adverse effect on
the Company’s sugar-growing operations.
In
addition, on May 24, 2001, petitions were filed by a third party, requesting
that the Commission on Water Resource Management of the State of Hawaii (“Water
Commission”) amend interim instream flow standards (“IIFS”) in 27 East Maui
streams that feed the Company’s irrigation system. On September 25, 2008, the
Water Commission took action on eight of the petitions, resulting in some
quantity of water being returned to the streams rather than being utilized for
irrigation purposes. While the loss of the water as a result of the Water
Commission’s action on the eight petitions may not significantly impair the
Company’s sugar-growing operations, similar losses of water on the remaining 19
streams would have a material adverse effect on the Company’s sugar-growing
operations. In December 2009, the Water Commission conducted deliberations on
the amendment of IIFS for the remaining 19 East Maui streams, deferring action
for at least a three month period. The Company, at this time, is unable to
determine what action the Water Commission will take with respect to all 27
streams.
On
June 25, 2004, two organizations filed with the Water Commission a petition
to amend IIFS for four streams in West Maui to increase the amount of water to
be returned to these streams. The West Maui irrigation system provides
approximately one-sixth of the irrigation water used by HC&S. The Water
Commission’s deliberations on whether to amend the current IIFS for the West
Maui streams are currently ongoing, and an adverse decision could result in some
quantity of water being returned to the streams, rather than being utilized for
irrigation purposes, which may have a material adverse effect on the Company’s
sugar-growing operations. A decision by the Water Commission is not expected
until mid-2010.
On
December 10, 2007, the Shipbuilders Council of America, Inc. and Pasha
Hawaii Transport Lines LLC filed a complaint against the U.S. Department of
Homeland Security, the U.S. Coast Guard and the National Vessel Documentation
Center in the U.S. District Court for the Eastern District of Virginia. The
complaint sought review of a certificate of documentation with a coastwise
endorsement issued by the National Vessel Documentation Center after concluding
that Matson’s C9 vessel Mokihana had not been rebuilt abroad. Matson intervened
in the action. On December 4, 2009, the court granted summary judgment in favor
of the government and Matson, and dismissed the plaintiffs’ complaint with
prejudice. The time to seek appellate review of this matter has
expired.
On April
21, 2008, Matson was served with a grand jury subpoena from the U.S. District
Court for the Middle District of Florida for documents and information relating
to water carriage in connection with the Department of Justice’s investigation
into the pricing and other competitive practices of carriers operating in the
domestic trades. Matson understands that while the investigation currently is
focused on the Puerto Rico trade, it also includes pricing and other competitive
practices in connection with all domestic trades, including the Alaska, Hawaii
and Guam trades. Matson does not operate vessels in the Puerto Rico and Alaska
trades. It does operate vessels in the Hawaii and Guam trades. Matson has
cooperated, and will continue to cooperate, fully with the Department of
Justice. If the Department of Justice believes that any violations have occurred
on the part of Matson or the Company, it could seek civil or criminal sanctions,
including monetary fines. The Company is unable to predict, at this time, the
outcome or financial impact, if any, of this investigation.
The
Company and Matson were named as defendants in a consolidated civil lawsuit
purporting to be a class action in the U.S. District Court for the Western
District of Washington in Seattle. The lawsuit alleged violations of the
antitrust laws and also named as a defendant Horizon Lines, Inc., another
domestic shipping carrier operating in the Hawaii and Guam trades. On August 18,
2009, the court granted the defendants’ motion to dismiss the complaint. The
court granted the plaintiffs leave to amend the complaint by May 10, 2010 to
allege claims consistent with the court’s order. If the plaintiffs file an
amended complaint, the Company and Matson will continue to vigorously defend
themselves in this lawsuit. The Company is unable to predict, at this time, the
outcome or financial impact, if any, of this lawsuit if an amended complaint is
filed.
In June 2006, Matson and its Long
Beach terminal operator, SSAT LLC, completed negotiations of an amendment to the
Preferential Assignment Agreement with the City of Long Beach that includes
changes requested by Matson to implement its new China Service as well as
environmental covenants applicable to vessels which call at Pier C. The
environmental requirements are part of programs proposed by both the ports of
Los Angeles and Long Beach designed to reduce airborne emissions in the port
area. Under the amendment, Matson is required to install equipment on all its
motor vessels to allow them to accept a shore-based electrical power source
instead of using the vessel’s diesel generators while in port (“cold ironing”)
and to phase out calls by its steamships by 2020. In December 2008, the Office
of Administrative Law approved regulations put forth by the California Air
Resources Board (“CARB”) which mandate cold ironing of diesel powered container
ships at major ports starting in 2014. The CARB regulations put the
responsibility for shoreside electrical infrastructure on the terminal operator.
Matson’s lease agreement commits the Port of Long Beach to providing the
shoreside infrastructure and construction commenced in 2009 and is expected to
be completed in 2010. However, the Port of Oakland has not yet made a commitment
to provide the required infrastructure at the Company’s Oakland terminal and
therefore, SSAT may be held responsible for this cost. SSAT submitted the
required terminal plan to CARB on July 1, 2009, but the plan has not yet been
approved. The cost of the required infrastructure improvements has not been
estimated. The modifications to Matson’s vessels to accommodate cold
ironing will occur at each of their next scheduled out–of-water drydockings. Two
vessels have been retrofitted through 2009 and one is scheduled for
2010. The estimated costs of the modifications are projected at $13.7
million for the eight motor vessels including design and engineering costs, and
the cost for vessel stepdown transformers to accommodate the power provided at
the dock. As of December 31, 2009, approximately $4.3 million has been incurred.
The costs of the modifications have been recorded as capital assets because they
provide future economic benefits.
The
Company is subject to possible climate change legislation, regulation and
international accords. Numerous bills related to climate change, such as
limiting and reducing greenhouse gas emissions through a “cap and trade” system
of allowances and credits, have been introduced in the U.S. Congress. If
enacted, these regulations could impose significant additional costs on the
Company, including increased energy costs, higher material prices, and costly
mandatory vessel and equipment modifications. The Company is unable to predict,
at this time, the outcome or financial impact, if any, of future climate change
related legislation.
The Company and certain subsidiaries
are parties to other various legal actions and are contingently liable in
connection with claims and contracts arising in the normal course of business,
the outcome of which, in the opinion of management after consultation with legal
counsel, will not have a material adverse effect on the Company’s financial
position or results of operations.
13. INDUSTRY
SEGMENTS
Operating segments are components of an
enterprise that engage in business activities from which it may earn revenues
and incur expenses, whose operating results are regularly reviewed by the chief
operating decision maker to make decisions about resources to be allocated to
the segment and assess its performance, and for which discrete financial
information is available. The Company’s chief operating decision maker is its
Chief Executive Officer. Based on the foregoing, the Company has five segments
that operate in three industries: Transportation, Real Estate and
Agribusiness.
The Transportation Industry consists of
two segments. Ocean Transportation carries freight between various U.S. Pacific
Coast, major Hawaii ports, Guam, China and other Pacific ports and provides
terminal, stevedoring and container equipment management services in Hawaii.
Logistics Services arranges domestic and international rail intermodal service,
long-haul and regional highway brokerage, specialized hauling, flat-bed and
project work, less-than-truckload, expedited freight services, and warehousing
and distribution services.
The Real Estate Industry consists of
two segments. The Real Estate Sales segment generates its revenues through the
development and sale of land, commercial and residential properties. The Real
Estate Leasing segment owns, operates, and manages retail, office, and
industrial properties. When property that was previously leased is sold, the
revenue and operating profit are included with the Real Estate Sales
segment.
Agribusiness, which consists of one
segment, grows sugar cane and coffee; produces bulk raw sugar, specialty
food-grade sugars, and molasses; produces, markets, and distributes roasted
coffee, green coffee and specialty food-grade sugars; provides general trucking
services, mobile equipment maintenance and repair services, and self-service
storage in Hawaii; and generates and sells, to the extent not used in the
Company’s operations, electricity.
The accounting policies of the
operating segments are described in the summary of significant accounting
policies. Reportable segments are measured based on operating profit, exclusive
of interest expense, general corporate expenses, and income taxes.
INDUSTRY
SEGMENTS (CONTINUED)
Industry
segment information for 2009, 2008, and 2007 is summarized below (in
millions):
|
For
the Year
|
2009
|
2008
|
2007
|
|||||||||
|
Revenue:
|
||||||||||||
|
Transportation:
|
||||||||||||
|
Ocean
transportation
|
$
|
888.6
|
$
|
1,023.7
|
$
|
1,006.9
|
||||||
|
Logistics
services
|
320.9
|
436.0
|
433.5
|
|||||||||
|
Real
Estate:
|
||||||||||||
|
Leasing
|
103.2
|
107.8
|
108.5
|
|||||||||
|
Sales
|
125.6
|
350.2
|
117.8
|
|||||||||
|
Less
amounts reported in discontinued operations1
|
(124.2
|
)
|
(151.5
|
)
|
(130.2
|
)
|
||||||
|
Agribusiness5
|
107.0
|
124.3
|
123.7
|
|||||||||
|
Reconciling
Items 2
|
(16.3
|
)
|
(10.7
|
)
|
(9.2
|
)
|
||||||
|
Total
revenue
|
$
|
1,404.8
|
$
|
1,879.8
|
$
|
1,651.0
|
||||||
|
Operating
Profit:
|
||||||||||||
|
Transportation:
|
||||||||||||
|
Ocean
transportation3
|
$
|
58.3
|
$
|
105.8
|
$
|
126.5
|
||||||
|
Logistics
services
|
6.7
|
18.5
|
21.8
|
|||||||||
|
Real
Estate:
|
||||||||||||
|
Leasing
|
43.2
|
47.8
|
51.6
|
|||||||||
|
Sales3
|
39.1
|
95.6
|
74.4
|
|||||||||
|
Less
amounts reported in discontinued operations1
|
(52.3
|
)
|
(69.3
|
)
|
(71.2
|
)
|
||||||
|
Agribusiness5
|
(27.8
|
)
|
(12.9
|
)
|
0.2
|
|||||||
|
Total
operating profit
|
67.2
|
185.5
|
203.3
|
|||||||||
|
Interest
expense, net4
|
(25.9
|
)
|
(23.7
|
)
|
(18.8
|
)
|
||||||
|
General
corporate expenses
|
(21.8
|
)
|
(21.0
|
)
|
(27.3
|
)
|
||||||
|
Income
from continuing operations before income taxes
|
19.5
|
140.8
|
157.2
|
|||||||||
|
Income
taxes
|
7.6
|
51.5
|
59.3
|
|||||||||
|
Income
from continuing operations
|
11.9
|
89.3
|
97.9
|
|||||||||
|
Discontinued
operations
|
32.3
|
43.1
|
44.3
|
|||||||||
|
Net
income
|
$
|
44.2
|
$
|
132.4
|
$
|
142.2
|
||||||
|
1
|
Prior
year amounts restated for amounts treated as discontinued operations. See
Notes 1 and 2 for additional
information.
|
|
2
|
Includes
inter-segment revenue, interest income, and other income classified as
revenue for segment reporting
purposes.
|
|
3
|
The Ocean Transportation segment
includes approximately $6.2 million, $5.2 million, and $10.7 million of
equity in earnings from its investment in SSAT for 2009, 2008, and 2007,
respectively. The Real Estate Sales segment includes approximately $9.0
million and $22.6 million in equity in earnings from its various real
estate joint ventures for 2008 and 2007, respectively. Equity in earnings
from joint ventures in 2009 was
negligible.
|
|
4
|
Includes
Ocean Transportation interest expense of $9.0 million for 2009, $11.6
million for 2008, and $13.9 million for 2007. Substantially all other
interest expense was at the parent
company.
|
|
5
|
Includes
a $5.4 million gain recorded upon consolidation of HS&TC in
2009.
|
INDUSTRY
SEGMENTS (CONTINUED)
|
As
of December 31:
|
2009
|
2008
|
2007
|
|||||||||
|
Identifiable
Assets:
|
||||||||||||
|
Ocean
transportation6
|
$
|
1,095.2
|
$
|
1,153.9
|
$
|
1,215.0
|
||||||
|
Logistics
services
|
72.4
|
74.2
|
58.6
|
|||||||||
|
Real
estate leasing
|
627.4
|
590.2
|
595.4
|
|||||||||
|
Real
estate sales6
|
415.6
|
344.6
|
408.9
|
|||||||||
|
Agribusiness
|
156.8
|
172.2
|
174.6
|
|||||||||
|
Other
|
12.2
|
15.1
|
26.6
|
|||||||||
|
Total
assets
|
$
|
2,379.6
|
$
|
2,350.2
|
$
|
2,479.1
|
||||||
|
Capital
Expenditures:
|
||||||||||||
|
Ocean
transportation
|
$
|
12.7
|
$
|
35.5
|
$
|
65.8
|
||||||
|
Logistics
services7
|
0.6
|
2.4
|
2.0
|
|||||||||
|
Real
estate leasing8
|
108.8
|
100.2
|
124.5
|
|||||||||
|
Real
estate sales9
|
0.1
|
0.6
|
0.3
|
|||||||||
|
Agribusiness
|
3.4
|
15.2
|
20.5
|
|||||||||
|
Other
|
0.3
|
0.8
|
0.3
|
|||||||||
|
Total
capital expenditures
|
$
|
125.9
|
$
|
154.7
|
$
|
213.4
|
||||||
|
Depreciation
and Amortization:
|
||||||||||||
|
Ocean
transportation
|
$
|
67.1
|
$
|
66.1
|
$
|
63.2
|
||||||
|
Logistics
services
|
3.5
|
2.3
|
1.5
|
|||||||||
|
Real
estate leasing1
|
19.5
|
17.9
|
15.7
|
|||||||||
|
Real
estate sales
|
0.3
|
0.2
|
0.2
|
|||||||||
|
Agribusiness
|
11.9
|
11.5
|
10.7
|
|||||||||
|
Other
|
3.1
|
2.7
|
1.3
|
|||||||||
|
Total
depreciation and amortization
|
$
|
105.4
|
$
|
100.7
|
$
|
92.6
|
||||||
|
6
|
The Ocean Transportation segment
includes approximately $47.2 million, $44.6 million, and $48.6 million
related to its investment in SSAT as of December 31, 2009, 2008, and 2007,
respectively. The Real Estate Sales segment includes approximately $193.3
million, $162.1 million, and $134.1 million related to its investment in
various real estate joint ventures as of December 31, 2009, 2008, and
2007, respectively.
|
|
7
|
Excludes
expenditures related to Matson Integrated Logistics’ acquisitions, which
are classified as Payments for Purchases of Investments in Cash Flows from
Investing Activities within the Consolidated Statements of Cash
Flows.
|
|
8
|
Represents
gross capital additions to the leasing portfolio, including gross
tax-deferred property purchases that are reflected as non-cash
transactions in the Consolidated Statements of Cash
Flows.
|
|
9
|
Excludes capital expenditures for
real estate developments held for sale which are classified as Cash Flows
from Operating Activities within the Consolidated Statements of Cash
Flows. Operating cash flows for capital expenditures related to real
estate developments were $6 million, $39 million, and $110 million for
2009, 2008, and 2007,
respectively.
|
14. QUARTERLY
INFORMATION (Unaudited)
Segment results by quarter for 2009 are
listed below (in millions, except per-share amounts):
|
2009
|
||||||||||||||||
|
Q1
|
Q2
|
Q3
|
Q4
|
|||||||||||||
|
Revenue:
|
||||||||||||||||
|
Transportation:
|
||||||||||||||||
|
Ocean
transportation
|
$
|
201.1
|
$
|
218.5
|
$
|
234.2
|
$
|
234.8
|
||||||||
|
Logistics
services
|
76.2
|
80.3
|
82.3
|
82.1
|
||||||||||||
|
Real
Estate:
|
||||||||||||||||
|
Leasing
|
27.2
|
25.9
|
25.2
|
24.9
|
||||||||||||
|
Sales
|
25.2
|
21.3
|
14.9
|
64.2
|
||||||||||||
|
Less
amounts reported in discontinued operations 1
|
(29.6
|
)
|
(20.8
|
)
|
(13.4
|
)
|
(60.4
|
)
|
||||||||
|
Agribusiness2
|
17.7
|
29.2
|
32.5
|
27.6
|
||||||||||||
|
Reconciling
Items 3
|
(2.3)
|
(2.8
|
)
|
(3.0
|
)
|
(8.2
|
)
|
|||||||||
|
Total
revenue
|
$
|
315.5
|
$
|
351.6
|
$
|
372.7
|
$
|
365.0
|
||||||||
|
Operating
Profit (Loss):
|
||||||||||||||||
|
Transportation:
|
||||||||||||||||
|
Ocean
transportation
|
$
|
(0.5
|
)
|
$
|
21.1
|
$
|
24.2
|
$
|
13.5
|
|||||||
|
Logistics
services
|
1.5
|
1.8
|
2.2
|
1.2
|
||||||||||||
|
Real
Estate:
|
||||||||||||||||
|
Leasing
|
12.0
|
11.0
|
10.2
|
10.0
|
||||||||||||
|
Sales
|
5.6
|
9.6
|
3.5
|
20.4
|
||||||||||||
|
Less
amounts reported in discontinued operations1
|
(11.3
|
)
|
(12.1
|
)
|
(5.5
|
)
|
(23.4
|
)
|
||||||||
|
Agribusiness2
|
(1.9
|
)
|
(11.3
|
)
|
(13.8
|
)
|
(0.8
|
)
|
||||||||
|
Total
operating profit
|
5.4
|
20.1
|
20.8
|
20.9
|
||||||||||||
|
Interest
Expense
|
(5.6
|
)
|
(6.9
|
)
|
(6.7
|
)
|
(6.7
|
)
|
||||||||
|
General
Corporate Expenses
|
(6.1
|
)
|
(4.5
|
)
|
(4.9
|
)
|
(6.3
|
)
|
||||||||
|
Income
From Continuing Operations before Income Taxes
|
(6.3
|
)
|
8.7
|
9.2
|
7.9
|
|||||||||||
|
Income
taxes (benefit)
|
(2.3
|
)
|
3.6
|
4.1
|
2.2
|
|||||||||||
|
Income
From Continuing Operations
|
(4.0
|
)
|
5.1
|
5.1
|
5.7
|
|||||||||||
|
Discontinued
Operations1
|
7.0
|
7.5
|
3.4
|
14.4
|
||||||||||||
|
Net
Income
|
$
|
3.0
|
$
|
12.6
|
$
|
8.5
|
$
|
20.1
|
||||||||
|
Earnings
Per Share:
|
||||||||||||||||
|
Basic
|
$
|
0.07
|
$
|
0.31
|
$
|
0.21
|
$
|
0.49
|
||||||||
|
Diluted
|
$
|
0.07
|
$
|
0.31
|
$
|
0.21
|
$
|
0.49
|
||||||||
1 See Note 2 for discussion of
discontinued operations.
|
2
|
Includes
a $5.4 million gain recorded upon consolidation of HS&TC in the fourth
quarter of 2009.
|
3 Includes
inter-segment revenue, interest income, and other income classified as revenue
for segment reporting purposes.
Segment results by quarter for 2008 are
listed below (in millions, except per-share amounts):
|
2008
|
||||||||||||||||
|
Q1
|
Q2
|
Q3
|
Q4
|
|||||||||||||
|
Revenue:
|
||||||||||||||||
|
Transportation:
|
||||||||||||||||
|
Ocean
transportation
|
$
|
243.0
|
$
|
268.4
|
$
|
272.8
|
$
|
239.5
|
||||||||
|
Logistics
services
|
102.6
|
115.5
|
118.1
|
99.8
|
||||||||||||
|
Real
Estate:
|
||||||||||||||||
|
Leasing
|
28.8
|
27.3
|
26.2
|
25.5
|
||||||||||||
|
Sales
|
187.4
|
31.2
|
77.2
|
54.4
|
||||||||||||
|
Less
amounts reported in discontinued operations 1
|
(8.3
|
)
|
(19.0
|
)
|
(75.9
|
)
|
(48.3
|
)
|
||||||||
|
Agribusiness
|
22.5
|
36.2
|
37.5
|
28.1
|
||||||||||||
|
Reconciling
Items 2
|
(1.5
|
)
|
(2.6
|
)
|
(3.0
|
)
|
(3.6
|
)
|
||||||||
|
Total
revenue
|
$
|
574.5
|
$
|
457.0
|
$
|
452.9
|
$
|
395.4
|
||||||||
|
Operating
Profit (Loss):
|
||||||||||||||||
|
Transportation:
|
||||||||||||||||
|
Ocean
transportation
|
$
|
15.9
|
$
|
37.4
|
$
|
31.4
|
$
|
21.1
|
||||||||
|
Logistics
services
|
4.7
|
4.6
|
5.1
|
4.1
|
||||||||||||
|
Real
Estate:
|
||||||||||||||||
|
Leasing
|
13.9
|
12.6
|
11.1
|
10.2
|
||||||||||||
|
Sales
|
41.4
|
9.1
|
25.8
|
19.3
|
||||||||||||
|
Less
amounts reported in discontinued operations1
|
(4.9
|
)
|
(10.8
|
)
|
(30.0
|
)
|
(23.6
|
)
|
||||||||
|
Agribusiness
|
4.8
|
(4.9
|
)
|
(6.7
|
)
|
(6.1
|
)
|
|||||||||
|
Total
operating profit
|
75.8
|
48.0
|
36.7
|
25.0
|
||||||||||||
|
Interest
Expense
|
(6.1
|
)
|
(5.6
|
)
|
(5.8
|
)
|
(6.2
|
)
|
||||||||
|
General
Corporate Expenses
|
(5.7
|
)
|
(5.4
|
)
|
(5.3
|
)
|
(4.6
|
)
|
||||||||
|
Income
From Continuing Operations before Income Taxes
|
64.0
|
37.0
|
25.6
|
14.2
|
||||||||||||
|
Income
taxes
|
25.1
|
14.1
|
7.4
|
4.9
|
||||||||||||
|
Income
From Continuing Operations
|
38.9
|
22.9
|
18.2
|
9.3
|
||||||||||||
|
Discontinued
Operations1
|
3.2
|
6.7
|
18.6
|
14.6
|
||||||||||||
|
Net
Income
|
$
|
42.1
|
$
|
29.6
|
$
|
36.8
|
$
|
23.9
|
||||||||
|
Earnings
Per Share:
|
||||||||||||||||
|
Basic
|
$
|
1.02
|
$
|
0.72
|
$
|
0.89
|
$
|
0.58
|
||||||||
|
Diluted
|
$
|
1.01
|
$
|
0.71
|
$
|
0.89
|
$
|
0.58
|
||||||||
1 See Note 2 for discussion of
discontinued operations.
2 Includes
inter-segment revenue, interest income, and other income classified as revenue
for segment reporting purposes.
15. PARENT
COMPANY CONDENSED FINANCIAL INFORMATION
Set forth below are the unconsolidated
condensed financial statements of Alexander & Baldwin, Inc. (“Parent
Company”). The significant accounting policies used in preparing these financial
statements are substantially the same as those used in the preparation of the
consolidated financial statements as described in Note 1, except that, for
purposes of the tables presented in this footnote, subsidiaries are carried
under the equity method.
The following table presents the Parent
Company’s condensed balance sheets as of December 31, 2009 and 2008 (in
millions):
|
2009
|
2008
|
|||||||
|
ASSETS
|
||||||||
|
Current
Assets:
|
||||||||
|
Cash
and cash equivalents
|
$
|
1
|
$
|
--
|
||||
|
Accounts
and other receivables, net
|
12
|
3
|
||||||
|
Inventories
|
6
|
--
|
||||||
|
Real
estate held for sale
|
7
|
--
|
||||||
|
Income
tax receivable
|
--
|
24
|
||||||
|
Section
1031 exchange proceeds
|
--
|
23
|
||||||
|
Prepaid
expenses and other
|
15
|
23
|
||||||
|
Total
current assets
|
41
|
73
|
||||||
|
Investments:
|
||||||||
|
Subsidiaries
consolidated, at equity
|
1,210
|
1,131
|
||||||
|
Property,
at Cost
|
455
|
432
|
||||||
|
Less
accumulated depreciation and amortization
|
226
|
219
|
||||||
|
Property
-- net
|
229
|
213
|
||||||
|
Other
Assets
|
32
|
43
|
||||||
|
Total
|
$
|
1,512
|
$
|
1,460
|
||||
|
LIABILITIES
AND SHAREHOLDERS’ EQUITY
|
||||||||
|
Current
Liabilities:
|
||||||||
|
Current
portion of long-term debt
|
$
|
40
|
$
|
28
|
||||
|
Accounts
payable
|
10
|
8
|
||||||
|
Income
taxes payable
|
24
|
--
|
||||||
|
Non-qualified
benefit plans
|
17
|
4
|
||||||
|
Other
|
15
|
12
|
||||||
|
Total
current liabilities
|
106
|
52
|
||||||
|
Long-term
Debt
|
239
|
200
|
||||||
|
Employee
Benefit Plans
|
22
|
49
|
||||||
|
Non-qualified
Benefit Plans
|
8
|
17
|
||||||
|
Other
Long-term Liabilities
|
4
|
6
|
||||||
|
Deferred
Income Taxes
|
42
|
30
|
||||||
|
Due
to Subsidiaries
|
6
|
34
|
||||||
|
Shareholders’
Equity:
|
||||||||
|
Capital
stock
|
33
|
33
|
||||||
|
Additional
capital
|
210
|
204
|
||||||
|
Accumulated
other comprehensive loss
|
(81
|
)
|
(96
|
)
|
||||
|
Retained
earnings
|
934
|
942
|
||||||
|
Cost
of treasury stock
|
(11
|
)
|
(11
|
)
|
||||
|
Total
shareholders’ equity
|
1,085
|
1,072
|
||||||
|
Total
|
$
|
1,512
|
$
|
1,460
|
||||
The following table presents the Parent
Company’s condensed statements of income for the years ended December 31, 2009,
2008 and 2007 (in millions):
|
2009
|
2008
|
2007
|
||||||||||
|
Revenue:
|
||||||||||||
|
Agribusiness
|
$
|
73
|
$
|
91
|
$
|
92
|
||||||
|
Real
estate leasing
|
22
|
19
|
18
|
|||||||||
|
Real
estate sales
|
8
|
6
|
6
|
|||||||||
|
Interest
and other
|
2
|
3
|
8
|
|||||||||
|
Total
revenue
|
105
|
119
|
124
|
|||||||||
|
Costs
and Expenses:
|
||||||||||||
|
Cost
of agribusiness goods and services
|
109
|
110
|
97
|
|||||||||
|
Cost
of real estate sales and leasing
|
14
|
11
|
10
|
|||||||||
|
Selling,
general and administrative
|
21
|
21
|
28
|
|||||||||
|
Interest
and other
|
16
|
14
|
12
|
|||||||||
|
Income
tax benefit
|
(21
|
)
|
(16
|
)
|
(7
|
)
|
||||||
|
Total
costs and expenses
|
139
|
140
|
140
|
|||||||||
|
Loss
from Continuing Operations
|
(34
|
)
|
(21
|
)
|
(16
|
)
|
||||||
|
Discontinued
Operations, net of income taxes
|
8
|
17
|
4
|
|||||||||
|
Loss
Before Equity in Income of Subsidiaries Consolidated
|
(26
|
)
|
(4
|
)
|
(12
|
)
|
||||||
|
Equity
in Income from Continuing Operations of Subsidiaries
Consolidated
|
46
|
111
|
114
|
|||||||||
|
Equity
in Income from Discontinued Operations of Subsidiaries
Consolidated
|
24
|
25
|
40
|
|||||||||
|
Net
Income
|
44
|
132
|
142
|
|||||||||
|
Other
Comprehensive Income (Loss), net of income taxes
|
15
|
(91
|
)
|
15
|
||||||||
|
Comprehensive
Income
|
$
|
59
|
$
|
41
|
$
|
157
|
||||||
The following table presents the
Parent Company’s condensed statements of cash flows for the years ended December
31, 2009, 2008 and 2007 (in millions):
|
2009
|
2008
|
2007
|
||||||||||
|
Cash
Flows from Operations (including dividends received from
subsidiaries)
|
$
|
90
|
$
|
144
|
$
|
17
|
||||||
|
Cash
Flows from Investing Activities:
|
||||||||||||
|
Capital
expenditures
|
(6
|
)
|
(16
|
)
|
(18
|
)
|
||||||
|
Purchase
of investments
|
(96
|
)
|
(12
|
)
|
--
|
|||||||
|
Proceeds
from disposal of property and sale of investments
|
28
|
9
|
5
|
|||||||||
|
Net
cash used in investing activities
|
(74
|
)
|
(19
|
)
|
(13
|
)
|
||||||
|
Cash
Flows from Financing Activities:
|
||||||||||||
|
Change
in intercompany payables/receivables
|
(13
|
)
|
(4
|
)
|
(15
|
)
|
||||||
|
Proceeds
from (repayments of) long-term debt, net
|
51
|
(16
|
)
|
85
|
||||||||
|
Proceeds
from issuance of capital stock, including tax benefit
|
(1
|
)
|
2
|
8
|
||||||||
|
Repurchases
of capital stock
|
--
|
(59
|
)
|
(33
|
)
|
|||||||
|
Dividends
paid
|
(52
|
)
|
(51
|
)
|
(48
|
)
|
||||||
|
Net
cash used in financing activities
|
(15
|
)
|
(128
|
)
|
(3
|
)
|
||||||
|
Cash
and Cash Equivalents:
|
||||||||||||
|
Net
increase (decrease) for the year
|
1
|
(3
|
)
|
1
|
||||||||
|
Balance,
beginning of year
|
--
|
3
|
2
|
|||||||||
|
Balance,
end of year
|
$
|
1
|
$
|
--
|
$
|
3
|
||||||
|
Other
Cash Flow Information:
|
||||||||||||
|
Interest
paid
|
$
|
(13
|
)
|
$
|
(13
|
)
|
$
|
(12
|
)
|
|||
|
Income
taxes paid, net of refunds
|
$
|
(38
|
)
|
$
|
(63
|
)
|
$
|
(55
|
)
|
|||
|
Other
Non-cash Information:
|
||||||||||||
|
Depreciation
expense
|
$
|
17
|
$
|
15
|
$
|
15
|
||||||
|
Tax-deferred
property sales
|
$
|
29
|
$
|
60
|
$
|
--
|
||||||
|
Tax-deferred
property purchases
|
$
|
(40
|
)
|
$
|
(5
|
)
|
$
|
--
|
||||
General
Information: The Parent Company is headquartered in Honolulu,
Hawaii and is engaged in the operations that are generally described in Note 13,
“Industry Segments.” Additional information related to the Parent Company is
described in the foregoing notes to the consolidated financial
statements.
Long-term Debt: At
December 31, 2009 and 2008, long-term debt consisted of the following (in
millions):
|
2009
|
2008
|
|||||||
|
Revolving
Credit loans (0.76% for 2009 and 1.12% for
2008)
|
$
|
24
|
$
|
55
|
||||
|
Term
Loans:
|
||||||||
|
6.90%,
payable through 2020
|
100
|
--
|
||||||
|
5.53%,
payable through 2016
|
50
|
50
|
||||||
|
5.55%,
payable through 2017
|
50
|
50
|
||||||
|
5.56%,
payable through 2016
|
25
|
25
|
||||||
|
4.10%,
payable through 2012
|
25
|
30
|
||||||
|
7.42%,
payable through 2010
|
3
|
6
|
||||||
|
6.20%,
payable through 2013
|
2
|
3
|
||||||
|
7.55%,
payable through 2009
|
--
|
7
|
||||||
|
7.57%,
payable through 2009
|
--
|
2
|
||||||
|
Total
|
279
|
228
|
||||||
|
Less
current portion
|
(40
|
)
|
(28
|
)
|
||||
|
Long-term
debt
|
$
|
239
|
$
|
200
|
||||
Long-term Debt
Maturities: At December 31, 2009,
maturities of all long-term debt during the next five years are $40 million in
2010, $16 million in 2011, $27 million in 2012, $21 million in 2013, $33 million
in 2014, and $142 million thereafter.
Revolving Credit
Facilities:
The Company has a revolving senior credit facility with six commercial banks
that expires in December 2011. The revolving credit facility provides for a
commitment of $225 million. Amounts drawn under the facility bear interest at
London Interbank Offered Rate (“LIBOR”) plus a spread ranging from 0.225 percent
to 0.475 percent based on the Company’s S&P rating. The agreement contains
certain restrictive covenants, the most significant of which require the
maintenance of minimum shareholders’ equity levels, minimum unencumbered
property investment values, and a maximum ratio of total debt to earnings before
interest, depreciation, amortization, and taxes. At December 31, 2009, $24
million was outstanding and classified as current, $2 million in letters of
credit had been issued against the facility, and $199 million remained available
for borrowing.
The Company has a replenishing $400
million three-year unsecured note purchase and private shelf agreement with
Prudential Investment Management, Inc. and its affiliates (collectively,
“Prudential”) under which the Company may issue notes in an aggregate amount up
to $400 million, less the sum of all principal amounts then outstanding on any
notes issued by the Company or any of its subsidiaries to Prudential and the
amount of any notes that are committed under the note purchase agreement. The
Prudential agreement contains certain restrictive covenants that are
substantially the same as the covenants contained in the aggregate $325 million
revolving senior credit facilities. The ability to draw additional amounts under
the Prudential facility expires on April 19, 2012 and borrowings under the shelf
facility bear interest at rates that are determined at the time of the
borrowing. At December 31, 2009, $71 million was available under the
facility.
Real Estate Secured Term
Debt: In June 2005, the Company, together with its real-estate
subsidiaries, purchased an office building in Phoenix, Arizona, and assumed $11
million of mortgage-secured debt. A&B owns approximately 24 percent of the
Phoenix office building. At December 31, 2009, approximately $2 million of the
$11 million was recorded on the parent company’s books, consistent with
ownership of the property. The property is jointly and severally owned by three
subsidiaries of the Company.
Dividends from Subsidiaries:
The Company received dividends from Matson totaling $60 million for each of the
last three years ended December 31, 2009, 2008, and 2007.
ITEM
9. CHANGES IN AND DISAGREEMENTS WITH ACCOUNTANTS ON ACCOUNTING AND FINANCIAL
DISCLOSURE
Not applicable.
ITEM
9A. CONTROLS AND PROCEDURES
A. Disclosure Controls and
Procedures
The Company’s management, with the
participation of the Company’s Chief Executive Officer and Chief Financial
Officer, has evaluated the effectiveness of the Company’s disclosure controls
and procedures (as such term is defined in Rules 13a-15(e) and 15d-15(e) under
the Exchange Act) as of the end of the period covered by this report. Based on
such evaluation, the Company’s Chief Executive Officer and Chief Financial
Officer have concluded that, as of the end of such period, the Company’s
disclosure controls and procedures are effective.
B. Internal Control over Financial
Reporting
(a) See page 57 for
management’s annual report on internal control over financial
reporting.
(b) See page 58 for report of
independent registered public accounting firm.
(c) There have not been any
changes in the Company’s internal control over financial reporting (as such term
is defined in Rules 13a-15(f) and 15d-15(f) under the Exchange Act) during the
Company’s fiscal fourth quarter that have materially affected, or are reasonably
likely to materially affect, the Company’s internal control over financial
reporting.
ITEM
9B. OTHER INFORMATION
Not applicable.
PART
III
ITEM
10. DIRECTORS, EXECUTIVE OFFICERS AND CORPORATE
GOVERNANCE
A. Directors
For
information about the directors of A&B, see the section captioned “Election
of Directors” in A&B’s proxy statement dated March 11, 2010 (“A&B’s
2010 Proxy Statement”), which section is incorporated herein by
reference.
B. Executive
Officers
The name
of each executive officer of A&B (in alphabetical order), age (in
parentheses) as of February 19, 2010, and present and prior positions with
A&B and business experience for the past five years are given
below.
Generally,
the term of office of executive officers is at the pleasure of the Board of
Directors. For a discussion of compliance with Section 16(a) of the
Exchange Act by A&B’s directors and executive officers, see the subsection
captioned “Section 16(a) Beneficial Ownership Reporting Compliance” in A&B’s
2010 Proxy Statement, which subsection is incorporated herein by
reference. For a discussion of change in control agreements and an
Executive Transition Agreement between A&B and certain of A&B’s
executive officers, and the Executive Severance Plan, see the subsections
captioned “Other Potential Post-Employment Payments” in A&B’s 2010 Proxy
Statement, which subsections are incorporated herein by reference.
Christopher
J. Benjamin (46)
Senior
Vice President of A&B, 7/05-present; Chief Financial Officer of A&B,
2/04-present; Treasurer of A&B, 5/06-present; Plantation General Manager,
Hawaiian Commercial & Sugar Company, 3/09-present; Vice President of
A&B, 4/03-6/05; first joined A&B or a subsidiary in 2001.
Norbert
M. Buelsing (58)
President
of A & B Properties, Inc., 10/08-present; Executive Vice President
of A & B Properties, Inc., 1/99-9/08; first joined A&B or a
subsidiary in 1990.
Meredith
J. Ching (53)
Senior
Vice President (Government & Community Relations) of A&B, 6/07-present;
Vice President of A&B, 10/92-6/07; first joined A&B or a subsidiary in
1982.
Nelson
N. S. Chun (57)
Senior
Vice President and Chief Legal Officer, 7/05-present; Vice President and General
Counsel of A&B, 11/03-6/05; Partner, Cades Schutte LLP, 10/83-11/03; first
joined A&B or a subsidiary in 2003.
Matthew
J. Cox (48)
President
of Matson, 10/08-present; Executive Vice President and Chief Operating Officer
of Matson, 7/05-9/08; Senior Vice President and Chief Financial Officer of
Matson, 6/01-6/05; first joined A&B or a subsidiary in 2001.
Paul
K. Ito (39)
Vice
President of A&B, 4/07-present; Controller of A&B, 5/06-present;
Director, Internal Audit of A&B, 4/05-4/06; Senior Manager,
Deloitte & Touche LLP, 5/96-3/05; first joined A&B or a subsidiary
in 2005.
Stanley
M. Kuriyama (56)
Chief
Executive Officer of A&B, 1/10-present; President of A&B, 10/08-present;
President and Chief Executive Officer, Land Group, 7/05-9/08; Chief Executive
Officer and Vice Chairman of A & B Properties, Inc., 12/99-9/08;
first joined A&B or a subsidiary in 1992.
Alyson
J. Nakamura (44)
Secretary
of A&B, 2/99-present; first joined A&B or a subsidiary in
1994.
Son-Jai
Paik (37)
Vice
President (Human Resources) of A&B, 1/07-present; Vice President, Human
Resources, LINA Korea, CIGNA Corporation, 3/03-12/06; first joined A&B or a
subsidiary in 2007.
C. Corporate
Governance
For
information about the Audit Committee of the A&B Board of Directors, see the
section captioned “Certain Information Concerning the Board of Directors” in
A&B’s 2010 Proxy Statement, which section is incorporated herein by
reference.
D. Code
of Ethics
For
information about A&B’s Code of Ethics, see the subsection captioned “Code
of Ethics” in A&B’s 2010 Proxy Statement, which subsection is incorporated
herein by reference.
ITEM
11. EXECUTIVE COMPENSATION
See the
section captioned “Executive Compensation” and the subsection captioned
“Compensation of Directors” in A&B’s 2010 Proxy Statement, which section and
subsection are incorporated herein by reference.
ITEM
12. SECURITY OWNERSHIP OF CERTAIN BENEFICIAL OWNERS AND MANAGEMENT
AND RELATED STOCKHOLDER MATTERS
See the
section captioned “Security Ownership of Certain Shareholders” and the
subsection titled “Security Ownership of Directors and Executive Officers” in
A&B’s 2010 Proxy Statement, which section and subsection are incorporated
herein by reference. See the Equity Compensation Plan Information
table in Item 5 of Part II.
ITEM
13. CERTAIN RELATIONSHIPS AND RELATED TRANSACTIONS, AND DIRECTOR
INDEPENDENCE
See the
section captioned “Election of Directors” and the subsection captioned “Certain
Relationships and Transactions” in A&B’s 2010 Proxy Statement, which section
and subsection are incorporated herein by reference.
ITEM
14. PRINCIPAL ACCOUNTING FEES AND SERVICES
Information
concerning principal accountant fees and services appears in the section
captioned “Ratification of Appointment of Independent Registered Public
Accounting Firm” in A&B’s 2010 Proxy Statement, which section is
incorporated herein by reference.
PART
IV
ITEM
15. EXHIBITS AND FINANCIAL STATEMENT SCHEDULES
A. Financial
Statements
The
financial statements are set forth in Item 8 of Part II
above.
B. Financial
Statement Schedules
All
schedules are omitted because of the absence of the conditions under which they
are required or because the information called for is included in the financial
statements or notes thereto.
C. Exhibits Required by Item 601 of
Regulation S-K
Exhibits
not filed herewith are incorporated by reference to the exhibit number and
previous filing shown in parentheses. All previous exhibits were
filed with the Securities and Exchange Commission in Washington,
D.C. Exhibits filed pursuant to the Securities Exchange Act of 1934
were filed under file number 000-00565. Shareholders may obtain
copies of exhibits for a copying and handling charge of $0.15 per page by
writing to Alyson J. Nakamura, Secretary, Alexander & Baldwin,
Inc., P. O. Box 3440, Honolulu, Hawaii 96801.
3. Articles
of incorporation and bylaws.
3.a. Restated
Articles of Association of Alexander & Baldwin, Inc., as restated
effective May 5, 1986, together with Amendments dated April 28, 1988 and
April 26, 1990 (Exhibits 3.a.(iii) and (iv) to A&B’s Form 10-Q for the
quarter ended March 31, 1990).
3.b. Revised
Bylaws of Alexander & Baldwin, Inc. (as amended through
January 25, 2007) (Exhibit 3.b. to A&B’s Form 10-K for the
year ended December 31, 2006).
4. Instruments
defining rights of security holders, including indentures.
4.b. Debt.
4.b. (i) $400,000,000
Note Purchase and Private Shelf Agreement among Alexander & Baldwin, Inc.,
Prudential Investment Management, Inc., The Prudential Insurance Company of
America, Prudential Retirement Insurance and Annuity Company, Gibraltar Life
Insurance Co., Ltd., and The Prudential Life Insurance Company, Ltd., dated as
of April 19, 2006 (Exhibit 10.1 to A&B’s Form 8-K dated April 20,
2006).
(ii) Amendment,
dated April 9, 2007, to Note Purchase and Private Shelf Agreement among
Alexander & Baldwin, Inc., Prudential Investment Management, Inc., The
Prudential Insurance Company of America, Prudential Retirement Insurance and
Annuity Company, Gibraltar Life Insurance Co., Ltd., and The Prudential Life
Insurance Company, Ltd., dated as of April 19, 2006 (Exhibit 4.b.(ii) to
A&B’s Form 10-Q for the quarter ended June 30, 2007).
(iii) Amendment,
dated March 8, 2009, to Note Purchase and Private Shelf Agreement among
Alexander & Baldwin, Inc., Prudential Investment Management, Inc., The
Prudential Insurance Company of America, Prudential Retirement Insurance and
Annuity Company, Gibraltar Life Insurance Co., Ltd., and The Prudential Life
Insurance Company, Ltd., dated as of April 19, 2006 (Exhibit 4.b.(iii) to
A&B’s Form 8-K dated February 20, 2009).
10. Material
contracts.
10.a. (i) Note
Agreement among Alexander & Baldwin, Inc., A&B-Hawaii, Inc. and The
Prudential Insurance Company of America, dated as of June 4, 1993 (Exhibit
10.a.(xiii) to A&B’s Form 8-K dated June 4, 1993).
(ii) Amendment
dated as of May 20, 1994 to the Note Agreement among Alexander &
Baldwin, Inc., A&B-Hawaii, Inc. and The Prudential Insurance Company of
America, dated as of June 4, 1993 (Exhibit 10.a.(xviv) to A&B’s
Form 10-Q for the quarter ended June 30, 1994).
(iii) Amendment
dated as of June 30, 1995 to the Note Agreement, among Alexander &
Baldwin, Inc., A&B-Hawaii, Inc. and The Prudential Insurance Company of
America, dated as of June 4, 1993 (Exhibit 10.a.(xxvii) to A&B’s
Form 10-Q for the quarter ended June 30, 1995).
(iv) Amendment
dated as of November 29, 1995 to the Note Agreement among Alexander &
Baldwin, Inc., A&B-Hawaii, Inc. and The Prudential Insurance Company of
America, dated as of June 4, 1993 (Exhibit 10.a.(xvii) to A&B’s Form
10-K for the year ended December 31, 1995).
(v) Amendment
dated as of January 16, 2007 to the Note Agreement among Alexander &
Baldwin, Inc., A&B-Hawaii, Inc. and The Prudential Insurance Company of
America, dated as of June 4, 1993 (Exhibit 10.a.(v) to A&B’s
Form 10-K for the year ended December 31, 2006).
(vi) Private
Shelf Agreement between Alexander & Baldwin, Inc., A&B-Hawaii,
Inc., and Prudential Insurance Company of America, dated as of August 2, 1996
(Exhibit 10.a.(xxxiii) to A&B’s Form 10-Q for the quarter ended
September 30, 1996).
(vii) First
Amendment, dated as of February 5, 1999, to the Private Shelf Agreement between
Alexander & Baldwin, Inc., A&B-Hawaii, Inc., and Prudential
Insurance Company of America, dated as of August 2, 1996 (Exhibit
10.a.(xxii) to A&B’s Form 10-K for the year ended December 31,
1998).
(viii) Private
Shelf Agreement between Alexander & Baldwin, Inc. and Prudential
Insurance Company of America, dated as of April 25, 2001 (Exhibit 10.a.(xlvii)
to A&B’s Form 10-Q for the quarter ended June 30, 2001).
(ix) Amendment,
dated as of April 25, 2001, to the Note Agreement among Alexander &
Baldwin, Inc., A&B-Hawaii, Inc. and The Prudential Insurance Company of
America, dated as of June 4, 1993, and the Private Shelf Agreement between
Alexander & Baldwin, Inc., A&B-Hawaii, Inc., and Prudential
Insurance Company of America, dated as of August 2, 1996 (Exhibit 10.a.(xlviii)
to A&B’s Form 10-Q for the quarter ended June 30, 2001).
(x) Amendment,
dated April 9, 2007, to (i) Note Agreement among Alexander & Baldwin,
Inc., A&B-Hawaii, Inc. and The Prudential Insurance Company of America,
dated as of June 4, 1993; (ii) Private Shelf Agreement between
Alexander & Baldwin, Inc., A&B-Hawaii, Inc., and Prudential
Insurance Company of America, dated as of August 2, 1996; and (iii) Private
Shelf Agreement between Alexander & Baldwin, Inc. and Prudential
Insurance Company of America, dated as of April 25, 2001 (Exhibit 10.a.(xxv) to
A&B Form 10-Q for the quarter ended June 30, 2007).
(xi) Credit
Agreement, dated December 28, 2006, between Alexander & Baldwin, Inc.
and First Hawaiian Bank, Bank of America, N.A., Wells Fargo Bank, National
Association, BNP Paribas, American Savings Bank, F.S.B., and Bank of Hawaii
(Exhibit 10.1 to A&B’s Form 8-K dated December 28, 2006).
(xii) First
Amendment to Credit Agreement, dated March 7, 2008, between Alexander &
Baldwin, Inc. and First Hawaiian Bank, Bank of America, N.A., Wells Fargo Bank,
National Association, BNP Paribas, American Savings Bank, F.S.B., and Bank of
Hawaii (Exhibit 10.a.(xii) to A&B Form 10-Q for the quarter ended March 31,
2008).
(xiii) Amended
and Restated Note Agreement dated May 19, 2005 among Matson Navigation
Company, Inc., The Prudential Insurance Company of America, and Pruco Life
Insurance Company (Exhibit 10.1 to A&B’s Form 8-K dated May 19,
2005).
(xiv) Amendment,
dated December 19, 2007, to Amended and Restated Note Agreement dated May 19,
2005 among Matson Navigation Company, Inc., The Prudential Insurance Company of
America, and Pruco Life Insurance Company (Exhibit 10.a.(xiii) to A&B’s
Form 10-K for the year ended December 31, 2007).
(xv) First
Preferred Ship Mortgage dated May 19, 2005, between Matson Navigation
Company, Inc. and The Prudential Insurance Company of America (Exhibit 10.2
to A&B’s Form 8-K dated May 19, 2005).
(xvi) Security
Agreement between Matson Navigation Company, Inc. and the United States of
America, with respect to $55 million of Title XI ship financing bonds,
dated July 29, 2004 (Exhibit 10.a.(xxvi) to A&B’s Form 10-Q for the
quarter ended September 30, 2004).
(xvii) Amendment
No. 1 dated September 21, 2007, to Security Agreement between Matson Navigation
Company, Inc. and the United States of America, with respect to $55 million
of Title XI ship financing bonds, dated July 29, 2004 (Exhibit 10.a.(xxx)
to A&B’s Form 10-Q for the quarter ended September 30,
2007).
(xviii) Senior
Secured Reducing Revolving Credit Agreement between Matson Navigation Company,
Inc. and DnB NOR Bank ASA, dated June 28, 2005 (Exhibit 10.1 to A&B’s Form
8-K dated June 28, 2005).
(xix) Amendment
No. 1, dated November 30, 2007, to Senior Secured Reducing Revolving
Credit Agreement between Matson Navigation Company, Inc. and DnB NOR Bank ASA,
dated June 28, 2005 (Exhibit 10.a.(xviii) to A&B’s Form 10-K for
the year ended December 31, 2007).
(xx) Credit
Agreement, dated December 28, 2006, between Matson Navigation Company, Inc. and
First Hawaiian Bank, Bank of America, N.A., Wells Fargo Bank, National
Association, BNP Paribas, American Savings Bank, F.S.B., and Bank of Hawaii
(Exhibit 10.2 to A&B’s Form 8-K dated December 28, 2006).
(xxi) Second
Amendment to Credit Agreement, dated March 7, 2008, between Matson Navigation
Company, Inc. and First Hawaiian Bank, Bank of America, N.A., Wells Fargo Bank,
National Association, BNP Paribas, American Savings Bank, F.S.B., and Bank of
Hawaii (Exhibit 10.a.(xxi) to A&B Form 10-Q for the quarter ended March 31,
2008).
(xxii) First
Amendment, dated November 20, 2007, to Credit Agreement, dated
December 28, 2006, between Matson Navigation Company, Inc. and First
Hawaiian Bank, Bank of America, N.A., Wells Fargo Bank, National Association,
BNP Paribas, American Savings Bank, F.S.B., and Bank of Hawaii
(Exhibit 10.a.(xx) to A&B’s Form 10-K for the year ended
December 31, 2007).
(xxiii) Promissory
Note, dated September 18, 2003, by Deer Valley Financial Center, LLC, Huntington
Company, L.L.C., Geneva Company, L.L.C., and Metzger Deer Valley, LLC in favor
of PNC Bank, National Association (Exhibit 10.a.(xxxvi) to A&B’s Form 10-Q
for the quarter ended June 30, 2005).
(xxiv) Consent
and Assumption Agreement With Release and Modification of Loan Documents, dated
June 6, 2005, among Deer Valley Financial Center, LLC, Huntington Company,
L.L.C., Geneva Company, L.L.C., Metzger Deer Valley, LLC, R. Craig Hannay,
A&B Deer Valley LLC, ABP Deer Valley LLC, WDCI Deer Valley LLC, Alexander
& Baldwin, Inc., and Midland Loan Services, Inc. (Exhibit 10.a.(xxxvii)
to A&B’s Form 10-Q for the quarter ended June 30, 2005).
(xxv) Borrower’s
Certificate, dated June 6, 2005, by A&B Deer Valley LLC, ABP Deer Valley
LLC, and WDCI Deer Valley LLC in favor of Wells Fargo Bank N.A. (Exhibit
10.a.(xxxviii) to A&B’s Form 10-Q for the quarter ended June 30,
2005).
(xxvi) General
Contract of Indemnity, among Alexander & Baldwin, Inc., Kukui`ula
Development Company (Hawaii), LLC, DMB Kukui`ula LLC, and DMB Communities LLC,
in favor of Travelers Casualty and Surety Company of America, dated June 13,
2006 (Exhibit 10.1 to A&B’s Form 8-K dated June 14,
2006).
(xxvii) Mutual
Indemnification Agreement, among Kukui`ula Development Company (Hawaii), LLC,
DMB Kukui`ula LLC, DMB Communities LLC, and Alexander & Baldwin, Inc.,
dated June 14, 2006 (Exhibit 10.2 to A&B’s Form 8-K dated
June 14, 2006).
(xxviii) General
Agreement of Indemnity, among Alexander & Baldwin, Inc., Kukui`ula
Development Company (Hawaii), LLC, and DMB Communities LLC, in favor of Safeco
Insurance Company of America, dated August 30, 2006 and entered into September
5, 2006 (Exhibit 10.1 to A&B’s Form 8-K dated September 5,
2006).
(xxix) Mutual
Indemnification Agreement, among Kukui`ula Development Company (Hawaii), LLC,
DMB Kukui`ula LLC, DMB Communities LLC, and Alexander & Baldwin, Inc., dated
August 30, 2006 and entered into September 5, 2006 (Exhibit 10.2 to
A&B’s Form 8-K dated September 5, 2006).
(xxx) Floating
Continuing Guarantee, dated July 29, 2005, among Alexander & Baldwin, Inc.,
American AgCredit, PCA and other financial institutions (Exhibit 10.a.(xxxix) to
A&B’s Form 10-Q for the quarter ended June 30, 2005).
(xxxi) Amendment
to Floating Continuing Guaranty between Alexander & Baldwin, Inc. and
American AgCredit, PCA, dated July 7, 2008 (Exhibit 10.1 to A&B’s Form 8-K
dated July 7, 2008).
(xxxii) Vessel
Construction Contract between Matson Navigation Company, Inc. and Kvaerner
Philadelphia Shipyard Inc., dated May 29, 2002 (Exhibit 10.a.(xxvii) to
A&B’s Form 10-Q for the quarter ended June 30, 2002).
(xxxiii) Vessel
Purchase and Sale Agreement between Matson Navigation Company, Inc. and Kvaerner
Shipholding, Inc., dated May 29, 2002 (Exhibit 10.a.(xxviii) to A&B’s
Form 10-Q for the quarter ended June 30, 2002).
(xxxiv) Waiver
of Cancellation Provisions Vessel Construction Contracts among Matson Navigation
Company, Inc., Kvaerner Philadelphia Shipyard Inc. and Kvaerner Shipholding
Inc., dated December 30, 2002 (Exhibit 10.a.(xxx) to A&B’s Form 10-K
for the year ended December 31, 2002).
(xxxv) Shipbuilding
Contract (Hull 003) between Kvaerner Philadelphia Shipyard Inc. and Matson
Navigation Company, Inc., dated February 14, 2005 (Exhibit 10.a.(xxxix) to
A&B’s Form 10-K for the year ended December 31, 2004).
(xxxvi) Amendment
No. 1 dated February 18, 2005, to Shipbuilding Contract (Hull 003) between
Kvaerner Philadelphia Shipyard Inc. and Matson Navigation Company, Inc., dated
February 14, 2005 (Exhibit 10.a.(xl) to A&B’s Form 10-K for the year
ended December 31, 2004).
(xxxvii) Amendment
No. 2 dated October 28, 2005, to Shipbuilding Contract (Hull 003) between
Aker Philadelphia Shipyard, Inc. (formerly Kvaerner Philadelphia Shipyard Inc.)
and Matson Navigation Company, Inc., dated February 14, 2005
(Exhibit 10.a.(l) to A&B’s Form 10-K for the year ended
December 31, 2005).
(xxxviii) Shipbuilding
Contract (Hull BN460) between Kvaerner Philadelphia Shipyard Inc. and Matson
Navigation Company, Inc., dated February 14, 2005 (Exhibit 10.a.(xli) to
A&B’s Form 10-K for the year ended December 31, 2004).
(xxxix) Amendment
No. 1 dated February 18, 2005, to Shipbuilding Contract (Hull BN460)
between Kvaerner Philadelphia Shipyard Inc. and Matson Navigation Company, Inc.,
dated February 14, 2005 (Exhibit 10.a.(xlii) to A&B’s Form 10-K for the
year ended December 31, 2004).
(xl) Amendment
No. 2 dated October 28, 2005, to Shipbuilding Contract (Hull BN460) between
Aker Philadelphia Shipyard, Inc. (formerly Kvaerner Philadelphia Shipyard Inc.)
and Matson Navigation Company, Inc., dated February 14, 2005
(Exhibit 10.a.(liii) to A&B’s Form 10-K for the year ended
December 31, 2005).
(xli) Amendment
No. 3 dated July 7, 2006, to Shipbuilding Contract (Hull BN460) between
Aker Philadelphia Shipyard, Inc. and Matson Navigation Company, Inc., dated
February 14, 2005 (Exhibit 10.a.(lv) to A&B’s Form 10-Q for the quarter
ended June 30, 2006).
(xlii) Right
of First Refusal Agreement between Kvaerner Philadelphia Shipyard Inc. and
Matson Navigation Company, Inc., dated February 14, 2005
(Exhibit 10.a.(xliii) to A&B’s Form 10-K for the year ended
December 31, 2004).
(xliii) Amendment
No. 1 dated October 28, 2005, to Right of First Refusal Agreement between
Aker Philadelphia Shipyard, Inc. (formerly Kvaerner Philadelphia Shipyard Inc.)
and Matson Navigation Company, Inc., dated February 14, 2005
(Exhibit 10.a.(lv) to A&B’s Form 10-K for the year ended
December 31, 2005).
*10.b.1. (i) Alexander &
Baldwin, Inc. 1998 Stock Option/Stock Incentive Plan
(Exhibit 10.b.1.(xxxii) to A&B’s Form 10-Q for the quarter ended March
31, 1998).
(ii) Amendment
No. 1 to the Alexander & Baldwin, Inc. 1998 Stock Option/Stock
Incentive Plan, dated October 25, 2000 (Exhibit 10.b.1.(xi) to A&B’s
Form 10-K for the year ended December 31, 2000).
(iii) Amendment
No. 2 to the Alexander & Baldwin, Inc. 1998 Stock Option/Stock
Incentive Plan, dated January 24, 2002 (Exhibit 10.b.1.(xlvi) to A&B’s
Form 10-Q for the quarter ended March 31, 2002).
(iv) Amendment
No. 3 to the Alexander & Baldwin, Inc. 1998 Stock Option/Stock
Incentive Plan, dated February 24, 2005 (Exhibit 10.b.1.(xiii) to A&B’s
Form 10-Q for the quarter ended March 31, 2005).
(v) Amendment
No. 4 to the Alexander & Baldwin, Inc. 1998 Stock Option/Stock Incentive
Plan, dated June 22, 2006 (Exhibit 10.b.1.(xiv) to A&B’s Form 10-Q for
the quarter ended June 30, 2006).
(vi) Amendment
No. 5 to the Alexander & Baldwin, Inc. 1998 Stock Option/Stock Incentive
Plan, dated October 26, 2006 (Exhibit 10.b.1.(xvii) to A&B’s Form 10-Q for
the quarter ended September 30, 2006).(vii) Form of Non-Qualified
Stock Option Agreement and Addendum pursuant to the Alexander & Baldwin,
Inc. 1998 Stock Option/Stock Incentive Plan (Exhibit 10.b.1.(xvi) to
A&B’s Form 10-Q for the quarter ended June 30, 2006 and Exhibit
10.b.1.(xx) to A&B’s Form 10-K for the year ended December 31, 2006,
respectively).
(viii) Form
of Non-Qualified Stock Option Agreement pursuant to the Alexander & Baldwin,
Inc. 1998 Stock Option/Stock Incentive Plan (Exhibit 10.b.1.(xxi) to A&B’s
Form 10-K for the year ended December 31, 2006).
(ix) Alexander &
Baldwin, Inc. 1998 Non-Employee Director Stock Option Plan (Exhibit
10.b.1.(xxxiii) to A&B’s Form 10-Q for the quarter ended March 31,
1998).
(x) Amendment
No. 1 to the Alexander & Baldwin, Inc. 1998 Non-Employee Director Stock
Option Plan, dated October 25, 2000 (Exhibit 10.b.1.(xiii) to A&B’s Form
10-K for the year ended December 31, 2000).
(xi) Amendment
No. 2 to the Alexander & Baldwin, Inc. 1998 Non-Employee Director Stock
Option Plan, dated February 26, 2004 (Exhibit 10.b.1.(xiv) to A&B’s Form
10-Q for the quarter ended March 31, 2004).
(xii) Amendment
No. 3 to the Alexander & Baldwin, Inc. 1998 Non-Employee Director Stock
Option Plan, dated June 23, 2004 (Exhibit 10.b.1.(xvi) to A&B’s Form 10-Q
for the quarter ended June 30, 2004).
(xiii) Amendment
No. 4 to the Alexander & Baldwin, Inc. 1998 Non-Employee Director Stock
Option Plan, dated October 26, 2006 (Exhibit 10.b.1(xxv) to A&B’s Form 10-Q
for the quarter ended September 30, 2006).
(xiv) Alexander
& Baldwin, Inc. 2007 Incentive Compensation Plan (Exhibit 10.b.1.(xxxi)
to A&B’s Form 10-Q for the quarter ended March 31,
2007).
(xv) Amendment
No. 1 to the Alexander & Baldwin, Inc. -2007 Incentive Compensation Plan,
dated June 28, 2007 (Exhibit 10.b.1.(xxxii) to A&B’s Form 10-Q for the
quarter ended June 30, 2007).
(xvi) Amendment
No. 2 to the Alexander & Baldwin, Inc. 2007 Incentive Compensation Plan,
dated December 13, 2007 (Exhibit 10.b.1.(xxxiii) to A&B’s
Form 10-K for the year ended December 31, 2007).
(xvii) Form
of Restricted Stock Unit Award Agreement for Non-Employee Board Member pursuant
to Alexander & Baldwin, Inc. 2007 Incentive Compensation Plan
(Exhibit 10.b.1.(xxxii) to A&B’s Form 10-Q for the quarter ended
March 31, 2007).
(xviii) Form
of Restricted Stock Unit Award Agreement (Deferral Election) for Non-Employee
Board Member pursuant to the Alexander & Baldwin, Inc. 2007 Incentive
Compensation Plan (Exhibit 10.b.1.(xxxv) to A&B’s Form 10-Q for the quarter
ended March 31, 2008).
(xix) Deferral
Election Form for Restricted Stock Unit Award for Non-Employee Board Member
pursuant to the Alexander & Baldwin, Inc. 2007 Incentive Compensation Plan
(Exhibit 10.b.1.(xxxvi) to A&B’s Form 10-Q for the quarter ended March 31,
2008).
(xx) Form
of Restricted Stock Unit Award Agreement (No Deferral Election) for Non-Employee
Board Member pursuant to the Alexander & Baldwin, Inc. 2007 Incentive
Compensation Plan (Exhibit 10.b.1.(xxxvii) to A&B’s Form 10-Q for the
quarter ended March 31, 2008).
(xxi) Form
of Notice of Grant of Stock Option pursuant to the Alexander & Baldwin, Inc.
2007 Incentive Compensation Plan (Exhibit 10.b.1.(xxxiv) to A&B’s Form 10-Q
for the quarter ended June 30, 2007).
(xxii) Form
of Executive Stock Option Agreement pursuant to the Alexander & Baldwin,
Inc. 2007 Incentive Compensation Plan (Exhibit 10.b.1.(xxxv) to A&B’s Form
10-Q for the quarter ended June 30, 2007).
(xxiii) Form
of Notice of Award of Time-Based Restricted Stock Units pursuant to the
Alexander & Baldwin, Inc. 2007 Incentive Compensation Plan (Exhibit
10.b.1.(xxxvi) to A&B’s Form 10-Q for the quarter ended June 30,
2007).
(xxiv) Form
of Executive Time-Based Restricted Stock Unit Award Agreement pursuant to the
Alexander & Baldwin, Inc. 2007 Incentive Compensation Plan (Exhibit
10.b.1.(xxxvii) to A&B’s Form 10-Q for the quarter ended June 30,
2007).
(xxv) Form
of Notice of Award of Performance-Based Restricted Stock Units pursuant to the
Alexander & Baldwin, Inc. 2007 Incentive Compensation Plan (Exhibit
10.b.1.(xxxviii) to A&B’s Form 10-Q for the quarter ended June 30,
2007).
(xxvi) Form
of Executive Performance-Based Restricted Stock Unit Award Agreement pursuant to
the Alexander & Baldwin, Inc. 2007 Incentive Compensation Plan (Exhibit
10.b.1.(xxxix) to A&B’s Form 10-Q for the quarter ended June 30,
2007).
(xxvii) Addendum
to Stock Option Agreements, Performance-Based Restricted Stock Unit Award
Agreement, and Time-Based Restricted Stock Unit Award Agreement (Exhibit
10.b.1.(xli) to A&B’s Form 10-K for the year ended December 31,
2007).
(xxviii) Form
of Notice of Grant of Stock Option pursuant to the Alexander & Baldwin, Inc.
2007 Incentive Compensation Plan (Exhibit 10.b.1.(xlv) to A&B’s Form 10-Q
for the quarter ended March 31, 2008).
(xxix) Form
of Executive Stock Option Agreement pursuant to the Alexander & Baldwin,
Inc. 2007 Incentive Compensation Plan (Exhibit 10.b.1.(xlvi) to A&B’s Form
10-Q for the quarter ended March 31, 2008).
(xxx) Form
of Notice of Award of Time-Based Restricted Stock Units pursuant to the
Alexander & Baldwin, Inc. 2007 Incentive Compensation Plan (Exhibit
10.b.1.(xlvii) to A&B’s Form 10-Q for the quarter ended March 31,
2008).
(xxxi) Form
of Executive Time-Based Restricted Stock Unit Award Agreement pursuant to the
Alexander & Baldwin, Inc. 2007 Incentive Compensation Plan (Exhibit
10.b.1.(xlviii) to A&B’s Form 10-Q for the quarter ended March 31,
2008).
(xxxii) Form
of Notice of Award of Performance-Based Restricted Stock Units pursuant to the
Alexander & Baldwin, Inc. 2007 Incentive Compensation Plan (Exhibit
10.b.1.(xlix) to A&B’s Form 10-Q for the quarter ended March 31,
2008).
(xxxiii) Form
of Executive Performance-Based Restricted Stock Unit Award Agreement pursuant to
the Alexander & Baldwin, Inc. 2007 Incentive Compensation Plan (Exhibit
10.b.1.(l) to A&B’s Form 10-Q for the quarter ended March 31,
2008).
(xxxiv) Form
of Executive Time-Based Restricted Stock Unit Award Agreement pursuant to the
Alexander & Baldwin, Inc. 2007 Incentive Compensation Plan (Exhibit
10.b.1.(xl) to A&B’s Form 10-K for the year ended December 31,
2008).
(xxxv) Form
of Notice of Award of Performance-Based Restricted Stock Unit pursuant to the
Alexander & Baldwin, Inc. 2007 Incentive Compensation Plan (Exhibit
10.b.1.(xli) to A&B’s Form 10-K for the year ended December 31,
2008).
(xxxvi) Form
of Executive Performance-Based Restricted Stock Unit Award Agreement pursuant to
the Alexander & Baldwin, Inc. 2007 Incentive Compensation Plan (Exhibit
10.b.1.(xlii) to A&B’s Form 10-K for the year ended December 31,
2008).
(xxxvii) Form
of Notice of Grant of Stock Option pursuant to the Alexander & Baldwin, Inc.
2007 Incentive Compensation Plan.
(xxxviii) Form
of Executive Stock Option Agreement pursuant to the Alexander & Baldwin,
Inc. 2007 Incentive Compensation Plan.
(xxxix) Form
of Notice of Award of Time-Based Restricted Stock Units pursuant to the
Alexander & Baldwin, Inc. 2007 Incentive Compensation Plan.
(xl) Form
of Executive Time-Based Restricted Stock Unit Award Agreement pursuant to the
Alexander & Baldwin, Inc. 2007 Incentive Compensation Plan.
(xli) Form
of Notice of Award of Performance-Based Restricted Stock Units pursuant to the
Alexander & Baldwin, Inc. 2007 Incentive Compensation Plan.
(xlii) Form
of Executive Performance-Based Restricted Stock Unit Award Agreement pursuant to
the Alexander & Baldwin, Inc. 2007 Incentive Compensation Plan.
(xliii) A&B
Deferred Compensation Plan for Outside Directors, amended and restated effective
as of January 1, 2008 (Exhibit 10.b.1.(xliii) to A&B’s Form 10-K for
the year ended December 31, 2008).
(xliv) A&B
Excess Benefits Plan, amended and restated effective as of January 1, 2008
(Exhibit 10.b.1.(xliv) to A&B’s Form 10-K for the year ended December 31,
2008).
(xlv) Amendment
No. 1 to the A&B Excess Benefits Plan, effective as of January 1, 2008
(Exhibit 10.b.1.(xlv) to A&B’s Form 10-Q for the quarter ended September 30,
2009).
(xlvi) Executive
Survivor/Retirement Benefit Plan, amended and restated effective January 1, 2005
(Exhibit 10.b.1.(xxvi) to A&B’s Form 10-Q for the quarter ended
June 30, 2006).
(xlvii) A&B
Executive Survivor/Retirement Benefit Plan, amended and restated effective
February 27, 2008 (Exhibit 10.b.1.(liv) to A&B’s Form 10-Q for the quarter
ended March 31, 2008).
(xlviii) A&B
1985 Supplemental Executive Retirement Plan, amended and restated effective as
of January 1, 2008 (Exhibit 10.b.1.(xlvii) to A&B’s Form 10-K for the
year ended December 31, 2008).
(xlix) Restatement
of the A&B Retirement Plan for Outside Directors, effective February 1, 1995
(Exhibit 10.b.1.(xxvi) to A&B’s Form 10-K for the year ended December
31, 1994).
(l) Amendment
No. 1 to the A&B Retirement Plan for Outside Directors, dated July 1,
1998 (Exhibit 10.b.1.(xlii) to A&B’s Form 10-Q for the quarter ended
September 30, 1998).
(li) Amendment
No. 2 to the A&B Retirement Plan for Outside Directors, dated October 25,
2000 (Exhibit 10.b.1.(xxxvi) to A&B’s Form 10-K for the year ended
December 31, 2000).
(lii) Amendment
No. 3 to the A&B Retirement Plan for Outside Directors, dated
December 9, 2004 (Exhibit 10.b.1.(xxxix) to A&B’s Form 10-K for
the year ended December 31, 2004).
(liii) Amendment
No. 4 to the A&B Retirement Plan for Outside Directors, dated February 24,
2005 (Exhibit 10.1 to A&B’s Form 8-K dated February 23, 2005).
(liv) Form
of Agreement entered into with certain executive officers (Exhibit 10.b.1.(liii)
to A&B’s Form 10-K for the year ended December 31, 2008).
(lv) Schedule
identifying executive officers who have entered into Form of Agreement
referenced in 10.b.1.(liii) (Exhibit 10.b.1.(liv) to A&B’s Form 10-K for the
year ended December 31, 2008).
(lvi) Alexander
& Baldwin, Inc. Executive Severance Plan, effective as of January 1,
2008 (Exhibit 10.b.1.(lv) to A&B’s Form 10-K for the year ended December 31,
2008).
(lvii) Alexander
& Baldwin, Inc. One-Year Performance Improvement Incentive Plan, as restated
effective October 22, 1992 (Exhibit 10.b.1.(xxi) to A&B’s Form 10-K for the
year ended December 31, 1992).
(lviii) Amendment
No. 1 to the Alexander & Baldwin, Inc. One-Year Performance Improvement
Incentive Plan, dated December 13, 2001 (Exhibit 10.b.1.(xxxvii) to A&B’s
Form 10-K for the year ended December 31, 2001).
(lix) Amendment
No. 2 to the Alexander & Baldwin, Inc. One-Year Performance Improvement
Incentive Plan, dated February 25, 2004 (Exhibit 10.b.1.(xxxix) to A&B’s
Form 10-Q for the quarter ended March 31, 2004).
(lx) Amendment
No. 3 to the Alexander & Baldwin, Inc. One-Year Performance Improvement
Incentive Plan, dated December 7, 2005 (Exhibit 10.2 to A&B’s Form 8-K dated
December 7, 2005).
(lxi) Amendment
No. 4 to the Alexander & Baldwin, Inc. One-Year Performance Improvement
Incentive Plan, dated October 24, 2007 (Exhibit 10.b.1.(lix) to A&B’s
Form 10-K for the year ended December 31, 2007).
(lxii) Amendment
No. 5 to the Alexander & Baldwin, Inc. One-Year Performance Improvement
Incentive Plan, dated December 13, 2007 (Exhibit 10.b.1.(lx) to A&B’s
Form 10-K for the year ended December 31, 2007).
(lxiii) Alexander
& Baldwin, Inc. Three-Year Performance Improvement Incentive Plan, as
restated effective October 22, 1992 (Exhibit 10.b.1.(xxii) to A&B’s Form
10-K for the year ended December 31, 1992).
(lxiv) Amendment
No. 4 to the Alexander & Baldwin, Inc. Deferred Compensation Plan, dated
December 7, 2005 (Exhibit 10.1 to A&B’s Form 8-K dated December 7,
2005).
(lxv) Alexander
& Baldwin, Inc. Deferred Compensation Plan, amended and restated effective
January 1, 2005 (Exhibit 10.b.1.(xlii) to A&B’s Form 10-Q for the
quarter ended June 30, 2006).
(lxvii) Alexander
& Baldwin, Inc. Restricted Stock Bonus Plan, as restated effective April 28,
1988 (Exhibit 10.c.1.(xi) to A&B’s Form 10-Q for the quarter ended
June 30, 1988).
(lxvii) Amendment
No. 1 to the Alexander & Baldwin, Inc. Restricted Stock Bonus Plan,
effective December 11, 1997 (Exhibit 10.b.1.(ii) to A&B’s Form 10-K for
the year ended December 31, 1997).
(lxviii) Amendment
No. 2 to the Alexander & Baldwin, Inc. Restricted Stock Bonus Plan, dated
June 25, 1998 (Exhibit 10.b.1.(xxxviii) to A&B’s Form 10-Q for the
quarter ended June 30, 1998).
(lxix) Amendment
No. 3 to the Alexander & Baldwin, Inc. Restricted Stock Bonus Plan, dated
December 8, 2004 (Exhibit 10.b.1.(liii) to A&B’s Form 10-K for the
year ended December 31, 2004).
(lxx) Amendment
No. 4 to the Alexander & Baldwin, Inc. Restricted Stock Bonus Plan, dated
December 13, 2007 (Exhibit 10.b.1.(lxviii) to A&B’s Form 10-K for
the year ended December 31, 2007).
(lxxi) Executive
Transition Agreement, dated August 28, 2008, between James S. Andrasick and
Matson Navigation Company, Inc. (Exhibit 10.b.1.(lxvii) to A&B’s Form 10-Q
for the quarter ended September 30, 2008).
(lxxii) Letter
Agreement, dated October 22, 2009, between Alexander & Baldwin, Inc. and W.
Allen Doane.
|
21.
|
Subsidiaries.
|
21. Alexander
& Baldwin, Inc. Subsidiaries as of February 1, 2010.
|
23.
|
Consent
of Deloitte & Touche LLP dated February 25,
2010.
|
|
31.1
|
Certification
of Chief Executive Officer, as Adopted Pursuant to Section 302 of the
Sarbanes-Oxley Act of 2002.
|
|
31.2
|
Certification
of Chief Financial Officer, as Adopted Pursuant to Section 302 of the
Sarbanes-Oxley Act of 2002.
|
|
32.
|
Certification
of Chief Executive Officer and Chief Financial Officer Pursuant to 18
U.S.C. Section 1350, as Adopted Pursuant to Section 906 of the
Sarbanes-Oxley Act of 2002.
|
SIGNATURES
Pursuant
to the requirements of Section 13 or 15(d) of the Securities Exchange Act of
1934, the registrant has duly caused this report to be signed on its behalf by
the undersigned, thereunto duly authorized.
|
ALEXANDER
& BALDWIN, INC.
|
||
|
(Registrant)
|
||
|
Date: February
25, 2010
|
By: /s/
Stanley M. Kuriyama
|
|
|
Stanley
M. Kuriyama, President and
|
||
|
Chief
Executive Officer
|
Pursuant
to the requirements of the Securities Exchange Act of 1934, this report has been
signed below by the following persons on behalf of the registrant in the
capacities and on the dates indicated.
|
Signature
|
Title
|
Date
|
||
|
/s/
Stanley M. Kuriyama
|
President,
|
February
25, 2010
|
||
|
Stanley
M. Kuriyama
|
Chief
Executive Officer and Director
|
|||
|
/s/
Christopher J. Benjamin
|
Senior
Vice President,
|
February
25, 2010
|
||
|
Christopher
J. Benjamin
|
Chief
Financial Officer and Treasurer
|
|||
|
/s/
Paul K. Ito
|
Vice
President, Controller
|
February
25, 2010
|
||
|
Paul
K. Ito
|
and
Assistant Treasurer
|
|||
|
/s/
Walter A. Dods, Jr.
|
Chairman
of the Board
|
February
25, 2010
|
||
|
Walter
A. Dods, Jr.
|
and
Director
|
|||
|
/s/
W. Blake Baird
|
Director
|
February
25, 2010
|
||
|
W.
Blake Baird
|
||||
|
/s/
Michael J. Chun
|
Director
|
February
25, 2010
|
||
|
Michael
J. Chun
|
||||
|
/s/
W. Allen Doane
|
Director
|
February
25, 2010
|
||
|
W.
Allen Doane
|
||||
|
/s/
Charles G. King
|
Director
|
February
25, 2010
|
||
|
Charles
G. King
|
||||
|
/s/
Constance H. Lau
|
Director
|
February
25, 2010
|
||
|
Constance
H. Lau
|
||||
|
/s/
Douglas M. Pasquale
|
Director
|
February
25, 2010
|
||
|
Douglas
M. Pasquale
|
||||
|
/s/
Maryanna G. Shaw
|
Director
|
February
25, 2010
|
||
|
Maryanna
G. Shaw
|
||||
|
/s/
Jeffrey N. Watanabe
|
Director
|
February
25, 2010
|
||
|
Jeffrey
N. Watanabe
|
||||
CONSENT
OF INDEPENDENT REGISTERED PUBLIC ACCOUNTING FIRM
We
consent to the incorporation by reference in Registration Statements No.
33-31922, 33-31923, 33-54825, and 333-69197 on Form S-8 of our report dated
February 25, 2010, relating to the consolidated financial statements of
Alexander & Baldwin, Inc. and subsidiaries and the effectiveness of
Alexander & Baldwin, Inc. and subsidiaries’ internal control over financial
reporting, appearing in this Annual Report on Form 10-K of Alexander &
Baldwin, Inc. and subsidiaries for the year ended December 31,
2009.
/s/ Deloitte & Touche
LLP
Honolulu,
Hawaii
February
25, 2010