Attached files
| file | filename |
|---|---|
| EX-99.1 - EX-99.1 - HEARTLAND FINANCIAL USA INC | ex991q12021pressrelease.htm |
| 8-K - 8-K - HEARTLAND FINANCIAL USA INC | htlf-20210426.htm |

1st Quarter 2021 Financials
Safe Harbor 2 This release (including any information incorporated herein by reference), and future oral and written statements of HTLF and its management, may contain forward-looking statements within the meaning of Section 27A of the Securities Act of 1933, as amended, and Section 21E of the Securities Exchange Act of 1934, as amended, with respect to the business, financial condition, results of operations, plans, objectives and future performance of the company. Any statements about the company's expectations, beliefs, plans, objectives, assumptions or future events or performance are not historical facts and may be forward-looking. Forward-looking statements may include information about possible or assumed future results of the company's operations or performance. These forward-looking statements are generally identified by the use of words such as ‘‘believe”, “expect’’, “anticipate’’, ‘‘plan”, “intend”, “estimate’’, ‘‘project”, “may”, ‘‘will”, ‘‘would”, ‘‘could”, ‘‘should’’, “view”, “opportunity”, “potential”, or similar or negative expressions of these words or phrases. Although the company may make these statements based on management’s experience, beliefs, expectations, assumptions and best estimate of future events, the ability of the company to predict results or the actual effect or outcomes of plans or strategies is inherently uncertain, and there may be events or factors that management has not anticipated. Therefore, the accuracy and achievement of such forward-looking statements and estimates are subject to a number of risks, many of which are beyond the ability of management to control or predict, that could cause actual results to differ materially from those in its forward-looking statements. These factors, which the company currently believes could have a material effect on its operations and future prospects, are detailed below and in the risk factors in HTLF's reports filed with the Securities and Exchange Commission (“SEC”), including the “Risk Factors” section under Item 1A of Part I of the company’s Annual Report on Form 10-K for the year ended December 31, 2020, include, among others: • COVID-19 Pandemic Risks, including risks related to the ongoing COVID-19 pandemic and measures enacted by the U.S. federal and state governments and adopted by private businesses in response to the COVID-19 pandemic; • Economic and Market Conditions Risks, including risks related to changes in the U.S. economy in general and in the local economies in which HTLF conducts its operations and future civil unrest, natural disasters, terrorist threats or acts of war; • Credit Risks, including risks of increasing credit losses due to deterioration in the financial condition of HTLF's borrowers, changes in asset and collateral values and climate and other borrower industry risks which may impact the provision for credit losses and net charge-offs; • Liquidity and Interest Rate Risks, including the impact of capital market conditions and changes in monetary policy on our borrowings and net interest income; • Operational Risks, including processing, information systems, cybersecurity, vendor, business interruption, and fraud risks; • Strategic and External Risks, including competitive forces impacting our business and strategic acquisition risks; • Legal, Compliance and Reputational Risks, including regulatory and litigation risks; and • Risks of Owning Stock in HTLF, including stock price volatility and dilution as a result of future equity offerings and acquisitions. There can be no assurance that other factors not currently anticipated by HTLF will not materially and adversely affect the company’s business, financial condition and results of operations. In addition, many of these risks and uncertainties are currently amplified by and may continue to be amplified by the COVID- 19 pandemic and the impact of varying governmental responses that affect the company’s customers and the economies where they operate. Additionally, all statements in this release, including forward-looking statements speak only as of the date they are made. The company does not undertake and specifically disclaims any obligation to publicly release the results of any revisions which may be made to or correct or update any forward-looking statement to reflect events or circumstances after the date of such statements or to reflect the occurrence of anticipated or unanticipated events or to otherwise update any statement in light of new information or future events. Further information concerning HTLF and its business, including additional factors that could materially affect the company’s financial results, is included in the company’s filings with the SEC.
3 Corporate Profile
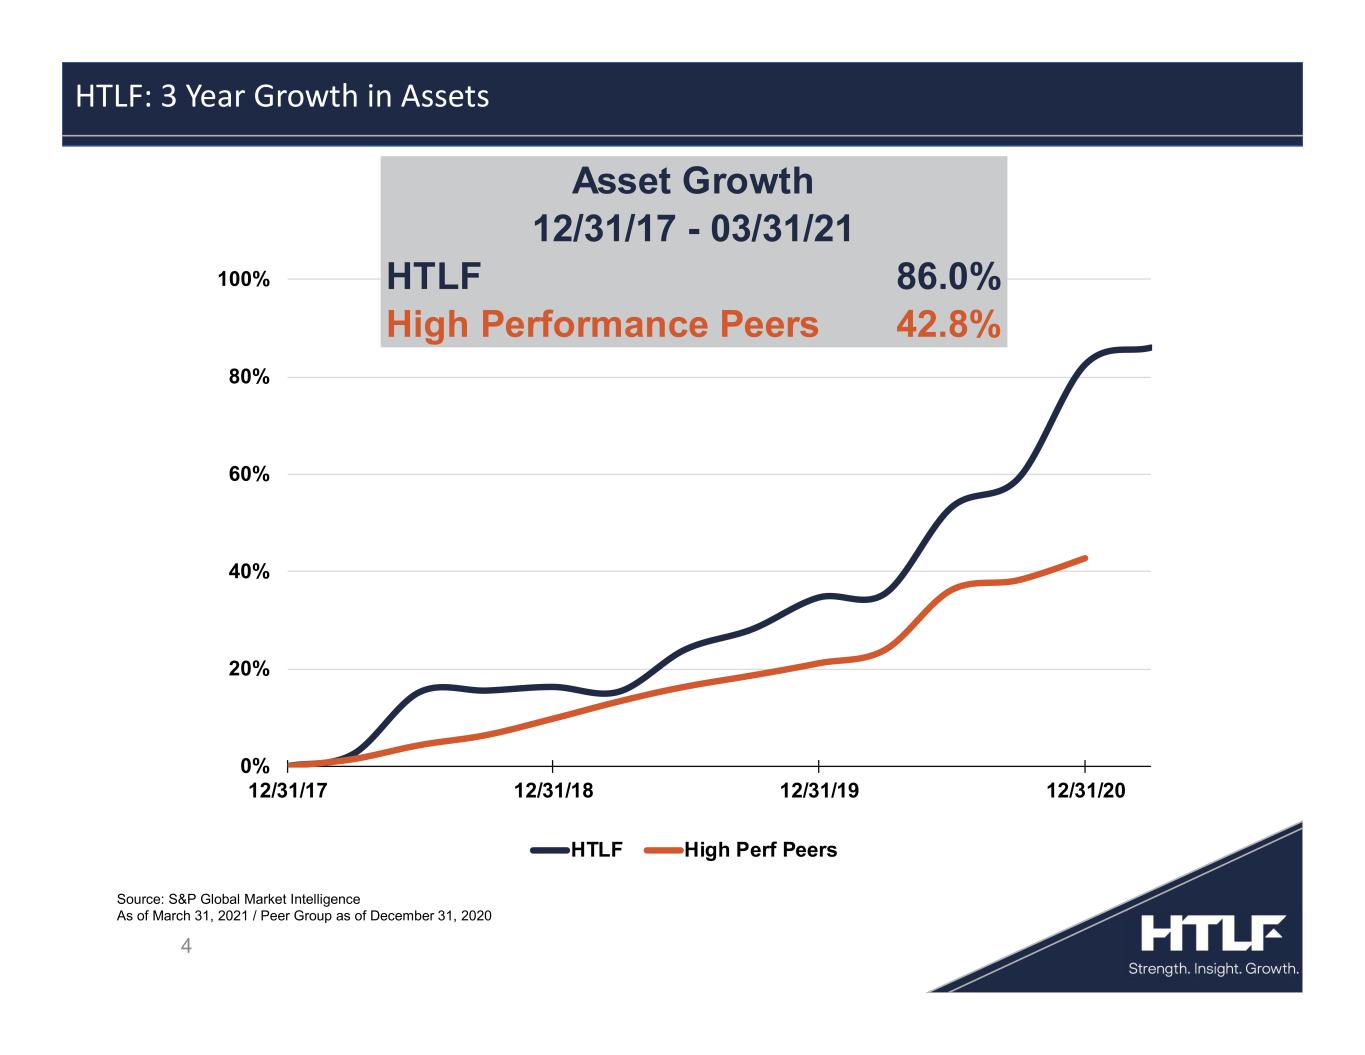
4 HTLF: 3 Year Growth in Assets Source: S&P Global Market Intelligence As of March 31, 2021 / Peer Group as of December 31, 2020 0% 20% 40% 60% 80% 100% 12/31/17 12/31/18 12/31/19 12/31/20 HTLF High Perf Peers HTLF 86.0% High Performance Peers 42.8% 12/31/17 - 03/31/21 Asset Growth
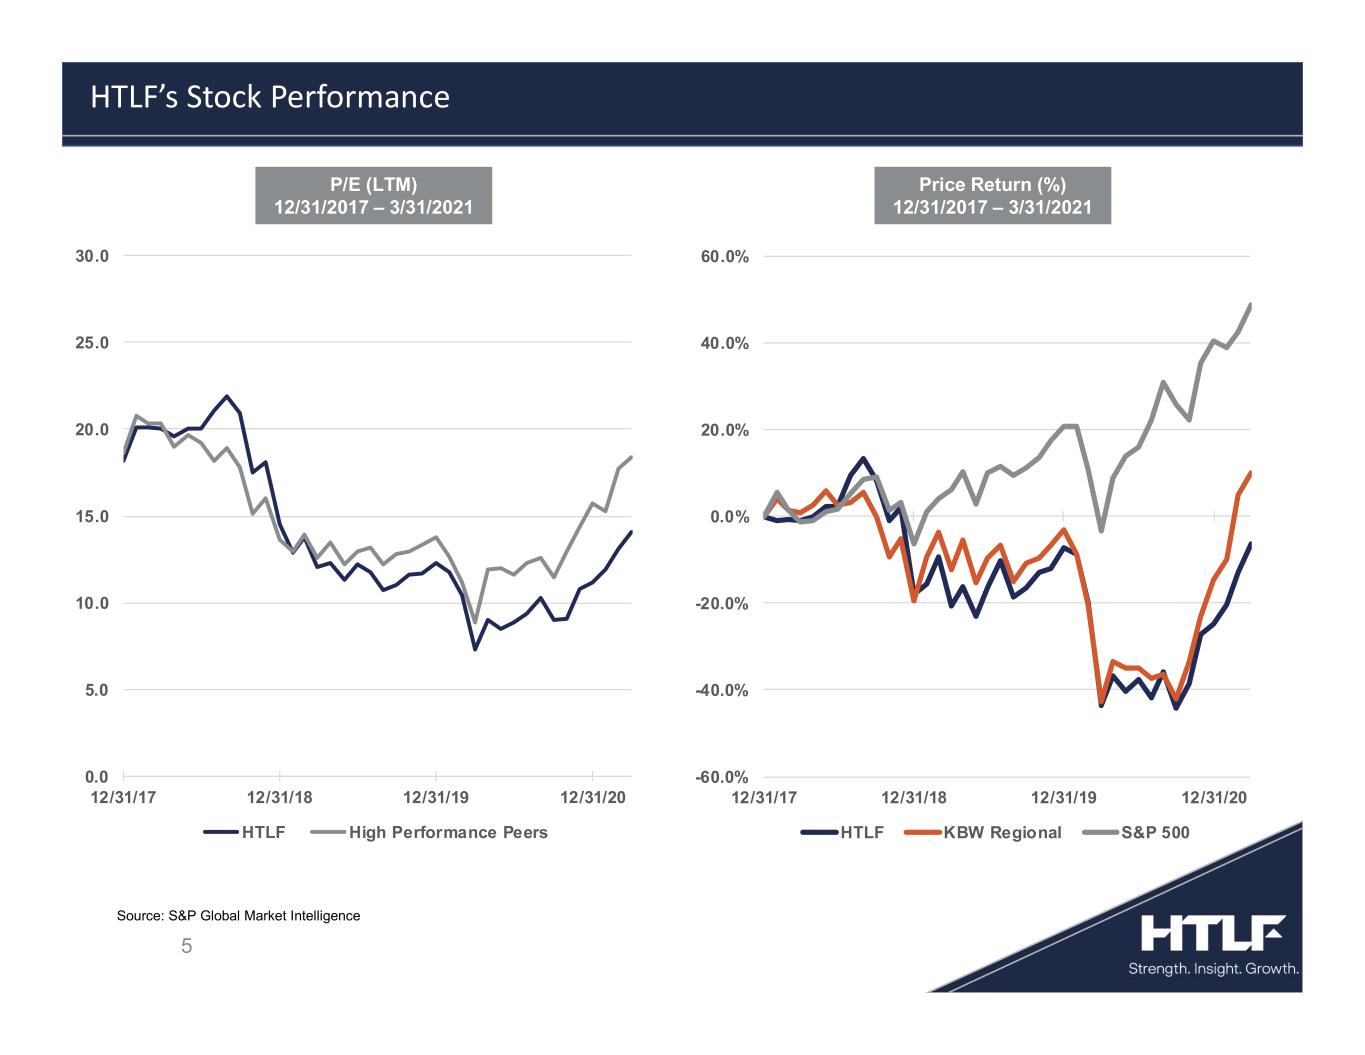
5 HTLF’s Stock Performance Price Return (%) 12/31/2017 – 3/31/2021 Source: S&P Global Market Intelligence P/E (LTM) 12/31/2017 – 3/31/2021 0.0 5.0 10.0 15.0 20.0 25.0 30.0 12/31/17 12/31/18 12/31/19 12/31/20 HTLF High Performance Peers -60.0% -40.0% -20.0% 0.0% 20.0% 40.0% 60.0% 12/31/17 12/31/18 12/31/19 12/31/20 HTLF KBW Regional S&P 500
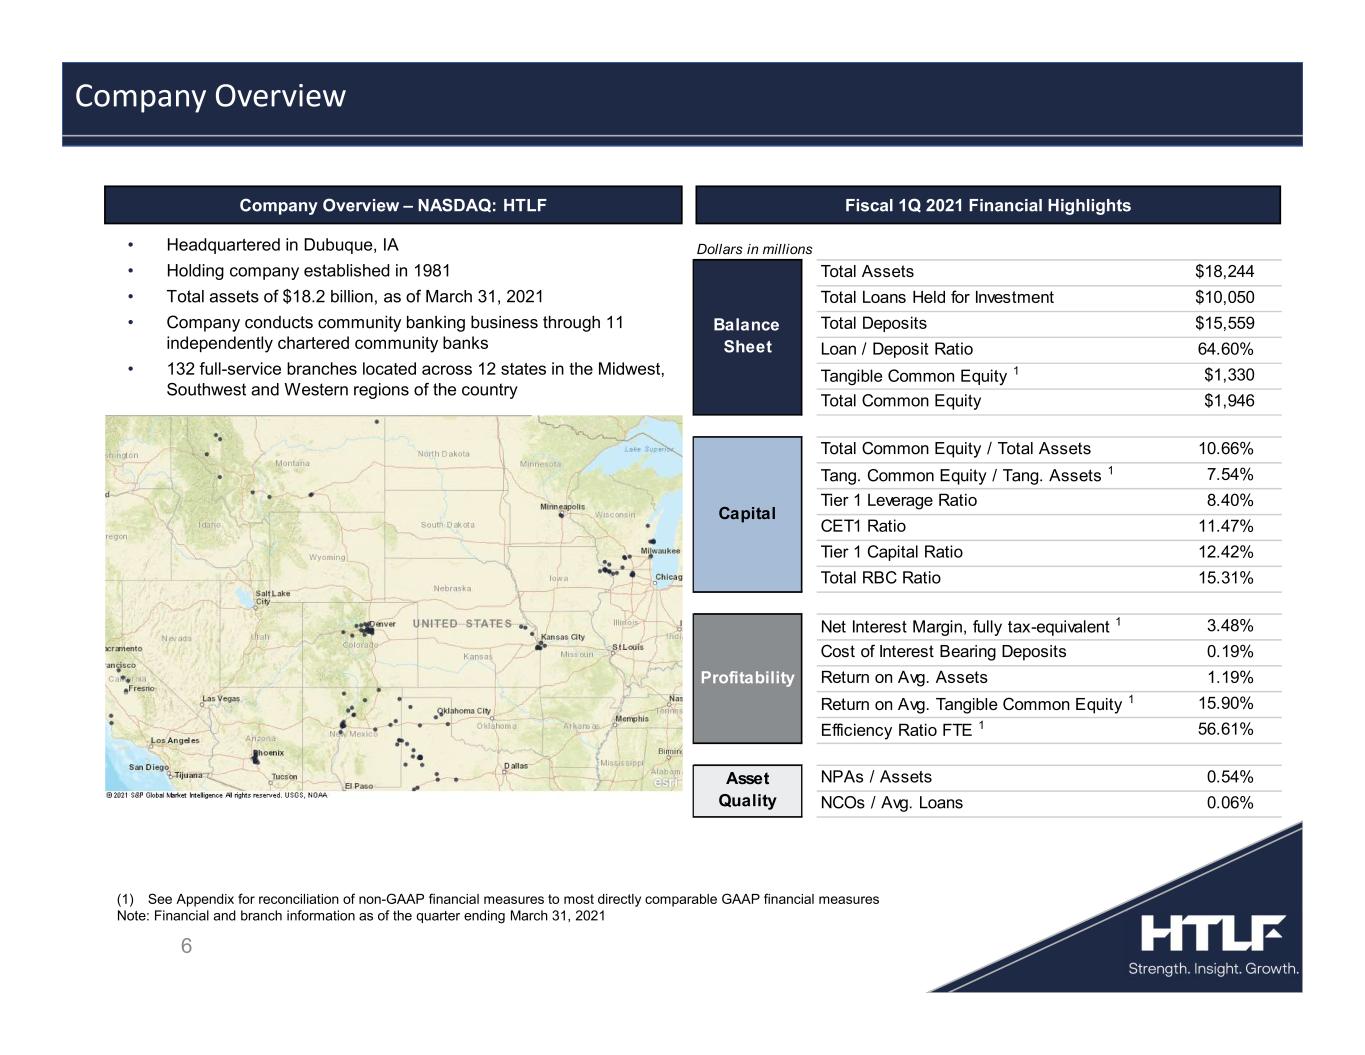
6 Company Overview – NASDAQ: HTLF Fiscal 1Q 2021 Financial Highlights • Headquartered in Dubuque, IA • Holding company established in 1981 • Total assets of $18.2 billion, as of March 31, 2021 • Company conducts community banking business through 11 independently chartered community banks • 132 full-service branches located across 12 states in the Midwest, Southwest and Western regions of the country Company Overview (1) See Appendix for reconciliation of non-GAAP financial measures to most directly comparable GAAP financial measures Note: Financial and branch information as of the quarter ending March 31, 2021 Total Assets $18,244 Total Loans Held for Investment $10,050 Total Deposits $15,559 Loan / Deposit Ratio 64.60% Tangible Common Equity 1 $1,330 Total Common Equity $1,946 Total Common Equity / Total Assets 10.66% Tang. Common Equity / Tang. Assets 1 7.54% Tier 1 Leverage Ratio 8.40% CET1 Ratio 11.47% Tier 1 Capital Ratio 12.42% Total RBC Ratio 15.31% Net Interest Margin, fully tax-equivalent 1 3.48% Cost of Interest Bearing Deposits 0.19% Return on Avg. Assets 1.19% Return on Avg. Tangible Common Equity 1 15.90% Efficiency Ratio FTE 1 56.61% NPAs / Assets 0.54% NCOs / Avg. Loans 0.06% Asset Quality Profitability Capital Balance Sheet Dollars in millions
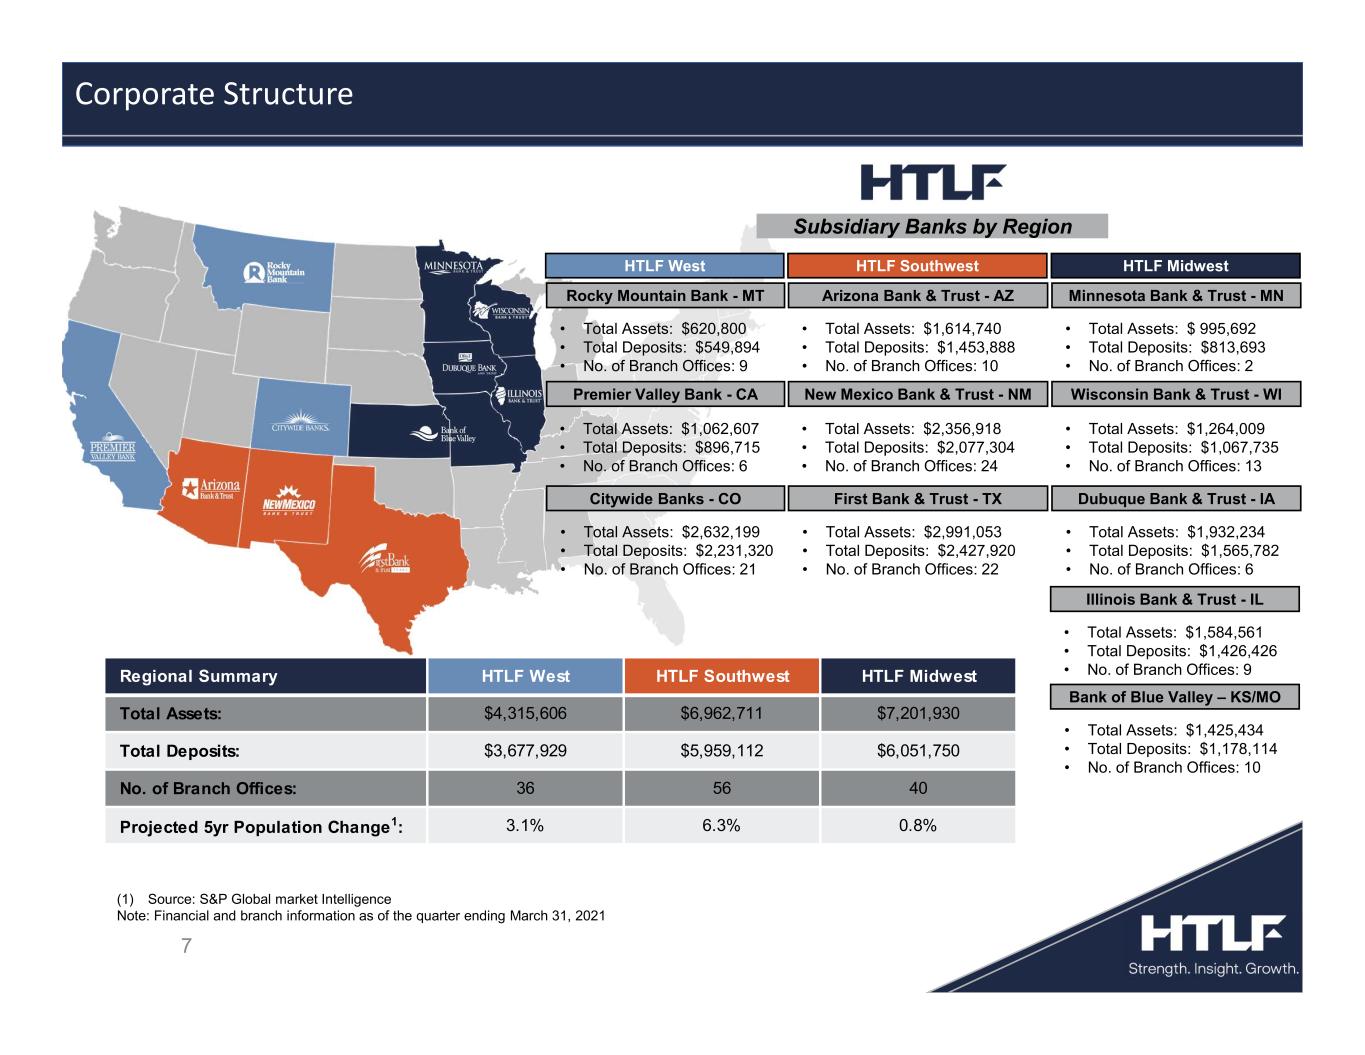
7 Subsidiary Banks by Region Corporate Structure (1) Source: S&P Global market Intelligence Note: Financial and branch information as of the quarter ending March 31, 2021 Bank of Blue Valley – KS/MO Illinois Bank & Trust - IL Minnesota Bank & Trust - MN HTLF Midwest • Total Assets: $1,584,561 • Total Deposits: $1,426,426 • No. of Branch Offices: 9 • Total Assets: $ 995,692 • Total Deposits: $813,693 • No. of Branch Offices: 2 • Total Assets: $1,425,434 • Total Deposits: $1,178,114 • No. of Branch Offices: 10 Citywide Banks - CO Premier Valley Bank - CA Rocky Mountain Bank - MT HTLF West • Total Assets: $1,062,607 • Total Deposits: $896,715 • No. of Branch Offices: 6 • Total Assets: $620,800 • Total Deposits: $549,894 • No. of Branch Offices: 9 • Total Assets: $2,632,199 • Total Deposits: $2,231,320 • No. of Branch Offices: 21 First Bank & Trust - TX New Mexico Bank & Trust - NM Arizona Bank & Trust - AZ HTLF Southwest • Total Assets: $2,356,918 • Total Deposits: $2,077,304 • No. of Branch Offices: 24 • Total Assets: $1,614,740 • Total Deposits: $1,453,888 • No. of Branch Offices: 10 • Total Assets: $2,991,053 • Total Deposits: $2,427,920 • No. of Branch Offices: 22 Dubuque Bank & Trust - IA Wisconsin Bank & Trust - WI • Total Assets: $1,264,009 • Total Deposits: $1,067,735 • No. of Branch Offices: 13 • Total Assets: $1,932,234 • Total Deposits: $1,565,782 • No. of Branch Offices: 6 Regional Summary HTLF West HTLF Southwest HTLF Midwest Total Assets: $4,315,606 $6,962,711 $7,201,930 Total Deposits: $3,677,929 $5,959,112 $6,051,750 No. of Branch Offices: 36 56 40 Projected 5yr Population Change1: 3.1% 6.3% 0.8%
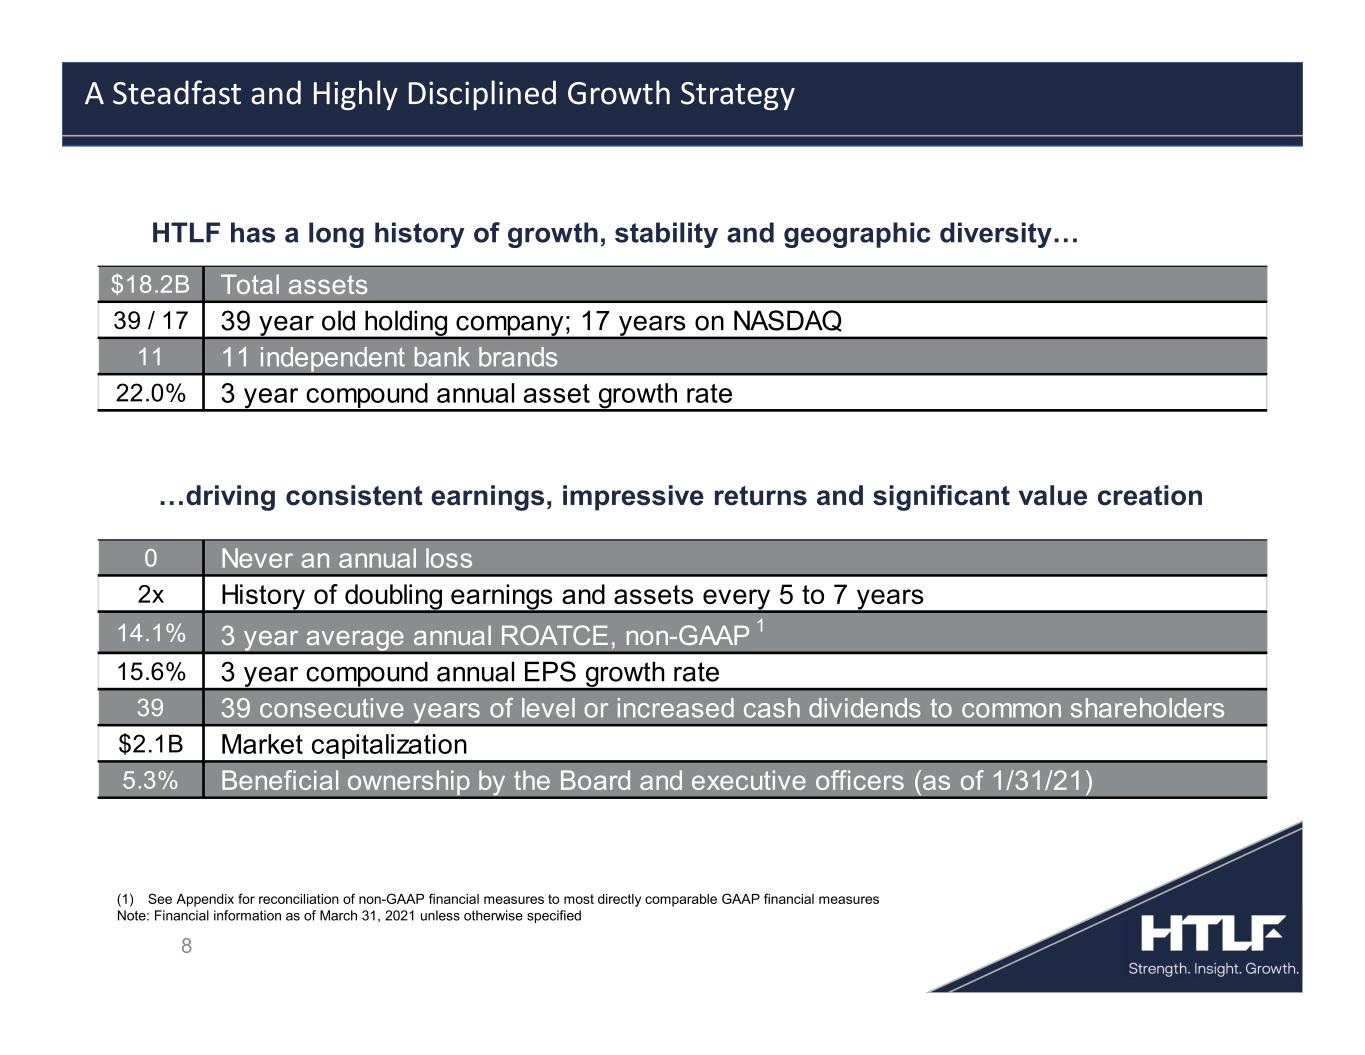
8 …driving consistent earnings, impressive returns and significant value creation HTLF has a long history of growth, stability and geographic diversity… A Steadfast and Highly Disciplined Growth Strategy (1) See Appendix for reconciliation of non-GAAP financial measures to most directly comparable GAAP financial measures Note: Financial information as of March 31, 2021 unless otherwise specified $18.2B Total assets 39 / 17 39 year old holding company; 17 years on NASDAQ 11 11 independent bank brands 22.0% 3 year compound annual asset growth rate 0 Never an annual loss 2x History of doubling earnings and assets every 5 to 7 years 14.1% 3 year average annual ROATCE, non-GAAP 1 15.6% 3 year compound annual EPS growth rate 39 39 consecutive years of level or increased cash dividends to common shareholders $2.1B Market capitalization 5.3% Beneficial ownership by the Board and executive officers (as of 1/31/21)
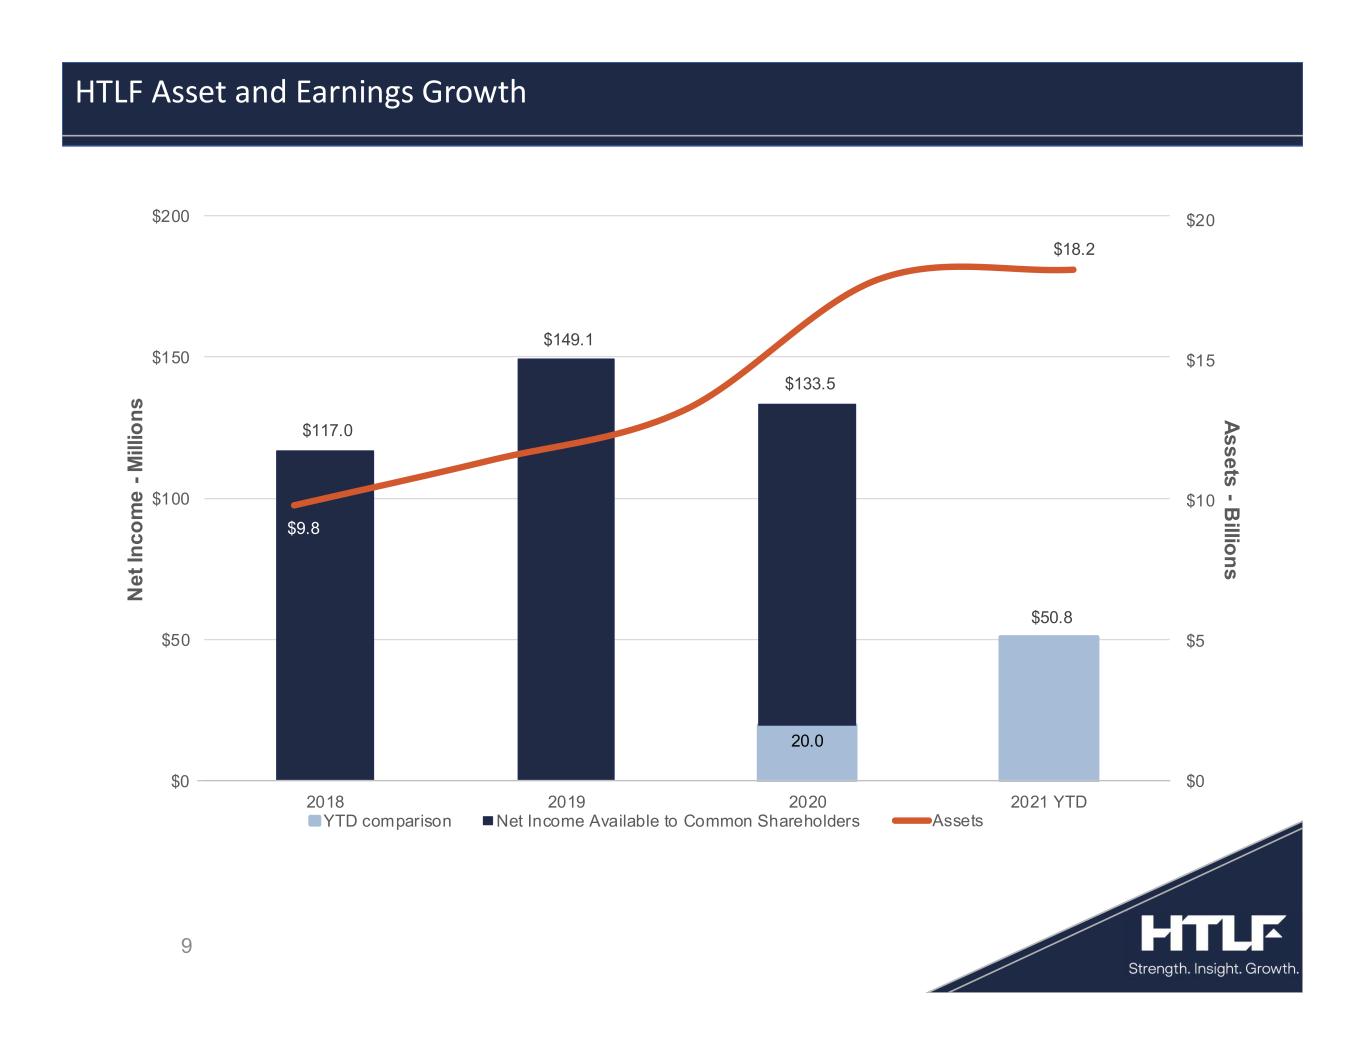
9 HTLF Asset and Earnings Growth 20.0 $117.0 $149.1 $133.5 $50.8 $0 $50 $100 $150 $200 2018 2019 2020 2021 YTD N e t In c o m e - M ill io n s YTD comparison Net Income Available to Common Shareholders $9.8 $18.2 $0 $5 $10 $15 $20 A s s e ts - B illio n s Assets
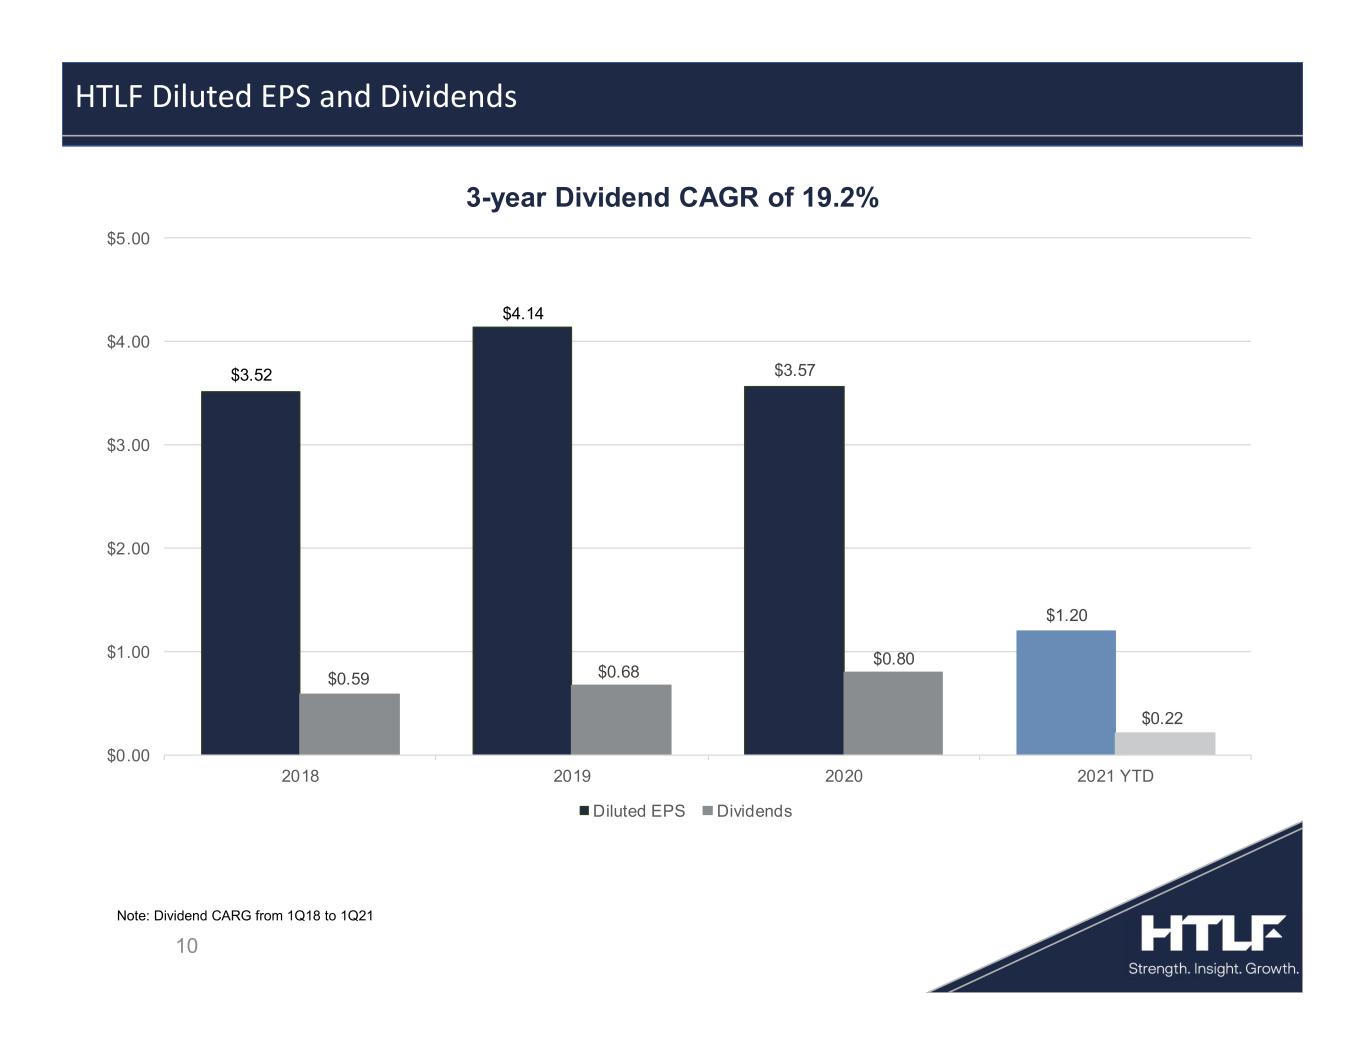
10 HTLF Diluted EPS and Dividends 3-year Dividend CAGR of 19.2% Note: Dividend CARG from 1Q18 to 1Q21 $3.52 $4.14 $3.57 $1.20 $0.59 $0.68 $0.80 $0.22 2018 2019 2020 2021 YTD $0.00 $1.00 $2.00 $3.00 $4.00 $5.00 Diluted EPS Dividends
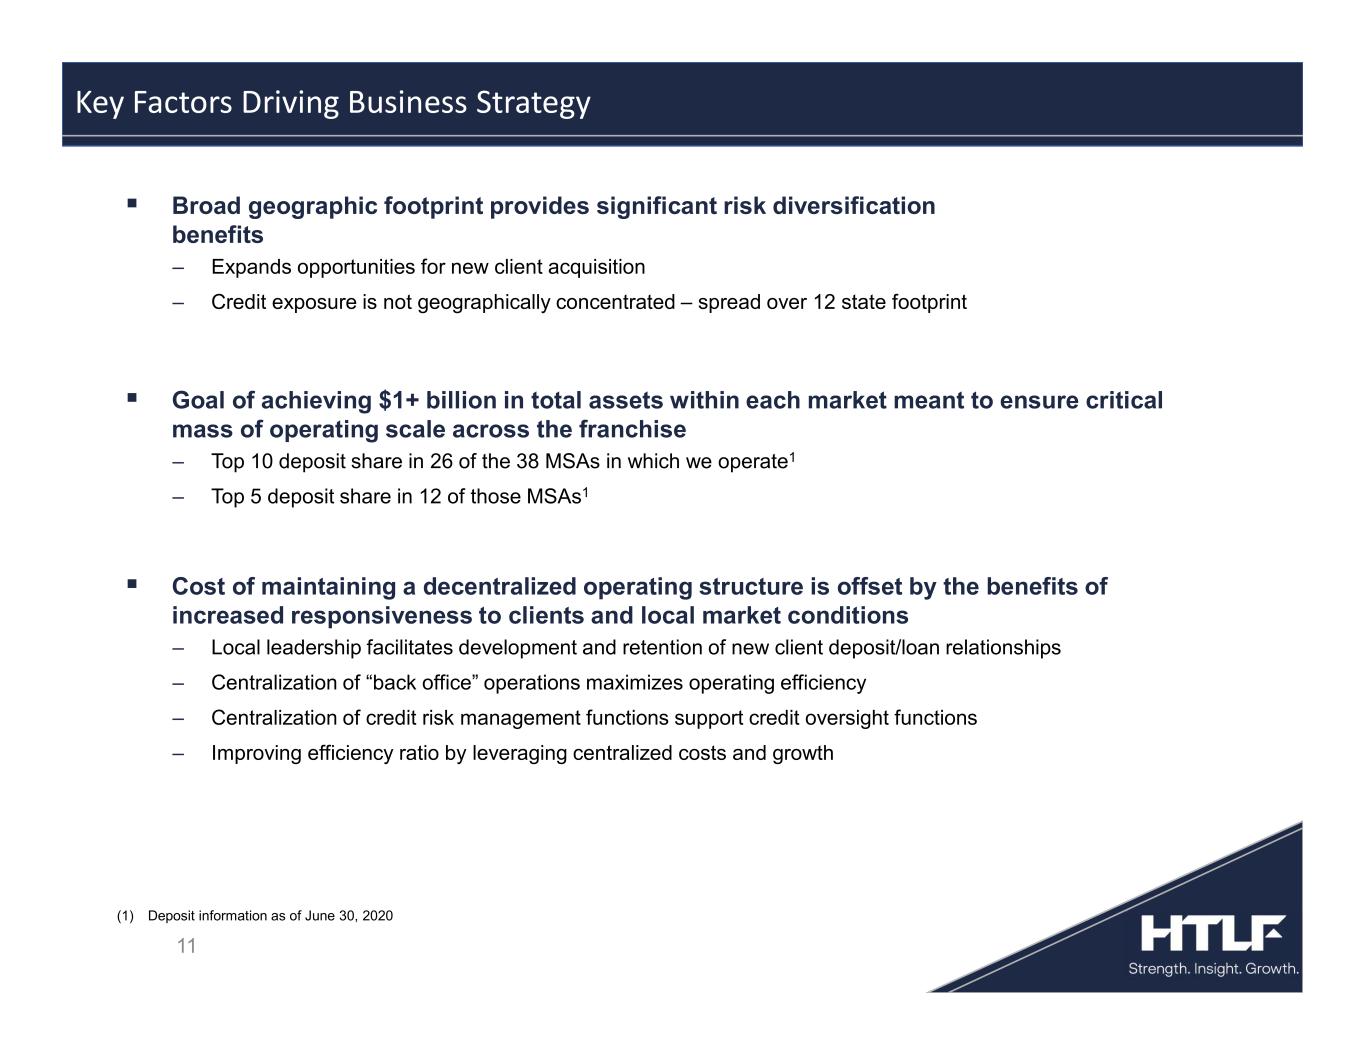
Broad geographic footprint provides significant risk diversification benefits ‒ Expands opportunities for new client acquisition ‒ Credit exposure is not geographically concentrated – spread over 12 state footprint Goal of achieving $1+ billion in total assets within each market meant to ensure critical mass of operating scale across the franchise ‒ Top 10 deposit share in 26 of the 38 MSAs in which we operate1 ‒ Top 5 deposit share in 12 of those MSAs1 Cost of maintaining a decentralized operating structure is offset by the benefits of increased responsiveness to clients and local market conditions ‒ Local leadership facilitates development and retention of new client deposit/loan relationships ‒ Centralization of “back office” operations maximizes operating efficiency ‒ Centralization of credit risk management functions support credit oversight functions ‒ Improving efficiency ratio by leveraging centralized costs and growth 11 Key Factors Driving Business Strategy (1) Deposit information as of June 30, 2020
12 Covid-19 Pandemic Summary
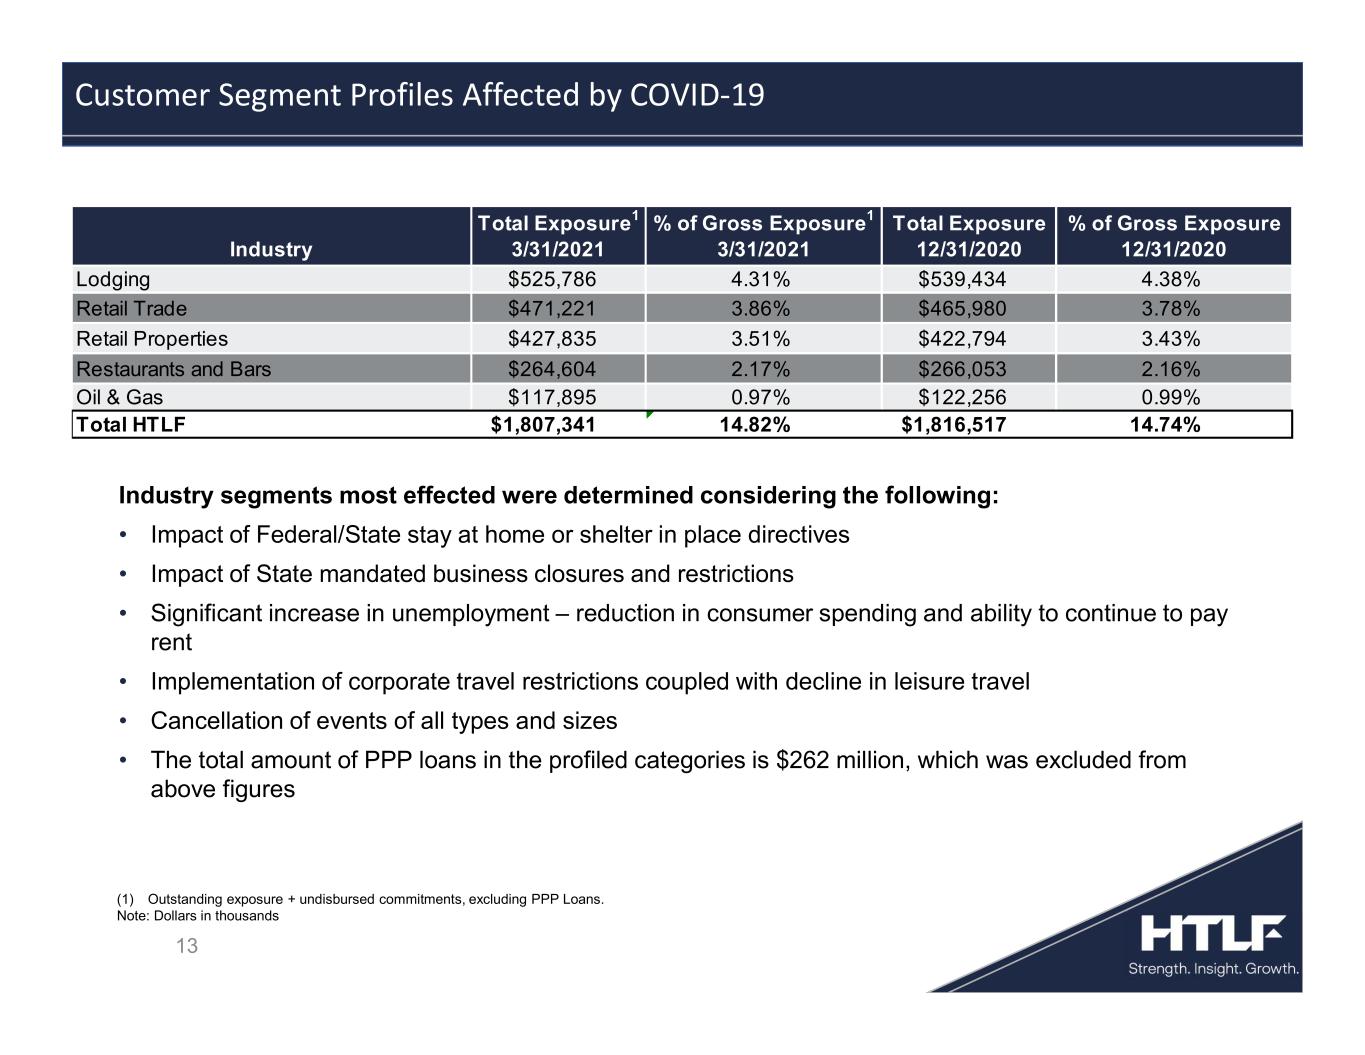
13 Industry segments most effected were determined considering the following: • Impact of Federal/State stay at home or shelter in place directives • Impact of State mandated business closures and restrictions • Significant increase in unemployment – reduction in consumer spending and ability to continue to pay rent • Implementation of corporate travel restrictions coupled with decline in leisure travel • Cancellation of events of all types and sizes • The total amount of PPP loans in the profiled categories is $262 million, which was excluded from above figures Customer Segment Profiles Affected by COVID-19 (1) Outstanding exposure + undisbursed commitments, excluding PPP Loans. Note: Dollars in thousands Total Exposure1 % of Gross Exposure1 Total Exposure % of Gross Exposure Industry 3/31/2021 3/31/2021 12/31/2020 12/31/2020 Lodging $525,786 4.31% $539,434 4.38% Retail Trade $471,221 3.86% $465,980 3.78% Retail Properties $427,835 3.51% $422,794 3.43% Restaurants and Bars $264,604 2.17% $266,053 2.16% Oil & Gas $117,895 0.97% $122,256 0.99% Total HTLF $1,807,341 14.82% $1,816,517 14.74%
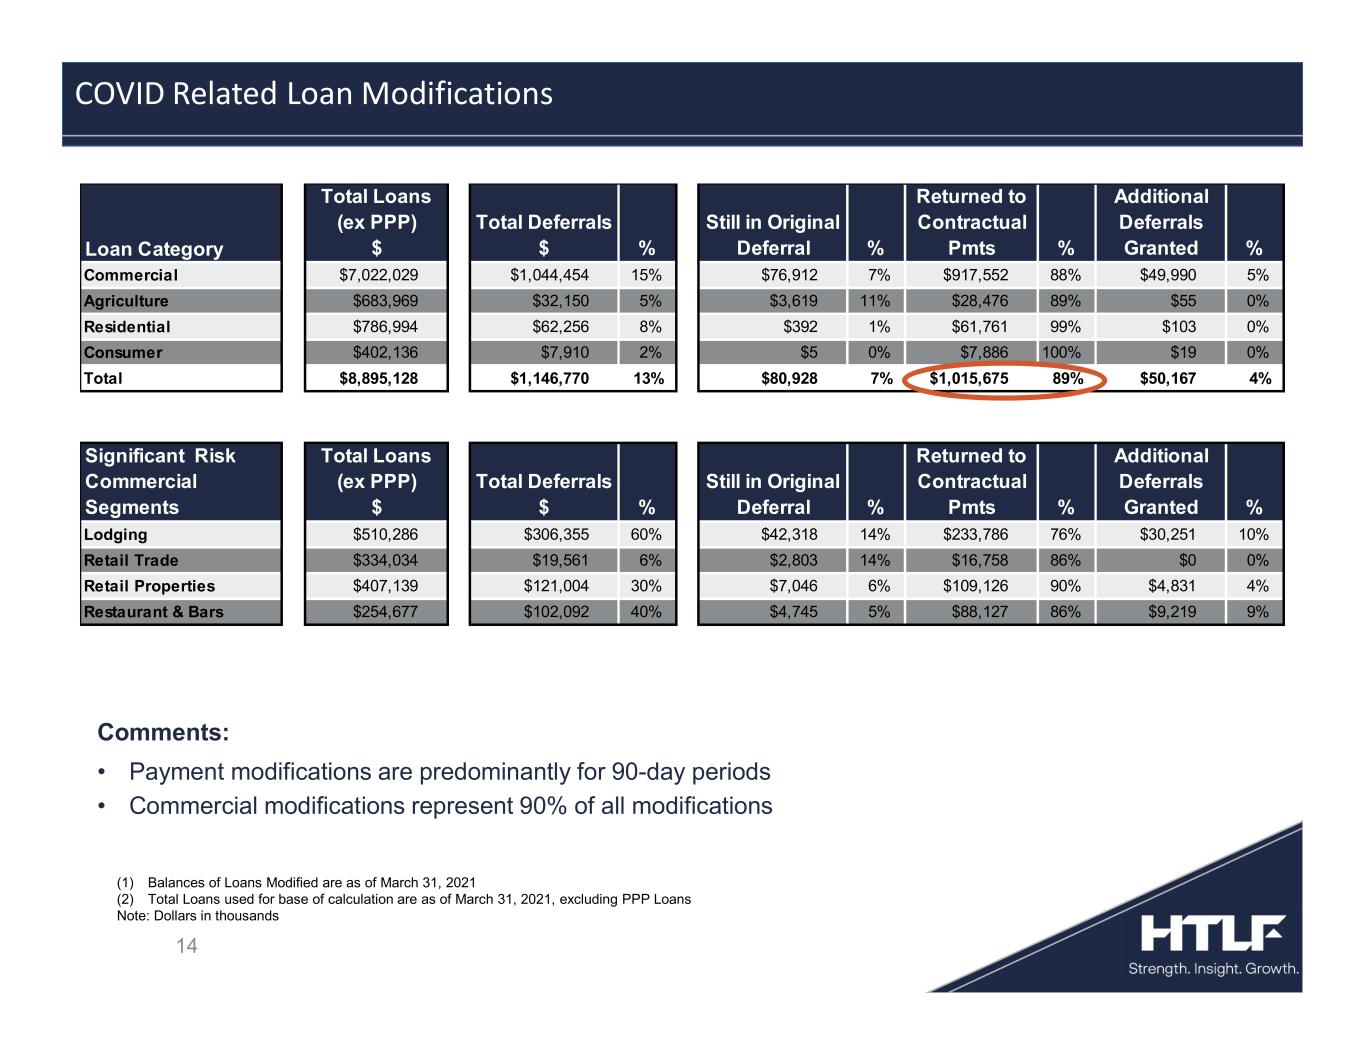
14 Comments: • Payment modifications are predominantly for 90-day periods • Commercial modifications represent 90% of all modifications COVID Related Loan Modifications (1) Balances of Loans Modified are as of March 31, 2021 (2) Total Loans used for base of calculation are as of March 31, 2021, excluding PPP Loans Note: Dollars in thousands Loan Category Total Loans (ex PPP) $ Total Deferrals $ % Still in Original Deferral % Returned to Contractual Pmts % Additional Deferrals Granted % Commercial $7,022,029 $1,044,454 15% $76,912 7% $917,552 88% $49,990 5% Agriculture $683,969 $32,150 5% $3,619 11% $28,476 89% $55 0% Residential $786,994 $62,256 8% $392 1% $61,761 99% $103 0% Consumer $402,136 $7,910 2% $5 0% $7,886 100% $19 0% Total $8,895,128 $1,146,770 13% $80,928 7% $1,015,675 89% $50,167 4% Significant Risk Commercial Segments Total Loans (ex PPP) $ Total Deferrals $ % Still in Original Deferral % Returned to Contractual Pmts % Additional Deferrals Granted % Lodging $510,286 $306,355 60% $42,318 14% $233,786 76% $30,251 10% Retail Trade $334,034 $19,561 6% $2,803 14% $16,758 86% $0 0% Retail Properties $407,139 $121,004 30% $7,046 6% $109,126 90% $4,831 4% Restaurant & Bars $254,677 $102,092 40% $4,745 5% $88,127 86% $9,219 9%
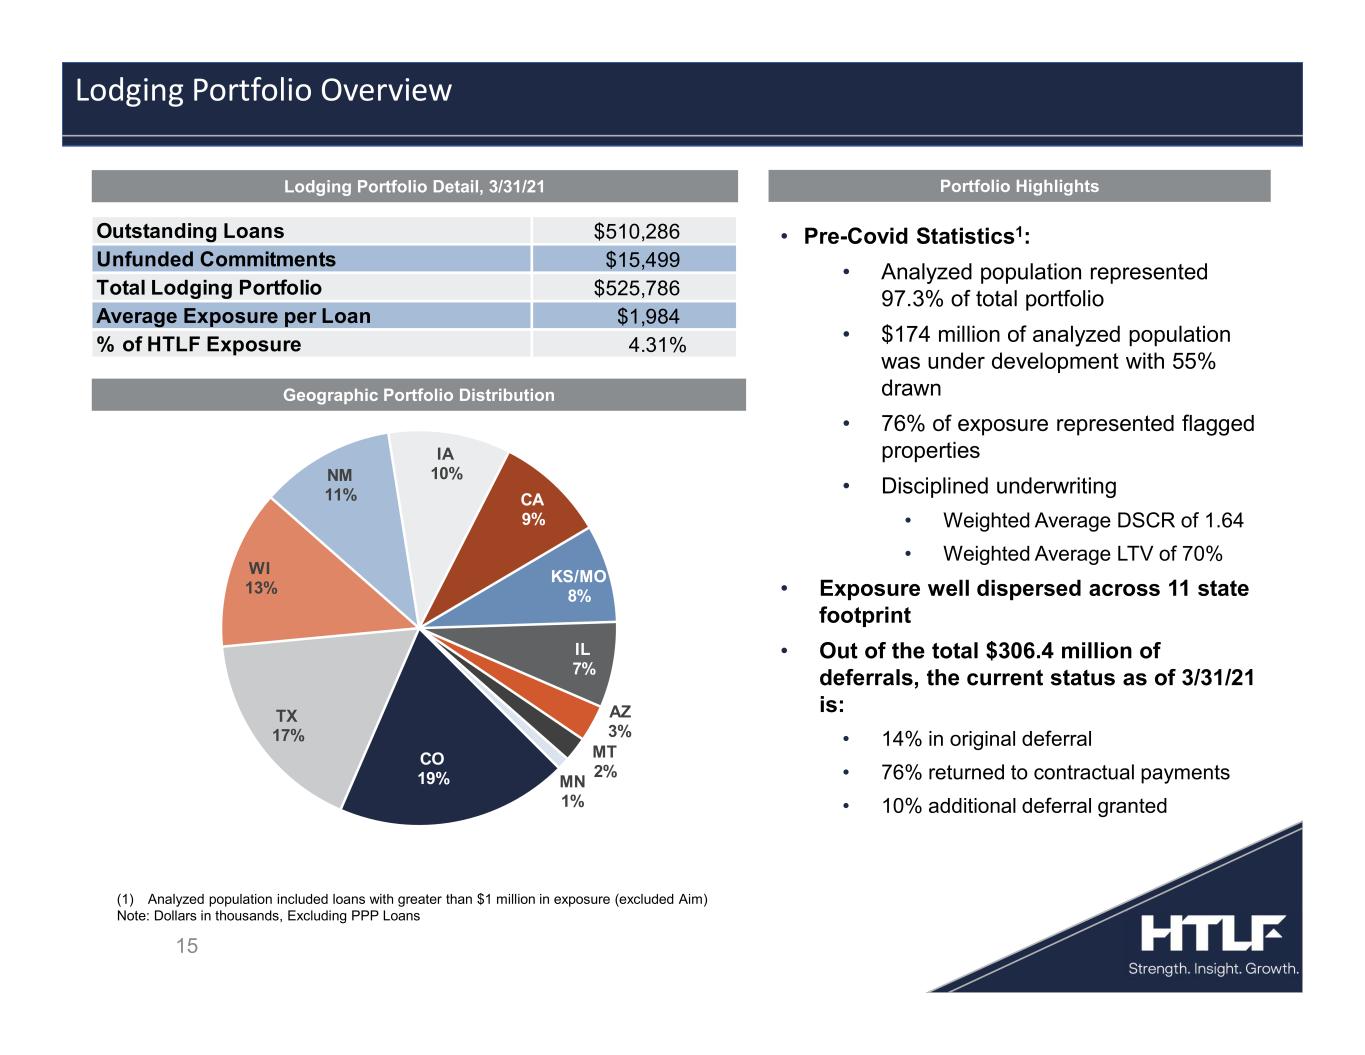
• Pre-Covid Statistics1: • Analyzed population represented 97.3% of total portfolio • $174 million of analyzed population was under development with 55% drawn • 76% of exposure represented flagged properties • Disciplined underwriting • Weighted Average DSCR of 1.64 • Weighted Average LTV of 70% • Exposure well dispersed across 11 state footprint • Out of the total $306.4 million of deferrals, the current status as of 3/31/21 is: • 14% in original deferral • 76% returned to contractual payments • 10% additional deferral granted Portfolio Highlights Geographic Portfolio Distribution Lodging Portfolio Detail, 3/31/21 15 Lodging Portfolio Overview (1) Analyzed population included loans with greater than $1 million in exposure (excluded Aim) Note: Dollars in thousands, Excluding PPP Loans Outstanding Loans $510,286 Unfunded Commitments $15,499 Total Lodging Portfolio $525,786 Average Exposure per Loan $1,984 % of HTLF Exposure 4.31% CO 19% TX 17% WI 13% NM 11% IA 10% CA 9% KS/MO 8% IL 7% AZ 3% MT 2% MN 1%
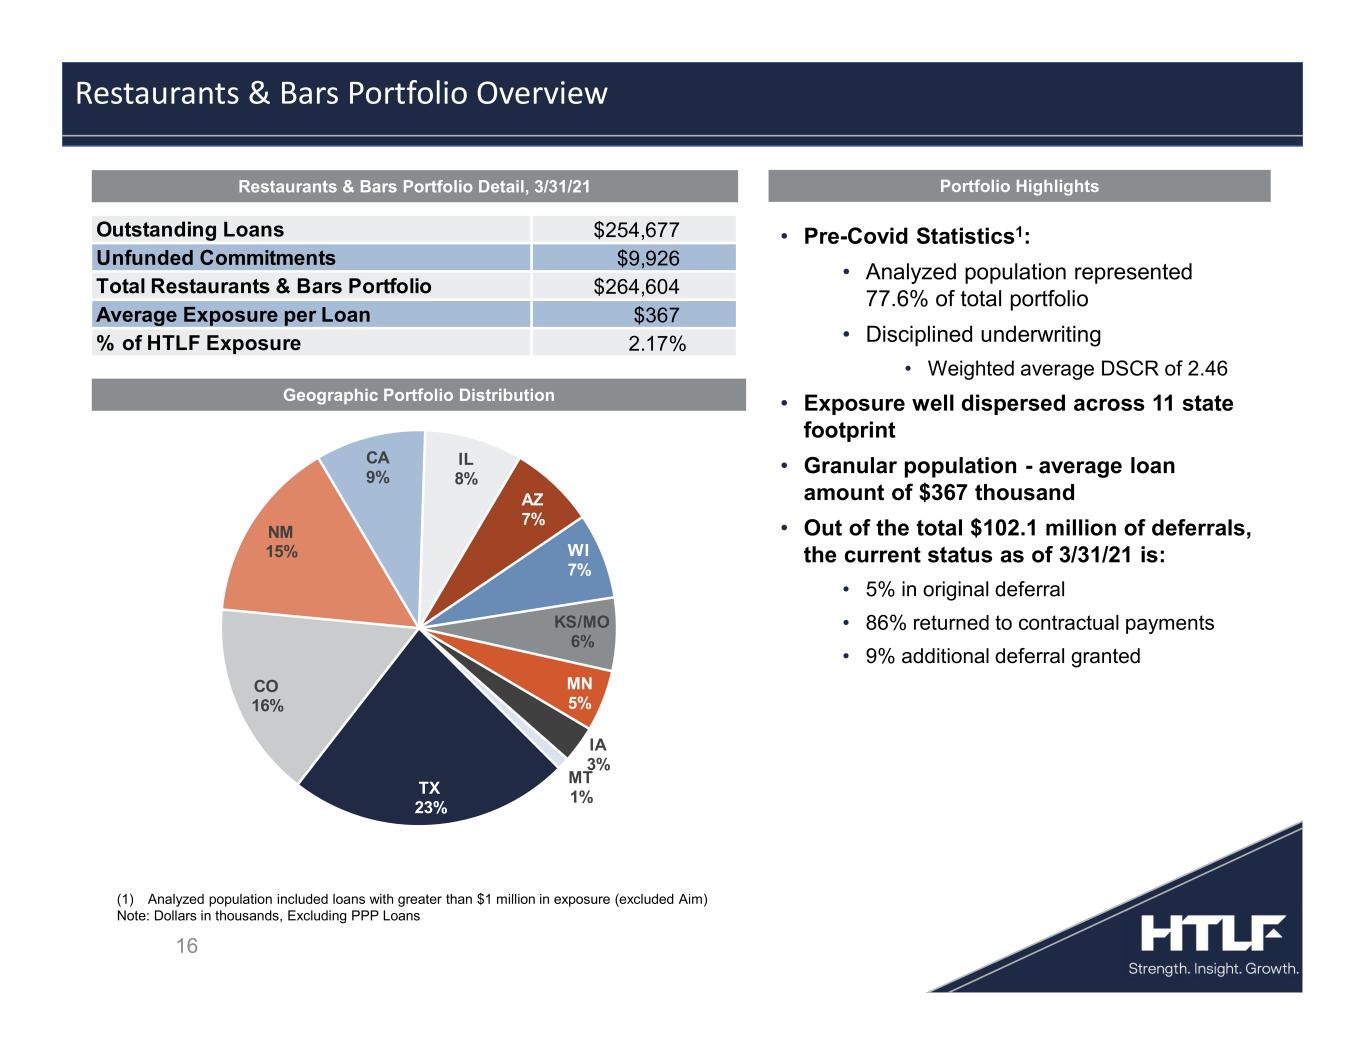
16 Restaurants & Bars Portfolio Overview (1) Analyzed population included loans with greater than $1 million in exposure (excluded Aim) Note: Dollars in thousands, Excluding PPP Loans Outstanding Loans $254,677 Unfunded Commitments $9,926 Total Restaurants & Bars Portfolio $264,604 Average Exposure per Loan $367 % of HTLF Exposure 2.17% TX 23% CO 16% NM 15% CA 9% IL 8% AZ 7% WI 7% KS/MO 6% MN 5% IA 3% MT 1% Portfolio HighlightsRestaurants & Bars Portfolio Detail, 3/31/21 • Pre-Covid Statistics1: • Analyzed population represented 77.6% of total portfolio • Disciplined underwriting • Weighted average DSCR of 2.46 • Exposure well dispersed across 11 state footprint • Granular population - average loan amount of $367 thousand • Out of the total $102.1 million of deferrals, the current status as of 3/31/21 is: • 5% in original deferral • 86% returned to contractual payments • 9% additional deferral granted Geographic Portfolio Distribution
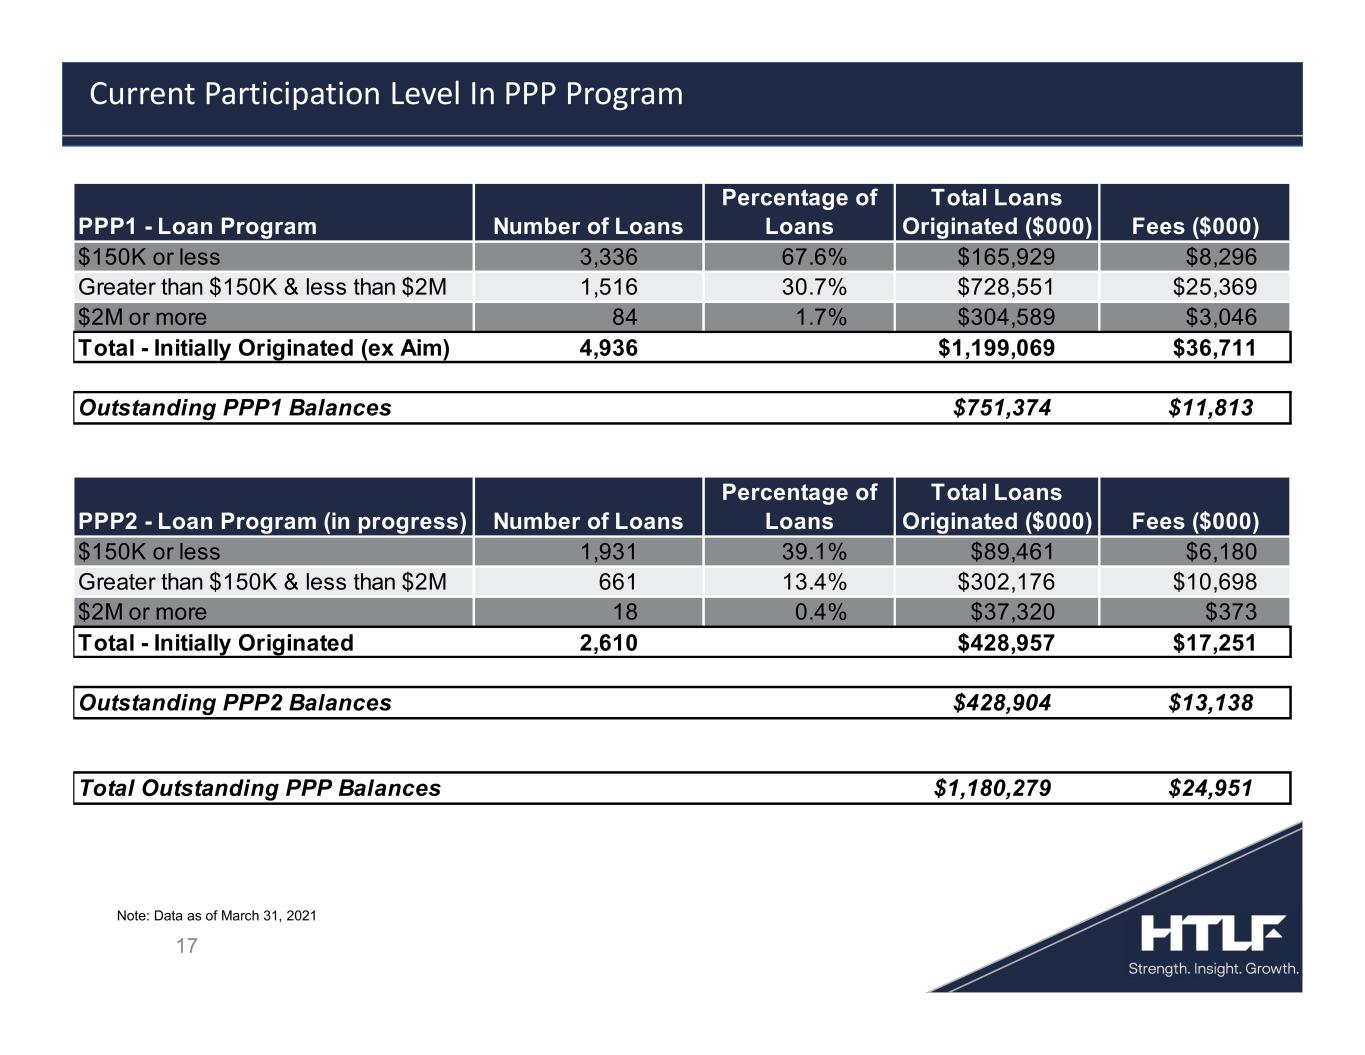
17 Current Participation Level In PPP Program Note: Data as of March 31, 2021 PPP1 - Loan Program Number of Loans Percentage of Loans Total Loans Originated ($000) Fees ($000) $150K or less 3,336 67.6% $165,929 $8,296 Greater than $150K & less than $2M 1,516 30.7% $728,551 $25,369 $2M or more 84 1.7% $304,589 $3,046 Total - Initially Originated (ex Aim) 4,936 $1,199,069 $36,711 $751,374 $11,813 PPP2 - Loan Program (in progress) Number of Loans Percentage of Loans Total Loans Originated ($000) Fees ($000) $150K or less 1,931 39.1% $89,461 $6,180 Greater than $150K & less than $2M 661 13.4% $302,176 $10,698 $2M or more 18 0.4% $37,320 $373 Total - Initially Originated 2,610 $428,957 $17,251 $428,904 $13,138 $1,180,279 $24,951 Outstanding PPP1 Balances Outstanding PPP2 Balances Total Outstanding PPP Balances
18 Financial Summary
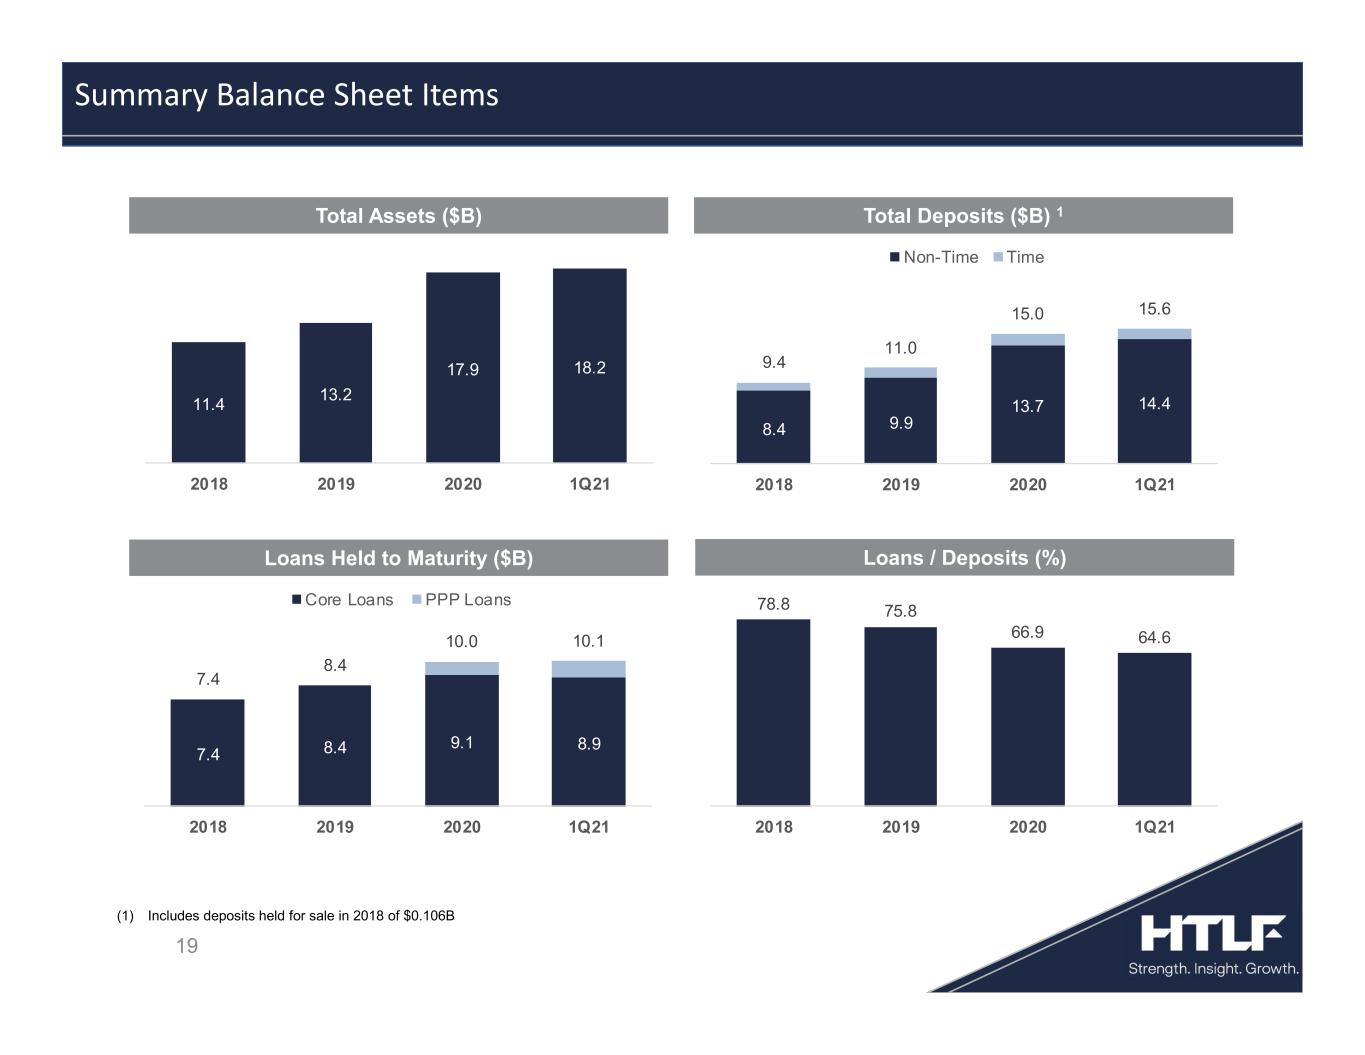
19 Total Assets ($B) Total Deposits ($B) 1 Loans Held to Maturity ($B) Loans / Deposits (%) Summary Balance Sheet Items (1) Includes deposits held for sale in 2018 of $0.106B 11.4 13.2 17.9 18.2 2018 2019 2020 1Q21 8.4 9.9 13.7 14.4 9.4 11.0 15.0 15.6 2018 2019 2020 1Q21 Non-Time Time 78.8 75.8 66.9 64.6 2018 2019 2020 1Q21 7.4 8.4 9.1 8.9 7.4 8.4 10.0 10.1 2018 2019 2020 1Q21 Core Loans PPP Loans
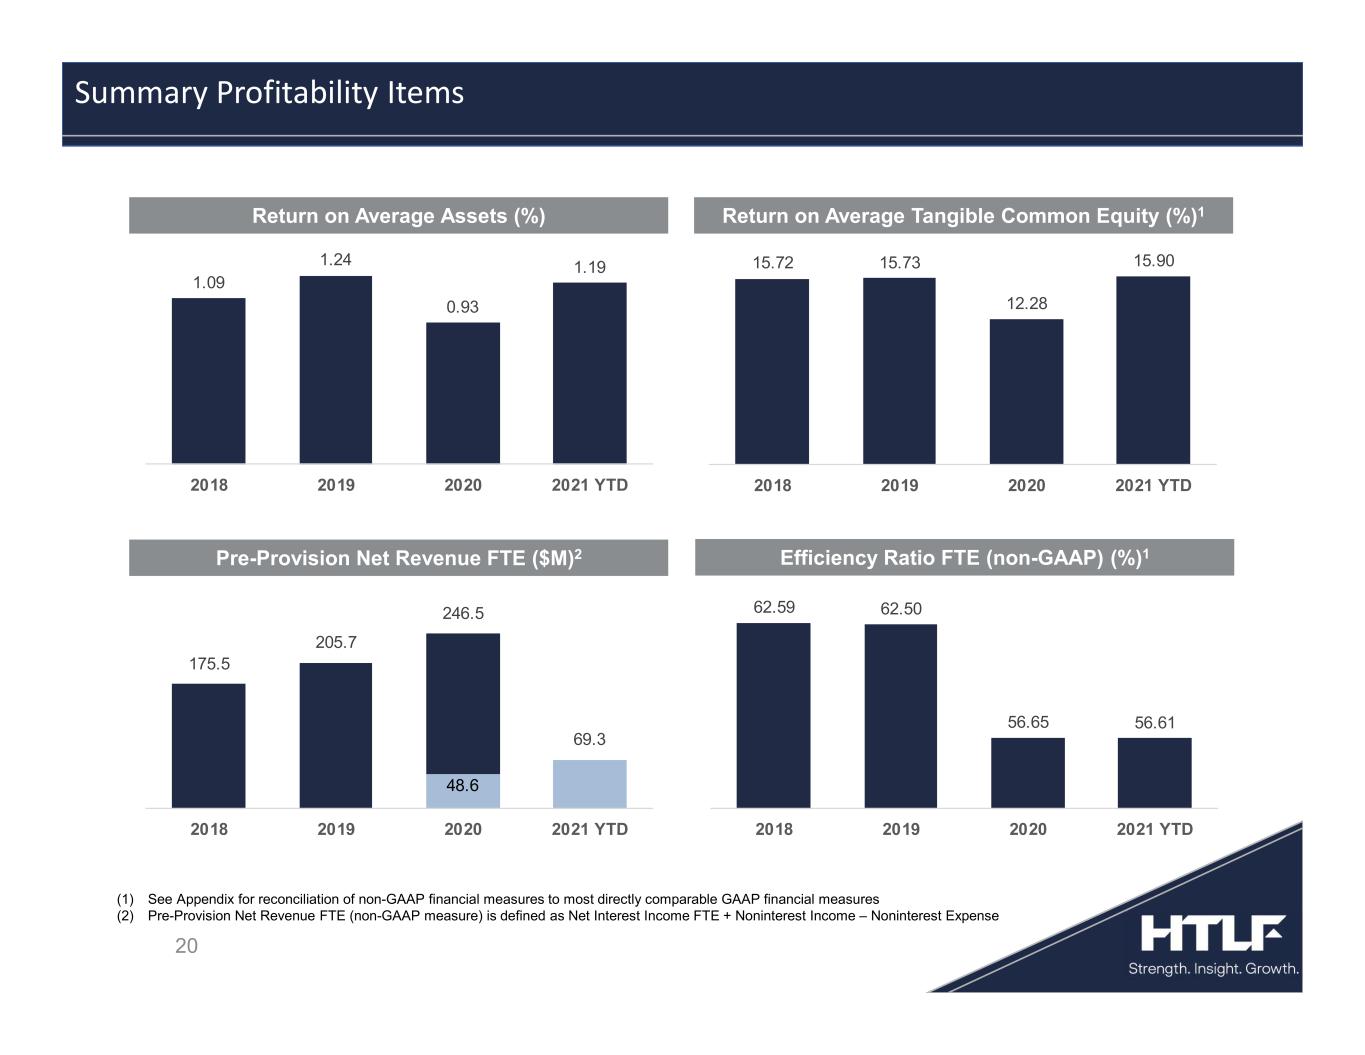
20 Summary Profitability Items (1) See Appendix for reconciliation of non-GAAP financial measures to most directly comparable GAAP financial measures (2) Pre-Provision Net Revenue FTE (non-GAAP measure) is defined as Net Interest Income FTE + Noninterest Income – Noninterest Expense 1.09 1.24 0.93 1.19 2018 2019 2020 2021 YTD 15.72 15.73 12.28 15.90 2018 2019 2020 2021 YTD 62.59 62.50 56.65 56.61 2018 2019 2020 2021 YTD 48.6 175.5 205.7 246.5 69.3 2018 2019 2020 2021 YTD Return on Average Assets (%) Return on Average Tangible Common Equity (%)1 Pre-Provision Net Revenue FTE ($M)2 Efficiency Ratio FTE (non-GAAP) (%)1
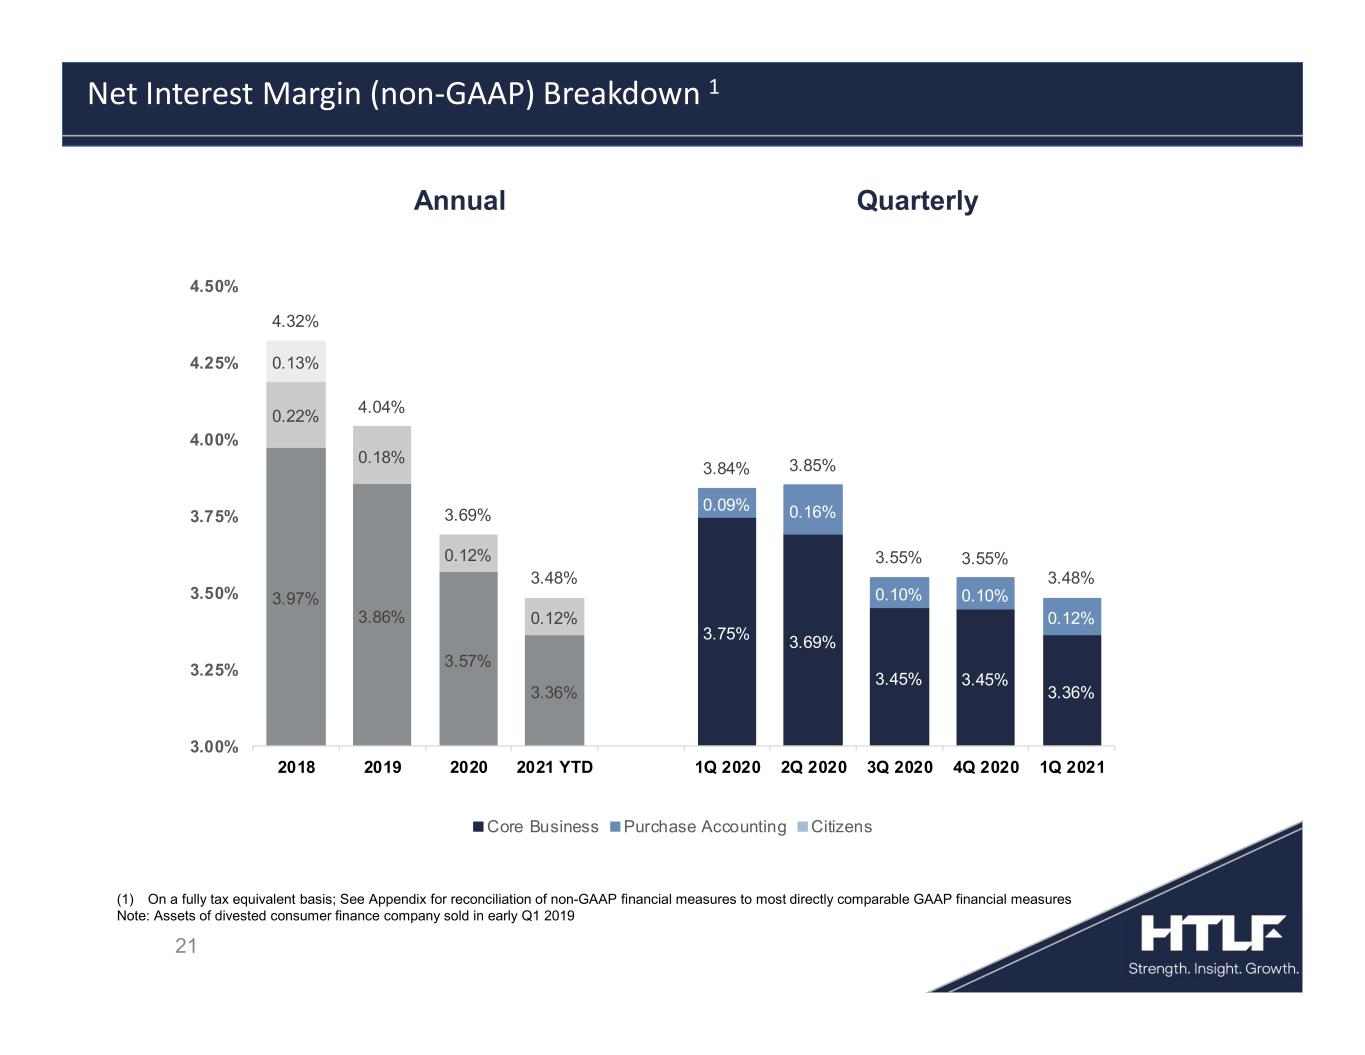
21 Net Interest Margin (non-GAAP) Breakdown 1 QuarterlyAnnual (1) On a fully tax equivalent basis; See Appendix for reconciliation of non-GAAP financial measures to most directly comparable GAAP financial measures Note: Assets of divested consumer finance company sold in early Q1 2019 3.97% 3.86% 3.57% 3.36% 0.22% 0.18% 0.12% 0.12% 0.13% 3.75% 3.69% 3.45% 3.45% 3.36% 0.09% 0.16% 0.10% 0.10% 0.12% 4.32% 4.04% 3.69% 3.48% 3.84% 3.85% 3.55% 3.55% 3.48% 3.00% 3.25% 3.50% 3.75% 4.00% 4.25% 4.50% 2018 2019 2020 2021 YTD 1Q 2020 2Q 2020 3Q 2020 4Q 2020 1Q 2021 Core Business Purchase Accounting Citizens
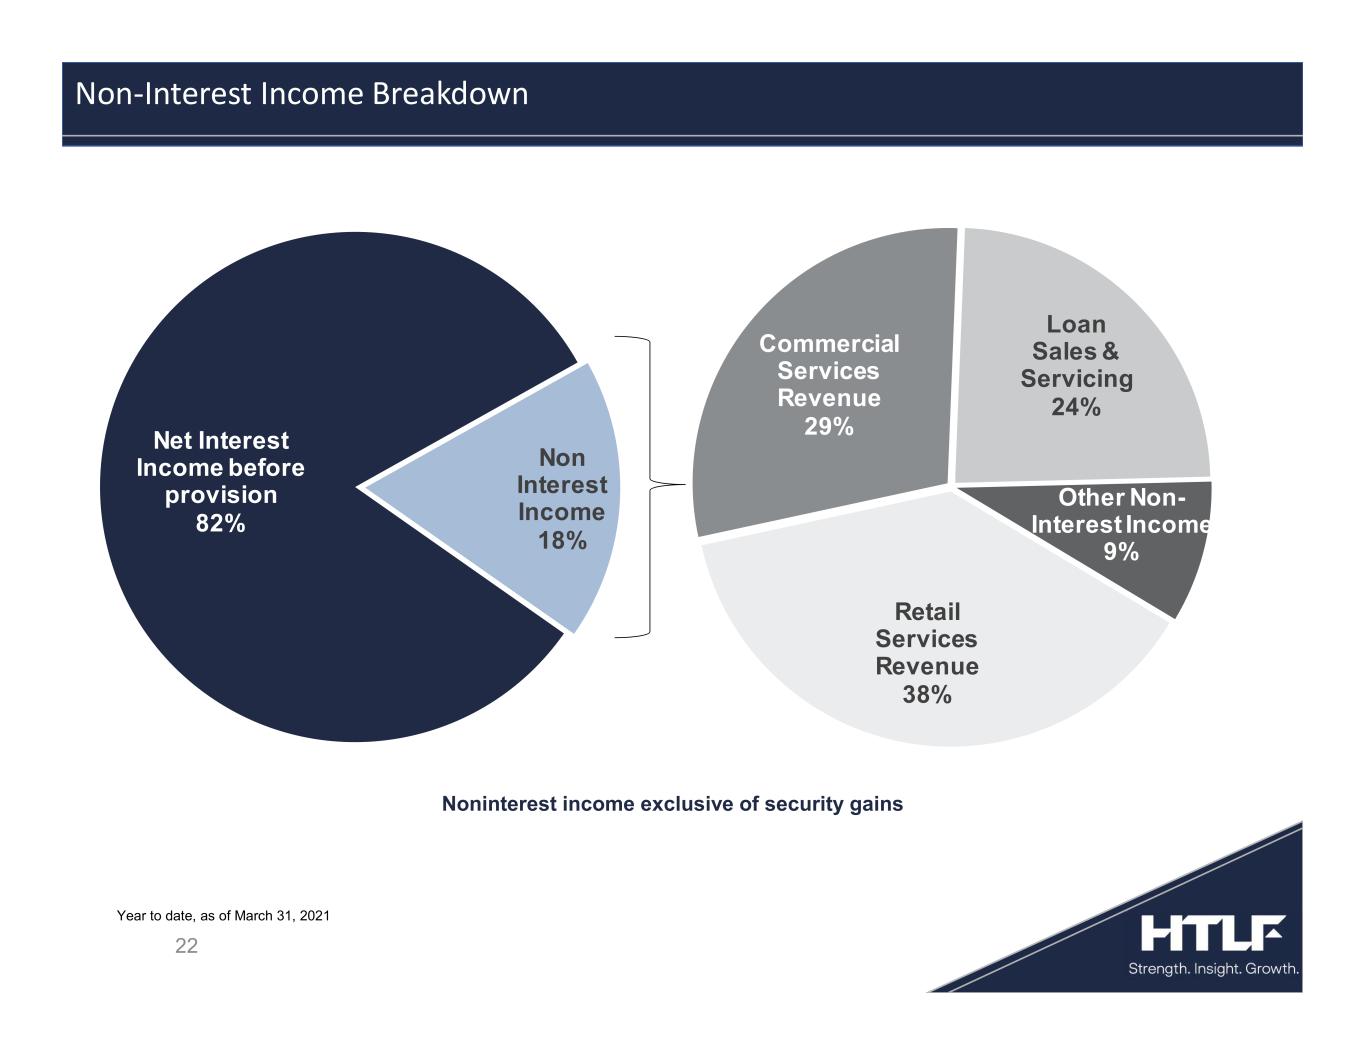
22 Noninterest income exclusive of security gains Non-Interest Income Breakdown Year to date, as of March 31, 2021 Net Interest Income before provision 82% Non Interest Income 18% Retail Services Revenue 38% Commercial Services Revenue 29% Loan Sales & Servicing 24% Other Non- Interest Income 9%
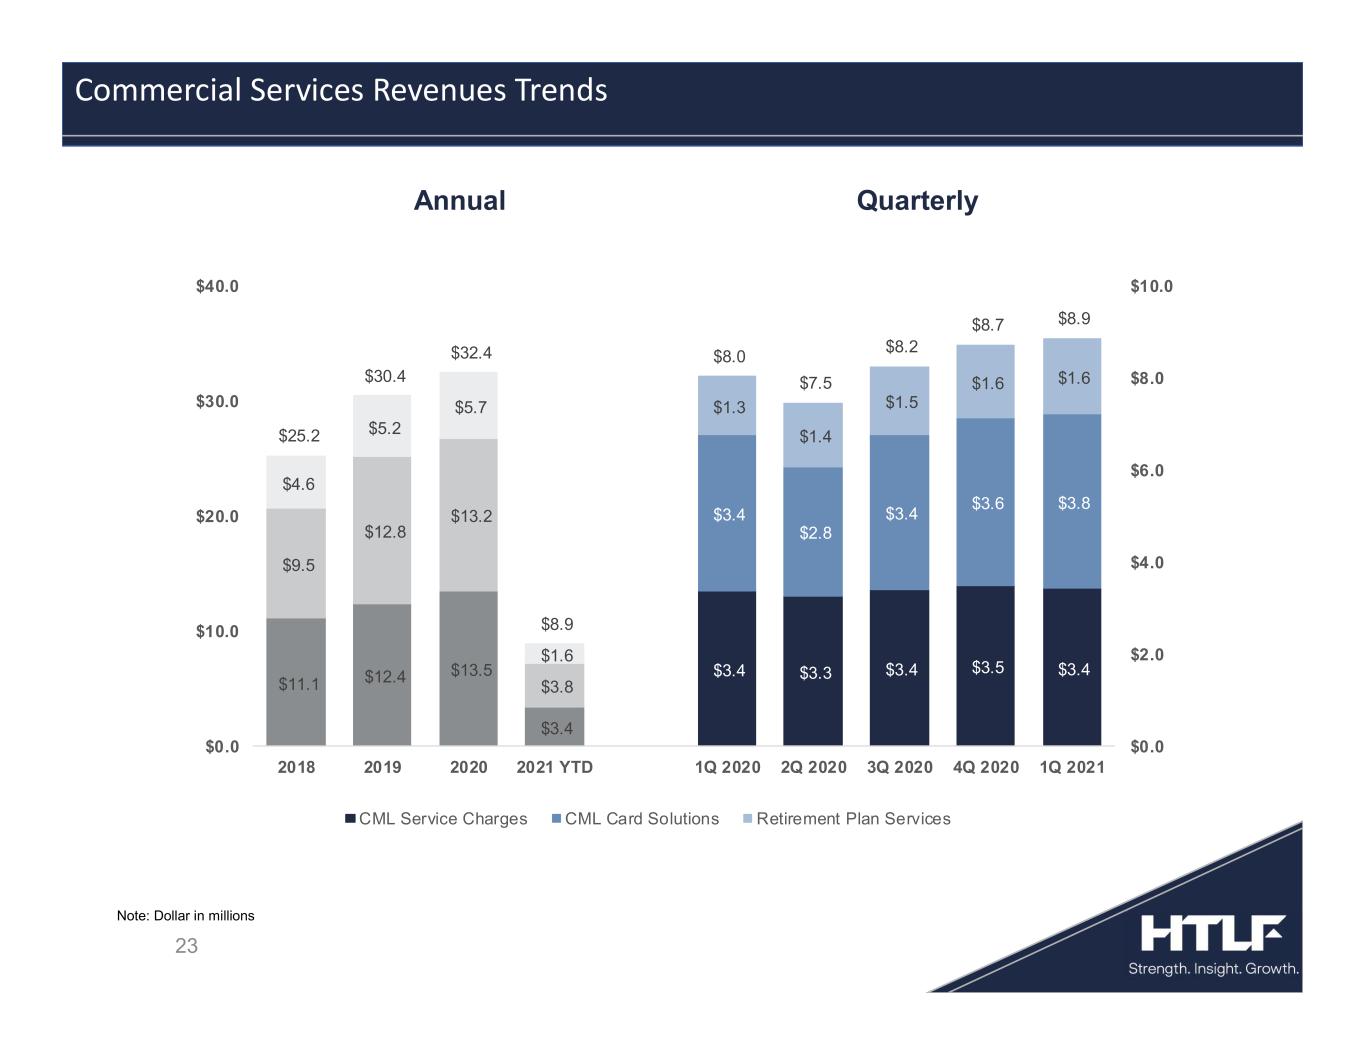
23 Commercial Services Revenues Trends Note: Dollar in millions $11.1 $12.4 $13.5 $3.4 $9.5 $12.8 $13.2 $3.8 $4.6 $5.2 $5.7 $1.6 $3.4 $3.3 $3.4 $3.5 $3.4 $3.4 $2.8 $3.4 $3.6 $3.8 $1.3 $1.4 $1.5 $1.6 $1.6 $25.2 $30.4 $32.4 $8.9 $8.0 $7.5 $8.2 $8.7 $8.9 $0.0 $2.0 $4.0 $6.0 $8.0 $10.0 $0.0 $10.0 $20.0 $30.0 $40.0 2018 2019 2020 2021 YTD 1Q 2020 2Q 2020 3Q 2020 4Q 2020 1Q 2021 CML Service Charges CML Card Solutions Retirement Plan Services QuarterlyAnnual
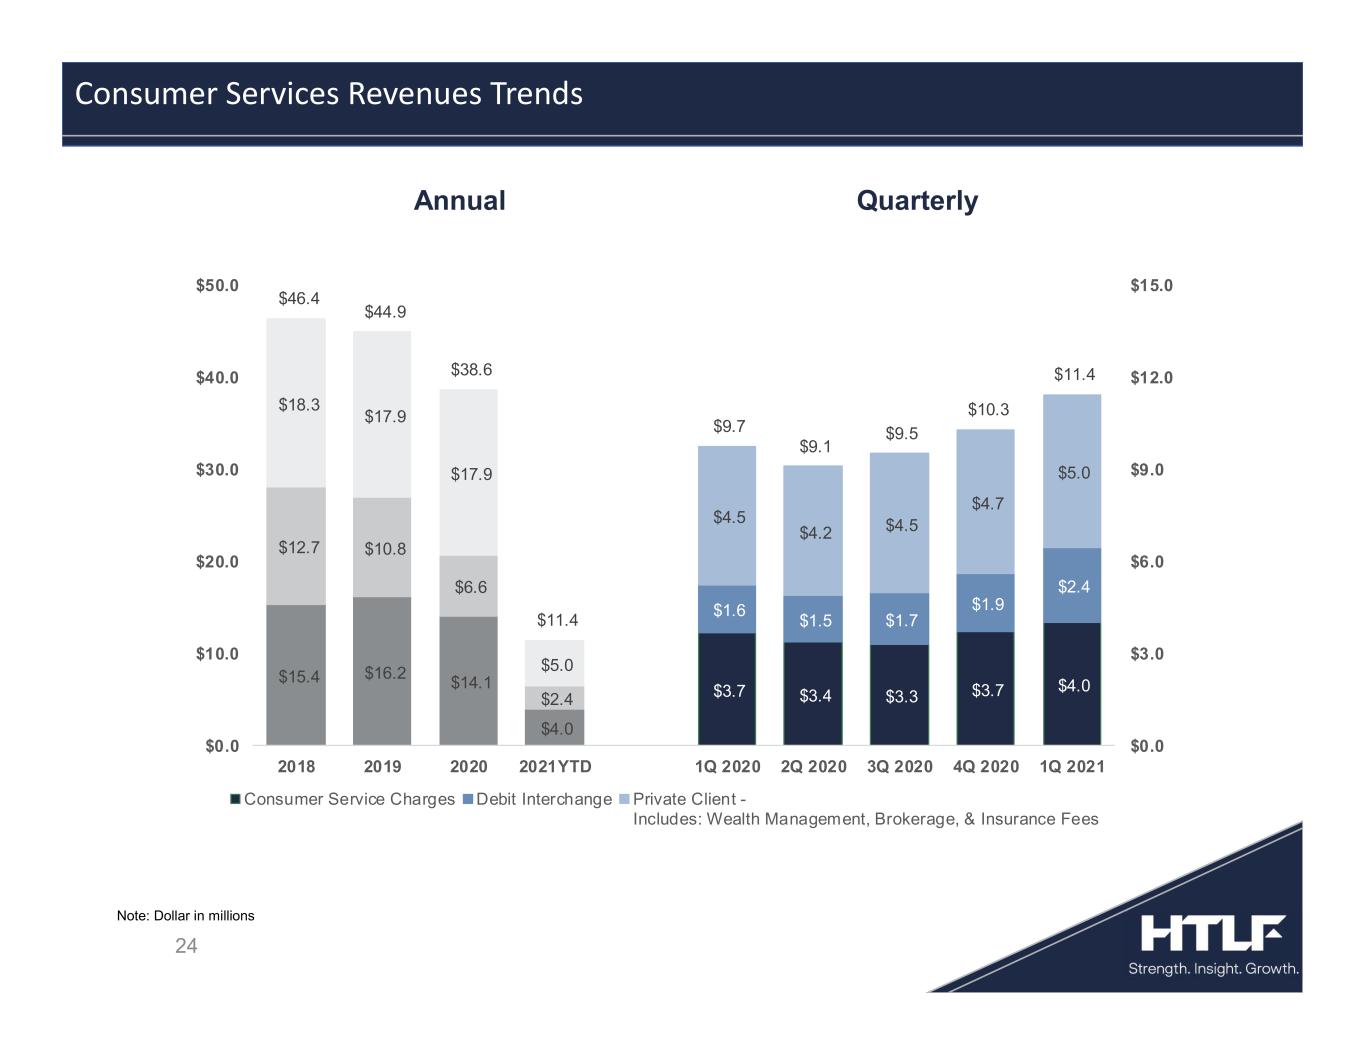
24 Consumer Services Revenues Trends Note: Dollar in millions $15.4 $16.2 $14.1 $4.0 $12.7 $10.8 $6.6 $2.4 $18.3 $17.9 $17.9 $5.0 $3.7 $3.4 $3.3 $3.7 $4.0 $1.6 $1.5 $1.7 $1.9 $2.4 $4.5 $4.2 $4.5 $4.7 $5.0 $46.4 $44.9 $38.6 $11.4 $9.7 $9.1 $9.5 $10.3 $11.4 $0.0 $3.0 $6.0 $9.0 $12.0 $15.0 $0.0 $10.0 $20.0 $30.0 $40.0 $50.0 2018 2019 2020 2021YTD 1Q 2020 2Q 2020 3Q 2020 4Q 2020 1Q 2021 Consumer Service Charges Debit Interchange Private Client - Includes: Wealth Management, Brokerage, & Insurance Fees QuarterlyAnnual
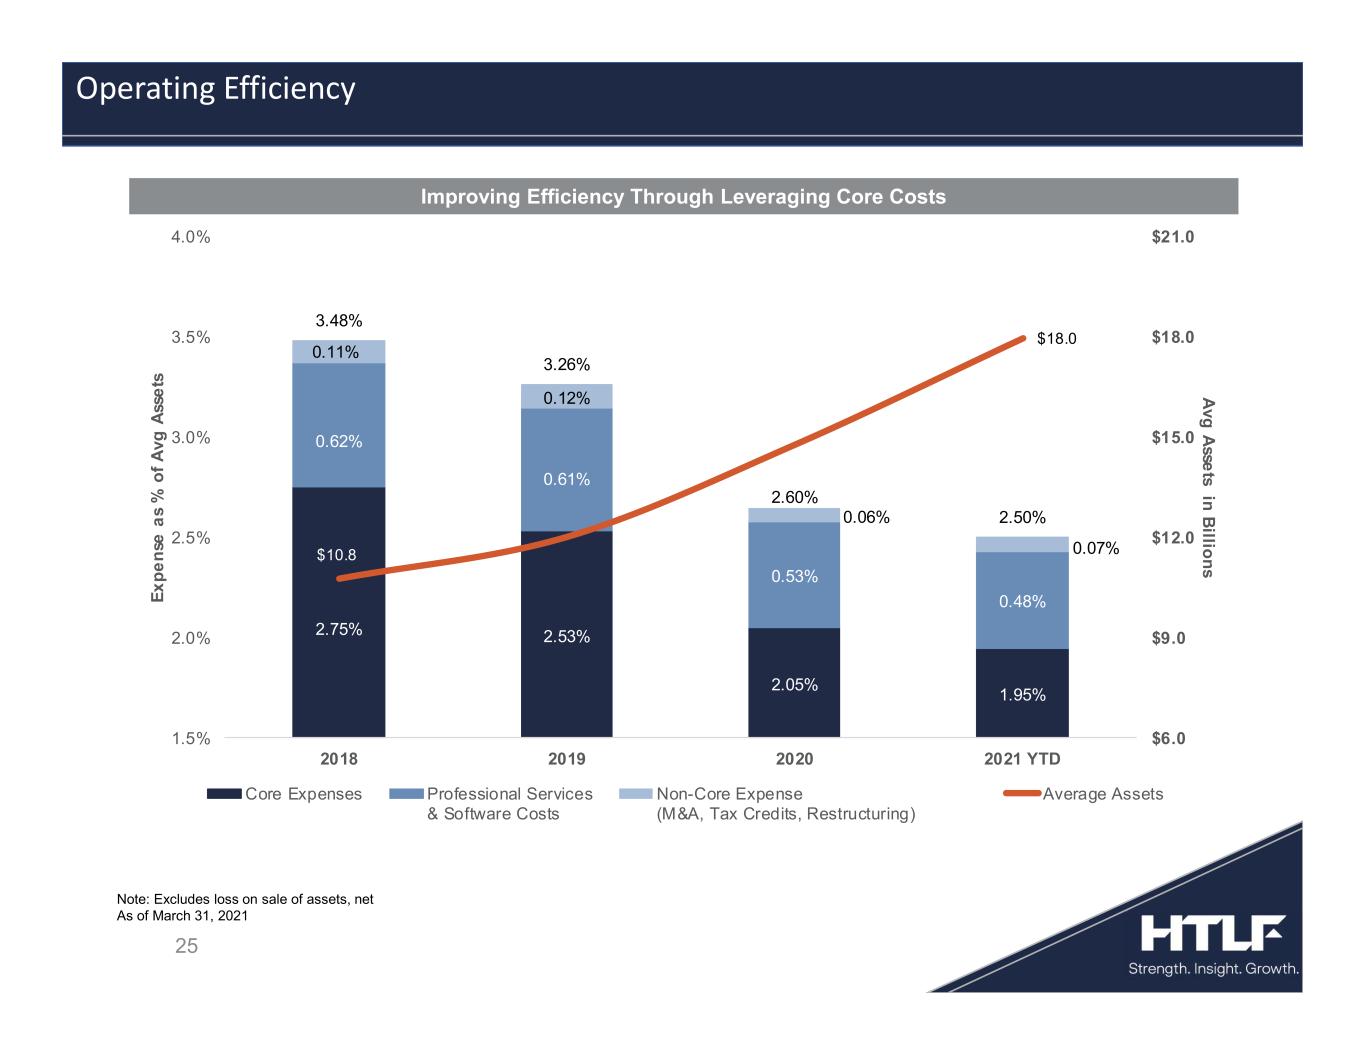
Improving Efficiency Through Leveraging Core Costs 25 Operating Efficiency Note: Excludes loss on sale of assets, net As of March 31, 2021 2.75% 2.53% 2.05% 1.95% 0.62% 0.61% 0.53% 0.48% 0.11% 0.12% 0.06% 0.07% 3.48% 3.26% 2.60% 2.50% $10.8 $18.0 $6.0 $9.0 $12.0 $15.0 $18.0 $21.0 1.5% 2.0% 2.5% 3.0% 3.5% 4.0% 2018 2019 2020 2021 YTD A v g A sse ts in B illio n s E x p e n se a s % o f A v g A ss e ts Core Expenses Professional Services & Software Costs Non-Core Expense (M&A, Tax Credits, Restructuring) Average Assets
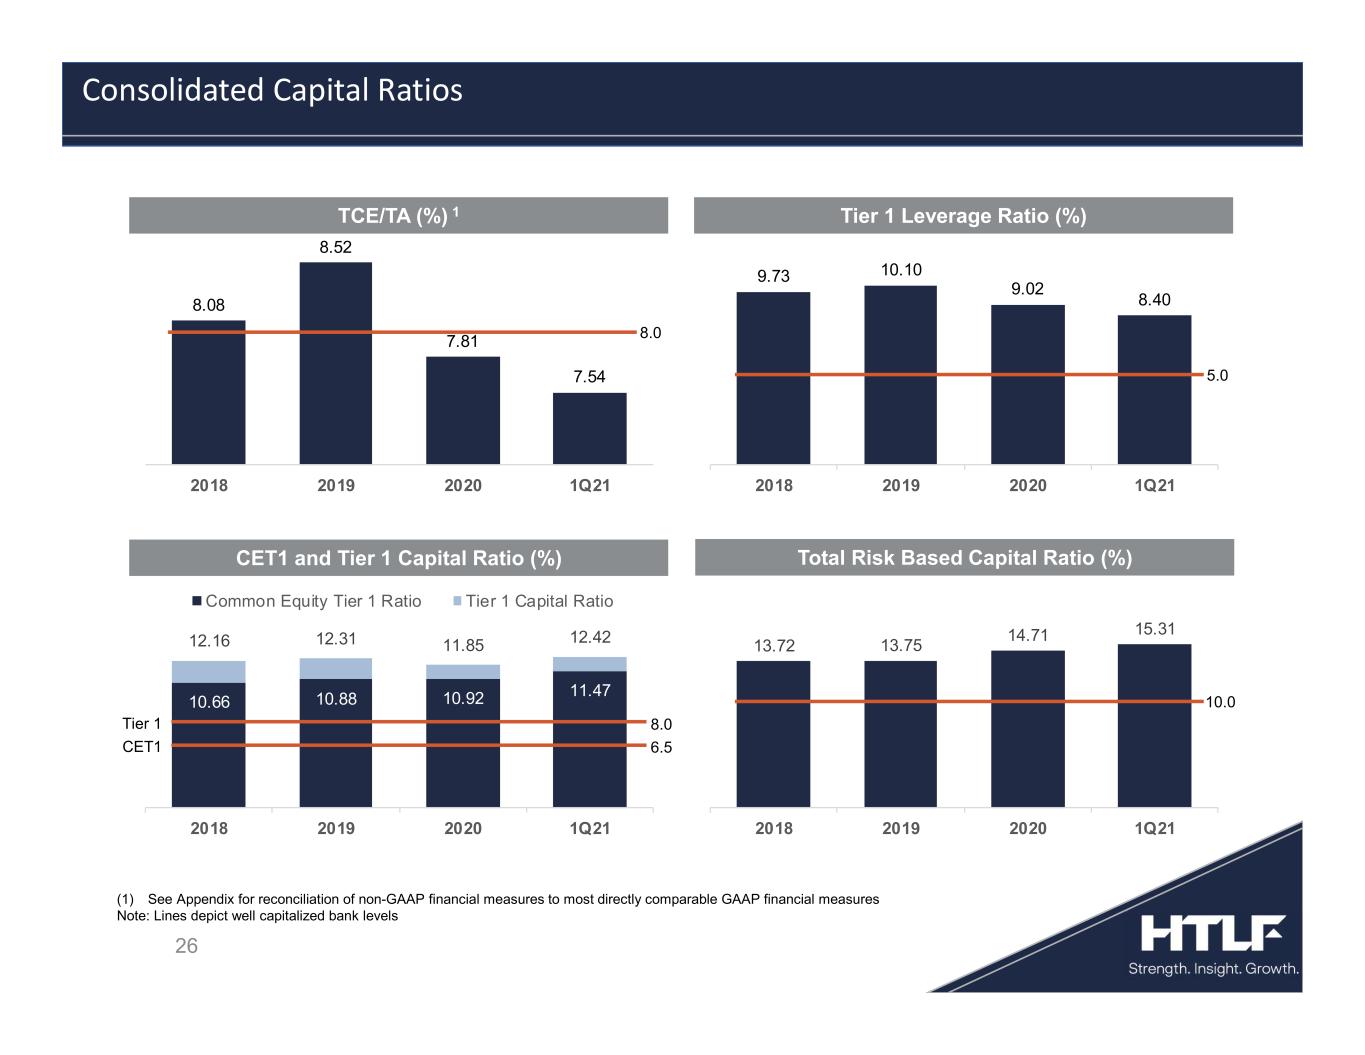
8.08 8.52 7.81 7.54 2018 2019 2020 1Q21 9.73 10.10 9.02 8.40 2018 2019 2020 1Q21 10.66 10.88 10.92 11.47 12.16 12.31 11.85 12.42 2018 2019 2020 1Q21 Common Equity Tier 1 Ratio Tier 1 Capital Ratio 13.72 13.75 14.71 15.31 2018 2019 2020 1Q21 26 Consolidated Capital Ratios Tier 1 CET1 10.0 8.0 8.0 6.5 (1) See Appendix for reconciliation of non-GAAP financial measures to most directly comparable GAAP financial measures Note: Lines depict well capitalized bank levels 5.0 TCE/TA (%) 1 Tier 1 Leverage Ratio (%) CET1 and Tier 1 Capital Ratio (%) Total Risk Based Capital Ratio (%)
27 Loan Portfolio and Asset Quality
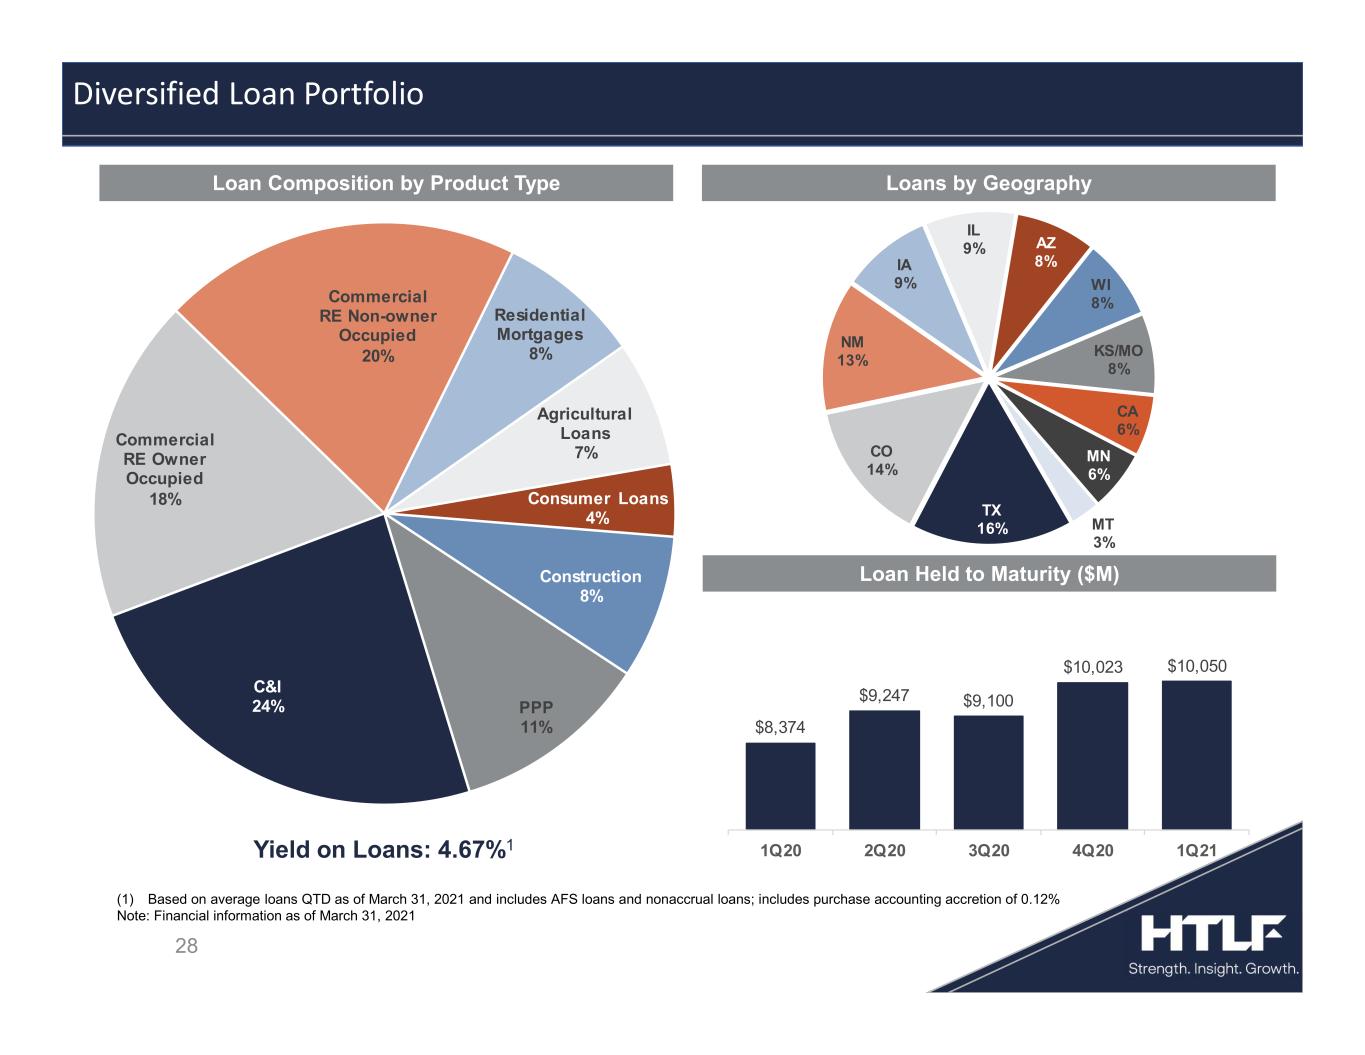
28 Loan Composition by Product Type Loans by Geography Loan Held to Maturity ($M) Diversified Loan Portfolio (1) Based on average loans QTD as of March 31, 2021 and includes AFS loans and nonaccrual loans; includes purchase accounting accretion of 0.12% Note: Financial information as of March 31, 2021 TX 16% CO 14% NM 13% IA 9% IL 9% AZ 8% WI 8% KS/MO 8% CA 6% MN 6% MT 3% C&I 24% Commercial RE Owner Occupied 18% Commercial RE Non-owner Occupied 20% Residential Mortgages 8% Agricultural Loans 7% Consumer Loans 4% Construction 8% PPP 11% Yield on Loans: 4.67%1 $8,374 $9,247 $9,100 $10,023 $10,050 1Q20 2Q20 3Q20 4Q20 1Q21
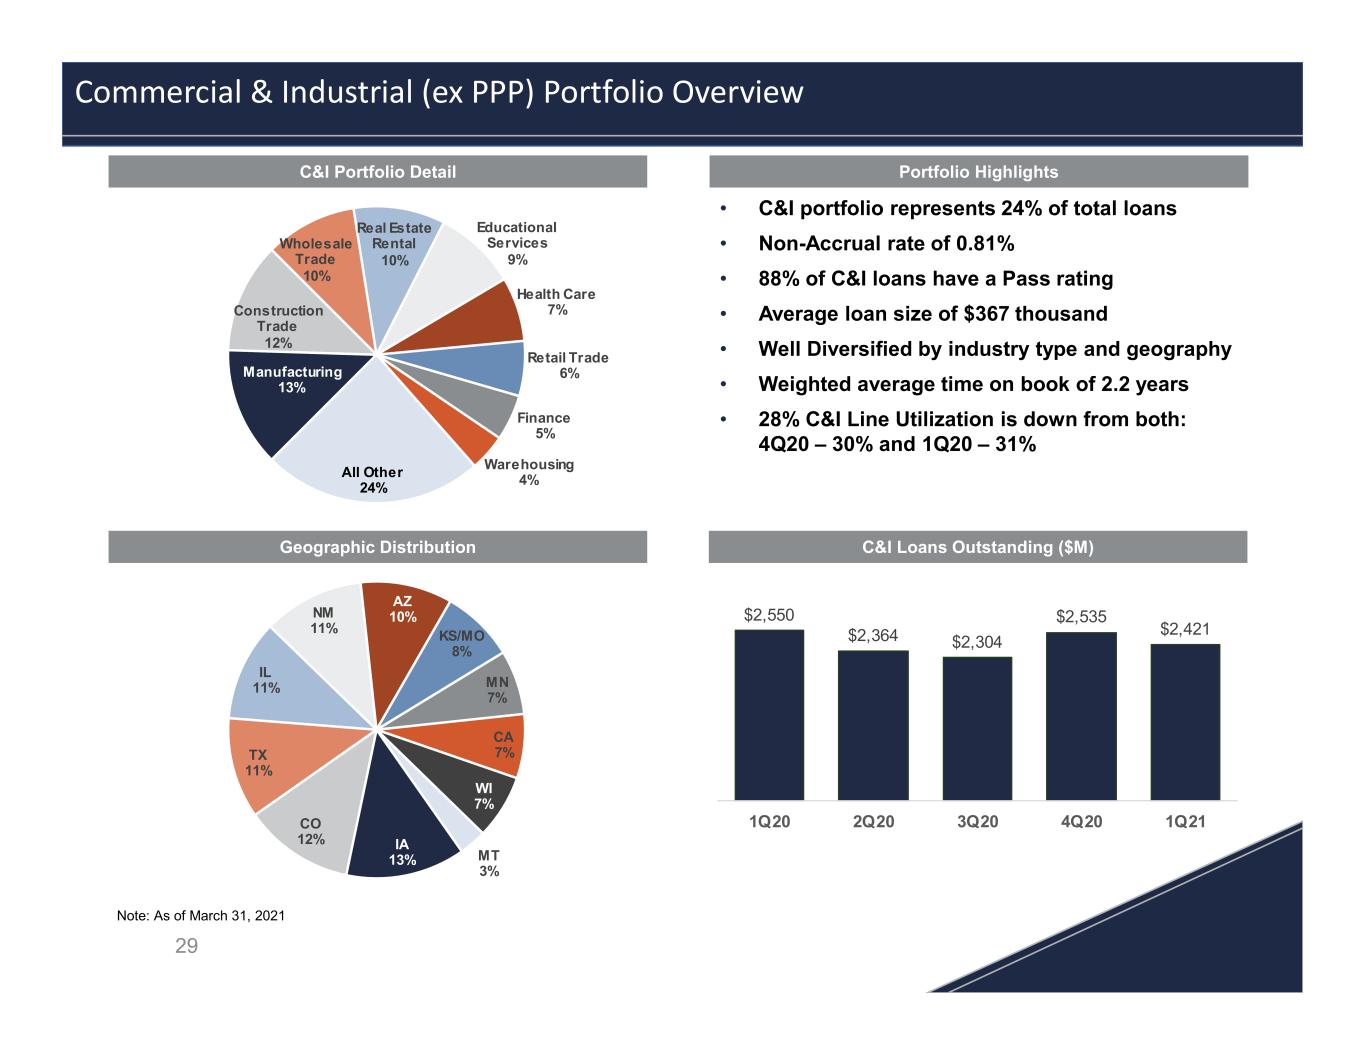
• C&I portfolio represents 24% of total loans • Non-Accrual rate of 0.81% • 88% of C&I loans have a Pass rating • Average loan size of $367 thousand • Well Diversified by industry type and geography • Weighted average time on book of 2.2 years • 28% C&I Line Utilization is down from both: 4Q20 – 30% and 1Q20 – 31% 29 Commercial & Industrial (ex PPP) Portfolio Overview Note: As of March 31, 2021 $2,550 $2,364 $2,304 $2,535 $2,421 1Q20 2Q20 3Q20 4Q20 1Q21 IA 13% CO 12% TX 11% IL 11% NM 11% AZ 10% KS/MO 8% MN 7% CA 7% WI 7% MT 3% Manufacturing 13% Construction Trade 12% Wholesale Trade 10% Real Estate Rental 10% Educational Services 9% Health Care 7% Retail Trade 6% Finance 5% Warehousing 4% All Other 24% C&I Portfolio Detail C&I Loans Outstanding ($M) Portfolio Highlights Geographic Distribution
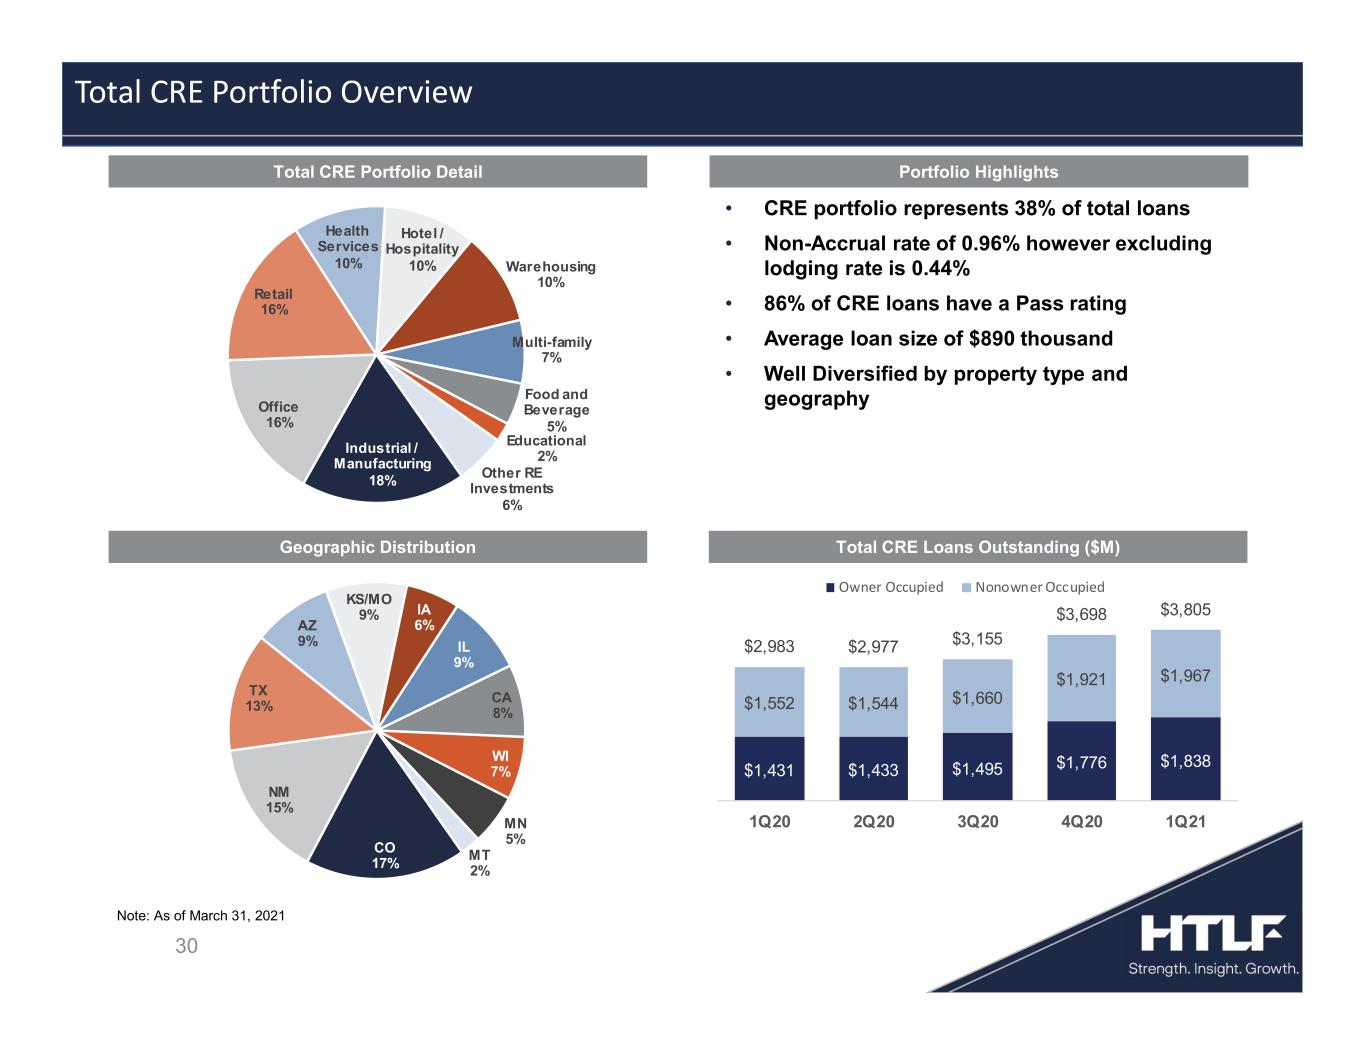
• CRE portfolio represents 38% of total loans • Non-Accrual rate of 0.96% however excluding lodging rate is 0.44% • 86% of CRE loans have a Pass rating • Average loan size of $890 thousand • Well Diversified by property type and geography 30 Total CRE Portfolio Overview Note: As of March 31, 2021 $1,431 $1,433 $1,495 $1,776 $1,838 $1,552 $1,544 $1,660 $1,921 $1,967 $2,983 $2,977 $3,155 $3,698 $3,805 1Q20 2Q20 3Q20 4Q20 1Q21 Owner Occupied Nonowner Occupied CO 17% NM 15% TX 13% AZ 9% KS/MO 9% IA 6% IL 9% CA 8% WI 7% MN 5% MT 2% Industrial / Manufacturing 18% Office 16% Retail 16% Health Services 10% Hotel / Hospitality 10% Warehousing 10% Multi-family 7% Food and Beverage 5% Educational 2% Other RE Investments 6% Total CRE Portfolio Detail Total CRE Loans Outstanding ($M) Portfolio Highlights Geographic Distribution
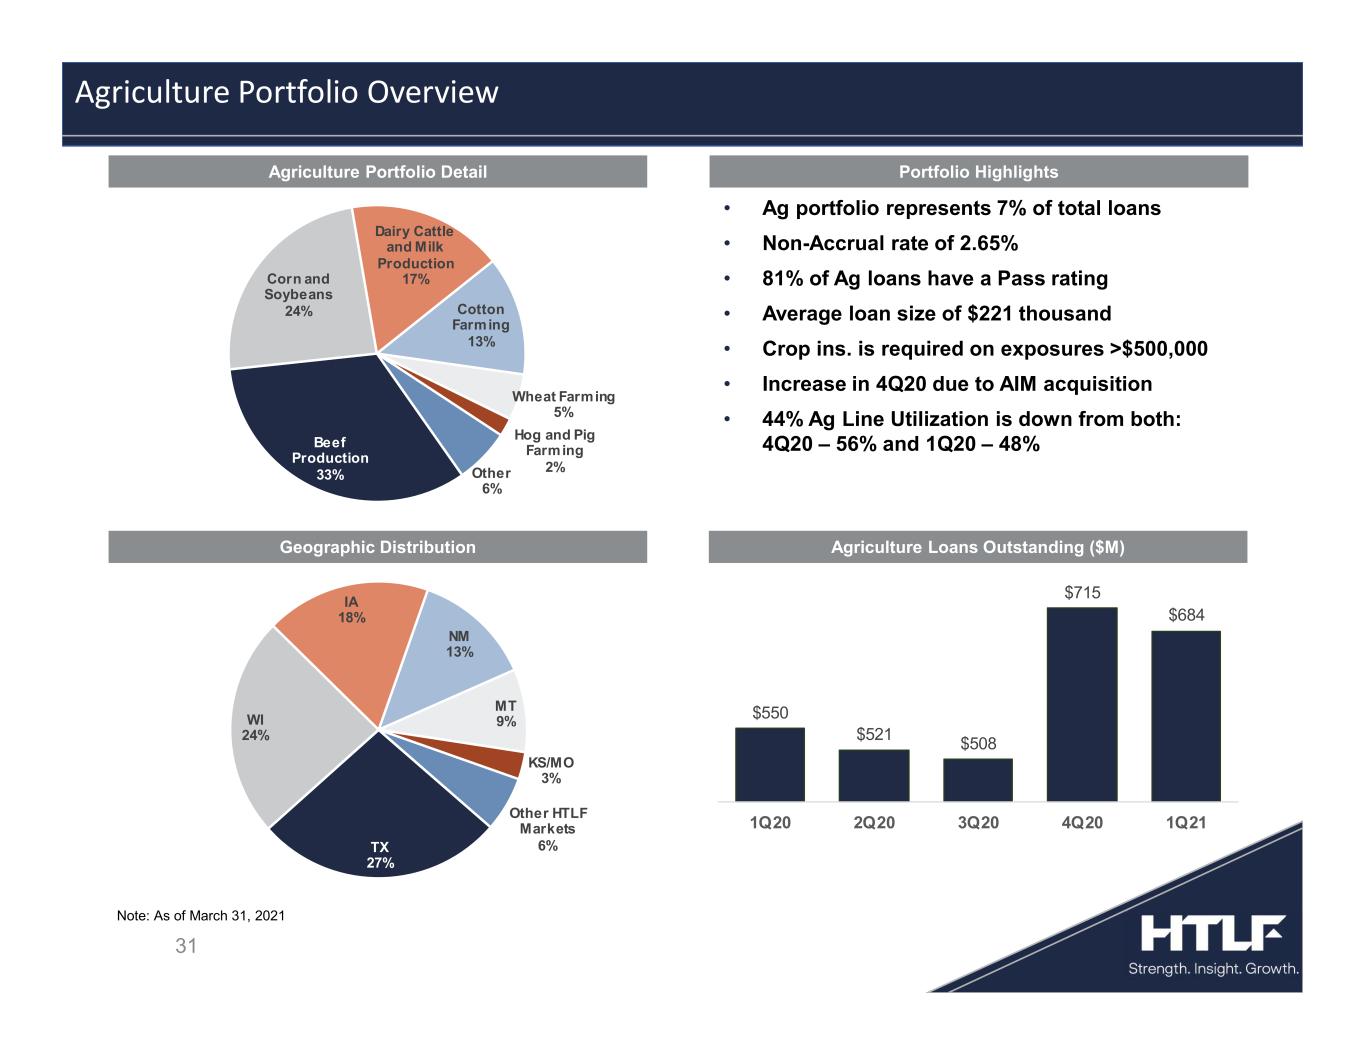
• Ag portfolio represents 7% of total loans • Non-Accrual rate of 2.65% • 81% of Ag loans have a Pass rating • Average loan size of $221 thousand • Crop ins. is required on exposures >$500,000 • Increase in 4Q20 due to AIM acquisition • 44% Ag Line Utilization is down from both: 4Q20 – 56% and 1Q20 – 48% 31 Agriculture Portfolio Overview Note: As of March 31, 2021 $550 $521 $508 $715 $684 1Q20 2Q20 3Q20 4Q20 1Q21 Beef Production 33% Corn and Soybeans 24% Dairy Cattle and Milk Production 17% Cotton Farming 13% Wheat Farming 5% Hog and Pig Farming 2%Other 6% TX 27% WI 24% IA 18% NM 13% MT 9% KS/MO 3% Other HTLF Markets 6% Portfolio HighlightsAgriculture Portfolio Detail Geographic Distribution Agriculture Loans Outstanding ($M)
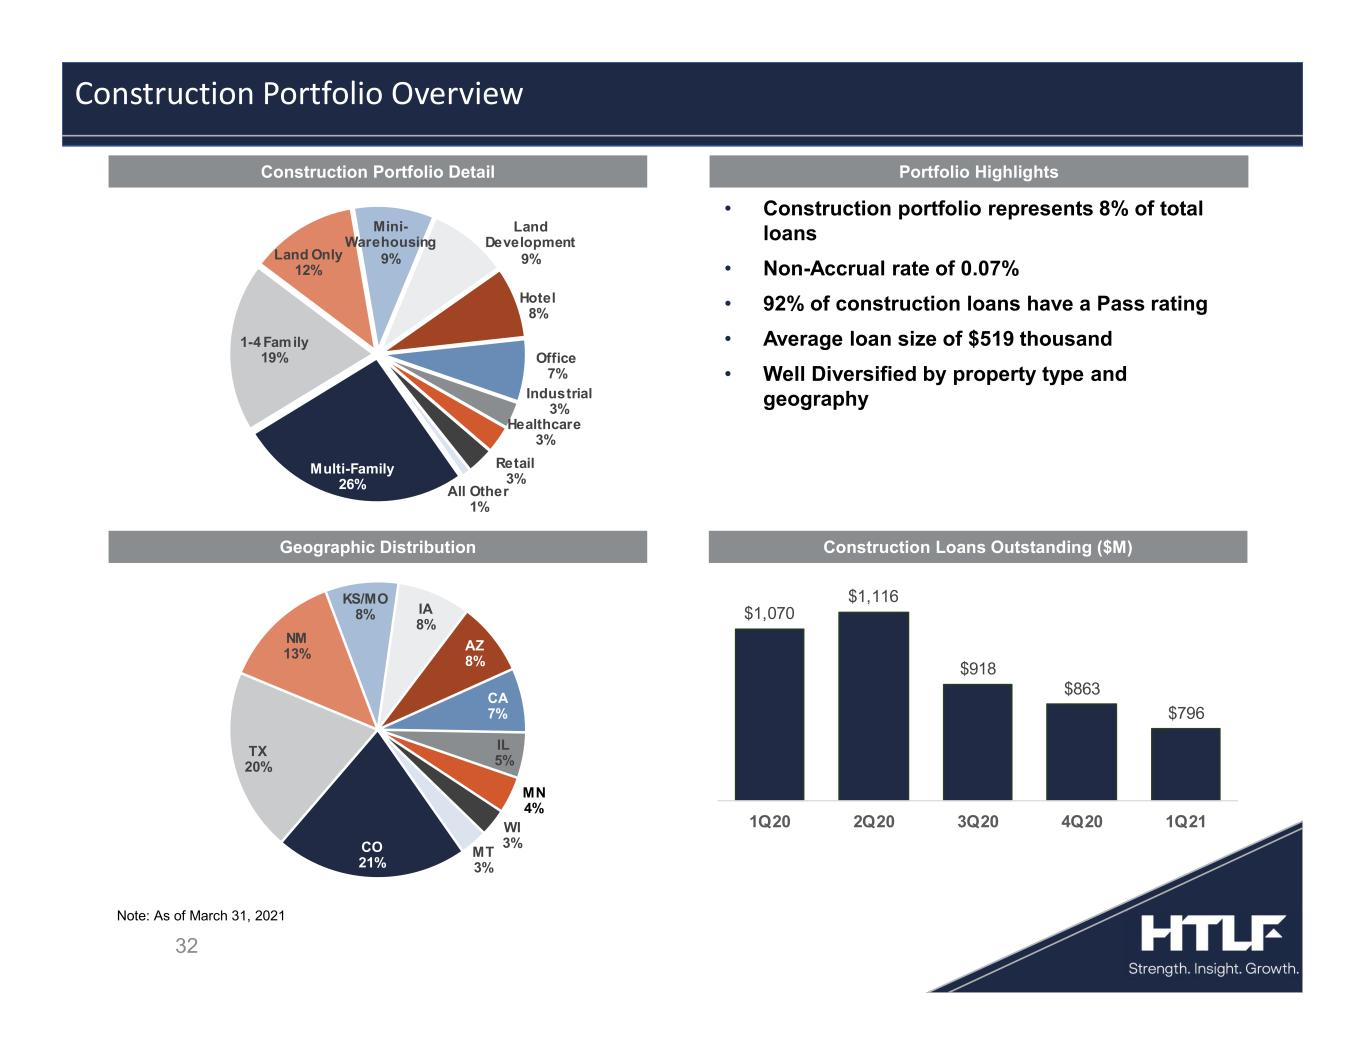
Portfolio HighlightsConstruction Portfolio Detail • Construction portfolio represents 8% of total loans • Non-Accrual rate of 0.07% • 92% of construction loans have a Pass rating • Average loan size of $519 thousand • Well Diversified by property type and geography Geographic Distribution Construction Loans Outstanding ($M) 32 Construction Portfolio Overview Note: As of March 31, 2021 $1,070 $1,116 $918 $863 $796 1Q20 2Q20 3Q20 4Q20 1Q21 CO 21% TX 20% NM 13% KS/MO 8% IA 8% AZ 8% CA 7% IL 5% MN 4% WI 3% MT 3% Multi-Family 26% 1-4 Family 19% Land Only 12% Mini- Warehousing 9% Land Development 9% Hotel 8% Office 7% Industrial 3% Healthcare 3% Retail 3% All Other 1%
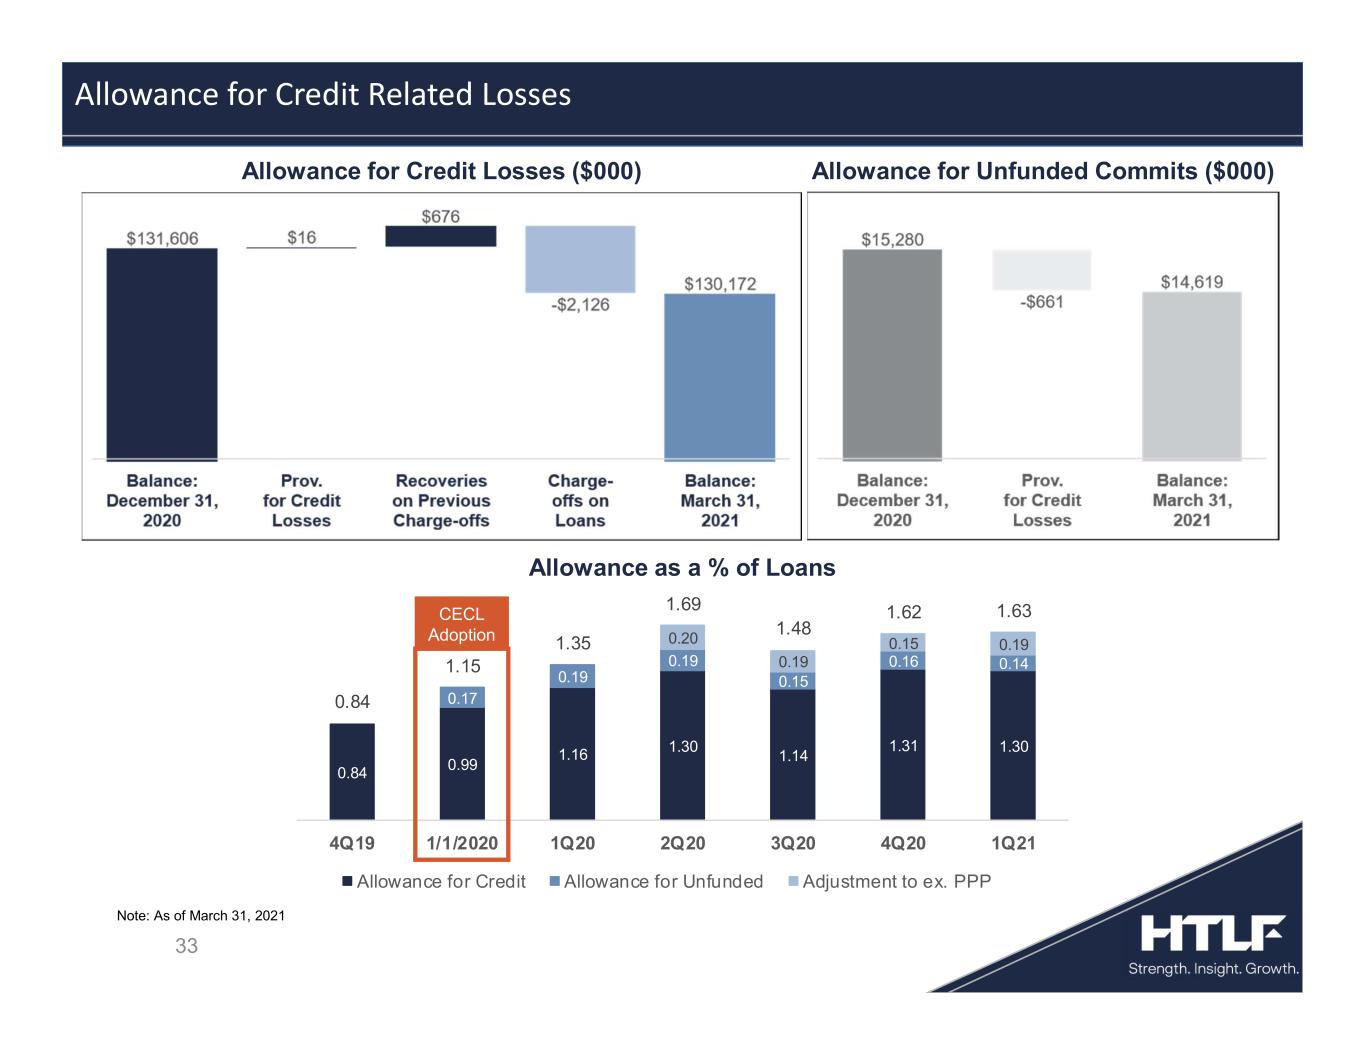
33 Allowance for Credit Related Losses Allowance as a % of Loans Allowance for Credit Losses ($000) Note: As of March 31, 2021 Allowance for Unfunded Commits ($000) 0.84 1.15 1.35 1.69 1.48 1.62 1.63 0.84 0.99 1.16 1.30 1.14 1.31 1.30 0.17 0.19 0.19 0.15 0.16 0.14 0.20 0.19 0.15 0.19 4Q19 1/1/2020 1Q20 2Q20 3Q20 4Q20 1Q21 Allowance for Credit Allowance for Unfunded Adjustment to ex. PPP CECL Adoption
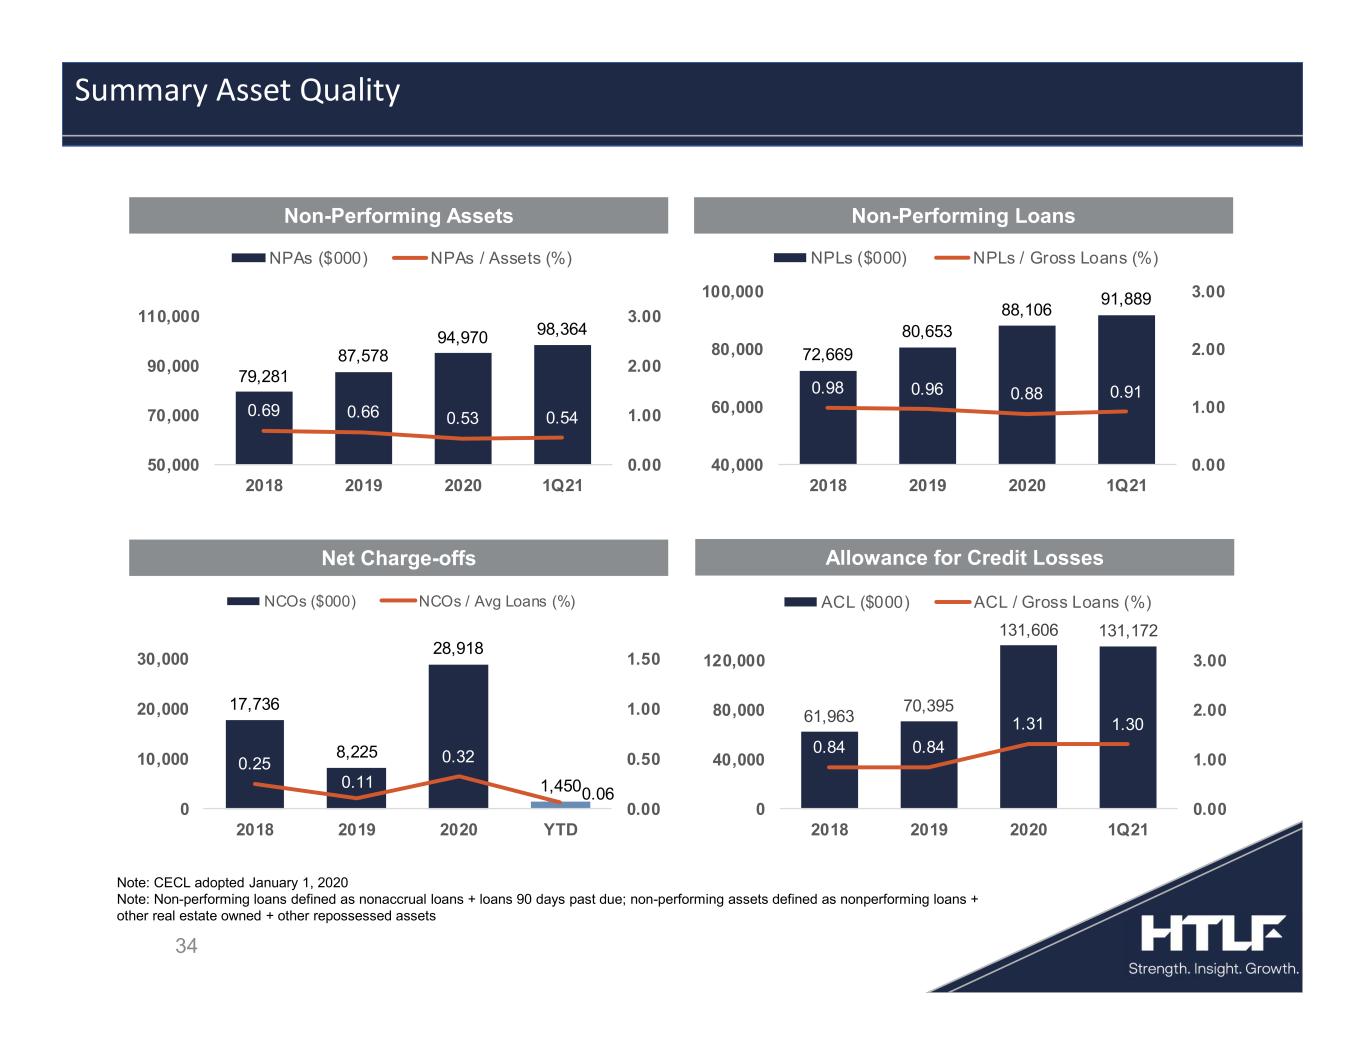
34 Summary Asset Quality Note: CECL adopted January 1, 2020 Note: Non-performing loans defined as nonaccrual loans + loans 90 days past due; non-performing assets defined as nonperforming loans + other real estate owned + other repossessed assets 72,669 80,653 88,106 91,889 0.98 0.96 0.88 0.91 0.00 1.00 2.00 3.00 40,000 60,000 80,000 100,000 2018 2019 2020 1Q21 NPLs ($000) NPLs / Gross Loans (%) 61,963 70,395 131,606 131,172 0.84 0.84 1.31 1.30 0.00 1.00 2.00 3.00 0 40,000 80,000 120,000 2018 2019 2020 1Q21 ACL ($000) ACL / Gross Loans (%) 79,281 87,578 94,970 98,364 0.69 0.66 0.53 0.54 0.00 1.00 2.00 3.00 50,000 70,000 90,000 110,000 2018 2019 2020 1Q21 NPAs ($000) NPAs / Assets (%) 17,736 8,225 28,918 1,450 0.25 0.11 0.32 0.06 0.00 0.50 1.00 1.50 0 10,000 20,000 30,000 2018 2019 2020 YTD NCOs ($000) NCOs / Avg Loans (%) Non-Performing Assets Non-Performing Loans Net Charge-offs Allowance for Credit Losses
35 Liquidity, Investments, Funding and Capital
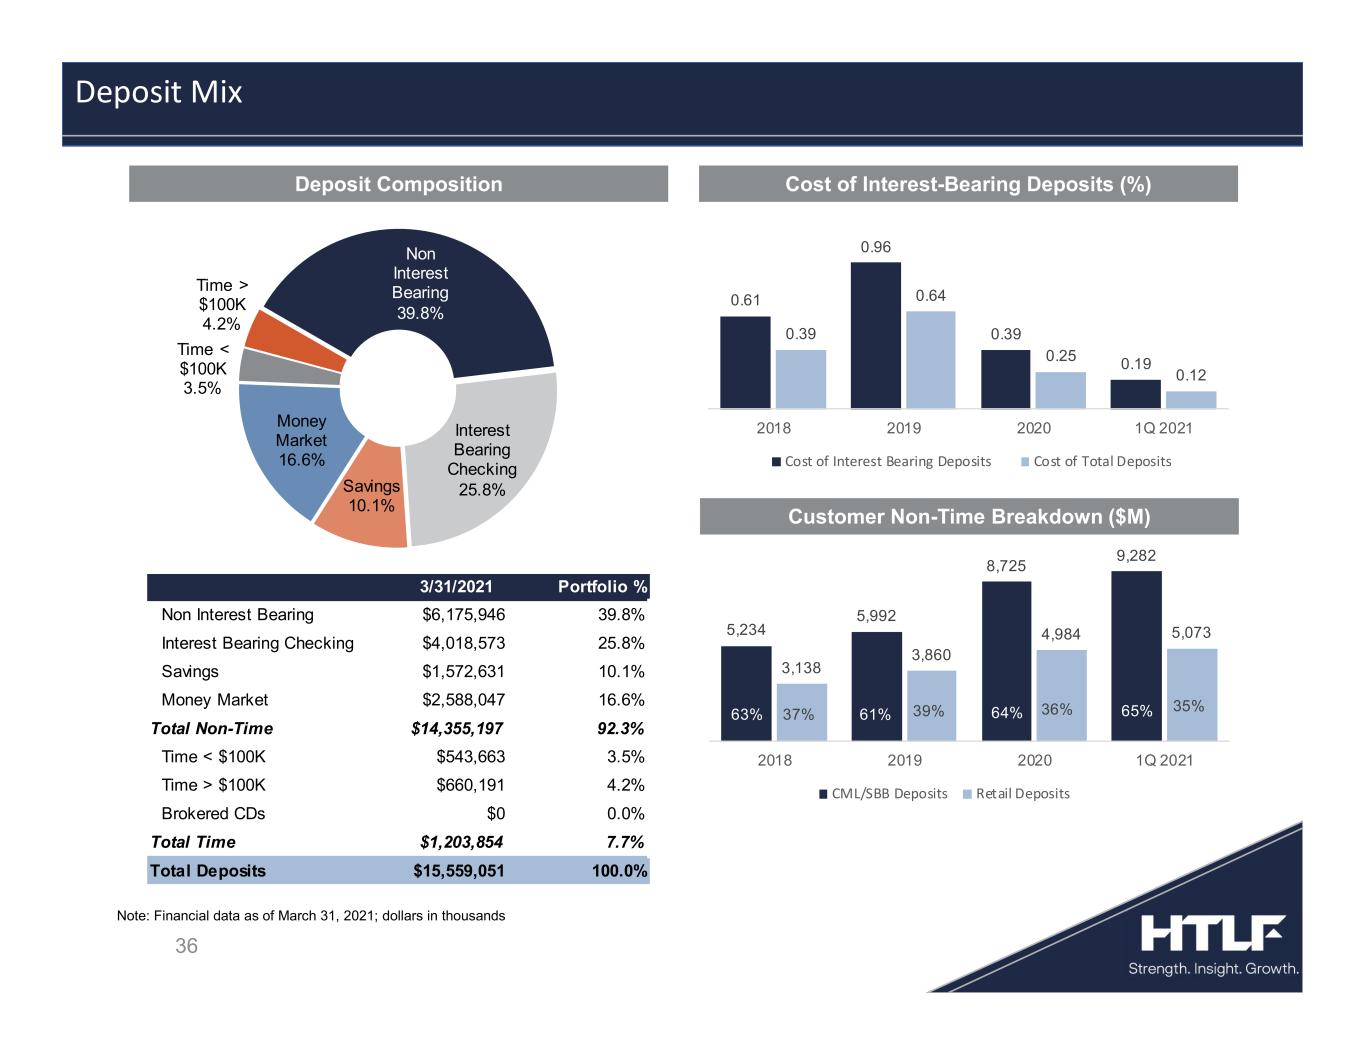
Deposit Composition Cost of Interest-Bearing Deposits (%) Customer Non-Time Breakdown ($M) 36 Deposit Mix Note: Financial data as of March 31, 2021; dollars in thousands Non Interest Bearing 39.8% Interest Bearing Checking 25.8%Savings 10.1% Money Market 16.6% Time < $100K 3.5% Time > $100K 4.2% 3/31/2021 Portfolio % Non Interest Bearing $6,175,946 39.8% Interest Bearing Checking $4,018,573 25.8% Savings $1,572,631 10.1% Money Market $2,588,047 16.6% Total Non-Time $14,355,197 92.3% Time < $100K $543,663 3.5% Time > $100K $660,191 4.2% Brokered CDs $0 0.0% Total Time $1,203,854 7.7% Total Deposits $15,559,051 100.0% 0.61 0.96 0.39 0.19 0.39 0.64 0.25 0.12 2018 2019 2020 1Q 2021 Cost of Interest Bearing Deposits Cost of Total Deposits 5,234 5,992 8,725 9,282 3,138 3,860 4,984 5,073 63% 61% 64% 65%37% 39% 36% 35% 2018 2019 2020 1Q 2021 CML/SBB Deposits Retail Deposits
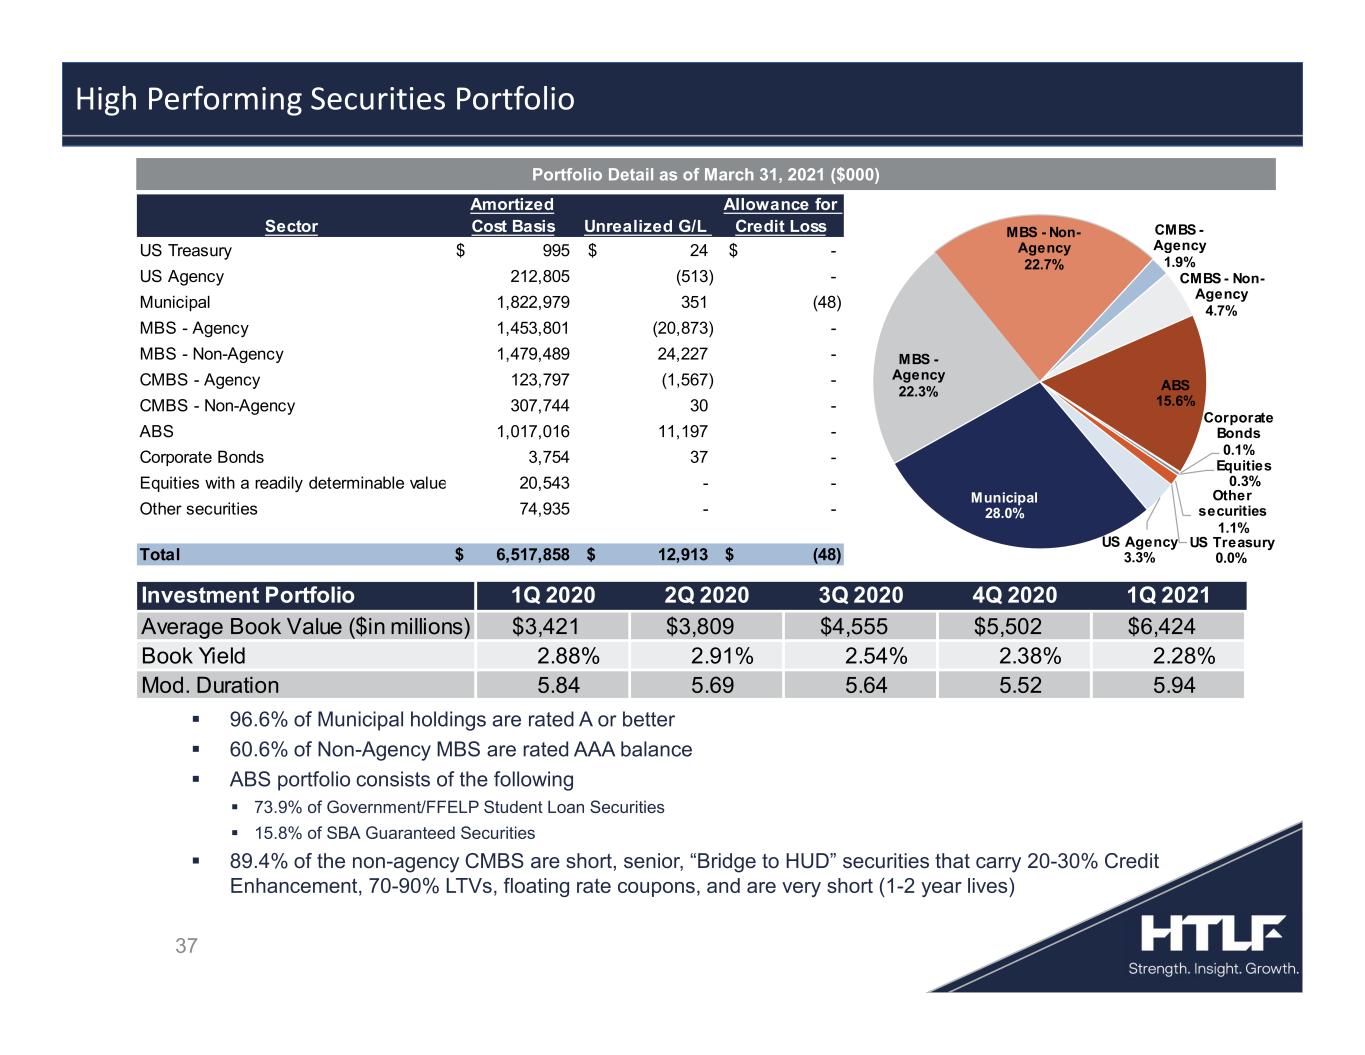
37 96.6% of Municipal holdings are rated A or better 60.6% of Non-Agency MBS are rated AAA balance ABS portfolio consists of the following 73.9% of Government/FFELP Student Loan Securities 15.8% of SBA Guaranteed Securities 89.4% of the non-agency CMBS are short, senior, “Bridge to HUD” securities that carry 20-30% Credit Enhancement, 70-90% LTVs, floating rate coupons, and are very short (1-2 year lives) High Performing Securities Portfolio Portfolio Detail as of March 31, 2021 ($000) Investment Portfolio 1Q 2020 2Q 2020 3Q 2020 4Q 2020 1Q 2021 Average Book Value ($in millions) $3,421 $3,809 $4,555 $5,502 $6,424 Book Yield 2.88% 2.91% 2.54% 2.38% 2.28% Mod. Duration 5.84 5.69 5.64 5.52 5.94 US Treasury 0.0% US Agency 3.3% Municipal 28.0% MBS - Agency 22.3% MBS - Non- Agency 22.7% CMBS - Agency 1.9% CMBS - Non- Agency 4.7% ABS 15.6% Corporate Bonds 0.1% Equities 0.3% Other securities 1.1% Sector Amortized Cost Basis Unrealized G/L Allowance for Credit Loss US Treasury 995$ 24$ -$ US Agency 212,805 (513) - Municipal 1,822,979 351 (48) MBS - Agency 1,453,801 (20,873) - MBS - Non-Agency 1,479,489 24,227 - CMBS - Agency 123,797 (1,567) - CMBS - Non-Agency 307,744 30 - ABS 1,017,016 11,197 - Corporate Bonds 3,754 37 - Equities with a readily determinable value 20,543 - - Other securities 74,935 - - Total 6,517,858$ 12,913$ (48)$
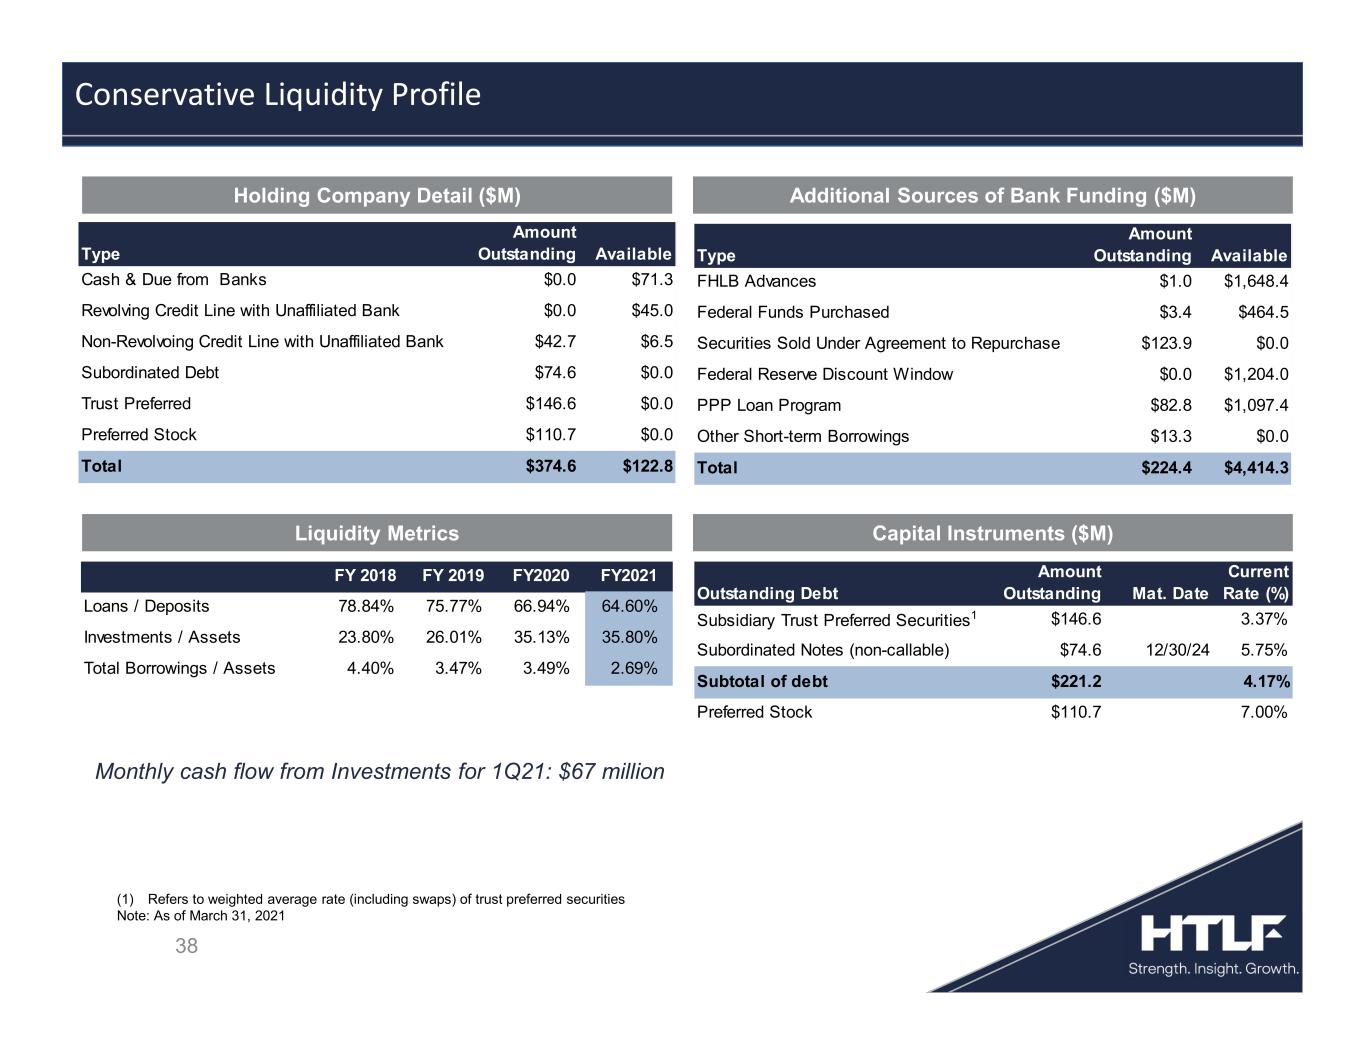
38 Monthly cash flow from Investments for 1Q21: $67 million Capital Instruments ($M) Conservative Liquidity Profile Liquidity Metrics (1) Refers to weighted average rate (including swaps) of trust preferred securities Note: As of March 31, 2021 FY 2018 FY 2019 FY2020 FY2021 Loans / Deposits 78.84% 75.77% 66.94% 64.60% Investments / Assets 23.80% 26.01% 35.13% 35.80% Total Borrowings / Assets 4.40% 3.47% 3.49% 2.69% Outstanding Debt Amount Outstanding Mat. Date Current Rate (%) Subsidiary Trust Preferred Securities1 $146.6 3.37% Subordinated Notes (non-callable) $74.6 12/30/24 5.75% Subtotal of debt $221.2 4.17% Preferred Stock $110.7 7.00% Type Amount Outstanding Available FHLB Advances $1.0 $1,648.4 Federal Funds Purchased $3.4 $464.5 Securities Sold Under Agreement to Repurchase $123.9 $0.0 Federal Reserve Discount Window $0.0 $1,204.0 PPP Loan Program $82.8 $1,097.4 Other Short-term Borrowings $13.3 $0.0 Total $224.4 $4,414.3 Type Amount Outstanding Available Cash & Due from Banks $0.0 $71.3 Revolving Credit Line with Unaffiliated Bank $0.0 $45.0 Non-Revolvoing Credit Line with Unaffiliated Bank $42.7 $6.5 Subordinated Debt $74.6 $0.0 Trust Preferred $146.6 $0.0 Preferred Stock $110.7 $0.0 Total $374.6 $122.8 Additional Sources of Bank Funding ($M)Holding Company Detail ($M)

39 M&A Strategy
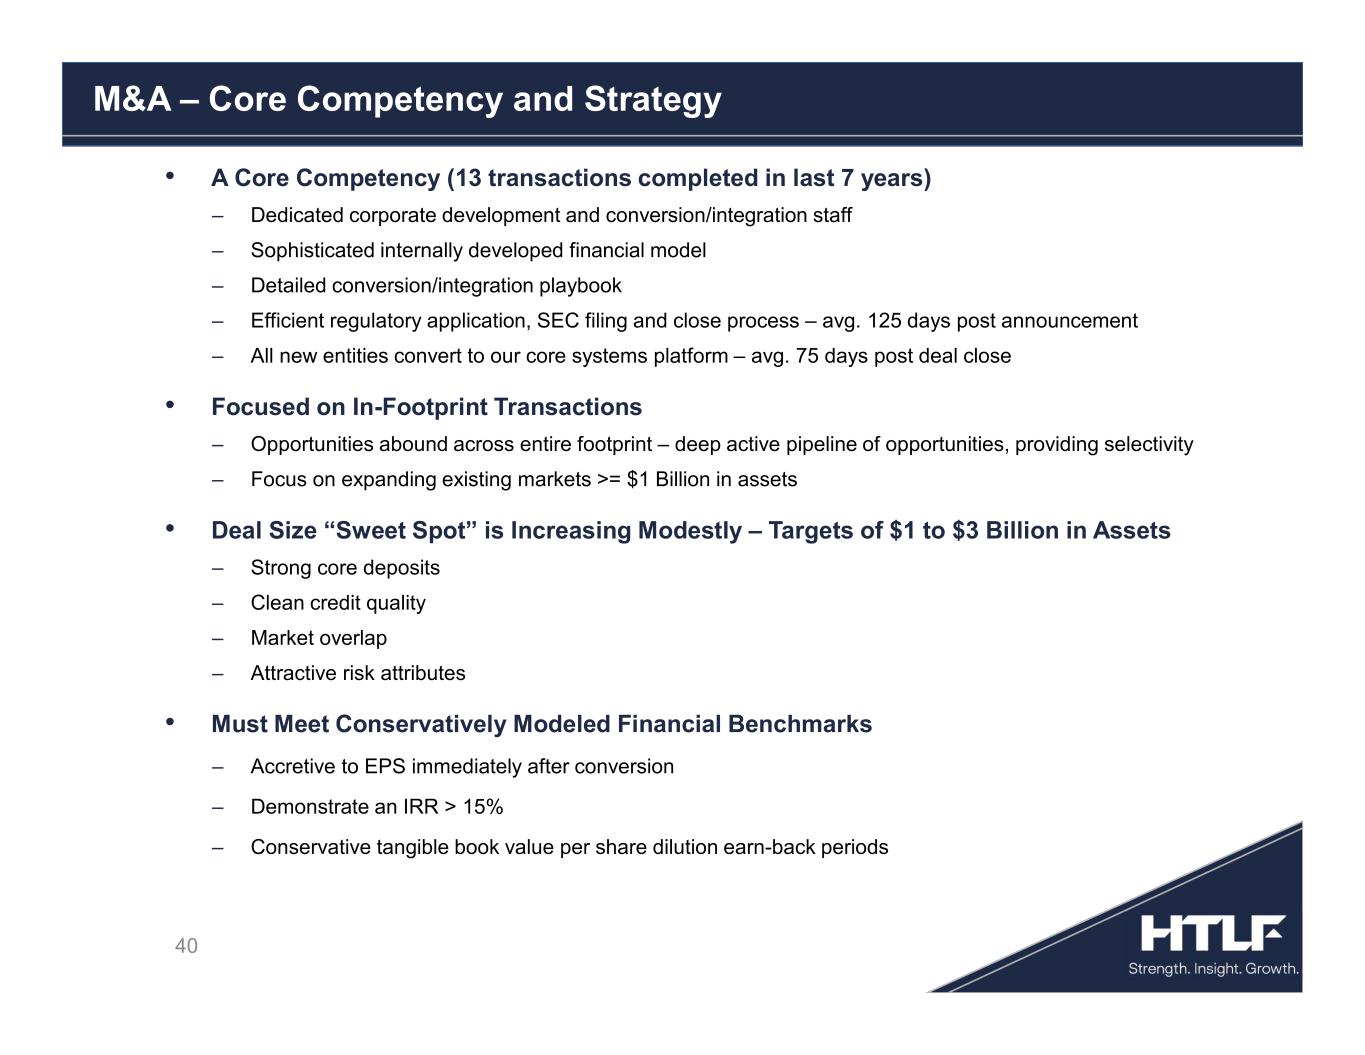
40 • A Core Competency (13 transactions completed in last 7 years) ‒ Dedicated corporate development and conversion/integration staff ‒ Sophisticated internally developed financial model ‒ Detailed conversion/integration playbook ‒ Efficient regulatory application, SEC filing and close process – avg. 125 days post announcement ‒ All new entities convert to our core systems platform – avg. 75 days post deal close • Focused on In-Footprint Transactions ‒ Opportunities abound across entire footprint – deep active pipeline of opportunities, providing selectivity ‒ Focus on expanding existing markets >= $1 Billion in assets • Deal Size “Sweet Spot” is Increasing Modestly – Targets of $1 to $3 Billion in Assets ‒ Strong core deposits ‒ Clean credit quality ‒ Market overlap ‒ Attractive risk attributes • Must Meet Conservatively Modeled Financial Benchmarks ‒ Accretive to EPS immediately after conversion ‒ Demonstrate an IRR > 15% ‒ Conservative tangible book value per share dilution earn-back periods M&A – Core Competency and Strategy
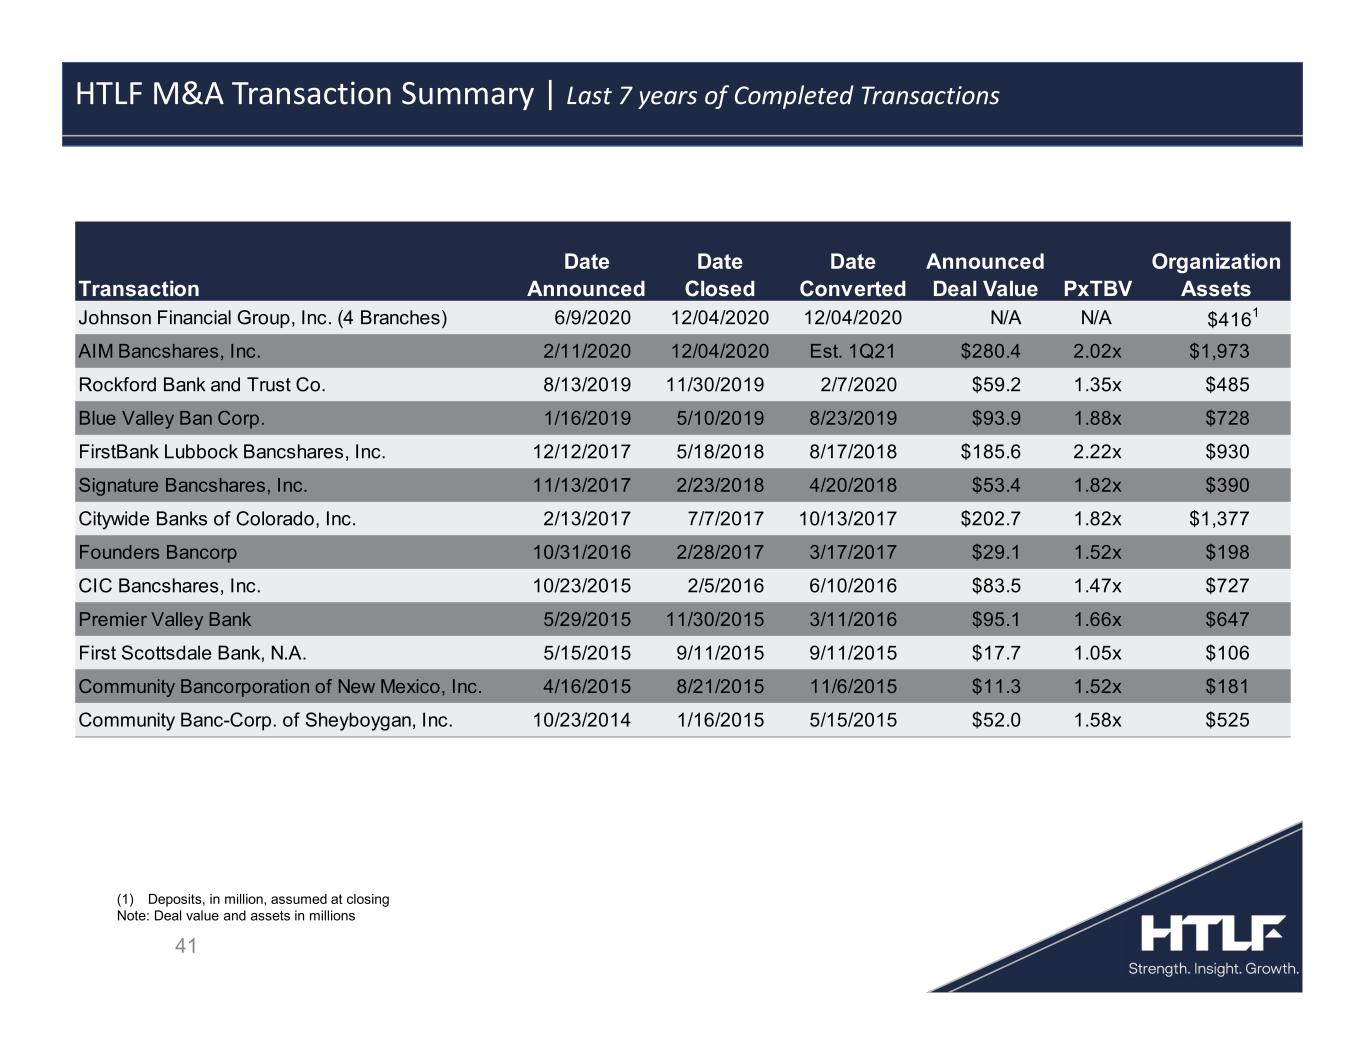
41 HTLF M&A Transaction Summary | Last 7 years of Completed Transactions (1) Deposits, in million, assumed at closing Note: Deal value and assets in millions Transaction Date Announced Date Closed Date Converted Announced Deal Value PxTBV Organization Assets Johnson Financial Group, Inc. (4 Branches) 6/9/2020 12/04/2020 12/04/2020 N/A N/A $4161 AIM Bancshares, Inc. 2/11/2020 12/04/2020 Est. 1Q21 $280.4 2.02x $1,973 Rockford Bank and Trust Co. 8/13/2019 11/30/2019 2/7/2020 $59.2 1.35x $485 Blue Valley Ban Corp. 1/16/2019 5/10/2019 8/23/2019 $93.9 1.88x $728 FirstBank Lubbock Bancshares, Inc. 12/12/2017 5/18/2018 8/17/2018 $185.6 2.22x $930 Signature Bancshares, Inc. 11/13/2017 2/23/2018 4/20/2018 $53.4 1.82x $390 Citywide Banks of Colorado, Inc. 2/13/2017 7/7/2017 10/13/2017 $202.7 1.82x $1,377 Founders Bancorp 10/31/2016 2/28/2017 3/17/2017 $29.1 1.52x $198 CIC Bancshares, Inc. 10/23/2015 2/5/2016 6/10/2016 $83.5 1.47x $727 Premier Valley Bank 5/29/2015 11/30/2015 3/11/2016 $95.1 1.66x $647 First Scottsdale Bank, N.A. 5/15/2015 9/11/2015 9/11/2015 $17.7 1.05x $106 Community Bancorporation of New Mexico, Inc. 4/16/2015 8/21/2015 11/6/2015 $11.3 1.52x $181 Community Banc-Corp. of Sheyboygan, Inc. 10/23/2014 1/16/2015 5/15/2015 $52.0 1.58x $525
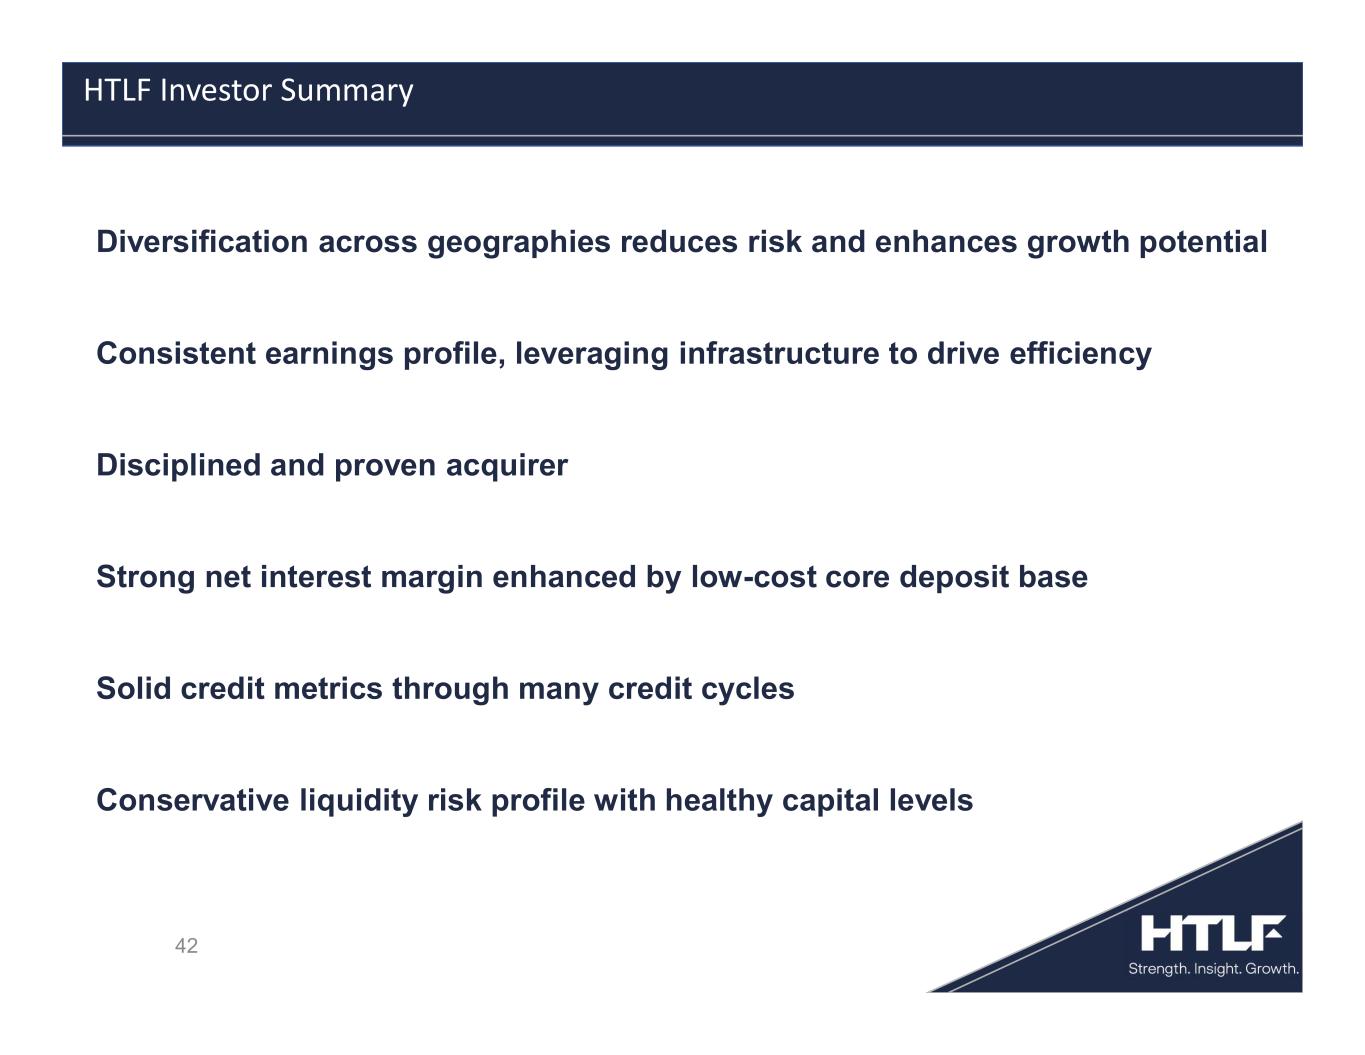
42 HTLF Investor Summary Diversification across geographies reduces risk and enhances growth potential Consistent earnings profile, leveraging infrastructure to drive efficiency Disciplined and proven acquirer Strong net interest margin enhanced by low-cost core deposit base Solid credit metrics through many credit cycles Conservative liquidity risk profile with healthy capital levels
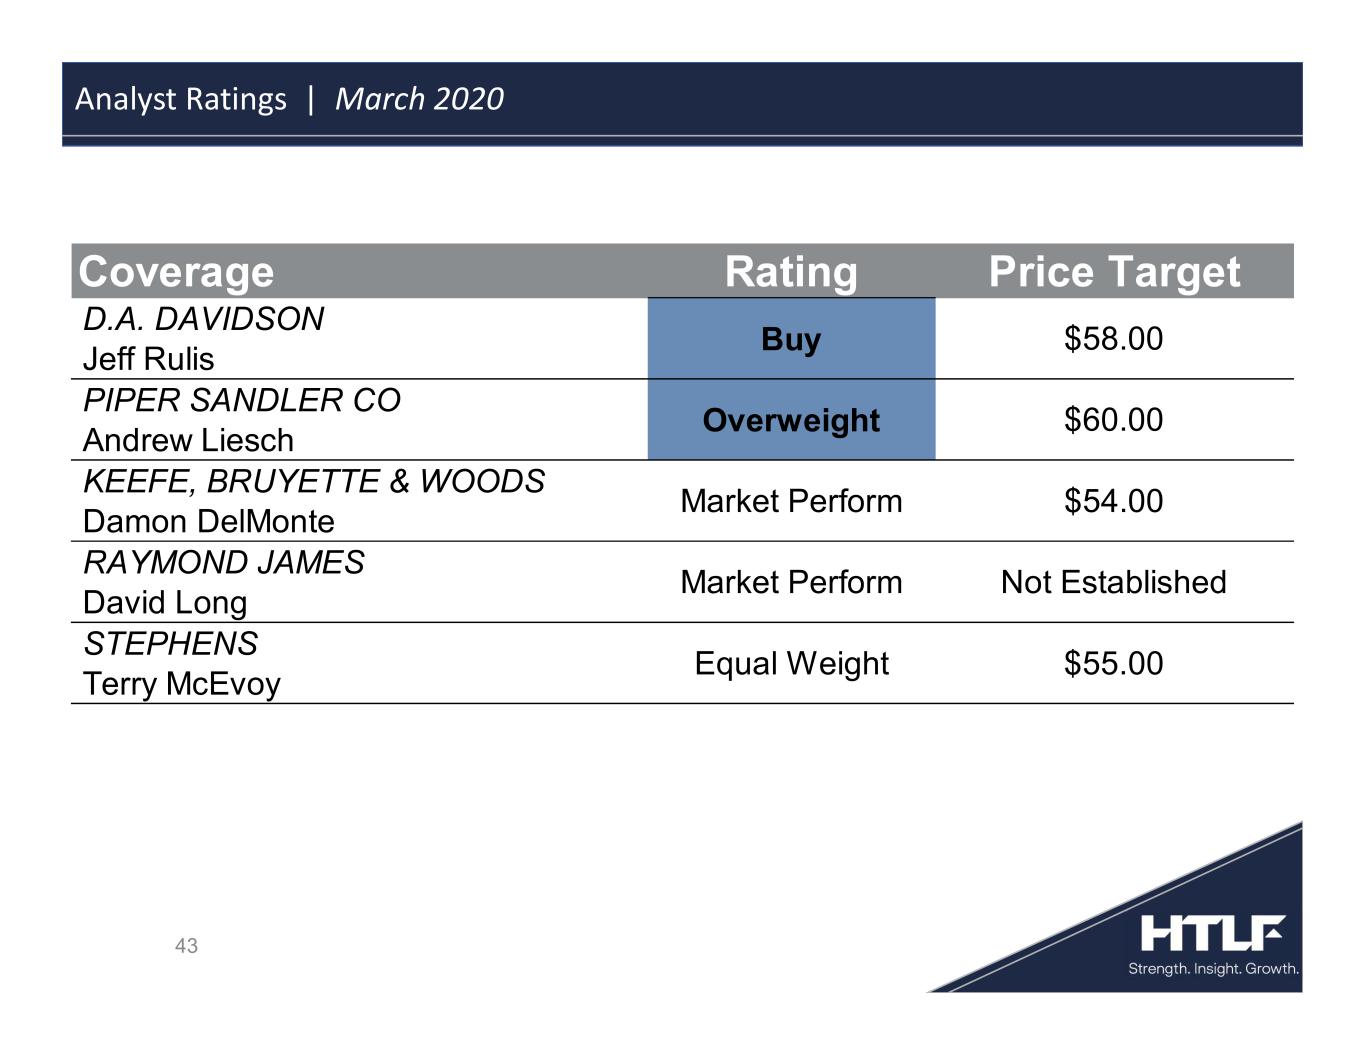
43 Analyst Ratings | March 2020 Coverage Rating Price Target D.A. DAVIDSON Jeff Rulis PIPER SANDLER CO Andrew Liesch KEEFE, BRUYETTE & WOODS Damon DelMonte RAYMOND JAMES David Long STEPHENS Terry McEvoy Market Perform Not Established Equal Weight $55.00 Buy $58.00 Overweight $60.00 Market Perform $54.00
44 Contact Information
45 Appendix
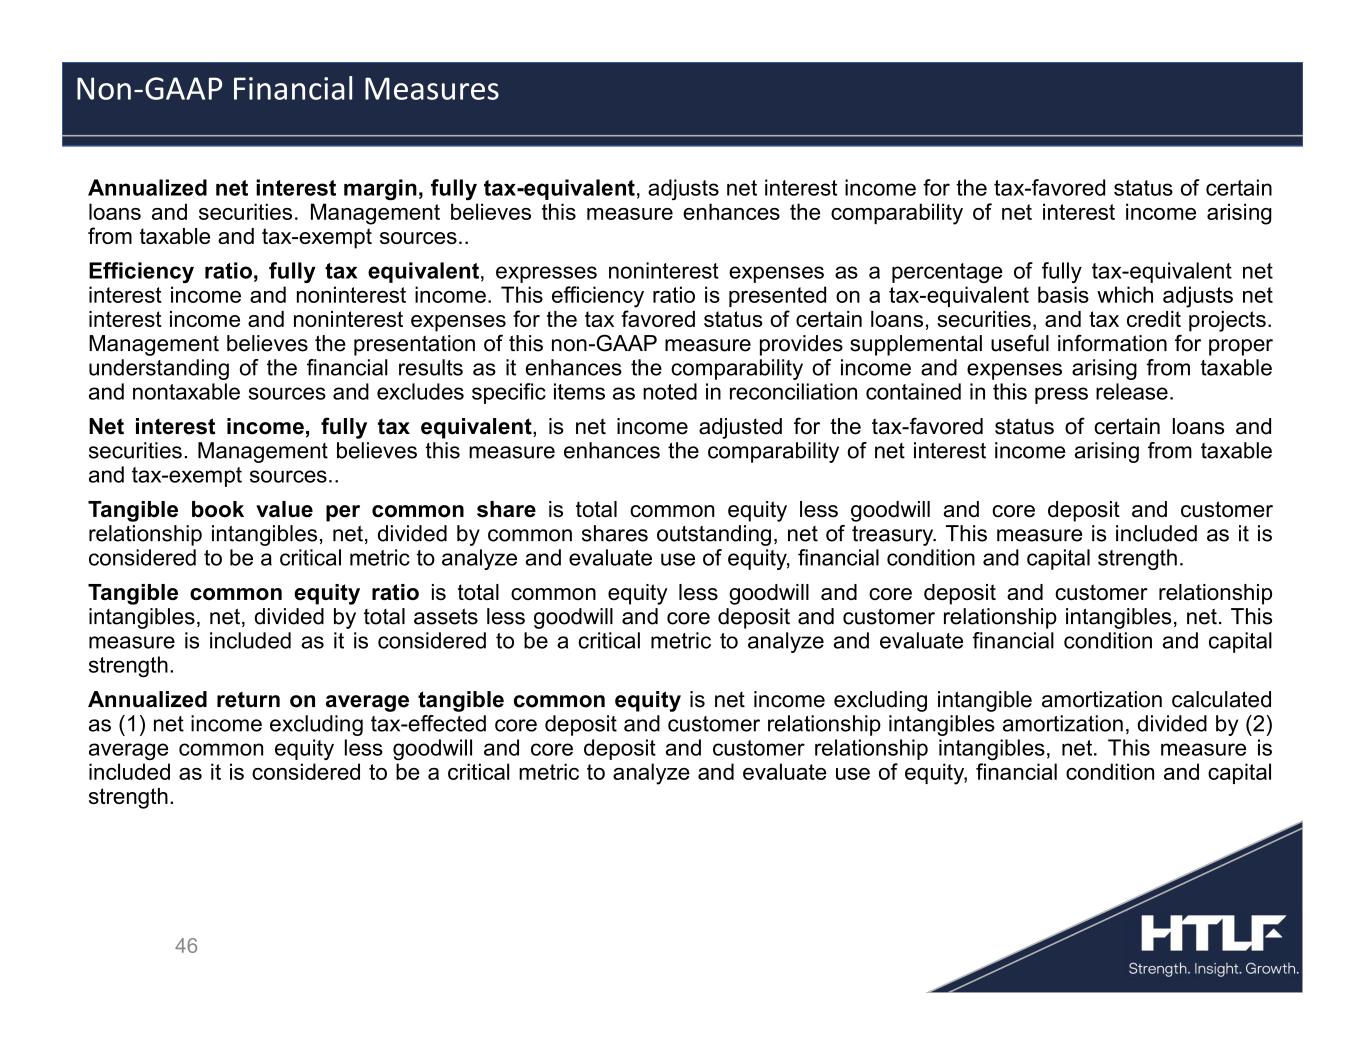
46 Annualized net interest margin, fully tax-equivalent, adjusts net interest income for the tax-favored status of certain loans and securities. Management believes this measure enhances the comparability of net interest income arising from taxable and tax-exempt sources.. Efficiency ratio, fully tax equivalent, expresses noninterest expenses as a percentage of fully tax-equivalent net interest income and noninterest income. This efficiency ratio is presented on a tax-equivalent basis which adjusts net interest income and noninterest expenses for the tax favored status of certain loans, securities, and tax credit projects. Management believes the presentation of this non-GAAP measure provides supplemental useful information for proper understanding of the financial results as it enhances the comparability of income and expenses arising from taxable and nontaxable sources and excludes specific items as noted in reconciliation contained in this press release. Net interest income, fully tax equivalent, is net income adjusted for the tax-favored status of certain loans and securities. Management believes this measure enhances the comparability of net interest income arising from taxable and tax-exempt sources.. Tangible book value per common share is total common equity less goodwill and core deposit and customer relationship intangibles, net, divided by common shares outstanding, net of treasury. This measure is included as it is considered to be a critical metric to analyze and evaluate use of equity, financial condition and capital strength. Tangible common equity ratio is total common equity less goodwill and core deposit and customer relationship intangibles, net, divided by total assets less goodwill and core deposit and customer relationship intangibles, net. This measure is included as it is considered to be a critical metric to analyze and evaluate financial condition and capital strength. Annualized return on average tangible common equity is net income excluding intangible amortization calculated as (1) net income excluding tax-effected core deposit and customer relationship intangibles amortization, divided by (2) average common equity less goodwill and core deposit and customer relationship intangibles, net. This measure is included as it is considered to be a critical metric to analyze and evaluate use of equity, financial condition and capital strength. Non-GAAP Financial Measures
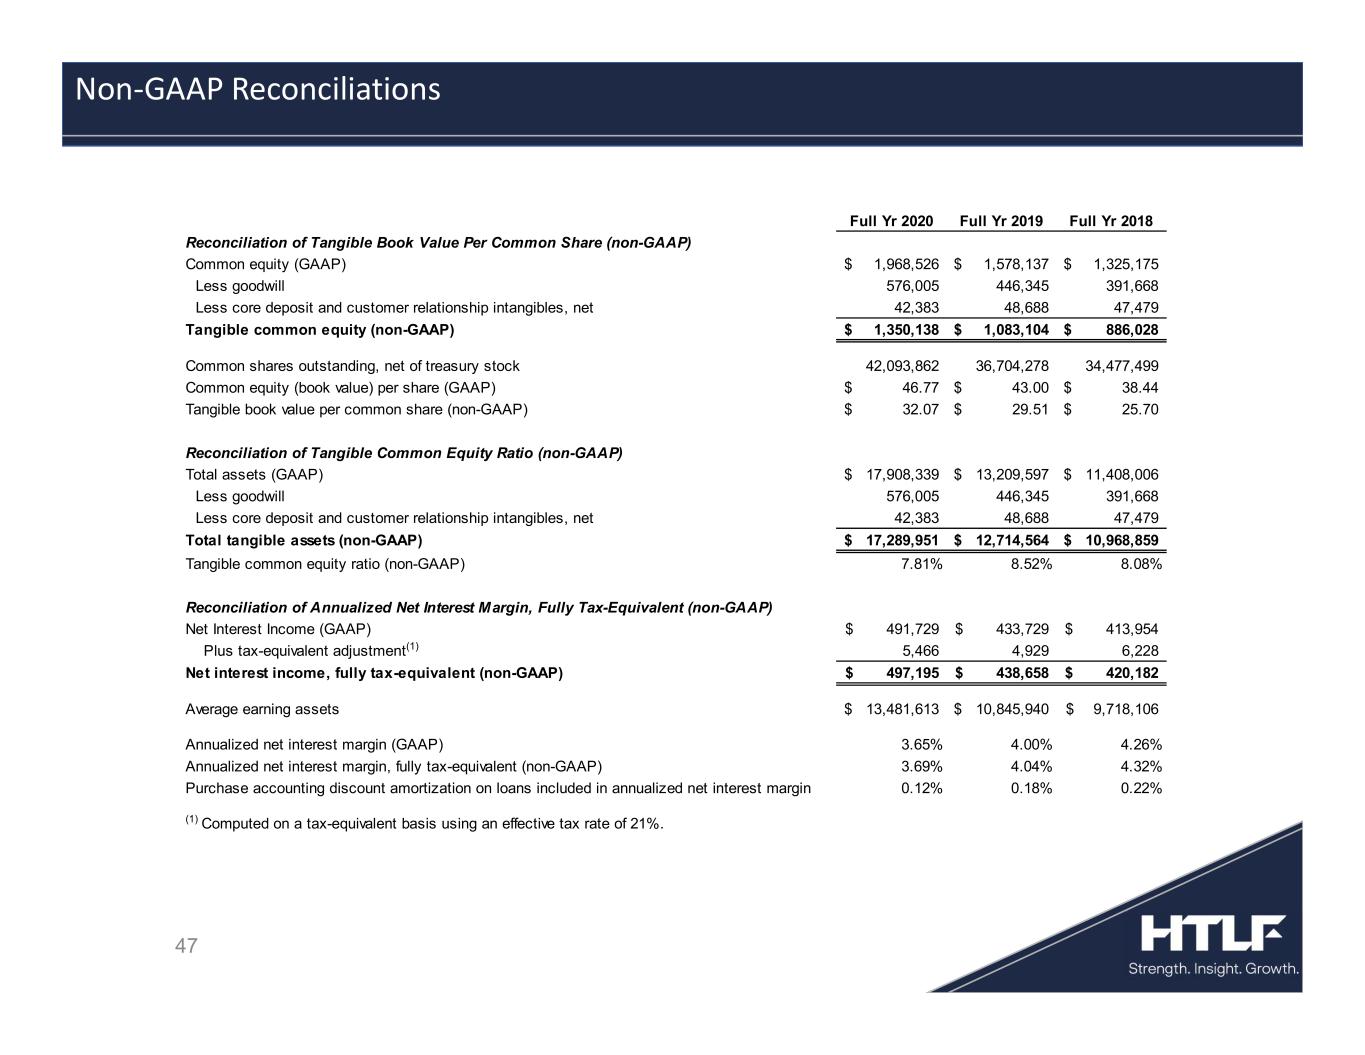
47 Non-GAAP Reconciliations Full Yr 2020 Full Yr 2019 Full Yr 2018 Reconciliation of Tangible Book Value Per Common Share (non-GAAP) Common equity (GAAP) 1,968,526$ 1,578,137$ 1,325,175$ Less goodwill 576,005 446,345 391,668 Less core deposit and customer relationship intangibles, net 42,383 48,688 47,479 Tangible common equity (non-GAAP) 1,350,138$ 1,083,104$ 886,028$ Common shares outstanding, net of treasury stock 42,093,862 36,704,278 34,477,499 Common equity (book value) per share (GAAP) 46.77$ 43.00$ 38.44$ Tangible book value per common share (non-GAAP) 32.07$ 29.51$ 25.70$ Reconciliation of Tangible Common Equity Ratio (non-GAAP) Total assets (GAAP) 17,908,339$ 13,209,597$ 11,408,006$ Less goodwill 576,005 446,345 391,668 Less core deposit and customer relationship intangibles, net 42,383 48,688 47,479 Total tangible assets (non-GAAP) 17,289,951$ 12,714,564$ 10,968,859$ Tangible common equity ratio (non-GAAP) 7.81% 8.52% 8.08% Reconciliation of Annualized Net Interest Margin, Fully Tax-Equivalent (non-GAAP) Net Interest Income (GAAP) 491,729$ 433,729$ 413,954$ Plus tax-equivalent adjustment(1) 5,466 4,929 6,228 Net interest income, fully tax-equivalent (non-GAAP) 497,195$ 438,658$ 420,182$ Average earning assets 13,481,613$ 10,845,940$ 9,718,106$ Annualized net interest margin (GAAP) 3.65% 4.00% 4.26% Annualized net interest margin, fully tax-equivalent (non-GAAP) 3.69% 4.04% 4.32% Purchase accounting discount amortization on loans included in annualized net interest margin 0.12% 0.18% 0.22% (1) Computed on a tax-equivalent basis using an effective tax rate of 21%.
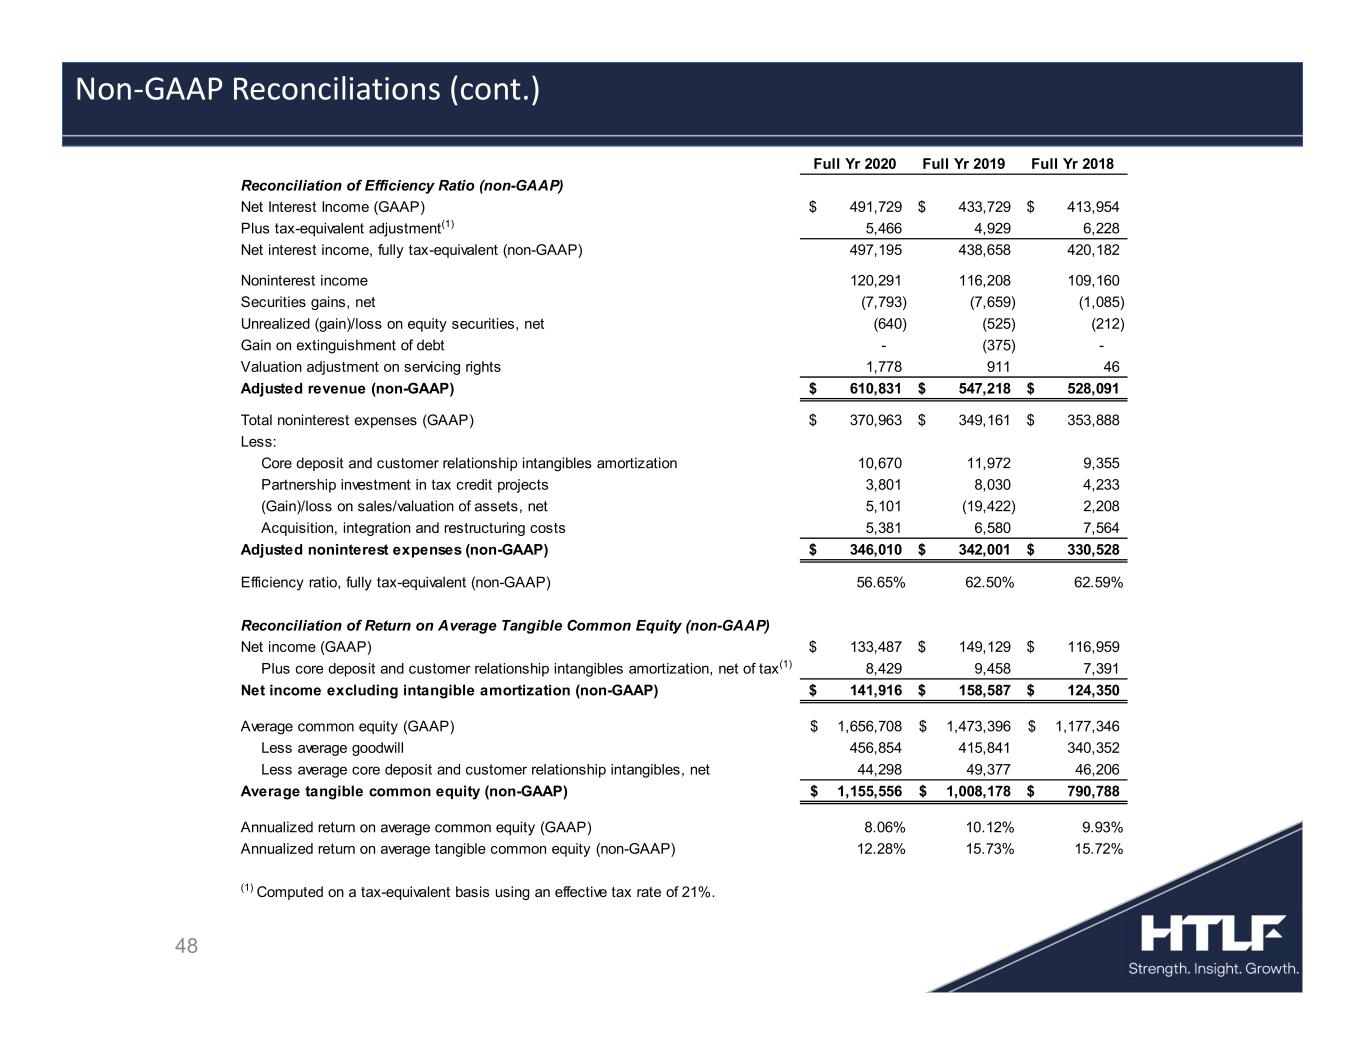
48 Non-GAAP Reconciliations (cont.) Full Yr 2020 Full Yr 2019 Full Yr 2018 Reconciliation of Efficiency Ratio (non-GAAP) Net Interest Income (GAAP) 491,729$ 433,729$ 413,954$ Plus tax-equivalent adjustment(1) 5,466 4,929 6,228 Net interest income, fully tax-equivalent (non-GAAP) 497,195 438,658 420,182 Noninterest income 120,291 116,208 109,160 Securities gains, net (7,793) (7,659) (1,085) Unrealized (gain)/loss on equity securities, net (640) (525) (212) Gain on extinguishment of debt - (375) - Valuation adjustment on servicing rights 1,778 911 46 Adjusted revenue (non-GAAP) 610,831$ 547,218$ 528,091$ Total noninterest expenses (GAAP) 370,963$ 349,161$ 353,888$ Less: Core deposit and customer relationship intangibles amortization 10,670 11,972 9,355 Partnership investment in tax credit projects 3,801 8,030 4,233 (Gain)/loss on sales/valuation of assets, net 5,101 (19,422) 2,208 Acquisition, integration and restructuring costs 5,381 6,580 7,564 Adjusted noninterest expenses (non-GAAP) 346,010$ 342,001$ 330,528$ Efficiency ratio, fully tax-equivalent (non-GAAP) 56.65% 62.50% 62.59% Reconciliation of Return on Average Tangible Common Equity (non-GAAP) Net income (GAAP) 133,487$ 149,129$ 116,959$ Plus core deposit and customer relationship intangibles amortization, net of tax(1) 8,429 9,458 7,391 Net income excluding intangible amortization (non-GAAP) 141,916$ 158,587$ 124,350$ Average common equity (GAAP) 1,656,708$ 1,473,396$ 1,177,346$ Less average goodwill 456,854 415,841 340,352 Less average core deposit and customer relationship intangibles, net 44,298 49,377 46,206 Average tangible common equity (non-GAAP) 1,155,556$ 1,008,178$ 790,788$ Annualized return on average common equity (GAAP) 8.06% 10.12% 9.93% Annualized return on average tangible common equity (non-GAAP) 12.28% 15.73% 15.72% (1) Computed on a tax-equivalent basis using an effective tax rate of 21%.
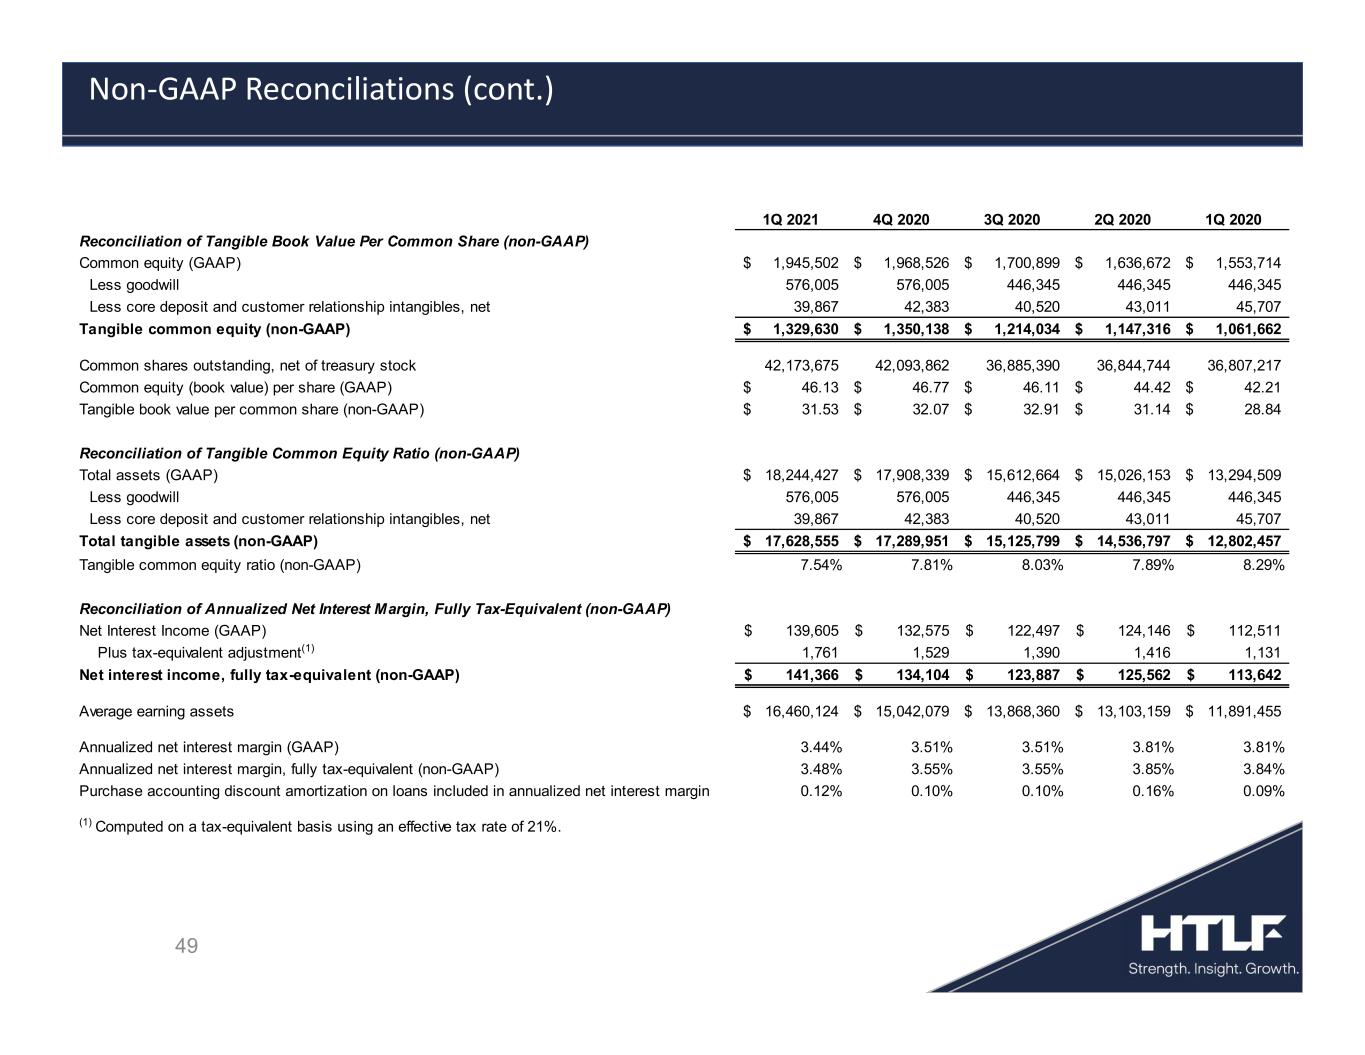
49 Non-GAAP Reconciliations (cont.) 1Q 2021 4Q 2020 3Q 2020 2Q 2020 1Q 2020 Reconciliation of Tangible Book Value Per Common Share (non-GAAP) Common equity (GAAP) 1,945,502$ 1,968,526$ 1,700,899$ 1,636,672$ 1,553,714$ Less goodwill 576,005 576,005 446,345 446,345 446,345 Less core deposit and customer relationship intangibles, net 39,867 42,383 40,520 43,011 45,707 Tangible common equity (non-GAAP) 1,329,630$ 1,350,138$ 1,214,034$ 1,147,316$ 1,061,662$ Common shares outstanding, net of treasury stock 42,173,675 42,093,862 36,885,390 36,844,744 36,807,217 Common equity (book value) per share (GAAP) 46.13$ 46.77$ 46.11$ 44.42$ 42.21$ Tangible book value per common share (non-GAAP) 31.53$ 32.07$ 32.91$ 31.14$ 28.84$ Reconciliation of Tangible Common Equity Ratio (non-GAAP) Total assets (GAAP) 18,244,427$ 17,908,339$ 15,612,664$ 15,026,153$ 13,294,509$ Less goodwill 576,005 576,005 446,345 446,345 446,345 Less core deposit and customer relationship intangibles, net 39,867 42,383 40,520 43,011 45,707 Total tangible assets (non-GAAP) 17,628,555$ 17,289,951$ 15,125,799$ 14,536,797$ 12,802,457$ Tangible common equity ratio (non-GAAP) 7.54% 7.81% 8.03% 7.89% 8.29% Reconciliation of Annualized Net Interest Margin, Fully Tax-Equivalent (non-GAAP) Net Interest Income (GAAP) 139,605$ 132,575$ 122,497$ 124,146$ 112,511$ Plus tax-equivalent adjustment(1) 1,761 1,529 1,390 1,416 1,131 Net interest income, fully tax-equivalent (non-GAAP) 141,366$ 134,104$ 123,887$ 125,562$ 113,642$ Average earning assets 16,460,124$ 15,042,079$ 13,868,360$ 13,103,159$ 11,891,455$ Annualized net interest margin (GAAP) 3.44% 3.51% 3.51% 3.81% 3.81% Annualized net interest margin, fully tax-equivalent (non-GAAP) 3.48% 3.55% 3.55% 3.85% 3.84% Purchase accounting discount amortization on loans included in annualized net interest margin 0.12% 0.10% 0.10% 0.16% 0.09% (1) Computed on a tax-equivalent basis using an effective tax rate of 21%.
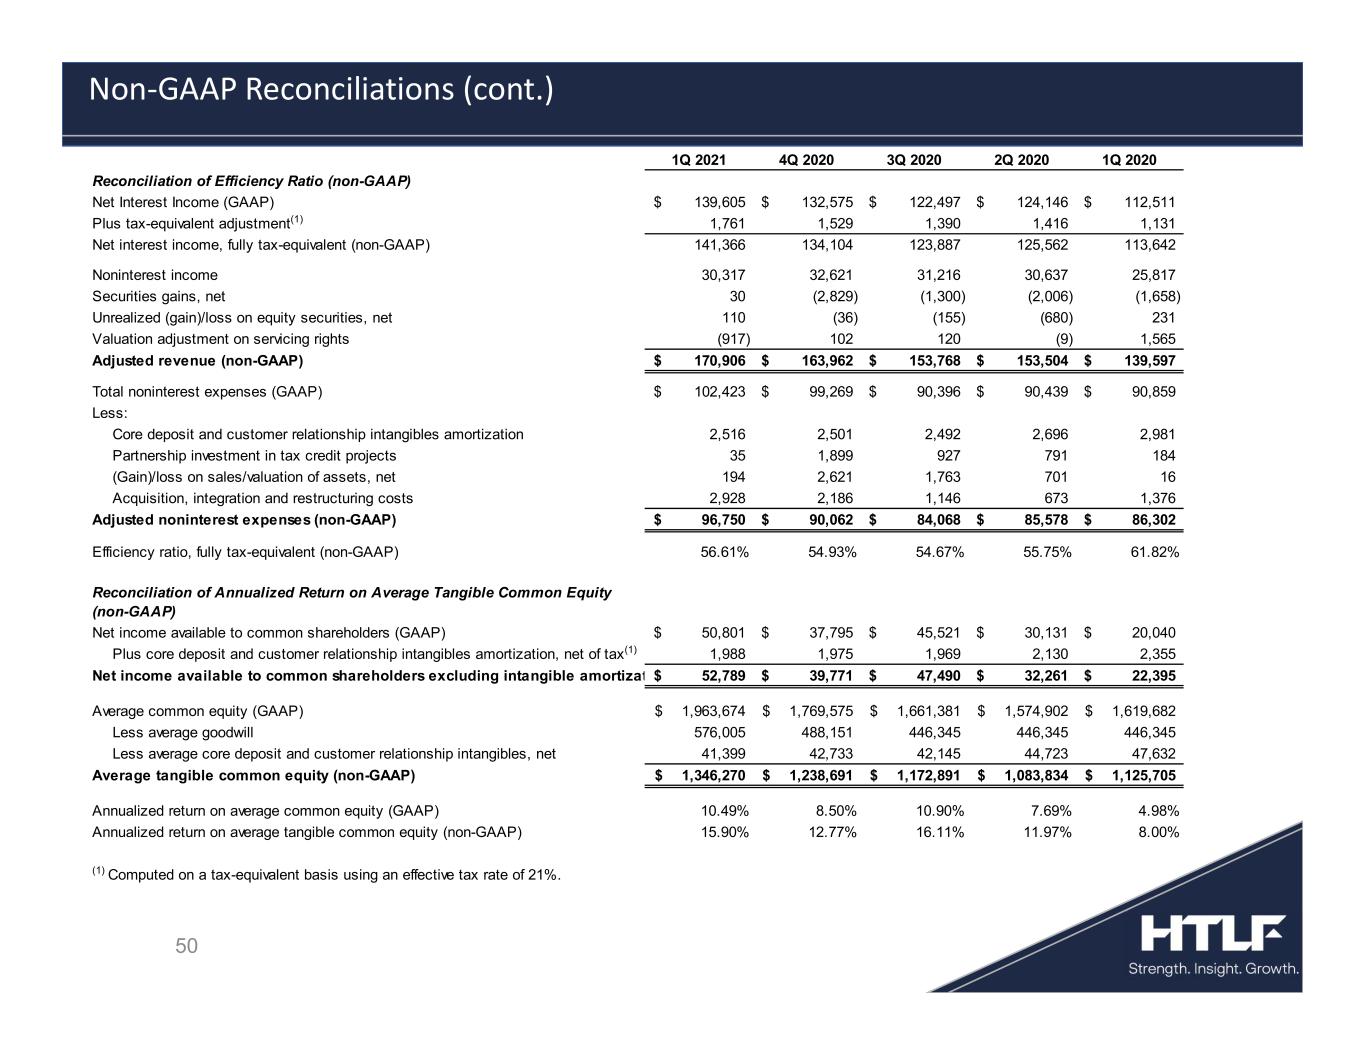
50 Non-GAAP Reconciliations (cont.) 1Q 2021 4Q 2020 3Q 2020 2Q 2020 1Q 2020 Reconciliation of Efficiency Ratio (non-GAAP) Net Interest Income (GAAP) 139,605$ 132,575$ 122,497$ 124,146$ 112,511$ Plus tax-equivalent adjustment(1) 1,761 1,529 1,390 1,416 1,131 Net interest income, fully tax-equivalent (non-GAAP) 141,366 134,104 123,887 125,562 113,642 Noninterest income 30,317 32,621 31,216 30,637 25,817 Securities gains, net 30 (2,829) (1,300) (2,006) (1,658) Unrealized (gain)/loss on equity securities, net 110 (36) (155) (680) 231 Valuation adjustment on servicing rights (917) 102 120 (9) 1,565 Adjusted revenue (non-GAAP) 170,906$ 163,962$ 153,768$ 153,504$ 139,597$ Total noninterest expenses (GAAP) 102,423$ 99,269$ 90,396$ 90,439$ 90,859$ Less: Core deposit and customer relationship intangibles amortization 2,516 2,501 2,492 2,696 2,981 Partnership investment in tax credit projects 35 1,899 927 791 184 (Gain)/loss on sales/valuation of assets, net 194 2,621 1,763 701 16 Acquisition, integration and restructuring costs 2,928 2,186 1,146 673 1,376 Adjusted noninterest expenses (non-GAAP) 96,750$ 90,062$ 84,068$ 85,578$ 86,302$ Efficiency ratio, fully tax-equivalent (non-GAAP) 56.61% 54.93% 54.67% 55.75% 61.82% Reconciliation of Annualized Return on Average Tangible Common Equity (non-GAAP) Net income available to common shareholders (GAAP) 50,801$ 37,795$ 45,521$ 30,131$ 20,040$ Plus core deposit and customer relationship intangibles amortization, net of tax(1) 1,988 1,975 1,969 2,130 2,355 Net income available to common shareholders excluding intangible amortization (non-GAAP)52,789$ 39,771$ 47,490$ 32,261$ 22,395$ Average common equity (GAAP) 1,963,674$ 1,769,575$ 1,661,381$ 1,574,902$ 1,619,682$ Less average goodwill 576,005 488,151 446,345 446,345 446,345 Less average core deposit and customer relationship intangibles, net 41,399 42,733 42,145 44,723 47,632 Average tangible common equity (non-GAAP) 1,346,270$ 1,238,691$ 1,172,891$ 1,083,834$ 1,125,705$ Annualized return on average common equity (GAAP) 10.49% 8.50% 10.90% 7.69% 4.98% Annualized return on average tangible common equity (non-GAAP) 15.90% 12.77% 16.11% 11.97% 8.00% (1) Computed on a tax-equivalent basis using an effective tax rate of 21%.
