Attached files
| file | filename |
|---|---|
| 8-K - 8-K - S&T BANCORP INC | stba-20210419.htm |
| EX-99.3 - EX-99.3 - S&T BANCORP INC | stba-2021x3x31divxex993.htm |
| EX-99.1 - EX-99.1 - S&T BANCORP INC | stba-20210331xex991.htm |
MEMBER FDIC First Quarter 2021 Earnings Supplement

2 Forward Looking Statements and Risk Factors This information contains or incorporates statements that we believe are “forward-looking statements” within the meaning of the Private Securities Litigation Reform Act of 1995. Forward-looking statements generally relate to our financial condition, results of operations, plans, objectives, outlook for earnings, revenues, expenses, capital and liquidity levels and ratios, asset levels, asset quality, financial position, and other matters regarding or affecting S&T and its future business and operations. Forward-looking statements are typically identified by words or phrases such as “will likely result”, “expect”, “anticipate”, “estimate”, “forecast”, “project”, “intend”, “ believe”, “assume”, “strategy”, “trend”, “plan”, “outlook”, “outcome”, “continue”, “remain”, “potential”, “opportunity”, “comfortable”, “current”, “position”, “maintain”, “sustain”, “seek”, “achieve” and variations of such words and similar expressions, or future or conditional verbs such as will, would, should, could or may. Although we believe the assumptions upon which these forward-looking statements are based are reasonable, any of these assumptions could prove to be inaccurate and the forward-looking statements based on these assumptions could be incorrect. The matters discussed in these forward-looking statements are subject to various risks, uncertainties and other factors that could cause actual results and trends to differ materially from those made, projected, or implied in or by the forward-looking statements depending on a variety of uncertainties or other factors including, but not limited to: credit losses and the credit risk of our commercial and consumer loan products; changes in the level of charge-offs and changes in estimates of the adequacy of the allowance for credit losses; cyber-security concerns; rapid technological developments and changes; operational risks or risk management failures by us or critical third parties, including fraud risk; our ability to manage our reputational risks; sensitivity to the interest rate environment including a prolonged period of low interest rates, a rapid increase in interest rates or a change in the shape of the yield curve; a change in spreads on interest-earning assets and interest-bearing liabilities; the transition from LIBOR as a reference rate; regulatory supervision and oversight, including changes in regulatory capital requirements and our ability to address those requirements; unanticipated changes in our liquidity position; changes in accounting policies, practices, or guidance, for example, our adoption of CECL; legislation affecting the financial services industry as a whole, and S&T, in particular; the outcome of pending and future litigation and governmental proceedings; increasing price and product/service competition; the ability to continue to introduce competitive new products and services on a timely, cost-effective basis; managing our internal growth and acquisitions; the possibility that the anticipated benefits from acquisitions, including DNB, cannot be fully realized in a timely manner or at all, or that integrating the acquired operations will be more difficult, disruptive or costly than anticipated; containing costs and expenses; reliance on significant customer relationships; an interruption or cessation of an important service by a third-party provider; our ability to attract and retain talented executives and employees; our ability to successfully manage our CEO transition; general economic or business conditions, including the strength of regional economic conditions in our market area; the duration and severity of the coronavirus (“COVID-19”) pandemic, both in our principal area of operations and nationally, including the ultimate impact of the pandemic on the economy generally and on our operations; our participation in the Paycheck Protection Program; deterioration of the housing market and reduced demand for mortgages; deterioration in the overall macroeconomic conditions or the state of the banking industry that could warrant further analysis of the carrying value of goodwill and could result in an adjustment to its carrying value resulting in a non-cash charge to net income; the stability of our core deposit base and access to contingency funding; re-emergence of turbulence in significant portions of the global financial and real estate markets that could impact our performance, both directly, by affecting our revenues and the value of our assets and liabilities, and indirectly, by affecting the economy generally and access to capital in the amounts, at the times and on the terms required to support our future businesses. Many of these factors, as well as other factors, are described in our Annual Report on Form 10-K for the year ended December 31, 2020, including Part I, Item 1A-"Risk Factors" and any of our subsequent filings with the SEC. Forward-looking statements are based on beliefs and assumptions using information available at the time the statements are made. We caution you not to unduly rely on forward-looking statements because the assumptions, beliefs, expectations and projections about future events may, and often do, differ materially from actual results. Any forward-looking statement speaks only as to the date on which it is made, and we undertake no obligation to update any forward-looking statement to reflect developments occurring after the statement is made. Non-GAAP Financial Measures In addition to the results of operations presented in accordance with Generally Accepted Accounting Principles (GAAP), S&T management uses and this presentation contains or references certain non-GAAP financial measures, such as net interest income on a fully taxable equivalent basis. S&T believes these financial measures provide information useful to investors in understanding our operational performance and business and performance trends which facilitate comparisons with the performance of others in the financial services industry. Although S&T believes that these non-GAAP financial measures enhance investors’ understanding of S&T’s business and performance, these non-GAAP financial measures should not be considered an alternative to GAAP. The non-GAAP financial measures contained therein should be read in conjunction with the audited financial statements and analysis as presented in the Annual Report on Form 10-K as well as the unaudited financial statements and analyses as presented in the respective Quarterly Reports in Exhibit 99.1 of Form 8-K for S&T Bancorp, Inc. and subsidiaries.
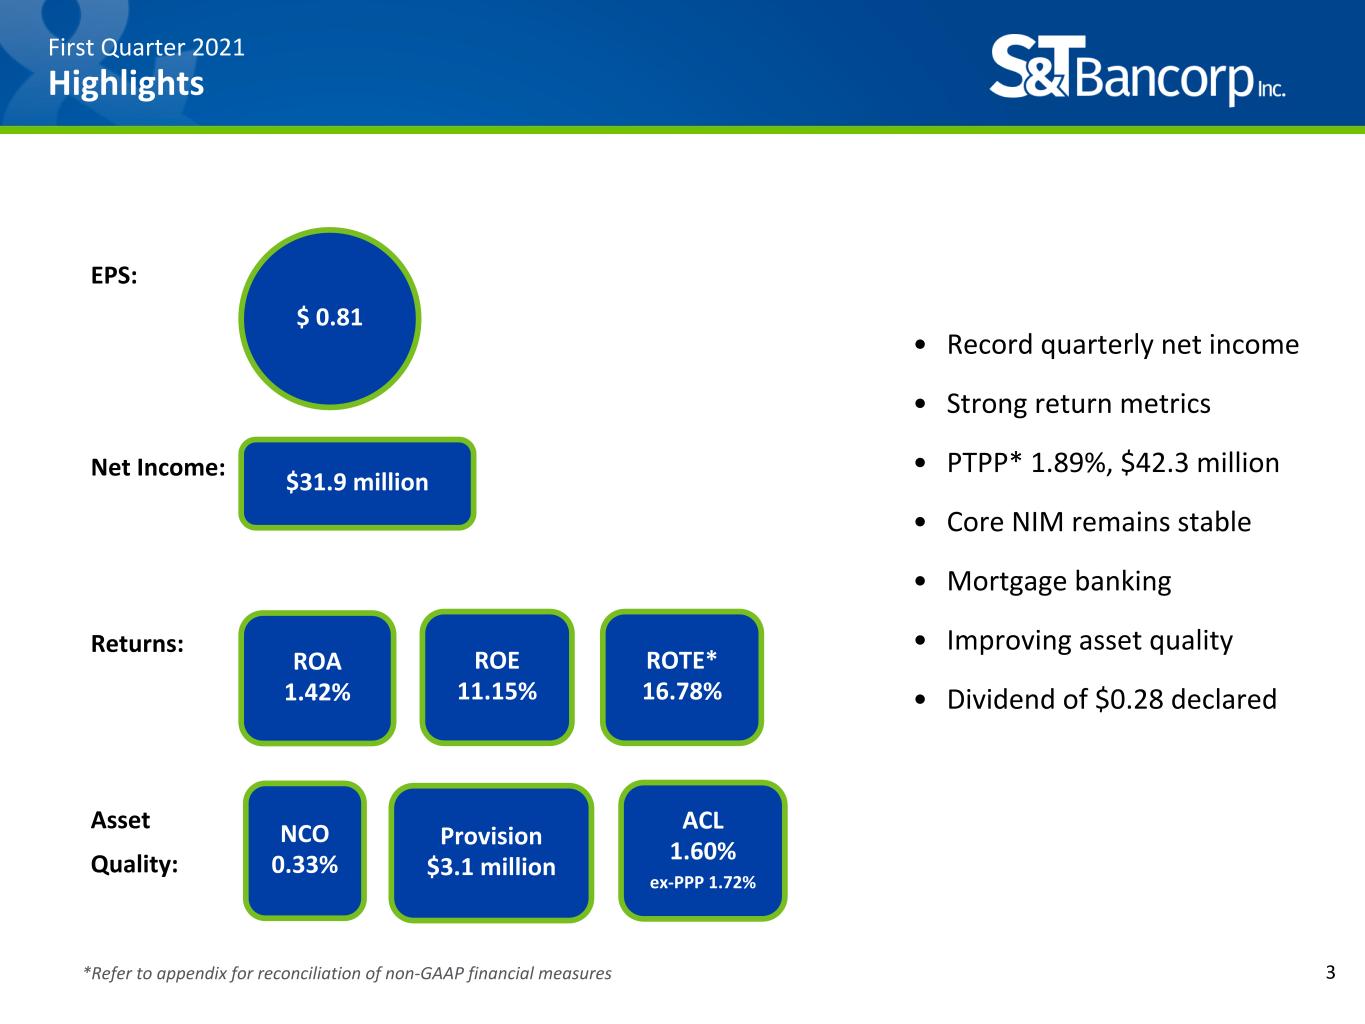
*Refer to appendix for reconciliation of non-GAAP financial measures 3 First Quarter 2021 Highlights EPS: Net Income: Returns: Asset Quality: $ 0.81 ROTE* 16.78% ROE 11.15% ROA 1.42% $31.9 million Provision $3.1 million ACL 1.60% ex-PPP 1.72% NCO 0.33% • Record quarterly net income • Strong return metrics • PTPP* 1.89%, $42.3 million • Core NIM remains stable • Mortgage banking • Improving asset quality • Dividend of $0.28 declared
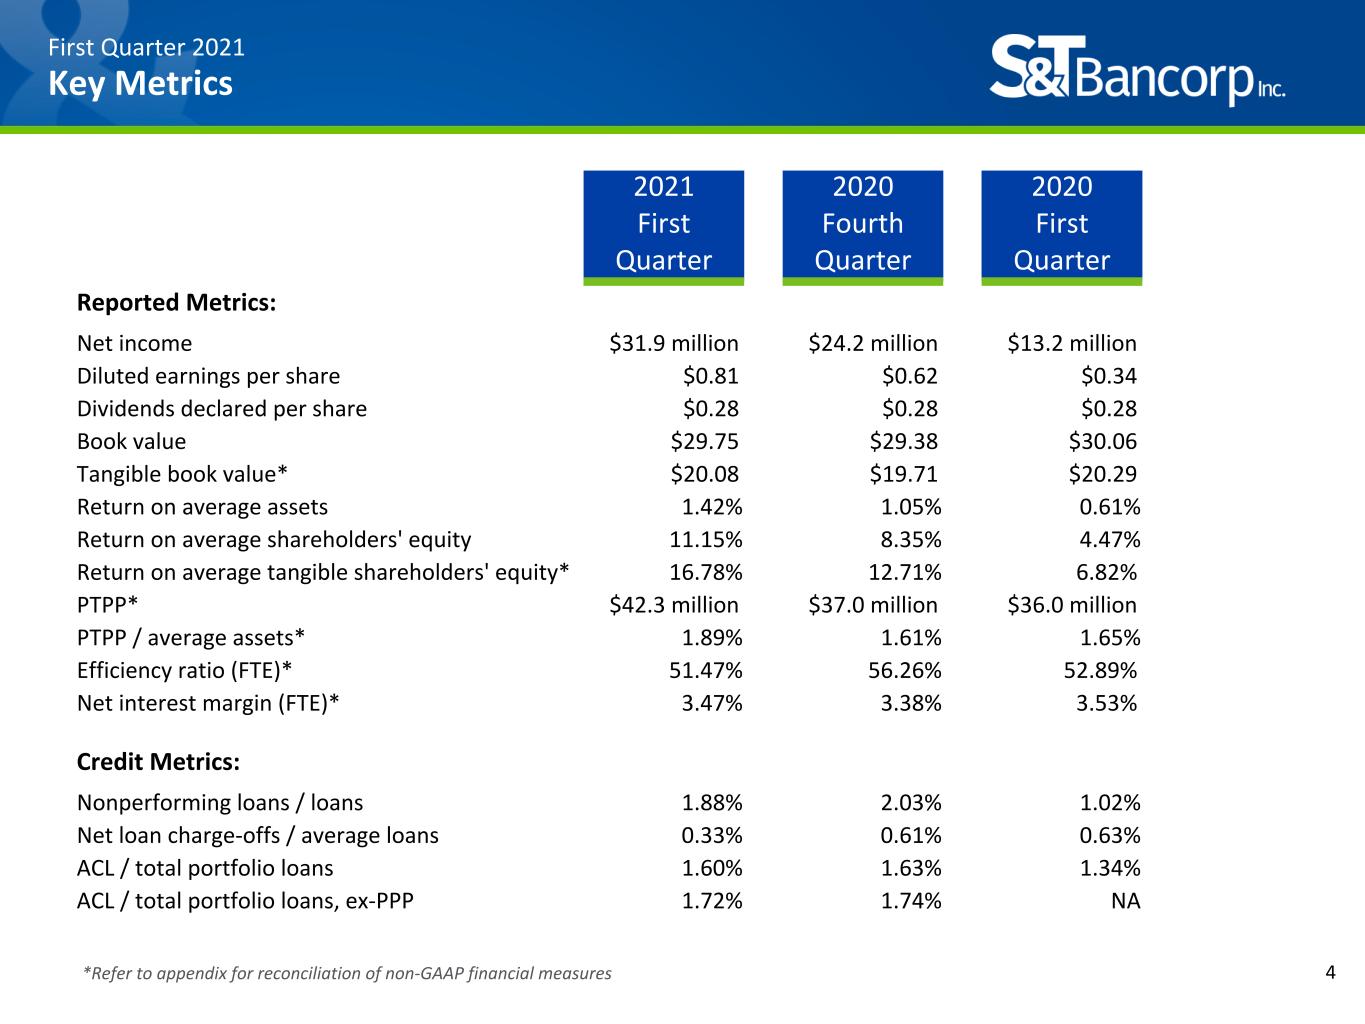
*Refer to appendix for reconciliation of non-GAAP financial measures 4 First Quarter 2021 Key Metrics 2021 2020 2020 First Fourth First Quarter Quarter Quarter Reported Metrics: Net income $31.9 million $24.2 million $13.2 million Diluted earnings per share $0.81 $0.62 $0.34 Dividends declared per share $0.28 $0.28 $0.28 Book value $29.75 $29.38 $30.06 Tangible book value* $20.08 $19.71 $20.29 Return on average assets 1.42 % 1.05 % 0.61 % Return on average shareholders' equity 11.15 % 8.35 % 4.47% Return on average tangible shareholders' equity* 16.78 % 12.71 % 6.82% PTPP* $42.3 million $37.0 million $36.0 million PTPP / average assets* 1.89 % 1.61 % 1.65% Efficiency ratio (FTE)* 51.47 % 56.26 % 52.89% Net interest margin (FTE)* 3.47 % 3.38 % 3.53% Credit Metrics: Nonperforming loans / loans 1.88 % 2.03 % 1.02 % Net loan charge-offs / average loans 0.33 % 0.61 % 0.63 % ACL / total portfolio loans 1.60 % 1.63 % 1.34 % ACL / total portfolio loans, ex-PPP 1.72 % 1.74 % NA

Ratios as of March 31, 2021 $ in millions *Refer to appendix for reconciliation of non-GAAP financial measures 5 First Quarter 2021 SBA PPP 44% of our round 1 PPP loans have been forgiven and we booked $190 million in round 2: Date Round 1 Balance % Forgiven September 30, 2020 $550 December 31, 2020 465 15 % March 31, 2021 309 44 % PPP loans impacted selected ratios as below: Ratio Excluding PPP Including PPP Impact Net Interest Margin 3.37 % 3.47 % 0.10 % ACL / total portfolio loans 1.72 % 1.60 % (0.12) % Nonperforming loans / loans 2.02 % 1.88 % (0.14) % TCE / TA* 9.33 % 8.81 % (0.52) % Leverage Ratio 10.24 % 9.71 % (0.53) %
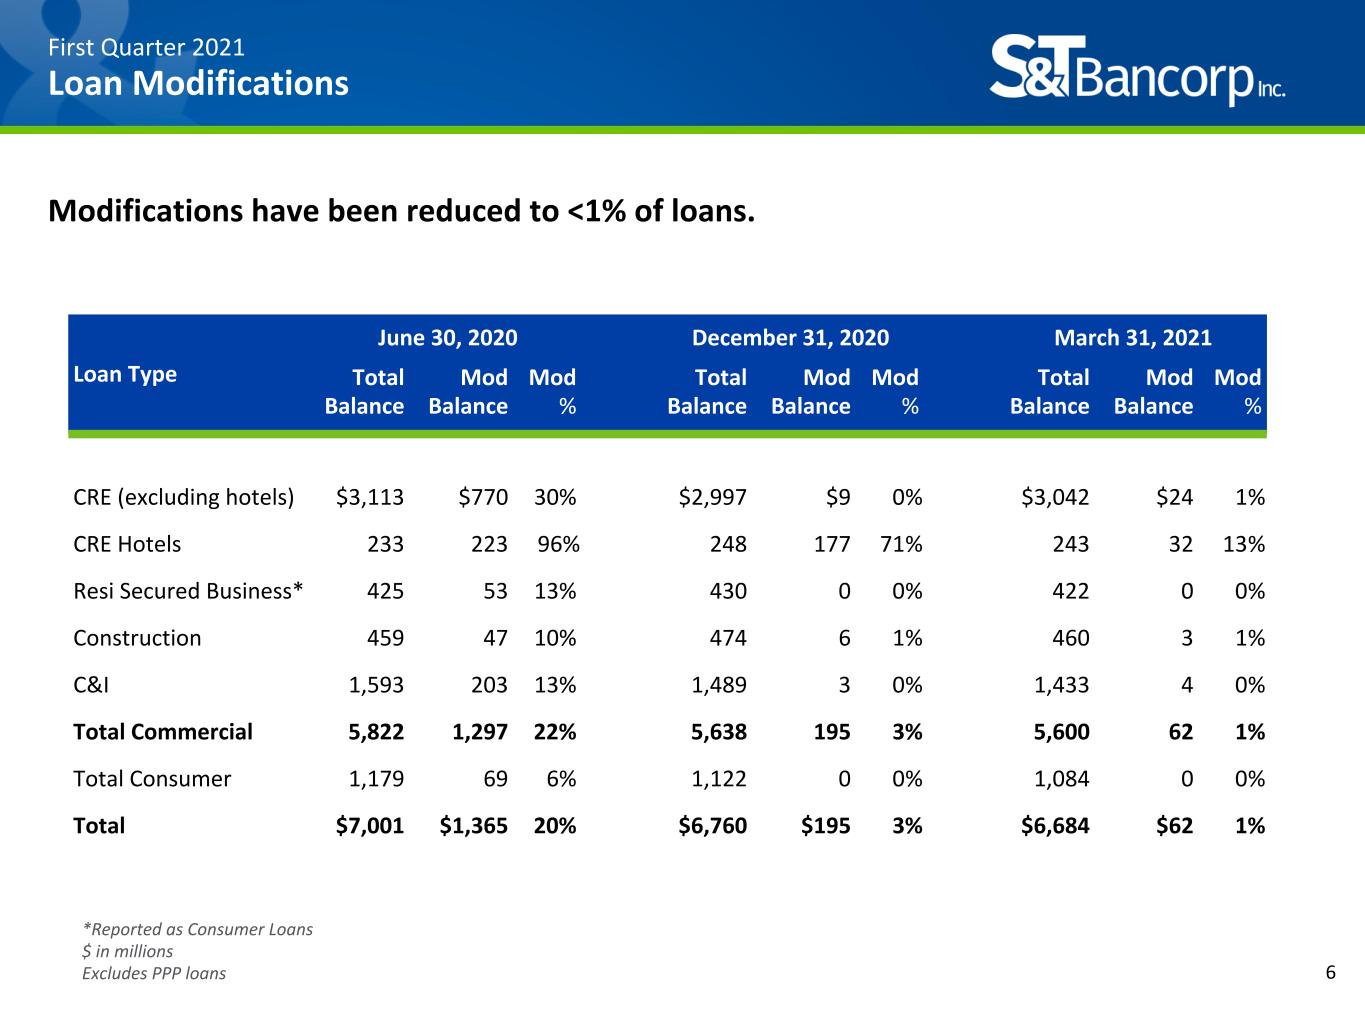
*Reported as Consumer Loans $ in millions Excludes PPP loans 6 First Quarter 2021 Loan Modifications Modifications have been reduced to <1% of loans. Loan Type June 30, 2020 December 31, 2020 March 31, 2021 Total Balance Mod Balance Mod % Total Balance Mod Balance Mod % Total Balance Mod Balance Mod % CRE (excluding hotels) $3,113 $770 30% $2,997 $9 0 % $3,042 $24 1 % CRE Hotels 233 223 96 % 248 177 71 % 243 32 13 % Resi Secured Business* 425 53 13% 430 0 0 % 422 0 0 % Construction 459 47 10% 474 6 1 % 460 3 1 % C&I 1,593 203 13% 1,489 3 0 % 1,433 4 0 % Total Commercial 5,822 1,297 22% 5,638 195 3 % 5,600 62 1 % Total Consumer 1,179 69 6% 1,122 0 0 % 1,084 0 0 % Total $7,001 $1,365 20% $6,760 $195 3 % $6,684 $62 1 %

Data as of March 31, 2021 $ in millions 7 First Quarter 2021 Net Interest Income Core NIM remains stable: • Our ex-PPP NIM improved 2 bps from 4Q20 to 1Q21 • PPP loans contributed $5.8 million to our NII and 0.10% to our NIM in 1Q21 • We have improved our funding mix by reducing our higher-costing deposits We are proactively managing our interest-bearing deposit costs:

Data as of March 31, 2021 $ in millions *Refer to appendix for reconciliation of non-GAAP financial measures 8 First Quarter 2021 Capital We have strong capital levels and are well-positioned for growth: PPP loans impacted selected ratios as below: Ratio Excluding PPP Including PPP Impact Leverage Ratio 10.24 % 9.71 % (0.53) % TCE / TA* 9.33 % 8.81 % (0.52) %

9 2021 2020 2020 First Quarter Fourth Quarter First Quarter Tangible Book Value (non-GAAP) Total shareholders' equity $1,168,278 $1,154,711 $1,176,251 Less: goodwill and other intangible assets, net of deferred tax liability (379,911) (380,278) (382,397) Tangible common equity (non-GAAP) $788,367 $774,434 $793,854 Common shares outstanding 39,268 39,298 39,125 Tangible book value (non-GAAP) $20.08 $19.71 $20.29 Return on Average Tangible Shareholders' Equity (non-GAAP) Net income (annualized) $129,378 $96,181 $53,216 Plus: amortization of intangibles (annualized), net of tax 1,464 1,853 2,008 Net income before amortization of intangibles (annualized) $130,842 $98,034 $55,224 Average total shareholders' equity $1,160,113 $1,151,933 $1,189,575 Less: average goodwill and other intangible assets, net of deferred tax liability (380,144) (380,734) (379,790) Average tangible equity (non-GAAP) $779,969 $771,199 $809,785 Return on average tangible shareholders' equity (non-GAAP) 16.78% 12.71% 6.82% PTPP / Average Assets (non-GAAP) Income before taxes $39,178 $29,880 $15,998 Plus: Provision for credit losses 3,137 7,130 20,050 Total 42,315 37,010 36,048 Total (annualized) (non-GAAP) $171,611 $147,235 $144,984 Average assets $9,080,532 $9,124,059 $8,767,326 PTPP / Average Assets (non-GAAP) 1.89% 1.61% 1.65% Definitions and Reconciliation of GAAP to Non-GAAP Financial Measures: Fourth Quarter 2020 Appendix

10 2021 2020 2020 First Quarter Fourth Quarter First Quarter Efficiency Ratio (non-GAAP) Noninterest expense $45,580 $48,528 $46,391 Less: merger related expenses — — (2,342) Noninterest expense excluding nonrecurring items $45,580 $48,528 $44,049 Net interest income per consolidated statements of net income $70,659 $69,929 $70,036 Plus: taxable equivalent adjustment 664 725 849 Net interest income (FTE) (non-GAAP) 71,323 70,654 70,885 Noninterest income 17,236 15,609 12,403 Less: net (gains)losses on sale of securities — — — Net interest income (FTE) (non-GAAP) plus noninterest income $88,559 $86,263 $83,288 Efficiency ratio (non-GAAP) 51.47% 56.26% 52.89% Tangible Common Equity / Tangible Assets (non-GAAP) Total shareholders' equity $1,168,278 $1,154,711 $1,176,251 Less: goodwill and other intangible assets, net of deferred tax liability (379,911) (380,278) (382,397) Tangible common equity (non-GAAP) $788,367 $774,434 $793,854 Total assets $9,328,979 $8,967,896 $9,005,497 Less: goodwill and other intangible assets, net of deferred tax liability (379,911) (380,278) (382,397) Tangible assets (non-GAAP) $8,949,068 $8,587,618 $8,623,100 Tangible common equity to tangible assets (non-GAAP) 8.81% 9.02% 9.21% Definitions and Reconciliation of GAAP to Non-GAAP Financial Measures: First Quarter 2021 Appendix
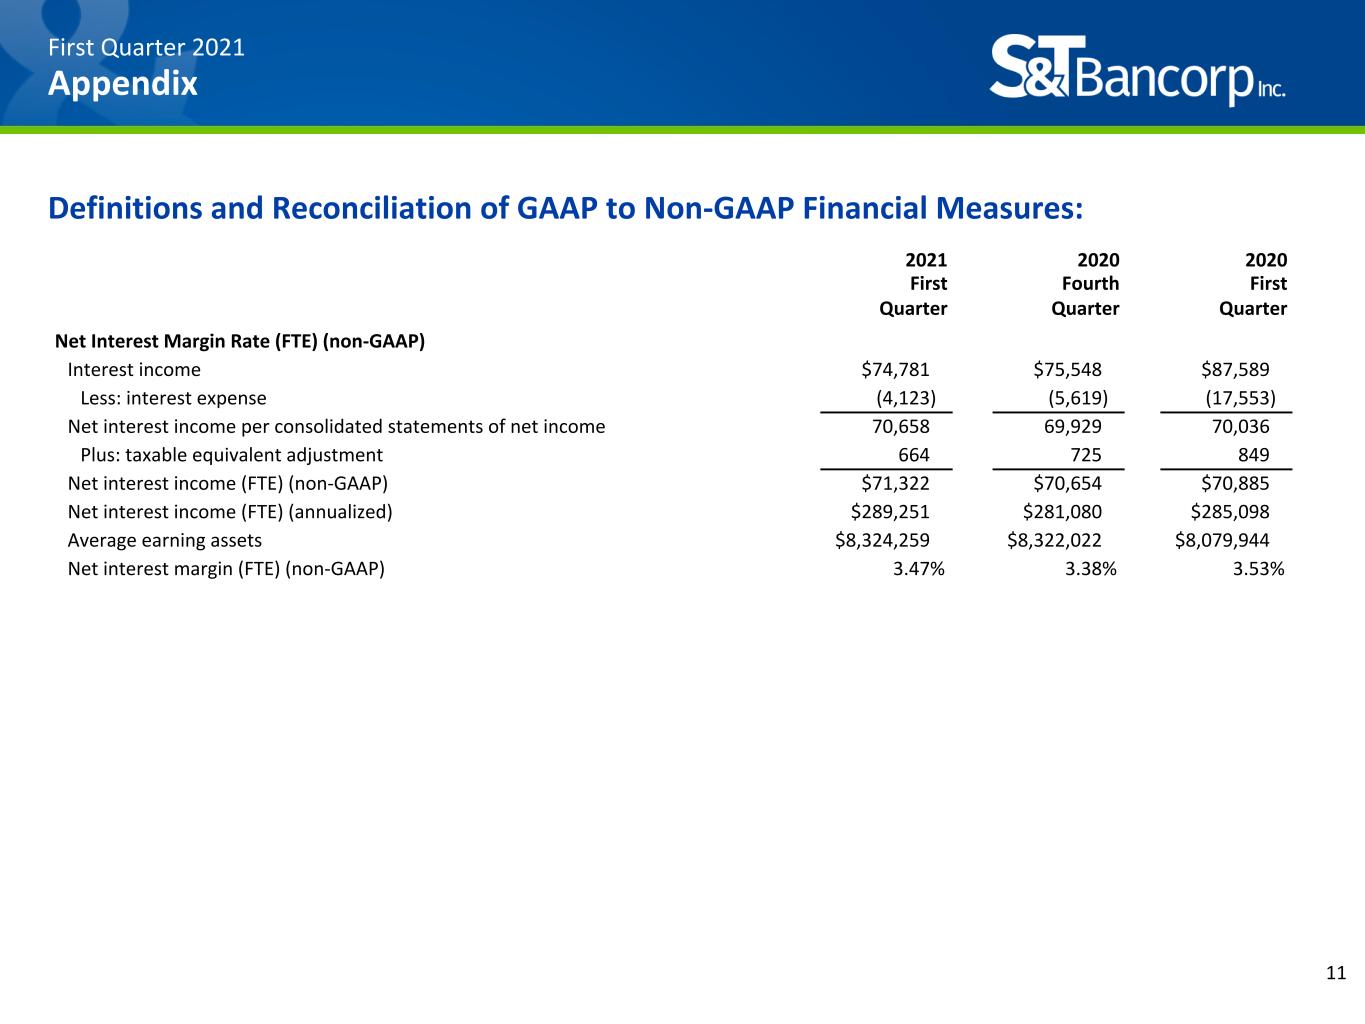
11 2021 2020 2020 First Quarter Fourth Quarter First Quarter Net Interest Margin Rate (FTE) (non-GAAP) Interest income $74,781 $75,548 $87,589 Less: interest expense (4,123) (5,619) (17,553) Net interest income per consolidated statements of net income 70,658 69,929 70,036 Plus: taxable equivalent adjustment 664 725 849 Net interest income (FTE) (non-GAAP) $71,322 $70,654 $70,885 Net interest income (FTE) (annualized) $289,251 $281,080 $285,098 Average earning assets $8,324,259 $8,322,022 $8,079,944 Net interest margin (FTE) (non-GAAP) 3.47% 3.38% 3.53% Definitions and Reconciliation of GAAP to Non-GAAP Financial Measures: First Quarter 2021 Appendix
MEMBER FDIC First Quarter 2021 Earnings Supplement
