Attached files
| file | filename |
|---|---|
| 8-K - FORM 8-K - SHENANDOAH TELECOMMUNICATIONS CO/VA/ | f8k_042121.htm |
| EX-99.2 - EXHIBIT 99.2 - SHENANDOAH TELECOMMUNICATIONS CO/VA/ | exh_992.htm |
Exhibit 99.1

April 20, 2021 2021 Shareholder Meeting
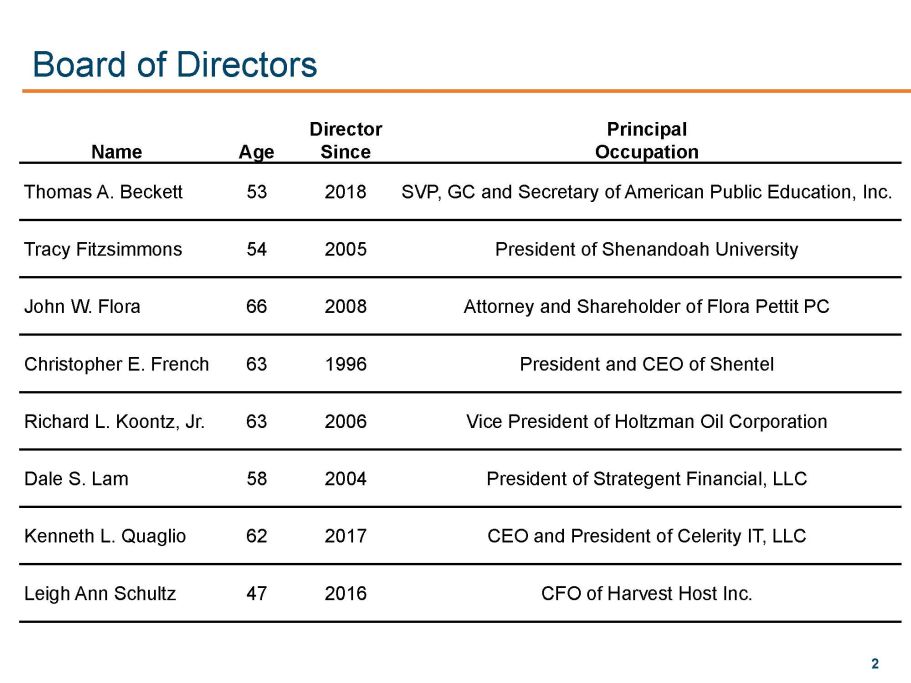
2 Board of Directors Name Age Director Since Principal Occupation Thomas A. Beckett 53 2018 SVP, GC and Secretary of American Public Education, Inc. Tracy Fitzsimmons 54 2005 President of Shenandoah University John W. Flora 66 2008 Attorney and Shareholder of Flora Pettit PC Christopher E. French 63 1996 President and CEO of Shentel Richard L. Koontz, Jr. 63 2006 Vice President of Holtzman Oil Corporation Dale S. Lam 58 2004 President of Strategent Financial, LLC Kenneth L. Quaglio 62 2017 CEO and President of Celerity IT, LLC Leigh Ann Schultz 47 2016 CFO of Harvest Host Inc.
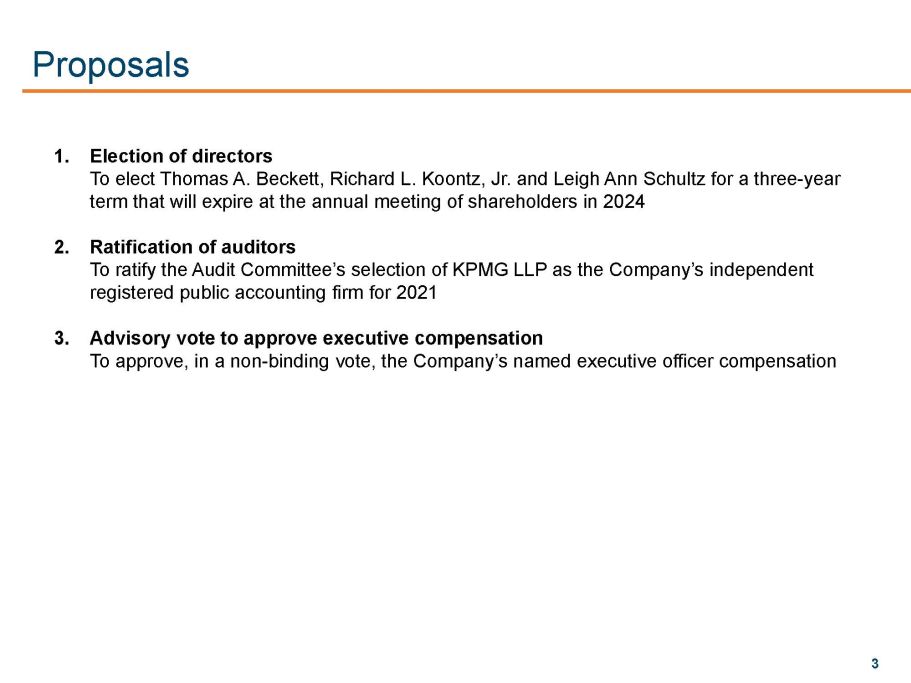
3 Proposals 1. Election of directors To elect Thomas A. Beckett, Richard L. Koontz, Jr. and Leigh Ann Schultz for a three - year term that will expire at the annual meeting of shareholders in 2024 2. Ratification of auditors To ratify the Audit Committee’s selection of KPMG LLP as the Company’s independent registered public accounting firm for 2021 3. Advisory vote to approve executive compensation To approve, in a non - binding vote, the Company’s named executive officer compensation
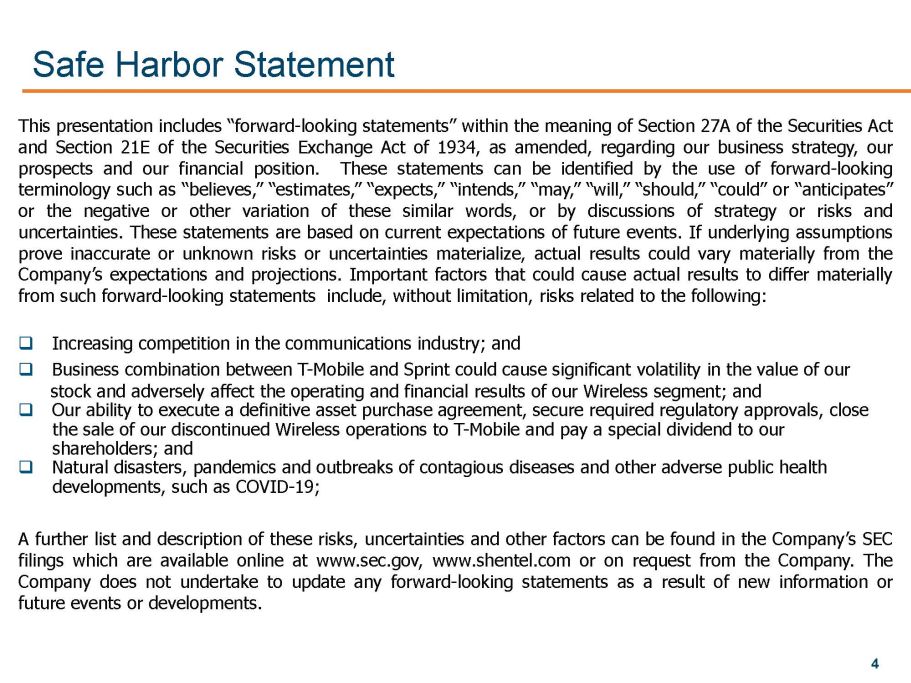
4 This presentation includes “forward - looking statements” within the meaning of Section 27 A of the Securities Act and Section 21 E of the Securities Exchange Act of 1934 , as amended, regarding our business strategy, our prospects and our financial position . These statements can be identified by the use of forward - looking terminology such as “believes,” “estimates,” “expects,” “intends,” “may,” “will,” “should,” “could” or “anticipates” or the negative or other variation of these similar words, or by discussions of strategy or risks and uncertainties . These statements are based on current expectations of future events . If underlying assumptions prove inaccurate or unknown risks or uncertainties materialize, actual results could vary materially from the Company’s expectations and projections . Important factors that could cause actual results to differ materially from such forward - looking statements include, without limitation, risks related to the following : q Increasing competition in the communications industry; and q Business combination between T - Mobile and Sprint could cause significant volatility in the value of our ----- stock and adversely affect the operating and financial results of our Wireless segment; and q Our ability to execute a definitive asset purchase agreement, secure required regulatory approvals, close the sale of our discontinued Wireless operations to T - Mobile and pay a special dividend to our shareholders; and q Natural disasters, pandemics and outbreaks of contagious diseases and other adverse public health developments, such as COVID - 19; A further list and description of these risks, uncertainties and other factors can be found in the Company’s SEC filings which are available online at www . sec . gov, www . shentel . com or on request from the Company . The Company does not undertake to update any forward - looking statements as a result of new information or future events or developments . Safe Harbor Statement
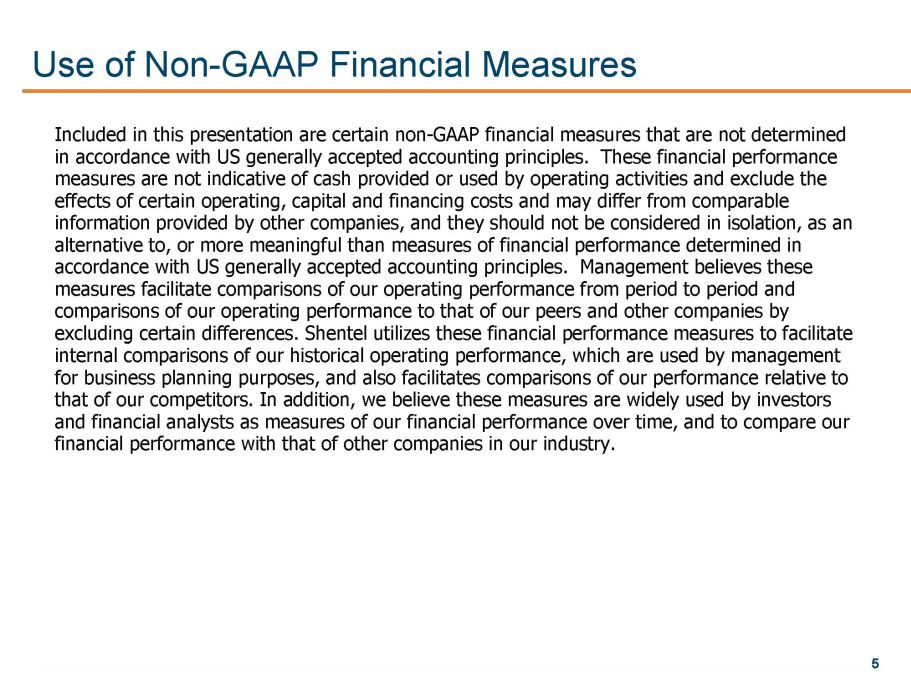
5 Use of Non - GAAP Financial Measures Included in this presentation are certain non - GAAP financial measures that are not determined in accordance with US generally accepted accounting principles. These financial performance measures are not indicative of cash provided or used by operating activities and exclude the effects of certain operating, capital and financing costs and may differ from comparable information provided by other companies, and they should not be considered in isolation, as an alternative to, or more meaningful than measures of financial performance determined in accordance with US generally accepted accounting principles. Management believes these measures facilitate comparisons of our operating performance from period to period and comparisons of our operating performance to that of our peers and other companies by excluding certain differences. Shentel utilizes these financial performance measures to facilitate internal comparisons of our historical operating performance, which are used by management for business planning purposes, and also facilitates comparisons of our performance relative to that of our competitors. In addition, we believe these measures are widely used by investors and financial analysts as measures of our financial performance over time, and to compare our financial performance with that of other companies in our industry.
Jim Volk Sr. VP of Finance and CFO
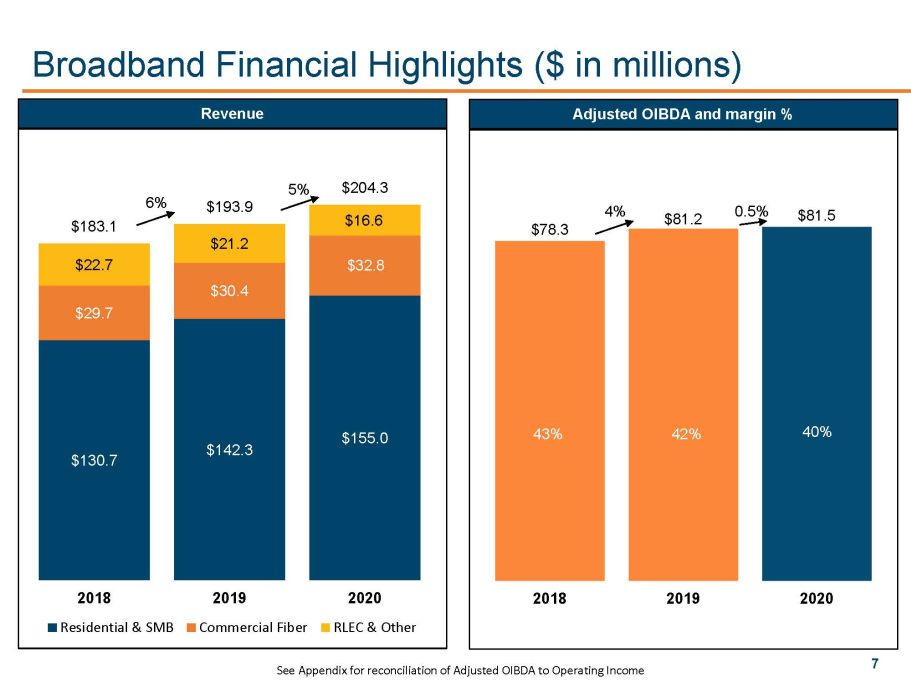
7 Broadband Financial Highlights ($ in millions) See Appendix for reconciliation of Adjusted OIBDA to Operating Income 34% 38% 37% Revenue Adjusted OIBDA and margin % $130.7 $142.3 $155.0 $29.7 $30.4 $32.8 $22.7 $21.2 $16.6 $183.1 $193.9 $204.3 2018 2019 2020 Residential & SMB Commercial Fiber RLEC & Other 6 % 5% $78.3 $81.2 $81.5 43% 42% 40% 2018 2019 2020 4% 0.5%
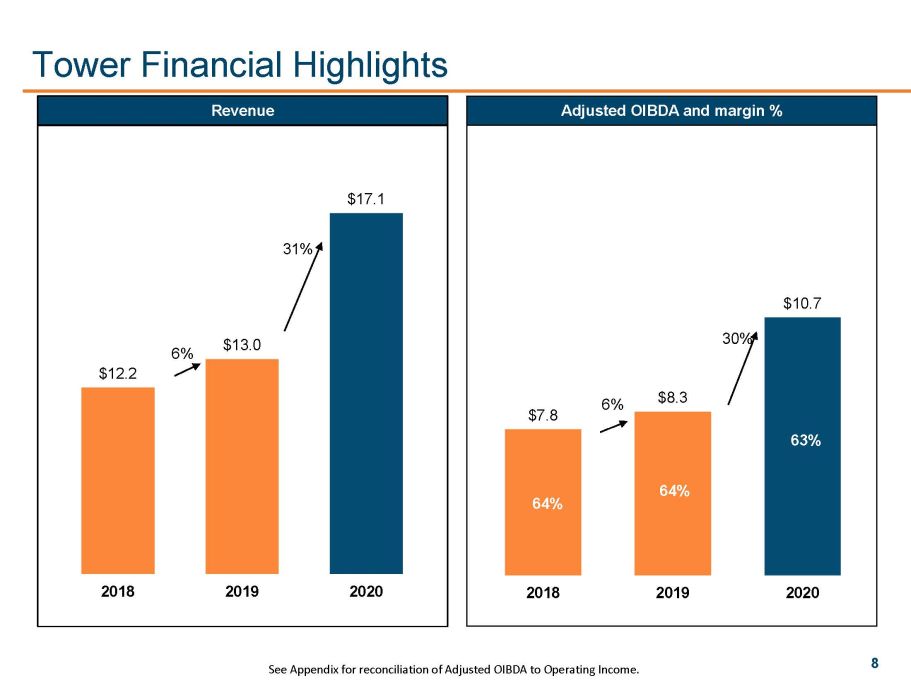
8 Tower Financial Highlights See Appendix for reconciliation of Adjusted OIBDA to Operating Income. 62% 60% 61% Revenue Adjusted OIBDA and margin % $12.2 $13.0 $17.1 2018 2019 2020 6% 31% $7.8 $8.3 $10.7 2018 2019 2020 64% 63% 6% 30% 64%
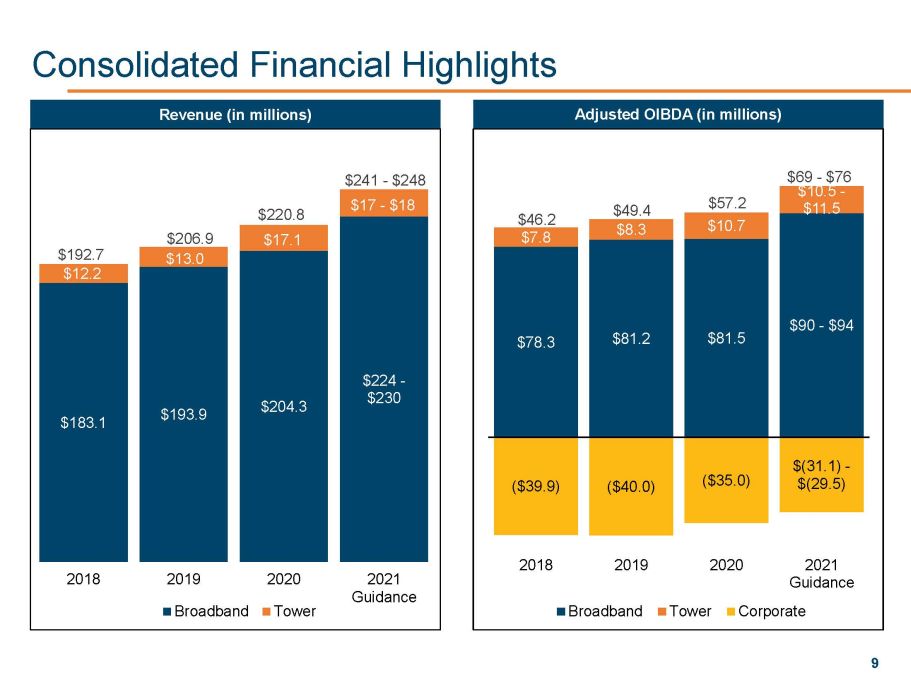
9 $78.3 $81.2 $81.5 $90 - $94 $7.8 $8.3 $10.7 $10.5 - $11.5 ($39.9) ($40.0) ($35.0) $(31.1) - $(29.5) $46.2 $49.4 $57.2 $69 - $76 2018 2019 2020 2021 Guidance Broadband Tower Corporate $183.1 $193.9 $204.3 $224 - $230 $12.2 $13.0 $17.1 $17 - $18 $192.7 $206.9 $220.8 $241 - $248 2018 2019 2020 2021 Guidance Broadband Tower Consolidated Financial Highlights x x Adjusted OIBDA (in millions) Revenue (in millions)
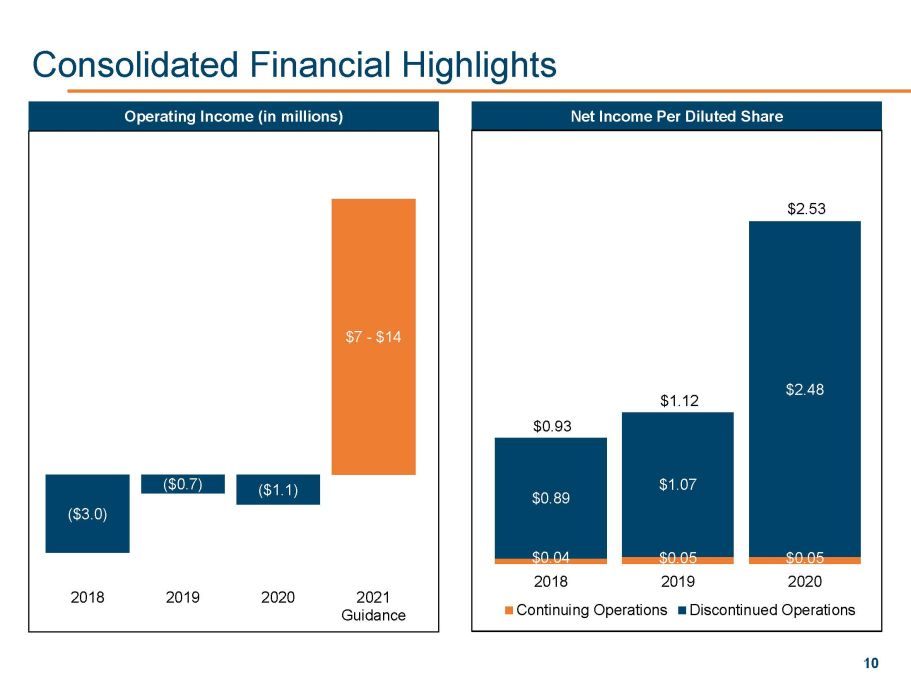
10 $0.04 $0.05 $0.05 $0.89 $1.07 $2.48 $0.93 $1.12 $2.53 2018 2019 2020 Continuing Operations Discontinued Operations ($3.0) ($0.7) ($1.1) $7 - $14 2018 2019 2020 2021 Guidance Consolidated Financial Highlights x x Net Income Per Diluted Share Operating Income (in millions)
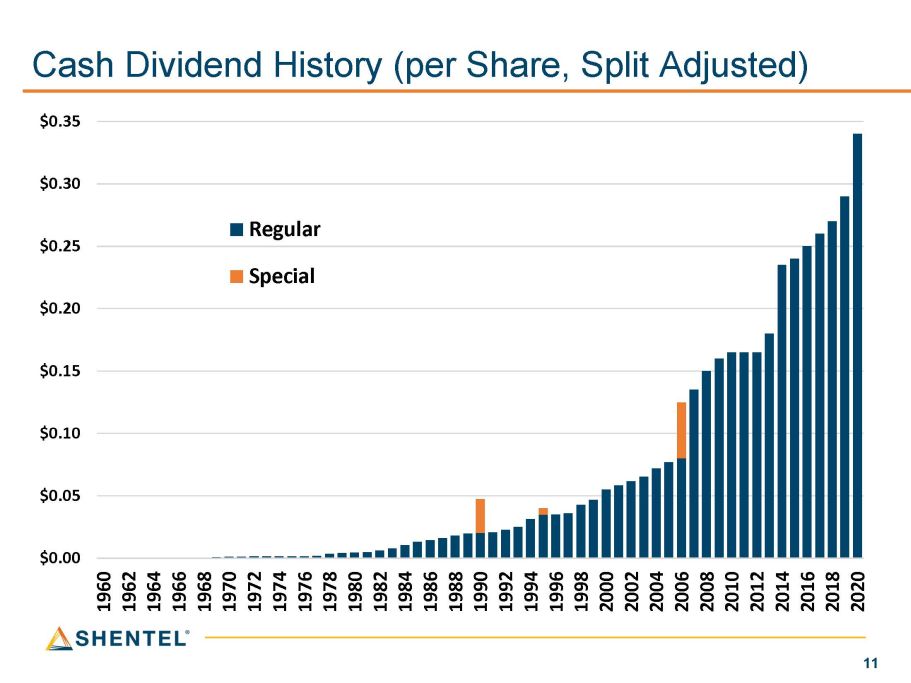
11 Cash Dividend History (per Share, Split Adjusted) x x $0.00 $0.05 $0.10 $0.15 $0.20 $0.25 $0.30 $0.35 1960 1962 1964 1966 1968 1970 1972 1974 1976 1978 1980 1982 1984 1986 1988 1990 1992 1994 1996 1998 2000 2002 2004 2006 2008 2010 2012 2014 2016 2018 2020 Regular Special
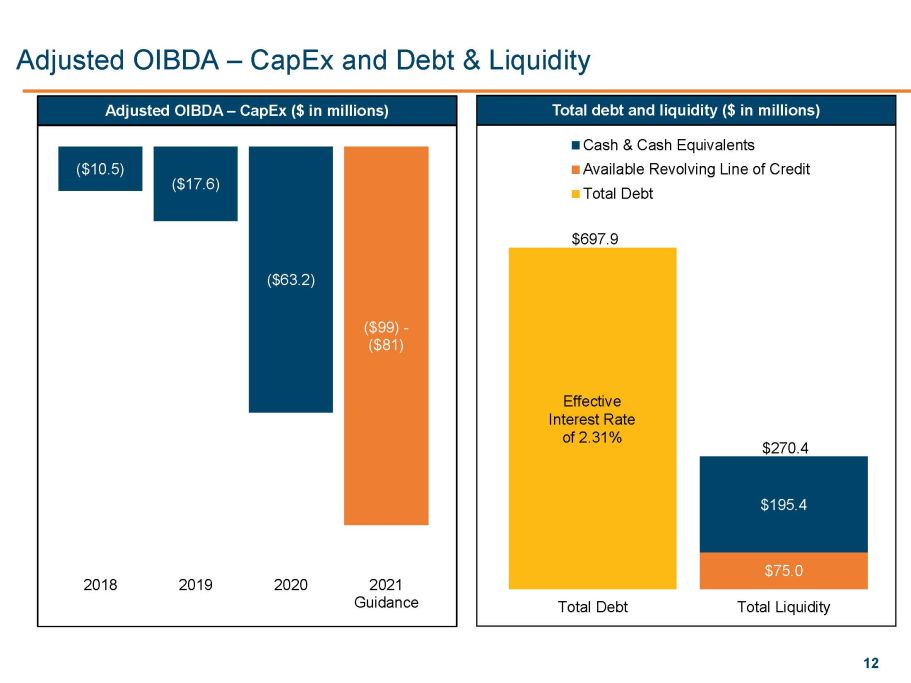
12 $697.9 $75.0 $195.4 $270.4 Total Debt Total Liquidity Cash & Cash Equivalents Available Revolving Line of Credit Total Debt Effective Interest R ate of 2.31% ($10.5) ($17.6) ($63.2) ($99) - ($81) 2018 2019 2020 2021 Guidance Adjusted OIBDA – CapEx and Debt & Liquidity Adjusted OIBDA – CapEx ($ in millions) Total debt and liquidity ($ in millions)
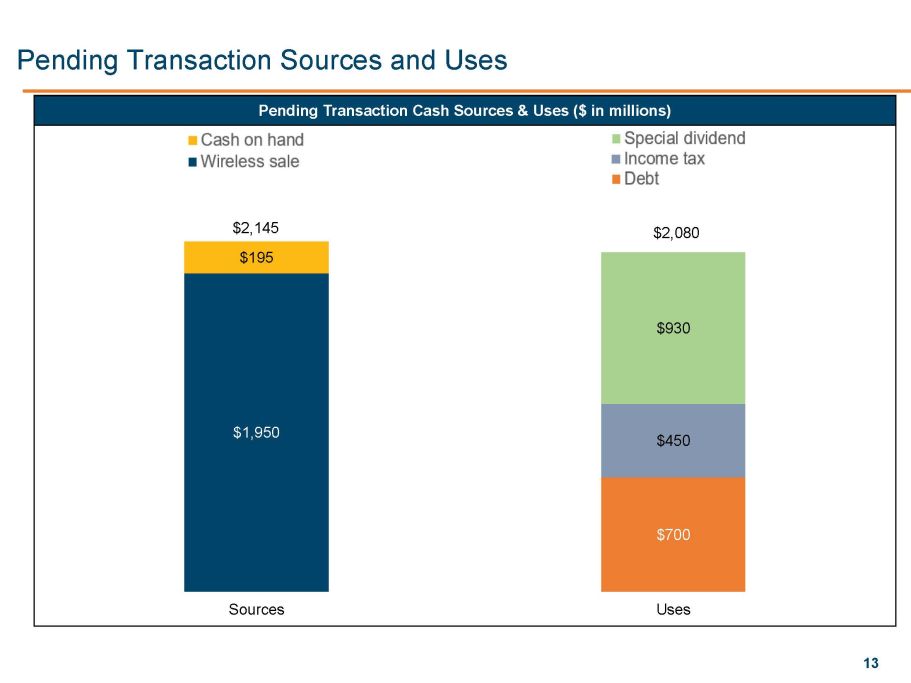
13 $1,950 $195 $700 $450 $930 Sources Uses Pending Transaction Sources and Uses Pending Transaction Cash Sources & Uses ($ in millions) $2,145 $2,080
Dave Heimbach EVP and COO
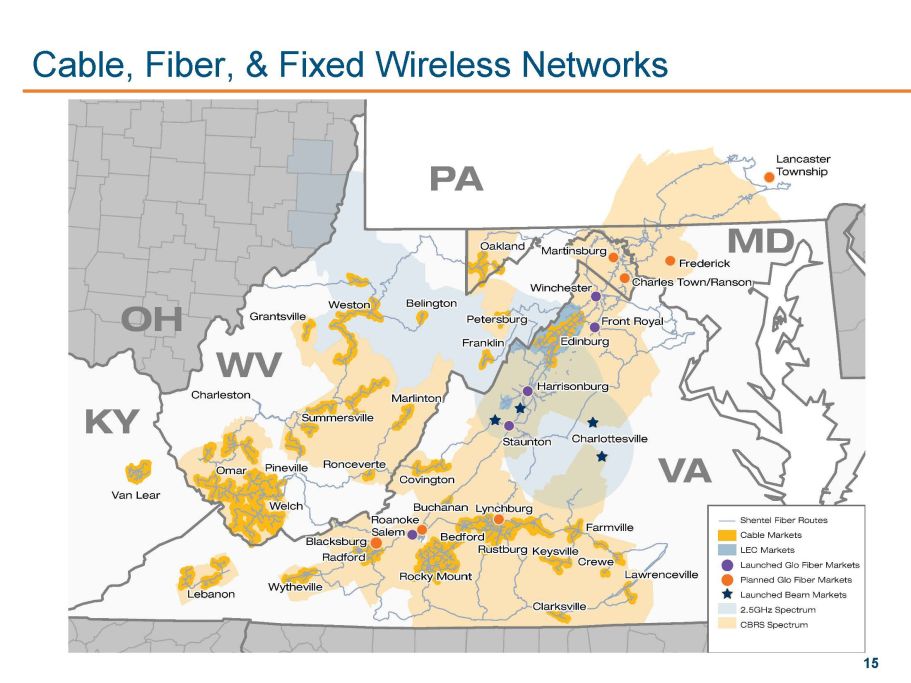
15 Cable, Fiber, & Fixed Wireless Networks
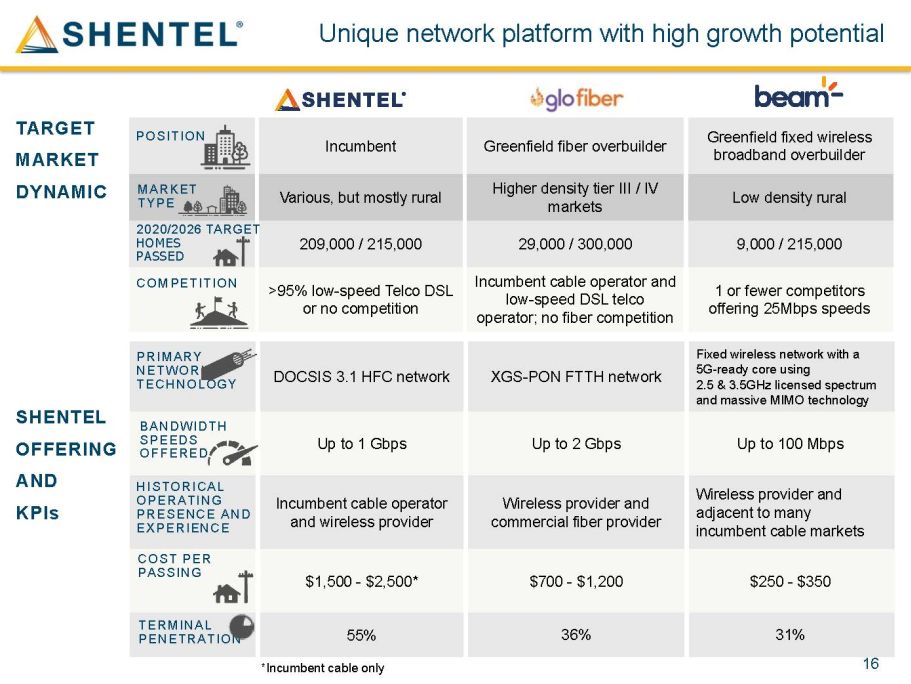
16 Incumbent Greenfield fiber overbuilder Greenfield fixed wireless broadband overbuilder Various, but mostly rural Higher density tier III / IV markets Low density rural 209,000 / 215,000 29,000 / 300,000 9,000 / 215,000 >95% low - speed Telco DSL or no competition Incumbent cable operator and low - speed DSL telco operator; no fiber competition 1 or fewer competitors offering 25Mbps speeds *Incumbent cable only Unique network platform with high growth potential POSITION MARKET TYPE COMPETITION TARGET MARKET DYNAMIC DOCSIS 3.1 HFC network XGS - PON FTTH network Fixed wireless network with a 5G - ready core using 2.5 & 3.5GHz licensed spectrum and massive MIMO technology Up to 1 Gbps Up to 2 Gbps Up to 100 Mbps Incumbent cable operator and wireless provider Wireless provider and commercial fiber provider Wireless provider and adjacent to many incumbent cable markets $1,500 - $2,500* $700 - $1,200 $250 - $350 55% 36% 31% PRIMARY NETWORK TECHNOLOGY HISTORICAL OPERATING PRESENCE AND EXPERIENCE COST PER PASSING SHENTEL OFFERING AND KPIs TERMINAL PENETRATION 2020/2026 TARGET HOMES PASSED BANDWIDTH SPEEDS OFFERED
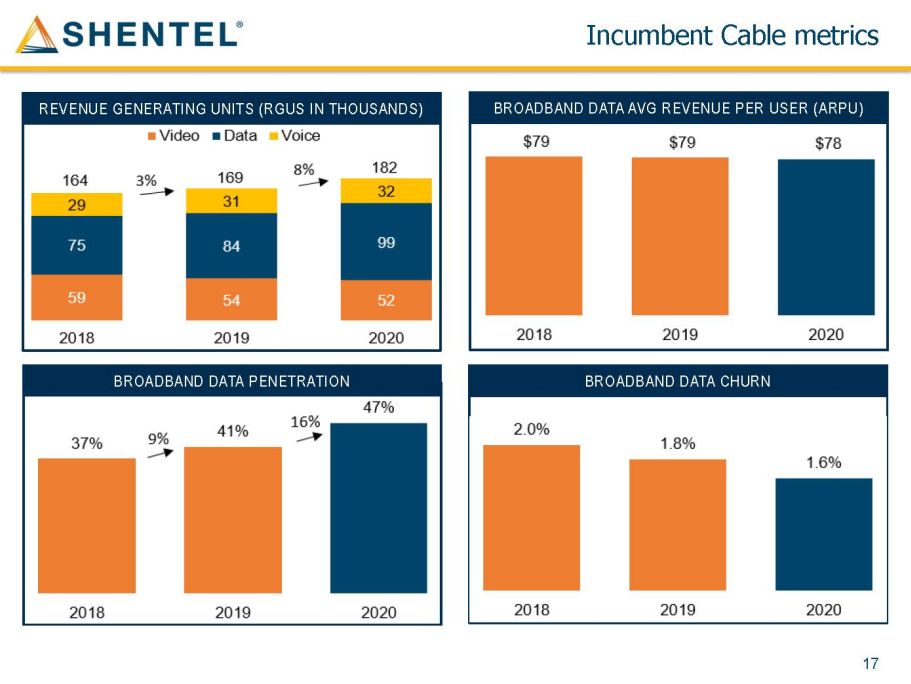
17 Incumbent Cable m etrics REVENUE GENERATING UNITS (RGU S IN THOUSANDS ) BROADBAND DATA PENETRATION BROADBAND DATA AVG REVENUE PER USER (ARPU) BROADBAND DATA CHURN
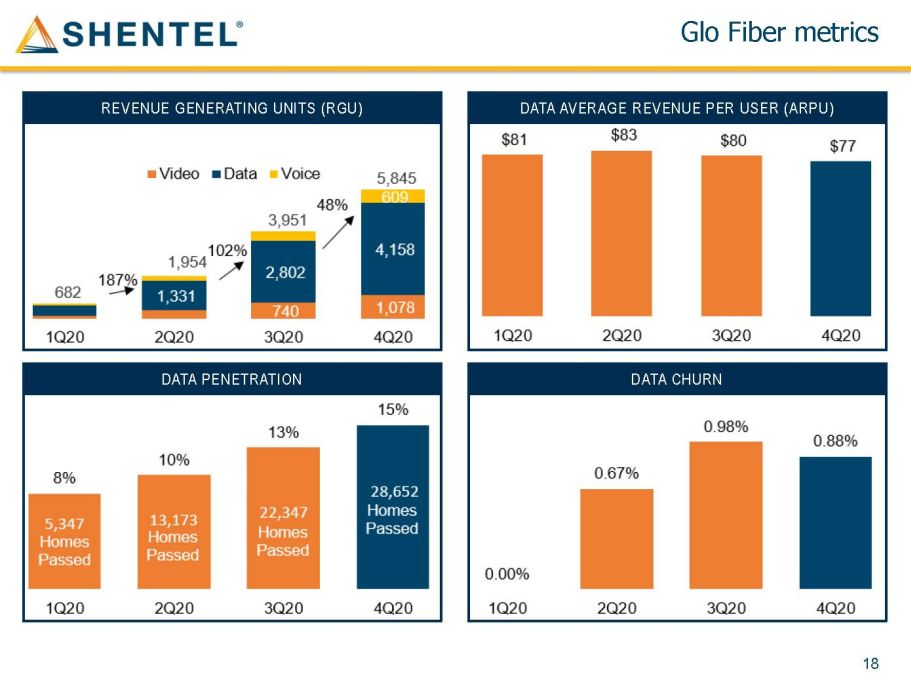
18 Glo Fiber m etrics REVENUE GENERATING UNITS (RGU) DATA AVERAGE REVENUE PER USER (ARPU) DATA PENETRATION DATA CHURN
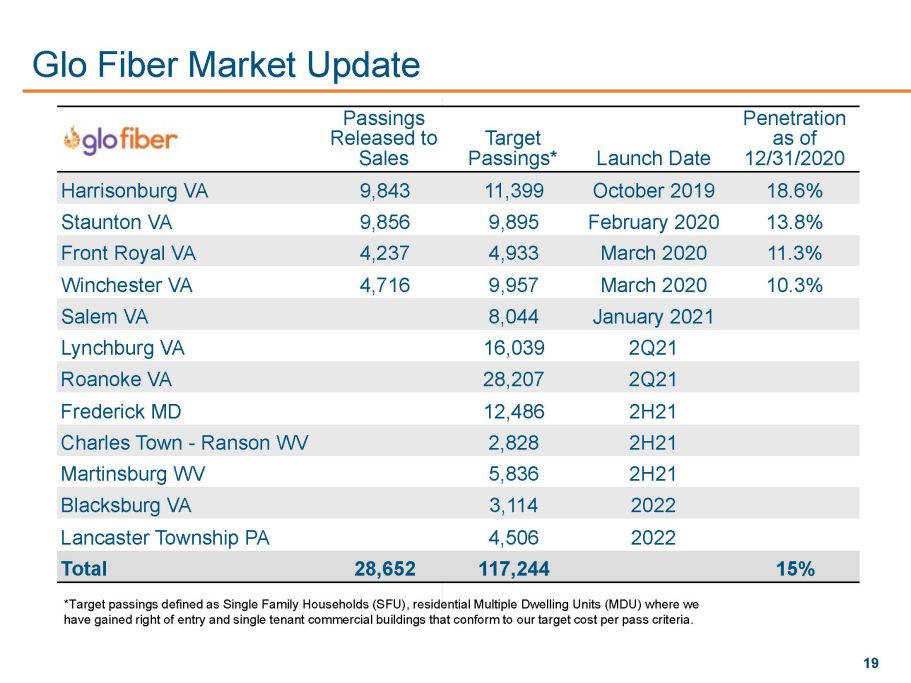
19 Glo Fiber Market Update Passings Released to Sales Target Passings * Launch Date Penetration as of 12/31 /2020 Harrisonburg VA 9, 843 1 1,399 October 2019 1 8.6 % Staunton VA 9,856 9,895 February 2020 1 3.8 % Front Royal VA 4,237 4,933 March 2020 11.3 % Winchester VA 4,716 9, 957 March 2020 10.3 % Salem VA 8,044 January 2021 Lynchburg VA 16,039 2Q 21 Roanoke VA 28,207 2Q 21 Frederick MD 12,486 2H21 Charles Town - Ranson WV 2,828 2H21 Martinsburg WV 5,836 2H21 Blacksburg VA 3,114 2022 Lancaster Township PA 4,5 06 2 022 Total 2 8,652 11 7,244 1 5 % *Target passings defined as Single Family Households (SFU), residential Multiple Dwelling Units (MDU) where we have gained right of entry and single tenant commercial buildings that conform to our target cost per pass criteria.
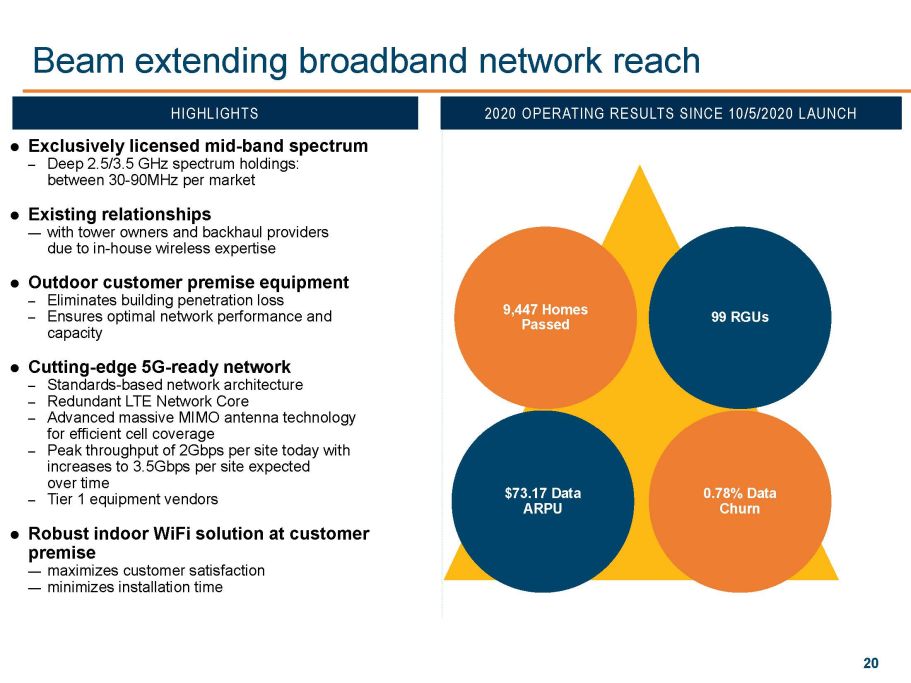
20 Beam extending broadband network reach Exclusively licensed mid - band spectrum – Deep 2.5/3.5 GHz spectrum holdings: between 30 - 90MHz per market Existing relationships — with tower owners and backhaul providers due to in - house wireless expertise Outdoor customer premise equipment – Eliminates building penetration loss – Ensures optimal network performance and capacity Cutting - edge 5G - ready network – Standards - based network architecture – Redundant LTE Network Core – Advanced massive MIMO antenna technology for efficient cell coverage – Peak throughput of 2Gbps per site today with increases to 3.5Gbps per site expected over time – Tier 1 equipment vendors Robust indoor WiFi solution at customer premise — maximizes customer satisfaction — minimizes installation time 9,447 Homes Passed 99 RGUs $73.17 Data ARPU 0.78% Data Churn HIGHLIGHTS 2020 OPERATING RESULTS SINCE 10/5/2020 LAUNCH
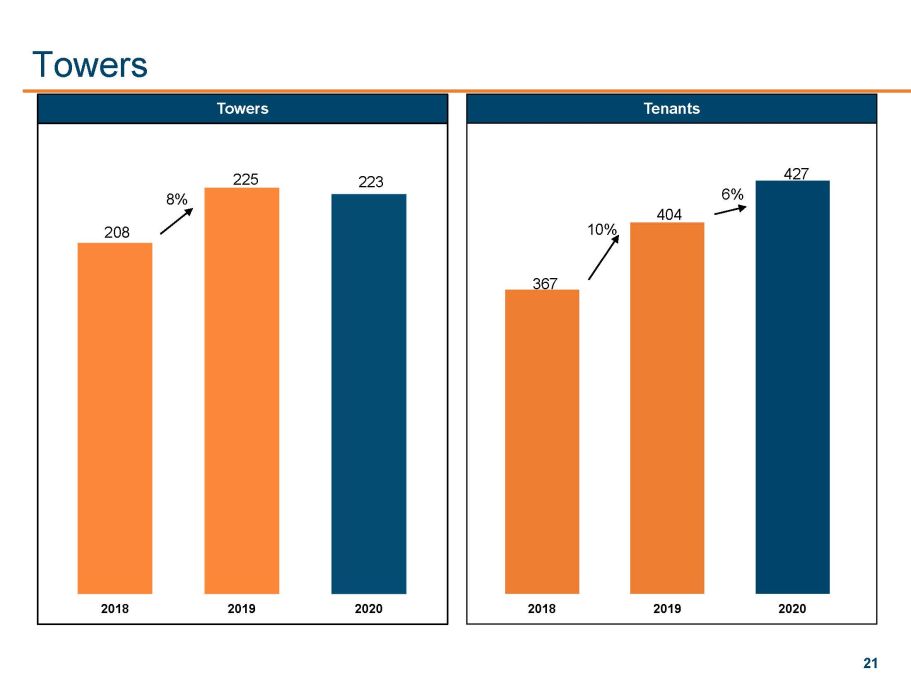
21 Towers 42% 48% 47% Towers Tenants 208 225 223 2018 2019 2020 8% 367 404 427 2018 2019 2020 10% 6%
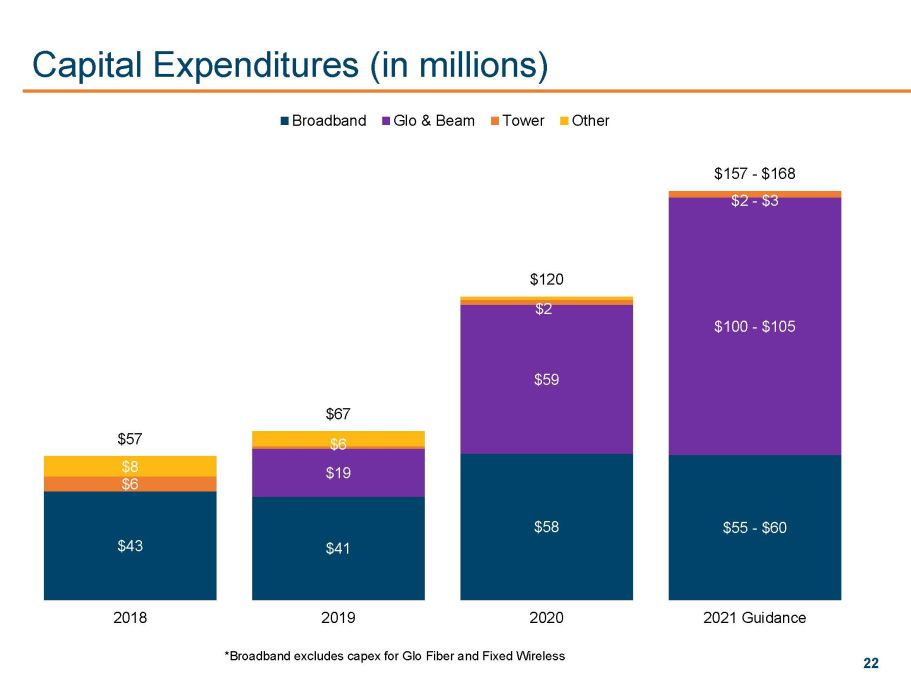
22 Capital Expenditures (in millions) *Broadband excludes capex for Glo Fiber and Fixed Wireless $43 $41 $58 $55 - $60 $19 $59 $100 - $105 $6 $2 $2 - $3 $8 $6 $57 $67 $120 $157 - $168 2018 2019 2020 2021 Guidance Broadband Glo & Beam Tower Other
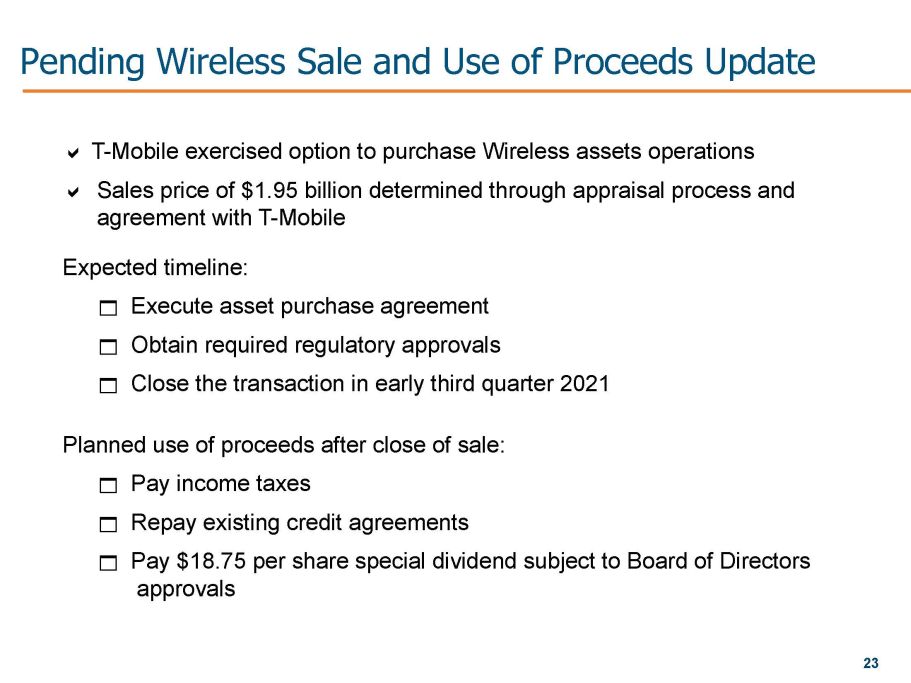
23 Pending Wireless Sale and Use of Proceeds Update a T - Mobile exercised option to purchase Wireless assets operations a Sales price of $1.95 billion determined through appraisal process and agreement with T - Mobile Expected timeline: 1 Execute asset purchase agreement 1 Obtain required regulatory approvals 1 Close the transaction in early third quarter 2021 Planned use of proceeds after close of sale: 1 Pay income taxes 1 Repay existing credit agreements 1 Pay $18.75 per share special dividend subject to Board of Directors approvals

Chris French President and CEO
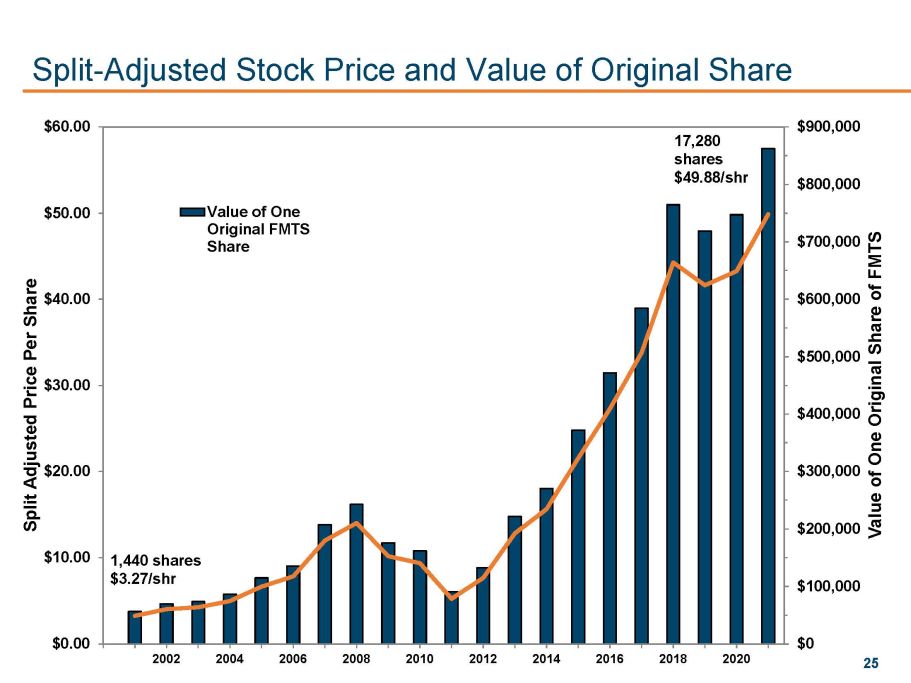
25 Split - Adjusted Stock Price and Value of Original Share x $0 $100,000 $200,000 $300,000 $400,000 $500,000 $600,000 $700,000 $800,000 $900,000 2002 2004 2006 2008 2010 2012 2014 2016 2018 2020 $0.00 $10.00 $20.00 $30.00 $40.00 $50.00 $60.00 Value of One Original Share of FMTS Split Adjusted Price Per Share Value of One Original FMTS Share 1,440 shares $3.27/ shr 17,280 shares $49.88/shr
26 Questions & Answers
April 20, 2021 2021 Shareholder Meeting
28 Shentel Appendix

29 2018 Adjusted OIBDA by Segment T welve Months Ended December 31, 2018 (in thousands) Broadband Tower Corporate & Eliminations Consolidated Operating income $ 42,294 $ 5,399 $ ( 50,662 ) $ (2,969 ) Depreciation 35,816 2,406 5,992 44,214 Amortization 176 176 OIBDA 78,286 7,805 ( 44,670 ) 41,421 Share - based compensation expense — — 4,745 4,745 Adjusted OIBDA $ 78,286 $ 7,805 $ ( 39,925 ) $ 46,166 Total revenue $ 183,120 $ 12,196 $ (2,633 ) $ 192,683 Adjusted OIBDA margin 42.8 % 64.0 % N/A 24.0 %
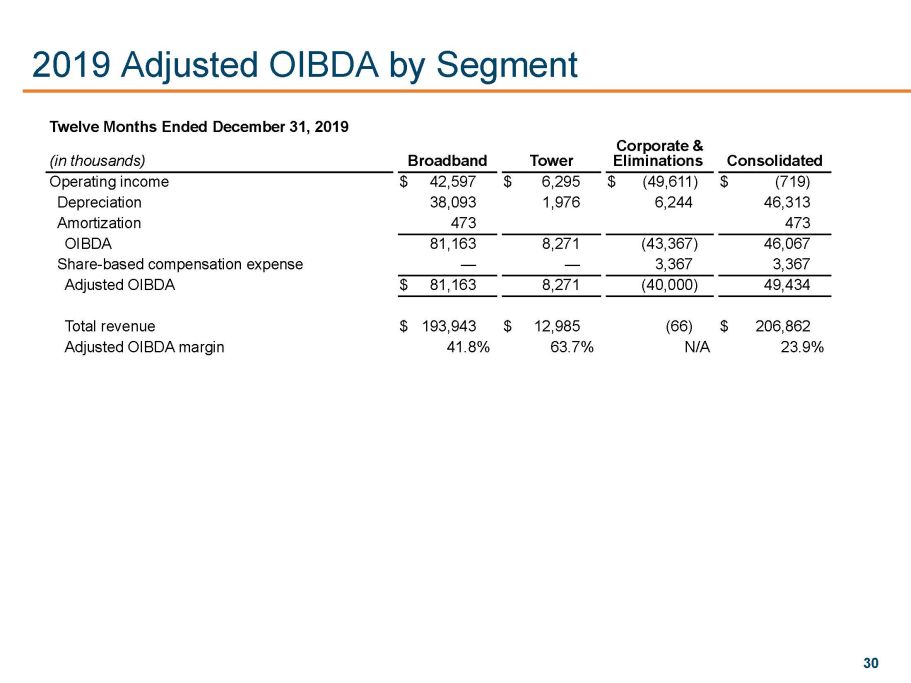
30 2019 Adjusted OIBDA by Segment T welve Months Ended December 31, 2019 (in thousands) Broadband Tower Corporate & Eliminations Consolidated Operating income $ 42,597 $ 6,295 $ ( 49,611 ) $ (719) Depreciation 38,093 1,976 6,244 46,313 Amortization 473 473 OIBDA 81,163 8,271 ( 43,367 ) 46,067 Share - based compensation expense — — 3,367 3,367 Adjusted OIBDA $ 81,163 8,271 ( 40,000 ) 49,434 Total revenue $ 193,943 $ 12,985 (66) $ 206,862 Adjusted OIBDA margin 41.8 % 63.7 % N/A 23.9 %
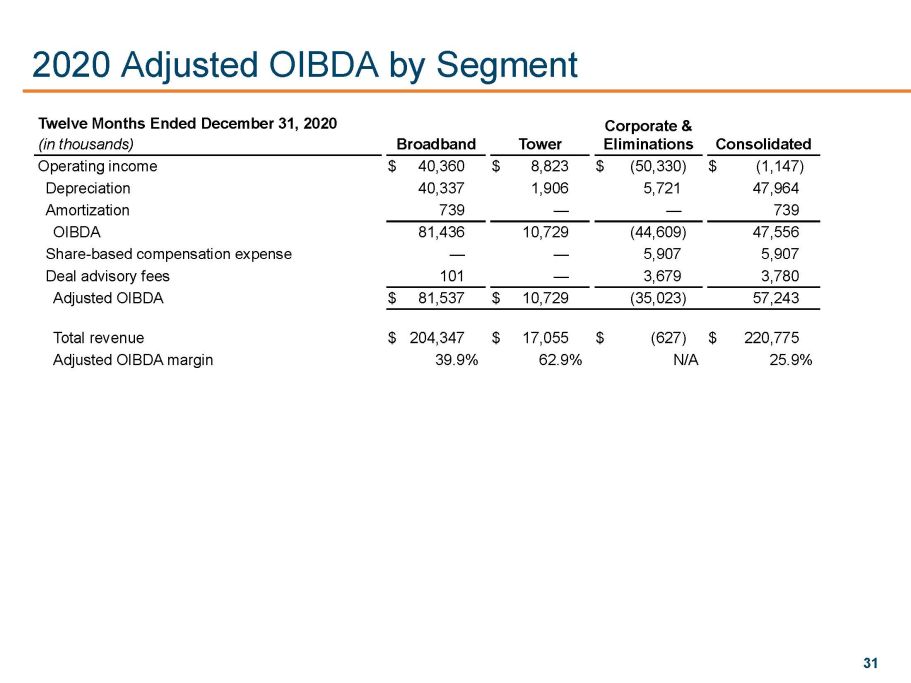
31 2020 Adjusted OIBDA by Segment Twelve Months Ended December 31, 2020 Corporate & (in thousands) Broadband Tower Eliminations Consolidated Operating income $ 40,360 $ 8,823 $ (50,330 ) $ (1,147 ) Depreciation 40,337 1,906 5,721 47,964 Amortization 739 — — 739 OIBDA 81,436 10,729 (44,609 ) 47,556 Share - based compensation expense — — 5,907 5,907 Deal advisory fees 101 — 3,679 3,780 Adjusted OIBDA $ 81,537 $ 10,729 (35,023 ) 57,243 Total revenue $ 204,347 $ 17,055 $ (627 ) $ 220,775 Adjusted OIBDA margin 39.9 % 62.9 % N/A 25.9 %
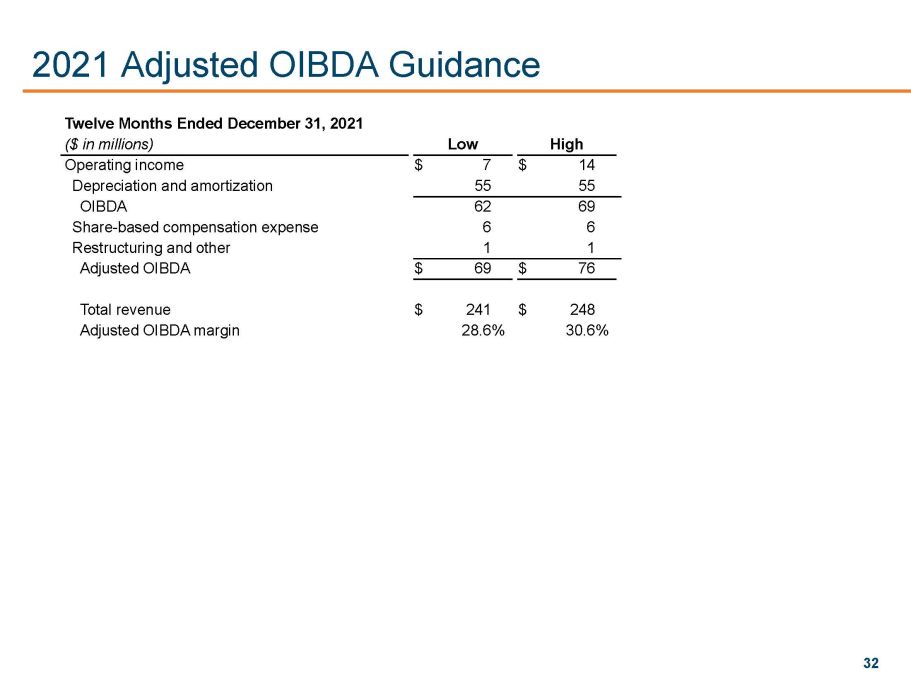
32 2021 Adjusted OIBDA Guidance T welve Months Ended December 31, 20 21 ( $ in millions ) Low High Operating income $ 7 $ 14 Depreciation and amortization 55 55 OIBDA 62 69 Share - based compensation expense 6 6 Restructuring and other 1 1 Adjusted OIBDA $ 69 $ 76 Total revenue $ 241 $ 248 Adjusted OIBDA margin 28.6 % 30.6 %
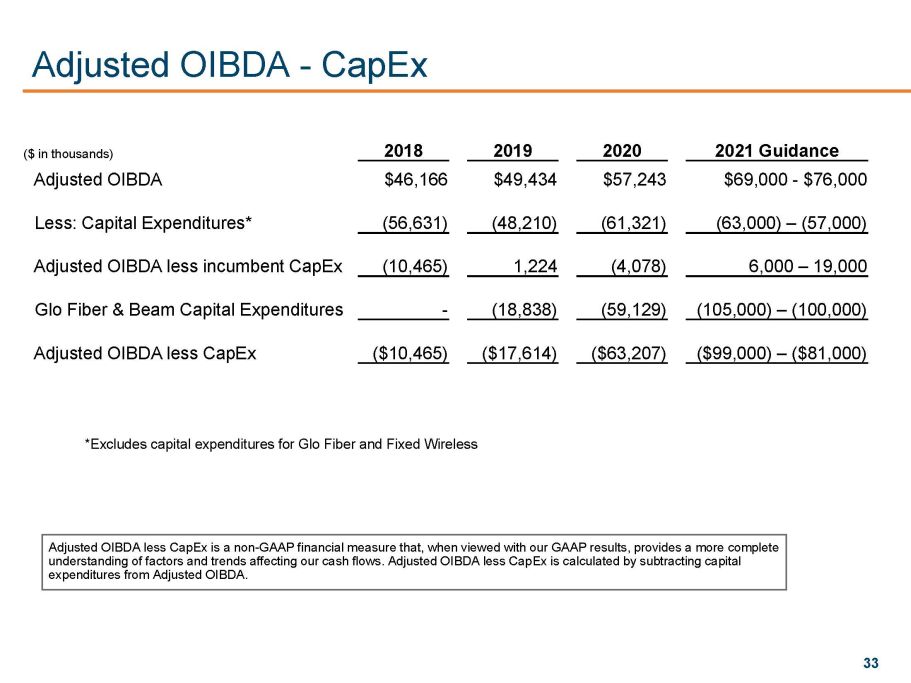
33 Adjusted OIBDA - CapEx *Excludes capital expenditures for Glo Fiber and Fixed Wireless ($ in thousands) 2018 2019 2020 2021 Guidance Adjusted OIBDA $ 46,166 $ 49,434 $ 57,243 $69,000 - $76,000 Less: Capital Expenditures* ( 56,631) (48,210) (61,321) (63,000) – (57,000) Adjusted OIBDA less incumbent CapEx ( 10,465) 1,224 (4,078) 6,000 – 19,000 Glo Fiber & Beam Capital Expenditures - (18,838) ( 59,129) (105,000) – (100,000) Adjusted OIBDA less CapEx ($ 10,465) ($ 17,614) ($63,207) ($99,000) – ($81,000) Adjusted OIBDA less CapEx is a non - GAAP financial measure that, when viewed with our GAAP results, provides a more complete understanding of factors and trends affecting our cash flows. Adjusted OIBDA less CapEx is calculated by subtracting capital expenditures from Adjusted OIBDA.
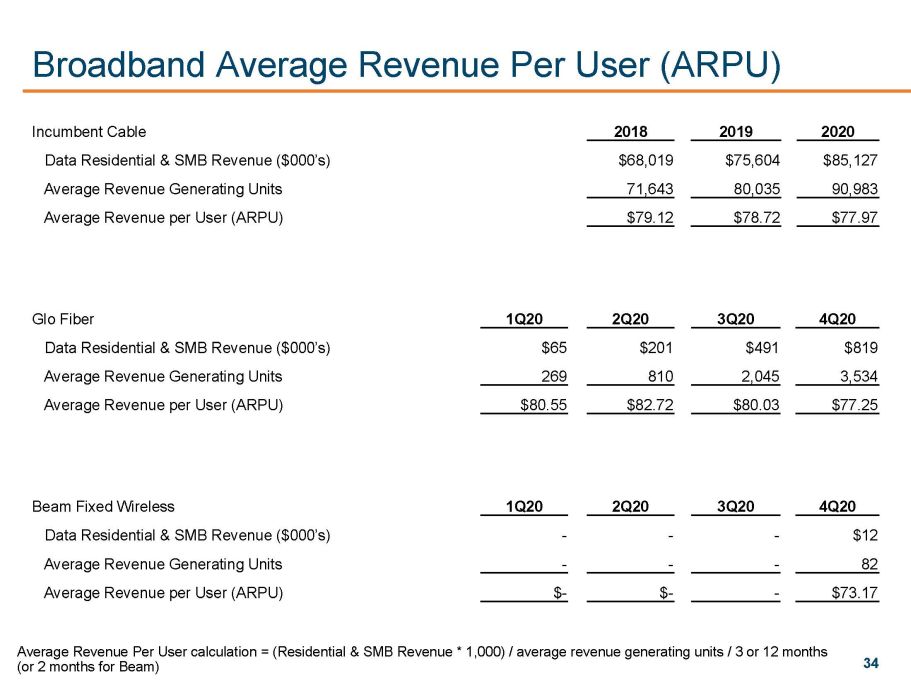
34 Broadband Average Revenue Per User (ARPU) Incumbent Cable 2018 2019 2020 Data Residential & SMB Revenue ($000’s) $68,019 $75,604 $85,127 Average Revenue Generating Units 71,643 80,035 90,983 Average Revenue per User (ARPU) $79.12 $ 78.72 $77.97 Average Revenue Per User calculation = (Residential & SMB Revenue * 1,000) / average revenue generating units / 3 or 12 months (or 2 months for Beam) Glo Fiber 1Q20 2 Q20 3 Q20 4Q20 Data Residential & SMB Revenue ($000’s) $65 $201 $491 $819 Average Revenue Generating Units 269 810 2,045 3,534 Average Revenue per User (ARPU) $80.55 $ 82.72 $ 80.03 $77.25 Beam Fixed Wireless 1Q20 2 Q20 3 Q20 4Q20 Data Residential & SMB Revenue ($000’s) - - - $12 Average Revenue Generating Units - - - 82 Average Revenue per User (ARPU) $ - $ - - $73.17