Attached files
| file | filename |
|---|---|
| 8-K - 8-K - PEOPLES BANCORP INC | pebo-20210326.htm |
| EX-99.2 - EX-99.2 PDF - PEOPLES BANCORP INC | exhibit992mar21.pdf |
| EX-99.1 - EX-99.1 PDF - PEOPLES BANCORP INC | investorpresentationmar2021.pdf |
| EX-99.2 - EX-99.2 - PEOPLES BANCORP INC | march2021exhibit992.htm |

March 29, 2021
Safe Harbor Statement Statements in this presentation which are not historical are “forward-looking statements” within the meaning of Section 27A of the Securities Act of 1933, as amended, Section 21E of the Securities Exchange Act of 1934, as amended, and the Private Securities Litigation Reform Act of 1995. These forward-looking statements may include discussions of the strategic plans and objectives or anticipated future performance and events of Peoples Bancorp Inc. (“Peoples”). The information contained in this presentation should be read in conjunction with Peoples’ Annual Report on Form 10-K for the fiscal year ended December 31, 2020, filed with the Securities and Exchange Commission (“SEC”) and available on the SEC’s website (www.sec.gov) or at Peoples’ website (www.peoplesbancorp.com). Investors are cautioned that forward-looking statements, which are not historical fact, involve risks and uncertainties, including those detailed in Peoples’ 2020 Annual Report on Form 10-K filed with the SEC under the section, “Risk Factors” in Part I, Item 1A. As such, actual results could differ materially from those contemplated by forward-looking statements made in this presentation. Management believes that the expectations in these forward-looking statements are based upon reasonable assumptions within the bounds of management's knowledge of Peoples’ business and operations. Peoples disclaims any responsibility to update these forward-looking statements to reflect events or circumstances after the date of this presentation. 2
Safe Harbor Statement This call does not constitute an offer to sell or the solicitation of an offer to buy securities of Peoples Bancorp Inc. (“Peoples”). Peoples will file a registration statement on Form S-4 and other documents regarding the proposed merger with Premier Financial Bancorp, Inc. (“Premier”) with the Securities and Exchange Commission (“SEC”). The registration statement will include a joint proxy statement/prospectus which will be sent to the shareholders of both Peoples and Premier in advance of their respective special meetings of shareholders to be held to consider the proposed merger. Investors and security holders are urged to read the proxy statement/prospectus and any other relevant documents to be filed with the SEC in connection with the proposed transaction because they contain important information about Peoples, Premier and the proposed merger. Investors and security holders may obtain a free copy of these documents (when available) through the website maintained by the SEC at www.sec.gov. These documents may also be obtained, free of charge, on Peoples’ website at www.peoplesbancorp.com under the tab “Investor Relations” or by contacting Peoples’ Investor Relations Department at: Peoples Bancorp Inc., 138 Putnam Street, PO Box 738, Marietta, Ohio 45750, Attn: Investor Relations. Peoples, Premier, and certain of their directors and executive officers may be deemed to be participants in the solicitation of proxies in connection with the proposed merger. Information regarding the interests of those participants and other persons who may be deemed participants in the transaction may be obtained by reading the proxy statement/prospectus regarding the proposed merger when it becomes available. Additional information about the directors and executive officers of Peoples is set forth in the proxy statement for Peoples' 2021 annual meeting of shareholders, as filed with the SEC on Schedule 14A on March 9, 2021. 3
Acquisition of Premier Financial Bancorp, Inc.

5 Strategic Rationale Strong Strategic Fit • Solidifies Peoples’ position as the best bank in West Virginia(1) • Entry into attractive Virginia, Maryland and Washington DC markets • Strong pro forma core deposit franchise • Aligned cultures and commitment to communities • Accelerates goal of becoming the Best Community Bank in America Enhanced Performance • Benefits of additional scale and operating leverage • Enhanced earnings profile • 30% cost savings to drive meaningful improvement in efficiency • Potential revenue synergies across multiple business lines (not modeled) Financially Compelling • 21%+ EPS accretion ($0.51 per share) • Reasonable tangible book earnback of 2.6 years • 20%+ internal rate of return (1) Peoples’ was recognized as the number one bank in West Virginia in 2020 by Forbes Sound Risk Profile • Grows balance sheet with high-quality loans and core deposits • Non complex business lines that are easily integrated • Leverages Peoples’ experience in acquisitions and integration • Diversifies balance sheet, geography and overall risk profile

Pro Forma Branch Map Enhanced Scale(1) Expanded Geography Improved Efficiency $6.7B Assets $4.6B Loans $5.5B Deposits ~61% Efficiency RatioPEBO (76) PFBI (48) Source: S&P Global Market Intelligence (1) Shown as of December 31, 2020; Excludes purchase accounting adjustments 136 Locations 6 States Enhancing Scale and Geographic Reach 6
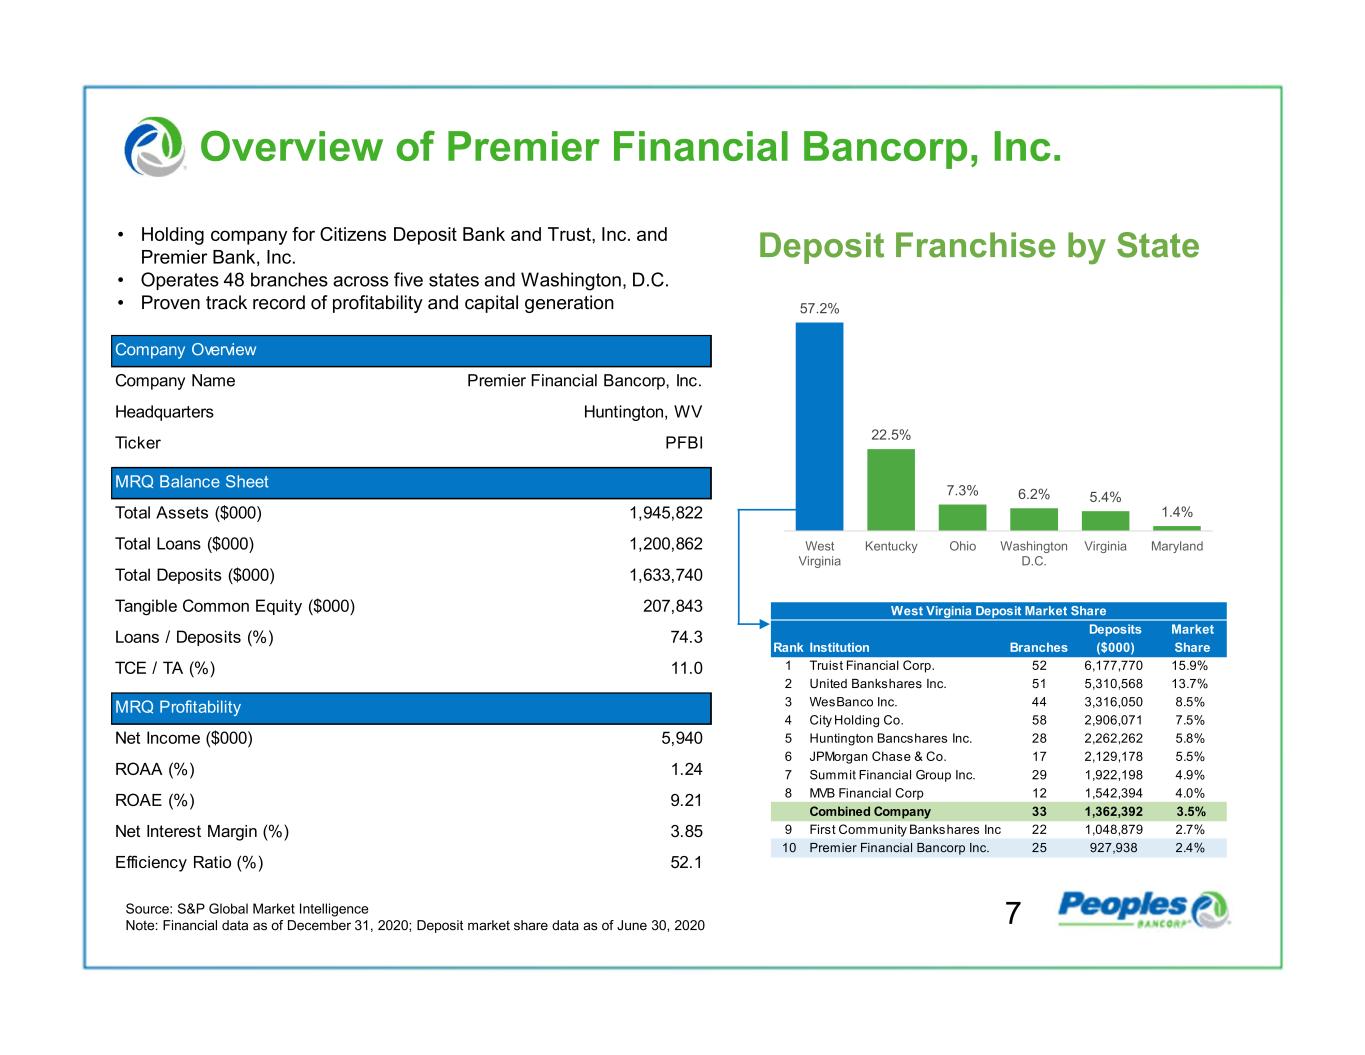
7 Company Overview Company Name Premier Financial Bancorp, Inc. Headquarters Huntington, WV Ticker PFBI MRQ Balance Sheet Total Assets ($000) 1,945,822 Total Loans ($000) 1,200,862 Total Deposits ($000) 1,633,740 Tangible Common Equity ($000) 207,843 Loans / Deposits (%) 74.3 TCE / TA (%) 11.0 MRQ Profitability Net Income ($000) 5,940 ROAA (%) 1.24 ROAE (%) 9.21 Net Interest Margin (%) 3.85 Efficiency Ratio (%) 52.1 • Holding company for Citizens Deposit Bank and Trust, Inc. and Premier Bank, Inc. • Operates 48 branches across five states and Washington, D.C. • Proven track record of profitability and capital generation 57.2% 22.5% 7.3% 6.2% 5.4% 1.4% West Virginia Kentucky Ohio Washington D.C. Virginia Maryland Deposit Franchise by State Source: S&P Global Market Intelligence Note: Financial data as of December 31, 2020; Deposit market share data as of June 30, 2020 West Virginia Deposit Market Share Deposits Market Rank Institution Branches ($000) Share 1 Truist Financial Corp. 52 6,177,770 15.9% 2 United Bankshares Inc. 51 5,310,568 13.7% 3 WesBanco Inc. 44 3,316,050 8.5% 4 City Holding Co. 58 2,906,071 7.5% 5 Huntington Bancshares Inc. 28 2,262,262 5.8% 6 JPMorgan Chase & Co. 17 2,129,178 5.5% 7 Summit Financial Group Inc. 29 1,922,198 4.9% 8 MVB Financial Corp 12 1,542,394 4.0% Combined Company 33 1,362,392 3.5% 9 First Community Bankshares Inc 22 1,048,879 2.7% 10 Premier Financial Bancorp Inc. 25 927,938 2.4% Overview of Premier Financial Bancorp, Inc.
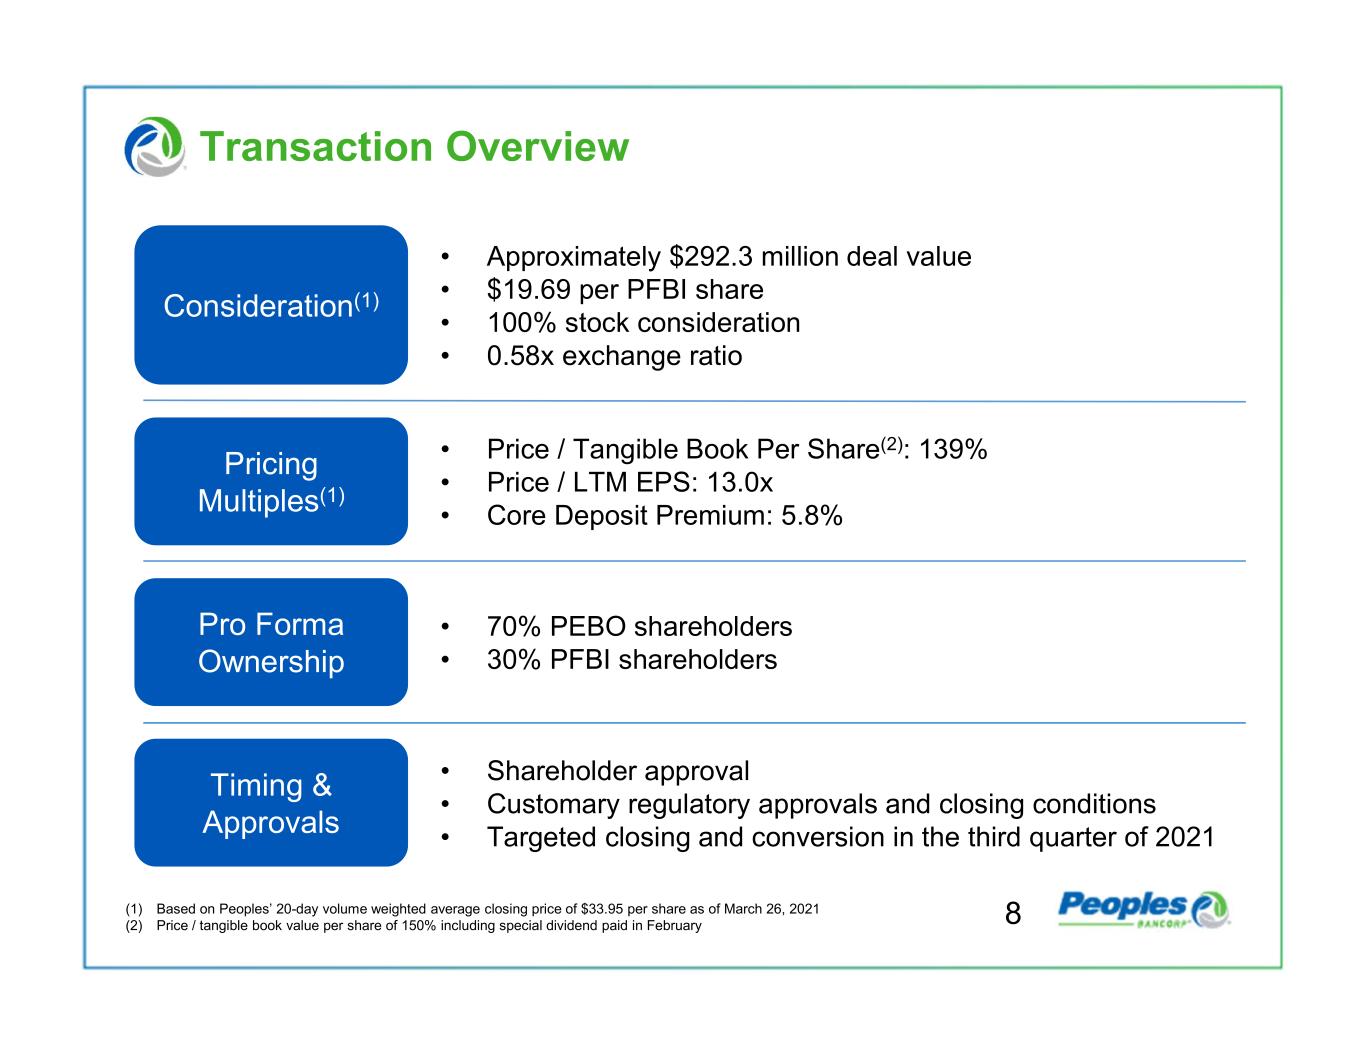
8 Consideration(1) • Approximately $292.3 million deal value • $19.69 per PFBI share • 100% stock consideration • 0.58x exchange ratio Pricing Multiples(1) • Price / Tangible Book Per Share(2): 139% • Price / LTM EPS: 13.0x • Core Deposit Premium: 5.8% Pro Forma Ownership • 70% PEBO shareholders • 30% PFBI shareholders Timing & Approvals • Shareholder approval • Customary regulatory approvals and closing conditions • Targeted closing and conversion in the third quarter of 2021 (1) Based on Peoples’ 20-day volume weighted average closing price of $33.95 per share as of March 26, 2021 (2) Price / tangible book value per share of 150% including special dividend paid in February Transaction Overview
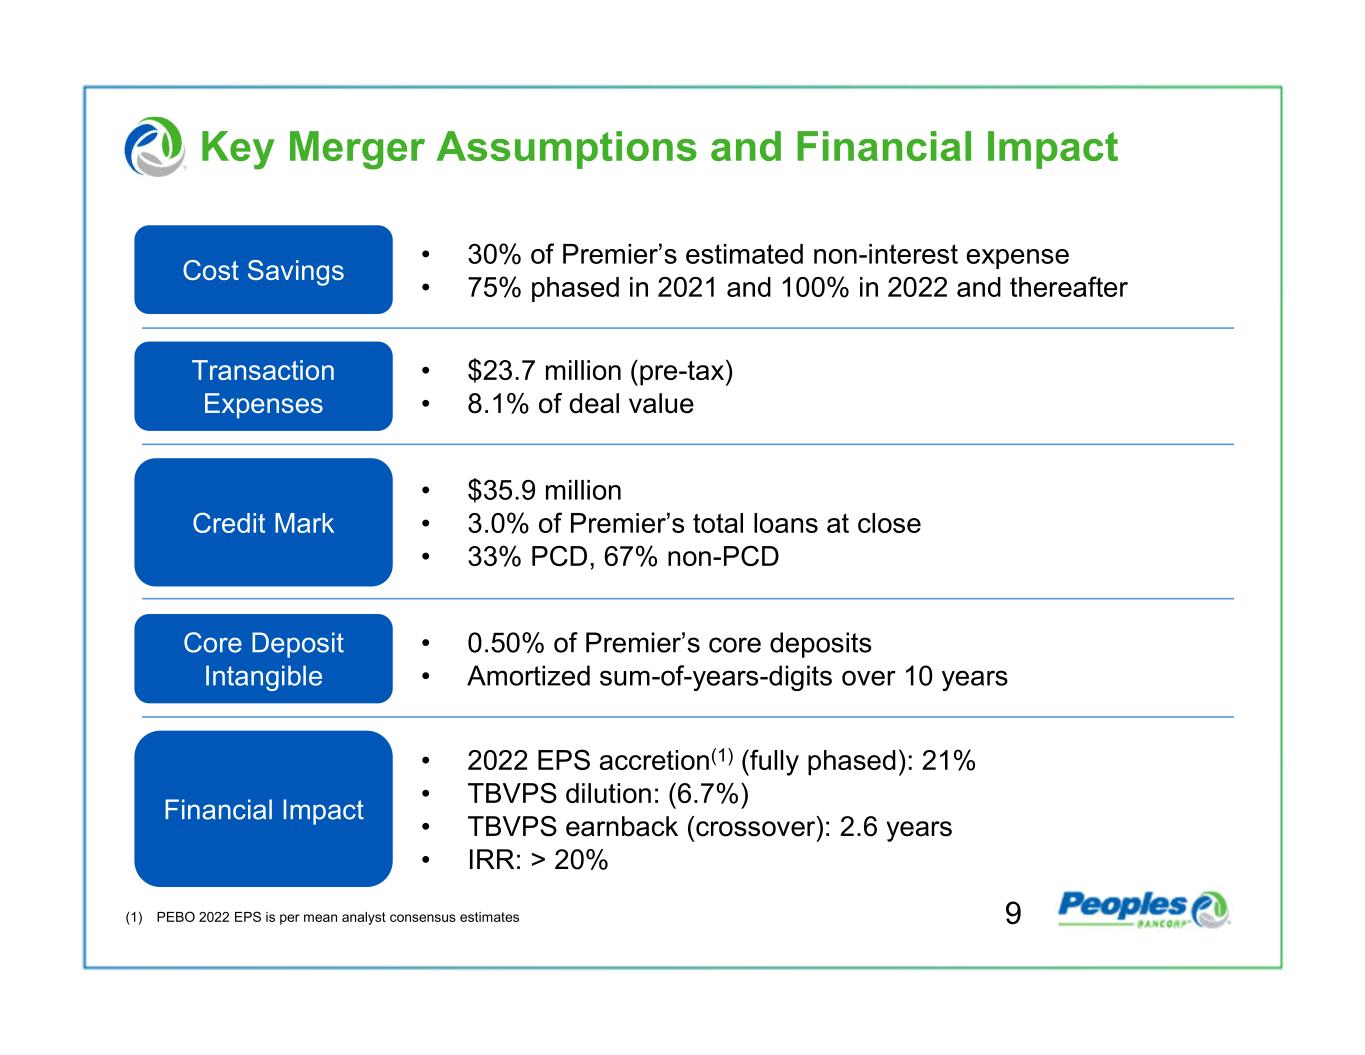
Cost Savings • 30% of Premier’s estimated non-interest expense • 75% phased in 2021 and 100% in 2022 and thereafter Transaction Expenses • $23.7 million (pre-tax) • 8.1% of deal value Credit Mark • $35.9 million • 3.0% of Premier’s total loans at close • 33% PCD, 67% non-PCD Financial Impact • 2022 EPS accretion(1) (fully phased): 21% • TBVPS dilution: (6.7%) • TBVPS earnback (crossover): 2.6 years • IRR: > 20% Core Deposit Intangible • 0.50% of Premier’s core deposits • Amortized sum-of-years-digits over 10 years (1) PEBO 2022 EPS is per mean analyst consensus estimates Key Merger Assumptions and Financial Impact 9
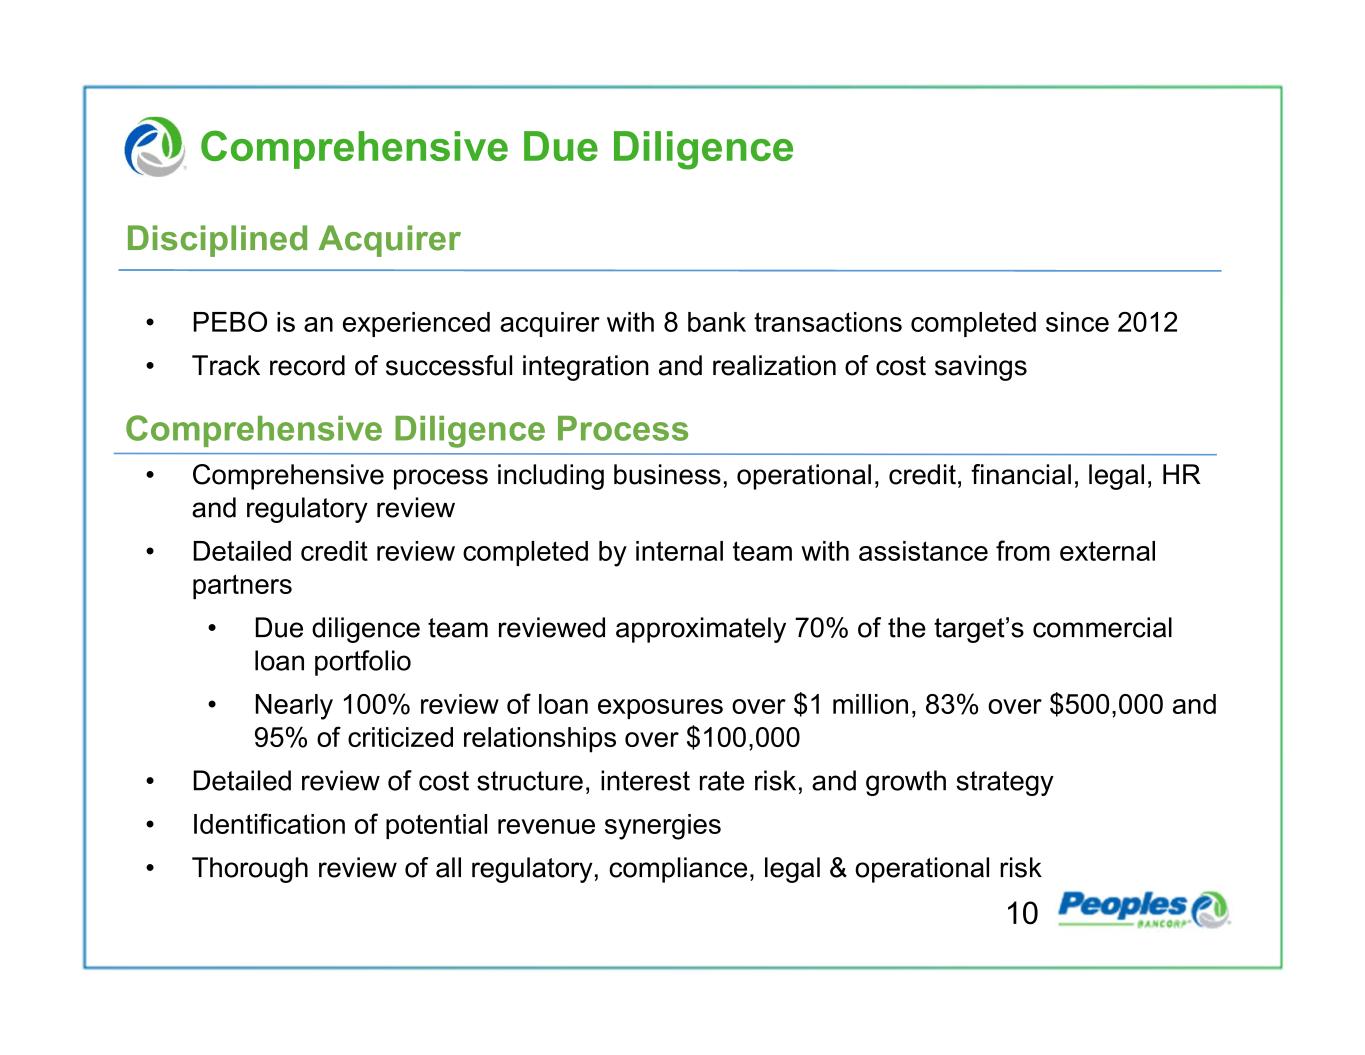
Comprehensive Due Diligence 10 • PEBO is an experienced acquirer with 8 bank transactions completed since 2012 • Track record of successful integration and realization of cost savings • Comprehensive process including business, operational, credit, financial, legal, HR and regulatory review • Detailed credit review completed by internal team with assistance from external partners • Due diligence team reviewed approximately 70% of the target’s commercial loan portfolio • Nearly 100% review of loan exposures over $1 million, 83% over $500,000 and 95% of criticized relationships over $100,000 • Detailed review of cost structure, interest rate risk, and growth strategy • Identification of potential revenue synergies • Thorough review of all regulatory, compliance, legal & operational risk Comprehensive Diligence Process Disciplined Acquirer

Transaction Highlights • Bolsters presence in core markets and creates a logical gateway for future growth opportunities • Entry into attractive markets within Virginia, Maryland, and Washington DC • Ability to expand enhanced product offerings, including insurance and wealth management, to existing and new clients throughout Premier’s footprint • Lower-risk transaction provides for a seamless integration • Provides access to additional low-cost deposits • Enhances Peoples’ growth strategy by leveraging larger balance sheet and product set across existing footprint and new markets • Financially attractive with strong, double-digit earnings accretion (fully phased-in) and manageable tangible book earnback • Experienced acquirer with significant integration experience 11

Acquisition of North Star Leasing

$25,806 $35,482 $36,383 $38,706 $49,615 $68,914 $69,674 $0 $10 ,000 $20 ,000 $30 ,000 $40 ,000 $50 ,000 $60 ,000 $70 ,000 $80 ,000 2014 2015 2016 2017 2018 2019 2020 North Star Leasing Overview • Founded in 1979 and headquartered in Burlington, VT, NSL leases a broad range of essential equipment used by small-and medium-sized businesses across the U.S. • NSL is an integrated originations, underwriting and servicing platform serving over 1,250 active vendors (80% of originations) and brokers (20%) • Originations have grown 18% annually from 2014 to 2020 • Net investment of $90 million, comprised of over 4,500 leases at an average yield of 18% • Average transaction size of $30,000 (for new originations). Underwriting is conducted through a combination of traditional underwriting and automated scoring. Personal guarantees on more than 95% of portfolio. While guarantors have an average FICO of 699, NSL generally requires three payments upfront and structurally mitigates weaker credits • Tenured management team Originations ($000) Equipment Type 13 Other 40% Manufacturing 27% Restaurant 12% Heavy Equipment 8% Titled - Vocational 6% Medical 4% Landscaping 3%

Strategic Rationale • Combination with our premium finance business will improve our core growth, net interest margin, and earnings • Experienced, data-driven team with small-ticket expertise Valuation • 100% cash consideration • $47.5 million at closing, with a maximum consideration of $50.63 million Financial Implications(1) • 13.1% accretive to 2022 EPS (approximately $0.37)(2) • Tangible book value earnback of 3.4 years • IRR greater than 45% Timing • Targeted closing March 31, 2021 (1) Financial implications exclude any impact from the announced acquisition of Premier Financial Bancorp, Inc. (2) PEBO 2022 EPS is per mean analyst consensus estimates Transaction Summary and Highlights 14

Peoples + Premier + North Star
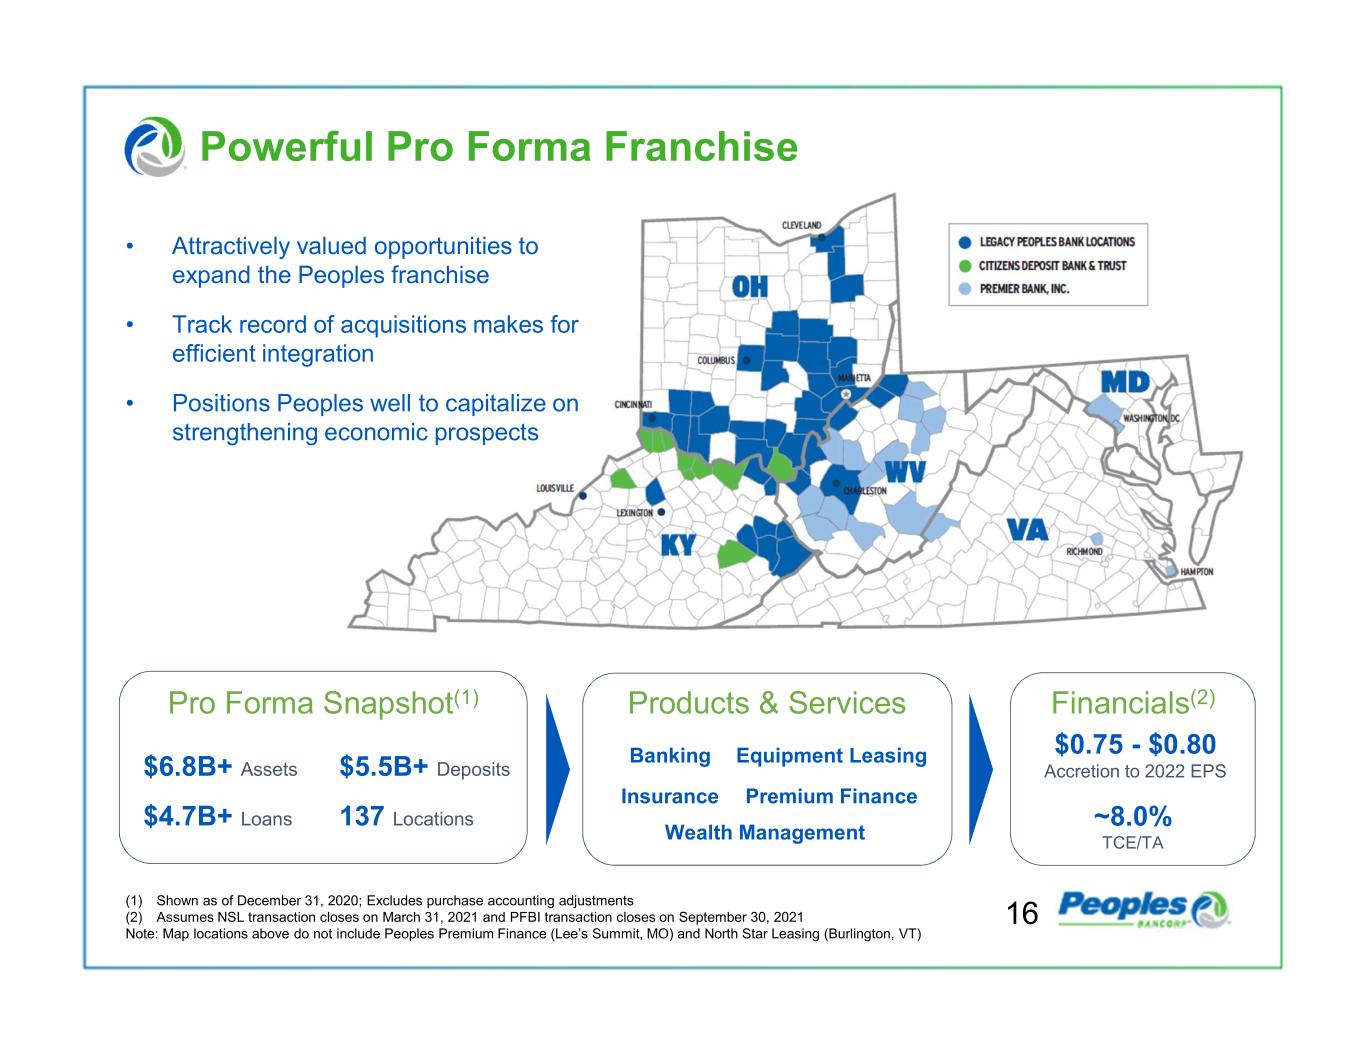
Powerful Pro Forma Franchise Pro Forma Snapshot(1) Products & Services $6.8B+ Assets $4.7B+ Loans $5.5B+ Deposits 137 Locations Banking Equipment Leasing ~8.0% TCE/TA $0.75 - $0.80 Accretion to 2022 EPS (1) Shown as of December 31, 2020; Excludes purchase accounting adjustments (2) Assumes NSL transaction closes on March 31, 2021 and PFBI transaction closes on September 30, 2021 Note: Map locations above do not include Peoples Premium Finance (Lee’s Summit, MO) and North Star Leasing (Burlington, VT) 16 • Attractively valued opportunities to expand the Peoples franchise • Track record of acquisitions makes for efficient integration • Positions Peoples well to capitalize on strengthening economic prospects Wealth Management Insurance Premium Finance Financials(2)
Appendix

Dollars in thousands Dollars in thousands Dollars in thousands Loan Type Balance % Loan Type Balance % Loan Type Balance % 1-4 Family $622,245 18.3% 1-4 Family $328,837 25.4% 1-4 Family $951,082 20.2% CRE & Multi-family 856,701 25.1% CRE & Multi 531,715 41.1% CRE & Multi 1,388,416 29.5% C&D 106,858 3.1% C&D 92,648 7.2% C&D 199,506 4.2% Home Equity 122,882 3.6% Home Equity 49,822 3.8% Home Equity 172,704 3.7% C&I 938,691 27.5% C&I 150,329 11.6% C&I 1,089,020 23.2% Specialty Finance 114,758 3.4% Specialty Finance 80,811 6.2% Specialty Finance(1) 195,569 4.2% Consumer & Other 645,464 18.9% Consumer & Other 61,027 4.7% Consumer & Other 706,491 15.0% Total Loans & Leases $3,407,599 100.0% Total Loans & Leases $1,295,189 100.0% Total Loans & Leases $4,702,788 100.0% PPP Loans $366,902 PPP Loans $62,000 PPP Loans $428,902 MRQ Yield on Loans: 4.06% MRQ Yield on Loans: 5.37% MRQ Yield on Loans: 4.42% 1-4 Family 18.3% CRE & Multi- family 25.1% C&D 3.1% Home Equity 3.6% C&I 27.5% Specialty Finance 3.4% Consumer & Other 18.9% 1-4 Family 25.4% CRE & Multi- family 41.1% C&D 7.2% Home Equity 3.8% C&I 11.6% Specialty Finance 6.2% Consumer & Other 4.7% 1-4 Family 20.2% CRE & Multi- family 29.5% C&D 4.2% Home Equity 3.7% C&I 23.2% Specialty Finance 4.2% Consumer & Other 15.0% Combined Source: S&P Global Market Intelligence Note: Financial data as of December 31, 2020; Excludes purchase accounting adjustments (1) Includes premium finance loans and leases acquired from NSL acquisition; Targeting less than 10% of total assets Pro Forma Loan Composition 18

Pro Forma Deposit Composition Dollars in thousands Dollars in thousands Dollars in thousands Deposit Type Balance % Deposit Type Balance % Deposit Type Balance % Non-Interest $997,323 25.5% Non-Interest $487,675 29.9% Non-Interest $1,484,998 26.8% Int-DDA, MM, Savings 2,405,910 61.5% Int-DDA, MM, Savings 820,513 50.2% Int-DDA, MM, Savings 3,226,423 58.2% CDs < $250K 419,025 10.7% CDs < $250K 261,917 16.0% CDs < $250K 680,942 12.3% CDs > $250K 88,201 2.3% CDs > $250K 63,635 3.9% CDs > $250K 151,836 2.7% Total Deposits $3,910,459 100.0% Total Deposits $1,633,740 100.0% Total Deposits $5,544,199 100.0% MRQ Cost of Deposits: 0.29% MRQ Cost of Deposits: 0.27% MRQ Cost of Deposits: 0.29% Non-Interest 25.5% Int-DDA, MM, Savings 61.5% CDs < $250K 10.7% CDs > $250K 2.3% Non-Interest 29.9% Int-DDA, MM, Savings 50.2% CDs < $250K 16.0% CDs > $250K 3.9% Non-Interest 26.8% Int-DDA, MM, Savings 58.2% CDs < $250K 12.3% CDs > $250K 2.7% Combined Source: S&P Global Market Intelligence Note: Financial data as of December 31, 2020; Excludes purchase accounting adjustments 19

Premier Financial Highlights ($000s) 2016Y 2017Y 2018Y 2019Y 2020Y Balance Sheet Total Assets 1,496,193 1,493,424 1,690,115 1,781,010 1,945,822 Total Loans HFI 1,024,823 1,049,052 1,149,301 1,195,295 1,214,395 Total Deposits 1,279,386 1,272,675 1,430,127 1,495,753 1,633,740 Loans / Deposits (%) 80 82 80 80 74 Yield on Loans (%) 5.23 5.32 5.38 5.65 5.27 Cost of IB Deposits (%) 0.40 0.40 0.56 0.84 0.57 Capital Position Total Equity 174,184 183,355 216,729 240,241 259,907 Tang. Common Equity 134,464 144,609 163,821 187,225 207,843 TCE Ratio (%) 9.23 9.94 10.01 10.83 10.98 Profitability Net Income 12,174 14,819 20,168 24,196 22,438 ROAA (%) 0.82 0.99 1.30 1.40 1.20 ROATCE (%) 9.53 10.81 13.63 13.88 11.53 Non-int. Inc. / Avg. Assets (%) 0.55 0.58 0.58 0.54 0.45 Non-int. Exp. / Avg. Assets (%) 2.63 2.58 2.55 2.45 2.29 Efficiency Ratio (%) 61.0 56.6 56.2 54.1 55.1 Net Interest Margin (%) 3.93 4.18 4.13 4.18 3.83 Asset Quality and LLR NPAs / Assets (%) 3.12 3.20 2.23 1.67 1.16 LLR / Gross Loans (%) 1.06 1.15 1.20 1.13 1.11 NCOs / Avg. Loans (%) 0.06 0.12 0.06 0.12 0.28 Source: S&P Global Market Intelligence 20
