Attached files
UNITED STATES SECURITIES AND EXCHANGE COMMISSION
WASHINGTON, D.C. 20549
FORM 10-K
(MARK ONE)
| ☒ | ANNUAL REPORT PURSUANT TO SECTION 13 OR 15(d) OF THE SECURITIES EXCHANGE ACT OF 1934 |
For the fiscal year ended December 31, 2020
| ☐ | TRANSITION REPORT PURSUANT TO SECTION 13 OR 15(d) OF THE SECURITIES EXCHANGE ACT OF 1934 |
FOR THE TRANSITION PERIOD FROM TO
Commission File No. 001-36260
CYPRESS ENVIRONMENTAL PARTNERS, L.P.
(Exact name of registrant as specified in its charter)
| Delaware | 61-1721523 |
| (State or other jurisdiction of incorporation or organization) | (I.R.S. Employer Identification No.) |
| 5727 South Lewis Avenue, Suite 300 | |
| Tulsa, Oklahoma | 74105 |
| (Address of principal executive offices) | (Zip Code) |
(Registrant’s telephone number, including area code): (918) 748-3900
Securities registered pursuant to Section 12(b) of the Act:
| Title of each class | Trading Symbol(s) | Name of each exchange on which registered |
| Common Units | CELP | New York Stock Exchange |
Indicate by check mark if the registrant is a well-known seasoned issuer, as defined in Rule 405 of the Securities Act. Yes ☐ No ☒
Indicate by check mark if the registrant is not required to file reports pursuant to Section 13 or Section 15(d) of the Act. Yes ☐ No ☒
Indicate by check mark whether the registrant (1) has filed all reports required to be filed by Section 13 or 15(d) of the Securities Exchange Act of 1934 during the preceding 12 months (or for such shorter period that the registrant was required to file such reports), and (2) has been subject to such filing requirements for the past 90 days. Yes ☒ No ☐
Indicate by check mark whether the registrant has submitted electronically every Interactive Data File required to be submitted and posted pursuant to Rule 405 of Regulation S-T during the preceding 12 months (or for such shorter period that the registrant was required to submit and post such files). Yes ☒ No ☐
Indicate by check mark whether the registrant is a large accelerated filer, an accelerated filer, a non-accelerated filer, a smaller reporting company or an emerging growth company. See the definitions of “large accelerated filer,” “accelerated filer,” “smaller reporting company” and “emerging growth company” in Rule 12b-2 of the Exchange Act. (Check one):
| Large accelerated filer ☐ | Accelerated filer ☐ | Non-accelerated filer ☐ | Smaller reporting company ☒ | Emerging growth company ☐ |
If an emerging growth company, indicate by check mark if the registrant has elected not to use the extended transition period for complying with any new or revised financial accounting standards provided pursuant to Section 13(a) of the Exchange Act. ☐
Indicate by check mark whether the registrant has filed a report on and attestation to its management’s assessment of the effectiveness of its internal control over financial reporting under Section 404(b) of the Sarbanes-Oxley Act (15 U.S.C. 7262(b)) by the registered public accounting firm that prepared or issued its audit report. Yes ☐ No ☒
Indicate by check mark whether the registrant is a shell company (as defined in Rule 12b-2 of the Exchange Act). Yes ☐ No ☒
The aggregate market value of the registrant’s Common Units Representing Limited Partner Interests held by non-affiliates computed by reference to the price at which the limited partner units were last sold as of June 30, 2020 was $17,978,753.
As of March 15, 2021, the registrant had 12,331,305 common units outstanding.
DOCUMENTS INCORPORATED BY REFERENCE: NONE
2
GLOSSARY OF TERMS
The following includes a description of the meanings of some of the terms used in this Annual Report on Form 10-K.
| “Dig site” | The location where pipeline maintenance occurs by excavating the ground above the pipeline. |
| “Environmental Services” | Our Water and Environmental Services segment comprised of produced water pipelines and our water treatment facilities located in the Williston basin in North Dakota (also known as the Bakken). |
| “Flowback water” | The fluid that returns to the surface for treatment following the completion of a new oil or natural gas well. |
| “Gun barrel” | A settling tank located at our water treatment facilities that is used for separating water and oil to clean the water prior to disposal. |
| “Hydraulic fracturing” | A process utilized by our customers in the completion of a new oil and gas well. Our customers pump fluids, mixed with granular proppant, into a geological formation at various pressures sufficient to create fractures in the hydrocarbon-bearing rock to release the oil and gas. |
| “Hydrotesting” | A process utilized in many industries to ensure that a vessel, pipeline, or tank is safe to operate and not leaking. The vessel, pipeline, or tank is filled with water and pressurized air to the rated maximum burst pressure to inspect for leaks. |
| “In-line inspection” | An inspection technique used to assess the integrity of pipelines from the inside of a pipe. Different technologies are utilized to identify metal loss or corrosion. In-line inspection is also frequently called “smart pigging”. |
| “IPO” | Our January 2014 initial public offering of common units representing limited partner interests in us. |
| “Injection intervals” | We own and operate EPA class II injection wells at our water treatment facilities that are regulated by the North Dakota Industrial Commission (“NDIC”). The NDIC determines the injection intervals and depths for us to safely re-inject treated fluids back into the earth where it originated as part of the production of oil and gas by our upstream customers. |
| “Inspection Services” | Our Inspection Services segment provides inspection and integrity services to public utility, upstream, midstream, and downstream energy companies. We offer many different types of inspection services including corrosion, welds, cathodic protection, utilities, among others. We are expanding our inspection services to new markets including municipal water, sewer, renewables, offshore, bridges, and electrical transmission infrastructure. |
| “Natural gas liquids” | The combination of ethane, propane, butane, isobutene and natural gasolines that, when removed from natural gas, become liquid under various levels of higher pressure and lower temperature. |
| “NDE” | Nondestructive examination is a service we offer our customers to test the integrity of their infrastructure. NDE is utilized in many industries including energy, municipal water, municipal sewer, electrical transmission, renewables, bridges, aviation, among others. We currently offer our NDE services to energy customers but plan to begin offering NDE services to other industries in the future. |
| “OPEC” | The Organization of Petroleum Exporting Countries. |
| “Pig tracking” | Our customers utilize in-line inspection tools (also commonly called smart pigs) to inspect their pipelines. We offer services to track these tools or smart pigs as the tool moves through buried pipeline. Pig tracking includes the locating, mapping and monitoring of the in-line inspection pig. |
| “Pipeline & Process Services” | Our Pipeline & Process Services segment includes Cypress Brown Integrity (“CBI”). CBI offers our customers hydrotesting, chemical cleaning, drying, water treatment, nitrogen, and other related services. |
| “Produced water” | Our Environmental Services segment operates water treatment facilities that process and inject produced water that occurs when upstream customers operate oil and natural gas wells. Produced water is naturally occurring water found in hydrocarbon-bearing formations that flows to the surface along with oil and natural gas. |
| “Proppant” | Our upstream customers utilize proppant in the completion of new oil and gas wells. Proppant can be sand or other small man-made small particles that are mixed with fracturing fluid during the hydraulic fracturing process to hold fractures open to extract oil and gas from rock. |
| “Residual oil” | We separate oil and water at our water treatment facilities in North Dakota. The recycled recovered oil is then sold. |
| “Separation tank” | Our water treatment facilities in North Dakota have cylindrical or spherical vessels used to separate oil, gas and water from the total fluid stream produced by the oil and gas wells of our customers. |
| “Settling tank” | Our water treatment facilities in North Dakota have non-circulating storage tanks where gravitational segregation forces separate liquids from solids. |
| “Staking” | Our Inspection Services segment offers our customer a variety of services to locate their pipelines. Staking is the process of marking the location where pipeline maintenance will occur. |
3
NAMES OF ENTITIES
Unless the context otherwise requires, references in this Annual Report on Form 10-K to “Cypress Environmental Partners, L.P.,” “our partnership,” “we,” “our,” “us,” or like terms, refer to Cypress Environmental Partners, L.P. and its subsidiaries.
References to:
| ● | “CBI” refers to Cypress Brown Integrity, LLC, a 51% owned subsidiary of CEP LLC; |
| ● | “CEM LLC” refers to Cypress Environmental Management, LLC, a wholly-owned subsidiary of the General Partner; |
| ● | “CEM TIR” refers to Cypress Environmental Management – TIR, LLC, a wholly-owned subsidiary of CEM LLC; |
| ● | “CEP LLC” refers to Cypress Environmental Partners, LLC, a wholly-owned subsidiary of the Partnership; |
| ● | “CF Inspection” refers to a nationally certified women owned business, CF Inspection Management, LLC, owned 49% by TIR-PUC and consolidated under generally accepted accounting principles by TIR-PUC. CF Inspection is 51% owned, managed and controlled by Cynthia A. Field, an affiliate of Holdings and a Director of our General Partner; |
| ● | “General Partner” refers to Cypress Environmental Partners GP, LLC, a subsidiary of Cypress Environmental GP Holdings, LLC; |
| ● | “Holdings” refers to Cypress Environmental Holdings, LLC (formerly Cypress Energy Holdings, LLC), the owner of Holdings II; |
| ● | “Holdings II” refers to Cypress Energy Holdings II, LLC, the owner of 5,610,549 common units representing 46% of our outstanding common units as of March 15, 2021; |
| ● | “Partnership” refers to the registrant, Cypress Environmental Partners, L.P.; |
| ● | “TIR Entities” refer collectively to various Tulsa Inspection Resources, LLC entities including TIR LLC; TIR-Canada, TIR-PUC and CF Inspection; |
| ● | “TIR-Canada” refers to Tulsa Inspection Resources – Canada, ULC, a wholly-owned subsidiary of TIR LLC; |
| ● | “TIR LLC” refers to Tulsa Inspection Resources, LLC, a wholly-owned subsidiary of CEP LLC; |
| ● | “TIR-PUC” refers to Tulsa Inspection Resources – PUC, LLC, a subsidiary of TIR LLC that has elected to be treated as a corporation for U.S. federal income tax purposes. |
4
CAUTIONARY REMARKS REGARDING FORWARD LOOKING STATEMENTS
The information discussed in this Annual Report on Form 10-K includes “forward-looking statements.” These forward-looking statements are identified by their use of terms and phrases such as “may,” “expect,” “estimate,” “project,” “plan,” “believe,” “intend,” “achievable,” “anticipate,” “continue,” “potential,” “should,” “could,” and similar terms and phrases. Although we believe that the expectations reflected in these forward-looking statements are reasonable, they do involve certain assumptions, risks and uncertainties and we can give no assurance that such expectations or assumptions will be achieved. Important factors that could cause actual results to differ materially from those in the forward-looking statements are described under “Item 1A - Risk Factors” and “Item 7 - Management’s Discussion and Analysis of Financial Condition and Results of Operations” in this Annual Report. All forward-looking statements attributable to us or persons acting on our behalf are expressly qualified in their entirety by the cautionary statements in this paragraph and elsewhere in this Annual Report on Form 10-K and speak only as of the date of this Annual Report on Form 10-K. Other than as required under the securities laws, we do not assume a duty to update these forward- looking statements, whether as a result of new information, subsequent events or circumstances, changes in expectations or otherwise.
RISK FACTORS SUMMARY
Our business is subject to numerous risks. The following is a summary of the principal risks and uncertainties that could have a material adverse effect on our business, cash flows, financial condition and/or results of operations. This summary is not complete and the risks summarized below are not the only risks we face. You should review and consider carefully the risks and uncertainties described in more detail in the “Risk Factors” section of this Annual Report on Form 10-K which includes a more complete discussion of the risks summarized below as well as a discussion of other risks related to our business and an investment in our common stock.
| ● | Our ability to earn revenue is dependent on the level of activity of our customers. Most of our customers are owners of energy infrastructure (pipelines, storage facilities, refineries, gas plants, compression and pump stations, among others), public utilities that distribute natural gas and electricity to homes and businesses, and construction companies that build assets for owners of energy infrastructure. The energy industry has historically experienced significant fluctuations in activity as a result of ongoing changes in supply and demand and the resultant fluctuations in commodity prices. The downturn in activity in the energy industry in 2020 had a significant adverse effect on our revenues, and a sustained level of low activity would continue to have a significant adverse effect on our revenues. |
| ● | Most of our agreements with customers do not commit the customers to purchase our services for extended periods of time. We operate in highly competitive business with low barriers to entry relative to many other industries. For these reasons, we must continually compete to earn revenue. |
| ● | We serve over one hundred different customers, but our top five customers represented over 50% of our revenues in 2020. |
| ● | We have a revolving credit facility with a syndicate of banks. We are required to maintain compliance with certain financial statement ratios at each quarter end. If we are unable to meet these covenants, we would require a covenant waiver. If we were unable to obtain a covenant waiver, we could go into default on the credit agreement. |
| ● | One of the covenants in the credit agreement limits our borrowing capacity at each quarter end to a specified multiple of trailing-twelve-month EBITDA (as defined in the credit agreement). This covenant could restrict our ability to borrow funds for working capital needs, which could constrain our ability to grow and generate revenues. |
| ● | Our revolving credit facility was recently renewed, modified, and matures in May 2022. If we are unable to extend the maturity date or to find alternative financing, we could go into default on the credit agreement. |
| ● | As amended in March 2021, our credit agreement contains significant limitations on our ability to pay cash distributions to our common and preferred unitholders. Our preferred units rank senior to our common units, and we must pay distributions on our preferred units (including any arrearages) before paying distributions on our common units. Our amended credit facility does allow for tax distributions if required. |
| ● | Our field operations are subject to safety risks that could expose us to substantial liability for personal injury, wrongful death, property damage, pollution, and other environmental damages. Such incidents affect could adversely affect operating costs, insurability, and relationships with employees and regulators. Many customers monitor the safety metrics of their service providers, and when we are unable to meet a customer’s target safety metrics, the customer may choose to hire different service providers. We carry various types of insurance with a variety of different coverages, deductibles, and exclusions. Insurance rates have been subject to wide fluctuations, and changes in coverage could result in less coverage, increases in cost, higher deductibles and retentions, and more exclusions. |
| ● | We are subject to litigation involving allegations of violations of the Fair Labor Standards Act and state wage and hour laws. In addition, we generally indemnify our customers for claims related to the services we provide and actions we take under our contracts, including claims regarding the Fair Labor Standards Act and state wage and hour laws, and, in some instances, we may be allocated risk through our contract terms for actions by our customers or other third parties. Claims related to the Fair Labor Standards Act are generally not covered by insurance. We have incurred, and expect to continue to incur, significant legal expenses in defending against these claims. In 2020 we recorded $0.4 million of expense associated with completed or proposed settlements of certain of these matters. We have employment agreements with most of our current inspectors that require mandatory arbitration and a bar on class action litigation, although we have former inspectors that did not have agreements with these provisions. |
| ● | Our tax treatment depends on our status as a partnership for federal income tax purposes. Certain inspection services are not qualifying income and we therefore have separate taxable entities that pay state and federal income tax on these earnings. |
| ● | Our unitholders may be required to pay taxes on their share of our income even if they do not receive any cash distributions from us. |
| ● | If we are not able to successfully manage the aforementioned risks and other risks described in the “Risk Factors” section of this Annual Report on Form 10-K, we could be required to undertake a restructuring. |
5
| ITEM 1. | BUSINESS |
Overview
Cypress Environmental Partners, L.P. (“we”, “us”, “our”, the “Partnership”) is a Delaware limited partnership formed on September 19, 2013. Our suite of services includes inspection, testing, recycling, survey, water treatment, and other environmental services that help our customers protect people, property, infrastructure, and the environment with a focus on safety and sustainability. We work closely with our customers to help them protect the environment, property, and people. Our services also help our clients comply with increasingly complex federal and state environmental and safety rules and regulations. The substantial majority of our environmental services are required services under various federal and state laws. Trading of our common units began January 15, 2014 on the New York Stock Exchange under the symbol “CELP”.
Our business is organized into three reportable segments: (1) Inspection Services (“Inspection Services”), comprising the TIR Entities’ operations, (2) Pipeline & Process Services (“Pipeline & Process Services”), consisting of CBI’s operations and (3) Water and Environmental Services (“Environmental Services”), representing water treatment activities in our water treatment entities. Other potential lines of business outlined in U.S. Treasury Regulations and our Internal Revenue Service (“IRS”) private letter ruling (“PLR”) would allow us to further diversify our business lines and activities. We are currently focused on expanding our Inspection Services into other markets that are not IRS qualifying income under our PLR including:
| ● | Municipal water and sewer |
| ● | Electrical transmission systems |
| ● | Bridges |
| ● | Offshore |
| ● | Coatings including marine/ships |
| ● | Renewable energy sources including wind, and solar, and hydroelectric. |
The Inspection Services segment generates revenue primarily by providing essential environmental services, including inspection and integrity services on a variety of infrastructure assets such as midstream pipelines, gathering systems, and distribution systems. These services are offered on existing infrastructure as well as new construction. This segment generally follows a just in time (“JIT”) business model whereby we only hire inspectors when we have work to perform for a customer. We hire these inspectors as W-2 employees from our proprietary database based upon qualifications, certifications, and experience. These inspectors utilize their own four-wheel drive vehicles and we therefore do not have substantial capital expenditure requirements. Services include nondestructive examination (“NDE”), in-line inspection support, pig tracking, survey, data gathering, and supervision of third-party contractors. Our revenues in this segment are driven primarily by the number of inspectors that perform services for our customers and the fees that we charge for those services, which depend on the type, skills, technology, equipment, and number of inspectors used on a particular project, the nature of the project, and the duration of the project. The number of inspectors engaged on projects is driven by the type of project, prevailing market rates, the age and condition of customers’ assets including pipelines, gas plants, compression stations, pump stations, storage facilities, and gathering and distribution systems including the legal and regulatory requirements relating to the inspection and maintenance of those assets. We also bill our customers for per diem charges, mileage, and other reimbursement items. We generally do not earn any margin on pass-through expenses such as per diem charges and mileage that we offer to our field inspectors who travel away from their residence. Revenue and costs in this segment are subject to seasonal variations and interim activity may not be indicative of yearly activity, considering that many of our customers develop yearly operating budgets and enter into contracts with us during the winter season for work to be performed during the remainder of the year. Additionally, inspection work throughout the United States during the winter months (especially in the northern states) may be hampered or delayed due to inclement weather.
The Pipeline & Process Services segment generates revenue primarily by providing essential environmental services including hydrostatic testing, chemical cleaning, water transfer and recycling, pumping, pigging, flushing, filling, dehydration, caliper runs, in-line inspection tool run support, nitrogen purging, and drying services to energy companies and pipeline construction companies. We perform services on both newly-constructed and existing pipelines and related infrastructure. We generally charge our customers in this segment on a fixed-bid basis, depending on the scope of work, size and length of the pipeline being tested, the complexity of services provided, and the utilization of our work force and equipment. We own a substantial amount of equipment to perform these services and frequently rent additional equipment as needed. Our results in this segment are driven primarily by the number of projects we are awarded and the nature and duration of the projects. Revenue and costs may be subject to seasonal variations and interim activity may not be indicative of yearly activity, considering that many of our customers develop yearly operating budgets and enter into contracts with us during the winter for work to be performed during the remainder of the year. Additionally, field work during the winter months may be hampered or delayed due to inclement weather.
The Environmental Services segment owns and operates nine (9) water treatment facilities with ten (10) EPA Class II injection wells in the Bakken shale region of the Williston Basin in North Dakota. We wholly-own eight of these water treatment facilities and we own a 25% interest in the other facility that we developed and manage. These water treatment facilities are connected to thirteen (13) pipeline gathering systems, including two (2) that we developed and own. We specialize in the treatment, recovery, separation, and disposal of waste byproducts generated by our customers during the lifecycle of an oil and natural gas well to protect the environment and our drinking water. All of the water treatment facilities utilize specialized equipment, technology, and remote monitoring to minimize the facilities’ downtime and increase the facilities’ efficiency for peak utilization. Revenue is generated on a fixed-fee per barrel basis for receiving, separating, filtering, recovering, processing, and injecting produced and flowback water. We also sell recovered oil, receive fees for pipeline transportation of water, and receive fees from a partially owned water treatment facility for management and staffing services.
The volume of water processed at our water treatment facilities is driven by water volume generated from existing oil and natural gas wells during their useful lives and new oil wells that are drilled and completed. Our customers' willingness to invest in new drilling is determined by a number of factors, the most important of which are the current and projected prices of oil; the cost to drill and operate a well; the availability and cost of capital; and environmental and governmental regulations. We generally expect the level of drilling to correlate with long-term trends in prices of oil.
Our Relationship with Holdings
All of the equity interests in our general partner are indirectly owned by Holdings and its affiliates. Holdings is owned by Charles C. Stephenson, Jr.; entities related to Mr. Stephenson’s family; his daughter Cynthia A. Field; and a company controlled by our Chairman, Chief Executive Officer and President, Peter C. Boylan III. Holdings’ owners bring substantial industry knowledge, experience, relationships and specialized, value-creation capabilities that we believe continue to benefit us. Mr. Stephenson has over 50 years of experience as a leader in the energy industry. He was the founder, Chairman and Chief Executive Officer of Vintage Petroleum prior to its sale to Occidental Petroleum in 2006 and is also the retired Chairman of Premier Natural Resources, a private oil and natural gas exploration and production company that he co-founded. Mr. Boylan has extensive executive management experience with public and private companies and also has extensive public company directorship experience. As the owners of our general partner and the direct or indirect owners of 64% of our outstanding common units and all of our outstanding preferred units, Holdings and its affiliates have a strong alignment of interests with our noncontrolling unitholders.
6
Business Strategies
Our principal business objective is to build a diversified partnership providing essential environmental services that will allow us, over time, to incrementally increase the cash flow we generate from our operations. We pursue the following business strategies:
| ● | Inspection Services. We intend to continue to position ourselves as a trusted provider of high-quality essential inspection services. Over the last few years, new laws have been enacted in the United States that, in the future, will require customers to undertake more frequent and more extensive inspections of their energy infrastructure and pipeline assets. Additionally, a significant portion of the pipeline infrastructure in North America was installed decades ago and is therefore more susceptible to degradation requiring more frequent inspections. We believe that increasingly stringent U.S. federal and state laws and regulations and aging pipeline infrastructure will result in increased need for inspection and integrity services and higher demand for independent, third-party inspectors capable of navigating these complicated requirements. Most of our clients are large public companies that often have long lead time expansion projects that require our services. Our clients also require ongoing maintenance and integrity work on their aging pipelines and other energy infrastructure. Our business is not immune to economic changes in the energy industry; however, we believe that we can grow organically by acquiring new customers and additional work from existing customers. Today, we estimate that we serve less than 8% of the available potential customers in the energy industry. We also plan to expand our inspection services into new markets not exposed to commodity prices including: |
| • | Municipal water and sewer |
| • | Electrical transmission systems |
| • | Bridges |
| • | Offshore |
| • | Coatings including marine/ships |
| • | Renewable energy sources including wind, solar, and hydroelectric. |
Each of these new markets requires the same skills our inspectors currently have, including welding, coatings, corrosion, NDE, cathodic protection, among others. We continue to invest in our business development and account management teams to pursue these and other opportunities.
| ● | Pipeline & Process Services. We intend to continue to position ourselves as a trusted provider of hydrotesting and other integrity services. We believe we have demonstrated the ability to perform large and complex integrity projects reliably. During 2018, we opened a new office in Odessa, Texas, to better serve the growing Permian basin market. In early 2019, we opened a new location in the Houston market to help us take advantage of the growing work in the industry. We plan to continue to focus on the potential synergies that may develop between this segment and our other business segments, including a privately owned pipeline & process services business based in Scott, Louisiana that is owned by a subsidiary of Holdings. We continue to enjoy an excellent reputation in the industry and continue to bid on new work. Historically, we have performed most of our services in Texas and in neighboring states, although we also have the ability to deploy teams to locations farther away from our base of operations in Texas. In 2020, we won a small percentage of the projects that occurred in Texas. We plan to aggressively pursue announced projects in Texas and other states to generate revenues. |
| ● | Environmental Services. This segment represents a small percentage of our overall business and our primary focus remains on inspection and related integrity services. We divested our Permian basin facilities in 2018. We have no plans to build new facilities and may divest one or more of our remaining facilities. We continue to look for dedicated pipeline opportunities with customers that will secure additional water volumes for our water treatment facilities. We remain an approved vendor for many prestigious E&P companies that demand very high standards from their vendors. Although the oil and gas industry is cyclical in nature, we currently derive a significant portion of our volume and revenue from existing oil wells. When customers complete new wells near our facilities, we have the opportunity to treat additional volumes of water. We intend to capitalize on the continued demand for removal, treatment, storage and disposal of flowback and produced water by continuing to position ourselves as a trusted, dependable provider of safe, high-quality water and environmental services to our customers. We estimate that we utilized approximately 22% of the aggregate annual capacity of 35.3 million barrels of these facilities in 2020, evidencing capacity for growth without additional capital expenditures. We currently have 13 pipelines connected to four of our water treatment facilities. Because many of the costs of constructing and operating a water treatment facility are either upfront capital costs or fixed costs, we expect that increased utilization of our existing water treatment facilities would lead to increased operating cash flow in the Environmental Services segment. We continue to focus on increasing pipeline water delivered to our facilities. Pipeline water was 66% of the total water volume in 2020. |
| ● | Leverage customer relationships in our business segments. We continue to pursue development opportunities with customers that lead to cross-selling opportunities between our business segments. Many customers of the Environmental Services segment also own gathering systems, storage facilities, gas plants, compression stations, and other pipeline assets to which we can offer inspection and integrity services. Holdings owns a pipeline & process services business that primarily performs offshore services, and an 5G ultra high definition in-line inspection business in Utah that performs services for energy, and municipal water pipelines. We intend to enhance our relationships with our customers by broadening the services we provide; by cross-selling our service offerings and adding complementary service offerings, we believe that we can further integrate into our customers’ operations and increase our profitability and distributable cash flow. |
| ● | Diversify our service offerings. We continue our diversification initiative to begin offering our inspection services to other industries, including renewables (such as wind, solar, hydroelectric), electrical transmission, municipal water, sewer, coatings, and Department of Transportation infrastructure (such as bridges). We have been bidding inspection jobs in these new markets and many of our inspectors and employees have the skills to offer these services to these new markets. Over the long term, we hope to have the majority of our inspection revenue coming from these new segments. |
| ● | Pursue strategic, accretive acquisitions. In 2018, Holdings completed two acquisitions to further broaden our collective suite of environmental services. One acquisition provided entry into the municipal water industry, whereby we can offer our traditional inspection services, including corrosion and nondestructive testing services, as well as in-line inspection (“ILI”). Holdings’ next generation 5G ultra high-resolution magnetic flux leakage (“MFL”) ILI technology called EcoVision™ UHD, is capable of helping pipeline owners and operators better manage the integrity of their assets in both the municipal water and energy industries. We believe Holdings is the only technology provider today capable of offering this service to the large and diverse municipal water industry that provides drinking water to our communities. Holdings has been investing in building ILI tools to serve these markets. |
7
Our Business Segments
Our business operates in three reportable segments: (1) Inspection Services, comprising the TIR Entities’ operations, (2) Pipeline & Process Services, made up of CBI’s operations, and (3) Water and Environmental Services (“Environmental Services”), consisting of water treatment activities. U.S. Treasury Regulations and our IRS private letter ruling (“PLR”) allow for expansion into other lines of business. Our long-term goals continue to be diversifying into other attractive lines of business and expanding our customer base within our existing lines of business. Certain inspection services are not qualifying income under our PLR and we therefore have separate taxable entities that pay state and federal income tax on these earnings.
Inspection Services
Overview. The Inspection Services segment is a leading provider of independent inspection, integrity, and nondestructive examination services to energy and utility industries. We inspect and test infrastructure assets including pipelines, gathering and distribution systems, storage facilities, gas plants, refineries, petrochemical facilities, liquefied natural gas facilities, compression stations, and pumping stations. Our mission is to provide quality environmental services in a safe, professional, ethical, and cost-effective manner that can be tailored to add value for our clients throughout the life of their assets.
We have entered into an agreement with CF Inspection, a nationally-qualified woman-owned company affiliated with one of Holdings’ owners and a Director of our General Partner. CF Inspection allows us to offer various services to clients that require the services of an approved Women’s Business Enterprise (“WBE”), as CF Inspection is certified as a National Women’s Business Enterprise by the Women’s Business Enterprise National Council. We own 49% of CF Inspection and Cynthia A. Field, an affiliate of Holdings and a Director of our General Partner, owns the remaining 51% of CF Inspection.
Operations. Upstream, midstream, downstream , public utility companies, and other pipeline operators are required by federal and state law and regulation to inspect their pipelines, infrastructure assets, and gathering systems on a regular basis in order to protect the environment and ensure public safety. At the beginning of an engagement, our personnel meet with the customer to determine the scope of the project and determine related staffing needs. We then develop a customized staffing plan utilizing our proprietary database of professionals and other recruitment methods. Our inspectors have significant industry experience and are certified to meet the qualification requirements of both the customer and the Pipeline and Hazardous Materials Safety Administration (“PHMSA”). We utilize a just in time (“JIT”) business model whereby we generally only hire an inspector when we have a billable assignment with a client. As the industry continues to adopt new technology, demand has increased for inspectors with greater technical skills and computer proficiencies. Our customers require inspectors to undergo specific training and certifications prior to performing inspection work on their projects. We utilize a number of accrediting agencies including but not limited to the National Center for Construction Education and Research and Veriforce training curricula to train and evaluate employees. In addition to assignment-specific training, welding inspectors and coating inspectors also must meet special certification requirements.
PHMSA recently issued new rules that impose several new requirements on operators of onshore gas transmission systems and hazardous liquids pipelines. The new rules expand requirements to address risks to pipelines outside of environmentally sensitive and populated areas. In addition, the rules make changes to integrity management requirements, including emphasizing the use of in-line inspection technology. The new rules took effect on July 1, 2020 with various implementation phases over a period of years. We remain optimistic about the long-term demand for environmental services such as inspection services, integrity services, and water solutions, due to our nation’s aging pipeline infrastructure, and we believe we continue to be well-positioned to capitalize on these opportunities. Our parent company’s ownership interests continue to remain fully aligned with our unitholders, as our General Partner and insiders collectively own approximately 76% of our total common and preferred units.
In 2020 and 2019, we employed as W-2 employees an average of 730 and 1,485 inspectors, respectively. Most of our inspection work was performed in the United States, although an insignificant amount of the work was performed in Canada. Our scope of services includes the following:
| ● | Project coordination (construction or maintenance coordination for in-line inspection services projects); |
| ● | Staking services (marking a dig site for surveyed anomalies); |
| ● | ILI Pig tracking services (mapping and tracking of third-party pipeline cleaning and inspection units, called pipeline inspection gadgets (“Pigs”)); |
| ● | Maintenance inspection (third-party pipeline periodic inspection to comply with PHMSA regulations); |
| ● | Miscellaneous inspection including welds, coatings, cathodic protection, utilities, safety, among others on existing and new construction; |
| ● | Pipeline marker replacement and installation; |
| ● | Depth of cover and centerline surveys; |
8
| ● | Various NDE inspections including but not limited to Phased Array Ultrasonic Testing, Optical Emission Spectroscopy, Positive Material Identification, and automated metal loss mapping to map and evaluate pipeline imperfections; and |
| ● | Related data management services. |
Pipeline & Process Services
Overview. The Pipeline & Process Services segment provides hydrostatic testing and related services to the energy industry, as well as pipeline and energy infrastructure construction companies. We focus on helping our customers meet regulatory pipeline integrity requirements. Our primary emphasis is on hydrostatic testing projects on new and existing pipelines required to maintain compliance with state and federal regulations. We perform all aspects of pipeline hydrostatic testing including, but not limited to, filling, pressure testing, dewatering, drying, and pneumatic or nitrogen testing.
We maintain a fleet of testing equipment capable of supporting requirements for hydrotesting, chemical cleaning, water transfer and recycling, pumping, pigging, flushing, filling, dehydration, caliper runs, ILI tool run support, nitrogen purging, and drying services. We also provide customers with test documentation and records retention services.
Operations. Upstream, midstream, and downstream public utility companies, and other pipeline operators are required by federal and state law to perform routine maintenance on their pipelines and gathering systems on a regular basis. In addition, operators and pipeline construction companies are required to test the integrity of newly-constructed pipelines prior to placing the pipelines in service. In our Pipeline & Process Services segment, we contract directly with pipeline owners and with pipeline construction companies to provide testing services. We own and operate our own fill and testing equipment, including specially-designed test trailers. We use a range of fill and pressure equipment to accommodate projects of various sizes. The technicians are W-2 employees with specialized training. CBI averaged 28 field technicians performing the testing services in each of 2020 and 2019, respectively.
Environmental Services
Overview. The Environmental Services segment owns and operates nine (9) water treatment facilities with ten (10) EPA Class II injection wells in the Bakken shale region of the Williston Basin in North Dakota. We wholly-own eight of these water treatment facilities and we own a 25% interest in the remaining facility we developed and manage. These water treatment facilities are connected to thirteen (13) pipeline gathering systems, including two (2) that we developed and own. We specialize in the treatment, recovery, separation, and disposal of waste byproducts generated during the lifecycle of an oil and natural gas well to protect the environment and our drinking water. During 2020, 99% of our volumes were produced water from existing wells (as opposed to flowback water from the development of new wells) and 66% of our volumes were delivered via pipeline. Our 25% owned facility had 99% produced water and 98% was delivered via pipeline in 2020. We currently serve approximately 50 customers. All of our facilities utilize specialized technology, equipment and remote monitoring to minimize the facilities’ downtime and increase the facilities’ efficiency for peak utilization. We also sell recovered oil, receive fees for pipeline transportation of water, and receive fees from Arnegard for management and staffing services.
Operations. The Environmental Services segment currently generates revenue by providing the following services:
| ● | Flowback water management. We inject flowback water produced by our customers from hydraulic fracturing operations during the completion of new oil wells. The owner of the oil well typically either transports the flowback water to one of our facilities via pipeline or truck. Once the water is received at our facility, we treat the water through a combination of separation tanks, gun barrels, and chemical processes. The water is then injected into the class II EPA injection well at depths of at least 5,000 feet after recovering the skim oil. We believe our approach to scientifically and methodically filtering and treating the flowback water prior to injecting it into our wells helps extend the life of our wells and furthers our reputation as an environmentally-conscious service provider. |
| ● | Produced water management. We also treat and inject naturally-occurring water for our customers that is extracted during the oil production process. This produced water is generated during the entire lifecycle of an oil well. While the level of hydrocarbon production declines over the life of a well, the amount of produced water may decline at a slower rate or, in some cases, may even increase. The customer separates the produced water from the production stream and either transports it to one of our water treatment facilities by truck or pipeline, or contracts with a trucking company to transport it to one of our water treatment facilities. Once we receive the water at one of our water treatment facilities, we filter and treat the water and then inject it into our injection wells at depths of at least 5,000 feet after recovering any skim oil. We periodically sample, test, and assess produced water to determine its chemistry so that we can properly treat the water with the appropriate chemicals that maximize oil separation and the life of our wells. |
| ● | Residual oil sales. Before we inject flowback and/or produced water into our injection wells, we separate the residual oil and sell it to third parties. |
| ● | Facility management. In addition to the facilities we wholly-own, we own a 25% interest in an additional facility in North Dakota that we developed and manage. Our responsibilities in managing this facility include operations, billing, collections, insurance, maintenance, repairs, and sales and marketing. We are compensated for the management of this facility based on a percentage of the gross revenue of the facility or a minimum monthly fee. |
9
The majority of the water processed at our water treatment facilities is derived from produced water that is generated throughout the life of the oil well. In 2020 and 2019, produced water represented 99% and 93%, respectively, of our total barrels of water treated.
In general, each of our water treatment facilities is open every day of the year, with some being open by appointment only. Over time, the volumes processed at each individual facility fluctuate based on changes in the level of activity near the facility. We have in the past temporarily closed individual facilities when the volumes at the facilities were low, and we have later reopened these facilities when market conditions near those facilities improved. We may in the future temporarily close individual facilities again. If market activity near an individual facility remains low for an extended period of time, we may consider permanently closing that facility, which would require us to incur certain asset retirement costs. We may also consider divestitures.
Some of our locations include onsite offices and sleeping quarters. We supplement our operations with various automated technologies to improve their efficiency and safety. We have installed 24-hour digital video monitoring and recording systems at each facility. These systems allow us to track operations and unloading activities, as well as to identify customers present at our facilities. We believe that our commitment to operating our facilities with sophisticated technology and automation contributes to our enhanced operating margins and provides our customers with increased safety and regulatory compliance. Our facilities have been inspected and approved by several of our publicly traded customers that have stringent approval standards and field audits performed by their Environmental, Health and Safety groups. We have permitted aggregate maximum daily disposal capacity of 96,800 barrels.
Principal Customers
Inspection Services
Customers of our Inspection Services segment are principally owners and operators of pipelines and other infrastructure or public utility/local distribution companies in North America that provide natural gas to homes and businesses. In 2020 and 2019, this segment had approximately 59 and 78, respectively. The five largest customers in this segment generated 59% and 65% of our segment revenue in 2020 and 2019, respectively. In 2020 and 2019, we had two and four customers, respectively, that individually accounted for more than 10% of segment revenues.
Pipeline & Process Services
Pipeline & Process Services segment customers are primarily pipeline construction companies and pipeline owners. In 2020 and 2019, this segment had approximately 29 and 38 customers, respectively. Our ten largest customers generated 90% and 92% of our total segment revenue in 2020 and 2019, respectively. In 2020 and 2019, we had four and three customers, respectively, that individually accounted for more than 10% of segment revenues.
Environmental Services
Environmental Services segment customers are primarily E&P companies that own, drill, and operate oil wells in North Dakota. These customers include publicly traded energy companies, independents, trucking companies, and third-party purchasers of residual oil. In the years ended December 31, 2020 and 2019, this segment had approximately 50 and 86 customers, respectively. Our ten largest customers generated 90% and 79% of the Environmental Services revenue in 2020 and 2019, respectively. In 2020 and 2019, we had four and three customers, respectively, that individually accounted for more than 10% of segment revenues.
10
Market
There is a large market of owners of pipelines and energy infrastructure, and there are many entities that we do not currently provide inspection and integrity services to. We estimate that we serve less than 8% of the available market. Therefore we have a large potential market whereby we plan to pursue organic growth. The table below illustrates the size of the market, based on our independent research:
| Category | # of Companies | # Top Prospects | Ranking Metric | Description |
| Exploration & production | 30,600 | 300 | >500 wells | All wells in the U.S. |
| Exploration & production - offshore | 188 | 44 | >10 wells | All U.S. wells offshore in the Gulf of Mexico |
| Midstream | 3,600 | 520 | >250 miles of pipeline | All midstream companies with pipelines in the U.S. |
| Midstream - offshore | 470 | 200 | >30 miles of pipeline | All midstream companies that have pipelines in the Gulf of Mexico |
| Public utility - electric | 2,100 | 350 | >50,000 customers | All electric public utility companies in the U.S. |
| Public utility - gas | 1,400 | 310 | >5,000 customers | All gas public utility companies in the U.S. |
| Public utility - water | 2,000 | 75 | City population | Companies approximately ranked by population |
| Petrochemical | 50 | - | None | Top 50 chemical companies in the world |
| Refineries | 75 | 48 | In Texas & Louisiana | All refineries in the U.S. |
| Liquefied natural gas terminals | 50 | - | None | All U.S. liquefied natural gas terminals that are existing or are being planned |
| Midstream gathering and processing | 2,700 | 400 | >250 miles of pipeline | All gathering & transmission lines in the U.S. |
We continue to focus on sales efforts, both to existing and prospective new customers. We have recently made investments in our account management and business development teams, to position ourselves to take advantage of the market’s eventual recovery.
Competition
Inspection Services
Reputation, safety statistics, financial strength, and quality are important to our current and potential customers. The inspection services business is highly competitive. Our competition consists primarily of three types of companies: independent inspection firms, engineering and construction firms, and diversified inspection service firms. Diversified inspection firms may inspect, for example, electric and nuclear facilities in addition to pipelines and related facilities. We believe that the principal competitive factors in our business include gaining and maintaining customer approval to service their pipelines, facilities and gathering systems, the ability to recruit and retain qualified experienced inspectors with multiple skills and nondestructive examination experience, safety record, insurance, financial strength, inspector training, insurance, reputation, dependability of service, customer service, and price.
Pipeline & Process Services
The pipeline and process services business is also highly competitive. We believe the principal competitive factors in our business are customer service, operational experience, safety, and price. Our competition consists primarily of smaller regional integrity firms and pipeline construction companies that pipeline owners allow to test their own construction and repair work.
11
Environmental Services
The Environmental Services business is highly competitive with relatively low barriers to entry. Our competition includes smaller regional companies. In addition, we face competition from our customers, who may have the option of using internal processing methods instead of outsourcing to us or to another third-party company. Many E&P companies also own their own water treatment facilities and water gathering systems, and therefore do not send their produced water to third parties for processing. We believe the principal competitive differentiating factors in our businesses include gaining and maintaining customer approval of water treatment facilities, location of facilities in relation to customer activity, reputation, safety record, reliability of service, track record of environmental and regulatory compliance, customer service, insurance coverage, and price.
Seasonality
Inspection Services
Inspection work varies depending upon the geographic location of our customers. The months from April to October are historically the most active for our inspection services in the United States as our customers focus on completing projects by year-end. Business has historically been slower in the period from November through March, due to the holiday season, weather, and the budgeting cycles of our customers. We believe our presence across various regions in the United States helps mitigate the seasonality of our business. Our public utility operations in California and other locations with moderate climates tend to experience less seasonal volatility.
Pipeline & Process Services
Because most of the work of the Pipeline & Process Services segment is currently performed in the southern United States, weather does not usually create significant seasonal variations in revenue. However, hurricanes, flooding, and the recent cold weather in Texas and Oklahoma adversely impact our ability to generate revenues. Business has historically been slower in the period from November through March, due to the holiday season and the budgeting cycles of our customers.
Environmental Services
The overall operations and financial performance of our North Dakota operations are affected by seasonality. The volume of water processed in the Bakken Shale region of the Williston Basin in North Dakota tends to be lower in the winter, due to heavy snow and cold temperatures, and in the spring, due to heavy rains and muddy conditions that may lead to road restrictions and weight limits that can impact business. The growing percentage of piped water to our facilities has mitigated some of these weather-related matters. The amount of residual oil is also less prevalent and more difficult to extract during the winter months.
Regulation of the Industry
Environmental and Occupational Health and Safety Matters
Our operations and the operations of our customers are subject to numerous federal, state, and local environmental laws and regulations relating to worker health and safety, the discharge of materials, and environmental protection. These laws and regulations may, among other things, require the acquisition of permits for regulated activities; govern the amounts and types of substances that may be released into the environment in connection with our operations; restrict the treatment methods of waste byproducts; limit or prohibit our or our customers’ activities in sensitive areas such as wetlands, wilderness areas, or areas inhabited by endangered or threatened species; require investigatory and remedial actions to mitigate pollution conditions caused by our current or former operations; and impose specific standards addressing worker protections. Numerous governmental agencies issue regulations to implement and enforce these laws, for which compliance is often costly and difficult. The violation of these laws and regulations may result in the denial or revocation of permits, issuance of corrective action orders, assessment of administrative and civil penalties, and even criminal prosecution.
We do not anticipate that compliance with existing environmental and occupational health and safety laws and regulations will have a material effect on our Consolidated Financial Statements. However, these rules and regulations are constantly evolving, and amendments thereto could result in a material effect on our operations and financial position. For instance, in January 2021, the Biden administration issued an executive order directing all federal agencies to review and take action to address any federal regulations, orders, guidance documents, policies and any similar agency actions promulgated during the prior administration that may be inconsistent with the current administration’s policies. As a result, it is unclear the degree to which certain recent regulatory developments may be modified or rescinded. The executive order also established an Interagency Working Group on the Social Cost of Greenhouse Gases (“Working Group”), which is called on to, among other things, develop methodologies for calculating the “social cost of carbon,” “social cost of nitrous oxide” and “social cost of methane.” Final recommendations from the Working Group are due no later than January 2022. Further regulation of air emissions, as well as uncertainty regarding the future course of regulation, could eventually reduce the demand for oil and natural gas. Also in January 2021, the Biden administration issued an executive order focused on addressing climate change (the “2021 Climate Change Executive Order”). Among other things, the 2021 Climate Change Executive Order directed the Secretary of the Interior to pause new oil and natural gas leasing on public lands or in offshore waters pending completion of a comprehensive review of the federal permitting and leasing practices, consider whether to adjust royalties associated with coal, oil, and gas resources extracted from public lands and offshore waters, or take other appropriate action, to account for corresponding climate costs. The 2021 Climate Change Executive Order also directed the federal government to identify “fossil fuel subsidies” to take steps to ensure that, to the extent consistent with applicable law, federal funding is not directly subsidizing fossil fuels. Legal challenges to the suspension have already been filed and are currently pending.
12
Further, while we may occasionally receive citations from environmental regulatory agencies for minor violations, such citations occur in the ordinary course of our business and are generally not material to our operations. However, it is possible that substantial costs for compliance or penalties for non-compliance may be incurred in the future. It is also possible that other developments, such as the adoption of stricter environmental laws, regulations, and enforcement policies, could result in additional costs or liabilities that we cannot currently quantify. Moreover, changes in environmental laws could limit our customers’ businesses or encourage our customers to handle and dispose of oil and natural gas wastes in other ways, which, in either case, could reduce the demand for our services and adversely impact our business.
The following is a summary of the more significant existing environmental and occupational health and safety laws and regulations to which our business operations and the operations of our customers are subject and for which compliance in the future may have a material adverse effect on our financial position, results of operations, or future cash flows.
Hazardous substances and wastes. Our operations are subject to environmental laws and regulations relating to the management and release of hazardous substances, solid wastes, hazardous wastes, and petroleum hydrocarbons. These laws generally regulate the generation, storage, treatment, transportation and disposal of solid and hazardous waste, and may impose strict joint and several liability for the investigation and remediation of affected areas where hazardous substances may have been released or disposed. For instance, the Comprehensive Environmental Response Compensation and Liability Act, or CERCLA, and comparable state laws impose liability, without regard to fault or the legality of the original conduct, on certain classes of persons that contributed to the release of a hazardous substance into the environment. We may handle hazardous substances within the meaning of CERCLA, or similar state statutes, in the course of our ordinary operations and, as a result, may be jointly and severally liable under CERCLA for all or part of the costs required to clean up sites at which these hazardous substances have been released into the environment. Under such laws, we could be required to remove previously disposed substances and wastes (including substances disposed of or released by prior owners or operators) or remediate contaminated property (including groundwater contamination, whether from prior owners or operators or other historical activities or spills). These laws may also require us to conduct natural resource damage assessments and pay penalties for such damages. It is not uncommon for neighboring landowners and other third-parties to file claims for personal injury and property damage allegedly caused by the release of hazardous substances or other pollutants into the environment. These laws and regulations may also expose us to liability for our acts that were in compliance with applicable laws at the time the acts were performed.
Petroleum hydrocarbons and other substances arising from oil and natural gas-related activities have been disposed of or released on or under many of our sites. At some of our facilities, we have conducted and continue to conduct monitoring or remediation of known soil and groundwater contamination. We will continue to perform such monitoring and remediation of known contamination, including any post remediation groundwater monitoring that may be required, until the appropriate regulatory standards have been achieved. These monitoring and remediation efforts are usually overseen by state environmental regulatory agencies.
In the future, we may also accept for disposal solids that are subject to the requirements of the federal Resource Conservation and Recovery Act, or RCRA, and comparable state statutes. While RCRA regulates both solid and hazardous wastes, it imposes strict requirements on the generation, storage, treatment, transportation, and disposal of hazardous wastes. Most E&P waste is exempt from stringent regulation as a hazardous waste under RCRA. None of our facilities are currently permitted to accept hazardous wastes for disposal, and we take precautions to help ensure that hazardous wastes do not enter or are not disposed of at our facilities. Some wastes handled by us that currently are exempt from treatment as hazardous wastes may in the future be designated as “hazardous wastes” under RCRA or other applicable statutes. For example, in May 2016, a nonprofit environmental group filed suit in the federal district court for the District of Columbia, seeking a declaratory judgment directing the EPA to review and reconsider the RCRA E&P waste exemption. EPA and the environmental group entered into an agreement that was formalized in a consent decree issued by the U.S. District court for the District of Columbia in December 2016. Under the decree, the EPA was required to propose a rulemaking for revisions of certain of its regulations pertaining to E&P wastes or sign a determination that revision of the regulations is not necessary. After undertaking its review, EPA signed a determination in 2019 concluding that it does not need to regulate E&P wastes, and specifically “drilling fluids, produced waters, and other wastes associated with the exploration, development, or production of oil, gas or geothermal energy,” because the states are adequately regulating E&P wastes under the Subtitle D provisions of RCRA. However, if the RCRA E&P waste exemption is repealed or modified in the future, we could become subject to more rigorous and costly operating and disposal requirements.
We are required to obtain permits for the disposal of E&P waste as part of our operations. State permits can restrict pressure, size, and location of disposal operations, impose limits on the types and amount of waste a facility may receive and the overall capacity of a waste disposal facility. States may add additional restrictions on the operations of a disposal facility when a permit is renewed or amended. As these regulations change, our permit requirements could become more stringent and may require material expenditures at our facilities or impose significant restraints or financial assurances on our operations. In the course of our operations, some of our equipment may be exposed to naturally occurring radiation associated with oil and natural gas deposits, and this exposure may result in the generation of wastes containing Naturally Occurring Radioactive Materials, or NORM. NORM wastes exhibiting trace levels of naturally occurring radiation in excess of established state standards are subject to special handling and disposal requirements, and any storage vessels, piping, and work area affected by NORM may be subject to remediation or restoration requirements. It is possible that we may incur costs or liabilities associated with elevated levels of NORM.
Safe Drinking Water Act. Our underground injection operations are subject to the Safe Drinking Water Act, or SDWA, as well as analogous state laws and regulations. Under the SDWA, the EPA established the Underground Injection Control, or UIC, program, which established the minimum program requirements for state and local programs regulating underground injection activities. The UIC program includes requirements for permitting, testing, monitoring, record keeping and reporting of injection well activities, as well as a prohibition against the migration of fluid containing any contaminant into underground sources of drinking water. State regulations require us to obtain a permit from the applicable regulatory agencies to operate our underground injection wells. Any leakage from the subsurface portions of the injection wells could cause degradation of fresh groundwater resources, potentially resulting in suspension of our UIC permit, issuance of fines and penalties from governmental agencies, incurrence of expenditures for remediation of the affected resource and imposition of liability by third parties for property damages and personal injuries. In addition, storage of residual crude oil collected as part of the saltwater injection process prior to sale could impose liability on us in the event that the entity to which the oil was transferred fails to manage and, as necessary, dispose of residual crude oil in accordance with applicable environmental and occupational health and safety laws.
13
Our customers are subject to these same regulations. While these largely result in their needing our services, some waste regulations could have the opposite effect. For instance, some states, have considered laws mandating the recycling of flowback and produced water. If such laws are passed, our customers may divert some saltwater to recycling operations that may have otherwise been disposed of at our facilities.
Oil Pollution Act of 1990. The Oil Pollution Act of 1990, or OPA, as amended, establishes strict liability for owners and operators of facilities that are the site of a release of oil into regulated waters. The OPA also imposes ongoing requirements on owners or operators of facilities that handle certain quantities of oil, including the preparation of oil spill response plans and proof of financial responsibility to cover environmental cleanup and restoration costs that could be incurred in connection with an oil spill. We handle oil at many of our facilities, and if a release of oil into the regulated waters occurred at one of our facilities, we could be liable for cleanup costs and damages under the OPA.
Water discharges. The federal Water Pollution Control Act, referred to as the Clean Water Act, and analogous state laws impose restrictions and strict controls regarding the discharge of pollutants into regulated waters and impose requirements affecting our ability to conduct activities in regulated waters and wetlands. Pursuant to the Clean Water Act and analogous state laws, permits must be obtained to discharge pollutants into regulated waters, and permits or coverage under general permits must also be obtained to authorize discharges of storm water runoff from certain types of industrial facilities, including many of our facilities. The Clean Water Act and regulations implemented thereunder also prohibit the discharge of dredge and fill material into regulated waters, including jurisdictional wetlands, unless authorized by an appropriately issued permit. Spill prevention, control, and countermeasure requirements of federal laws require appropriate containment berms and similar structures to help prevent the contamination of regulated waters in the event of a hydrocarbon storage tank spill, rupture, or leak. Some states also maintain groundwater protection programs that require permits for discharges or operations that may impact groundwater conditions. Federal and state regulatory agencies can impose administrative, civil and criminal penalties for non-compliance with discharge permits or other requirements of the Clean Water Act and analogous state laws and regulations.
We believe that compliance with existing permits and regulatory requirements under the Clean Water Act and state counterparts will not have a material adverse effect on our business. Future changes to permits or regulatory requirements under the Clean Water Act, however, could adversely affect our business.
Endangered species. The federal Endangered Species Act, or ESA, restricts activities that may affect endangered or threatened species or their habitats. Many states also have analogous laws designed to protect endangered or threatened species. Additionally, as a result of a settlement approved by the U.S. District Court for the District of Columbia in September 2011, the Fish and Wildlife Service was required to make a determination on the listing of more than 250 species as endangered or threatened under the ESA by the end of the Fish and Wildlife Service’s 2018 fiscal year. The Fish and Wildlife Service did not meet that deadline but continues to consider whether to list additional species under the ESA. Although current listings have not had a material impact on our operations, the designation of previously unidentified endangered or threatened species under the ESA or similar state laws could limit our ability to expand our operations and facilities or could force us to incur material additional costs. Moreover, listing such species under the ESA or similar state laws could indirectly, but materially, affect our business by imposing constraints on our customers’ operations, including the curtailment of new drilling or a refusal to allow a new pipeline to be constructed.
Air emissions. Some of our operations also result in emissions of regulated air pollutants. The Clean Air Act, or CAA, and analogous state laws require permits for and impose other restrictions on facilities that have the potential to emit substances into the atmosphere above certain specified quantities or in a manner that could adversely affect environmental quality. Failure to obtain a permit or to comply with permit requirements could result in the imposition of substantial administrative, civil, and even criminal penalties. We do not believe that any of our operations are subject to CAA permitting or regulatory requirements for major sources of air emissions, but some of our facilities could be subject to state “minor source” air permitting requirements and other state regulatory requirements for air emissions. Our Pipeline & Process Services segment has certain equipment requirements in various states.
Our customers’ operations may be subject to existing and future CAA permitting and regulatory requirements that could have a material effect on their operations. The EPA recently approved and proposed new CAA rules requiring additional emissions controls and practices for oil and natural gas production wells, including wells that are the subject of hydraulic fracturing operations. The rules also establish new emission requirements for compressors, controllers, dehydrators, storage tanks, natural gas processing and certain other equipment used in the hydraulic fracturing process. These rules may increase the costs to our customers of developing and producing hydrocarbons, and as a result, may have an indirect and adverse effect on the amount of oilfield waste delivered to our facilities by our customers.
Climate change. The EPA has adopted regulations under existing provisions of the federal Clean Air Act that, for example, require certain large stationary sources to obtain Prevention of Significant Deterioration, or PSD, pre-construction permits and Title V operating permits for greenhouse gas (“GHG”) emissions. The EPA has also adopted rules requiring the monitoring and reporting of GHG emissions from specified sources in the United States, including, among others, certain onshore oil and natural gas processing and fractionating facilities, which was expanded in October 2015 to include onshore petroleum and natural gas gathering and boosting activities and natural gas transmission pipelines. Additionally, the U.S. Congress has, in the past, considered adopting legislation to reduce emissions of GHGs, and almost one-half of the states have already taken legal measures to reduce emissions of GHGs, primarily through the planned development of GHG emission inventories and/or regional GHG cap-and-trade programs. Most of these cap-and-trade programs work by requiring major sources of emissions, such as electric power plants or major producers of fuels, such as refineries and natural gas processing plants, to acquire and surrender emission allowances that correspond to their annual emissions of GHGs. In addition, in December 2015, over 190 countries, including the United States, reached an agreement to reduce greenhouse gas emissions (the “Paris Agreement”). The agreement entered into force in November 2016 after more than 70 countries, including the United States, ratified or otherwise consent to be bound by the agreement. In June 2018, President Trump announced that the United States plans to withdraw from the agreement and formally initiated the withdrawal process in November 2019, which resulted in an effective exit date of November 2020. However, the Biden administration issued the aforementioned 2021 Climate Change Executive Order that, among other things, commenced the process for the U.S. reentering the Paris Agreement. The U.S. officially rejoined the Paris Agreement on February 19, 2021. The 2021 Climate Change Executive Order also directed the Secretary of the Interior to pause new oil and natural gas leasing on public lands or in offshore waters pending completion of a comprehensive review of the federal permitting and leasing practices, consider whether to adjust royalties associated with coal, oil, and gas resources extracted from public lands and offshore waters, or take other appropriate action, to account for corresponding climate costs. The 2021 Climate Change Executive Order also directed the federal government to identify “fossil fuel subsidies” to take steps to ensure that, to the extent consistent with applicable law, federal funding is not directly subsidizing fossil fuels. Legal challenges to the suspension have already been filed and are currently pending. To the extent that the United States and other countries implement the Paris Agreement or impose other climate change regulations on the oil and natural gas industry, it could have an adverse effect on our business. The EPA and other federal and state agencies have also acted to address greenhouse gas emissions in other industries, most notably coal-fired power generation, and as a result could attempt in the future to impose additional regulations on the oil and natural gas industry.
14
Although it is not possible at this time to estimate how potential future laws or regulations addressing GHG emissions would impact our business, either directly or indirectly, any future federal or state laws or implementing regulations that may be adopted to address GHG emissions in areas where we operate could require us or our customers to incur increased operating costs. Regulation of GHGs could also result in a reduction in demand for and production of oil and natural gas, which would result in a decrease in demand for our services. We cannot predict with any certainty at this time how these possibilities may affect our operations, but effects could be materially adverse.
Hydraulic fracturing. We do not conduct hydraulic fracturing operations, but we do provide treatment and disposal services with respect to the fluids used and wastes generated by our customers in such operations, which are often necessary to drill and complete new wells and maintain existing wells. Hydraulic fracturing involves the injection of water, sand, or other proppants and chemicals under pressure into target geological formations to fracture the surrounding rock and stimulate production. Presently, hydraulic fracturing is regulated primarily at the state level, typically by state oil and natural gas commissions and similar agencies. Several states, including North Dakota, where we conduct our Environmental Services business, have either adopted or proposed laws and/or regulations to require oil and natural gas operators to disclose chemical ingredients and water volumes used to hydraulically fracture wells, in addition to more stringent well construction and monitoring requirements. The chemical ingredient information is generally available to the public via online databases including fracfocus.org, and this may bring more public scrutiny to hydraulic fracturing operations.
At the federal level, the SDWA regulates the underground injection of substances through the UIC program and generally exempts hydraulic fracturing from the definition of “underground injection.” The U.S. Congress has in recent legislative sessions considered legislation to amend the SDWA, including legislation that would repeal the exemption for hydraulic fracturing from the definition of “underground injection” and require federal permitting and regulatory control of hydraulic fracturing, as well as legislative proposals to require disclosure of the chemical constituents of the fluids used in the fracturing process.
Federal agencies have also asserted regulatory authority over certain aspects of the process within their jurisdiction. For example, the EPA issued an Advanced Notice of Proposed Rulemaking seeking comment on its intent to develop regulations under the Toxic Substances Control Act to require companies to disclose information regarding the chemicals used in hydraulic fracturing, and proposed effluent limitations for the disposal of wastewater from unconventional resources to publicly owned treatment works. In addition, the U.S. Department of the Interior (“DOI”) published a rule that updated existing regulation of hydraulic fracturing activities on federal lands, including requirements for disclosure, well bore integrity and handling of flowback water. A U.S. District Court in Wyoming struck down this rule in June 2016; that ruling was overturned and the rule reinstated by the U.S. Court of Appeals for the Tenth Circuit in September 2017. However, the DOI formally rescinded the rule in December 2017.
The EPA conducted a study of the potential impacts of hydraulic fracturing activities on drinking water. The EPA released its final report in December 2016. The study concluded that under certain limited circumstances, hydraulic fracturing activities and related disposal and fluid management activities, could adversely affect drinking water supplies. This study and other studies that may be undertaken by the EPA or other governmental authorities, depending on their results, could spur initiatives to regulate hydraulic fracturing under the SDWA or otherwise. If new federal, state or local laws or regulations that significantly restrict hydraulic fracturing are adopted, such legal requirements could result in delays, eliminate certain drilling and injection activities and make it more difficult or costly for our customers to perform fracturing. Any such regulations limiting or prohibiting hydraulic fracturing could reduce oil and natural gas exploration and production activities by our customers and, therefore, adversely affect our business. Such laws or regulations could also materially increase our costs of compliance and our cost of doing business by more strictly regulating how hydraulic fracturing wastes are handled or disposed.
Occupational Safety and Health Act. We are subject to the requirements of the Occupational Safety and Health Act, or OSHA and comparable state laws that regulate the protection of employee health and safety. OSHA’s hazard communications standard requires that information about hazardous materials used or produced in our operations be maintained and provided to employees, state and local government authorities and citizens. These laws and regulations are subject to frequent changes. Failure to comply with these laws could lead to the assertion of third-party claims against us, civil and/or criminal fines, and changes in the way we operate our facilities that could have an adverse effect on our financial position.
Seismic activity. Several states have acted to address a growing concern that the underground injection of water into disposal wells may have triggered seismic activity in certain areas. Any new seismic permitting requirements applicable to disposal wells would impose more stringent permitting requirements and would be likely to result in added costs to comply or, perhaps, may require alternative methods of disposing of saltwater and other fluids, which could delay production schedules and also result in increased costs. Additional regulatory measures designed to minimize or avoid damage to geologic formations may be imposed to address such concerns.
Employees
The Partnership does not have any employees. We are managed and operated by the directors and officers of our general partner. All of the employees who conduct our business are employed by affiliates of our general partner, although we often refer to these individuals in this report as our employees. This is a common structure among other publicly traded partnerships.
15
Inspection Services Segment
Our Inspection Services segment utilizes a just in time (“JIT”) business model that employs a number of W-2 inspectors that varies based on client needs (we also employ technicians for services such as nondestructive examination; for purposes of this report, we generally use the term “inspectors” to refer to all of the field employees of the Inspection Services segment). We generally only employ inspectors when there is a specific billable client project to deploy them on. As of December 31, 2020, this segment employed 528 inspectors and 24 office employees, all of whom were employed in the United States. 2020 was the worst year in our short history, following our best year and record results in 2019 prior to the COVID-19 pandemic. Many of our customers cancelled new construction projects and/or deferred maintenance and integrity work as the price of crude oil declined significantly before recovering to current levels. We implemented major cost reductions including layoffs, furloughs, and salary and hour reductions to address these adverse market conditions.
Recruitment and retention of qualified field employees is critical to our success. We recruit via our company website, third-party recruitment websites, and our proprietary database that includes over 20,000 prospective inspectors. There are numerous competitors in the inspection business, and we must maintain competitive compensation packages in order to recruit and retain qualified inspectors. Compensation packages vary based on geographic and other factors. Currently, we do not provide company-paid health and related benefits for most of our inspectors.
We have implemented an inspector rating system, under which we and our clients periodically rate inspector performance. We have also recently developed a program in partnership with the Department of Defense SkillsBridge program and a Tulsa-based technical college to recruit and train honorably discharged veterans to become inspectors.
Certain inspectors for one of our publicly traded public utility companies are members of a union and are covered by a collective bargaining arrangement. As of December 31, 2020, 79 inspectors were members of this union. This customer has an agreement to work with this union as part of their agreement with the California Public Utility Commission. None of our other employees are covered by collective bargaining arrangements.
Pipeline & Process Services Segment
Our Pipeline & Process Services segment employed 42 people at December 31, 2020. Of these W-2 employees, 13 were office employees and 29 were field employees. Most of the employees in the Pipeline & Process Services segment are full-time employees who are compensated regardless of whether or not they are deployed on a customer project, given the specialized training required to perform their tasks on hydrotesting. Our compensation structure for field employees includes wages, health benefits, job-specific bonuses, and, when the financial performance of the segment is strong, annual discretionary bonuses. When we have a high volume of customer projects, we often deploy employees of an affiliated entity owned by Holdings and/or contract labor to manage the short-term swings in activity. When we have a low volume of customer projects, as was the case in late 2020 and early 2021, we re-assess the size of our workforce. In early 2021, we implemented a cost reduction plan that included a combination of salary reductions, furloughs, and a reduction in workforce.
Environmental Services Segment
Our Environmental Services segment employed 8 people at December 31, 2020, all of whom work at our North Dakota facilities. Our facilities are generally open every day of the year to serve our customers. Most of these W-2 employees have been employed with us for a number of years. Our compensation structure for field employees includes wages and health benefits. During 2020, in response to challenging market conditions, we implemented a cost reduction plan that included a combination of salary reductions and a reduction in workforce.
Corporate
As of Dec ember 31, 2020 we employed 68 people in our corporate offices who provide various services including management, business development, human resources, information technology, billing, safety, legal, payroll, and accounting, among others. We utilize a shared services model to support our various businesses. The compensation cost for these employees is allocated among us and our affiliates based on estimates of the amount of time these employees spend on our businesses relative to those of our affiliates. Our primary corporate office is in Tulsa, Oklahoma, and we have a smaller corporate office in Houston, Texas. CBI is located in Giddings, Texas. Our affiliates, privately owned by Holdings, have offices in Salt Lake City, Utah and Scott, Louisiana.
We have a small corporate workforce, and as a result, recruitment and retention of high-performing employees is important to our success. We strive to recruit employees who are willing and able to perform a diverse set of responsibilities as business needs warrant.
Our salary structure is designed to reward high performance/merit, and we generally award salary increases to specific employees for performance and/or market reasons, rather than awarding across-the-board cost of living increases. We have an annual short-term incentive plan, and the bonuses we pay under this program are heavily influenced by the financial performance of our business. In 2019, we awarded generous cash bonuses (as a result of strong financial performance), whereas in 2020, we awarded only minimal cash bonuses (as a result of lower financial performance). Executive management did not receive any bonuses in 2020 given our performance. We also have a long-term incentive plan, under which we grant equity awards to select key employees. These awards have been in the form of phantom restricted common units that vest over a period of 3 to 5 years, and in some cases vesting is also contingent on company performance metrics. However, our LTIP allows us to incentivize our employees with a variety of equity incentives, including without limitation, common unit purchase options. During 2020, we implemented salary reductions for a large percentage of our corporate salaried employees in response to the adverse market conditions. These reductions ranged from 5%-40%, with our CEO at the maximum end of this range, the management team generally at the higher end of this range, and employees with lower salaries generally at the lower end of this range. We offer subsidized health and related benefits and the opportunity to participate in a 401(k) plan, although we do not currently offer matching contributions to the 401(k) plan.
Safety
We have a team of professionals in our corporate offices dedicated to matters such as workplace safety and operational qualifications. During 2020, in response to the COVID-19 pandemic, we implemented our business continuity plan, which included a work-from-home arrangement for most of our corporate office employees at various times during the pandemic.
Insurance Matters
Our customers require that we maintain certain minimum levels of insurance and evaluate our insurance coverage as part of the initial and ongoing approval process they require to use our services. We also carry a variety of insurance coverages for our operations as required by law. However, our insurance may not be sufficient to cover any particular loss or may not cover all losses, and losses not covered by insurance would increase our costs. Also, insurance rates have been subject to wide fluctuations, and changes in coverage could result in less coverage, increases in cost, higher deductibles and retentions, and more exclusions.
16
Our businesses can be dangerous, involving unforeseen circumstances such as environmental damage from leaks, spills, or vehicle accidents. To address the hazards inherent in our services, our insurance coverage includes business, auto liability, commercial general liability, employer’s liability, environmental and pollution, and other coverage. To address the hazards inherent in our services, insurance coverage includes employer’s liability, auto liability, employee benefits liabilities, and contractor’s pollution and other coverage. We also carry cybersecurity and crime coverage. Coverage for environmental and pollution-related losses is subject to significant limitations. We do not carry business interruption insurance, given its cost and its coverage limitations.
Available Information
Our annual reports on Form 10-K, quarterly reports on Form 10-Q, current reports on Form 8-K, and amendments to those reports filed or furnished pursuant to Section 13(a) or 15(d) of the Securities Exchange Act of 1934 (the “Exchange Act”) are made available free of charge on our website at www.cypressenvironmental.biz as soon as reasonably practicable after these reports have been electronically filed with, or furnished to, the SEC. Unitholders may request a printed copy of these reports free of charge by contacting Investor Relations at Cypress Environmental Partners, L.P., 5727 S. Lewis Ave., Suite 300, Tulsa, OK 74105 or by e-mailing ir@cypressenvironmental.biz. These documents are also available on the SEC’s website at www.sec.gov, or a unitholder may obtain information on the operation of the Public Reference Room by calling the SEC at 1-800-SEC-0330. No information from either the SEC’s website or our website is incorporated herein by reference.
Unitholders should consider carefully the following risk factors together with all of the other information included in this Annual Report on Form 10-K and our other reports filed with the SEC before investing in our common units. If any of the following risks were actually to occur, our business, financial condition or results of operations could be materially adversely affected. In that case, the trading price of our common units could decline and a unitholder could lose all or part of their investment.
Risks Related to Our Business
There are significant contractual restrictions on our ability to pay distributions to holders of our common units.
Our revolving credit agreement, as amended in March 2021 (the “Credit Agreement”), contains significant limitations on our ability to pay cash distributions. We may only pay the following cash distributions:
| ● | distributions to common and preferred unitholders, to the extent of income taxes estimated to be payable by these unitholders resulting from allocations of our earnings; |
| ● | distributions to the preferred unitholder up to $1.1 million per year, if our leverage ratio is 4.0 or lower; and |
| ● | distributions to the noncontrolling interest owners of CBI and CF Inspection. |
The holders of our Series A Preferred Units are entitled to receive quarterly distributions equal to 9.5% per year plus accrued and unpaid distributions prior to distributions to holders of our common units.
The Partnership may seek to renegotiate the terms of the Series A Preferred Units with the related party holders thereof, including negotiating the conversion of such Series A Preferred Units into common units. The conflicts committee of the board of directors would represent the Partnership in any such related party transaction. The holders of the Series A Preferred Units may be unwilling to renegotiate the terms of the Series A Preferred Units on terms that are beneficial and/or acceptable to the Partnership or at all.
In addition to the contractual restrictions noted above, our ability to pay distributions in the future to our common unitholders will depend on the amount of cash we generate from our operations, which fluctuates based on a variety of factors.
The amount of cash we generate from our operations fluctuates from based on, among other things:
| ● | the fees we charge, and the margins we realize, from our services; |
| ● | the number and types of projects conducted by our Inspection Services and Pipeline & Process Services segments and the volume of water processed by our Environmental Services segment; |
| ● | prevailing economic and market conditions, including volatile commodity prices and their effect on our customers; |
| ● | the cost of achieving organic growth in current and new markets; |
17
| ● | our ability to make profitable acquisitions of businesses; |
| ● | the level of competition from other companies; |
| ● | governmental regulations, including changes in governmental regulations, in our industry; and |
| ● | weather and natural disasters, lightning, seismic activity, vandalism, and acts of terror. |
In addition, the actual amount of cash we will have available for distribution will depend on other factors, some of which are beyond our control, including:
| ● | our ability to borrow funds and access capital markets; |
| ● | the level of our operating costs and expenses and the performance of our various facilities, inspectors, and staff; |
| ● | fluctuations in our working capital needs; |
| ● | our ability to collect receivables from customers in a timely manner; |
| ● | our debt service requirements, interest rates, and other liabilities; |
| ● | the level of capital expenditures we make; |
| ● | the cost of acquisitions; |
| ● | the amount of cash reserves established by our general partner; and |
| ● | other business risks affecting our cash levels. |
The working capital needs of the Inspection Services segment are substantial, and will continue to be substantial. This will reduce our borrowing capacity for other purposes and reduce our cash available for distribution.
We pay the majority of our inspectors in the Inspection Services segment on a weekly basis, but typically receive payment from our customers 45 to 90 days after the services have been performed. We borrow under our credit facility as needed to fund our working capital needs, and these borrowings reduce the amount of credit we may use for other needs, such as acquisitions and growth projects. Borrowings also increase our aggregate interest expense, which reduces cash available for distribution to our unitholders. Any cash generated from operations used to fund working capital needs will also reduce cash available for distribution to our unitholders. Additionally, if our customers delay in paying us, our working capital needs will increase, and we could be required to make further borrowings under our revolving credit facility; these delays in our customers’ payments could also impact our ability to pay cash distributions.
In the ordinary course of our business, we may become subject to lawsuits, indemnity, or other claims, which could materially and adversely affect our business, financial condition, results of operations, profitability, cash flows, and growth prospects. We are currently and may in the future also be subject to litigation involving allegations of violations of the Fair Labor Standards Act and state wage and hour laws. In addition, we generally indemnify our customers for claims related to the services we provide and the actions we take under our contracts, and, in some instances, we may be allocated risk through our contract terms for actions by our customers or other third parties.
From time to time, we are subject to various claims, lawsuits and other legal proceedings brought or threatened against us in the ordinary course of our business. These actions and proceedings may seek, among other things, compensation for alleged personal injury, workers’ compensation, employment discrimination and other employment-related damages, breach of contract, property damage, environmental liabilities, multiemployer pension plan withdrawal liabilities, punitive damages and civil penalties or other losses, liquidated damages, consequential damages, or injunctive or declaratory relief.
Such actions and proceedings may also seek damages for alleged failure of our employees to adequately perform their professional obligations. Claims for damages could include such matters as damage to customer property, damage to third-party property, environmental damages, or third-party injury claims, among others. Given the inherent risks associated with the transportation and disposal of hydrocarbons, such damage claims could be material.
Certain of our contracts with customers contain onerous indemnification provisions that may expose us to indemnification demands by our customers for claims made against them. Certain of our contracts with customers also contain onerous damages provisions, including for such matters as consequential damages.
Our existing and future debt levels may limit our flexibility to obtain financing and to pursue other business opportunities.
Our Credit Agreement provides up to $75.0 million of borrowing capacity, subject to certain limitations. As of December 31, 2020, we had $62.0 million of borrowings outstanding under our Credit Agreement. We may be able to incur additional debt, subject to limitations in our Credit Agreement. Our degree of leverage could have important consequences to us, including the following:
18
| ● | our ability to obtain additional financing, if necessary, for working capital, capital expenditures, acquisitions, or other purposes may be impaired, or such financing may not be available on favorable terms; |
| ● | our funds available for operations, future business opportunities and distributions to unitholders will be reduced by that portion of our cash flow required to make interest payments on our debt; |
| ● | we may be more vulnerable to competitive pressures or a downturn in our business or the economy generally; and |
| ● | our flexibility in responding to changing business and economic conditions may be limited. |
Our ability to refinance and service our debt will depend upon, among other things, our future financial and operating performance, which will be affected by prevailing economic conditions and financial, business, regulatory and other factors, some of which are beyond our control. If our operating results are not sufficient to service our current or future indebtedness, we will be forced to take actions such as reducing distributions, reducing or delaying our business activities, acquisitions, investments or capital expenditures, selling assets or seeking additional equity capital. We may not be able to effect any of these actions on satisfactory terms or at all.
Our Credit Agreement matures on May 31, 2022. If we are unable to enter into a new or amended credit facility prior to that date, all amounts outstanding under the Credit Agreement would become due and payable. Our ability to enter into a new or amended credit facility with a longer term will depend on a number of factors, many of which are beyond our control, which include the perceptions of lenders related to our future financial performance, the perceptions of lenders regarding market conditions, the lending strategies and policies of lenders, and other factors. Even if we are able to enter into a new or amended credit facility with a longer term, the terms of such a facility could be less favorable than the terms under our existing Credit Agreement.
We are required to maintain compliance with certain financial statement ratios at each quarter end. If we are unable to meet these covenants, we could go into default on the Credit Agreement. One of the covenants in the Credit Agreement limits our borrowing capacity at each quarter end to a specified multiple of trailing-twelve-month EBITDA (as defined in the Credit Agreement). This covenant could restrict our ability to borrow funds for working capital needs, which could constrain our ability to generate revenues.
We do not enter into long-term contracts with our customers, which subjects us to renewal or termination risks.
We do not typically enter into long-term contracts with our customers. While we frequently operate under master services agreements with customers that set forth the terms on which we will provide services, customers operating under these agreements typically have the ability to terminate their relationship with us at any time at their sole discretion by choosing to not use us to provide services. Therefore, it is possible that our customers may decide not to use our inspection services, pipeline and process services, or water treatment services. Decisions by customers to no longer use our services could adversely affect our operations, financial condition, cash flows and ability to make cash distribution to our unitholders.
We depend on a limited number of customers for a substantial portion of our revenues. The loss of, or a material nonpayment by, any of our key customers could adversely affect our results of operations, financial condition, and ability to make cash distributions to our unitholders.
Our ten largest customers generated approximately 71%, 77% and 67% of our consolidated revenue in 2020, 2019, and 2018, respectively. The following table sets forth the customers who accounted for more than 10% of our consolidated revenue for the years ended December 31, 2020, 2019, and 2018 (all of which are customers of our Inspection Services segment):
| 2020 | 2019 | 2018 | ||
| Pacific Gas and Electric Company | Pacific Gas and Electric Company | Pacific Gas and Electric Company | ||
| Enterprise Products Partners L.P. | Phillips 66 | Plains All American Pipeline, L.P. | ||
| Plains All American Pipeline, L.P. |
The loss of all, or even a portion of the revenues from these customers, as a result of competition, market conditions or otherwise, could have a material adverse effect on our business, results of operations, financial condition, and cash flows.
Our business is dependent upon the willingness of our customers to outsource their inspection services and integrity service activities and waste management activities.
Our business is largely dependent on the willingness of customers to outsource their inspection services and pipeline and process service activities and their water and environmental treatment services. Some pipeline owners and operators currently inspect and perform pipeline and process service activities on their own pipeline systems using the same techniques and technologies that we use, as well as others that we currently do not employ. In addition, many oil and natural gas producing companies own and operate waste treatment, recovery, and water treatment facilities that provide services that we could otherwise provide to them, and some producers recycle saltwater on-site that we could otherwise dispose for them. Most oilfield operators, including many of our customers, have numerous abandoned wells that could be licensed to dispose of internally-generated waste and third-party waste, which, if our customers chose to license these abandoned wells, could result in competition for us. Additionally, technologies may be developed that could allow our customers to recycle saltwater and to recover oil through oilfield waste processing, which would make our services unnecessary. Our current customers could decide to inspect and perform integrity activities on their own pipeline systems or process and dispose of their waste internally, either of which could have a material adverse effect on our financial position, results of operations, cash flows, and our ability to make cash distributions to our unitholders.
19
The credit risks of our concentrated customer base could indirectly result in losses to us.
Many of our customers are oil and natural gas companies that have or may face liquidity constraints, especially in light of the current commodity price environment. The concentration of our customers in the energy industry may impact our overall exposure to credit risk since our customers may be similarly affected by prolonged changes in economic and industry conditions. If a significant number of our customers experience a prolonged business decline or disruptions, we may incur increased exposure to credit risk and bad debts.
Sanchez Energy Corporation and certain of its affiliates (collectively, “Sanchez”), a former customer, filed for bankruptcy protection in August 2019. As of December 31, 2020, our Consolidated Balance Sheet included $0.5 million of pre-petition accounts receivable from Sanchez. We have recorded an allowance of $0.5 million at December 31, 2020 against these accounts receivable from Sanchez.
We serve customers who are involved in drilling for, producing, and transporting oil, natural gas, and natural gas liquids. Adverse developments affecting the oil and natural gas industry or drilling activity, including sustained low or further reduced common prices, reduced demand for oil, natural gas, and natural gas liquids products, adverse weather conditions, and increased regulation of drilling and production, could have a material adverse effect on our results of operations.
We depend on our oil and natural gas customers’ willingness to make operating and capital expenditures to develop and produce oil and natural gas in the United States. A reduction in drilling activity generally results in decreases in the volumes of new flowback and produced water generated, which adversely impacts our revenues. Therefore, if these expenditures decline, our business is likely to be adversely affected.
The level of activity in the oil and natural gas exploration and production industry in the U.S. has been volatile. According to a published oil and gas drilling rig count, the United States weekly aggregate rig count reached an all-time high of 4,530 rigs in December 1981 and a post-1942 low rig count of 244 rigs in August 2020. When oil and natural gas prices are low, E&P companies, pipeline owners, and operators and public utility or local distribution companies in the regions we conduct our business typically reduce capital spending maintaining their pipelines or oil and natural gas production.
Crude oil prices decreased significantly during 2020, due in part to decreased demand as a result of the worldwide COVID-19 pandemic. This decline in oil prices led many of our customers to change their budgets and plans, which has decreased their spending on drilling, completions, and exploration. This had an adverse effect on construction of new pipelines, gathering systems, and related energy infrastructure. Lower exploration and production activity also affected the midstream industry and led to delays and cancellations of projects. It is also possible that our customers may elect to defer maintenance activities on their infrastructure. Such developments reduce our opportunities to generate revenues. It is impossible at this time to determine what may occur, as customer plans will evolve over time. It is possible that the cumulative nature of these events could have a material adverse effect on our results of operations and financial position.
The Environmental Services segment constituted approximately 3%, 3%, and 4% of our revenue in 2020, 2019, and 2018, respectively. The Bakken region of North Dakota generally requires higher oil prices than certain other regions in order to generate suitable economic returns for E&P companies. Therefore, a continued decrease in drilling activity or hydraulic fracking could have an adverse effect on our financial position, results of operations, demand for services, and cash flows.
Our customers’ willingness to engage in drilling and production of oil and natural gas and to construct new pipelines and other infrastructure depends largely upon prevailing industry conditions that are influenced by numerous factors over which our management has no control, such as:
| ● | the supply of and demand for oil and natural gas; |
| ● | the level of prices, and market expectations with respect to future prices of oil and natural gas; |
| ● | the cost of exploring for, developing, producing, and delivering oil and natural gas; |
| ● | the cost of fracturing services; |
| ● | the market’s expected rate of decline of current oil and natural gas production; |
| ● | the rate and frequency at which new oil and natural gas reserves are discovered; |
| ● | available pipeline and other transportation capacity; |
| ● | lead times associated with acquiring equipment and products and availability of personnel; |
| ● | weather conditions, including hurricanes, tornadoes, earthquakes, wildfires, drought or man-made disasters that can affect oil and natural gas operations over a wide area, as well as local weather conditions such as unusually cold winters in the Bakken Shale region of the Williston Basin in North Dakota that can have a significant impact on drilling activity in that region; |
20
| ● | domestic and worldwide economic conditions; |
| ● | contractions in the credit market; |
| ● | political instability in certain oil and natural gas producing countries; |
| ● | the continued threat of terrorism and the impact of military and other action, including military action in the Middle East or other parts of the world; |
| ● | governmental regulations, including income tax laws or government incentive programs relating to the oil and natural gas industry and the policies of governments regarding the exploration for and production and development of oil and natural gas reserves; |
| ● | the level of oil production by non-OPEC countries and the available excess production capacity contained in OPEC member countries; |
| ● | oil refining capacity and shifts in end-customer preferences toward fuel efficiency; |
| ● | potential acceleration in the development, and the price and availability, of alternative fuels; |
| ● | the availability of water resources for use in hydraulic fracturing operations; |
| ● | public pressure on, and legislative and regulatory interest in, federal, state, and local governments to ban, stop, significantly limit or regulate hydraulic fracturing operations; |
| ● | technical advances affecting energy consumption; |
| ● | access to necessary labor and services; |
| ● | the access to and cost of debt and equity capital for oil and natural gas producers; |
| ● | merger and divestiture activity among oil and natural gas producers; and |
| ● | the impact of changing regulations and environmental and safety rules and policies. |
Our markets are highly competitive, and increased competition could adversely impact our financial position, our results of operations, demand for our services, our cash flows, or our ability to make required payments on outstanding debt.
We have many competitors in our primary markets. Some of our customers also compete with us in the treatment and disposal sector by offering similar such services to other oil and natural gas companies. Our customers regularly evaluate the best combination of value and price from competing alternatives and new technologies and can move between alternatives or, in some cases, develop their own alternatives with relative ease. This competition influences the prices we charge and requires us to aggressively control our costs and maximize efficiency in order to maintain acceptable operating margins; however, we may be unable to do so and remain competitive on a cost-for-service basis. In addition, existing and future competitors may develop or offer services or new technologies that have pricing, location or other advantages over the services we provide. Adverse market conditions could lead customers to demand lower prices, which could result in a reduction in our profit margins.
A failure by our employees to follow applicable procedures and guidelines or on-site accidents could have a material adverse effect on our business.
We require our employees to comply with various internal procedures and guidelines, including an environmental management program and worker health and safety guidelines. The failure by our employees to comply with our internal environmental, health, and safety guidelines could result in personal injuries, property damage or non-compliance with applicable governmental laws and regulations, which may lead to fines, remediation obligations or third-party claims. Any such fines, remediation obligations, third-party claims or losses could have a material adverse effect on our financial position, results of operations, and cash flows. In addition, on-site accidents can result in injury or death to our or other contractors’ employees or damage to our or other contractors’ equipment and facilities and damage to other people, truck drivers, area residents, and property. Any fines or third-party claims resulting from any such on-site accidents could have a material adverse effect on our business. Under Department of Transportation regulations, a sustained failure to operate vehicles safely could result in the loss of our ability to operate vehicles in the conduct of our business.
In addition, while an inspector is performing inspection services or integrity services for us, the inspector is our employee and is eligible for workers’ compensation claims if the inspector is injured or killed while working for us. As the inspectors generally travel to and from projects in their own vehicles, we may be responsible for workers compensation claims or third-party claims arising out of vehicle accidents, which could negatively affect our results of operations. Our inspectors travel extensively in their own vehicles, as job sites are often a long distance from an inspector’s home and from his/her lodging location while he/she is working on a project.
21
Unsatisfactory safety performance may negatively affect our customer relationships, workers compensation rates and, to the extent we fail to retain existing customers or attract new customers, adversely impact our revenues.
Our ability to retain existing customers and attract new business is dependent on many factors, including our ability to demonstrate that we can reliably and safely operate our business and stay current on constantly changing rules, regulations, training, and laws. Existing and potential customers consider the safety record of their service providers to be of high importance in their decision to engage third-party servicers. If one or more accidents were to occur at one of our operating sites, or pipelines or gathering systems we inspect, the affected customer may seek to terminate or cancel its use of our facilities or services and may be less likely to continue to use our services, which could cause us to lose substantial revenues. Further, our ability to attract new customers may be impaired if they elect not to purchase our services because they view our safety record as unacceptable. In addition, it is possible that we will experience numerous or particularly severe accidents in the future, causing our safety record to deteriorate. This may be more likely if we continue to grow, if we experience high employee turnover or labor shortage, or add inexperienced personnel. In addition, we could be subject to liability for damages as a result of such accidents and could incur penalties or fines for violations of applicable safety laws and regulations.
Our ability to grow in the future is dependent on our ability to access external growth capital.
We rely in part upon external financing sources, including borrowings under our credit facility and the issuance of debt and equity securities, to fund working capital and growth capital expenditures. However, we may not be able to obtain equity or debt financing on terms favorable to us, or at all. To the extent we are unable to efficiently finance growth externally, our cash distribution policy will significantly impair our ability to grow. In addition, because we distribute all of our available cash, we may not grow as quickly as businesses that reinvest their available cash to expand ongoing operations. Furthermore, Holdings is under no obligation to fund our growth. To the extent we issue additional units, the payment of distributions on those additional units may increase the risk that we will be unable to maintain or increase our per-unit distribution level. There are no limitations in our partnership agreement on our ability to issue additional units, including units ranking senior to the common units. The incurrence of borrowings or other debt by us to finance our growth strategy would result in increased interest expense, which in turn would reduce the available cash that we have to distribute to our unitholders.
We are vulnerable to the potential difficulties, expenses, and uncertainties associated with growth and expansion.
We believe that our future success depends on our ability to manage growth, including increased demands and responsibilities. The following factors could present difficulties to us:
| ● | access to debt and equity capital on attractive terms; |
| ● | limitations with systems and technology; |
| ● | organizational challenges common to large, expansive operations; |
| ● | administrative burdens; |
| ● | employee insurance; |
| ● | safety and training; |
| ● | ability to recruit, train, and retain personnel and managers; |
| ● | ability to obtain permits for expanded operations; and |
| ● | long lead times associated with acquiring equipment and building any new facilities. |
Our operating results could be adversely affected if we do not successfully manage any of these potential difficulties.
We sell residual oil that we recover during our water treatment process. Volumes of residual oil recovered during the water treatment process can vary. Any significant reduction in residual oil content in the water we treat, or the price we achieve for residual oil sales, will affect our recovery of residual oil and, indirectly, our profitability.
Approximately 3%, 6%, and 5% of the revenue in 2020, 2019, and 2018, respectively, of our Environmental Services segment was derived from sales of residual oil recovered during the water treatment process. Our ability to recover sufficient volumes of residual oil is dependent upon the residual oil content in the water we treat, which is, among other things, a function of water type, chemistry, source, and temperature. Generally, where outside temperatures are lower, there is less residual oil content and separation is more difficult. Thus, our residual oil recovery during the winter season is lower than our recovery during the summer season in North Dakota. Additionally, residual oil content will decrease if, among other things, producers recover higher levels of residual oil in water prior to delivering such water to us for treatment. Also, the revenues we derive from sales of residual oil are subjected to fluctuations in the price of oil. Any reduction in residual crude oil content in the water we treat or the prices we realize on our sales of residual oil could materially and adversely affect our profitability.
22
Our utilization of existing capacity, expansion of existing water treatment facilities, and construction or purchase of new water treatment facilities may not result in revenue increases and will be subject to regulatory, environmental, political, legal, and economic risks, which could adversely affect our operations and financial condition.
The construction of a new water treatment facility or the extension, renovation or expansion of an existing water treatment facility, such as by connecting such water treatment facility to existing or newly constructed pipeline systems, involves numerous business, competitive, regulatory, environmental, political, and legal uncertainties, most of which are beyond our control. If we undertake these projects, they may not be completed on schedule, at all, or at the budgeted cost. Furthermore, we will not receive any material increases in revenues until after completion of the project, although we will have to pay financing and construction costs during the construction period. As a result, new water treatment facilities may not be able to attract enough demand for water and environmental services to achieve our expected investment return, which could materially adversely affect our results of operations and financial condition and our ability in the future to make distributions to our unitholders.
Our ability to acquire assets from Holdings or third parties is subject to risks and uncertainty. If we are unable to make acquisitions on economically acceptable terms, our future growth would be limited, and any acquisitions we may make may reduce, rather than increase, our cash flows and ability to make distributions to unitholders. Furthermore, we may not realize the benefits from or successfully integrate any acquisitions.
Holdings has made acquisitions of other types of businesses that may be suitable to our operations in the future. We may have the opportunity to make acquisitions directly from Holdings and its affiliates. The consummation and timing of any future acquisitions of these assets will depend upon, among other things, Holdings’ and its affiliates’ willingness to offer these assets for sale, our ability to negotiate acceptable purchase agreements and commercial agreements with respect to the assets and our ability to obtain financing on acceptable terms. We can offer no assurance that we will be able to successfully consummate any future acquisitions with Holdings and its affiliates, and Holdings and its affiliates are under no obligation to accept any offer that we may choose to make. In addition, certain of these assets may require substantial capital expenditures in order to maintain compliance with applicable regulatory requirements or otherwise make them suitable for our commercial needs. For these or a variety of other reasons, we may decide not to acquire these assets from Holdings and its affiliates if, and when, Holdings and its affiliates offers such assets for sale, and our decision will not be subject to unitholder approval.
Additionally, we may not be able to make accretive acquisitions from third parties if we are:
| ● | unable to identify attractive acquisition candidates or negotiate acceptable purchase contracts; |
| ● | unable to obtain financing for these acquisitions on economically acceptable terms; |
| ● | outbid by competitors; or |
| ● | for any other reason. |
Furthermore, even if we do consummate acquisitions that we believe will be accretive, they may in fact result in a decrease in cash flow. Any acquisition involves potential risks, including, among other things:
| ● | mistaken assumptions about disposal capacity, number and quality of inspectors, revenues and costs, cash flows, capital expenditures, and synergies; |
| ● | the assumption of unknown liabilities; |
| ● | limitations on rights to indemnity from the seller; |
| ● | mistaken assumptions about the overall costs of equity or debt; |
| ● | the diversion of management’s attention from other business concerns; |
| ● | integrating business operations or unforeseen regulatory issues; |
| ● | unforeseen new regulations; |
| ● | unforeseen difficulties operating in new geographic areas; and |
| ● | customer or key personnel losses at the acquired businesses. |
If we consummate any future acquisitions, our capitalization and results of operations may change significantly, and unitholders will not have the opportunity to evaluate the economic, financial, and other relevant information that we will consider in determining the application of these funds and other resources.
We conduct a portion of our operations through entities that we partially own, which subjects us to additional risks that could have a material adverse effect on our financial condition and results of operations.
We own a 51.0% interest in CBI, a 25% interest in Alati Arnegard, LLC, and a 49.0% interest in CF Inspection. We may also enter into other arrangements with third parties in the future. Other third parties in future arrangements may have obligations that are important to the success of the arrangement, such as the obligation to pay their share of capital and other costs of these partially owned entities. The performance of these third-party obligations, including the ability of our current partners to satisfy their respective obligations, is outside our control. If these parties do not satisfy their obligations under the arrangements, our business may be adversely affected.
23
Our joint venture arrangements may involve risks not otherwise present without a partner, including, for example:
| ● | our partner shares certain blocking rights over transactions; |
| ● | our partner may take actions contrary to our instructions or requests or contrary to our policies or objectives; |
| ● | although we may control these joint ventures, we may have contractual duties to the joint ventures’ respective other owners, which may conflict with our interests and the interests of our unitholders; and |
| ● | disputes between us and other partners may result in delays, litigation, or operational impasses. |
The risks described above or any failure to continue joint ventures or to resolve disagreements with our third-party partners could adversely affect our ability to transact the business that is the subject of such business, which would, in turn, negatively affect our financial condition, results of operations, and ability to distribute cash to our unitholders.
Restrictions in our Credit Agreement could adversely affect our business, financial condition, results of operations, ability to make cash distributions to our unitholders and the value of our units.
In March 2021, we entered into an amendment to our Credit Agreement. As amended, the Credit Agreement provides up to $75.0 million of borrowing capacity and matures in May 2022. Our Credit Agreement limits our ability to, among other things:
| ● | make cash distributions to common and preferred unitholders; |
| ● | incur or guarantee additional debt; |
| ● | make certain investments and acquisitions; |
| ● | incur certain liens or permit them to exist; |
| ● | alter our lines of business; |
| ● | enter into certain types of transactions with affiliates; |
| ● | merge or consolidate with another company; and |
| ● | transfer, sell or otherwise dispose of assets. |
The Credit Agreement also contains covenants requiring us to maintain certain financial ratios. Our ability to meet those financial ratios and tests can be affected by events beyond our control, and we cannot assure unitholders that we will be able to meet these ratios and tests.
The provisions of our Credit Agreement may affect our ability to obtain future financing and pursue attractive business opportunities and our flexibility in planning for, and reacting to, changes in business conditions. For example, our funds available for operations, future business opportunities and cash distributions to unitholders may be reduced by that portion of our cash flow required to make interest payments on our debt. Our ability to service our debt may depend upon, among other things, our future financial and operating performance, which will be affected by prevailing economic conditions and financial, business, regulatory and other factors, some of which are beyond our control. If our operating results are not sufficient to service any future indebtedness, we will be forced to take actions such as reducing distributions, reducing or delaying our business activities, acquisitions, investments or capital expenditures, selling assets or seeking additional equity capital. We cannot assure unitholders that we would be able to take any of these actions, that these actions would be successful and permit us to meet our scheduled debt service obligations or satisfy our capital requirements, or that these actions would be permitted under the terms of our Credit Agreement, or future debt agreements. Our debt documents restrict our ability to dispose of assets and use the proceeds from the disposition. We may not be able to consummate those dispositions or to obtain the proceeds which we could realize from them and these proceeds may not be adequate to meet any debt service obligations then due. In addition, a failure to comply with the provisions of our credit facility could result in a default or an event of default that could enable its lenders to declare the outstanding principal of that debt, together with accrued and unpaid interest, to be immediately due and payable. If the payment of debt is accelerated, defaults under other debt instruments, if any, may be triggered, and our assets may be insufficient to repay such debt in full, and the holders of our units could experience a partial or total loss of their investment in us. Please read “Item 7 – Management’s Discussion and Analysis of Financial Condition and Results of Operations – Liquidity and Capital Resources” for additional information about our credit facility.
24
We must comply with worker health and safety laws and regulations at our facilities and in connection with our operations, and failure to do so could result in significant liability and/or fines and penalties.
Our activities are subject to a wide range of national, state, and local occupational health and safety laws and regulations. These environmental, health, and safety laws and regulations applicable to our business and the business of our customers, including laws regulating the energy industry, and the interpretation or enforcement of these laws and regulations, are constantly evolving. Failure to comply with these health and safety laws and regulations could lead to third-party claims, criminal and regulatory violations, civil fines, and changes in the way we operate our facilities, which could increase the cost of operating our business and have a material adverse effect on our financial position, results of operations, and cash flows and our ability to make cash distributions to our unitholders. Our safety and compliance record is also important to our clients, and our failure to maintain safe operations could materially impact our business.
Our business involves many hazards, operational risks, and regulatory uncertainties, some of which may not be fully covered by insurance. If a significant accident or event occurs for which we are not adequately insured or if we fail to recover all anticipated insurance proceeds for significant accidents or events for which we are insured, our operations and financial results could be adversely affected.
Risks inherent to our industry, such as lightning strikes, equipment defects, vehicle accidents, explosions, earthquakes, and incidents related to the handling of fluids and wastes, can cause personal injury, loss of life, suspension of operations, damage to formations, damage to facilities, business interruption, and damage to or destruction of property, equipment and the environment. We use fiberglass tanks at our water treatment facilities because fiberglass is less corrosive than other materials traditionally utilized. These tanks are, however, more prone to lightning strikes than traditional tanks, as a result of fiberglass’ tendency to store static electricity. The lightning protection systems we employ may not succeed in preventing lightning from damaging a facility. The risks associated with these types of accidents could expose us to substantial liability for personal injury, wrongful death, property damage, pollution and other environmental damages. The frequency and severity of such incidents will affect operating costs, insurability, and relationships with employees and regulators.
Our insurance coverage may be inadequate to cover our liabilities. For instance, while our insurance policies apply to and cover costs imposed on us by retroactive changes in governmental regulations, the costs we incur as a result of such regulatory changes cannot be known in advance and may exceed our coverage limitations. In addition, we may not be able to maintain adequate insurance in the future at rates we consider reasonable and commercially justifiable, and insurance may not continue to be available on terms as favorable as our current arrangements. The occurrence of a significant uninsured claim, a claim in excess of the insurance coverage limits maintained by us, or a claim at a time when we are not able to obtain liability insurance could have a material adverse effect on our ability to conduct normal business operations and on our financial condition, results of operations, and cash flows. In some cases, electrical storms can damage facility motors or electronics, and it may not be possible to prove to the insurance carrier that such storm caused the damage. We do not carry business interruption insurance and as a result, could suffer a significant loss in revenue that could impact our ability to pay cash distributions on our units.
Accidents or incidents related to the handling of hydraulic fracturing fluids, saltwater, or other wastes are covered by our insurance against claims made for bodily injury, property damage, or environmental damage and clean-up costs stemming from a sudden and accidental pollution event, provided that we report the event within 30 days after its commencement. The coverage applies to incidents the company is legally obligated to pay resulting from pollution conditions caused by covered operations. We may not have coverage if the operator is unaware of the pollution event and unable to report the “occurrence” to the insurance company within the required time frame. Although we have coverage for gradual, long-term pollution events at certain locations, this coverage does not extend to all places where we may be located or where we may do business. We also may have liability exposure if any pipelines or gathering systems transporting water to our water treatment facilities develop a leak (depending upon the terms of the insurance contracts at issue).
On November 29, 2018, a production inspector employed by CEM-TIR suffered a fatal injury while working at a client’s jobsite. The injury occurred while the employee was performing a procedure inconsistent with his job duties, at the direction of the client’s employee. CEM-TIR had no knowledge or control over the work that was performed by the employee. An OSHA investigation determined that neither CEM-TIR nor TIR were at fault, and instead issued citations to the client.
A failure in our operational and communications systems, loss of power, natural disasters, or cyber security attacks on any of our facilities, or any of our third- parties’ facilities on which we rely, may adversely affect our results of operations and financial results.
Our business is dependent upon our operational systems to process a large amount of data and a substantial number of transactions. If any of our financial, operational, or other data processing systems fail or have other significant shortcomings, our financial results could be adversely affected. Our financial results could also be adversely affected if an employee causes our operational or financial systems to fail, either as a result of inadvertent error, or by deliberately tampering with or manipulating our operational systems. In addition, dependence upon automated systems may further increase the risk that operational system flaws, employee tampering, or manipulation of those systems will result in losses that are difficult to detect.
Due to technological advances, we have become more reliant on technology to help increase efficiency in our business. We use computer programs to help run our financial and operations processes, and this may subject our business to increased risks. Any future cyber security attacks that affect our facilities, communications systems, our customers, or any of our financial data could have a material adverse effect on our business. In addition, cyber-attacks on our customer and employee data may result in a financial loss and may negatively impact our reputation. Third-party systems on which we rely could also suffer operational system failure. Any of these occurrences could disrupt our business, result in potential liability or reputational damage, or otherwise have an adverse effect on our financial results.
Our business could be adversely impacted if we are unable to obtain or maintain the regulatory permits required to develop and operate our facilities and to dispose of certain types of waste.
We own and operate water treatment facilities in North Dakota, which are subject to regulatory programs for addressing the handling, treatment, recycling and disposal of saltwater. We are also required to comply with federal laws and regulations governing our operations. These environmental laws and regulations require that we, among other things, obtain permits and authorizations prior to our developing and operating waste treatment and storage facilities and in connection with our disposing and transporting certain types of waste. Regulatory agencies strictly monitor waste handling and disposal practices at all of our facilities. For many of our sites, we are required under applicable laws, regulations, and/or permits to conduct periodic monitoring, company-directed testing, and third-party testing. Any failure to comply with such laws, regulations, or permits may result in suspension or revocation of necessary permits and authorizations, civil or criminal liability, and imposition of fines and penalties, which could adversely impact our operations and revenues and ability to continue to provide oilfield water and environmental services to our customers.
25
In addition, we may experience a delay in obtaining, be unable to obtain, or suffer the revocation of required permits or regulatory authorizations, which may cause us to be unable to serve customers, interrupt our operations, and limit our growth and revenue. Regulatory agencies may impose more stringent or burdensome restrictions or obligations on our operations when we seek to renew or amend our permits. For example, permit conditions may limit the amount or types of waste we can accept, require us to make material expenditures to upgrade our facilities, implement more burdensome and expensive monitoring or sampling programs, or increase the amount of financial assurance that we provide to cover future facility closure costs. Moreover, nongovernmental organizations or the public may elect to protest the issuance or renewal of our permits on the basis of developmental, environmental, or aesthetic considerations, which protests may contribute to a delay or denial in the issuance or reissuance of such permits. It is not uncommon for local property owners or, in some cases, oil and natural gas producers, to oppose water treatment permits. Any such limitations or requirements could limit the water and environmental services we provide to our customers, or make such services more expensive to provide, which could have a material adverse effect on our financial position, results of operations, cash flows, and our ability to make cash distributions to our unitholders.
Our customers’ delays in obtaining permits for their operations could impair our business.
In most states, our customers are required to obtain permits from one or more governmental agencies in order to perform drilling and completion activities and to operate pipeline and gathering systems. Such permits are typically issued by state agencies, but federal and local governmental permits may also be required. The requirements for such permits vary depending on the location where such drilling and completion, and pipeline and gathering activities will be conducted. As with all governmental permitting processes, there is a degree of uncertainty as to whether a permit will be granted, the time it will take for a permit to be issued, and the conditions that may be imposed in connection with the granting of the permit. Recently, moratoriums on the issuance of permits for certain types of drilling and completion activities have been imposed in some areas, such as New York. Some of our customers’ drilling and completion activities may also take place on federal land or Native American lands, requiring leases and other approvals from the federal government or Native American tribes to conduct such drilling and completion activities. In some cases, federal agencies have cancelled proposed leases for federal lands and refused or delayed required approvals. Consequently, our customers’ operations in certain areas of the United States may be interrupted or suspended for varying lengths of time, causing a loss of revenue to us and adversely affecting our results of operations in support of those customers.
In the future we may face increased obligations relating to the closing of our water treatment facilities and we may be required to provide an increased level of financial assurance to regulatory agencies to ensure the appropriate closure activities occur for a water treatment facility.
Obtaining a permit to own or operate a water treatment facility generally requires us to establish performance bonds, letters of credit or other forms of financial assurance to address clean up and closure obligations at our water treatment facilities. In particular, the North Dakota regulatory agencies require us to post performance bonds in connection with the operation of our water treatment facilities. As of December 31, 2020 we have posted performance bonds of $0.7 million (recorded within prepaid expenses and other on our Consolidated Balance Sheet) and we expect to post additional performance bonds of $0.3 million in early 2021. Additionally, in the future, regulatory agencies may require us to increase the amount of our closure bonds at existing water treatment facilities. We have accrued approximately $0.2 million within other noncurrent liabilities on our Consolidated Balance Sheet related to our contemplated future closure obligations of our water treatment facilities as of December 31, 2020. This amount was calculated by estimating the total amount of closure obligations and the dates at which such closures might occur and discounting this total estimated cost to calculate a present value. However, actual costs could exceed our current expectations, as a result of, among other things, federal, state or local government regulatory action, increased costs our service providers charge who assist in closing water treatment facilities, and additional environmental remediation requirements. In addition, such closures could occur sooner than estimated in our calculation of the liability for the closure obligations, which could result in the expense recognition being accelerated. Increased regulatory requirements regarding our existing or future water treatment facilities, including the requirement to pay increased closure and post-closure costs or to establish increased financial assurance for such activities could substantially increase our operating costs and cause our available cash that we have to distribute to our unitholders to decline.
Changes in laws or government regulations regarding hydraulic fracturing could increase our customers’ costs of doing business, limit the areas in which our customers can operate and reduce oil and natural gas production by our customers, which could adversely impact our business.
We do not conduct hydraulic fracturing operations, but we do provide treatment and disposal services with respect to the fluids used and wastes generated by our customers in such operations, which are often necessary to drill and complete new wells and maintain existing wells. Hydraulic fracturing involves the injection of water, sand or other proppants and chemicals under pressure into target geological formations to fracture the surrounding rock and stimulate oil and gas production. Presently, hydraulic fracturing is regulated primarily at the state level, typically by state oil and natural gas commissions and similar agencies. Several states, including North Dakota, where we conduct our water and environmental services business, have either adopted or proposed laws and/or regulations to require oil and natural gas operators to disclose chemical ingredients and water volumes such operators use to hydraulically fracture wells. These states also impose stringent well construction and monitoring requirements. The chemical ingredient information we provide to these states is generally available to the public via online databases including fracfocus.org. Making this information publicly available may bring more scrutiny to hydraulic fracturing operations.
At the federal level, the SDWA regulates the underground injection of substances through the UIC program and generally exempts hydraulic fracturing from the definition of “underground injection.” The U.S. Congress has in recent legislative sessions considered legislation to amend the SDWA. Such legislation would repeal the exemption for hydraulic fracturing from the definition of “underground injection” and require federal permitting and regulatory control of hydraulic fracturing, as well as legislative proposals to require disclosure of the chemical constituents of the fluids used in the fracturing process.
26
Federal agencies have also asserted regulatory authority over certain aspects of the process within their respective jurisdictions. For example, the EPA issued an Advanced Notice of Proposed Rulemaking seeking comment on its intent to develop regulations under the Toxic Substances Control Act to require companies to disclose information regarding the chemicals used in hydraulic fracturing, and proposed effluent limitations for the disposal of wastewater from unconventional resources to publicly owned treatment works.
The EPA conducted a study of the potential impacts of hydraulic fracturing activities on drinking water. The EPA released its final report in December 2016. The study concluded that under certain limited circumstances, hydraulic fracturing activities and related disposal and fluid management activities, could adversely affect drinking water supplies. As part of this study, the EPA requested that certain companies provide them with information concerning the chemicals used in the hydraulic fracturing process. This study and other studies that may be undertaken by the EPA or other governmental authorities, depending on their results, could spur initiatives to regulate hydraulic fracturing under the SDWA or otherwise. If new federal, state or local laws or regulations that significantly restrict hydraulic fracturing are adopted, such legal requirements could result in delays, eliminate certain drilling and injection activities and make it more difficult or costly for our customers to perform fracturing. Any such regulations limiting or prohibiting hydraulic fracturing could reduce oil and natural gas exploration and production activities by our customers and, therefore, adversely affect our business. Such laws or regulations could also materially increase our costs of compliance and doing business by more strictly regulating how hydraulic fracturing wastes are handled or disposed.
Oil and natural gas producers’ operations, especially those using hydraulic fracturing, are substantially dependent on the availability of water. Restrictions on the ability to obtain water may incentivize oil and natural gas producers’ water recycling efforts which would decrease the volume of saltwater delivered to our water treatment facilities and correspondingly decrease our revenues attributed to saltwater delivery services.
Water is an essential component of oil and natural gas production during the drilling, and in particular, hydraulic fracturing, process. However, the availability of suitable water supplies may be limited by natural occurrences, such as prolonged droughts. As a result, some local water districts have begun restricting the use of water for hydraulic fracturing in an effort to protect local water supplies. For example, in response to continuing drought conditions in 2015, 2014, and 2013, the Texas Legislature considered a number of bills that would have mandated recycling of flowback and produced water and/or prohibited recyclable water from being disposed of in wells. If oil and natural gas producers are unable to obtain water to use in their operations from local sources, they may be incentivized to recycle and reuse saltwater instead of delivering such saltwater to our water treatment facilities. Similarly, mandatory recycling programs could reduce the amount of materials sent to us for treatment and disposal. Any such limits or mandates could adversely affect our business and results of operations.
Increased attention to seismic activity associated with hydraulic fracturing and underground disposal could result in additional regulations and adversely impact demand for our services.
There exists a concern among certain experts in the oil and gas industry that the underground injection of produced water into disposal wells has triggered seismic activity in certain areas. Some states have promulgated rules or guidance in response to these concerns. For example, in Texas, the Texas Railroad Commission (“TRC”) published a final rule in October 2014 governing permitting or re-permitting of disposal wells that will require, among other things, the submission of information on seismic events occurring within a specified radius of the disposal well location, as well as logs, geologic cross sections, and structure maps relating to the disposal area in question. If the permittee or an applicant of a disposal well permit fails to demonstrate that the injected fluids are confined to the disposal zone, or if scientific data indicates such a disposal well is likely to be or determined to be contributing to seismic activity, then the TRC may deny, modify, suspend, or terminate the permit application or existing operating permit for that well. New seismic permitting requirements applicable to disposal wells would impose more stringent permitting requirements and would be likely to result in added costs to comply, or perhaps, may require alternative methods of disposing of saltwater and other fluids, which could delay production schedules and also result in increased costs. Additional regulatory measures designed to minimize or avoid damage to geologic formations may be imposed to address such concerns.
We and our customers may incur significant liability under, or costs and expenditures to comply with, environmental regulations, which are complex and subject to frequent change.
Our and our customer’s operations are subject to stringent federal, state, provincial and local laws and regulations relating to, among other things, protection of natural resources, wetlands, endangered species, the environment, waste management, waste disposal, and transportation of waste and other materials. These laws and regulations may impose numerous obligations that are applicable to our and our customer’s operations, including the acquisition of permits to conduct regulated activities, the incurrence of capital or operating expenditures to limit or prevent releases of materials from our or our customers’ operations, and the imposition of substantial liabilities and remedial obligations for pollution or contamination resulting from our and our customer’s operations.
Compliance with this complex array of laws and regulations is difficult and may require us to make significant expenditures. As the federal government continues to develop and propose regulations relating to fuel quality, engine efficiency and GHG emissions, we may experience an increase in costs related to equipment purchases and maintenance, impairment of equipment productivity, and a decrease in the residual value of equipment. In addition, our customers could impose environmental, social, and governance mandates on us that are more stringent than federal, state, provincial and local laws and regulations, which could result in further increases in costs. A breach of such requirements may result in suspension or revocation of necessary licenses or authorizations, civil liability for, among other things, pollution damage and the imposition of material fines.
Our operations also pose risks of environmental liability due to leakage, migration, releases or spills from our operations to surface or subsurface soils, surface water, or groundwater. Some environmental laws and regulations impose strict, joint and several liabilities in connection with releases of regulated substances into the environment. Therefore, in some situations we could be exposed to liability as a result of our conduct that was lawful at the time it occurred or the conduct of, or conditions caused by, third parties.
27
Laws protecting the environment generally have become more stringent over time. We expect this trend to continue, which could lead to material increases in our costs for future environmental compliance and remediation, and could adversely affect our operations by restricting the way in which we treat and dispose of exploration and production, or E&P, waste, or our ability to expand our business. For instance, in January 2021, the Biden administration issued an executive order directing all federal agencies to review and take action to address any federal regulations, orders, guidance documents, policies and any similar agency actions promulgated during the prior administration that may be inconsistent with the current administration’s policies. As a result, it is unclear the degree to which certain recent regulatory developments may be modified or rescinded.
In particular, the RCRA, which governs the disposal of solid and hazardous waste, currently exempts certain E&P wastes from classification as hazardous wastes. In recent years, proposals have been made to rescind this exemption from RCRA. For example, in May 2016, a nonprofit environmental group filed suit in the federal district court for the District of Columbia, seeking a declaratory judgment directing the EPA to review and reconsider the RCRA E&P waste exemption. EPA and the environmental group entered into an agreement that was formalized in a consent decree issued by the U.S. District Court for the District of Columbia in December 2016. Under the consent decree, the EPA was required to propose a rulemaking for revisions of certain of its regulations pertaining to E&P wastes or sign a determination that revision of the regulations is not necessary. After undertaking its review, EPA signed a determination in April 2019 concluding that it does not need to regulate E&P wastes, and specifically “drilling fluids, produced waters, and other wastes associated with the exploration, development, or production of oil, gas or geothermal energy,” because the states are adequately regulating E&P wastes under the Subtitle D provisions of RCRA. If the exemption covering E&P wastes is repealed or modified in the future, or if the regulations interpreting the rules regarding the treatment or disposal of this type of waste were changed, our operations could face significantly more stringent regulations, permitting requirements, and other restrictions, which could have a material adverse effect on our business.
We could incur significant costs in cleaning up contamination that occurs at our facilities.
Petroleum hydrocarbons, saltwater, and other substances and wastes arising from E&P related activities have been disposed of or released on or under many of our sites. At some of our facilities, we have conducted and may continue to conduct monitoring, and we will continue to perform such monitoring and remediation of known contamination until the appropriate regulatory standards have been achieved. These monitoring and remediation efforts are usually overseen by state environmental regulatory agencies. Costs for such remediation activities may exceed estimated costs, and there can be no assurance that the future costs will not be material. It is possible that we may identify additional contamination in the future, which could result in additional remediation obligations and expenses, which could be material.
We and our customers may be exposed to certain regulatory and financial risks related to climate change.
The EPA has adopted regulations under existing provisions of the federal Clean Air Act, that, for example, require certain large stationary sources to obtain Prevention of Significant Deterioration, or PSD, pre-construction permits and Title V operating permits for GHG emissions. The EPA has also adopted rules requiring the monitoring and reporting of GHG emissions from specified sources in the United States, including, among others, certain onshore oil and natural gas processing and fractionating facilities, which was expanded in October 2015 to include onshore petroleum and natural gas gathering and boosting activities and natural gas transmission pipelines. Additionally, the U.S. Congress has in the past considered adopting legislation to reduce emissions of GHGs, and almost one- half of the states have already taken legal measures to reduce emissions of GHGs, primarily through the planned development of GHG emission inventories and/or regional GHG cap-and-trade programs. Most of these cap and trade programs work by requiring major sources of emissions, such as electric power plants or major producers of fuels, such as refineries and natural gas processing plants, to acquire and surrender emission allowances that correspond to their annual emissions of GHGs. In addition, in December 2015, over 190 countries, including the United States, reached an agreement to reduce greenhouse gas emissions (the “Paris Agreement”). The agreement entered into force in November 2016 after over 70 countries, including the United States, ratified or otherwise consented to be bound by the agreement. In June 2018, President Trump announced that the United States plans to withdraw from the agreement and formally initiated the withdrawal process in November 2019, which resulted in an effective exit date of November 2020. However, the Biden administration issued a climate change executive order in January 2021 that, among other things, commenced the process for the U.S. reentering the Paris Agreement. The U.S. officially rejoined the Paris Agreement on February 19, 2021. The January 2021 climate change executive order also directed the Secretary of the Interior to pause new oil and natural gas leasing on public lands or in offshore waters pending completion of a comprehensive review of the federal permitting and leasing practices, consider whether to adjust royalties associated with coal, oil, and gas resources extracted from public lands and offshore waters, or take other appropriate action, to account for corresponding climate costs. The climate change executive order also directed the federal government to identify “fossil fuel subsidies” to take steps to ensure that, to the extent consistent with applicable law, federal funding is not directly subsidizing fossil fuels. Legal challenges to the suspension have already been filed and are currently pending. To the extent that the United States and other countries implement the Paris Agreement or impose other climate change regulations on the oil and natural gas industry, it could have an adverse effect on our business. The EPA and other federal and state agencies have also acted to address GHG emissions in other industries, most notably coal-fired power generation, and as a result could attempt in the future to impose additional regulations on the oil and natural gas industry.
Although it is not possible at this time to estimate how potential future laws or regulations addressing GHG emissions would impact our business, either directly or indirectly, any future federal or state laws or implementing regulations that may be adopted to address GHG emissions in areas where we operate could require us or our customers to incur increased operating costs. Regulation of GHGs could also result in a reduction in demand for and production of oil and natural gas, which would result in a decrease in demand for our services. We cannot predict with any certainty at this time how these possibilities may affect our operations, but effects could be materially adverse.
Finally, increasing concentrations of GHGs in the Earth’s atmosphere may produce climate changes that have significant physical effects, such as increased frequency and severity of storms, floods, and other climatic events. If any such effects were to occur, they could adversely affect or delay demand for the oil or natural gas produced by our customers or otherwise cause us to incur significant costs in preparing for or responding to those effects.
28
Certain plant or animal species could be designated as endangered or threatened, which could limit our ability to expand some of our existing operations or limit our customers’ ability to develop new oil and natural gas wells.
The federal Endangered Species Act (“ESA”) restricts activities that may affect endangered or threatened species or their habitats. Many states also have analogous laws designed to protect endangered or threatened species. Additionally, as a result of a settlement approved by the U.S. District Court for the District of Columbia in September 2011, the Fish and Wildlife Service was required to make a determination on the listing of more than 250 species as endangered or threatened under the ESA by the end of the Fish and Wildlife Service’s 2018 fiscal year. Although current listings have not had a material impact on our operations, the designation of previously unidentified endangered or threatened species under the ESA or similar state laws could limit our ability to expand our operations and facilities or could force us to incur material additional costs. Moreover, listing such species under the ESA or similar state laws could indirectly, but materially, affect our business by imposing constraints on our customers’ operations, including the curtailment of new drilling or a refusal to allow a new pipeline to be constructed.
We have customers in New Mexico, Texas, Oklahoma, Wyoming, and North Dakota that have operations within the habitat of the greater sage-grouse and the lesser prairie-chicken, and our own operations are strategically located in proximity to our customers. To the extent these species, or other species that live in the areas where our operations and our customers’ operations are conducted, are listed under the ESA or similar state laws, this could limit our ability to expand our operations and facilities, or could force us to incur material additional costs. Moreover, listing such species under the ESA or similar state laws could indirectly, but materially, affect our business by imposing constraints on our customers’ operations.
Due to our lack of asset and geographic diversification, adverse developments in the areas in which we are located could adversely impact our financial condition, results of operations, and cash flows and reduce our ability to make distributions to our unitholders.
Our water treatment facilities are located exclusively in North Dakota. This concentration could disproportionately expose us to operational, economic, and regulatory risk in these areas. Our water treatment facilities currently consist of eight owned and one managed facility. Any operational, economic or regulatory issues at a single facility could have a material adverse impact on us. Due to the lack of diversification in our assets and the location of our assets, adverse developments in our markets, including, for example, transportation constraints, adverse regulatory developments, or other adverse events at one of our water treatment facilities, could have a significantly greater impact on our financial condition, results of operations, and cash flows than if we were more diversified.
Conservation measures and technological advances could reduce demand for oil and natural gas.
Fuel conservation measures, alternative fuel requirements, increasing consumer demand for alternatives to oil and natural gas, technological advances in fuel economy and energy generation devices could reduce demand for oil and natural gas and our customers’ drilling and production activities, and therefore the amount of drilling and production waste provided to us for treatment and disposal. Management cannot predict the impact of the changing demand for oil and natural gas services and products, and any major changes may have a material adverse effect on our business, financial condition, results of operations, and cash flows.
New technology, including those involving recycling of saltwater or the replacement of water in fracturing fluid, may hurt our competitive position.
The water treatment industry is subject to the introduction of new waste treatment and disposal techniques and services using new technologies including those involving recycling of saltwater, some of which may be subject to patent protection. As competitors and others use or develop new technologies or technologies comparable to ours in the future, we may lose market share or be placed at a competitive disadvantage. For example, some companies have successfully used propane as the fracturing fluid instead of water. Further, we may face competitive pressure to implement or acquire certain new technologies at a substantial cost. Some of our competitors may have greater financial, technical and personnel resources than we do, which may allow them to gain technological advantages or implement new technologies before we can. Additionally, we may be unable to implement new technologies or products at all, on a timely basis, or at an acceptable cost. New technology could also make it easier for our customers to vertically integrate their operations or reduce the amount of waste produced in oil and natural gas drilling and production activities, thereby reducing or eliminating the need for third-party disposal. Limits on our ability to effectively use or implement new technologies may have a material adverse effect on our business, financial condition and results of operations.
Technology advancements in connection with alternatives to hydraulic fracturing could decrease the demand for our water treatment facilities.
Some oil and natural gas producers are focusing on developing and utilizing non-water fracturing techniques, such as techniques that utilize propane, carbon dioxide, or nitrogen instead of water. If our producing customers begin to shift their fracturing techniques to waterless fracturing in the development of their wells, our water treatment services could be materially impacted because these wells would not produce flowback water.
We may be unable to ensure that customers will continue to utilize our services or facilities and pay rates that generate acceptable margins for us.
We cannot ensure that customers will continue to pay rates that generate acceptable margins for us. Our margins for Environmental Services could decrease if the volume of saltwater processed and disposed of by our customers’ decreases or if we are unable to increase the rates charged to correspond with increasing costs of operations. Our revenues and profitability for Inspection Services and Pipeline & Process Services could decrease if the demand for our inspectors decreases, if our safety record declines, if we are unable to obtain affordable insurance, if we are unable to recruit and retain qualified inspectors, or if we are unable to increase the daily and hourly rates charged to correspond with any potential increase in costs of operations. In addition, new agreements for our services in these business segments may not be obtainable on terms acceptable to us or, if obtained, may not be obtained on terms favorably consistent with current practices, in which case our revenue and profitability could decline. We also cannot ensure that the parties from whom we lease, license, or otherwise occupy the land on which certain of our facilities are situated, or the parties from whom we lease certain of our equipment, will renew our current leases, licenses, or other occupancy agreements upon their expiration on commercially reasonable terms or at all. Any such failure to honor the terms of the leases or licenses or renew our current leases or licenses could have a material adverse effect on our financial position, results of operations, and cash flows.
29
Public health threats, such as the coronavirus (COVID-19) and other highly communicable diseases, have and could continue to have an adverse impact the operations of our customers, and the global economy, including the worldwide demand for oil and natural gas and the level of demand for our environmental services. We may be unable to attract and retain a sufficient number of skilled and qualified workers.
The delivery of our water and environmental services and products requires personnel with specialized skills and experience who can perform physically demanding work. The water treatment industry has experienced a high rate of employee turnover as a result of the volatility of the oilfield service industry and the demanding nature of the work, and workers may choose to pursue employment in fields that offer a less demanding work environment. In addition, Inspection Services and Pipeline & Process Services are dependent on specialized inspectors, who must undergo specific training prior to performing inspection and integrity services.
Our ability to be productive and profitable will depend upon our ability to employ and retain skilled workers. In addition, our ability to expand our operations depends in part on our ability to increase the size of our skilled labor force. The demand for skilled workers is high, and the supply of skilled workers is limited. A significant increase in the wages paid by our competitors or the unionization of groups of our employees, could result in a reduction of our skilled labor force, increases in the wage rates that we must pay, or both. Likewise, laws and regulations to which we are, or may in the future become subject, could increase our labor costs or subject us to liabilities to our employees. In addition, the customers of our Inspection Services and Pipeline & Process Services segments could choose to hire our inspectors directly. If any of these events were to occur, our capacity and profitability could be diminished and our growth potential could be impaired.
Our ability to operate our business effectively could be impaired if affiliates of our general partner fail to attract and retain key employees, or if such personnel suddenly become unavailable to perform their duties.
We depend on the continuing efforts of our executive officers and other key management personnel, all of whom are employees of affiliates of our general partner. Additionally, neither we, nor our subsidiaries, have employees. CEM LLC and its affiliates are responsible for providing the employees and other personnel necessary to conduct our operations. All of the employees who conduct our business are employed by affiliates of our general partner. The loss of any member of our management or other key employees could have a material adverse effect on our business.
Consequently, our ability to operate our business and implement our strategies will depend on the continued ability of affiliates of our general partner to attract and retain highly skilled management personnel with industry experience, as well as such personnel remaining healthy and available to perform their duties. Competition for these persons is intense. Given our size, we may be at a disadvantage relative to our larger competitors in the competition for these personnel. We may not be able to continue to employ our senior executives and other key personnel, or attract and retain qualified personnel in the future, and one or more such personnel could become unable to perform their duties as a result of health issues, such as COVID-19, or other unexpected calamities. Our failure to retain or attract our senior executives and other key personnel, or other loss of such personnel, could have a material adverse effect on our ability to effectively operate our business. During 2020, we implemented a significant reduction in workforce in response to adverse market conditions, which resulted in the departure of a number of employees who previously served us in customer service and sales roles. We are currently in litigation with certain former employees, whom we allege stole confidential information from us and interfered with certain of our customer relationships.
Our business would be adversely affected if we, or our customers, experience significant interruptions.
We are dependent upon the uninterrupted operations of our water treatment facilities for the processing of saltwater, as well as the operations of third-party facilities, such as our oil and natural gas producing customers, for uninterrupted demand of our water and environmental services. Any significant interruption at these facilities, or inability to transport products to or from the third-party facilities to our water treatment facilities, for any reason, would adversely affect our results of operations, cash flow, and ability to make distributions to our unitholders. Operations at our facilities and at the facilities owned or operated by our customers could be partially or completely shut down, temporarily or permanently, as the result of any number of circumstances that are not within our control, such as:
| ● | catastrophic events, including epidemics, lightning strikes, hurricanes, seismic activity such as earthquakes, fires and floods; |
| ● | loss of electricity or power; |
| ● | explosion, breakage, loss of power, accidents to machinery, storage tanks or facilities; |
| ● | leaks in packers and tubing below the surface, failures in cement or casing or ruptures in the pipes, valves, fittings, hoses, pumps, tanks, containment systems or houses that lead to spills or employee injuries; |
| ● | environmental remediation; |
| ● | pressure issues that limit or restrict our ability to inject water into the disposal well or limitations with the injection zone formation and its permeability or porosity that could limit or prevent disposal of additional fluids; |
| ● | labor difficulties; |
| ● | malfunctions in automated control systems at the facilities; |
| ● | disruptions in the supply of saltwater to our facilities; |
30
| ● | failure of third-party pipelines, pumps, equipment or machinery; and |
| ● | governmental mandates, restrictions, or rules and regulations. |
In addition, there can be no assurance that we are adequately insured against such risks because we do not carry business interruption insurance. As a result, our revenue and results of operations could be materially adversely affected.
The amount of cash we have available for distribution to holders of our common units depends primarily on our cash flow, rather than on our profitability, which may prevent us from making distributions, even during periods in which we record net income.
The amount of cash we have available for distribution depends primarily upon our cash flow, and not solely on profitability. As a result, we may make cash distributions during periods when we record losses for financial accounting purposes, and may not make cash distributions during periods when we record net earnings for financial accounting purposes.
Increases in interest rates could adversely impact our unit price, our ability to issue equity or incur debt for acquisitions or other purposes, and our ability to make cash distributions at our intended levels.
Interest rates may increase in the future. As a result, interest rates on our Credit Agreement, or future credit facilities and debt offerings, could be higher than current levels, causing our financing costs to increase accordingly. Our common unit price is impacted by the level of our cash distributions and implied distribution yield. The distribution yield is often used by investors to compare and rank yield-oriented securities for investment decision-making purposes. Therefore, changes in interest rates, either positive or negative, may affect the yield requirements of investors who invest in our units, and a rising interest rate environment could have an adverse impact on our unit price and our ability to issue equity or incur debt for acquisitions or other purposes and to make cash distributions at our intended levels.
A sustained failure of our information technology systems could adversely affect our business.
Enterprise-wide information systems have been developed and integrated into our operations. If our information technology systems are disrupted due to problems with the integration of our information systems or otherwise, we may face difficulties in generating timely and accurate financial information. Such a disruption to our information technology systems could have an adverse effect on our financial condition, results of operations, and cash available for distribution to our unitholders. In addition, we may not realize the benefits we anticipated from the implementation of our enterprise-wide information systems.
Public health threats have and could continue to have a significant effect on our operations and our financial results.
Public health threats, such as COVID-19 and other highly communicable diseases, have and could continue to have an adverse impact our operations, the operations of our customers, and the global economy, including the worldwide demand for oil and natural gas and the level of demand for our environmental services. Any quarantine of personnel or the inability of personnel to access our offices or work locations could adversely affect our operations, and an extended period of remote working by our employees could also strain our technology resources and introduce operational risks, including a heightened risk of a cybersecurity incident. Remote working environments may be less secure and more susceptible to hacking attacks, including phishing and social engineering attempts that seek to exploit the COVID-19 pandemic. Travel restrictions or operational problems in any areas in which we operate, or any reduction in the demand for our environmental services caused by public health threats, may materially impact operations and adversely affect our financial results. Additionally, due to the uncertainties created by the COVID-19 pandemic and the related impact on our business, we have made or may make future employment decisions that may subject us to increased risks related to employment matters, including increased litigation and/or claims for severance or other benefits. Further, we may owe indemnity obligations to customers who may assert that they suffered losses as a result of COVID-19 infection contracted from our employees.
If we fail to develop or maintain an effective system of internal controls, we may not be able to report our financial results accurately or prevent fraud, which would likely have a negative impact on the market price of our common units.
Effective internal controls are necessary for us to provide timely, reliable financial reports, prevent fraud, and to operate successfully as a publicly-traded partnership. Our efforts to develop and maintain our internal controls may not be successful, and we may be unable to maintain effective controls over our financial processes and reporting in the future or to comply with our obligations under Section 404 of the Sarbanes-Oxley Act of 2002 (“Section 404”). For example, Section 404 requires us, among other things, to annually review and report on the effectiveness of our internal controls over financial reporting. Any failure to develop, implement, or maintain effective internal controls, or to improve our internal controls, could harm our operating results or cause us to fail to meet our reporting obligations. Given the difficulties inherent in the design and operation of internal controls over financial reporting, we can provide no assurance as to our conclusions about the effectiveness of our internal controls, and we may incur significant costs in our efforts to comply with Section 404.
We are required to disclose changes made in our internal control over financial reporting on a quarterly basis, and we are required to assess the effectiveness of our controls annually. We are not an “accelerated filer” as defined in Rule 12b-2 of the Exchange Act, and therefore our independent registered public accounting firm is not required to attest to the effectiveness of our internal controls over financial reporting until we become an accelerated filer.
31
Risks Inherent in an Investment in Us
Our general partner and its affiliates, including Holdings, have conflicts of interest with us and limited fiduciary duties to us and our unitholders, and they may favor their own interests to our and our unitholders’ detriment. Additionally, we have no control over the business decisions and operations of Holdings, and Holdings is under no obligation to adopt a business strategy that favors us.
As of December 31, 2020, Holdings and its affiliates own an approximate 64% common unit interest in us and own and control our general partner and appoint all the officers and directors of our general partner. As of December 31, 2020, an affiliate of Holdings owns all of the preferred unit interests in us. Although our general partner has a duty to manage us in a manner that is in the best interests of our partnership and our unitholders, the directors and officers of our general partner also have a fiduciary duty to manage our general partner in a manner that is in the best interests of its owner, Holdings. Conflicts of interest may arise between Holdings and its affiliates, including our general partner, on the one hand, and us and our unitholders, on the other hand. In resolving these conflicts of interest, our general partner may favor its own interests and the interests of its affiliates, including Holdings, over the interests of our common unitholders. These conflicts include, among others, the following situations:
| ● | our general partner may exercise its right to call and purchase all of the common units not owned by it and its affiliates if it and its affiliates own more than 80.0% of the common units; |
| ● | neither our partnership agreement nor any other agreement requires Holdings to pursue a business strategy that favors us or utilizes our assets, which could involve decisions by Holdings to invest in competitors, pursue and grow particular markets, or undertake acquisition opportunities for itself. Holdings’ directors and officers have a fiduciary duty to make these decisions in the best interests of Holdings; |
| ● | our general partner is allowed to take into account the interests of parties other than us, such as Holdings, in resolving conflicts of interest; |
| ● | Holdings may be constrained by the terms of its debt instruments from taking actions, or refraining from taking actions, that may be in our best interests; |
| ● | our partnership agreement replaces the fiduciary duties that would otherwise be owed by our general partner with contractual standards governing its duties, limiting our general partner’s liabilities and restricting the remedies available to our unitholders for actions that, without such limitations, might constitute breaches of fiduciary duty; |
| ● | except in limited circumstances, our general partner has the power and authority to conduct our business without unitholder approval; |
| ● | our general partner will determine the amount and timing of asset purchases and sales, borrowings, issuance of additional partnership securities, and the creation, reduction or increase of cash reserves, each of which can affect the amount of cash that is distributed to our unitholders; |
| ● | expenditures, which would not reduce operating surplus, or a maintenance capital expenditure, which would reduce our operating surplus, and whether to set aside cash for future maintenance capital expenditures on certain of our assets that will need extensive repairs during their useful lives. This determination can affect the amount of available cash from operating surplus that is distributed to our unitholders and to our general partner, and the amount of adjusted operating surplus generated in any given period; |
| ● | our general partner will determine which costs incurred by it are reimbursable by us; |
| ● | our general partner may cause us to borrow funds in order to permit the payment of cash distributions, even if the purpose or effect of the borrowing is to make incentive distributions; |
| ● | our partnership agreement permits us to classify up to $10.0 million as operating surplus, even if it is the surplus generated from asset sales, non-working capital borrowings, or other sources that would otherwise constitute capital surplus. This cash may be used to fund distributions to our general partner in respect of the general partner interest or the incentive distribution rights; |
| ● | our partnership agreement does not restrict our general partner from causing us to pay it or its affiliates for any services rendered to us or entering into additional contractual arrangements with any of these entities on our behalf; |
| ● | our general partner intends to limit its liability regarding our contractual and other obligations; |
| ● | our general partner controls the enforcement of obligations owed to us by our general partner and its affiliates; |
| ● | our general partner decides whether to retain separate counsel, accountants or others to perform services for us; |
| ● | our general partner may or may not provide financial support to the Partnership. They may also require compensation for financial support in the form of additional units, preferred equity, dividend reinvestment plan, and other mechanisms; |
| ● | our general partner may decide to issue additional Partnership common units to the general public, thus diluting current unitholders’ ownership interests. This action could result in lower distributions to our common unitholders; and |
| ● | our general partner may elect to cause us to issue common units to it in connection with a resetting of the target distribution levels related to the incentive distribution rights without the approval of the conflicts committee of the board of directors of our general partner, which we refer to as our conflicts committee, or our unitholders. This election may result in lower distributions to our common unitholders in certain situations. |
32
Under the terms of our partnership agreement, the doctrine of corporate opportunity, or any analogous doctrine, does not apply to our general partner or any of its affiliates, including its executive officers, directors, and owners. Any such person or entity that becomes aware of a potential transaction, agreement, arrangement, or other matter that may be an opportunity for us, will not have any duty to communicate or offer such opportunity to us. Any such person or entity will not be liable to us or to any limited partner for breach of any fiduciary duty or other duty by reason of the fact that such person or entity pursues or acquires such opportunity for itself, directs such opportunity to another person or entity or does not communicate such opportunity or information to us. This may create actual and potential conflicts of interest between us and affiliates of our general partner, and result in less than favorable treatment of us and our unitholders. Please read “Item 13 – Certain Relationships and Related Party Transactions – Conflicts of Interest and Duties.”
Our general partner has a limited call right that may require our unitholders to sell their common units at an undesirable time or price.
If at any time, our general partner and its affiliates own more than 80.0% of our then-outstanding common units, our general partner will have the right, but not the obligation, which it may assign to any of its affiliates or to us, to acquire all, but not less than all, of the common units held by unaffiliated persons at a price not less than their then-current market price. As a result, unitholders may be required to sell their common units at an undesirable time or price and may not receive any return on unitholders’ investment. Unitholders may also incur a tax liability upon a sale of their units. As of March 15, 2021, Holdings and its affiliates own 64% of our common units.
Our general partner interest or the control of our general partner may be transferred to a third party without unitholder consent.
Our general partner may transfer its general partner interest to a third party in a merger or in a sale of all or substantially all of its assets without the consent of the unitholders. Furthermore, there is no restriction in our partnership agreement on the ability of Holdings to transfer its membership interest in our general partner to a third party. The new owner of our general partner would then be in a position to replace the board of directors and officers of our general partner with its own choices.
Our partnership agreement requires that we distribute all of our available cash, which could limit our ability to grow and make acquisitions.
Our partnership agreement requires that we distribute all of our available cash to our unitholders. As a result, we expect to rely primarily upon external financing sources, including commercial bank borrowings and the issuance of debt and equity securities, to fund our acquisitions and expansion capital expenditures. Therefore, to the extent we are unable to finance our growth externally, our cash distribution policy will significantly impair our ability to grow. In addition, because we distribute all of our available cash, our growth may not be as fast as that of businesses that reinvest their available cash to expand ongoing operations. To the extent we issue additional units in connection with any acquisitions or expansion capital expenditures, the payment of distributions on those additional units may increase the risk that we will be unable to maintain or increase our per unit distribution level. There are no limitations in our partnership agreement on our ability to issue additional units, including units ranking senior to our common units as to distributions or in liquidation or that have special voting rights and other rights, and our unitholders will have no preemptive or other rights (solely as a result of their status as unitholders) to purchase any such additional units. The incurrence of additional commercial borrowings, or other debt to finance our growth strategy, would result in increased interest expense, which, in turn, may reduce the amount of cash that we have available to distribute to our unitholders.
Our general partner’s discretion in establishing cash reserves may reduce the amount of cash we have available to distribute to unitholders.
Our partnership agreement requires our general partner to deduct from operating surplus the cash reserves that it determines are necessary to fund our future operating expenditures. In addition, the partnership agreement permits the general partner to reduce available cash by establishing cash reserves for the proper conduct of our business, to comply with applicable law or agreements to which we are a party, or to provide funds for future distributions to partners. These cash reserves will affect the amount of cash we have available to distribute to unitholders.
Our partnership agreement replaces our general partner’s fiduciary duties to holders of our common units with contractual standards governing its duties.
Our partnership agreement contains provisions that eliminate the fiduciary standards to which our general partner would otherwise be held by state fiduciary duty law and replaces those duties with several different contractual standards. For example, our partnership agreement permits our general partner to make a number of decisions in its individual capacity, as opposed to in its capacity as our general partner, free of any duties to us and our unitholders, other than the implied contractual covenant of good faith and fair dealing. This provision entitles our general partner to consider only the interests and factors that it desires, and relieves it of any duty or obligation to give any consideration to any interest of, or factors affecting, us, our affiliates, or our limited partners. Examples of decisions that our general partner may make in its individual capacity include:
| ● | how to allocate corporate opportunities among us and its affiliates; |
| ● | whether to exercise its limited call right; |
| ● | whether to seek approval by the conflicts committee of the board of directors of our general partner to address and resolve a conflict of interest; |
| ● | how to exercise its voting rights with respect to the units it owns; |
| ● | whether to elect to reset target distribution levels; |
| ● | whether to transfer the incentive distribution rights or any units it owns to a third party; and |
| ● | whether or not to consent to any merger, consolidation or conversion of the partnership or amendment to the partnership agreement. |
33
By purchasing a common unit, a unitholder is treated as having consented to the provisions in our partnership agreement, including the provisions discussed above. Please read “Item 13 – Certain Relationships and Related Party Transactions – Conflicts of Interest and Duties.”
Our general partner limits its liability regarding our obligations.
Our general partner limits its liability under contractual arrangements so that counterparties to such agreements have recourse only against our assets and not against our general partner or its assets or any affiliate of our general partner or its assets. Our general partner may therefore cause us to incur indebtedness or other obligations that are nonrecourse to our general partner. Our partnership agreement provides that any action taken by our general partner to limit its liability is not a breach of our general partner’s fiduciary duties, even if we could have obtained terms that are more favorable without the limitation on liability. In addition, we are obligated to reimburse or indemnify our general partner to the extent that it incurs obligations on our behalf. Any such reimbursement or indemnification payments would reduce the amount of cash otherwise available for distribution to our unitholders.
Our partnership agreement restricts the remedies available to holders of our common units for actions taken by our general partner that might otherwise constitute breaches of fiduciary duty.
Our partnership agreement contains provisions that restrict the remedies available to unitholders for actions taken by our general partner that might otherwise constitute breaches of fiduciary duty under state fiduciary duty law. For example, our partnership agreement:
| ● | provides that whenever our general partner makes a determination or takes, or declines to take, any other action in its capacity as our general partner, our general partner is required to make such determination, or take or decline to take such other action, in good faith, meaning that it subjectively believed that the determination or the decision to take or decline to take such action was in the best interests of our partnership, and will not be subject to any other or different standard imposed by our partnership agreement, Delaware law, or any other law, rule or regulation, or at equity; |
| ● | provides that our general partner will not have any liability to us or our unitholders for decisions made in its capacity as a general partner, so long as it acted in good faith; |
| ● | provides that our general partner and its officers and directors will not be liable for monetary damages to us or our limited partners resulting from any act or omission unless there has been a final and non-appealable judgment entered by a court of competent jurisdiction determining that our general partner, or its officers and directors, as the case may be, acted in bad faith or engaged in intentional fraud or willful misconduct or, in the case of a criminal matter, acted with knowledge that the conduct was unlawful; and |
| ● | provides that our general partner will not be in breach of its obligations under our partnership agreement or its fiduciary duties to us or our limited partners if a transaction with an affiliate, or the resolution of a conflict of interest is approved in accordance with, or otherwise meets, the standards set forth in our partnership agreement. |
In connection with a situation involving a transaction with an affiliate or a conflict of interest, our partnership agreement provides that any determination by our general partner must be made in good faith, and that our conflicts committee and the board of directors of our general partner are entitled to a presumption that they acted in good faith. In any proceeding brought by or on behalf of any limited partner or the partnership, the person bringing or prosecuting such proceeding will have the burden of overcoming such presumption. Please read “Item 13 – Certain Relationships and Related Party Transactions – Conflicts of Interest and Duties.”
Unitholders have very limited voting rights and, even if they are dissatisfied, they cannot remove our general partner without its consent.
Unlike the holders of common stock in a corporation, unitholders have only limited voting rights on matters affecting our business and, therefore, limited ability to influence management’s decisions regarding our business. For example, unlike holders of stock in a public corporation, unitholders do not have “say-on-pay” advisory voting rights. Unitholders did not elect our general partner or the board of directors of our general partner, and have no right to elect our general partner or the board of directors of our general partner on an annual or other continuing basis. The board of directors of our general partner is chosen by the member of our general partner, which is a wholly-owned subsidiary of Holdings. Furthermore, if the unitholders are dissatisfied with the performance of our general partner, they will have little ability to remove our general partner. As a result of these limitations, the price at which our common units will trade could be diminished because of the absence or reduction of a takeover premium in the trading price.
The vote of the holders of at least 66 2/3% of all outstanding common units is required to remove our general partner. As of March 8, 2020, Holdings and its affiliates own approximately 64% of our outstanding common units. Therefore, the unitholders will be unable initially to remove our general partner without its consent, because our general partner and its affiliates own sufficient units to be able to prevent its removal.
Furthermore, unitholders’ voting rights are further restricted by the partnership agreement provision providing that any units held by a person that owns 20.0% or more of any class of units then outstanding, other than our general partner, its affiliates, their transferees, and persons who acquired such units with the prior approval of the board of directors of our general partner, cannot vote on any matter.
Our partnership agreement also contains provisions limiting the ability of unitholders to call meetings or to acquire information about our operations, as well as other provisions limiting the unitholders’ ability to influence the manner or direction of management.
34
We may issue additional common units and other equity interests ranking junior to the Series A Preferred Units without unitholder approval, which would dilute unitholders’ existing ownership interests.
At any time, we may issue an unlimited number of general partner interests or limited partner interests of any type without the approval of our unitholders and our unitholders will have no preemptive or other rights (solely as a result of their status as unitholders) to purchase any such general partner interests or limited partner interests, except that, subject to certain limited exceptions, we will need the consent of 66 2/3% of the outstanding Series A Preferred Units representing limited partner interests in the Partnership (“Series A Preferred Units”) to issue any additional Series A Preferred Units or any class or series of partnership interests that, with respect to distributions on such partnership interests or distributions in respect of such partnership interests upon our liquidation, dissolution and winding up, ranks equal to or senior to the Series A Preferred Units. Our Series A Preferred Units may be converted into common units at the then-applicable conversion rate at the earlier of (i) May 29, 2021 or (ii) immediately prior to a liquidation of us. In addition, our Series A Preferred Units may be converted into common units on other terms negotiated by the conflicts committee of our board of directors. Further, there are no limitations in our partnership agreement on our ability to issue equity securities that rank equal, or senior to, our common units as to distributions, or in liquidation, or that have special voting rights and other rights. The issuance by us of additional common units or other equity securities of equal or senior rank, including in connection with a conversion of the Series A Preferred Units, will have the following effects:
| ● | our existing unitholders’ proportionate ownership interest in us will decrease; |
| ● | it any time, our general partner and its affiliates own more than 80% of our then-outstanding common units, our general partner will have the right, but not the obligation, which it may assign to any of its affiliates or to us, to acquire all, but not less than all, of the common units held by unaffiliated persons at a price not less than their then-current market price. As a result, unitholders may be required to sell their common units at an undesirable time or price and may not receive any return on unitholders’ investment. Unitholders may also incur a tax liability upon a sale of their units. |
| ● | the amount of cash we have available to distribute on each unit may decrease; |
| ● | the ratio of taxable income to distributions may increase; |
| ● | the relative voting strength of each previously outstanding unit may be diminished; and |
| ● | the market price of our common units may decline. |
The issuance by us of additional general partner interests may have the following effects, among others, if such general partner interests are issued to a person who is not an affiliate of Holdings:
| ● | management of our business may no longer reside solely with our current general partner; and |
| ● | affiliates of the newly admitted general partner may compete with us, and neither that general partner, nor such affiliates, will have any obligation to present business opportunities to us. |
Holdings or its unitholders, directors or officers may sell units in the public or private markets, and such sales could have an adverse impact on the trading price of the common units.
As of December 31, 2020, Holdings held 6,957,349 common units. Additionally, we have agreed to provide Holdings with certain registration rights under applicable securities laws. The sale of these units in the public or private markets could have an adverse impact on the price of the common units or on any trading market that may develop.
If we cannot continue to meet the continued listing requirements of the NYSE, the NYSE may delist our common units, which would have an adverse impact on the trading volume, liquidity and market price of our common units.
The NYSE has several listing requirements set forth in the NYSE Listed Company Manual. For example, Section 802.01C of the NYSE Listed Company Manual requires that our common units trade at a minimum average closing price of $1.00 per common unit over a consecutive 30 trading day period. Section 802.01B of the NYSE Listed Company Manual requires that either our market capitalization (inclusive of common and preferred equity) or our total owners’ equity exceed $50 million. Pursuant to the rules of the NYSE, if we fail to maintain these listing requirements, we will have a six-month period in which to regain compliance or be delisted. In addition, our common units could also be delisted if our average market capitalization over a consecutive 30 trading day period is less than $15 million. If such event were to occur, we would not have an opportunity to cure the deficiency, and, as a result, our common units would be suspended from trading on the NYSE immediately and the NYSE would begin the process to delist our common units, subject to our right to appeal under NYSE rules. There is no assurance that any appeal we undertake in these or other circumstances would be successful, nor is there any assurance that we will continue to comply with the other NYSE continued listing standards in such case.
Failure to maintain our NYSE listing could negatively impact us and our unitholders by reducing the willingness of investors to hold our common units because of the resulting decreased price, liquidity and trading of our common units, limited availability of price quotations, and reduced news and analyst coverage. These developments may also require brokers trading in our common units to adhere to more stringent rules and may limit our ability to raise capital by issuing additional securities or obtaining additional financing in the future. Delisting may also adversely impact the perception of our financial condition and cause reputational harm with investors and parties conducting business with us. In addition, the perceived decreased value of employee equity incentive awards may reduce their effectiveness in encouraging performance and retention.
In addition, regardless of compliance with the listing standards of the NYSE, the board of directors of our general partner may determine that it is no longer economically viable or attractive to remain a publicly traded partnership.
35
Affiliates of our general partner, including, but not limited to, Holdings, may compete with us, and neither our general partner nor its affiliates have any obligation to present business opportunities to us.
Neither our partnership agreement, nor our amended and restated omnibus agreement, will prohibit Holdings or any other affiliates of our general partner from owning assets or engaging in businesses that compete directly or indirectly with us. Under the terms of our partnership agreement, the doctrine of corporate opportunity, or any analogous doctrine, will not apply to our general partner or any of its affiliates, including Holdings. Any such entity that becomes aware of a potential transaction, agreement, arrangement or other matter that may be an opportunity for us, will not have any duty to communicate or offer such opportunity to us. Moreover, except for the obligations set forth in our amended and restated omnibus agreement, neither Holdings, nor any of its affiliates, have a contractual obligation to offer us the opportunity to purchase additional assets from it, and we are unable to predict whether, or when, such an offer may be presented and acted upon. As a result, competition from Holdings and other affiliates of our general partner could materially and adversely impact our results of operations and distributable cash flow.
The incentive distribution rights of our general partner may be transferred to a third party without unitholder consent.
Our general partner may transfer its incentive distribution rights to a third party, at any time, without the consent of our unitholders. If our general partner transfers its incentive distribution rights to a third party, but retains its general partner interest, our general partner may not have the same incentive to grow our partnership and increase distributions to unitholders over time as it would if it had retained ownership of its incentive distribution rights. For example, a transfer of incentive distribution rights by our general partner could reduce the likelihood that Holdings, which owns our general partner, will sell or contribute additional assets to us, as Holdings would have less of an economic incentive to grow our business, which, in turn, would impact our ability to grow our asset base.
Unitholders may have to repay distributions that were wrongfully distributed to them.
Under certain circumstances, unitholders may have to repay amounts wrongfully distributed to them. Under Section 17-607 of the Delaware Revised Uniform Limited Partnership Act, we may not make a distribution to unitholders if the distribution would cause our liabilities to exceed the fair value of our assets. Delaware law provides that for a period of three years from the date of the impermissible distribution, limited partners who received the distribution and who knew at the time of the distribution that it violated Delaware law, will be liable to the limited partnership for the distribution amount. Transferees of common units are liable for the obligations of the transferor to make contributions to the partnership that are known to the transferee at the time of the transfer and for unknown obligations if the liabilities could be determined from our partnership agreement. Liabilities to partners on account of their partnership interest and liabilities that are non-recourse to the partnership are not counted for purposes of determining whether a distribution is permitted.
The price of our common units may fluctuate significantly, and unitholders could lose all or part of their investment.
As of December 31, 2020, there are only 4,275,842 publicly traded common units held by public unitholders. As of December 31, 2020, Holdings held 6,957,349 common units representing an aggregate 57% of our common units. The lack of liquidity in the trading market for our common units may result in wide bid-ask spreads, which could result in significant fluctuations in the market price of our common units and limit the number of investors who are able to buy our common units. In addition, our Series A Preferred Units may be converted into common units at the then-applicable conversion rate at the earlier of (i) May 29, 2021 or (ii) immediately prior to a liquidation of us.
Our general partner, or any transferee holding incentive distribution rights, may elect to cause us to issue common units to it in connection with a resetting of the target distribution levels related to its incentive distribution rights, without the approval of our conflicts committee or the holders of our common units. This could result in lower distributions to holders of our common units.
Our general partner has the right, at any time units are outstanding and the holder of the incentive distribution rights has received distributions on its incentive distribution rights at the highest level to which it is entitled (50.0%) for each of the prior four consecutive fiscal quarters and the amount of such distribution did not exceed the adjusted operating surplus for such quarter, to reset the initial target distribution levels at higher levels based on our distributions at the time of the exercise of the reset election. Following a reset election, the minimum quarterly distribution will be adjusted to equal the reset minimum quarterly distribution, and the target distribution levels will be reset to correspondingly higher levels based on percentage increases above the reset minimum quarterly distribution.
If our general partner elects to reset the target distribution levels, the holder of the incentive distribution rights will be entitled to receive a number of common units equal to that number of common units that would have entitled the holder to an average aggregate quarterly cash distribution in the prior two quarters equal to the average of the distributions on the incentive distribution rights in such two quarters. We anticipate that our general partner would exercise this reset right in order to facilitate acquisitions or internal growth projects that would not be sufficiently accretive to cash distributions per common unit without such conversion. It is possible, however, that our general partner could exercise this reset election at a time when it is experiencing, or expects to experience, declines in cash distributions related to the incentive distribution rights and may, therefore, desire the holder of the incentive distribution rights be issued common units, rather than retain the right to receive distributions based on the initial target distribution levels. This risk could be elevated if our incentive distribution rights have been transferred to a third party. As a result, a reset election may cause our common unitholders to experience a reduction in the amount of cash distributions that they would have otherwise received had we not issued new common units in connection with resetting the target distribution levels. Additionally, our general partner has the right to transfer all or any portion of our incentive distribution rights at any time, and such transferee shall have the same rights as the general partner relative to resetting target distributions if our general partner concurs that the tests for resetting target distributions have been fulfilled.
36
The NYSE does not require a publicly traded limited partnership like us to comply with certain of its corporate governance requirements.
Our common units trade on the NYSE. Because we are a publicly traded limited partnership, the NYSE does not require us to have a majority of independent directors on our general partner’s board of directors or to establish a compensation committee or a nominating and corporate governance committee. Additionally, any future issuance of additional common units or other securities, including to affiliates, will not be subject to the NYSE’s shareholder approval rules that apply to a corporation. Accordingly, unitholders do not have the same protections afforded to certain corporations that are subject to all of the NYSE corporate governance requirements.
A unitholder’s liability may not be limited if a court finds that unitholder action constitutes control of our business.
A general partner of a partnership generally has unlimited liability for the obligations of the partnership, except for those contractual obligations of the partnership that are expressly made without recourse to the general partner. Our partnership is organized under Delaware law, and we conduct business in a number of other states. The limitations on the liability of holders of limited partner interests for the obligations of a limited partnership have not been clearly established in some of the other states in which we do business. A unitholder could be liable for any and all of our obligations as if a unitholder were a general partner, if a court or government agency were to determine that unitholders’ right to act with other unitholders to remove or replace our general partner, to approve some amendments to our partnership agreement, or to take other actions under our partnership agreement constitute “control” of our business.
Our Series A Preferred Units have rights, preferences and privileges that are not held by, and are preferential to the rights of, holders of our common units.
Our Series A Preferred Units rank senior to our common units with respect to distribution rights and rights upon liquidation. These preferences could adversely affect the market price for our common units or could make it more difficult for us to sell our common units in the future.
In addition, until the conversion of the Series A Preferred Units into common units or their redemption, holders of the Series A Preferred Units will receive cumulative quarterly distributions equal to 9.5% per annum plus accrued and unpaid distributions. With respect to any quarter up to and including the quarter ending June 30, 2021, our general partner may elect to pay such quarterly distribution in cash, in-kind in the form of additional Series A Preferred Units or in a combination thereof, provided that a minimum of 2.5% of such distribution will be paid in cash unless the holders of the Series A Preferred Units otherwise agree. For any quarter ending after June 30, 2021, the quarterly distribution will be paid in cash. Each holder of the Series A Preferred Units has the right to share in any special distributions by us of cash, securities or other property pro rata with the common units on an as-converted basis, subject to customary adjustments. Accordingly, we cannot pay any distributions on any junior securities, including any of the common units, prior to paying the quarterly distribution payable to the Series A Preferred Units, including any previously accrued and unpaid distributions. Our obligation to pay distributions on our Series A Preferred Units could impact our liquidity and reduce the amount of cash flow available for working capital, capital expenditures, growth opportunities, acquisitions and other general partnership purposes. Our obligations to the holders of the Series A Preferred Units could also limit our ability to obtain additional financing or increase our borrowing costs, which could have an adverse effect on our financial condition.
The terms of our Series A Preferred Units contain covenants that may limit our business flexibility.
The terms of our Series A Preferred Units contain covenants preventing us from taking certain actions without the approval of the holders of 66 2/3% of the outstanding Series A Preferred Units, voting separately as a class. The need to obtain the approval of holders of the Series A Preferred Units before taking these actions could impede our ability to take certain actions that management or the Board of Directors of our General Partner may consider to be in the best interests of our unitholders.
The affirmative vote of 66 2/3% of the outstanding Series A Preferred Units, voting separately as a class, is necessary to amend our partnership agreement in any manner that is materially adverse to any of the rights, preferences and privileges of the Series A Preferred Units. The affirmative vote of 66 2/3% of the outstanding Series A Preferred Units voting separately as a class, is necessary to, among other things issue, authorize or create any additional Series A Preferred Units or any class or series of partnership interests that, with respect to distributions on such partnership interests or distributions in respect of such partnership interests upon our liquidation, dissolution and winding up, ranks equal to or senior to the Series A Preferred Units.
Tax Risks
Our tax treatment depends on our status as a partnership for U.S. federal income tax purposes. If the Internal Revenue Service (“IRS”) were to treat us as a corporation for U.S. federal income tax purposes, which would subject us to entity-level taxation, then our cash available for distribution to our unitholders would be substantially reduced.
The anticipated after-tax economic benefit of an investment in the common units depends largely on our being treated as a partnership for federal income tax purposes. We have not requested a ruling from the IRS with respect to our treatment as a partnership for U.S. federal income tax purposes.
Despite the fact that we are a limited partnership under Delaware law, it is possible, in certain circumstances, for a partnership such as ours, to be treated as a corporation for U.S. federal income tax purposes. A change in our business, or a change in current law, could cause us to be treated as a corporation for U.S. federal income tax purposes or otherwise subject us to taxation as an entity.
If we were treated as a corporation for federal income tax purposes, we would pay federal income tax on our taxable income at the corporate tax rate, which is currently at 21.0%, and would likely pay state and local income tax at varying rates. Distributions would generally be taxed again as corporate dividends (to the extent of our current and accumulated earnings and profits), and no income, gains, losses, deductions, or credits would flow through to a unitholder. Because a tax would be imposed upon us as a corporation, our cash available for distribution to a unitholder would be substantially reduced. Therefore, if we were treated as a corporation for federal income tax purposes, there would be a material reduction in the anticipated cash flow and after-tax return to our unitholders, likely causing a substantial reduction in the value of our common units.
37
Our partnership agreement provides that, if a law is enacted or existing law is modified or interpreted in a manner that subjects us to taxation as a corporation, or otherwise subjects us to entity-level taxation for federal, state, or local income tax purposes, the minimum quarterly distribution amount and the target distribution levels may be adjusted to reflect the impact of that law on us.
If we were subjected to a material amount of additional entity-level taxation by individual states, counties, or cities, it would reduce our cash available for distribution to our unitholders.
Changes in current state, county, or city law may subject us to additional entity-level taxation by individual states, countries, or cities. Several states have subjected, or are evaluating ways to subject, partnerships to entity-level taxation through the imposition of state income, franchise, and other forms of taxation. Imposition of any such taxes may substantially reduce the cash available for distribution to a unitholder. Our partnership agreement provides that, if a law is enacted, or existing law is modified or interpreted in a manner that subjects us to entity-level taxation, the minimum quarterly distribution amount, and the target distribution levels, may be adjusted to reflect the impact of that law on us.
The tax treatment of publicly traded partnerships, or an investment in our common units, could be subject to potential legislative, judicial, or administrative changes and differing interpretations, possibly on a retroactive basis.
The present U.S. federal income tax treatment of publicly traded partnerships, including us, or an investment in our common units may be modified by administrative, legislative or judicial interpretation at any time. For example, members of Congress and the President have periodically considered substantive changes to the existing U.S. federal income tax laws that affect publicly traded partnerships, including the elimination of partnership tax treatment for publicly traded partnerships. Any modification to the U.S. federal income tax laws and interpretations thereof, may, or may not, be retroactively applied, and could make it more difficult or impossible to meet the qualifying income exception upon which we rely for our treatment as a partnership for U.S. federal income tax purposes. We are unable to predict whether any such changes will ultimately be enacted. However, it is possible that a change in law could affect us, and any such changes could negatively impact the value of an investment in our common units.
Our unitholders’ share of our income will be taxable to them for U.S. federal income tax purposes even if they do not receive any cash distributions from us.
Because a unitholder will be treated as a partner, to whom we will allocate taxable income that could be different in amount than the cash we distribute, a unitholder’s allocable share of our taxable income will be taxable to it, which may require the payment of federal income taxes and, in some cases, state and local income taxes, on its share of our taxable income even if it receives no cash distributions from us. Our unitholders may not receive cash distributions from us equal to their share of our taxable income or even equal to the actual tax liability that results from that income.
If the IRS or state revenue agencies contest the tax positions we take, the market for our common units may be adversely impacted and the cost of any such contest will reduce our cash available for distribution to our unitholders.
We have not requested a ruling from the IRS with respect to our treatment as a partnership for U.S. federal income tax purposes. The IRS may adopt positions that differ from the positions we take, and the IRS’s positions may ultimately be sustained. We employ inspectors who work in many different state and local jurisdictions. Compensation practices vary due to local market conditions and customer demands. The IRS or state taxing authorities could also adopt positions different than the positions we take on such matters as the attribution of taxable income among states (both for our income and the income of our employees), the determination of which types of payments to our employees are taxable and which are not, the allocation of shared expenses among affiliated entities, and other matters that require judgment in the interpretation of tax laws and regulations. In addition, rules and regulations by federal, state, and local taxing authorities evolve over time. It may be necessary to resort to administrative or court proceedings to sustain some or all of the positions we take and such positions may not ultimately be sustained. A court may not agree with some or all of the positions we take. Any contest with the IRS, and the outcome of any IRS contest, may have a materially adverse impact on our financial position and results of operations, the market for our common units, and the price at which they trade. In addition, our costs of any contest with the IRS will be borne indirectly by our unitholders and our general partner, because the costs will reduce our cash available for distribution to our unitholders and for incentive distributions to our general partner.
If the IRS makes audit adjustments to our income tax returns for tax years beginning after December 31, 2017, it may assess and collect any taxes (including any applicable penalties and interest) resulting from such audit adjustment directly from us, in which case our cash available for distribution to our unitholders might be substantially reduced.
Pursuant to the Bipartisan Budget Act of 2015, for tax years beginning after December 31, 2017, if the IRS makes audit adjustments to our income tax returns, it may assess and collect any taxes (including any applicable penalties and interest) resulting from such audit adjustment directly from us. Generally, we expect to elect to have our general partner and our unitholders take such audit adjustment into account in accordance with their interests in us during the tax year under audit, but there can be no assurance that such election will be effective in all circumstances. If we are unable to have our general partner and our unitholders take such audit adjustment into account in accordance with their interests in us during the tax year under audit, our current unitholders may bear some or all of the tax liability resulting from such audit adjustment, even if such unitholders did not own units in us during the tax year under audit. If, as a result of any such audit adjustment, we are required to make payments of taxes, penalties, and interest, our cash available for distribution to our unitholders might be substantially reduced. Tax gain or loss on the disposition of our common units could be more or less than expected.
If our unitholders sell common units, they will recognize a gain or loss for U.S. federal income tax purposes equal to the difference between the amount realized and their tax basis in those common units. Because distributions in excess of their allocable share of our net taxable income decrease their tax basis in their common units, the amount, if any, of such prior excess distributions with respect to the common units a unitholder sells will, in effect, become taxable income to the unitholder if it sells such common units at a price greater than its tax basis in those common units, even if the price received is less than its original cost. Furthermore, a substantial portion of the amount realized on any sale of unitholders’ common units, whether or not representing gain, may be taxed as ordinary income due to potential recapture items, including depreciation recapture. In addition, because the amount realized includes a unitholder’s share of our nonrecourse liabilities, a unitholder that sells common units may incur a tax liability in excess of the amount of cash received from the sale.
38
Tax-exempt entities and non-U.S. persons face unique tax issues from owning our common units that may result in adverse tax consequences to them.
Investment in common units by tax-exempt entities, such as employee benefit plans and individual retirement accounts (known as IRAs), and non-U.S. persons raises issues unique to them. For example, virtually all of our income allocated to organizations that are exempt from federal income tax, including IRAs and other retirement plans, will be unrelated business taxable income and will be taxable to them. Distributions to non-U.S. persons will be reduced by withholding taxes at the highest applicable effective tax rate, and non-U.S. persons will be required to file federal income tax returns, and pay tax on their share of our taxable income. Upon the sale, exchange or other disposition of a common unit by a non-U.S. person, the transferee is generally required to withhold 10% of the amount realized on such sale, exchange or other disposition if any portion of the gain on such sale, exchange, or other disposition would be treated as effectively connected with a U.S. trade or business. The U.S. Department of the Treasury and the IRS have recently issued final regulations providing guidance on the application of these rules for transfers of certain publicly traded partnership interests, including our common units. Under these regulations, the “amount realized” on a transfer of our common units will generally be the amount of gross proceeds paid to the broker effecting the applicable transfer on behalf of the transferor, and such broker will generally be responsible for the relevant withholding obligations. Distributions to non-U.S. persons may also be subject to additional withholding under these rules to the extent a portion of a distribution is attributable to an amount in excess of our cumulative net income that has not previously been distributed. The U.S. Department of the Treasury and the IRS have provided that these rules will generally not apply to transfers of our common units occurring before January 1, 2022. Tax-exempt entities and Non-U.S. persons should consult their tax advisor before investing in our common units.
Some of our activities may not generate qualifying income, and we conduct these activities in separate subsidiaries that are treated as corporations for U.S. federal income tax purposes. Corporate U.S. federal income taxes paid by these subsidiaries reduce our cash available for distribution.
In order to maintain our status as a partnership for U.S. federal income tax purposes, 90% or more of our gross income in each tax year must be qualifying income under Section 7704 of the Internal Revenue Code. To ensure that 90% or more of our gross income in each tax year is qualifying income, we currently conduct the portions of our business unrelated to these operations in separate subsidiaries that are treated as corporations for U.S. federal income tax purposes. These corporate subsidiaries will be subject to corporate-level tax, which reduces the cash available for distribution to us and, in turn, to our unitholders. If the IRS were to successfully assert that any corporate subsidiary has more tax liability than we anticipate, or legislation were enacted that increased the corporate tax rate, our cash available for distribution to our unitholders would be further reduced.
We treat each purchaser of common units as having the same tax benefits without regard to the actual common units purchased. The IRS may challenge this treatment, which could adversely affect the value of the common units.
Because we cannot match transferors and transferees of common units and because of other reasons, we have adopted depreciation and amortization positions that may not conform to all aspects of existing Treasury Regulations. A successful IRS challenge to those positions could adversely affect the amount of tax benefits available to a unitholder. It also could affect the timing of these tax benefits, or the amount of gain from unitholders’ sale of common units and could have a negative impact on the value of our common units, or result in audit adjustments to unitholders’ tax returns.
We prorate our items of income, gain, loss, and deduction for U.S. federal income tax purposes between transferors and transferees of our units each month based upon the ownership of our units on the first business day of each month, instead of on the basis of the date a particular unit is transferred. The IRS may challenge this treatment, which could change the allocation of items of income, gain, loss, and deduction among our unitholders.
We prorate our items of income, gain, loss, and deduction for federal income tax purposes between transferors and transferees of our units each month based upon the ownership of our units on the first day of each month, instead of on the basis of the date a particular unit is transferred.
The U.S. Department of the Treasury and the IRS have issued Treasury Regulations that permit publicly traded partnerships to use a monthly simplifying convention that is similar to ours, but they do not specifically authorize all aspects of the proration method we have adopted. If the IRS were to successfully challenge this method, we could be required to change the allocation of items of income, gain, loss, and deduction among our unitholders.
A unitholder whose common units are loaned to a “short seller” to effect a short sale of common units may be considered as having disposed of those common units. If so, he would no longer be treated for U.S. federal income tax purposes as a partner with respect to those common units during the period of the loan, and may recognize gain or loss from the disposition.
Because a unitholder whose common units are loaned to a “short seller” to effect a short sale of common units may be considered as having disposed of the loaned common units, he may no longer be treated for U.S. federal income tax purposes as a partner with respect to those common units during the period of the loan to the short seller, and the unitholder may recognize gain or loss from such disposition. Moreover, during the period of the loan to the short seller, any of our income, gain, loss, or deduction with respect to those common units may not be reportable by the unitholder, and any cash distributions received by the unitholder as to those common units could be fully taxable as ordinary income.
39
We have adopted certain valuation methodologies in determining a unitholder’s allocations of income, gain, loss, and deduction. The IRS may challenge these methodologies or the resulting allocations, and such a challenge could adversely affect the value of our common units.
In determining the items of income, gain, loss, and deduction allocable to our unitholders, in certain circumstances, including when we issue additional units, we must determine the fair market value of our assets. Although we may from time to time consult with professional appraisers regarding valuation matters, we make many fair market value estimates using a methodology based on the market value of our common units as a means to measure the fair market value of our assets. The IRS may challenge these valuation methods and the resulting allocations of income, gain, loss, and deduction.
A successful IRS challenge to these methods or allocations could adversely affect the amount, character, and timing of taxable income or loss allocated to our unitholders. It also could affect the amount of gain from our unitholders’ sale of common units and could have a negative impact on the value of our common units, or result in audit adjustments to our unitholders’ tax returns without the benefit of additional deductions.
A s a result of investing in our common units, a unitholder may become subject to state and local taxes and return filing requirements in jurisdictions where we operate or own or acquire properties.
In addition to U.S. federal income taxes, our unitholders are likely subject to other taxes, including state and local taxes, unincorporated business taxes and estate, inheritance, or intangible taxes that are imposed by the various jurisdictions in which we conduct business or control property now, or in the future, even if they do not live in any of those jurisdictions. Our unitholders are likely required to file state and local income tax returns and pay state and local income taxes in some or all of these various jurisdictions. Further, our unitholders may be subject to penalties for failure to comply with those requirements. We currently own property or conduct business in many states, most of which impose an income tax on individuals, corporations, and other entities. As we make acquisitions, or expand our business, we may control assets or conduct business in additional states that impose a personal income tax. It is each unitholder’s responsibility to file all federal, state, and local tax returns. Unitholders should consult their tax advisors.
ITEM 1B. UNRESOLVED STAFF COMMENTS
Not Applicable.
Our Properties
We have an aggregate maximum daily disposal capacity of 96,800 barrels in the following water treatment facilities, all of which were built using completion techniques consistent with current industry practices and utilizing well depths of at least 5,300 feet to 6,332 feet with injection intervals beginning at least 5,010 feet beneath the surface. Our permitted capacity is much higher.
| Location | County | In-service Date | Leased / Owned (3) | |||
| Tioga, ND | Williams | June 2011 | Owned | |||
| Manning, ND | Dunn | December 2011 | Owned | |||
| Grassy Butte, ND | McKenzie | May 2012 | Leased | |||
| New Town, ND (1) | Mountrail | June 2012 | Leased | |||
| Williston, ND (1) | Williams | August 2012 | Owned | |||
| Stanley, ND | Mountrail | September 2012 | Owned | |||
| Belfield, ND (1) | Billings | October 2012 | Leased | |||
| Watford City, ND (1), (2) | McKenzie | May 2013 | Leased | |||
| Arnegard, ND (1) | McKenzie | August 2014 | Leased |
| (1) | Currently receives piped water. |
| (2) | We own a 25.0% noncontrolling interest in this water treatment facility. |
| (3) | Some facilities are constructed on land that is leased under long-term arrangements. |
We lease general office space at our corporate headquarters located at 5727 S. Lewis Ave., Suite 300, Tulsa, Oklahoma 74105. The lease expires in November of 2024, unless terminated earlier under certain circumstances specified in our lease. We also lease office space in Houston, Texas that is shared by our Inspection Services and Pipeline & Process Services segments, primarily for business development purposes. This lease expires in March of 2022. Our Pipeline & Process Services segment rents office space in Odessa, Texas on a month by month basis.
| ITEM 3. | LEGAL PROCEEDINGS |
See Note 13 to our Consolidated Financial Statements included in “Item 8. – Financial Statement and Supplementary Data.” for information regarding our legal proceedings as of December 31, 2020.
40
| ITEM 4. | MINE SAFETY DISCLOSURES |
Not Applicable.
| ITEM 5. | MARKET FOR REGISTRANT’S COMMON EQUITY, RELATED UNITHOLDER MATTERS AND ISSUER PURCHASES OF EQUITY SECURITIES |
Our common units are listed on the NYSE under the symbol “CELP.”
On June 30, 2020 the closing price for the common units was $4.13 per unit and there were approximately 5,200 unitholders of record and beneficial owners (held in street name) of the Partnership’s common units. We issued approximately 9,600 federal K-1s to unitholders of record for 2020.
In addition to the common units we issued at our IPO date, we also issued 5,913,000 subordinated units, for which there was no established public trading market. As of December 31, 2016, 5,612,699 of the subordinated units were effectively held by Holdings and its controlled affiliates, either directly or indirectly through its ownership of CEP-TIR. The remaining 300,301 subordinated units were held directly by certain beneficial owners and management. With the payment of the February 2017 quarterly distribution and the fulfillment of other requirements as provided in the partnership agreement, on February 14, 2017, the subordination period with respect to our 5,913,000 subordinated units expired and all outstanding subordinated units converted to common units on a one-for-one basis. The conversion did not impact the total number of our outstanding units representing limited partner interests.
On May 29, 2018 we issued and sold in a private placement 5,769,231 Series A Preferred Units representing limited partner interests in the Partnership (the “Preferred Units”) for a cash purchase price of $7.54 per Preferred Unit, resulting in gross proceeds to the Partnership of $43.5 million. The purchaser of the Preferred Units is entitled to receive quarterly distributions that represent an annual return of 9.5% (which amounts to $4.1 million per year). Of this 9.5% annual return, we have the option under our agreement with the purchaser of the Preferred Units to pay 7.0% in kind (in the form of issuing additional Preferred Units) for the first twelve quarters after the initial sale of the Preferred Units.
Our Cash Distribution Policy
Our partnership agreement requires that, within 45 days after the end of each quarter, we distribute all of our available cash to unitholders of record on the applicable record date. The partnership agreement permits the general partner to reduce available cash by establishing cash reserves for the proper conduct of our business, to comply with applicable law or agreements to which we are a party, or to provide funds for future distributions to partners. These cash reserves affect the amount of cash we have available to distribute to unitholders. Our preferred units rank senior to our common units, and we must pay distributions on our preferred units (including any arrearages) before paying distributions on our common units. In addition, the preferred units rank senior to the common units with respect to rights upon liquidation.
In July 2020, in light of the current market conditions, we made the difficult decision to temporarily suspend payment of common unit distributions. This has enabled us to retain more cash to manage our financing needs during these challenging market conditions. As amended in March 2021, our revolving credit facility contains significant limitations on our ability to pay cash distributions. We may only pay the following cash distributions:
| ● | distributions to common and preferred unitholders, to the extent of income taxes estimated to be payable by these unitholders resulting from allocations of our earnings; |
| ● | distributions to the preferred unitholder up to $1.1 million per year if our leverage ratio is 4.0 or lower; and |
| ● | distributions to the noncontrolling interest owners of CBI and CF Inspection. |
We hope to resume quarterly cash distributions to common unitholders when circumstances warrant. However, we make no representation or assurances as to the availability of future cash distributions since they are dependent upon future earnings, cash flows, capital requirements, financial condition, the terms of future financing arrangements, and our ability to pay arrearages on the preferred units.
Definition of Available Cash
Available cash, for any quarter, consists of all cash and cash equivalents on hand at the end of that quarter:
| ● | less, the amount of cash reserves established by our general partner at the date of determination of available cash for the quarter to: |
| ● | provide for the proper conduct of our business, which could include, but is not limited to, amounts reserved for capital expenditures, working capital and operating expenses; |
| ● | comply with applicable law, any of our debt instruments or other agreements; or |
41
| ● | provide funds for distributions to our unitholders (including our general partner) for any one or more of the next four quarters; |
| ● | plus, if our general partner so determines, all or a portion of cash on hand on the date of determination of available cash for the quarter, including cash on hand resulting from working capital borrowings made after the end of the quarter. |
Distributions
We make no representation or assurances as to the availability of future cash distributions, since they are dependent upon future earnings, cash flows, capital requirements, financial conditions, restrictions under credit agreements, and other factors. Our partnership agreement requires that we make distributions of available cash from operating surplus for any quarter in the following manner:
| ● | first, 100.0% to all common unitholders, pro rata, until we distribute for each outstanding common unit an amount equal to the minimum quarterly distribution for that quarter; and |
| ● | thereafter, in the manner described in “General Partner Interest and Incentive Distribution Rights” below. |
As described above, our revolving credit facility, as amended in March 2021, contains significant restrictions on our ability to pay cash distributions on common and preferred units.
Series A Preferred Units
As of March 15, 2021, we had 5,769,231 Series A Preferred Units outstanding. Until the conversion of the Series A Preferred Units into common units or their redemption, holders of the Series A Preferred Units are entitled to receive cumulative quarterly distributions equal to 9.5% per annum plus accrued and unpaid distributions. With respect to any quarter up to and including the quarter ending June 30, 2021, our general partner may elect to pay such quarterly distribution in cash, in-kind in the form of additional Series A Preferred Units or in a combination thereof, provided that a minimum of 2.5% of such distribution will be paid in cash unless the holders of the Series A Preferred Units otherwise agree. We cannot redeem, repurchase or pay any distributions on any junior securities, including any of the common units, prior to paying the quarterly distribution payable to the Series A Preferred Units, including any previously accrued and unpaid distributions.
As described above, our revolving credit facility, as amended in March 2021, contains significant restrictions on our ability to pay cash distributions on common and preferred units.
General Partner Interest and Incentive Distribution Rights
Incentive distribution rights (“IDRs”) represent a common unitholder’s right to receive an increasing percentage of quarterly distributions of available cash from operating surplus after the minimum quarterly distribution and the target distribution levels have been achieved. The IDRs are effectively held by the same ownership group that own and control our general partner.
The following discussion assumes there are no arrearages on common units.
If, for any quarter, we have distributed available cash from operating surplus to our common unitholders in an aggregate amount equal to the minimum quarterly distribution, then, our partnership agreement requires that we distribute any additional available cash from operating surplus for that quarter among the common unitholders and the owner(s) of the IDRs in the following manner:
| ● | first, 100.0% to all common unitholders, pro rata, until each common unitholder receives a total of $0.445625 per unit for that quarter (the “first target distribution”); |
| ● | second, 85.0% to all common unitholders, pro rata, and 15.0% to the owner(s) of the IDRs, until each common unitholder receives a total of $0.484375 per unit for that quarter (the “second target distribution”); |
| ● | third, 75.0% to all common unitholders, pro rata, and 25.0% to the owner(s) of the IDRs, until each common unitholder receives a total of $0.581250 per unit for that quarter (the “third target distribution”); and |
| ● | thereafter, 50.0% to all common unitholders, pro rata, and 50.0% to the owner(s) of the IDRs. |
Securities Authorized for Issuance under Equity Compensation Plans
See “Item 12 — Security Ownership of Certain Beneficial Owners and Management and Related Unitholder Matters” for information regarding our equity compensation plans as of December 31, 2020.
Unregistered Sales of Equity Securities
None not previously reported on a current report on Form 8-K.
42
Issuer Purchases of Equity Securities
None.
ITEM 6. SELECTED FINANCIAL DATA
The following tables should be read together with “Item 7 – Management’s Discussion and Analysis of Financial Condition and Results of Operations” and the historical financial statements and accompanying notes included in “Item 8 – Financial Statements and Supplementary Data.
The following tables present Adjusted EBITDA and Distributable Cash Flow, which we use in evaluating the performance and liquidity of our business. These financial measures are not calculated or presented in accordance with generally accepted accounting principles, or GAAP. We explain these measures below and reconcile them to net (loss) income and net cash from operating activities, their most directly comparable financial measures calculated and presented in accordance with GAAP.
43
Non-GAAP Financial Measures
We define adjusted EBITDA as net income or loss exclusive of (i) interest expense, (ii) depreciation, amortization, and accretion expense, (iii) income tax expense or benefit, (iv) equity-based compensation expense, and (v) certain other unusual or nonrecurring items. We define adjusted EBITDA attributable to limited partners as adjusted EBITDA exclusive of amounts attributable to the general partner and to noncontrolling interests. We define distributable cash flow as adjusted EBITDA attributable to limited partners less cash interest paid, cash income taxes paid, maintenance capital expenditures, and distributions on preferred equity. Management believes these measures provide investors meaningful insight into results from ongoing operations.
These non-GAAP financial measures are used as supplemental liquidity and performance measures by our management and by external users of our financial statements, such as investors, commercial banks, research analysts, and others to assess:
| ● | the financial performance of our assets without regard to the impact of financing methods, capital structure or the historical cost basis of our assets; |
| ● | our operating performance and return on capital as compared to those of other companies, without regard to financing methods or capital structure; and |
| ● | the ability of our businesses to generate sufficient cash to pay interest costs, support our indebtedness, and make cash distributions to our unitholders. |
We believe that the presentation of these non-GAAP measures provides useful information to investors in assessing our financial condition and results of operations. The GAAP measures most directly comparable to Adjusted EBITDA, Adjusted EBITDA attributable to limited partners, and Distributable Cash Flow are net income (loss) and cash flow from operating activities. These non-GAAP measures should not be considered as alternatives to the most directly comparable GAAP financial measures. Each of these non-GAAP measures excludes some, but not all, of the items that affect the most directly comparable GAAP financial measures. Adjusted EBITDA, Adjusted EBITDA attributable to limited partners, and Distributable Cash Flow should not be considered alternatives to net income (loss), income (loss) before income taxes, net income (loss) attributable to limited partners, cash flows from operating activities, or any other measure of financial performance calculated in accordance with GAAP, as those items are used to measure operating performance, liquidity, or the ability to service debt obligations.
Because Adjusted EBITDA, Adjusted EBITDA attributable to limited partners, and Distributable Cash Flow may be defined differently by other companies, our definitions of Adjusted EBITDA, Adjusted EBITDA attributable to limited partners, and Distributable Cash Flow may not be comparable to a similarly titled measure of other companies, thereby diminishing their utility.
44
The following tables present a reconciliation of net (loss) income to Adjusted EBITDA and to Distributable Cash Flow, a reconciliation of net (loss) income attributable to limited partners to Adjusted EBITDA attributable to limited partners and to Distributable Cash Flow, and a reconciliation of net cash provided by operating activities to Adjusted EBITDA and to Distributable Cash Flow for each of the periods indicated.
Reconciliation of Net (Loss) Income to Adjusted EBITDA and Distributable Cash Flow
| Years ended December 31, | ||||||||||||
| 2020 | 2019 | 2018 | ||||||||||
| (in thousands) | ||||||||||||
| Net (loss) income | $ | (366 | ) | $ | 17,424 | $ | 12,098 | |||||
| Add: | ||||||||||||
| Interest expense | 4,028 | 5,330 | 6,206 | |||||||||
| Debt issuance cost write-off | — | — | 114 | |||||||||
| Depreciation, amortization and accretion | 5,815 | 5,537 | 5,480 | |||||||||
| Income tax expense | 542 | 2,254 | 1,318 | |||||||||
| Equity based compensation | 961 | 1,107 | 1,247 | |||||||||
| Foreign currency losses | — | — | 643 | |||||||||
| Less: | ||||||||||||
| Gains on asset disposals, net | — | — | 4,004 | |||||||||
| Foreign currency gains | 107 | 222 | — | |||||||||
| Adjusted EBITDA | $ | 10,873 | $ | 31,430 | $ | 23,102 | ||||||
| Adjusted EBITDA attributable to noncontrolling interests | 1,588 | 1,976 | 1,219 | |||||||||
| Adjusted EBITDA attributable to limited partners / controlling interests | $ | 9,285 | $ | 29,454 | $ | 21,883 | ||||||
| Less: | ||||||||||||
| Preferred unit distributions | 4,133 | 4,133 | 1,412 | |||||||||
| Cash interest paid, cash taxes paid, maintenance capital expenditures | 5,394 | 7,238 | 7,611 | |||||||||
| Distributable cash flow | $ | (242 | ) | $ | 18,083 | $ | 12,860 | |||||
Reconciliation of Net (Loss) Income Attributable to Limited Partners to Adjusted EBITDA Attributable to Limited Partners and Distributable Cash Flow
| Years ended December 31, | ||||||||||||
| 2020 | 2019 | 2018 | ||||||||||
| (in thousands) | ||||||||||||
| Net (loss) income attributable to limited partners | $ | (1,415 | ) | $ | 16,014 | $ | 11,413 | |||||
| Add: | ||||||||||||
| Interest expense attributable to limited partners | 4,028 | 5,330 | 6,206 | |||||||||
| Debt issuance costs attributable to limited partners | — | — | 114 | |||||||||
| Depreciation, amortization and accretion attributable to limited partners | 5,305 | 5,006 | 4,974 | |||||||||
| Impairments attributable to limited partners | — | — | — | |||||||||
| Income tax expense attributable to limited partners | 513 | 2,219 | 1,290 | |||||||||
| Equity based compensation attributable to limited partners | 961 | 1,107 | 1,247 | |||||||||
| Foreign currency losses attributable to limited partners | — | — | 643 | |||||||||
| Less: | ||||||||||||
| Gains on asset disposals attributable to limited partners, net | — | — | 4,004 | |||||||||
| Foreign currency gains attributable to limited partners | 107 | 222 | — | |||||||||
| Adjusted EBITDA attributable to limited partners | 9,285 | 29,454 | 21,883 | |||||||||
| Less: | ||||||||||||
| Preferred unit distributions | 4,133 | 4,133 | 1,412 | |||||||||
| Cash interest paid, cash taxes paid and maintenance capital expenditures attributable to limited partners | 5,394 | 7,238 | 7,611 | |||||||||
| Distributable cash flow | $ | (242 | ) | $ | 18,083 | $ | 12,860 | |||||
45
Reconciliation of Net Cash Provided by Operating Activities to Adjusted EBITDA and Distributable Cash Flow
| Years ended December 31, | ||||||||||||
| 2020 | 2019 | 2018 | ||||||||||
| (in thousands) | ||||||||||||
| Cash flows provided by operating activities | $ | 27,922 | $ | 18,179 | $ | 15,409 | ||||||
| Changes in trade accounts receivable | (33,634 | ) | 4,310 | 7,169 | ||||||||
| Changes in prepaid expenses and other | 891 | (136 | ) | (1,004 | ) | |||||||
| Changes in accounts payable and accrued liabilities | 11,421 | 1,506 | (5,440 | ) | ||||||||
| Changes in income taxes payable | 765 | (356 | ) | (87 | ) | |||||||
| Interest expense (excluding non-cash interest) | 3,448 | 4,797 | 5,646 | |||||||||
| Income tax expense (excluding deferred tax benefit) | 542 | 2,290 | 1,267 | |||||||||
| Other | (482 | ) | 840 | 142 | ||||||||
| Adjusted EBITDA | $ | 10,873 | $ | 31,430 | $ | 23,102 | ||||||
| Adjusted EBITDA attributable to noncontrolling interests | 1,588 | 1,976 | 1,219 | |||||||||
| Adjusted EBITDA attributable to limited partners / controlling interests | $ | 9,285 | $ | 29,454 | $ | 21,883 | ||||||
| Less: | ||||||||||||
| Preferred unit distributions | 4,133 | 4,133 | 1,412 | |||||||||
| Cash interest paid, cash taxes paid, maintenance capital expenditures | 5,394 | 7,238 | 7,611 | |||||||||
| Distributable cash flow | $ | (242 | ) | $ | 18,083 | $ | 12,860 | |||||
ITEM 7. MANAGEMENT’S DISCUSSION AND ANALYSIS OF FINANCIAL CONDITION AND RESULTS OF OPERATIONS
This Management’s Discussion and Analysis of Financial Condition and Results of Operations contains a discussion of our business, including a general overview of our properties, our results of operations, our liquidity and capital resources, and our quantitative and qualitative disclosures about market risk.
The following discussion contains forward-looking statements that reflect our future plans, estimates, beliefs, and expected performance. The forward-looking statements are dependent upon events, risks, and uncertainties that may be outside our control, including among other things, the risk factors discussed in “Item 1A. Risk Factors” of this Annual Report on Form 10-K. Our actual results could differ materially from those discussed in these forward-looking statements. Factors that could cause or contribute to such differences include, but are not limited to, market prices for oil and natural gas, production volumes, estimates of proved reserves, capital expenditures, economic and competitive conditions, regulatory changes and other uncertainties, as well as those factors discussed below and elsewhere in this Annual Report on Form 10-K, all of which are difficult to predict. In light of these risks, uncertainties, and assumptions, the forward-looking events discussed may not occur. See “Cautionary Remarks Regarding Forward-Looking Statements” in the front of this Annual Report on Form 10-K.
Overview
We are a growth-oriented master limited partnership formed in September 2013. We offer essential services that help protect the environment and ensure sustainability. We provide a wide range of environmental services including independent inspection, integrity, and support services for pipeline and energy infrastructure owners and operators and public utilities. We also provide water pipelines, hydrocarbon recovery, disposal, and water treatment services. The Inspection Services segment comprises the operations of our TIR Entities and the Pipeline & Process Services segment comprises the operations of CBI. We also provide water treatment and other water and environmental services to U.S. onshore oil and natural gas producers and trucking companies through our Environmental Services segment. We operate nine (eight wholly-owned) water treatment facilities, all of which are in the Bakken Shale region of the Williston Basin in North Dakota. We also have a management agreement in place to provide staffing and management services to one 25%-owned water treatment facility in the Bakken Shale region. In all of our business segments, we work closely with our customers to help them comply with increasingly complex and strict environmental and safety rules and regulations applicable to production and pipeline operations, assisting in reducing their operating costs.
How We Generate Revenue
The Inspection Services segment generates revenue primarily by providing essential environmental services, including inspection and integrity services on a variety of infrastructure assets such as midstream pipelines, gathering systems, and distribution systems. Services include nondestructive examination, in-line inspection support, pig tracking, survey, data gathering, and supervision of third-party contractors. Our revenues in this segment are driven primarily by the number of inspectors that perform services for our customers and the fees that we charge for those services, which depend on the type, skills, technology, equipment, and number of inspectors used on a particular project, the nature of the project, and the duration of the project. The number of inspectors engaged on projects is driven by the type of project, prevailing market rates, the age and condition of customers’ assets including pipelines, gas plants, compression stations, storage facilities, and gathering and distribution systems including the legal and regulatory requirements relating to the inspection and maintenance of those assets. We also bill our customers for per diem charges, mileage, and other reimbursement items. Revenue and costs in this segment are subject to seasonal variations and interim activity may not be indicative of yearly activity, considering many of our customers develop yearly operating budgets and enter into contracts with us during the winter season for work to be performed during the remainder of the year. Additionally, inspection work throughout the United States during the winter months (especially in the northern states) may be hampered or delayed due to inclement weather.
46
The Pipeline & Process Services segment generates revenue primarily by providing essential environmental services including hydrostatic testing, chemical cleaning, water transfer and recycling, pumping, pigging, flushing, filling, dehydration, caliper runs, in-line inspection tool run support, nitrogen purging, and drying services to energy companies and pipeline construction companies. We perform services on newly-constructed and existing pipelines and related infrastructure. We generally charge our customers in this segment on a fixed-bid basis, depending on the size and length of the pipeline being tested, the complexity of services provided, and the utilization of our work force and equipment. Our results in this segment are driven primarily by the number of projects we are awarded and the nature and duration of the projects. Revenue and costs in this segment may be subject to seasonal variations and interim activity may not be indicative of yearly activity, considering that many of our customers develop yearly operating budgets and enter into contracts with us during the winter season for work to be performed during the remainder of the year. Additionally, field work during the winter months may be hampered or delayed due to inclement weather.
The Environmental Services segment owns and operates nine (9) water treatment facilities with ten (10) EPA Class II injection wells in the Bakken shale region of the Williston Basin in North Dakota. We wholly-own eight of these water treatment facilities and we own a 25% interest in the other facility. These water treatment facilities are connected to thirteen (13) pipeline gathering systems, including two (2) that we developed and own. We specialize in the treatment, recovery, separation, and disposal of waste byproducts generated during the lifecycle of an oil and natural gas well to protect the environment and our drinking water. All of the water treatment facilities utilize specialized equipment and remote monitoring to minimize the facilities’ downtime and increase the facilities’ efficiency for peak utilization. Revenue is generated on a fixed-fee per barrel basis for receiving, separating, filtering, recovering, processing, and injecting produced and flowback water. We also sell recovered oil, receive fees for pipeline transportation of water, and receive fees from a partially-owned water treatment facility for management and staffing services.
How We Evaluate Our Operations
Our management uses a variety of financial and operating metrics to analyze our performance. We view these metrics as significant factors in assessing our operating results and profitability. These metrics include:
| ● | inspector headcount in our Inspection Services segment; |
| ● | gross margin percentages in our Inspection Services segment; |
| ● | field personnel headcount and utilization in our Pipeline & Process Services segment; |
| ● | volume of water treated and residual oil recovered in our Environmental Services segment; |
| ● | operating expenses; |
| ● | segment gross margin; |
| ● | safety metrics; |
| ● | Adjusted EBITDA; |
| ● | maintenance capital expenditures; and |
| ● | distributable cash flow. |
Inspector Headcount
The amount of revenue we generate in our Inspection Services segment depends primarily on the number of inspectors that perform services for our customers. The number of inspectors engaged on projects is driven by the type of project, prevailing market rates, the age and condition of customers’ midstream pipelines, gathering systems, miscellaneous infrastructure, distribution systems, and the legal and regulatory requirements relating to the inspection and maintenance of those assets.
Field Personnel Headcount and Utilization
The amount of revenue we generate in our Pipeline & Process Services segment depends primarily on the number of bids we win for hydrostatic testing and other integrity services and the fees that we charge for those services, which depend on the type and number of field personnel used on a particular project, the type of equipment used and the fees charged for the utilization of that equipment, and the nature and the duration of the project. The number of field personnel engaged on projects is driven by the type of project, the size and length of the pipeline being inspected, the complexity of services provided, and the utilization of our work force and equipment. The employees of the Pipeline & Process Services segment are full-time employees, and therefore primarily represent fixed costs (in contrast to the employees of the Inspection Services segment who perform work in the field, most of whom only earn wages when they are performing work for a customer and whose wages are therefore primarily variable costs).
47
Water Treatment and Residual Oil Volumes
The amount of revenue we generate in the Environmental Segment depends primarily on the volume of produced water and flowback water that we treat and dispose for our customers pursuant to published or negotiated rates, as well as the volume of residual oil that we sell pursuant to rates that are determined based on the quality of the oil sold and prevailing oil prices. Most of the revenue generated from water delivered to our facilities by truck is generated pursuant to contracts that are short-term in nature. Most of the revenue generated from water delivered to our facilities by pipeline is generated pursuant to contracts that are several years in duration, but do contain cancellation terms. The volumes of water processed at our water treatment facilities are driven by water volumes generated from existing oil wells during their useful lives and development drilling and production volumes from new wells located near our facilities. Producers’ willingness to engage in new drilling is determined by a number of factors, the most important of which are the prevailing and projected prices of oil, natural gas, and natural gas liquids, the cost to drill and operate a well, the availability and cost of capital, and environmental and governmental regulations. We generally expect the level of drilling to positively correlate with long-term trends in prices of oil, natural gas, and natural gas liquids.
Approximately 3%, 6%, and 5% of our Environmental Services segment revenue in 2020, 2019, and 2018, respectively, was derived from sales of residual oil recovered during the water treatment process. Our ability to recover residual oil is dependent upon the oil content in the water we treat, which is, among other things, a function of water type, chemistry, source, and temperature. Generally, where outside temperatures are lower, oil separation is more difficult. Thus, our residual oil recovery during the winter season is lower than our recovery during the summer season. Additionally, residual oil content will decrease if, among other things, producers begin recovering higher levels of residual oil in saltwater prior to delivering such saltwater to us for treatment.
Operating Expenses
The primary components of our operating expenses include cost of services, general and administrative expense, and depreciation, amortization and accretion.
Costs of services. Employee-related costs and reimbursable expenses are the primary cost of services components in the Inspection Services segment. Employee-related costs, equipment rentals, supplies, and depreciation on fixed assets are the primary cost of services components in the Pipeline & Process Services segment. These expenses fluctuate based on the number, type, and location of projects on which we are engaged at any given time. Repair and maintenance costs, employee-related costs, residual oil disposal costs, and utility expenses are the primary cost of services components in the Environmental Services segment. Certain of these expenses remain relatively stable with fluctuations in the volume of water processed (although certain expenses, such as utilities, vary based on the volume of water processed). Maintenance expenses fluctuate depending on the timing of maintenance work.
General and administrative. General and administrative expenses include compensation and related costs of employees performing general and administrative functions, general office expenses, insurance, legal and other professional fees, software, travel and promotion, and other expenses.
Depreciation, amortization and accretion. Depreciation, amortization and accretion expense primarily consists of the decrease in value of assets as a result of using the assets over their estimated useful life. Depreciation and amortization are recorded on a straight-line basis. We estimate that our assets have useful lives ranging from 3 to 39 years. The fixed assets of our Environmental Services segment constituted approximately 72% of the net book value of our consolidated fixed assets as of December 31, 2020.
Segment Gross Margin, Adjusted EBITDA, and Distributable Cash Flow
We view segment gross margin as one of our primary management tools, and we track this item on a regular basis, both as an absolute amount and as a percentage of revenue. We also track Adjusted EBITDA, defined as net income or loss exclusive of (i) interest expense, (ii) depreciation, amortization, and accretion expense, (iii) income tax expense or benefit, (iv) equity-based compensation expense, and (v) certain other unusual or nonrecurring items. We use distributable cash flow, defined as Adjusted EBITDA less cash interest paid, cash taxes paid, maintenance capital expenditures, and distributions on preferred equity, as an additional measure to analyze our performance. Adjusted EBITDA and distributable cash flow do not reflect changes in working capital balances, which could be significant, as headcounts of the Inspection Services segment vary from period to period. Adjusted EBITDA and distributable cash flow are non-GAAP, supplemental financial measures used by management and by external users of our financial statements, such as investors, lenders, and analysts, to assess:
| ● | our operating performance as compared to those of other providers of similar services, without regard to financing methods, historical cost basis, or capital structure; |
| ● | the ability of our assets to generate sufficient cash flow to support our indebtedness and make distributions to our partners; and |
| ● | our ability to incur and service debt and fund capital expenditures. |
Adjusted EBITDA and distributable cash flow are not financial measures presented in accordance with GAAP. We believe that the presentation of these non-GAAP financial measures provide useful information to investors in assessing our financial condition and results of operations. Net income (loss) is the GAAP measure most directly comparable to Adjusted EBITDA. The GAAP measure most directly comparable to distributable cash flow is net cash provided by operating activities. Our non-GAAP financial measures should not be considered as alternatives to the most directly comparable GAAP financial measures. Each of these non-GAAP financial measures has important limitations as an analytical tool because it excludes some, but not all, of the items that affect the most directly comparable GAAP financial measure. You should not consider Adjusted EBITDA or distributable cash flow in isolation or as a substitute for analysis of our results as reported under GAAP. Because Adjusted EBITDA and distributable cash flow may be defined differently by other companies in our industry, our definitions of these non-GAAP financial measures may not be comparable to similarly titled measures of other companies, thereby diminishing their utility.
48
For a further discussion of the non-GAAP financial measures of Adjusted EBITDA and reconciliation of that measure to their most comparable financial measures calculated and presented in accordance with GAAP, please read “Item 6 — Selected Financial Data — Non-GAAP Financial Measures.”
Overview and Outlook
Overall
Our 2020 results were the worst in our short history following our best year that included record results in 2019. The financial results in 2020 were adversely affected by the significant decline in oil prices during the year, which was driven in part by increased supply from Russia, Saudi Arabia, and other oil-producing nations as a result of a price war and in part by a significant decrease in demand as a result of the COVID-19 pandemic. The combination of these events led many of our customers to cancel planned construction projects and defer regular maintenance projects whenever possible. The effects of these events placed significant financial pressures on a vast majority of our customers to reduce costs, which led to some of our customers to aggressively pursue pricing concessions. We value our long-term customer relationships and worked closely with them to address this reality which, in turn, required us to modify what pay we could offer to our valued inspectors. Despite the COVID-19 pandemic, we have continued our field operations without any significant disruption in our service to our customers.
Previously, OPEC started a price war for market share in November 2014 that led to a downturn that lasted through 2017. The industry, our customers, and we benefitted from the rebound in 2018 and 2019. In the years leading into 2020, many companies had been active in constructing new energy infrastructure, such as pipelines, gas plants, compression stations, pumping stations, and storage facilities, which afforded us the opportunity to provide our inspection and integrity services on these projects. The commodity price decline in 2020 led our customers to change their budgets and plans, and to decrease their spending on capital expenditures. This, in turn, had an impact on regular maintenance work and the construction of new pipelines, gathering systems, and related energy infrastructure. Lower exploration and production activity also affected the midstream industry and led to delays and cancellations of projects. The volatility in crude oil prices is illustrated in the chart below, which shows the average monthly spot price for West Texas Intermediate crude oil from 2018 through 2020.
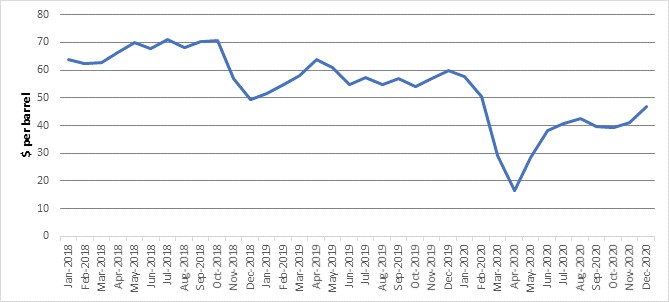
Recognizing the impact of the COVID-19 pandemic, we took swift and decisive actions to reduce overhead and other costs through a combination of salary reductions, reductions in force, furloughs, hiring freezes, and other cost-cutting measures. We elected to defer some discretionary capital expenditures and we remain focused on opportunities to reduce our working capital needs. In early 2021, we took additional actions to further reduce our costs with some additional layoffs and furloughs. We believe the actions we have taken have significantly lowered our general and administrative costs to weather the storm. While reducing various costs, we have also made investments in personnel in our account management and business development teams, to position ourselves to take advantage of the market’s eventual recovery.
As of December 31, 2020, we had long-term debt, net of cash and cash equivalents, of $44.1 million. We explored the possibility of a Federal Reserve Main Street lending facility. We had too many employees to avail ourselves of any of the federal government's Paycheck Protection Program forgivable loans. In March 2021, we entered into an amendment to our existing credit facility that extended the maturity date to May 2022, reduced the total capacity from $110.0 million to $75.0 million, and made the leverage ratio covenant temporarily less restrictive during 2021. See further discussion regarding our credit facility below in the “Our Credit Agreement” section as part of “Management’s Discussion and Analysis of Financial Condition and Liquidity”.
In light of the adverse market conditions, we made the difficult decision in July 2020 to temporarily suspend payment of common unit distributions. This has enabled us to retain more cash to manage our working capital and financing requirements during these challenging market conditions. Our credit facility, as amended in March 2021, contains significant restrictions on our ability to pay cash distributions to common and preferred unitholders. As a result, we expect to use cash generated from operations for working capital to finance revenue growth and to pay down debt.
The vaccination process for COVID-19 is currently underway, which has likely been a leading factor in the recent recovery in demand for crude oil. The price of crude oil has increased in early 2021, with the average daily spot price for West Texas Intermediate crude oil increasing to $52.01 in January 2021 and $65.36 on March 15, 2021. We expect this increase in crude oil prices to lead customers to increase their maintenance and capital spending plans. This should provide more opportunity to provide inspection, integrity, and water treatment services. We continue to focus on winning new customers while supporting our existing clients.
Sales and business development remain our top priority, and we are bidding on many projects with both existing and prospective new customers. The near-term recovery remains fragile, as market participants evaluate the risks associated with new variants of the coronavirus. Our customers are evaluating these changing circumstances as they prepare their capital expansion and maintenance budgets. Historically, as commodity prices increase, customers begin to increase their spending, which increases our opportunities to provide our services. Although higher commodity prices typically benefit our business, we typically experience a lag between when commodity prices increase and when our customers begin to increase their spending for inspection, integrity, and water treatment services. We believe there will be significant long-term demand for our services, and we continue our efforts to diversify our customer base. We have continued to invest in talent in the areas of account management and business development. We strive to position ourselves as a stable and reliable provider of high-quality services to our customer base.
In 2020 we made the strategic decision to aggressively pursue new inspection markets to diversify our inspection business to markets not tied to commodity prices. We have the expertise and systems to offer inspection services into new markets including municipal water, sewer, bridges, electrical transmission, marine coatings, and renewables (such as wind, solar, and hydroelectric). We have been bidding inspection jobs in these new markets and many of our inspectors and employees have the skills to offer these services to these new markets. Over the long term, we hope to have the majority of our inspection revenue coming from these new segments.
49
We believe government regulation under the new administration will continue to grow with a focus on protecting the environment. The U.S. Pipeline and Hazardous Materials Safety Administration (“PHMSA”) recently issued new rules that impose several new requirements on operators of onshore gas transmission systems and hazardous liquids pipelines. The new rules expand requirements to address risks to pipelines outside of environmentally sensitive and populated areas. In addition, the rules make changes to integrity management requirements, including emphasizing the use of in-line inspection technology. The new rules took effect on July 1, 2020 with various implementation phases over a period of years. We remain optimistic about the long-term demand for environmental services such as inspection services, integrity services, and water solutions, due to our nation’s aging pipeline infrastructure, and we believe we continue to be well-positioned to capitalize on these opportunities. The following charts summarize the age of pipelines in the United States, as developed from our independent research and government data:
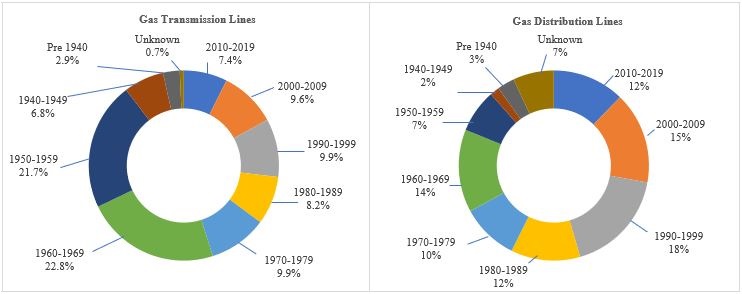
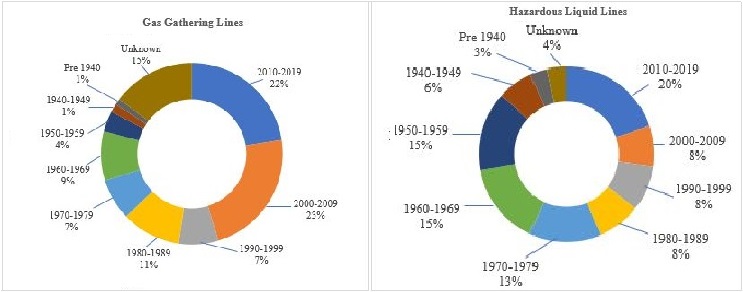
In 2018, Holdings completed two acquisitions to further broaden our collective suite of environmental services. One acquisition provided entry into the municipal water industry, whereby we can offer our traditional inspection services, including corrosion and nondestructive testing services, as well as in-line inspection (“ILI”). Holdings’ next generation 5G ultra high-resolution magnetic flux leakage (“MFL”) ILI technology called EcoVision™ UHD, is capable of helping pipeline owners and operators better manage the integrity of their pipeline assets in both the municipal water and energy industries. We believe Holdings is the only technology provider today capable of offering this service to the large and diverse municipal water industry that provides drinking water to our communities. Holdings has been investing in building tools to serve different size pipelines. At some point in the future, these businesses may be offered to the Partnership when appropriate. We do not expect to acquire either of these businesses in the near term, although we continue to use these affiliated business as cross-selling opportunities for our services.
Our parent company’s ownership interests continue to remain fully aligned with our unitholders, as our General Partner and insiders collectively own approximately 76% of our total common and preferred units.
Inspection Services
Revenues of our Inspection Services segment decreased from $372.0 million in 2019 to $181.5 million in 2020, a decrease of 51%. Gross margins in this segment decreased from $40.5 million in 2019 to $19.8 million in 2020, a decrease of 51%. Revenues during 2019 benefited from the largest contract in the 18-year history of TIR, which was a single-source Inspection Services project in Texas. This project began in late 2018, peaked in 2019, and continued with declining headcounts into 2020. Our revenues during 2020 did not significantly benefit from any other large new projects. A portion of our revenue in this segment is associated with mileage and per diem allowances for our inspectors who leave their home to work remotely at the client’s location. The majority of the time we are not entitled to a markup or profit margin on these items, and the gross margin percentages reflect this dynamic.
50
During 2020, the COVID-19 pandemic, combined with a significant decrease in crude oil prices resulting from reduced demand and an anticipated increase in supply from Saudi Arabia and Russia, led many of our customers to change their budgets and plans. In our Inspection Services segment, most projects that were already in process continued, despite the COVID-19 pandemic. However, many customers announced reductions in their capital expansion budgets and deferrals of planned construction projects, and these changes reduced our revenue-generating opportunities. We expect customers to continue to conduct maintenance activities, many of which are government-mandated. However, many customers are deferring maintenance work when possible if they have the option to do so.
We have many long-term customer relationships that go back over 18 years. We believe our reputation developed over this time will give us a competitive advantage during this challenging industry downturn when some of our competitors may not survive. We continue to bid on new work that could benefit us if we are successful in being awarded those inspection opportunities. The vast majority of our customers are under significant financial pressure to reduce costs and have been aggressively pursuing pricing concessions. We value our long-term customer relationships and work closely with our customers to address this reality, which in turn requires us to modify what pay we can offer to our valued inspectors. The net result of the actions has led to less working capital being required to operate the businesses.
We operate in a very large market, with more than 3,000 customer prospects who require federally and/or state-mandated inspection and integrity services. Today, we estimate that we serve less than 8% of the available market. We believe we have substantial opportunities for organic growth. Our focus remains on maintenance and integrity work on existing pipelines, as well as work on new projects. The majority of our clients are large public companies with long planning cycles that lead to healthy backlogs of new long-term projects and existing pipeline networks that also require inspection and integrity services. We believe that regulatory requirements, coupled with the aging pipeline infrastructure, mean that, regardless of commodity prices, our customers will require our inspection services. However, a prolonged downturn in oil and natural gas prices could lead to a downturn in demand for our services.
Pipeline and Process Services
Revenues of our Pipeline & Process Services segment decreased from $19.3 million in 2019 to $18.7 million in 2020, a decrease of 3%. Gross margins decreased from $5.9 million in 2019 to $5.0 million in 2020, a decrease of 16%.
Revenues remained strong in 2020, due to increased success in winning bids for projects as a result of improved business development efforts. We believe we have positioned ourselves as a preferred provider for large hydrotesting projects with our customer base. Although market conditions were adverse in 2020 for our other businesses, hydrotesting is one of the last steps to be completed before a pipeline is placed into service, and during 2020, a number of pipeline construction projects that began prior to the COVID-19 pandemic continued. During late 2020, activity slowed down, and bid activity was lower in early 2021 than in years past. In early 2021, we implemented a cost reduction plan that included salary reductions, furloughs, and a reduction in workforce.
In 2018, we opened a new office in Odessa, Texas to better serve the Permian basin market. In early 2019, we opened a new location in the Houston market. CBI continues to enjoy an excellent reputation in the industry. Although the planned reduction in capital expansion projects by many of our customers will reduce our revenue-generating opportunities, we believe we have developed a strong reputation over the last decade that will give us a competitive advantage when bidding on future work, not only with new construction projects, but also with integrity maintenance projects. We remain active in bidding for new projects and we believe this downturn may put some competitors out of business.
Environmental Services
Revenues of our Environmental Services segment decreased from $10.3 million in 2019 to $5.8 million in 2020, a decrease of 44%. The decrease was primarily due to a decrease of 5.5 million barrels of water processed in 2020 compared to 2019. The decrease in volume resulted from a slowdown in exploration and production activity in the areas near our facilities. Gross margins in this segment decreased from $7.3 million in 2019 to $3.7 million in 2020, a decrease of 49%. The decrease in gross margin was due primarily to a $4.6 million decrease in revenue, partially offset by a $1.0 million decrease in cost of services. Low commodity prices, an excess of supply, and low demand have led to a significant reduction in activity by producers in North Dakota.
Bakken Clearbrook oil pricing was under intense pressure during 2020, along with WTI oil prices. WTI oil prices, which were at $61.14 at December 31, 2019, decreased in January and February 2020, decreased even more sharply in March and April 2020, gradually increased to $40 per barrel in early July, and begin increasing in December to $48.35 at December 31, 2020. Pipeline capacity and storage constraints also adversely affected this market. Several prominent exploration and production customers elected to shut in their production instead of selling oil at the low market prices. According to a published rig count as of December 31, 2020, the Williston basin of the Bakken totaled 11 rigs, down 82% from its peak in 2019 of 61 rigs. During late 2020, the largest customer of one of our highest-volume facilities notified us of its decision to build its own facility and began sending most of its water to that facility in February 2021.
Although market conditions are adverse, we expect to continue to benefit from the fact that 99% of our water in 2020 was produced water from existing wells (rather than flowback water from new wells) and 66% of our water in 2020 was from pipelines. We also took steps to reduce our operating costs, including the temporary closure during the second quarter of 2020 of several of our facilities. We have since reopened these facilities after market conditions improved. We recently completed a new contract with a public energy company to connect its pipeline to one of our water treatment facilities. This facility began receiving volumes from the pipeline in October 2020. We expect the increase in oil prices in early 2021 to lead to an increase in exploration and production activity in the Bakken.
In July 2020, in relation to an ongoing lawsuit challenging various federal authorizations for the Dakota Access Pipeline, a federal court ordered that the Dakota Access Pipeline be shut down and drained of oil by August 5, 2020. The owners of the pipeline appealed the decision, and a federal appeals court stayed the July 2020 order to close the pipeline and ordered further briefing on the issue. The Dakota Access Pipeline transports approximately 40% of the crude oil that is produced in the Bakken region. Although most of the production from the wells that our facilities serve is not transported on the Dakota Access Pipeline, the closure of the pipeline would likely have an adverse effect on overall production in the Bakken, which would likely reduce the volume of water delivered to our facilities. In addition, the uncertainty associated with this litigation may reduce E&P companies’ incentive to invest in new production in the Bakken.
51
Critical Accounting Policies and Estimates
The preparation of financial statements in conformity with generally accepted accounting principles requires management to select appropriate accounting policies and make estimates and assumptions that affect the reported amounts of assets, liabilities, revenue and expenses. See “Note 2 — Summary of Significant Accounting Policies” in the audited financial statements included in “Item 8 — Financial Statements and Supplementary Data” for descriptions of our major accounting policies and estimates. Certain of these accounting policies and estimates involve judgments and uncertainties to such an extent that there is a reasonable likelihood that materially different amounts could have been reported under different conditions, or if different assumptions had been used. The following discussions of critical accounting estimates, including any related discussion of contingencies, address all important accounting areas where the nature of accounting estimates or assumptions could be material due to the levels of subjectivity and judgment necessary to account for highly uncertain matters or the susceptibility of such matters to change.
Business Combinations and Intangible Assets Including Goodwill
We account for acquisitions of businesses using the acquisition method of accounting. Accordingly, assets acquired and liabilities assumed are recorded at their estimated fair values at the acquisition date. The excess of purchase price over fair value of net assets acquired, including the amount assigned to identifiable intangible assets, is recorded as goodwill. The results of operations of acquired businesses are included in the Consolidated Financial Statements from the acquisition date.
Impairments of Long-Lived Assets
Property and Equipment
We assess property and equipment for possible impairment whenever events or changes in circumstances indicate that the carrying value of the assets may not be recoverable. Such indicators include, among others, the nature of the asset, the projected future economic benefit of the asset, changes in regulatory and political environments, and historical and future cash flow and profitability measurements. If the carrying value of an asset group exceeds the undiscounted cash flows estimated to be generated by the asset group, we recognize an impairment loss equal to the excess of carrying value of the asset group over its estimated fair value. Estimating the future cash flows and the fair value of an asset group involves management estimates on highly uncertain matters such as future commodity prices, the effects of inflation on operating expenses, and the outlook for national or regional market supply and demand for the services we provide.
In the Environmental Services segment, Property, Plant, and Equipment is grouped for impairment testing purposes at each water treatment facility, as these asset groups represent the lowest level at which cash flows are separately identifiable. Our estimates utilize judgments and assumptions such as undiscounted future cash flows, discounted future cash flows, estimated fair value of the asset group, and economic environment in which the asset is operated. Significant judgments and assumptions in these assessments include estimates of rates for water treatment services, volumes of water processed, expected capital costs, oil and gas drilling and producing volumes in the markets served, risks associated with the different zones into which water is processed, and our estimate of an applicable discount rate commensurate with the risk of the underlying cash flow estimates.
An estimate as to the sensitivity to earnings for these periods had we used other assumptions in our impairment reviews and impairment calculations is not practicable, given the number of assumptions involved in the estimates. Unfavorable changes in our assumptions might have caused an unknown number of assets to become impaired. Additionally, further unfavorable changes in our assumptions in the future are reasonably possible, and therefore, it is possible that we may incur impairment charges in the future.
Identifiable Intangible Assets
Our recorded net identifiable intangible assets of $17.4 million and $20.1 million at December 31, 2020 and 2019, respectively, consist primarily of customer relationships and trademarks and trade names, amortized on a straight-line basis over estimated useful lives ranging from 5 – 20 years. Identifiable intangible assets with finite lives are amortized on a straight-line basis over their estimated useful lives, which is the period over which the asset is expected to contribute directly or indirectly to our future cash flows. We have no indefinite-lived intangibles other than goodwill. The determination of the fair value of the intangible assets and the estimated useful lives are based on an analysis of all pertinent factors including (1) the use of widely-accepted valuation approaches, such as the income approach or the cost approach, (2) our expected use of the asset, (3) the expected useful life of related assets, (4) any legal, regulatory, or contractual provisions, including renewal or extension periods that would cause substantial costs or modifications to existing agreements, and (5) the effects of demand, competition, and other economic factors. Should any of the underlying assumptions indicate that the value of the intangible assets might be impaired, we may be required to reduce the carrying value and/or subsequent useful life of the asset. If the underlying assumptions governing the amortization of an intangible asset were later determined to have significantly changed, we may be required to adjust the amortization period of such asset to reflect any new estimate of its useful life. Any write-down of the value or unfavorable change in the useful life of an intangible asset would increase expense at that time.
Goodwill
We have $50.4 million of goodwill on our Consolidated Balance Sheet at December 31, 2020. Of this amount, $40.3 million relates to the Inspection Services segment and $10.1 million relates to the Environmental Services segment. Goodwill is not amortized, but is subject to annual assessments on November 1 (or at other dates if events or changes in circumstances indicate that the carrying value of goodwill may be impaired) for impairment at a reporting unit level. The reporting units used to evaluate and measure goodwill for impairment are determined primarily by the manner in which the business is managed or operated. We have determined that our Inspection Services and Environmental Services operating segments are the appropriate reporting units for testing goodwill impairment.
To perform a goodwill impairment assessment, we first evaluate qualitative factors to determine whether it is more likely than not that the fair value of a reporting unit exceeds its carrying value. If this assessment reveals that it is more likely than not that the carrying value of a reporting unit exceeds its fair value, we then determine the estimated fair value of the reporting unit. If the carrying amount exceeds the reporting unit’s fair value, we record a goodwill impairment charge for the excess (not exceeding the carrying value of the reporting unit’s goodwill).
52
Crude oil prices decreased significantly in 2020, due in part to decreased demand as a result of the worldwide COVID-19 pandemic. This decline in oil prices led many of our customers to change their budgets and plans, which resulted in reduced spending on drilling, completions, and exploration. This has had an adverse effect on construction of new pipelines, gathering systems, and related energy infrastructure. Lower exploration and production activity has also adversely effected the midstream industry and has led to delays and cancellations of projects. It is also possible that our customers may elect to defer maintenance activities on their infrastructure. Such developments would reduce our opportunities to generate revenues. It is impossible at this time to determine what may occur, as customer plans will evolve over time. It is possible that the cumulative nature of these events could have a material adverse effect on our results of operations and financial position.
Inspection Services
We completed our annual goodwill impairment assessment as of November 1, 2020 and concluded the $40.3 million of goodwill of the Inspection Services segment was not impaired. Our evaluations included various qualitative and corroborating quantitative factors, including current and projected earnings and current customer relationships and projects, and a comparison of our enterprise value to the sum of the estimated fair values of our business segments. The qualitative and supporting quantitative assessments on this reporting unit indicated that there was no need to conduct further quantitative testing for goodwill impairment. The use of different assumptions and estimates from the assumptions and estimates we used in our analyses could have resulted in the requirement to perform further quantitative goodwill impairment analyses.
Environmental Services
We completed our annual goodwill impairment assessment as of November 1, 2020 and updated this analysis as of December 31, 2020 and concluded that the remaining $10.1 million of goodwill of the Environmental Services segment was not impaired. We considered the decline in the price of crude oil and the fact that, during the third quarter of 2020, the largest customer of one of our highest-volume facilities notified us of its decision to build its own facility and to send most of its water to that facility beginning in February 2021. We considered these developments to be potential indicators of impairment and therefore performed quantitative goodwill impairment analyses. We estimated the fair value of the reporting unit utilizing the income approach (discounted cash flows) valuation method, which is a Level 3 measurement as defined in ASC 820, Fair Value Measurement. Significant inputs in the valuation included projections of future revenues, anticipated operating costs, and appropriate discount rates. Since the volume of water we receive at our facilities is heavily influenced by the extent of exploration and production in the areas near our facilities, and since exploration and production is in turn heavily influenced by crude oil prices, we estimated future revenues by reference to crude prices in the forward markets. We used a forward price curve that reflects a gradual increase in the West Texas Intermediate ("WTI") crude price each month, with the price remaining around $39-$47 per barrel through January 2022 and reaching $49-$53 per barrel in January 2032. We estimated future operating costs by reference to historical per-barrel costs and estimated future volumes. We estimated revenues and costs for a period of ten years and estimated a terminal value calculated as a multiple of the cash flows in the preceding year. We discounted these estimated future cash flows at a rate of 13.5%. We assumed that a hypothetical buyer would be a partnership that is not subject to income taxes and that could obtain savings in general and administrative expenses through synergies with its other operations. Based on these quantitative analyses, we concluded that the goodwill of the Environmental Services segment was not impaired. Our analysis indicated that the fair value of the reporting unit of the Environmental Services segment exceeded their book value by 16% at December 31, 2020. The use of different assumptions and estimates from those we used in our analysis could have resulted in the need to record a goodwill impairment.
Our estimates of fair value are sensitive to changes in a number of variables, many of which relate to broader macroeconomic conditions outside of our control. As a result, actual performance could be different from our expectations and assumptions. Estimates and assumptions used in determining fair value of the reporting units that are outside the control of management include commodity prices, interest rates, and cost of capital. Our water treatment facilities are concentrated in one basin, and changes in oil and gas production in that basin could have a significant impact on the profitability of the Environmental Services segment. While we believe we have made reasonable estimates and assumptions to estimate the fair values of our reporting units, it is reasonably possible that changes could occur that would require a goodwill impairment charge in the future. Such changes could include, among others, a slower recovery in demand for petroleum products than assumed in our projections, an increase in supply from other areas (or other factors) that result in reduced production in North Dakota, and increased pessimism among market participants, which could increase the discount rate on (and therefore decrease the value of) estimated future cash flows.
Revenue Recognition
Under Accounting Standards Codification (“ASC”) 606 - Revenue from Contracts with Customers, an entity should recognize revenue to depict the transfer of promised goods or services to customers in an amount that reflects the consideration to which the entity expects to be entitled in exchange for those goods or services. Based on this accounting guidance, our revenue is earned and recognized through the service offerings of our three reportable business segments. Our sales contracts have terms of less than one year. As such, we have used the practical expedient contained within the accounting guidance which exempts us from the requirement to disclose the transaction price allocated to remaining performance obligations if the performance obligation is part of a contract with an original expected duration of one year or less. We apply judgment in determining whether we are the principal or the agent in instances where we utilize subcontractors to perform all or a portion of the work under our contracts. Based on the criteria in ASC 606, we have determined we are principal in all such circumstances.
In 2020 and 2019, we recognized $0.3 million and $0.2 million of revenue within our Inspection Services segment, respectively, on services performed in previous years. We had constrained recognition of this revenue until the expiration of a contract provision that had given the customer the opportunity to reopen negotiation of the fee paid for the services. As of December 31, 2020, and December 31, 2019, we recognized a refund liability of $0.8 million and $0.7 million within our Inspection Services segment, respectively, for revenue associated with such variable consideration. In addition, we have recorded other refund liabilities of $0.8 million and $0.7 million at December 31, 2020 and 2019, respectively.
53
In the first quarter of 2018, we recognized $0.3 million of revenue within our Pipeline & Process Services segment associated with additional billings on a project that we completed in the fourth quarter of 2017 (we recognized the revenue upon receipt of customer acknowledgment of the additional fees).
Consolidated Results of Operations – Cypress Environmental Partners, L.P.
The Consolidated Results of Operations and Segment Operating Results sections generally discuss 2020 and 2019 items and year-to-year comparisons between 2020 and 2019. Discussions of 2018 items and year-to-year comparisons between 2019 and 2018 that are not included in this Form 10-K can be found in the Consolidated Results of Operations and Segment Operating Results sections of "Management’s Discussion and Analysis of Financial Condition and Results of Operations" in Part II, Item 7 of our Annual Report on Form 10-K for the year ended December 31, 2019.
Factors Impacting Comparability
The historical results of operations for the periods presented may not be comparable, either to each other or to our future results of operations, for the reason described below:
| ● | We are party to an omnibus agreement with Holdings and other related parties. Prior to January 1, 2020, the omnibus agreement called for Holdings to provide certain general and administrative services, including executive management services and expenses associated with our being a publicly-traded entity (such as audit, tax, and transfer agent fees, among others) in return for a fixed annual fee. In an effort to simplify this arrangement so it would be easier for investors to understand, in November 2019, with the approval of the Conflicts Committee of the Board of Directors, we and Holdings agreed to terminate the management fee provisions of the omnibus agreement effective December 31, 2019. Beginning January 1, 2020, the executive management services and other general and administrative expenses that Holdings previously incurred and charged to us via the annual administrative fee are charged directly to us as they are incurred and are now paid directly by the Partnership. Under our current cost structure, these direct expenses have been lower than the annual administrative fee that we previously paid, although we experience more variability in our quarterly general and administrative expense now that we are incurring the expenses directly than when we paid a consistent administrative fee each quarter. |
54
Consolidated Results of Operations
The following table compares the operating results of Cypress Environmental Partners, L.P. for the years ended December 31:
| 2020 | 2019 | |||||||
| (in thousands) | ||||||||
| Revenues | $ | 205,996 | $ | 401,648 | ||||
| Costs of services | 177,484 | 347,924 | ||||||
| Gross margin | 28,512 | 53,724 | ||||||
| Operating costs and expense: | ||||||||
| General and administrative | 20,100 | 25,626 | ||||||
| Depreciation, amortization and accretion | 4,883 | 4,448 | ||||||
| Gain on asset disposals, net | (27 | ) | (25 | ) | ||||
| Operating income | 3,556 | 23,675 | ||||||
| Other income (expense): | ||||||||
| Interest expense, net | (4,028 | ) | (5,330 | ) | ||||
| Foreign currency gains | 107 | 222 | ||||||
| Other, net | 541 | 1,111 | ||||||
| Net income before income tax expense | 176 | 19,678 | ||||||
| Income tax expense | 542 | 2,254 | ||||||
| Net (loss) income | (366 | ) | 17,424 | |||||
| Net income attributable to noncontrolling interests | 1,049 | 1,410 | ||||||
| Net (loss) income attributable to limited partners | (1,415 | ) | 16,014 | |||||
| Net income attributable to preferred unitholder | 4,133 | 4,133 | ||||||
| Net (loss) income attributable to common unitholders | $ | (5,548 | ) | $ | 11,881 | |||
See the detailed discussion of elements of operating income (loss) by reportable segment below. See also Note 14 to our Consolidated Financial Statements included in “Item 8. – Financial Statement and Supplementary Data.”
The following is a discussion of significant changes in the non-segment related corporate other income and expenses for the years ended December 31, 2020 and 2019.
Interest expense. Interest expense primarily consists of interest on borrowings under our Credit Agreement, amortization of debt issuance costs, and unused commitment fees. Changes in interest expense resulted primarily from changes in the balance of outstanding debt and changes in interest rates. The interest rate on our Credit Agreement floats based on LIBOR, and changes in the LIBOR rate were the primary driver of changes in the interest rate during 2019 and 2020. In March and April 2020, in an abundance of caution, we borrowed a combined $39.1 million on the Credit Agreement to provide substantial liquidity to manage our business in light of the COVID-19 pandemic and the significant decline in the price of crude oil. In January, May, June, and September 2020, we repaid a combined $52.0 million on the Credit Agreement. The average debt balance outstanding and average interest rates are summarized in the table below:
| Year Ended December 31 | Average Debt Balance Outstanding (in thousands) | Average Interest Rate | ||||||
| 2020 | $ | 80,763 | 4.03 | % | ||||
| 2019 | $ | 81,400 | 5.78 | % | ||||
55
Foreign currency gains (losses). Our Canadian subsidiary has certain intercompany payables to our U.S.-based subsidiaries. Such intercompany payables and receivables among our consolidated subsidiaries are eliminated in our Consolidated Balance Sheets. We report currency translation adjustments on these intercompany payables and receivables within foreign currency gains (losses) in our Consolidated Statements of Operations. The net foreign currency gains during 2020 and 2019 resulted from the appreciation of the Canadian dollar relative to the U.S. dollar.
Other, net. Other income in 2019 includes a gain of $1.3 million of the settlement of litigation with a former subcontractor. Other expense in 2019 includes a loss of $0.5 million on the sale of pre-petition accounts receivable from Pacific Gas and Electric Company, which is a customer that filed for bankruptcy protection in 2019. Other income in 2020 and 2019 also includes royalty income, interest income, and income associated with our 25% interest in a water treatment facility that we account for under the equity method.
Income tax expense. We qualify as a partnership for income tax purposes, and therefore we generally do not pay income tax; instead, each owner reports his or her share of our income or loss on his or her individual tax return. Our income tax provision relates primarily to (1) our U.S. corporate subsidiaries that provide services to public utility customers, which do not appear to fit within the definition of qualified income as it is defined in the Internal Revenue Code, Regulations, and other guidance, which subjects this income to U.S. federal and state income taxes, (2) our Canadian subsidiary, which is subject to Canadian federal and provincial income taxes, and (3) certain other state income taxes, including the Texas franchise tax.
Income tax expenses decreased from $2.3 million in 2019 to $0.5 million in 2020, primarily due a decrease in income of our U.S. corporate subsidiary that provides services to public utility customers and a decrease in revenue that is subject to the Texas franchise tax in our Inspection Services and Pipeline and Process Services segments.
As a publicly-traded partnership, we are subject to a statutory requirement that 90% of our total gross income represent “qualifying income” (as defined by the Internal Revenue Code, related Treasury Regulations, and Internal Revenue Service pronouncements), determined on a calendar-year basis. Income generated by taxable corporate subsidiaries is excluded from this calculation. In 2020, substantially all our gross income, which consisted of $139.0 million of revenue (exclusive of the income generated by our taxable corporate subsidiaries), represented “qualifying income”. Certain inspection services are not qualifying income and we therefore have separate taxable entities that pay state and federal income tax on these earnings.
Net income (loss) attributable to noncontrolling interests. We own a 51% interest in CBI and a 49% interest in CF Inspection. The accounts of these subsidiaries are included within our Consolidated Financial Statements. The portion of the net income (loss) of these entities that is attributable to outside owners is reported in net income (loss) attributable to noncontrolling interests in our Consolidated Statements of Operations. Changes in the net income (loss) attributable to noncontrolling interests from 2019 to 2020 related primarily to changes in the net income generated by CBI.
Net income attributable to preferred unitholder. On May 29, 2018, we issued and sold $43.5 million of preferred equity. The holder of the preferred units is entitled to an annual return of 9.5% on this investment. This return is reported in net income attributable to preferred unitholder in the Consolidated Statements of Operations.
56
Segment Operating Results
Inspection Services
The following table summarizes the operating results of our Inspection Services segment for the years ended December 31, 2020 and 2019.
| Years Ended December 31 | ||||||||||||||||||||||||
| 2020 | % of
Revenue |
2019 | % of
Revenue |
Change | % Change | |||||||||||||||||||
| (in thousands, except average revenue and inspector data) | ||||||||||||||||||||||||
| Revenues | $ | 181,526 | $ | 371,994 | $ | (190,468 | ) | (51.2 | )% | |||||||||||||||
| Costs of services | 161,726 | 331,498 | (169,772 | ) | (51.2 | )% | ||||||||||||||||||
| Gross margin | 19,800 | 10.9 | % | 40,496 | 10.9 | % | (20,696 | ) | (51.1 | )% | ||||||||||||||
| General and administrative | 15,282 | 8.4 | % | 19,086 | 5.1 | % | (3,804 | ) | (19.9 | )% | ||||||||||||||
| Depreciation, amortization and accretion | 2,217 | 1.2 | % | 2,224 | 0.6 | % | (7 | ) | (0.3 | )% | ||||||||||||||
| Other | – | 1 | 0.0 | % | (1 | ) | (100.0 | )% | ||||||||||||||||
| Operating income | $ | 2,301 | 1.3 | % | $ | 19,185 | 5.2 | % | $ | (16,884 | ) | (88.0 | )% | |||||||||||
| Operating Data | ||||||||||||||||||||||||
| Average number of inspectors | 730 | 1,485 | (755 | ) | (50.8 | )% | ||||||||||||||||||
| Average revenue per inspector per week | $ | 4,769 | $ | 4,804 | $ | (35 | ) | (0.7 | )% | |||||||||||||||
| Revenue variance due to number of inspectors | $ | (187,758 | ) | |||||||||||||||||||||
| Revenue variance due to average revenue per inspector | $ | (2,710 | ) | |||||||||||||||||||||
Revenue. Revenue decreased $190.5 million in 2020 compared to 2019, due to a decrease in the average number of inspectors engaged (a decrease of 755 inspectors accounting for $187.8 million of the revenue decrease) and a decrease in the average revenue billed per inspector (accounting for $2.7 million of the revenue decrease). Revenues during 2019 benefited from the largest contract in the 18-year history of TIR, which was a single-source inspection services project in Texas. This project began in the fourth quarter of 2018, peaked in the second quarter of 2019, and continued with declining headcounts into 2020. We generated $8.0 million and $62.9 million of revenue from this project in 2020 and 2019, respectively. Our revenues during 2020 did not significantly benefit from any other large new projects. During 2020, the COVID-19 pandemic, combined with a significant decrease in crude oil prices resulting from reduced demand and an anticipated increase in supply from Saudi Arabia and Russia, led many of our customers to change their budgets and plans. Revenues of our subsidiary that serves public utility companies decreased by $19.1 million in 2020 compared to 2019, due in part to lower activity as a result of the COVID-19 pandemic. Revenues of our nondestructive examination service line decreased by $7.2 million in 2020 compared to 2019, due in part to lower activity as a result of the COVID-19 pandemic. The decrease in average revenue per inspector is due to changes in customer mix. Fluctuations in the average revenue per inspector are common, given that we charge different rates for different types of inspectors and different types of inspection services. In addition, certain of our customers pursued pricing concessions at the outset of the COVID-19 pandemic, which led us to reduce prices and to also reduce the compensation we could offer to our valued inspectors.
Costs of services. Costs of services decreased $169.8 million in 2020 compared to 2019, primarily related to a decrease in the average number of inspectors employed during the period.
Gross margin. Gross margin decreased $20.7 million in 2020 compared to 2019, as a result of lower revenues. The gross margin percentage was 10.9% in both 2020 and 2019. Our gross margin percentage reflects the fact that we have certain revenue associated with mileage and per diem reimbursements for our inspectors travelling away from home that is typically not entitled to any profit margin or mark up.
Gross margin in 2020 and 2019 benefited from the fact that we recognized $0.3 million and $0.2 million, respectively, of revenue on services performed in previous years. We had constrained recognition of this revenue until the expiration of a contract provision that had given the customer the opportunity to reopen negotiation of the fee paid for the services.
General and administrative. General and administrative expenses decreased by $3.8 million in 2020 compared to 2019, due primarily to a decrease in employee compensation expense through a combination of salary reductions, reductions in workforce, furloughs, hiring freezes, and reductions in incentive compensation and sales commission expense. Legal fees increased by $0.4 million as a result of costs associated with FLSA employment litigation and certain other employment-related lawsuits and claims. We also recorded general and administrative expense of $0.5 million and $0.1 million in 2020 and 2019, respectively, related to the completed or proposed settlements of various litigation matters. Bad debt expense increased by $0.4 million primarily due to new information that changed our estimates regarding the likelihood of collecting accounts receivable from a former customer. Travel and advertising costs decreased by $0.6 million as a result of the pandemic and the resultant slowdown in travel. Expenses we incurred for costs that were previously incurred by Holdings pursuant to the Omnibus Agreement were lower during 2020 than the administrative fee charged by Holdings during 2019; however, the benefit of this reduced expense was partially offset by increased expense resulting from a reassessment of the allocation of shared expenses to the various segments, which resulted in less expense being charged to the Environmental Services segment and more expense being charged to the Inspection Services segment in 2020.
Depreciation, amortization, and accretion. Depreciation, amortization, and accretion expense in 2020 was similar to depreciation, amortization and accretion expense during 2019.
57
Operating income. Operating income decreased by $16.9 million in 2020 compared to 2019, due primarily to the decrease in gross margin, partially offset by a decrease in general and administrative expenses.
Pipeline & Process Services
The following table summarizes the results of the Pipeline & Process Services segment for the years ended December 31, 2020 and 2019.
| Year Ended December 31 | ||||||||||||||||||||||||
| 2020 | % of
Revenue |
2019 | % of
Revenue |
Change | % Change | |||||||||||||||||||
| (in thousands, except average revenue and inspector data) | ||||||||||||||||||||||||
| Revenue | $ | 18,716 | $ | 19,337 | $ | (621 | ) | (3.2 | )% | |||||||||||||||
| Costs of services | 13,743 | 13,397 | 346 | 2.6 | % | |||||||||||||||||||
| Gross margin | 4,973 | 26.6 | % | 5,940 | 30.7 | % | (967 | ) | (16.3 | )% | ||||||||||||||
| General and administrative | 2,308 | 12.3 | % | 2,500 | 12.9 | % | (192 | ) | (7.7 | )% | ||||||||||||||
| Depreciation, amortization and accretion | 558 | 3.0 | % | 574 | 3.0 | % | (16 | ) | (2.8 | )% | ||||||||||||||
| Gain on asset disposals, net | (32 | ) | (0.2 | )% | (26 | ) | (0.1 | )% | (6 | ) | 23.1 | % | ||||||||||||
| Operating income | $ | 2,139 | 11.4 | % | $ | 2,892 | 15.0 | % | $ | (753 | ) | (26.0 | )% | |||||||||||
| Operating Data | ||||||||||||||||||||||||
| Average number of field personnel | 28 | 28 | — | 0.0 | % | |||||||||||||||||||
| Average revenue per field personnel per week | $ | 12,819 | $ | 13,245 | $ | (424 | ) | (3.2 | )% | |||||||||||||||
| Revenue variance due to number of field personnel | $ | — | ||||||||||||||||||||||
| Revenue variance due to average revenue per field personnel | $ | (621 | ) | |||||||||||||||||||||
Revenue. Revenue decreased $0.6 million in 2020 compared to 2019. Our Pipeline & Process Services segment generates more of its revenues from a smaller number of larger-scale projects than does our Inspection Services segment. As a result, the revenues of the Pipeline & Process Services segment can be significantly influenced by the ability to win a relatively small number of bids for hydrotesting projects. In 2020, 64% of the revenues in the Pipeline & Process Services segment were generated from the 10 largest projects.
Costs of services. Costs of services increased $0.3 million in 2020 compared to 2019. This increase was due in part to an increase in the utilization of contract labor as there was more overlap in the timing of projects in 2020 compared to 2019. In addition, one large project during 2020 generated a significantly lower margin than normal, due in part to unplanned delays that were not within our control.
Gross margin. Gross margin decreased $1.0 million in 2020 compared to 2019. The employees of the Pipeline & Process Services segment are full-time employees, and therefore primarily represent fixed costs (in contrast to the employees of the Inspection Services segment who perform work in the field, most of whom only earn wages when they are performing work for a customer and whose wages are therefore primarily variable costs). Because these employees were less than fully utilized in 2020 than in 2019, the gross margin percentage was lower. In addition, the gross margin percentage decreased in 2020 compared to 2019 due to an increase in the utilization of contract labor and due to unplanned delays that were not within our control on one large project during 2020.
General and administrative. General and administrative expenses primarily include compensation expense for office employees and general office expenses. These expenses decreased by $0.2 million in 2020 compared to 2019 due primarily to a decrease in incentive compensation expense resulting from the decrease in revenue of the business toward the latter part of 2020.
Depreciation, amortization, and accretion. Depreciation, amortization, and accretion expense includes depreciation of property and equipment and amortization of intangible assets associated with customer relationships, trade names, and noncompete agreements. Depreciation, amortization, and accretion expense in 2020 was similar to depreciation, amortization, and accretion expense in 2019.
Operating income. Operating income decreased by $0.8 million in 2020 compared to 2019. This decrease was due to lower gross margin of $1.0 million partially offset by a decrease of $0.2 million in general and administrative expenses.
58
Environmental Services
The following table summarizes the operating results of our Environmental Services segment for the years ended December 31, 2020 and 2019.
| Year Ended December 31 | ||||||||||||||||||||||||
| 2020 | % of
Revenue |
2019 | % of
Revenue |
Change | % Change | |||||||||||||||||||
| (in thousands, except per barrel data) | ||||||||||||||||||||||||
| Revenues | $ | 5,754 | $ | 10,317 | $ | (4,563 | ) | (44.2 | )% | |||||||||||||||
| Costs of services | 2,015 | 3,029 | (1,014 | ) | (33.5 | )% | ||||||||||||||||||
| Gross margin | 3,739 | 65.0 | % | 7,288 | 70.6 | % | (3,549 | ) | (48.7 | )% | ||||||||||||||
| General and administrative | 1,802 | 31.3 | % | 2,995 | 29.0 | % | (1,193 | ) | (39.8 | )% | ||||||||||||||
| Depreciation, amortization and accretion | 1,648 | 28.6 | % | 1,632 | 15.8 | % | 16 | 1.0 | % | |||||||||||||||
| Gain on asset disposals, net | 5 | 0.1 | % | — | 5 | |||||||||||||||||||
| Operating income | $ | 284 | 4.9 | % | $ | 2,661 | 25.8 | % | $ | (2,377 | ) | (89.3 | )% | |||||||||||
| Operating Data | ||||||||||||||||||||||||
| Total barrels of water processed | 7,932 | 13,416 | (5,484 | ) | (40.9 | )% | ||||||||||||||||||
| Average revenue per barrel processed (a) | $ | 0.73 | $ | 0.77 | $ | (0.04 | ) | (5.2 | )% | |||||||||||||||
| Revenue variance due to barrels processed | $ | (4,246 | ) | |||||||||||||||||||||
| Revenue variance due to revenue per barrel | $ | (317 | ) | |||||||||||||||||||||
| (a) | Average revenue per barrel processed is calculated by dividing revenues (which includes water treatment revenues, residual oil sales, and management fees) by the total barrels of saltwater processed. |
Revenue. Revenue of the Environmental Services segment decreased by $4.6 million in 2020 compared to 2019. The decrease in revenues was due primarily to a decrease of 5.5 million barrels in the volume of water processed and lower prices on the sale of recovered crude oil. Low commodity prices, an excess of supply, and low demand led to a significant reduction in activity by producers in North Dakota. Bakken Clearbrook oil pricing was under intense pressure during 2020, along with WTI oil prices. WTI oil prices, which were at $61.14 at December 31, 2019, decreased in January and February 2020, decreased even more sharply in March and April 2020, gradually increased to $40 per barrel in early July, and begin increasing in December to $48.35 at December 31, 2020. Pipeline capacity and storage constraints also adversely affected this market. Several prominent exploration and production customers elected to shut in their production instead of selling oil at the low market prices. The average price per barrel of recovered crude oil also decreased in 2020 compared to 2019. Revenues from the sale of recovered crude oil represented 3% and 6% of the revenue in the Environmental Services segment in 2020 and 2019, respectively.
Costs of services. Costs of services decreased by $1.0 million in 2020 compared to 2019 due in part to a decrease of $0.5 million in variable costs (such as chemical and utility expense) resulting from a decrease in volumes, a decrease of $0.3 million in compensation expense as a result of salary reductions and reductions in force, and a decrease of $0.2 million in repairs and maintenance expense.
Gross margin. Gross margin decreased $3.5 million in 2020 compared to 2019, due primarily to a $4.6 million decrease in revenue, partially offset by a $1.0 million decrease in cost of services.
General and administrative. General and administrative expenses include general overhead expenses such as employee compensation costs, insurance, property taxes, royalty expenses, and other miscellaneous expenses. These expenses decreased through a combination of salary reductions, reductions in workforce, furloughs, hiring freezes, reductions in incentive compensation expense, and other cost-cutting measures. Expenses we incurred for costs that were previously incurred by Holdings pursuant to the Omnibus Agreement were lower during 2020 than the administrative fee charged by Holdings during 2019. In addition, the decrease in general and administrative expenses was partially due to a reassessment of the allocation of shared expenses to the various segments, which resulted in less expense being charged to the Environmental Services segment and more expense being charged to the Inspection Services segment in 2020 than in 2019.
Depreciation, amortization, and accretion. Depreciation, amortization, and accretion expenses include depreciation of property and equipment and amortization of intangible assets associated with customer relationships, trade names, and noncompete agreements. Depreciation, amortization, and accretion expense in 2020 was similar to depreciation, amortization, and accretion expense in 2019.
Operating income. Operating income decreased by $2.4 million in 2020 compared to 2019. This decrease was due in part to a decrease in gross margin of $3.5 million partially offset by a decrease of $1.2 million in general and administrative expense.
59
Liquidity and Capital Resources
The working capital needs of the Inspection Services segment are substantial, driven by payroll costs and reimbursable expenses paid to our inspectors on a weekly basis. Please read “Risk Factors — Risks Related to Our Business — The working capital needs of the Inspection Services segment are substantial”, which could require us to seek additional financing that we may not be able to obtain on satisfactory terms, or at all. Consequently, our ability to develop and maintain sources of funds to meet our capital requirements is critical to our ability to meet our growth objectives. We expect that our future capital needs will be funded by future borrowings and the issuance of debt and equity securities. However, we may not be able to raise additional funds on desired or favorable terms or at all.
At December 31, 2020, our sources of liquidity included:
| ● | $17.9 million of cash on our Consolidated Balance Sheet at December 31, 2020 ($5.8 million of which was held by CBI); |
| ● | available borrowings under our Credit Agreement; and |
| ● | issuance of equity securities through our at-the-market equity program. |
We had outstanding borrowings of $62.6 million at December 31, 2020 (inclusive of finance lease obligations). At each quarter end, our borrowing capacity is limited by a leverage ratio in the Credit Agreement. The leverage ratio is calculated as the debt outstanding (inclusive of finance leases) divided by trailing-twelve-month EBITDA (as defined in the Credit Agreement). The maximum leverage ratio is 6.0 at December 31, 2020 and March 31, 2021, 5.3 at June 30, 2021, 4.5 at September 30, 2021, and 4.0 at December 31, 2021. At December 31, 2020, our leverage ratio was 5.8. As amended in March 2021, the Credit Agreement has a maximum borrowing capacity of $75.0 million.
In 2020, in light of the current market conditions, we made the difficult decision to temporarily suspend payment of common unit distributions. This has enabled us to retain more cash to manage our financing needs during these challenging market conditions. As amended in March 2021, the Credit Agreement contains significant limitations on our ability to pay cash distributions. We may only pay the following cash distributions:
| ● | distributions to common and preferred unitholders, to the extent of income taxes estimated to be payable by these unitholders resulting from allocations of our earnings; |
| ● | distributions to the preferred unitholder up to $1.1 million per year, if our leverage ratio is 4.0 or lower; and |
| ● | distributions to the noncontrolling interest owners of CBI and CF Inspection. |
The Credit Agreement matures on May 31, 2022. See further discussion below in the “Our Credit Agreement” section.
At-the-Market Equity Program
In April 2019, we established an at-the-market equity program (“ATM Program”), which will allow us to offer and sell common units from time to time, to or through the sales agent under the ATM Program. The maximum amount we may sell varies based on changes in the market value of the units. Currently, the maximum amount we may sell is $10 million. We are under no obligation to sell any common units under this program. As of the date of this filing, we have not sold any common units under the ATM Program and, as such, have not received any net proceeds or paid any compensation to the sales agent under the ATM Program.
Employee Unit Purchase Plan
In November 2020, we established an employee unit purchase plan (“EUPP”), which will allow us to offer and sell up to 500,000 common units. Employees can elect to have up to 10 percent of their annual base pay withheld to purchase common units, subject to terms and limitations of the EUPP. The purchase price of the common units is 95% of the volume weighted average of the closing sales prices of our common units on the ten immediately preceding trading days at the end of each offering period. There have been no common unit issuances under the EUPP.
60
Common Unit Distributions
The following table summarizes the distributions on common and subordinated units declared and paid since our initial public offering:
| Payment Date | Per Unit Cash Distributions | Total Cash Distributions | Total Cash Distributions to Affiliates (a) | |||||||||
| (in thousands) | ||||||||||||
| Total 2014 Distributions | $ | 1.104646 | $ | 13,064 | $ | 8,296 | ||||||
| Total 2015 Distributions | 1.625652 | 19,232 | 12,284 | |||||||||
| Total 2016 Distributions | 1.625652 | 19,258 | 12,414 | |||||||||
| Total 2017 Distributions | 1.036413 | 12,310 | 7,928 | |||||||||
| Total 2018 Distributions | 0.840000 | 10,019 | 6,413 | |||||||||
| February 14, 2019 | 0.210000 | 2,510 | 1,606 | |||||||||
| May 15, 2019 | 0.210000 | 2,531 | 1,622 | |||||||||
| August 14, 2019 | 0.210000 | 2,534 | 1,624 | |||||||||
| November 14, 2019 | 0.210000 | 2,534 | 1,627 | |||||||||
| Total 2019 Distributions | 0.840000 | 10,109 | 6,479 | |||||||||
| February 14, 2020 | 0.210000 | 2,534 | 1,627 | |||||||||
| May 15, 2020 | 0.210000 | 2,564 | 1,641 | |||||||||
| Total 2020 Distributions | 0.420000 | 5,098 | 3,268 | |||||||||
| Total Distributions (since IPO) | $ | 7.492363 | $ | 89,090 | $ | 57,082 | ||||||
| (a) | Approximately 64% of the Partnership’s outstanding common units at December 31, 2020 were held by affiliates. |
Preferred Unit Distributions
On May 29, 2018 we issued and sold in a private placement 5,769,231 Series A Preferred Units representing limited partner interests in the Partnership (the “Preferred Units”) for a cash purchase price of $7.54 per Preferred Unit, resulting in gross proceeds to the Partnership of $43.5 million. The purchaser of the Preferred Units is entitled to receive quarterly distributions that represent an annual return of 9.5% (which amounts to $4.1 million per year). Of this 9.5% annual return, we have the option to pay 7.0% in kind (in the form of issuing additional Preferred Units) for the first twelve quarters after the initial sale of the Preferred Units. Under the terms of our modified credit facility, we are restricted from paying any cash distributions unless our gross leverage is less than four times our trailing-twelve-month EBITDA (as defined in the Credit Agreement). The Preferred Units rank senior to our common units, and we must pay distributions on the Preferred Units (including any arrearages) before paying distributions on our common units.
61
The following table summarizes the distributions paid to our preferred unitholder:
| Payment Date | Cash Distributions | |||
| (in thousands) | ||||
| November 14, 2018 (a) | $ | 1,412 | ||
| Total 2018 Distributions | 1,412 | |||
| February 14, 2019 | 1,033 | |||
| May 15, 2019 | 1,033 | |||
| August 14, 2019 | 1,033 | |||
| November 14, 2019 | 1,034 | |||
| Total 2019 Distributions | 4,133 | |||
| February 14, 2020 | 1,033 | |||
| May 15, 2020 | 1,033 | |||
| August 14, 2020 | 1,033 | |||
| November 14, 2020 | 1,034 | |||
| Total 2020 Distributions | 4,133 | |||
| Total Distributions | $ | 9,678 | ||
| (a) | This distribution relates to the period from May 29, 2018 (date of preferred unit issuance) through September 30, 2018. |
CBI
CBI’s company agreement generally requires CBI to make an annual distribution to its members equal to or greater than the amount of CBI’s taxable income multiplied by the maximum federal income tax rate. In 2020, CBI declared and paid distributions of $2.8 million, of which $1.4 million was distributed to us and the remainder of which was distributed to noncontrolling interest owners. In 2018, CBI declared and paid distributions of $2.0 million, of which $1.0 million was distributed to us and the remainder of which was distributed to noncontrolling interest owners.
Cash Flows
The following table sets forth a summary of the net cash provided by (used in) operating, investing, and financing activities for the periods identified.
| Year Ended December 31 | ||||||||
| 2020 | 2019 | |||||||
| (in thousands) | ||||||||
| Net cash provided by operating activities | $ | 27,922 | $ | 18,179 | ||||
| Net cash used in investing activities | (1,654 | ) | (1,933 | ) | ||||
| Net cash used in financing activities | (23,977 | ) | (15,930 | ) | ||||
| Effect of exchange rates on cash | 2 | 4 | ||||||
| Net increase in cash and cash equivalents | $ | 2,293 | $ | 320 | ||||
Operating activities. In 2020, we generated net operating cash inflows of $27.9 million, consisting of a net loss of $0.4 million plus non-cash expenses of $7.7 million and net changes in working capital of $20.6 million. Non-cash expenses included depreciation, amortization, and accretion, and equity-based compensation expense, among others. The net change in working capital includes a net decrease of $33.6 million in accounts receivable, partially offset by a net increase of $0.9 million in prepaid expenses and other, and by a net decrease of $12.2 million in current liabilities. During periods of revenue growth, changes in working capital typically reduce operating cash flows, based on the fact that we pay our employees before we collect accounts receivable from our customers. During 2020, we experienced a decrease in inspectors in our Inspection Services segment, which reduced the need to expend cash for working capital.
62
In 2019, we generated operating cash flows of $18.2 million. Prior to consideration of changes in working capital, operating cash flows in 2019 were $23.5 million, consisting of net income of $17.4 million plus non-operating-cash expenses of $6.1 million (non-cash expenses include depreciation and amortization, equity-based compensation, foreign currency gains/losses, gain on litigation settlement, and loss on sale of accounts receivable, among others). In 2019, changes in working capital reduced operating cash flows by $5.3 million. During periods of revenue growth, changes in working capital typically reduce operating cash flows, based on the fact that we pay our employees before we collect our accounts receivable from our customers.
Investing activities. In 2020, net cash outflows from investing activities were $1.7 million, which included costs associated with a new software system for payroll and human resources management, field equipment for our Inspection Services and Pipeline & Process Services segments, and facility improvements for our Environmental Services segment.
In 2019, cash outflows for investing activities consisted of capital expenditures of $2.0 million, which were partially offset by less than $0.1 million in proceeds from fixed asset disposals. Capital expenditures in 2019 included the purchase of equipment (primarily for our nondestructive examination business) and costs associated with a new software system for payroll and human resources management that we implemented in early 2020.
Financing activities. In 2020, financing cash outflows primarily consisted of $12.9 million of net repayments on our revolving credit facility. In March and April 2020, in an abundance of caution, we borrowed a combined $39.1 million on the Credit Agreement to provide substantial liquidity to manage our business in light of the COVID-19 pandemic and the significant decline in the price of crude oil. In January, May, June and September 2020, we repaid a combined $52.0 million on the Credit Agreement. Financing cash outflows also included $5.1 million of distributions to common unitholders, $4.1 million of distributions to preferred unitholders, and $1.4 million of distributions to noncontrolling interests.
In 2019, cash outflows from financing activities included $1.2 million of net payments on our revolving credit facility. Financing cash outflows for 2020 also included $10.1 million of common unit distributions and $4.1 million of preferred unit distributions.
Working Capital
Our working capital (defined as current assets less current liabilities) was $30.3 million at December 31, 2020. Our Inspection Services and Pipeline & Process Services segments have substantial working capital needs, as we generally pay our field personnel on a weekly basis, but typically receive payment from our customers 45 to 90 days after the services have been performed. A substantial portion of our inspection services revenue is associated with mileage and per diem expense reimbursement for our inspectors that work away from their home on our clients' assets. We generally do not receive any markup or profit margin on these amounts. Several customers are re-visiting their policies and considering deploying more local inspectors. If this occurs, this will reduce our working capital requirements. Please read “Risk Factors — Risks Related to Our Business — The working capital needs of the Inspection Services segment are substantial, which could require us to seek additional financing that we may not be able to obtain on satisfactory terms, or at all.”
Capital Requirements
We generally have small capital expenditure requirements compared to many other master limited partnerships. Our Inspection Services segment does not generally require significant capital expenditures, other than the purchase of nondestructive examination technology. Our inspectors provide their own four wheel drive vehicles and receive mileage reimbursement. Our Pipeline & Process Services segment has both maintenance and growth capital needs for equipment and vehicles in order to perform hydrostatic testing and other integrity procedures. Our Environmental Services Segment has minimal capital expenditure requirements for the maintenance of existing water treatment facilities. We do not plan on investing in any growth capital in this segment. Our partnership agreement requires that we categorize our capital expenditures as either maintenance capital expenditures or expansion capital expenditures.
| ● | Maintenance capital expenditures are those cash expenditures that will enable us to maintain our operating capacity or operating income over the long-term. Maintenance capital expenditures include expenditures to maintain equipment reliability, integrity, and safety, as well as to address environmental laws and regulations. Maintenance capital expenditures, inclusive of finance lease obligation payments, were $0.7 million for each of the years ended December 31, 2020 and 2019, respectively (cash basis). |
63
| ● | Expansion capital expenditures are those capital expenditures that we expect will increase our operating capacity or operating income over the long-term. Expansion capital expenditures include the acquisition of assets or businesses and the construction or development of additional water treatment capacity, to the extent such expenditures are expected to expand our long-term operating capacity or operating income. Expansion capital expenditures were $1.3 million and $1.5 million in 2020 and 2019, respectively (cash basis). |
Future expansion capital expenditures may vary significantly from period to period based on the investment opportunities available. We expect to fund future capital expenditures from cash flows generated from our operations, borrowings under our Credit Agreement, the issuance of additional partnership units, or debt offerings. As we expand into new inspection markets such as municipal water, municipal sewer, electrical transmission, bridges, among others, we should be able to use a lot of our NDE equipment. However, we will need to invest in additional growth capital for attractive opportunities to enter these new markets.
Credit Agreement
We are party to a credit agreement (the “Credit Agreement”) with a syndicate of seven banks, with Deutsche Bank Trust Company Americas (“DB”) serving as the Administrative Agent. DB has served as our agent since 2013. The obligations under the Credit Agreement are secured by a first priority lien on substantially all of our assets.
The Credit Agreement has been amended several times since inception and most recently in May 2018 and again in March 2021. Both recent amendments reduced the borrowing capacity following two industry downturns. After the March 2021 amendment, the Credit Agreement has a total capacity of $75.0 million and matures on May 31, 2022.
Outstanding borrowings at December 31, 2020 and December 31, 2019 were $62.0 million and $74.9 million, respectively, and are reported in our Consolidated Balance Sheets as long-term debt. Outstanding borrowings less cash and cash equivalents was $44.1 million as of December 31, 2020. The average debt balance outstanding in 2020 and 2019 was $80.8 million and $81.4 million, respectively. In March and April 2020, in an abundance of caution, we borrowed a combined $39.1 million on the Credit Agreement to provide substantial liquidity to manage our business in light of the COVID-19 pandemic and the significant decline in the price of crude oil. In January, May, June, and September 2020, we repaid a combined $52.0 million on the Credit Agreement.
All borrowings under the Credit Agreement bear interest, at our option, on a leveraged-based grid pricing at (i) a base rate plus a margin of 2.00% to 3.75% per annum (“Base Rate Borrowings”) or (ii) an adjusted LIBOR rate plus a margin of 3.00% to 4.75% per annum (“LIBOR Borrowings”). The applicable margin is determined based on our leverage ratio, as defined in the Credit Agreement. Under the March 2021 amendment, the applicable margins are 0.50% to 0.75% higher (depending on the leverage ratio) than they were prior to the amendment. Interest on Base Rate Borrowings is payable monthly. Interest on LIBOR Borrowings is paid upon maturity of the underlying LIBOR contract, but no less often than quarterly. Commitment fees are charged at a rate of 0.50% on any unused credit and are payable quarterly. Interest paid in 2020 and 2019 was $3.4 million and $4.8 million, respectively, including commitment fees. The interest rate on our borrowings ranged from 3.33% to 4.80% in 2020 and 4.70% to 6.02% in 2019.
The Credit Agreement contains various customary covenants and restrictive provisions. The Credit Agreement also requires us to maintain certain financial covenants, including a leverage ratio and an interest coverage ratio. The interest coverage ratio is calculated as the trailing-twelve-month EBITDA (as defined in the Credit Agreement) divided by trailing-twelve-month pro forma interest expense (as defined in the Credit Agreement). The minimum interest coverage ratio is 3.0 at each quarter end. At December 31, 2020, our interest coverage ratio was 4.7. The leverage ratio is calculated as the gross debt outstanding (inclusive of finance leases) divided by trailing-twelve-month EBITDA (as defined in the Credit Agreement). The maximum leverage ratio is 6.0x at December 31, 2020 and March 31, 2021, 5.3x at June 30, 2021, 4.5x at September 30, 2021, and 4.0x at December 31, 2021. At December 31, 2020, our leverage ratio was 5.8.
As of December 31, 2020, we were in compliance with all covenants of the Credit Agreement (as amended in March 2021). We currently are forecasting a sufficient level of EBITDA to remain in compliance with the financial covenants in the Credit Agreement throughout the term of the Credit Agreement. However, maintaining a sufficient level of EBITDA will be dependent on the level of activity in the markets we serve and on our ability to win awards for work from our customers, and may require us to sell common units through our at-the-market equity program to raise proceeds to repay debt and/or to delay reimbursements to affiliates on a short-term basis. It is reasonably possible that we could fail to meet one or both of the financial covenant ratios. If this were to occur, and if we were unable to obtain from the lenders a waiver of the covenant violation, we would be in default on the Credit Agreement. Upon the occurrence and during the continuation of an event of default, subject to the terms and conditions of the Credit Agreement, the lenders may declare any outstanding principal, together with any accrued and unpaid interest, to be immediately due and payable and may exercise the other remedies set forth or referred to in the Credit Agreement.
The Credit Agreement contains significant limitations on our ability to pay cash distributions. We may only pay the following cash distributions:
| ● | distributions to common and preferred unitholders, to the extent of income taxes estimated to be payable by these unitholders resulting from allocations of our earnings; |
| ● | distributions to the preferred unitholder up to $1.1 million per year if our leverage ratio is 4.0 or lower; and |
| ● | distributions to the noncontrolling interest owners of CBI and CF Inspection. |
In addition, the Credit Agreement restricts our ability to redeem or repurchase our equity interests.
The Credit Agreement requires us to make payments to reduce the outstanding balance if, for any consecutive period of five business days, our cash on hand (less amounts expected to be paid in the following five business days) exceeds $10.0 million.
We incurred certain debt issuance costs at the inception of the Credit Agreement, which we were amortizing on a straight-line basis over the original term of the Credit Agreement. Upon amending the Credit Agreement in May 2018, we wrote off $0.1 million of these debt issuance costs and reported this expense within debt issuance cost write-off in our Consolidated Statement of Operations for 2018, which represented the portion of the unamortized debt issuance costs attributable to lenders who were no longer participating in the credit facility subsequent to the amendment. The remaining debt issuance costs associated with the inception of the Credit Agreement, along with $1.3 million of debt issuance costs associated with the May 2018 amendment, were being amortized on a straight-line basis over the remaining term of the Credit Agreement. Debt issuance costs total $0.2 million and $0.8 million at December 31, 2020 and December 31, 2019, respectively, and are reported as debt issuance costs, net on the Consolidated Balance Sheets. In 2021, we incurred $1.0 million of debt issuance costs related to the March 2021 amendment to the Credit Agreement.
64
Off-Balance Sheet Arrangements
We do not have any off-balance sheet or hedging arrangements.
| ITEM 7A. | QUANTITATIVE AND QUALITATIVE DISCLOSURES ABOUT MARKET RISK |
We are exposed to market risk, including the effects of adverse changes in commodity prices and interest rates as described below.
The primary objective of the following information is to provide forward-looking quantitative and qualitative information about our potential exposure to market risks. The term “market risk” refers to the risk of loss arising from adverse changes in oil, natural gas, and natural gas liquids prices and interest rates. The disclosures are not meant to be precise indicators of expected future losses, but rather indicators of reasonably possible losses. None of our market risk sensitive instruments were entered into for speculative trading purposes.
Commodity Price Risk
Our customers are regularly exposed to commodity price risk. Less than 1% of our consolidated revenues in 2020 and 2019 were directly derived from sales of crude oil. A hypothetical change in crude oil prices of 10% would result in an increase or decrease of our revenues derived from sales of commodities by less than $0.1 million. Increases or decreases in commodity prices can also result in changes in demand for our water treatment, inspection services, and pipeline and process services, resulting in an increase or decrease of our revenues and gross margins.
Crude oil prices decreased significantly in 2020, due in part to decreased demand as a result of the worldwide COVID-19 pandemic. This decline in oil prices led many of our customers to change their budgets and plans, which decreased their spending on drilling, completions, and exploration. This had an adverse effect on construction of new pipelines, gathering systems, and related energy infrastructure. Lower exploration and production activity also affected the midstream industry and to delays and cancellations of projects. It is also possible that our customers may elect to defer maintenance activities on their infrastructure. Such developments would reduce our opportunities to generate revenues. It is impossible at this time to determine what may occur, as customer plans will evolve over time. It is possible that the cumulative nature of these events could have a material adverse effect on our results of operations and financial position. For further discussion of the volatility of crude oil prices, please read “Risk Factors”.
Interest Rate Risk
The interest rate on our Credit Agreement floats based on LIBOR, and as a result we have exposure to changes in interest rates on this indebtedness, which was $62.0 million as of December 31, 2020 and $74.9 million as of December 31, 2019. A hypothetical change in interest rates of 1.0% would have resulted in an increase or decrease in our annual interest expense of approximately $0.8 million for both 2020 and 2019, respectively.
The credit markets have recently experienced historical lows in interest rates. It is possible that monetary policy will tighten, resulting in higher interest rates to counter possible inflation. Interest rates in the future could be higher than current levels, causing our financing costs to increase accordingly.
Counterparty and Customer Credit Risk
Our credit exposure generally relates to accounts receivable for services we have provided to our customers. If significant customers were to have credit or financial problems resulting in a delay or failure to pay the amounts they owe to us, this could have a material adverse effect on our business, financial condition, results of operations, or cash flows. The current adverse market conditions could have a material adverse effect on the financial position of our customers, which could increase the risk that we are unable to collect accounts receivable from our customers. We would aggressively act to protect our rights in any such event, as we have done in the past.
A former customer of our Inspection Services segment, Sanchez Energy Corporation and certain of its affiliates (collectively, “Sanchez”), filed for bankruptcy protection in August 2019. As of December 31, 2020, we have $0.5 million of pre-petition accounts receivable from Sanchez. We filed liens to secure $0.4 million of these accounts receivable from Sanchez, although these liens may prove to be ineffective in our efforts to collect the pre-petition accounts receivable from Sanchez as there are other parties that have secured higher priority liens on the same assets. We have recorded an allowance of $0.5 million against these accounts receivable from Sanchez as of December 31, 2020.
65
ITEM 8. FINANCIAL STATEMENTS AND SUPPLEMENTARY DATA
The following information is included in this Item 8:
66
Report of Independent Registered Public Accounting Firm
To the Limited Partners of Cypress Environmental Partners, L.P.
and the Board of Directors of Cypress Environmental Partners, GP, LLC,
General Partner of Cypress Environmental Partners, L.P.
Opinion on the Financial Statements
We have audited the accompanying consolidated balance sheets of Cypress Environmental Partners, L.P. (the “Partnership”) as of December 31, 2020 and 2019, and the related consolidated statements of operations, comprehensive income (loss), owners’ equity and cash flows for each of the three years in the period ended December 31, 2020, and the related notes (collectively referred to as the “consolidated financial statements”). In our opinion, the consolidated financial statements referred to above present fairly, in all material respects, the consolidated financial position of the Partnership at December 31, 2020 and 2019, and the results of its operations and its cash flows for each of the three years in the period ended December 31, 2020, in conformity with U.S. generally accepted accounting principles.
Basis for Opinion
These consolidated financial statements are the responsibility of the Partnership's management. Our responsibility is to express an opinion on the Company’s consolidated financial statements based on our audits. We are a public accounting firm registered with the PCAOB and are required to be independent with respect to the Partnership in accordance with the U.S. federal securities laws and the applicable rules and regulations of the Securities and Exchange Commission and the PCAOB.
We conducted our audits in accordance with the standards of the PCAOB. Those standards require that we plan and perform the audit to obtain reasonable assurance about whether the consolidated financial statements are free of material misstatement, whether due to error or fraud. The Partnership is not required to have, nor were we engaged to perform, an audit of its internal control over financial reporting. As part of our audits we are required to obtain an understanding of internal control over financial reporting but not for the purpose of expressing an opinion on the effectiveness of the Partnership’s internal control over financial reporting. Accordingly, we express no such opinion.
Our audits included performing procedures to assess the risks of material misstatement of the consolidated financial statements, whether due to error or fraud, and performing procedures that respond to those risks. Such procedures included examining, on a test basis, evidence regarding the amounts and disclosures in the consolidated financial statements. Our audits also included evaluating the accounting principles used and significant estimates made by management, as well as evaluating the overall presentation of the consolidated financial statements. We believe that our audits provide a reasonable basis for our opinion.
| 67 |
Critical Audit Matter
The critical audit matters communicated below are matters arising from the current period audit of the financial statements that were communicated or required to be communicated to the audit committee and that: (1) relate to accounts or disclosures that are material to the financial statements and (2) involved our especially challenging, subjective, or complex judgments. The communication of critical audit matters does not alter in any way our opinion on the consolidated financial statements, taken as a whole, and we are not, by communicating the critical audit matters below, providing separate opinions on the critical audit matters or on the accounts or disclosure to which they relate.
| Goodwill Impairment Assessment | ||
| Description of the Matter |
At December 31, 2020, the Partnership's goodwill was $50.4 million, of which $40.3 million relates to the Inspection Services segment and $10.1 million relates to the Environmental Services segment. As discussed in Note 2 to the consolidated financial statements, goodwill is tested annually on November 1 (or at other dates if events or changes in circumstances indicate the carrying value of goodwill may be impaired) for impairment at the reporting unit level. The Partnership considered the decline in the price of crude oil during the first quarter of 2020 and the loss of the largest customer at one of the Partnership’s highest volume facilities in the third quarter of 2020 as potential indicators of impairment, and thus performed quantitative goodwill impairment analyses for the Environmental Services segment.
Auditing management's goodwill impairment analysis was complex and highly judgmental and required the involvement of specialists due to the significant estimation required to determine the fair value of the reporting units. In particular, the fair value estimates were sensitive to significant assumptions, such as changes in the discount rate, revenue growth rate, gross margin, and terminal value, which are affected by expectations about future market or economic conditions, including future commodity prices.
| |
| How We Addressed the Matter in Our Audit | To test the estimated fair value of the Environmental Services reporting unit, we performed audit procedures that included, among others, assessing methodologies and testing the significant assumptions discussed above and the underlying data used by the Partnership in its analyses. We compared the significant assumptions used by management to current industry and economic trends and also by assessing the historical accuracy of management's estimates. For example, we compared the revenue growth rate in the prospective financial data used by management to analysts’ forecasted commodity prices and historical performance. We performed sensitivity analyses of significant assumptions to evaluate the changes in the fair value of the reporting unit that would result from changes in the assumptions. In addition, we tested the reconciliation of the fair value of the Partnership’s reporting units to the market capitalization of the Partnership. We also involved a valuation specialist to assist us in our evaluation of the valuation methodologies applied and evaluating the significant assumptions in the fair value estimate. | |
| Risk and uncertainty related to forecasted debt covenant compliance | ||
| Description of the Matter |
At December 31, 2020, the Partnership's outstanding borrowings on its Credit Agreement were $62.0 million. As discussed in Note 6 to the consolidated financial statements, the Partnership’s Credit Agreement requires maintenance of certain financial covenants, including a leverage ratio and an interest coverage ratio. Failure to maintain the covenants, or to obtain from the lenders a waiver of a covenant violation, would result in a default on the Credit Agreement. Upon the occurrence and during the continuation of an event of default, subject to the terms and conditions of the Credit Agreement, the lenders may declare any outstanding principal, together with any accrued and unpaid interest, to be immediately due and payable and may exercise the other remedies set forth or referred to in the Credit Agreement. The Partnership has disclosed that it is reasonably possible it could fail to meet one or both financial covenants. Auditing management’s assessment of the likelihood of compliance with the financial covenants was complex and highly judgmental. In particular, projections of Consolidated EBITDA, as defined in the Credit Agreement, were sensitive to significant assumptions, primarily revenue growth rates.
| |
| How We Addressed the Matter in Our Audit | To test management’s forecasted debt covenant compliance, our audit procedures included, among others, testing the significant assumption discussed above and the underlying data used by the Partnership in its forecast of Consolidated EBITDA. For example, we compared the revenue growth rates used by management to historical performance, current macroeconomics trends, current operating trends and publicly available data. We performed sensitivity analyses of certain significant assumptions to evaluate the changes in forecasted Consolidated EBITDA and its effect on debt covenant compliance that would result from changes in the assumptions. We further evaluated management’s disclosure in the consolidated financial statements regarding the risks and uncertainties associated with management’s forecast. |
/s/ Ernst & Young LLP
We have served as the Partnership’s auditor since 2012.
Tulsa, Oklahoma
March 22, 2021
68
CYPRESS ENVIRONMENTAL PARTNERS, L.P.
As of December 31, 2020 and 2019
(in thousands)
| December 31, 2020 | December 31, 2019 | |||||||
| ASSETS | ||||||||
| Current assets: | ||||||||
| Cash and cash equivalents | $ | 17,893 | $ | 15,700 | ||||
| Trade accounts receivable, net | 18,420 | 52,524 | ||||||
| Prepaid expenses and other | 2,033 | 988 | ||||||
| Total current assets | 38,346 | 69,212 | ||||||
| Property and equipment: | ||||||||
| Property and equipment, at cost | 26,929 | 26,499 | ||||||
| Less: Accumulated depreciation | 16,470 | 13,738 | ||||||
| Total property and equipment, net | 10,459 | 12,761 | ||||||
| Intangible assets, net | 17,386 | 20,063 | ||||||
| Goodwill | 50,389 | 50,356 | ||||||
| Finance lease right-of-use assets, net | 607 | 600 | ||||||
| Operating lease right-of-use assets | 1,987 | 2,942 | ||||||
| Debt issuance costs, net | 242 | 803 | ||||||
| Other assets | 570 | 605 | ||||||
| Total assets | $ | 119,986 | $ | 157,342 | ||||
| LIABILITIES AND OWNERS' EQUITY | ||||||||
| Current liabilities: | ||||||||
| Accounts payable | $ | 2,070 | $ | 3,529 | ||||
| Accounts payable - affiliates | 58 | 1,167 | ||||||
| Accrued payroll and other | 4,876 | 14,850 | ||||||
| Income taxes payable | 328 | 1,092 | ||||||
| Finance lease obligations | 250 | 183 | ||||||
| Operating lease obligations | 439 | 459 | ||||||
| Total current liabilities | 8,021 | 21,280 | ||||||
| Long-term debt | 62,029 | 74,929 | ||||||
| Finance lease obligations | 300 | 359 | ||||||
| Operating lease obligations | 1,549 | 2,425 | ||||||
| Other noncurrent liabilities | 182 | 158 | ||||||
| Total liabilities | 72,081 | 99,151 | ||||||
| Commitments and contingencies - Note 13 | ||||||||
| Owners' equity: | ||||||||
| Partners’ capital: | ||||||||
| Common units (12,213 and 12,068 units outstanding at December 31, 2020 and 2019, respectively) | 27,507 | 37,334 | ||||||
| Preferred units (5,769 units outstanding at December 31, 2020 and 2019) | 44,291 | 44,291 | ||||||
| General partner | (25,876 | ) | (25,876 | ) | ||||
| Accumulated other comprehensive loss | (2,655 | ) | (2,577 | ) | ||||
| Total partners' capital | 43,267 | 53,172 | ||||||
| Noncontrolling interests | 4,638 | 5,019 | ||||||
| Total owners' equity | 47,905 | 58,191 | ||||||
| Total liabilities and owners' equity | $ | 119,986 | $ | 157,342 | ||||
See accompanying notes.
69
CYPRESS ENVIRONMENTAL PARTNERS, L.P.
Consolidated Statements of Operations
For the Years Ended December 31, 2020, 2019 and 2018
(in thousands, except per unit data)
| 2020 | 2019 | 2018 | ||||||||||
| Revenues | $ | 205,996 | $ | 401,648 | $ | 314,960 | ||||||
| Costs of services | 177,484 | 347,924 | 270,914 | |||||||||
| Gross margin | 28,512 | 53,724 | 44,046 | |||||||||
| Operating costs and expense: | ||||||||||||
| General and administrative | 20,100 | 25,626 | 23,744 | |||||||||
| Depreciation, amortization and accretion | 4,883 | 4,448 | 4,404 | |||||||||
| Gain on asset disposals, net | (27 | ) | (25 | ) | (4,108 | ) | ||||||
| Operating income | 3,556 | 23,675 | 20,006 | |||||||||
| Other income (expense): | ||||||||||||
| Interest expense, net | (4,028 | ) | (5,330 | ) | (6,206 | ) | ||||||
| Debt issuance cost write-off | — | — | (114 | ) | ||||||||
| Foreign currency gains (losses) | 107 | 222 | (643 | ) | ||||||||
| Other, net | 541 | 1,111 | 373 | |||||||||
| Net income before income tax expense | 176 | 19,678 | 13,416 | |||||||||
| Income tax expense | 542 | 2,254 | 1,318 | |||||||||
| Net (loss) income | (366 | ) | 17,424 | 12,098 | ||||||||
| Net income attributable to noncontrolling interests | 1,049 | 1,410 | 685 | |||||||||
| Net (loss) income attributable to limited partners | (1,415 | ) | 16,014 | 11,413 | ||||||||
| Net income attributable to preferred unitholder | 4,133 | 4,133 | 2,445 | |||||||||
| Net (loss) income attributable to common unitholders | $ | (5,548 | ) | $ | 11,881 | $ | 8,968 | |||||
| Net (loss) income per common limited partner unit: | ||||||||||||
| Basic | $ | (0.46 | ) | $ | 0.99 | $ | 0.75 | |||||
| Diluted | $ | (0.46 | ) | $ | 0.88 | $ | 0.72 | |||||
| Weighted average common units outstanding: | ||||||||||||
| Basic | 12,181 | 12,039 | 11,929 | |||||||||
| Diluted | 12,181 | 18,289 | 15,757 | |||||||||
See accompanying notes.
70
CYPRESS ENVIRONMENTAL PARTNERS, L.P.
Consolidated Statements of Comprehensive (Loss) Income
For the Years Ended December 31, 2020, 2019 and 2018
(in thousands)
| 2020 | 2019 | 2018 | ||||||||||
| Net (loss) income | $ | (366 | ) | $ | 17,424 | $ | 12,098 | |||||
| Other comprehensive (loss) income - foreign currency translation | (78 | ) | (163 | ) | 263 | |||||||
| Comprehensive (loss) income | $ | (444 | ) | $ | 17,261 | $ | 12,361 | |||||
| Comprehensive income attributable to preferred unitholders | 4,133 | 4,133 | 2,445 | |||||||||
| Comprehensive income attributable to noncontrolling interests | 1,049 | 1,410 | 685 | |||||||||
| Comprehensive (loss) income attributable to common unitholders | $ | (5,626 | ) | $ | 11,718 | $ | 9,231 | |||||
See accompanying notes.
71
CYPRESS ENVIRONMENTAL PARTNERS, L.P.
Consolidated Statement of Owners' Equity
For the Years Ended December 31, 2020, 2019 and 2018
(in thousands)
| Common
Units |
Preferred
Units |
General
Partner |
Accumulated Other Comprehensive Gain (Loss) | Noncontrolling Interests | Total Owners' Equity | |||||||||||||||||||
| Owners’ equity at December 31, 2017 | $ | 34,614 | $ | — | $ | (25,876 | ) | $ | (2,677 | ) | $ | 3,924 | $ | 9,985 | ||||||||||
| Net income | 8,968 | 2,445 | — | — | 685 | 12,098 | ||||||||||||||||||
| Issuance of preferred units, net | — | 43,258 | — | — | — | 43,258 | ||||||||||||||||||
| Foreign currency translation adjustment | — | — | — | 263 | — | 263 | ||||||||||||||||||
| Distributions | (10,019 | ) | (1,412 | ) | — | — | (1,000 | ) | (12,431 | ) | ||||||||||||||
| Equity-based compensation | 1,247 | — | — | — | — | 1,247 | ||||||||||||||||||
| Taxes paid related to net share settlement of equity-based compensation | (133 | ) | — | — | — | — | (133 | ) | ||||||||||||||||
| Owners' equity at December 31, 2018 | 34,677 | 44,291 | (25,876 | ) | (2,414 | ) | 3,609 | 54,287 | ||||||||||||||||
| Net income | 11,881 | 4,133 | — | — | 1,410 | 17,424 | ||||||||||||||||||
| Foreign currency translation adjustment | — | — | — | (163 | ) | — | (163 | ) | ||||||||||||||||
| Distributions | (10,109 | ) | (4,133 | ) | — | — | — | (14,242 | ) | |||||||||||||||
| Equity-based compensation | 1,107 | — | — | — | — | 1,107 | ||||||||||||||||||
| Taxes paid related to net share settlement of equity-based compensation | (222 | ) | — | — | — | — | (222 | ) | ||||||||||||||||
| Owners' equity at December 31, 2019 | 37,334 | 44,291 | (25,876 | ) | (2,577 | ) | 5,019 | 58,191 | ||||||||||||||||
| Net (loss) income | (5,548 | ) | 4,133 | — | — | 1,049 | (366 | ) | ||||||||||||||||
| Foreign currency translation adjustment | — | — | — | (78 | ) | — | (78 | ) | ||||||||||||||||
| Distributions | (5,098 | ) | (4,133 | ) | — | — | (1,430 | ) | (10,661 | ) | ||||||||||||||
| Equity-based compensation | 961 | — | — | — | — | 961 | ||||||||||||||||||
| Taxes paid related to net share settlement of equity-based compensation | (142 | ) | — | — | — | — | (142 | ) | ||||||||||||||||
| Owners' equity at December 31, 2020 | $ | 27,507 | $ | 44,291 | $ | (25,876 | ) | $ | (2,655 | ) | $ | 4,638 | $ | 47,905 | ||||||||||
See accompanying notes.
72
CYPRESS ENVIRONMENTAL PARTNERS, L.P.
Consolidated Statements of Cash Flows
For the Years Ended December 31, 2020, 2019 and 2018
(in thousands)
| 2020 | 2019 | 2018 | ||||||||||
| Operating activities: | ||||||||||||
| Net (loss) income | $ | (366 | ) | $ | 17,424 | $ | 12,098 | |||||
| Adjustments to reconcile net (loss) income to net cash provided by operating activities: | ||||||||||||
| Depreciation, amortization and accretion | 5,815 | 5,537 | 5,480 | |||||||||
| Gain on asset disposals, net | (27 | ) | (25 | ) | (4,108 | ) | ||||||
| Interest expense from debt issuance cost amortization | 580 | 533 | 560 | |||||||||
| Debt issuance cost write-off | — | — | 114 | |||||||||
| Equity-based compensation expense | 961 | 1,107 | 1,247 | |||||||||
| Equity in earnings of investee | (249 | ) | (214 | ) | (217 | ) | ||||||
| Distributions from investee | 288 | 75 | 175 | |||||||||
| Deferred tax (expense) benefit, net | — | (36 | ) | 51 | ||||||||
| Foreign currency (gains) losses | (107 | ) | (222 | ) | 643 | |||||||
| Bad debt expense, net of recoveries | 470 | 63 | 4 | |||||||||
| Gain on litigation settlement | — | (1,254 | ) | — | ||||||||
| Loss on sale of accounts receivable | — | 515 | — | |||||||||
| Changes in assets and liabilities: | ||||||||||||
| Trade accounts receivable | 33,634 | (4,310 | ) | (7,169 | ) | |||||||
| Prepaid expenses and other | (891 | ) | 136 | 1,004 | ||||||||
| Accounts payable and accounts payable - affiliates | (1,453 | ) | (3,681 | ) | 2,273 | |||||||
| Accrued payroll and other | (9,968 | ) | 2,175 | 3,167 | ||||||||
| Income taxes payable | (765 | ) | 356 | 87 | ||||||||
| Net cash provided by operating activities | 27,922 | 18,179 | 15,409 | |||||||||
| Investing activities: | ||||||||||||
| Proceeds from fixed asset disposals, including insurance proceeds | 41 | 43 | 12,769 | |||||||||
| Purchases of property and equipment | (1,695 | ) | (1,976 | ) | (5,762 | ) | ||||||
| Net cash (used in) provided by investing activities | (1,654 | ) | (1,933 | ) | 7,007 | |||||||
| Financing activities: | ||||||||||||
| Issuance of preferred units, net of issuance costs | — | — | 43,258 | |||||||||
| Borrowings on credit facility | 39,100 | 7,800 | 2,500 | |||||||||
| Payments on credit facility | (52,000 | ) | (9,000 | ) | (63,271 | ) | ||||||
| Debt issuance cost payments | (19 | ) | (75 | ) | (1,327 | ) | ||||||
| Repayments on finance lease obligations | (255 | ) | (191 | ) | (62 | ) | ||||||
| Taxes paid related to net share settlement of equity-based compensation | (142 | ) | (222 | ) | (133 | ) | ||||||
| Distributions | (10,661 | ) | (14,242 | ) | (12,431 | ) | ||||||
| Net cash used in financing activities | (23,977 | ) | (15,930 | ) | (31,466 | ) | ||||||
| Effect of exchange rates on cash | 2 | 4 | (17 | ) | ||||||||
| Net increase (decrease) in cash and cash equivalents | 2,293 | 320 | (9,067 | ) | ||||||||
| Cash and cash equivalents, beginning of period (includes restricted cash equivalents of $551 at December 31, 2019 and 2018, and $490 at December 31, 2017) | 16,251 | 15,931 | 24,998 | |||||||||
| Cash and cash equivalents, end of period (includes restricted cash equivalents of $651 at December 31, 2020 and $551 at December 31, 2019 and 2018) | $ | 18,544 | $ | 16,251 | $ | 15,931 | ||||||
| Non-cash items: | ||||||||||||
| Accounts payable and accrued payroll and other excluded from capital expenditures | $ | 5 | $ | 1,148 | $ | 25 | ||||||
| Acquisitions of finance leases included in liabilities | $ | 247 | $ | 357 | $ | 400 | ||||||
| Supplemental cash flow disclosures: | ||||||||||||
| Cash taxes paid | $ | 1,487 | $ | 1,980 | $ | 1,174 | ||||||
| Cash interest paid | $ | 3,374 | $ | 4,783 | $ | 5,781 | ||||||
See accompanying notes.
73
CYPRESS ENVIRONMENTAL PARTNERS, L.P.
Notes to Consolidated Financial Statements
| 1. | Organization and Operations |
Cypress Environmental Partners, L.P. (“we”, “us”, “our”, or the “Partnership”) is a Delaware limited partnership formed in 2013. We offer essential services that help protect the environment and ensure sustainability. We provide a wide range of environmental services including independent inspection, integrity, and support services for pipeline and energy infrastructure owners and operators and public utilities. We also provide water pipelines, hydrocarbon recovery, disposal, and water treatment services. Trading of our common units began January 15, 2014 on the New York Stock Exchange under the symbol “CELP”. Our business is organized into the Inspection Services (“Inspection Services”), Pipeline & Process Services (“Pipeline & Process Services”), and Water and Environmental Services (“Environmental Services”) segments.
The Inspection Services segment generates revenue by providing essential environmental services including inspection and integrity services on a variety of infrastructure assets including midstream pipelines, gathering systems, and distribution systems. Services include nondestructive examination, in-line inspection support, pig tracking, survey, data gathering, and supervision of third-party contractors. We typically charge our customers a daily or hourly fee for our services, in addition to per diem, mileage, and other reimbursable items. Revenue and costs are subject to seasonal variations and interim activity may not be indicative of yearly activity, considering that many of our customers develop yearly operating budgets and enter into contracts with us during the winter season for work to be performed during the remainder of the year. Additionally, inspection work throughout the United States during the winter months (especially in the northern states) may be hampered or delayed due to inclement weather.
The Pipeline & Process Services segment generates revenue primarily by providing essential environmental services, including hydrostatic testing services and chemical cleaning of newly-constructed and existing pipelines and related infrastructure. Our customers include energy companies and pipeline construction companies. We generally charge our customers on a fixed-bid basis, depending on the size and length of the pipeline being tested and the complexity of services provided. Revenue and costs are subject to seasonal variations, and interim activity may not be indicative of yearly activity, considering that many of our customers develop yearly operating budgets and enter into contracts with us for work to be performed during the remainder of the year. Additionally, field work during the winter months may be hampered or delayed due to inclement weather.
The Environmental Services segment owns and operates nine (9) water treatment facilities with ten (10) EPA Class II injection wells in the Bakken shale region of the Williston Basin in North Dakota. We wholly-own eight of these water treatment facilities and we own a 25% interest in the remaining facility. These water treatment facilities are connected to thirteen (13) pipeline gathering systems, including two (2) that we developed and own. We specialize in the treatment, recovery, separation, and disposal of waste byproducts generated during the lifecycle of an oil and natural gas well to protect the environment and our drinking water. All of the water treatment facilities utilize specialized equipment and remote monitoring to minimize the facilities’ downtime and increase the facilities’ efficiency for peak utilization. Revenue is generated on a fixed-fee per barrel basis for receiving, separating, filtering, recovering, processing, and injecting produced and flowback water. We also sell recovered oil, receive fees for transportation of water via pipeline, and receive fees from a partially owned water treatment facility for management and staffing services (see Note 11).
| 2. | Basis of Presentation and Significant Accounting Policies |
Basis of Presentation
The accompanying Consolidated Financial Statements include our accounts and those of our controlled subsidiaries. All intercompany transactions and account balances have been eliminated in consolidation. Investments over which we exercise significant influence, but do not control, are accounted for using the equity method of accounting.
The accompanying Consolidated Financial Statements have been prepared in accordance with accounting principles generally accepted in the United States (“GAAP”) for consolidated financial information and in accordance with the rules and regulations of the Securities and Exchange Commission. The Consolidated Financial Statements include all adjustments considered necessary for a fair presentation of the financial position and results of operations for the periods presented. Certain previously-reported amounts have been reclassified to conform to the current presentation.
Use of Estimates in the Preparation of Financial Statements
The preparation of our Consolidated Financial Statements in conformity with GAAP requires management to make estimates and assumptions that affect the amounts reported in these financial statements and accompanying notes. Actual results could differ from those estimates.
The COVID-19 pandemic and the significant decline in the price of crude oil have created and may continue to create significant uncertainty in macroeconomic conditions, which may continue to cause decreased demand for our services and adversely impact our results of operations. We consider these changing economic conditions as we develop accounting estimates, such as our annual effective tax rate, allowance for bad debts, and long-lived asset impairment assessments. We expect our accounting estimates to continue to evolve depending on the duration and degree of the impact of the COVID-19 pandemic and the significant decline in the price of crude oil. Our accounting estimates may change as new events and circumstances arise.
74
CYPRESS ENVIRONMENTAL PARTNERS, L.P.
Notes to Consolidated Financial Statements
Fair Value Measurement
We utilize fair value measurements to measure assets in a business combination or assess impairment of property and equipment, intangible assets, and goodwill. Fair value is the amount received from the sale of an asset or the amount paid to transfer a liability in an orderly transaction between market participants (an exit price) at the measurement date. Fair value is a market-based measurement considered from the perspective of a market participant. We use market data or assumptions that we believe market participants would use in pricing the asset or liability, including assumptions about risk and the risks inherent in the inputs to the valuation. These inputs can be readily observable, market corroborated, or unobservable. We apply both market and income approaches for fair value measurements using the best available information while utilizing valuation techniques that maximize the use of observable inputs and minimize the use of unobservable inputs.
The fair value hierarchy in GAAP prioritizes the inputs used to measure fair value, giving the highest priority to quoted prices in active markets for identical assets or liabilities (Level 1 measurement) and the lowest priority to unobservable inputs (Level 3 measurement). The Partnership classifies fair value balances based on the observability of those inputs. The three levels of the fair value hierarchy are as follows:
| ● | Level 1 – Quoted prices for identical assets or liabilities in active markets that management has the ability to access. Active markets are those in which transactions for the asset or liability occur in sufficient frequency and volume to provide pricing information on an ongoing basis. |
| ● | Level 2 – Inputs are other than quoted prices in active markets included in Level 1 that are either directly or indirectly observable. These inputs are either directly observable in the marketplace or indirectly observable through corroboration with market data for substantially the full contractual term of the asset or liability being measured. |
| ● | Level 3 – Inputs that are not observable for which there is little, if any, market activity for the asset or liability being measured. These inputs reflect management’s best estimate of the assumptions market participants would use in determining fair value. |
Cash and Cash Equivalents
We consider all investments purchased with initial maturities of three months or less to be cash equivalents. Cash equivalents consist primarily of investments in highly-liquid securities.
As of December 31, 2020, U.S. cash balances are insured by the Federal Deposit Insurance Corporation (FDIC) up to $250,000 per financial institution. Canadian cash balances are insured by the Canada Deposit Insurance Corporation (CDIC) up to $100,000 (Canadian Dollars) per financial institution. Our cash is primarily held at three financial institutions, and therefore is in excess of the FDIC or CDIC insurance limits. We periodically assess the financial condition of the institutions where we deposit funds.
Restricted Cash
Restricted cash was approximately $0.7 million and $0.6 million at December 31, 2020 and 2019, respectively. These amounts are included in prepaid expenses and other on the Consolidated Balance Sheets.
Accounts Receivable, Allowance for Bad Debts and Concentration of Credit Risk
We grant unsecured credit to customers under normal industry standards and terms, and have established policies and procedures that allow for an evaluation of our customers’ creditworthiness. We typically receive payment from our customers 45 to 90 days after the services have been performed. We determine allowances for bad debts based on our assessment of the creditworthiness of our customers. Trade receivables are written off against the allowance when deemed uncollectible. Recoveries of trade receivables previously written off are recorded when cash is received. We do not typically charge interest on past due trade receivables and we do not typically require collateral on our trade receivables. We had an allowance for doubtful accounts of $0.5 million and $0.2 million at December 31, 2020 and 2019, respectively. We recorded bad debt expense of $0.4 million in 2020, $0.2 million in 2019, and less than $0.1 million in 2018. In 2020, we wrote off one uncollectable account in the amount of $0.1 million. In 2019, we received $0.1 million on accounts receivable previously written off. We report bad debt expense and recoveries within general and administrative on our Consolidated Statements of Operations.
We had two customers, Pacific Gas & Electric Company and Enbridge Inc., that represented more than 10% of total accounts receivable as of December 31, 2020.
The majority of our revenues are generated in the United States. In 2020, 2019, and 2018, we generated revenues of less than $0.1 million, $0.2 million, and $1.3 million, respectively, from services performed in Canada.
Sanchez Bankruptcy
A former customer of our Inspection Services segment, Sanchez Energy Corporation and certain of its affiliates (collectively, “Sanchez”), filed for bankruptcy protection in August 2019. As of December 31, 2020, we have $0.5 million of pre-petition accounts receivable from Sanchez. We filed liens to secure $0.4 million of these accounts receivable from Sanchez, although these liens may prove to be ineffective in our efforts to collect the pre-petition accounts receivable from Sanchez as there are other parties that have secured higher priority liens on the same assets. We have recorded an allowance of $0.5 million against these accounts receivable from Sanchez as of December 31, 2020.
75
CYPRESS ENVIRONMENTAL PARTNERS, L.P.
Notes to Consolidated Financial Statements
Pacific Gas and Electric Bankruptcy
PG&E Corporation and its wholly-owned subsidiary Pacific Gas and Electric Company (collectively, “PG&E”), a customer, filed for bankruptcy protection in January 2019. We had accounts receivable from PG&E of $12.1 million at the date of the bankruptcy filing.
In November 2019, we sold $10.4 million of our pre-petition receivables from PG&E in a non-recourse sale to a third party for cash proceeds of $9.8 million. We recorded a loss of $0.5 million in the fourth quarter of 2019 on the sale of these pre-petition receivables, which is reported within Other, net on our Consolidated Statement of Operations. In March 2020 we collected from PG&E the remaining $1.7 million of pre-petition receivables under a court-approved “operational integrity supplier program”.
In July 2020, PG&E emerged from bankruptcy protection.
Property and Equipment
Property and equipment consists of land, land and leasehold improvements, buildings, facilities, wells and related equipment, field equipment, computer and office equipment, and vehicles. We record property and equipment at cost. Costs of renewals and improvements that substantially extend the useful lives of the assets are capitalized. Maintenance and repairs are expensed as incurred. We depreciate property and equipment on a straight-line basis over the estimated useful lives of the assets. Upon retirement, disposition, or impairment of an asset, we remove the cost and related accumulated depreciation from the balance sheet and report the resulting gain or loss, if any, in the Consolidated Statement of Operations.
Debt Issuance Costs
Debt issuance costs represent fees and expenses associated with securing our Credit Agreement (see Note 6). Amortization of the capitalized debt issuance costs is recorded on a straight-line basis over the term of the Credit Agreement.
Income Taxes
As a limited partnership, we generally are not subject to federal, state or local income taxes. The tax on our net income is generally borne by the individual partners. Net income (loss) for financial statement purposes may differ significantly from taxable income (loss) of the partners as a result of differences between the tax basis and financial reporting basis of assets and liabilities and the taxable income allocation requirements under our partnership agreement. The aggregated difference in the basis of our net assets for financial and tax reporting purposes cannot be readily determined because information regarding each partner’s tax attributes is not available to us.
The income of Tulsa Inspection Resources – Canada, ULC, our Canadian subsidiary, is taxable in Canada. Tulsa Inspection Resources – PUC, LLC (“TIR-PUC”), a subsidiary of our Inspection Services segment that performs inspection services for utility customers, and Cypress Brown Integrity - PUC, LLC, a 51% owned subsidiary, have elected to be taxed as corporations for U.S. federal income tax purposes, and therefore these subsidiaries are subject to U.S. federal and state income taxes. The amounts recognized as income tax expense, income taxes payable, and deferred tax liabilities in our Consolidated Financial Statements represent the Canadian and U.S. taxes referred to above, as well as partnership-level taxes levied by various states, most notably, franchise taxes assessed by the state of Texas.
As a publicly-traded partnership, we are subject to a statutory requirement that at least 90% of our total gross income is classified as “qualifying income” (as defined by the Internal Revenue Code, related Treasury Regulations, and Internal Revenue Service pronouncements), determined on a calendar year basis. If our qualifying income does not meet this statutory requirement, we could be taxed as a corporation for federal and state income tax purposes. Our income has met the statutory qualifying income requirement for each year since our IPO.
We evaluate uncertain tax positions for recognition and measurement in the Consolidated Financial Statements. To recognize a tax position, we determine whether it is more likely than not that a tax position will be sustained upon examination, including resolution of any related appeals or litigation, based on the technical merits of the position. A tax position that meets the more likely than not threshold is measured to determine the amount of benefit to be recognized in the Consolidated Financial Statements. The amount of tax benefit recognized with respect to any tax position is measured as the largest amount of benefit that is greater than 50% likely of being realized upon settlement. We had no uncertain tax positions that required recognition in the financial statements at December 31, 2020 or 2019. Any interest or penalties would be recognized as a component of income tax expense.
Revenue Recognition
Under Accounting Standards Codification (“ASC”) 606 - Revenue from Contracts with Customers, an entity should recognize revenue to depict the transfer of promised goods or services to customers in an amount that reflects the consideration to which the entity expects to be entitled in exchange for those goods or services. Based on this accounting guidance, our revenue is earned and recognized through the service offerings of our three reportable business segments. Our sales contracts have terms of less than one year. As such, we have used the practical expedient contained within the accounting guidance which exempts us from the requirement to disclose the transaction price allocated to remaining performance obligations if the performance obligation is part of a contract with an original expected duration of one year or less. We apply judgment in determining whether we are the principal or the agent in instances where we utilize subcontractors to perform all or a portion of the work under our contracts. Based on the criteria in ASC 606, we have determined we are principal in all such circumstances. See Note 14 for disaggregated revenue reported by segment.
76
CYPRESS ENVIRONMENTAL PARTNERS, L.P.
Notes to Consolidated Financial Statements
In 2020, 2019, and 2018, we recognized $0.3 million, $0.2 million, and $0.5 million of revenue within our Inspection Services segment, respectively, on services performed in previous years. We had constrained recognition of this revenue until the expiration of a contract provision that had given the customer the opportunity to reopen negotiation of the fee paid for the services. As of December 31, 2020 and December 31, 2019, we recognized a refund liability of $0.8 million and $0.7 million, respectively, for revenue associated with such variable consideration. In addition, we have recorded other refund liabilities of $0.8 million and $0.7 million at December 31, 2020 and 2019, respectively.
In the first quarter of 2018, we recognized $0.3 million of revenue within our Pipeline & Process Services segment associated with additional billings on a project that we completed in the fourth quarter of 2017 (we recognized the revenue upon receipt of customer acknowledgment of the additional fees).
Accrued Payroll and Other
Accrued payroll and other on our Consolidated Balance Sheets includes the following:
| December 31, 2020 | December 31, 2019 | |||||||
| (in thousands) | ||||||||
| Accrued payroll | $ | 1,799 | $ | 9,670 | ||||
| Customer deposits | 1,694 | 1,682 | ||||||
| Litigation settlements (Note 13) | 424 | 1,900 | ||||||
| Other | 959 | 1,598 | ||||||
| $ | 4,876 | $ | 14,850 | |||||
Fair Value of Financial Instruments
The carrying amounts reported in the Consolidated Balance Sheets for cash and cash equivalents, trade accounts receivable, prepaid expenses and other, accounts payable, accounts payable – affiliates, accrued payroll and other, and income taxes payable approximate their fair values.
Assets and Liabilities Measured at Fair Value on a Nonrecurring Basis
Certain assets and liabilities are reported at fair value on a nonrecurring basis in our Consolidated Balance Sheets. The following methods and assumptions were used to estimate the fair values:
Property, Plant, and Equipment
We assess property and equipment for possible impairment whenever events or changes in circumstances indicate, in the judgment of management, that the carrying value of the assets may not be recoverable. Such indicators include, among others, the nature of the asset, the projected future economic benefit of the asset, changes in regulatory and political environments, and historical and future cash flow and profitability measurements. If the carrying value of an asset exceeds the future undiscounted cash flows expected from the asset, we recognize an impairment charge for the excess of carrying value of the asset over its estimated fair value. Determination as to whether and how much an asset is impaired involves management estimates on highly uncertain matters such as future commodity prices and the outlook for national or regional market supply and demand for the services we provide. In the Environmental Services segment, Property, Plant, and Equipment is grouped for impairment testing purposes at each water treatment facility, as these asset groups represent the lowest level at which cash flows are separately identifiable.
For our Environmental Services segment, we considered the decline in the price of crude oil and the fact that, during the third quarter of 2020, the largest customer of one of our highest-volume facilities notified us of its decision to build its own facility and to send most of its water to that facility beginning in February 2021. We considered these developments to be potential indicators of impairment and therefore performed a step 1 recoverability impairment test. We used the same forward crude oil price curve for our property and equipment impairment analysis that we used for our goodwill impairment analysis. Based on this analysis, we concluded that the property and equipment was not impaired. The use of different assumptions and estimates from those we used in our analysis could have resulted in the need to record an impairment. While we believe we have made reasonable estimates and assumptions to estimate the future undiscounted cash flows expected from the assets, it is reasonably possible that changes could occur that would require an impairment charge in the future. Location-specific market considerations could also lead us to record an impairment to the property, plant, and equipment of one or more individual facilities in the future.
Goodwill
We have $50.4 million of goodwill on our Consolidated Balance Sheet at December 31, 2020. Of this amount, $40.3 million relates to the Inspection Services segment and $10.1 million relates to the Environmental Services segment. Goodwill is not amortized, but is subject to annual assessments on November 1 (or at other dates if events or changes in circumstances indicate that the carrying value of goodwill may be impaired) for impairment at a reporting unit level. The reporting units used to evaluate and measure goodwill for impairment are determined primarily by the manner in which the business is managed or operated. We have determined that our Inspection Services and Environmental Services operating segments are the appropriate reporting units for testing goodwill impairment.
77
CYPRESS ENVIRONMENTAL PARTNERS, L.P.
Notes to Consolidated Financial Statements
To perform a goodwill impairment assessment, we first evaluate qualitative factors to determine whether it is more likely than not that the fair value of a reporting unit exceeds its carrying value. If this assessment reveals that it is more likely than not that the carrying value of a reporting unit exceeds its fair value, we then determine the estimated fair value of the reporting unit. If the carrying amount exceeds the reporting unit’s fair value, we record a goodwill impairment charge for the excess (not exceeding the carrying value of the reporting unit’s goodwill).
Crude oil prices have decreased significantly in 2020, due in part to decreased demand as a result of the worldwide COVID-19 pandemic. This decline in oil prices led many of our customers to change their budgets and plans, which has resulted in reduced spending on drilling, completions, and exploration. This has had an adverse effect on construction of new pipelines, gathering systems, and related energy infrastructure. Lower exploration and production activity has also adversely effected the midstream industry and has led to delays and cancellations of projects. It is also possible that our customers may elect to defer maintenance activities on their infrastructure. Such developments would reduce our opportunities to generate revenues. It is impossible at this time to determine what may occur, as customer plans will evolve over time. It is possible that the cumulative nature of these events could have a material adverse effect on our results of operations and financial position.
Inspection Services
We completed our annual goodwill impairment assessment as of November 1, 2020 and concluded the $40.3 million of goodwill of the Inspection Services segment was not impaired. Our evaluations included various qualitative and corroborating quantitative factors, including current and projected earnings and current customer relationships and projects, and a comparison of our enterprise value to the sum of the estimated fair values of our business segments. The qualitative and supporting quantitative assessments on this reporting unit indicated that there was no need to conduct further quantitative testing for goodwill impairment. The use of different assumptions and estimates from the assumptions and estimates we used in our analyses could have resulted in the requirement to perform further quantitative goodwill impairment analyses.
Environmental Services
We completed our annual goodwill impairment assessment as of November 1, 2020 and updated this analysis as of December 31, 2020 and concluded that the remaining $10.1 million of goodwill of the Environmental Services segment was not impaired. We considered the decline in the price of crude oil in 2020 and the fact that, during the third quarter of 2020, the largest customer of one of our highest-volume facilities notified us of its decision to build its own facility and to send most of its water to that facility beginning in February 2021. We considered these developments to be potential indicators of impairment and therefore performed quantitative goodwill impairment analyses. We estimated the fair value of the reporting unit utilizing the income approach (discounted cash flows) valuation method, which is a Level 3 measurement as defined in ASC 820, Fair Value Measurement. Significant inputs in the valuation included projections of future revenues, anticipated operating costs, and appropriate discount rates. Since the volume of water we receive at our facilities is heavily influenced by the extent of exploration and production in the areas near our facilities, and since exploration and production is in turn heavily influenced by crude oil prices, we estimated future revenues by reference to crude prices in the forward markets. We used a forward price curve that reflects a gradual increase in the West Texas Intermediate ("WTI") crude price each month, with the price remaining around $39-$47 per barrel through January 2022 and reaching $49-$53 per barrel in January 2032. We estimated future operating costs by reference to historical per-barrel costs and estimated future volumes. We estimated revenues and costs for a period of ten years and estimated a terminal value calculated as a multiple of the cash flows in the preceding year. We discounted these estimated future cash flows at a rate of 13.5%. We assumed that a hypothetical buyer would be a partnership that is not subject to income taxes and that could obtain savings in general and administrative expenses through synergies with its other operations. Based on these quantitative analyses, we concluded that the goodwill of the Environmental Services segment was not impaired. Our analysis indicated that the fair value of the reporting unit of the Environmental Services segment exceeded their book value by 16% at December 31, 2020. The use of different assumptions and estimates from those we used in our analysis could have resulted in the need to record a goodwill impairment.
Our estimates of fair value are sensitive to changes in a number of variables, many of which relate to broader macroeconomic conditions outside of our control. As a result, actual performance could be different from our expectations and assumptions. Estimates and assumptions used in determining fair value of the reporting units that are outside the control of management include commodity prices, interest rates, and cost of capital. Our water treatment facilities are concentrated in one basin, and changes in oil and gas production in that basin could have a significant impact on the profitability of the Environmental Services segment. While we believe we have made reasonable estimates and assumptions to estimate the fair values of our reporting units, it is reasonably possible that changes could occur that would require a goodwill impairment charge in the future. Such changes could include, among others, a slower recovery in demand for petroleum products than assumed in our projections, an increase in supply from other areas (or other factors) that result in reduced production in North Dakota, and increased pessimism among market participants, which could increase the discount rate on (and therefore decrease the value of) estimated future cash flows.
Identifiable Intangible Assets
Our intangible assets consist primarily of customer relationships, trade names, and our database of inspectors. We recorded these intangible assets as part of our accounting for the acquisitions of businesses and we amortize these assets on a straight-line basis over their estimated useful lives, which typically range from 5 – 20 years (see Note 5).
We review our intangible assets for impairment whenever events or circumstances indicate that the asset group to which they relate may be impaired. To perform an impairment assessment, we first determine whether the cash flows expected to be generated from the asset group exceed the carrying value of the asset group. If such estimated cash flows do not exceed the carrying value of the asset group, we reduce the carrying value of the assets to their fair values and record a corresponding impairment loss.
78
CYPRESS ENVIRONMENTAL PARTNERS, L.P.
Notes to Consolidated Financial Statements
Depending on future events, it is reasonably possible that we could incur impairment charges associated with our property and equipment, goodwill, or intangible assets.
Gains on Asset Disposals
During 2018, we sold our two water treatment facilities in Texas and recorded a combined gain of $3.6 million. During 2018, we received proceeds of $0.4 million from the settlement of litigation related to lightning strikes that occurred in 2017 at our facilities in Orla, Texas and Grassy Butte, North Dakota. This litigation related to the non-performance of certain lightning protection equipment we had purchased to protect the facilities against lightning strikes. The proceeds from these sales and settlements are reported within gain on asset disposals, net in our Consolidated Statements of Operations.
Noncontrolling Interests
We own a 51% interest in CBI and a 49% interest in CF Inspection Management, LLC (“CF Inspection”). The accounts of these subsidiaries are included in our Consolidated Financial Statements. The portion of the net income (loss) of these entities that is attributable to outside owners is reported in net income (loss) attributable to noncontrolling interests in our Consolidated Statements of Operations, and the portion of the net assets of these entities that is attributable to outside owners is reported in noncontrolling interests in our Consolidated Balance Sheets. CBI’s company agreement generally requires CBI to make an annual distribution to its members equal to or greater than the amount of CBI’s taxable income multiplied by the maximum federal income tax rate.
Foreign Currency Translation
Our Consolidated Financial Statements are reported in U.S. dollars. We translate our Canadian-dollar-denominated assets and liabilities into U.S. dollars at the exchange rate in effect at the balance sheet date. We translate our Canadian-dollar-denominated revenues and expenses into U.S. dollars at the average exchange rate in effect during the period.
Our Consolidated Balance Sheet at December 31, 2020 includes $2.7 million of accumulated other comprehensive loss associated with accumulated currency translation adjustments, all of which relate to our Canadian operations. If at some point in the future we were to substantially complete a liquidation of our Canadian operations, we would reclassify the balance in accumulated other comprehensive loss to other accounts within partners’ capital, which would be reported in the Consolidated Statements of Operations as a reduction to net income.
Our Canadian subsidiary has certain payables to our U.S.-based subsidiaries. These intercompany payables and receivables among our consolidated subsidiaries are eliminated in our Consolidated Balance Sheets. Beginning April 1, 2017, with the expiration of a contract with our largest Canadian customer, we report currency translation adjustments on these intercompany payables and receivables within foreign currency gains (losses) in our Consolidated Statements of Operations as we no longer consider these intercompany balances long-term investments in nature. Prior to April 1, 2017, we reported currency translation adjustments on these intercompany payables and receivables within other comprehensive income (loss). We continue to report currency translation adjustments on other Canadian activity and balances within accumulated other comprehensive loss in our Consolidated Statement of Owners’ Equity.
New Accounting Standards
In 2020, we adopted the following new accounting standard issued by the Financial Accounting Standards Board (“FASB”):
The FASB issued ASU 2020-15 – Intangibles—Goodwill and Other—Internal-Use Software (Subtopic 350-40): Customer’s Accounting for Implementation Costs Incurred in a Cloud Computing Arrangement That Is a Service Contract in August 2020. This guidance requires a customer in a cloud computing arrangement to follow the internal use software guidance in ASC 350-40 to determine which costs should be capitalized as assets or expensed as incurred. The amendments in this ASU are effective for fiscal years beginning after December 15, 2020, including interim periods within those fiscal years. We adopted this guidance prospectively from the date of adoption (January 1, 2020) and this guidance has not had a material effect on our Consolidated Financial Statements.
In 2019, we adopted the following new accounting standard issued by the FASB:
The FASB issued ASU 2016-02 – Leases in February 2016. This guidance attempts to increase transparency and comparability among organizations by recognizing certain lease assets and lease liabilities on the balance sheet and disclosing key information about leasing arrangements. The main difference between previous GAAP methodology and the method used in this new guidance is the recognition on the balance sheet of lease assets and lease liabilities by lessees for certain operating leases.
We made accounting policy elections to not capitalize leases with a lease term of twelve months or less and to not separate lease and non-lease components for all asset classes. We also elected the package of practical expedients within ASU 2016-02 that allows an entity to not reassess prior to the effective date (i) whether any expired or existing contracts are or contain leases, (ii) the lease classification for any expired or existing leases, or (iii) initial direct costs for any existing leases, but did not elect the practical expedient of hindsight when determining the lease term of existing contracts at the effective date.
79
CYPRESS ENVIRONMENTAL PARTNERS, L.P.
Notes to Consolidated Financial Statements
In July 2020, the FASB issued ASU 2020-11 – Targeted Improvements, which provided entities with a transition option to not restate the comparative periods for the effects of applying the new leasing standard (i.e. comparative periods presented in the Consolidated Financial Statements will continue to be in accordance with Accounting Standards Codification 840). We adopted the new standard on the effective date of January 1, 2020 and used a modified retrospective approach as permitted under ASU 2020-11. The effects of implementing ASU 2016-02 included the addition of right-of-use assets and associated lease liabilities to our Consolidated Balance Sheet, but were immaterial to our Consolidated Statement of Operations and Consolidated Statement of Cash Flows. The cumulative effect adjustment was not material to partners’ capital on our Consolidated Balance Sheet. Upon adoption, we recorded operating lease right-of-use assets of $3.5 million and current and noncurrent operating lease obligations of $0.5 million and $3.0 million, respectively. Liabilities recorded as a result of this standard are excluded from the definition of indebtedness under our credit facility, and therefore do not affect the leverage ratio under our credit facility.
| 3. | Property and Equipment |
Property and equipment consist of the following, recorded at cost, as of December 31, 2020 and 2019:
| December 31, | |||||||||||
| Asset Category | Useful Lives (years) | 2020 | 2019 | ||||||||
| (in thousands) | |||||||||||
| Land | $ | 1,301 | $ | 1,301 | |||||||
| Land improvements | 15 | 984 | 984 | ||||||||
| Buildings and leasehold improvements | 30 - 39 | 1,183 | 1,183 | ||||||||
| Facilities, wells and equipment | 5 - 15 | 19,731 | 19,231 | ||||||||
| Computer and office equipment | 3 - 9 | 3,388 | 3,454 | ||||||||
| Vehicles and other | 3 - 5 | 342 | 346 | ||||||||
| 26,929 | 26,499 | ||||||||||
| Less accumulated depreciation | (16,470 | ) | (13,738 | ) | |||||||
| Net property, plant and equipment | $ | 10,459 | $ | 12,761 | |||||||
Depreciation expense is computed using the straight-line method over the estimated useful lives of the assets. Depreciation expense was $3.1 million, $2.8 million, and $2.8 million in 2020, 2019, and 2018, respectively, of which $0.9 million, $1.1 million, and $1.1 million was included as a component of costs of services in 2020, 2019, and 2018, respectively. In 2020 and 2019, depreciation expense included $0.3 million and $0.2 million related to finance leases, respectively. We sold property and equipment which reduced accumulated depreciation by $0.1 million in each of 2020 and 2019, respectively.
80
CYPRESS ENVIRONMENTAL PARTNERS, L.P.
Notes to Consolidated Financial Statements
| 4. | Goodwill |
Goodwill represents the excess of cost over fair value of the assets and liabilities of businesses acquired. Changes in goodwill are as follows:
| Inspection Services | Environmental Services | Total | ||||||||||
| (in thousands) | ||||||||||||
| Balance - December 31, 2017 | $ | 40,344 | $ | 13,091 | $ | 53,435 | ||||||
| Foreign currency adjustments | (116 | ) | — | (116 | ) | |||||||
| Dispositions | — | (3,025 | ) | (3,025 | ) | |||||||
| Balance - December 31, 2018 | $ | 40,228 | $ | 10,066 | $ | 50,294 | ||||||
| Foreign currency adjustments | 62 | — | 62 | |||||||||
| Balance - December 31, 2019 | $ | 40,290 | $ | 10,066 | $ | 50,356 | ||||||
| Foreign currency adjustments | 33 | — | 33 | |||||||||
| Balance - December 31, 2020 | $ | 40,323 | $ | 10,066 | $ | 50,389 | ||||||
Goodwill is not amortized, but is subject to annual reviews on November 1 (or other dates if events or changes in circumstances warrant) for impairment at a reporting unit level. We have determined that the Inspection Services and Environmental Services operating segments are the appropriate reporting units for testing goodwill for impairment. For additional information regarding the annual reviews of the goodwill on the Consolidated Balance Sheets, please see Note 2.
In May 2018, we sold our Orla, Texas water treatment facility. The net book value of the assets sold included $3.0 million of allocated goodwill, calculated based on the estimated fair value of the Orla facility relative to the estimated fair value of the Environmental Services reporting unit as a whole. In January 2018, we sold our Pecos, Texas water treatment facility. The net book value of the assets sold included $2.0 million of allocated goodwill, calculated based on the estimated fair value of the Pecos facility relative to the estimated fair value of the Environmental Services reporting unit as a whole.
81
CYPRESS ENVIRONMENTAL PARTNERS, L.P.
Notes to Consolidated Financial Statements
| 5. | Intangible Assets |
Intangible assets consist of the following at December 31, 2020 and 2019:
| December 31, | |||||||||||
| Asset Category | Useful Lives | 2020 | 2019 | ||||||||
| (years) | (in thousands) | ||||||||||
| Customer relationships | 5 - 20 | $ | 22,853 | $ | 22,853 | ||||||
| Contracts | 3 | 241 | 241 | ||||||||
| Non-compete agreements | 3 | — | 143 | ||||||||
| Trademarks and trade names | 10 | 11,679 | 11,679 | ||||||||
| Inspector database | 10 | 2,080 | 2,080 | ||||||||
| 36,853 | 36,996 | ||||||||||
| Less accumulated amortization | (19,467 | ) | (16,933 | ) | |||||||
| Net intangibles | $ | 17,386 | $ | 20,063 | |||||||
Amortization expense was $2.7 million in each of 2020, 2019, and 2018, respectively.
Future amortization expense of our intangible assets is estimated to be as follows:
| Year ending December 31, | (in thousands) | |||
| 2021 | $ | 2,668 | ||
| 2022 | 2,668 | |||
| 2023 | 2,070 | |||
| 2024 | 1,497 | |||
| 2025 | 1,150 | |||
| Thereafter | 7,333 | |||
| $ | 17,386 | |||
| 6. | Credit Agreement |
We are party to a credit agreement (the “Credit Agreement”) with a syndicate of seven banks, with Deutsche Bank Trust Company Americas serving as the Administrative Agent. The obligations under the Credit Agreement are secured by a first priority lien on substantially all of our assets.
The Credit Agreement was amended in May 2018 and again in March 2021. Both amendments reduced the borrowing capacity. After the March 2021 amendment, the Credit Agreement has a total capacity of $75.0 million, subject to various customary covenants and restrictive provisions, and matures on May 31, 2022. The Credit Agreement had a total capacity of $110.0 million, subject to certain limitations, prior to the March 2021 amendment.
Outstanding borrowings at December 31, 2020 and December 31, 2019 were $62.0 million and $74.9 million, respectively, and are reported in our Consolidated Balance Sheets as long-term debt. Prior to the Credit Agreement amendment in March 2021, our borrowings as of December 31, 2020, were a short-term obligation scheduled to mature on May 29, 2021. Accounting Standards Codification (“ASC”) 470 states that short-term obligations should be excluded from current liabilities upon completing a refinancing through a long-term obligation after the reporting period but before the date of the filing, among other criteria. The average debt balance outstanding in 2020, 2019, and 2018 was $80.8 million, $81.4 million, and $98.6 million, respectively.
All borrowings under the Credit Agreement bear interest, at our option, on a leveraged-based grid pricing at (i) a base rate plus a margin of 2.00% to 3.75% per annum (“Base Rate Borrowings”) or (ii) an adjusted LIBOR rate plus a margin of 3.00% to 4.75% per annum (“LIBOR Borrowings”). The applicable margin is determined based on our leverage ratio, as defined in the Credit Agreement. Interest on Base Rate Borrowings is payable monthly. Interest on LIBOR Borrowings is paid upon maturity of the underlying LIBOR contract, but no less often than quarterly. Commitment fees are charged at a rate of 0.50% on any unused credit and are payable quarterly. Interest paid in 2020, 2019, and 2018 was $3.4 million, $4.8 million, and $5.8 million, respectively, including commitment fees. The interest rate on our borrowings ranged from 3.33% to 4.80% in 2020, 4.70% to 6.02% in 2019, and 4.74% to 6.02% in 2018.
82
CYPRESS ENVIRONMENTAL PARTNERS, L.P.
Notes to Consolidated Financial Statements
The Credit Agreement contains various customary covenants and restrictive provisions. The Credit Agreement also requires us to maintain certain financial covenants, including a leverage ratio and an interest coverage ratio. The interest coverage ratio is calculated as the trailing-twelve-month EBITDA (as defined in the Credit Agreement) divided by trailing-twelve-month pro forma interest expense (as defined in the Credit Agreement). The minimum interest coverage ratio is 3.0 at each quarter end. At December 31, 2020, our interest coverage ratio was 4.7. The leverage ratio is calculated as the debt outstanding (inclusive of finance leases) divided by trailing-twelve-month EBITDA (as defined in the Credit Agreement). The maximum leverage ratio is 6.0 at December 31, 2020 and March 31, 2021, 5.3 at June 30, 2021, 4.5 at September 30, 2021, and 4.0 at December 31, 2021. At December 31, 2020, our leverage ratio was 5.8.
As of December 31, 2020, we were in compliance with all covenants of the Credit Agreement (as amended in March 2021). We currently are forecasting a sufficient level of EBITDA to remain in compliance with the financial covenants in the Credit Agreement throughout the term of the Credit Agreement. However, maintaining a sufficient level of EBITDA will be dependent on the level of activity in the markets we serve and on our ability to win awards for work from our customers, and may require us to sell common units through our at-the-market equity program to raise proceeds to repay debt and/or to delay reimbursements to affiliates on a short-term basis. It is reasonably possible that we could fail to meet one or both of the financial covenant ratios. If this were to occur, and if we were unable to obtain from the lenders a waiver of the covenant violation, we would be in default on the Credit Agreement. Upon the occurrence and during the continuation of an event of default, subject to the terms and conditions of the Credit Agreement, the lenders may declare any outstanding principal, together with any accrued and unpaid interest, to be immediately due and payable and may exercise the other remedies set forth or referred to in the Credit Agreement.
The Credit Agreement contains significant limitations on our ability to pay cash distributions. We may only pay the following cash distributions:
| ● | distributions to common and preferred unitholders, to the extent of income taxes estimated to be payable by these unitholders resulting from allocations of our earnings; |
| ● | distributions to the preferred unitholder up to $1.1 million per year if our leverage ratio is 4.0 or lower; and |
| ● | distributions to the noncontrolling interest owners of CBI and CF Inspection. |
In addition, the Credit Agreement restricts our ability to redeem or repurchase our equity interests.
The Credit Agreement requires us to make payments to reduce the outstanding balance if, for any consecutive period of five business days, our cash on hand (less amounts expected to be paid in the following five business days) exceeds $10.0 million.
We incurred certain debt issuance costs at the inception of the Credit Agreement, which we were amortizing on a straight-line basis over the original term of the Credit Agreement. Upon amending the Credit Agreement in May 2018, we wrote off $0.1 million of these debt issuance costs and reported this expense within debt issuance cost write-off in our Consolidated Statement of Operations for 2018, which represented the portion of the unamortized debt issuance costs attributable to lenders who were no longer participating in the credit facility subsequent to the amendment. The remaining debt issuance costs associated with the inception of the Credit Agreement, along with $1.3 million of debt issuance costs associated with the May 2018 amendment, were being amortized on a straight-line basis over the remaining term of the Credit Agreement. Debt issuance costs total $0.2 million and $0.8 million at December 31, 2020 and December 31, 2019, respectively, and are reported as debt issuance costs, net on the Consolidated Balance Sheets. In 2021, we incurred $1.0 million of debt issuance costs related to the March 2021 amendment to the Credit Agreement.
The carrying value of our long-term debt approximates fair value, as the borrowings under the Credit Agreement are considered to be priced at market for debt instruments having similar terms and conditions (Level 2 of the fair value hierarchy).
On March 15, 2021, we made a payment of $8.0 million on the Credit Agreement, which reduced the outstanding balance on the Credit Agreement to $54.0 million.
| 7. | Income Taxes |
As a limited partnership, we generally are not subject to federal, state or local income taxes. The tax on the net income of the Partnership is generally borne by the individual partners. We have Canadian activity that is taxable in Canada. In addition, we own three entities which have elected to be taxed as corporations for U.S. federal income tax purposes. The amounts recognized as income tax expense, income taxes payable, and deferred tax liabilities in the Consolidated Financial Statements represent the Canadian and U.S. taxes referred to above, as well as partnership-level taxes levied by various states (primarily Texas).
83
CYPRESS ENVIRONMENTAL PARTNERS, L.P.
Notes to Consolidated Financial Statements
Significant components of income tax expense (benefit) are as follows for the years ended December 31:
| 2020 | 2019 | 2018 | ||||||||||
| (in thousands) | ||||||||||||
| Current tax expense (benefit) | ||||||||||||
| U.S. federal | $ | 169 | $ | 1,007 | $ | 497 | ||||||
| State | 370 | 1,329 | 797 | |||||||||
| Canadian | — | (46 | ) | (27 | ) | |||||||
| Total | 539 | 2,290 | 1,267 | |||||||||
| Deferred tax expense (benefit) | ||||||||||||
| U.S. federal | 2 | (36 | ) | 36 | ||||||||
| State | 1 | (15 | ) | 15 | ||||||||
| Canadian | — | 15 | — | |||||||||
| Total | 3 | (36 | ) | 51 | ||||||||
| Total income tax expense | $ | 542 | $ | 2,254 | $ | 1,318 | ||||||
The following table reconciles the differences between the U.S. federal statutory rate of 21% in each of 2020, 2019, and 2018, respectively, to the Partnership's income tax expense on the Consolidated Statements of Operations for the years ended December 31:
| 2020 | 2019 | 2018 | ||||||||||
| (in thousands) | ||||||||||||
| Tax computed at statutory rate | $ | 37 | $ | 4,132 | $ | 2,817 | ||||||
| Income not subject to federal tax | 140 | (3,102 | ) | (2,396 | ) | |||||||
| State income taxes, net of federal benefit | 377 | 1,265 | 787 | |||||||||
| Other | (12 | ) | (41 | ) | 110 | |||||||
| $ | 542 | $ | 2,254 | $ | 1,318 | |||||||
Tax years that remain subject to examination by various taxing authorities for each of our consolidated entities include the years 2018 through 2020. Tax-related interest and penalties were insignificant in 2020, 2019, and 2018.
We had no uncertain tax positions that required recognition in the financial statements at December 31, 2020 or 2019. During the next twelve months, we do not expect that the ultimate resolution of any uncertain tax positions will result in a significant increase or decrease of an unrecognized tax benefit.
| 8. | Owners’ Equity |
Common Units
As of December 31, 2020 and 2019, there were 12,212,532 and 12,068,343 common units outstanding, respectively. As described in Note 6, our Credit Agreement, as amended in March 2021, places significant restrictions on our ability to pay common unit distributions.
84
CYPRESS ENVIRONMENTAL PARTNERS, L.P.
Notes to Consolidated Financial Statements
Series A Preferred Units
In May 2018 (the “Closing Date”), we entered into a Series A Preferred Unit Purchase Agreement (the “Preferred Unit Purchase Agreement”) with an entity controlled by Charles C. Stephenson, Jr. (the “Purchaser”), an affiliate of our General Partner, under which we issued and sold in a private placement 5,769,231 Series A Preferred Units representing limited partner interests in the Partnership (the “Preferred Units”) to the Purchaser for a cash purchase price of $7.54 per Preferred Unit, resulting in gross proceeds to the Partnership of $43.5 million. We used proceeds from the transaction to reduce outstanding borrowings on our revolving credit facility.
The Preferred Unit Purchase Agreement contains customary representations, warranties, and covenants of the Partnership and the Purchaser. The Partnership and the Purchaser agreed to indemnify each other and their respective officers, directors, managers, employees, agents, counsel, accountants, investment bankers, and other representatives against certain losses resulting from breaches of their respective representations, warranties, and covenants, subject to certain negotiated limitations and survival periods set forth in the Preferred Unit Purchase Agreement.
Pursuant to the Preferred Unit Purchase Agreement, and in connection with the closing of this transaction, our General Partner executed the First Amendment to First Amended and Restated Agreement of Limited Partnership of the Partnership, which authorizes and establishes the rights and preferences of the Preferred Units. The Preferred Units have voting rights that are identical to the voting rights of the common units into which such Preferred Units would be converted at the then-applicable conversion rate.
The Purchaser is entitled to receive quarterly distributions that represent an annual return of 9.5% on the Preferred Units. We have the option to pay 7.0% of the 9.5% in kind (in the form of issuing additional preferred units) for the first twelve quarters after the Closing Date.
After the third anniversary of the Closing Date, the Purchaser will have the option to convert the Preferred Units into common units on a one-for-one basis. If certain conditions are met after the third anniversary of the Closing Date, we will have the option to cause the Preferred Units to convert to common units. After the third anniversary of the Closing Date, we will also have the option to redeem the Preferred Units. We may redeem the Preferred Units (a) at any time after the third anniversary of the closing date and on or prior to the fourth anniversary of the closing date at a redemption price equal to 105% of the issue price, and (b) at any time after the fourth anniversary of the closing date at a redemption price equal to 101% of the issue price.
The Preferred Units rank senior to our common units, and we must pay distributions on the Preferred Units (including any arrearages) before paying distributions on our common units. In addition, the Preferred Units rank senior to the common units with respect to rights upon liquidation. As described in Note 6, our Credit Agreement, as amended in March 2021, places significant restrictions on our ability to pay cash distributions.
Incentive Distribution Rights
Our General Partner owns a 0.0% non-economic general partnership interest in the Partnership, which does not entitle it to receive cash distributions. Affiliates of our General Partner hold incentive distribution rights (“IDRs”), which represent the right to receive an increasing percentage (15%, 25%, and 50%) of quarterly distributions of available cash from operating surplus after specified target distribution levels have been achieved. Affiliates of the General Partner would begin receiving incentive distribution payments when the quarterly cash distribution exceeds $0.445625 per common unit. There were no incentive distribution payments in 2020, 2019, or 2018.
At-the-Market Equity Program
In April 2019, we established an at-the-market equity program (“ATM Program”), which will allow us to offer and sell common units from time to time, to or through the sales agent under the ATM Program. The maximum amount we may sell varies based on changes in the market value of the units. Currently, the maximum amount we may sell is $10 million. We are under no obligation to sell any common units under this program. As of the date of this filing, we have not sold any common units under the ATM Program and, as such, have not received any net proceeds or paid any compensation to the sales agent under the ATM Program.
Employee Unit Purchase Plan
In November 2020, we established an employee unit purchase plan (“EUPP”), which will allow us to offer and sell up to 500,000 common units. Employees can elect to have up to 10 percent of their annual base pay withheld to purchase common units, subject to terms and limitations of the EUPP. The purchase price of the common units is 95% of the volume weighted average of the closing sales prices of our common units on the ten immediately preceding trading days at the end of each offering period. There have been no common unit issuances under the EUPP.
Net (Loss) Income Per Unit
Our net (loss) income is attributable and allocable to three ownership groups: (1) our preferred unitholder, (2) the noncontrolling interests in certain subsidiaries, and (3) our common unitholders. Income attributable to preferred unitholder represents the 9.5% annual return to which the owner of the Preferred Units is entitled. Net income (loss) attributable to noncontrolling interests represent 49% of the income (loss) generated by CBI and 51% of the income (loss) generated by CF Inspection. Net (loss) income attributable to common unitholders represents our remaining net (loss) income, after consideration of amounts attributable to our preferred unitholder and the noncontrolling interests.
85
CYPRESS ENVIRONMENTAL PARTNERS, L.P.
Notes to Consolidated Financial Statements
Basic net (loss) income per common limited partner unit is calculated as net (loss) income attributable to common unitholders divided by the basic weighted average common units outstanding. Diluted net (loss) income per common limited partner unit includes the dilutive effect of the unvested equity-based compensation and the Preferred Units. The following summarizes the calculation of the basic net (loss) income per common limited partner unit for the periods presented:
| Year Ended December 31 | ||||||||||||
| 2020 | 2019 | 2018 | ||||||||||
| (in thousands, except per unit data) | ||||||||||||
| Net (loss) income attributable to common unitholders | $ | (5,548 | ) | $ | 11,881 | $ | 8,968 | |||||
| Weighted average common units outstanding | 12,181 | 12,039 | 11,929 | |||||||||
| Basic net (loss) income per common limited partner unit | $ | (0.46 | ) | $ | 0.99 | $ | 0.75 | |||||
The following summarizes the calculation of the diluted net (loss) income per common limited partner unit for the periods presented:
| Year Ended December 31 | ||||||||||||
| 2020 | 2019 | 2018 | ||||||||||
| (in thousands, except per unit data) | ||||||||||||
| Net (loss) income attributable to common unitholders | $ | (5,548 | ) | $ | 11,881 | $ | 8,968 | |||||
| Net income attributable to preferred unitholder | — | 4,133 | 2,445 | |||||||||
| $ | (5,548 | ) | $ | 16,014 | $ | 11,413 | ||||||
| Weighted average common units outstanding | 12,181 | 12,039 | 11,929 | |||||||||
| Effect of dilutive securities: | ||||||||||||
| Weighted average preferred units outstanding | — | 5,769 | 3,413 | |||||||||
| Long-term incentive plan unvested units | — | 481 | 415 | |||||||||
| Diluted weighted average common units outstanding | 12,181 | 18,289 | 15,757 | |||||||||
| Diluted net (loss) income per common limited partner unit | $ | (0.46 | ) | $ | 0.88 | $ | 0.72 | |||||
For the year ended December 31, 2020, the preferred units and long-term incentive plan unvested units would have been antidilutive and, therefore, were not included in the computation of diluted net (loss) income per common limited partner unit.
| 9. | Major Customers |
The following table sets forth the customers who accounted for more than 10% of our consolidated revenue for the years ended December 31, 2020, 2019, and 2018:
| 2020 | 2019 | 2018 | ||
| Enterprise Products Partners L.P. | Pacific Gas and Electric Company | Pacific Gas and Electric Company | ||
| Pacific Gas and Electric Company | Phillips 66 (a) | Plains All American Pipeline, L.P. |
| (a) | Phillips 66 accounted for more than 15% of our consolidated revenue during 2019. |
No other customer accounted for more than 10% of our consolidated revenues during these years. Revenues from these customers resulted from activities conducted by our Inspection Services segment.
| 10. | Equity Compensation |
Long-Term Incentive Plan (“LTIP”)
Our General Partner has adopted a long-term incentive plan (“LTIP”) that authorizes the issuance of up to 2.5 million common units. Certain of our directors and employees have been awarded phantom restricted units (“Units”) under the terms of the LTIP in the form of time-based unit awards (“Service Units”), performance-based unit awards (“Performance Units”), and market-based unit awards (“Market Units”). In 2020, 2019, and 2018, compensation expense of $1.0 million, $1.1 million and $1.2 million, respectively, was recorded under the LTIP (including expense associated with the Profit Interest Units described below).
86
CYPRESS ENVIRONMENTAL PARTNERS, L.P.
Notes to Consolidated Financial Statements
Time-Based Unit Awards – The majority of the Service Units vest in three tranches, with one-third of the units vesting three years from the grant date, one-third vesting four years from the grant date, and one-third vesting five years from the grant date, contingent only on the continued service of the recipients through the vesting dates. However, certain of the Service Units have different, and typically shorter, vesting periods. The fair value of the Service Units is determined based on the quoted market value of the publicly-traded common units at the grant date, adjusted for a discount to reflect the fact that distributions are not paid on the Service Units during the vesting period. We recognize compensation expense on a straight-line basis over the vesting period of the grant. We account for forfeitures when they occur. Total unearned compensation associated with the Service Units at December 31, 2020 and 2019 was $2.5 million and $2.3 million, respectively, with an average remaining life of 2.0 years and 1.9 years, respectively. The following table summarizes the activity of the Service Units in 2020, 2019, and 2018:
| Number of Unvested Units | Weighted Average Grant Date Fair Value / Unit | |||||||
| Units at December 31, 2017 | 587,014 | $ | 8.56 | |||||
| Units granted | 399,726 | $ | 3.24 | |||||
| Units vested | (69,296 | ) | $ | 13.97 | ||||
| Units forfeited | (44,383 | ) | $ | 5.76 | ||||
| Units at December 31, 2018 | 873,061 | $ | 5.83 | |||||
| Units granted | 201,306 | $ | 4.40 | |||||
| Units vested | (145,200 | ) | $ | 8.48 | ||||
| Units forfeited | (64,635 | ) | $ | 6.10 | ||||
| Units at December 31, 2019 | 864,532 | $ | 5.04 | |||||
| Units granted | 420,181 | $ | 4.15 | |||||
| Units vested | (168,969 | ) | $ | 7.66 | ||||
| Units forfeited | (144,723 | ) | $ | 4.39 | ||||
| Units at December 31, 2020 | 971,021 | $ | 4.29 | |||||
Performance-Based Unit Awards – In the third quarter of 2019, we granted Performance Units to certain employees that are subject to performance conditions in addition to the service condition. These Performance Units will vest in April 2022, April 2023, April 2024, or not at all, depending on our performance relative to a specified profitability target. We recognize compensation expense on a straight-line basis over the estimated vesting period of the grant. We adjust the life-to-date expense recognized for the Performance Units for any changes in our estimates of the number of units that will vest and the timing of vesting. We account for forfeitures when they occur. The Performance Units granted in the third quarter of 2020 had an estimated grant date fair value of $4.19 per unit and are being expensed over a service period of 3.73 years.
In addition, we have issued grants of Performance Units that vest three years from the grant date. Upon vesting, the recipient is entitled to receive a number of common units equal to a percentage of the units granted, based on the recipient meeting various performance targets in addition to the service condition.
Total unearned compensation associated with the Performance Units at December 31, 2020 and 2019 was less than $0.1 million and $0.4 million, respectively, with an average remaining life of 1.5 years and 2.6 years, respectively. The following table summarizes the activity of the Performance Units in 2020, 2019, and 2018:
87
CYPRESS ENVIRONMENTAL PARTNERS, L.P.
Notes to Consolidated Financial Statements
| Number of Unvested Units | Weighted Average Grant Date Fair Value / Unit | |||||||
| Units at December 31, 2017 | 77,495 | $ | 7.75 | |||||
| Units granted | 72,046 | $ | 4.52 | |||||
| Units vested | (7,184 | ) | $ | 8.49 | ||||
| Units forfeited | (40,709 | ) | $ | 8.49 | ||||
| Units at December 31, 2018 | 101,648 | $ | 5.11 | |||||
| Units granted | 89,402 | $ | 4.19 | |||||
| Units vested | (6,167 | ) | $ | 6.54 | ||||
| Units forfeited | (24,310 | ) | $ | 6.45 | ||||
| Units at December 31, 2019 | 160,573 | $ | 4.34 | |||||
| Units granted | 1,050 | $ | 4.19 | |||||
| Units vested | — | $ | — | |||||
| Units forfeited | (20,574 | ) | $ | 4.19 | ||||
| Units at December 31, 2020 | 141,049 | $ | 4.36 | |||||
Market-Based Unit Awards – In the third quarter of 2019, we granted Units that are subject to market conditions in addition to the service condition (the “Market Units”). Half of the Market Units will vest in April 2022, April 2023, April 2024, or not at all, depending on the market value of our common units relative to specified targets on those dates. These Market Units had an estimated fair value on the grant date of $3.51 per unit and are being expensed over a derived service period of 2.73 years. The other half of the Market Units will vest in April 2022, April 2023, April 2024, or not at all, depending on the yield on our common units relative to specified targets on those dates. The Market Units granted in 2020 had an estimated fair value on the grant date of $3.58 per unit and are being expensed over a derived service period of 2.73 years. Compensation expense is recognized on a straight-line basis over a derived service period, regardless of when, if ever, the market condition is satisfied. Total unearned compensation associated with the Market Units at December 31, 2020 and 2019 was $0.1 million and $0.3 million, respectively, with an average remaining life of 1.3 years and 2.3 years, respectively. The following table summarizes the activity of the Market Units for 2019 and 2020:
88
CYPRESS ENVIRONMENTAL PARTNERS, L.P.
Notes to Consolidated Financial Statements
| Number of Unvested Units | Weighted Average Grant Date Fair Value / Unit | |||||||
| Units at December 31, 2018 | — | $ | — | |||||
| Units granted | 89,403 | $ | 3.54 | |||||
| Units vested | — | $ | — | |||||
| Units forfeited | (875 | ) | $ | 3.54 | ||||
| Units at December 31, 2019 | 88,528 | $ | 3.54 | |||||
| Units granted | 1,050 | $ | 3.54 | |||||
| Units vested | — | $ | — | |||||
| Units forfeited | (20,576 | ) | $ | 3.54 | ||||
| Units at December 31, 2020 | 69,002 | $ | 3.54 | |||||
In addition to the awards shown above, at the time of our Initial Public Offering, certain profit interest units previously issued were converted into 44,451 units of the Partnership outside of the LTIP. Compensation expense associated with these profit interest units was $0.1 million for the year ended December 31, 2018. There were no unvested profit interest units at December 31, 2019 or 2020.
| 11. | Related-Party Transactions |
Omnibus Agreement
We are party to an omnibus agreement with Holdings and other related parties. The omnibus agreement provides for, among other things, our right of first offer on Holdings’ and its subsidiaries’ assets used in, and entities primarily engaged in, providing water treatment and other water and environmental services. So long as Holdings controls our General Partner, the omnibus agreement will remain in full force and effect, unless we and Holdings agree to terminate it sooner. If Holdings ceases to control our General Partner, either party may terminate the omnibus agreement. We and Holdings may agree to further amend the omnibus agreement; however, amendments that the General Partner determines are adverse to our unitholders will also require the approval of the Conflicts Committee of our Board of Directors.
Prior to January 1, 2020, the omnibus agreement called for Holdings to provide certain general and administrative services, including executive management services and expenses associated with our being a publicly-traded entity (such as audit, tax, and transfer agent fees, among others) in return for a fixed annual fee (adjusted for inflation) that was payable quarterly. In an effort to simplify this arrangement so it would be easier for investors to understand, in November 2019, with the approval of the Conflicts Committee of the Board of Directors, we and Holdings agreed to terminate the management fee provisions of the omnibus agreement effective December 31, 2019. Beginning January 1, 2020, the executive management services and other general and administrative expenses that Holdings previously incurred and charged to us via the annual administrative fee are charged directly to us as they are incurred. Under our current cost structure, these direct expenses have been lower than the annual administrative fee that we previously paid, although we experience more variability in our quarterly general and administrative expense now that we are incurring the expenses directly than when we paid a consistent administrative fee each quarter. For the years ended December 31, 2019 and 2018, Holdings charged us an administrative fee of $4.5 million and $4.0 million, respectively, recorded within general and administrative in the Consolidated Statement of Operations.
Because of our limited partnership structure, all of the employees who conduct our business are employed by affiliates of Holdings, although we often refer to these individuals in this report as our employees. We generally reimburse Holdings for the compensation costs associated with these employees, although Holdings has committed to waiving certain expense reimbursements if certain specified events occur during a specified period of time, up to a maximum expense waiver of $4.0 million.
Alati Arnegard, LLC
The Partnership provides management services to a 25% owned company, Alati Arnegard, LLC (“Arnegard”), which is part of the Environmental Services segment. We recorded earnings from this investment of $0.2 million in each of 2020, 2019, and 2018, respectively. These earnings are recorded in other, net on the Consolidated Statements of Operations and equity in earnings of investee on the Consolidated Statements of Cash Flows. Management fee revenue earned from Arnegard is included in revenues on the Consolidated Statements of Operations and totaled $0.7 million in 2020, 2019, and 2018, respectively. Accounts receivable from Arnegard totaled $0.2 million and $0.1 million at December 31, 2020 and 2019, respectively, and is included in trade accounts receivable, net on the Consolidated Balance Sheets. Our investment in Arnegard totaled approximately $0.4 million at both December 31, 2020 and 2019, respectively and is included in other assets on the Consolidated Balance Sheets.
89
CYPRESS ENVIRONMENTAL PARTNERS, L.P.
Notes to Consolidated Financial Statements
CF Inspection Management, LLC
We have entered into a joint venture with CF Inspection, a nationally-qualified woman-owned company. CF Inspection allows us to offer various services to clients that require the services of an approved Women’s Business Enterprise (“WBE”), as CF Inspection is certified as a Women’s Business Enterprise by the Supplier Clearinghouse in California and as a National Women’s Business Enterprise by the Women’s Business Enterprise National Council. We own 49% of CF Inspection and Cynthia A. Field, an affiliate of Holdings and a Director of our General Partner, owns the remaining 51% of CF Inspection. For the years ended December 31, 2020, 2019, and 2018, CF Inspection, which is part of the Inspection Services segment, represented 5.0%, 3.3%, and 3.4% of our consolidated revenue, respectively.
Sale of Preferred Equity
As described in Note 8, we issued and sold $43.5 million of preferred equity to an affiliate in May 2018.
Pipeline and Process Services
Entities owned by Holdings provide contract labor support to our Pipeline & Process Services segment. During the years ended December 31, 2020, 2019, and 2018, we incurred $0.6 million, $0.2 million, and $0.1 million of expense associated with these services, which is included in costs of services in our Consolidated Statements of Operations.
| 12. | Leases |
We determine if an agreement contains a lease at the inception of the arrangement. If an arrangement is determined to contain a lease, we classify the lease as an operating lease or a finance lease, depending on the terms of the arrangement. Right-of-use (“ROU”) assets represent the right to use an underlying asset for the lease term, and lease liabilities represent the obligation to make lease payments arising from the lease. These assets and liabilities are initially recognized based on the present value of lease payments over the lease term calculated using our incremental borrowing rate unless the implicit rate is readily determinable. Lease assets also include any upfront lease payments made and exclude lease incentives. The lease terms of our leases include options to extend or terminate the lease when it is reasonably certain that those options will be exercised.
Practical Expedients and Accounting Policy Elections
We made accounting policy elections to not capitalize leases with a lease term of twelve months or less and to not separate lease and non-lease components for all asset classes. We also elected the package of practical expedients within ASU 2016-02 that allows an entity to not reassess prior to the effective date (i) whether any expired or existing contracts are or contain leases, (ii) the lease classification for any expired or existing leases, or (iii) initial direct costs for any existing leases, but did not elect the practical expedient of hindsight when determining the lease term of existing contracts at the effective date.
Discount Rate
Our lease agreements do not generally provide an implicit interest rate. As a result, we use our incremental borrowing rate as the discount rate in calculating the present value of the lease payments. The incremental borrowing rate is the estimated rate of interest that we would have to pay to borrow on a collateralized basis over a similar term an amount equal to the lease payments in a similar economic environment.
Operating Leases
Our operating leases include leases for office space and land lease agreements for four of our water treatment facilities. Our lease for our office space headquarters constitutes $1.8 million of our Operating ROU asset at December 31, 2020 of $2.0 million. The lease expires in November of 2024, unless terminated earlier with a payment of a penalty under certain circumstances specified in our lease. In the determination of the lease term for this lease, we concluded the lease term would extend through November 2024, as it was not reasonably certain at the inception of the agreement that we would exercise any of the termination options in the agreement. As of December 31, 2020, the weighted average remaining lease term and weighted average discount rate for our operating leases was 4.2 years and 6.1%, respectively. Our operating leases are reflected as operating lease right-of-use assets within noncurrent assets and operating lease obligations within current and noncurrent liabilities on our Consolidated Balance Sheets.
90
CYPRESS ENVIRONMENTAL PARTNERS, L.P.
Notes to Consolidated Financial Statements
Our operating lease obligations at December 31, 2020 with terms that are greater than one year mature as follows (in thousands):
| 2021 | $ | 557 | ||
| 2022 | 557 | |||
| 2023 | 557 | |||
| 2024 | 513 | |||
| 2025 | 29 | |||
| Thereafter | 66 | |||
| Total lease payments | $ | 2,279 | ||
| Less imputed interest | (291 | ) | ||
| Total operating lease obligation | $ | 1,988 |
Finance Leases
Our finance leases primarily include leases for vehicles. As of December 31, 2020, the weighted average remaining lease term and weighted average discount rate for our finance leases was 2.3 years and 5.4%, respectively. Our finance leases are reflected as finance lease right-of-use assets, net within noncurrent assets and finance lease obligations within current and noncurrent liabilities on our Consolidated Balance Sheets.
Our finance lease obligations at December 31, 2020 with terms that are greater than one year mature as follows (in thousands):
| 2021 | $ | 274 | ||
| 2022 | 206 | |||
| 2023 | 93 | |||
| Total lease payments | $ | 573 | ||
| Less imputed interest | (23 | ) | ||
| Total finance lease obligation | $ | 550 |
Lease Expense Components
During the years ended December 31, 2020 and 2019, our lease expense consists of the following components (in thousands):
| Year Ended December 31 | ||||||||
| 2020 | 2019 | |||||||
| Finance lease expense: | ||||||||
| Amortization of right-of-use assets | $ | 276 | $ | 178 | ||||
| Interest on lease liabilities | 37 | 31 | ||||||
| Operating lease expense | 681 | 672 | ||||||
| Short-term lease expense - general and administrative | 67 | 103 | ||||||
| Short-term lease expense - costs of services (a) | 3,695 | 3,570 | ||||||
| Variable lease expense | 7 | 10 | ||||||
| Sublease income - related parties | (28 | ) | (32 | ) | ||||
| Total lease expense | $ | 4,735 | $ | 4,532 | ||||
| (a) | These short-term lease expenses are included in costs of services within our Consolidated Statement of Operations. The nature of these expenses includes the rental of compressors, dryers, vehicles, frac tanks, launchers, receivers and various other types of equipment. These rentals have lease terms of one year or less. |
91
CYPRESS ENVIRONMENTAL PARTNERS, L.P.
Notes to Consolidated Financial Statements
| 13. | Commitments and Contingencies |
Security Deposits
The Partnership has various performance obligations which are secured with short-term security deposits (reflected as restricted cash equivalents on our Consolidated Statements of Cash Flows) totaling $0.7 million and $0.6 million at December 31, 2020 and 2019, respectively. These amounts are reported in prepaid expenses and other on the Consolidated Balance Sheets.
Compliance Audit Contingencies
Certain agreements with customers offer our customers the right to perform periodic compliance audits, which include the examination of the accuracy of our invoices. Should our invoices be determined to be inconsistent with the agreements, the agreements may provide the customer the right to receive a credit or refund for overcharges identified. At any given time, we may have multiple audits ongoing. As of December 31, 2020 and 2019, we established a reserve of $0.3 million and $0.2 million, respectively, as an estimate of potential liabilities related to these compliance audit contingencies.
Litigation Settlements
In 2019, we agreed to a settlement with a former subcontractor. As part of the settlement, we made specified cash payments in November 2019, January 2020, and July 2020. We recorded a gain of $1.3 million within other, net in the Consolidated Statement of Operations in the fourth quarter of 2019 related to this settlement. In addition, we recorded expense of $0.5 million and $0.1 million in 2020 and 2019, respectively, related to the completed or proposed settlement of various litigation matters. We recorded this expense within general and administrative in the Consolidated Statements of Operations.
Legal Proceedings
Other
We are and may in the future be subject to litigation involving allegations of violations of the Fair Labor Standards Act and state wage and hour laws. In addition, we generally indemnify our customers for claims related to the services we provide and actions we take under our contracts, including claims regarding the Fair Labor Standards Act and state wage and hour laws, and, in some instances, we may be allocated risk through our contract terms for actions by our customers or other third parties. Claims related to the Fair Labor Standards Act are generally not covered by insurance. From time to time, we are subject to various claims, lawsuits and other legal proceedings brought or threatened against us in the ordinary course of our business. These actions and proceedings may seek, among other things, compensation for alleged personal injury, workers’ compensation, employment discrimination and other employment-related damages, breach of contract, property damage, environmental liabilities, multiemployer pension plan withdrawal liabilities, punitive damages and civil penalties or other losses, liquidated damages, consequential damages, or injunctive or declaratory relief. The outcome of related litigation is unknown at this time but could be material to our financial statements in future periods.
92
CYPRESS ENVIRONMENTAL PARTNERS, L.P.
Notes to Consolidated Financial Statements
| 14. | Segment Disclosures |
The Partnership’s operations consist of three reportable segments: (i) Inspection Services, (ii) Pipeline & Process Services, and (iii) Water and Environmental Services (“Environmental Services”). The amounts within “Other” represent corporate and overhead items not specifically allocable to the other reportable segments.
The following table outlines segment operating income and a reconciliation of total segment operating income to net income before income tax expense.
| Inspection Services | Pipeline and Process Services | Environmental Services | Other | Total | ||||||||||||||||
| (in thousands) | ||||||||||||||||||||
| Year ended December 31, 2020 | ||||||||||||||||||||
| Revenues | $ | 181,526 | $ | 18,716 | $ | 5,754 | $ | — | $ | 205,996 | ||||||||||
| Costs of services | 161,726 | 13,743 | 2,015 | — | 177,484 | |||||||||||||||
| Gross margin | 19,800 | 4,973 | 3,739 | — | 28,512 | |||||||||||||||
| General and administrative | 15,282 | 2,308 | 1,802 | 708 | 20,100 | |||||||||||||||
| Depreciation, amortization and accretion | 2,217 | 558 | 1,648 | 460 | 4,883 | |||||||||||||||
| (Gains) losses on asset disposals, net | — | (32 | ) | 5 | — | (27 | ) | |||||||||||||
| Operating income (loss) | $ | 2,301 | $ | 2,139 | $ | 284 | $ | (1,168 | ) | 3,556 | ||||||||||
| Interest expense, net | (4,028 | ) | ||||||||||||||||||
| Foreign currency gains | 107 | |||||||||||||||||||
| Other, net | 541 | |||||||||||||||||||
| Net income before income tax expense | $ | 176 | ||||||||||||||||||
| Year ended December 31, 2019 | ||||||||||||||||||||
| Revenues | $ | 371,994 | $ | 19,337 | $ | 10,317 | $ | — | $ | 401,648 | ||||||||||
| Costs of services | 331,498 | 13,397 | 3,029 | — | 347,924 | |||||||||||||||
| Gross margin | 40,496 | 5,940 | 7,288 | — | 53,724 | |||||||||||||||
| General and administrative | 19,086 | (a) | 2,500 | 2,995 | (b) | 1,045 | 25,626 | |||||||||||||
| Depreciation, amortization and accretion | 2,224 | 574 | 1,632 | 18 | 4,448 | |||||||||||||||
| Losses (gains) on asset disposals, net | 1 | (26 | ) | — | — | (25 | ) | |||||||||||||
| Operating income (loss) | $ | 19,185 | $ | 2,892 | $ | 2,661 | $ | (1,063 | ) | 23,675 | ||||||||||
| Interest expense, net | (5,330 | ) | ||||||||||||||||||
| Foreign currency gains | 222 | |||||||||||||||||||
| Other, net | 1,111 | |||||||||||||||||||
| Net income before income tax expense | $ | 19,678 | ||||||||||||||||||
| Year ended December 31, 2018 | ||||||||||||||||||||
| Revenues | $ | 288,083 | $ | 15,001 | $ | 11,876 | $ | — | $ | 314,960 | ||||||||||
| Costs of services | 256,436 | 10,708 | 3,770 | — | 270,914 | |||||||||||||||
| Gross margin | 31,647 | 4,293 | 8,106 | — | 44,046 | |||||||||||||||
| General and administrative | 17,010 | (c) | 2,379 | 3,295 | (b) | 1,060 | 23,744 | |||||||||||||
| Depreciation, amortization and accretion | 2,237 | 592 | 1,575 | — | 4,404 | |||||||||||||||
| Gains on asset disposals, net | (21 | ) | (83 | ) | (4,004 | ) | — | (4,108 | ) | |||||||||||
| Operating income (loss) | $ | 12,421 | $ | 1,405 | $ | 7,240 | $ | (1,060 | ) | $ | 20,006 | |||||||||
| Interest expense, net | (6,320 | ) | ||||||||||||||||||
| Foreign currency loss | (643 | ) | ||||||||||||||||||
| Other, net | 373 | |||||||||||||||||||
| Net income before income tax expense | $ | 13,416 | ||||||||||||||||||
| Total Assets | ||||||||||||||||||||
| December 31, 2020 | $ | 82,458 | $ | 11,988 | $ | 19,708 | $ | 5,832 | $ | 119,986 | ||||||||||
| December 31, 2019 | $ | 114,858 | $ | 14,318 | $ | 21,911 | $ | 6,255 | $ | 157,342 | ||||||||||
| (a) | Amount includes $3.3 million of the administrative fee charged by Holdings specified in the omnibus agreement. |
| (b) | Amount includes $1.2 million of the administrative fee charged by Holdings specified in the omnibus agreement. |
| (c) | Amount includes $2.8 million of the administrative fee charged by Holdings specified in the omnibus agreement. |
93
CYPRESS ENVIRONMENTAL PARTNERS, L.P.
Notes to Consolidated Financial Statements
| 15. | Distributions |
The following table summarizes the cash distributions that we declared and paid on common and subordinated units since our initial public offering:
| Payment Date | Per Unit Cash Distributions | Total Cash Distributions | Total Cash Distributions to Affiliates (a) | |||||||||
| (in thousands) | ||||||||||||
| Total 2014 Distributions | $ | 1.104646 | $ | 13,064 | $ | 8,296 | ||||||
| Total 2015 Distributions | 1.625652 | 19,232 | 12,284 | |||||||||
| Total 2016 Distributions | 1.625652 | 19,258 | 12,414 | |||||||||
| Total 2017 Distributions | 1.036413 | 12,310 | 7,928 | |||||||||
| Total 2018 Distributions | 0.840000 | 10,019 | 6,413 | |||||||||
| February 14, 2019 | 0.210000 | 2,510 | 1,606 | |||||||||
| May 15, 2019 | 0.210000 | 2,531 | 1,622 | |||||||||
| August 14, 2019 | 0.210000 | 2,534 | 1,624 | |||||||||
| November 14, 2019 | 0.210000 | 2,534 | 1,627 | |||||||||
| Total 2019 Distributions | 0.840000 | 10,109 | 6,479 | |||||||||
| February 14, 2020 | 0.210000 | 2,534 | 1,627 | |||||||||
| May 15, 2020 | 0.210000 | 2,564 | 1,641 | |||||||||
| Total 2020 Distributions | 0.420000 | 5,098 | 3,268 | |||||||||
| Total Distributions (since IPO) | $ | 7.492363 | $ | 89,090 | $ | 57,082 | ||||||
| (a) | Approximately 64% of the Partnership's outstanding common units at December 31, 2020 were held by affiliates. |
94
CYPRESS ENVIRONMENTAL PARTNERS, L.P.
Notes to Consolidated Financial Statements
The following table summarizes the distributions paid to our preferred unitholder:
| Payment Date | Cash Distributions | |||
| (in thousands) | ||||
| November 14, 2018 (a) | $ | 1,412 | ||
| Total 2018 Distributions | 1,412 | |||
| February 14, 2019 | 1,033 | |||
| May 15, 2019 | 1,033 | |||
| August 14, 2019 | 1,033 | |||
| November 14, 2019 | 1,034 | |||
| Total 2019 Distributions | 4,133 | |||
| February 14, 2020 | 1,033 | |||
| May 15, 2020 | 1,033 | |||
| August 14, 2020 | 1,033 | |||
| November 14, 2020 | 1,034 | |||
| Total 2020 Distributions | 4,133 | |||
| Total Distributions | $ | 9,678 | ||
| (a) | This distribution relates to the period from May 29, 2018 (date of preferred unit issuance) through September 30, 2018. |
In July 2020, in light of the challenging market conditions, we made the difficult decision to temporarily suspend payment of common unit distributions. This has enabled us to retain more cash to manage our financing needs. As described in Note 6, our Credit Facility, as amended in March 2021, contains significant restrictions on our ability to pay cash distributions.
| 16. | Sale of Water Treatment facilities |
In 2018, we sold our subsidiaries Cypress Energy Partners – Orla SWD, LLC (“Orla”) and Cypress Energy Partners – Pecos SWD, LLC (“Pecos”), each of which owned a water treatment facility in Texas, in separate transactions to unrelated parties for a combined $12.2 million of cash proceeds and a royalty interest in the future revenues of the Pecos facility. We recorded a combined gain on these transactions of $3.6 million in 2018, which represented the excess of the cash proceeds over the net book value of the assets sold. These gains are reported within gain on asset disposals, net in our Consolidated Statements of Operations. The net book value of the assets sold included $5.0 million of allocated goodwill, calculated based on the estimated fair value of the Orla and Pecos facilities relative to the estimated fair value of the Environmental Services reporting unit as a whole. These calculation are considered Level 3 and the fair values included in these calculations were determined utilizing estimated discounted cash flows of the Orla and Pecos facilities and the Environmental Services reporting unit as a whole as of the dates of sales. We used the proceeds from these transactions to reduce our outstanding debt.
The Pecos and Orla facilities generated combined revenues and operating income (loss) of $0.2 million and approximately ($0.1) million in 2018, respectively.
95
| ITEM 9. | CHANGES IN AND DISAGREEMENTS WITH ACCOUNTANTS ON ACCOUNTING AND FINANCIAL DISCLOSURE |
None.
| ITEM 9A. | CONTROLS AND PROCEDURES |
Evaluation of Disclosure Controls and Procedures.
As required by Rule 13a-15(b) of the Exchange Act, we have evaluated, under the supervision and with the participation of our management, including the principal executive officer and principal financial officer of our general partner, the effectiveness of the design and operation of our disclosure controls and procedures (as defined in Rule 13a-15(e) or Rule 15d-15(e) under the Exchange Act) as of the end of the period covered by this Annual Report. Our disclosure controls and procedures are designed to provide reasonable assurance that the information required to be disclosed by us in reports that we file under the Exchange Act is accumulated and communicated to our management, including the principal executive officer and principal financial officer of our general partner, as appropriate, to allow timely decisions regarding required disclosure and is recorded, processed, summarized and reported within the time periods specified in the rules and forms of the SEC. Based upon the evaluation, the principal executive officer and principal financial officer of our general partner have concluded that our disclosure controls and procedures were effective at the reasonable assurance level as of December 31, 2020. Additionally, we have implemented a quarterly sub-certification process whereby other members of management review our filings and confirm their responsibility for, among other things, the effectiveness of key controls in their functional areas and that they are not aware of any material inaccuracies or omissions in our financial statements.
Our management, including our principal executive officer and principal financial officer, does not expect that our disclosure controls or our internal controls over financial reporting (“Internal Controls”) will prevent all errors and all fraud. A control system, no matter how well conceived and operated, can provide only reasonable, not absolute, assurance that the objectives of the control system are met. Further, the design of a control system must reflect the fact that there are resource constraints, and the benefits of controls must be considered relative to their costs. Because of the inherent limitations in all control systems, no evaluation of controls can provide absolute assurance that all control deficiencies and instances of fraud, if any, within the Partnership have been detected. These inherent limitations include the realities that judgments in decision-making can be faulty, and that simple errors or mistakes can occur. Additionally, controls can be circumvented by the individual acts of some persons, by collusion of two or more people, or by management override of the control. The design of any system of controls also is based, in part, upon certain assumptions about the likelihood of future events, and there can be no assurance that any design will succeed in achieving its stated goals under all potential future conditions. Over time, controls may become inadequate because of changes in conditions, or the degree of compliance with the policies or procedures may deteriorate. Because of the inherent limitations in a cost-effective control system, misstatements due to error or fraud may occur and not be detected. We monitor our disclosure controls and internal controls and make modifications as necessary; our intent in this regard is that the disclosure controls and the internal controls will be maintained as systems change and conditions warrant.
Management’s Report on Internal Control over Financial Reporting
Our management is responsible for establishing and maintaining adequate and effective internal control over financial reporting, as such term is defined under Exchange Act Rule 13a-15(f). Our internal control over financial reporting is a process that is designed under the supervision of our Chief Executive Officer and Chief Financial Officer, and effected by our Board of Directors, management and other personnel, to provide reasonable assurance regarding the reliability of financial reporting and the preparation of financial statements for external purposes in accordance with GAAP. Our internal control over financial reporting includes those policies and procedures that:
| i. | pertain to the maintenance of records that, in reasonable detail, accurately and fairly reflect the transactions and dispositions of our assets; |
| ii. | provide reasonable assurance that transactions are recorded as necessary to permit preparation of financial statements in accordance with GAAP, and that receipts and expenditures recorded by us are being made only in accordance with authorizations of our management and Board of Directors; and |
| iii. | provide reasonable assurance regarding prevention or timely detection of unauthorized acquisition, use, or disposition of our assets that could have a material effect on our financial statements. |
Because of its inherent limitations, internal control over financial reporting may not prevent or detect misstatements. Also, projections of any evaluation of effectiveness to future periods are subject to the risk that controls may become inadequate because of changes in conditions, or that the degree of compliance with the policies and procedures may deteriorate.
96
The internal controls are supported by written processes and complemented by a staff of competent business process owners, as well as competent and qualified internal specialists used to assist in testing the operating effectiveness of the internal control over financial reporting.
Management has conducted its evaluation of the effectiveness of internal control over financial reporting as of December 31, 2020 based on the framework in Internal Control – Integrated Framework (2013) issued by the Committee of Sponsoring Organizations of the Treadway Commission (“COSO”). Management’s assessment included an evaluation of the design of our internal control over financial reporting and testing the operational effectiveness of our internal control over financial reporting. Management reviewed the results of the assessment with the Audit Committee of the Board of Directors. Based on its assessment and review with the Audit Committee, management concluded that, at December 31, 2020, we maintained effective internal control over financial reporting, and management believes that we have no material internal control weaknesses in our financial reporting process.
Changes in Internal Control over Financial Reporting
There were no changes in our internal control over financial reporting that occurred during the three months ended December 31, 2020 that have materially affected, or are reasonably likely to materially affect, our internal control over financial reporting.
None.
ITEM 10. DIRECTORS, EXECUTIVE OFFICERS AND CORPORATE GOVERNANCE MANAGEMENT
Management of Cypress Environmental Partners, L.P.
We are managed by the executive officers of our general partner. Our general partner is not elected by our unitholders and will not be subject to re-election by our unitholders in the future. Affiliates of Holdings indirectly own all of the membership interests in our general partner. Our general partner has a board of directors, and our unitholders are not entitled to elect the directors or directly or indirectly participate in our management or operations. Our general partner will be liable, as general partner, for all of our debts (to the extent not paid from our assets), except for indebtedness or other obligations that are specifically nonrecourse. Whenever possible, we intend to incur indebtedness that is nonrecourse to our general partner.
Our general partner currently has six directors. Holdings appoints all members to the board of directors of our general partner. Pursuant to our general partner’s operating agreement, Holdings appointed to our board of directors (i) Peter C. Boylan III, who has the right to serve as a director as long as CEP Capital Partners, LLC, an entity controlled by Mr. Boylan, is a member of Holdings and (ii) such other individuals selected by Mr. Boylan that, together with Mr. Boylan, constitute a percentage of the board of directors equal to the percentage of Holdings that CEP Capital Partners, LLC owns. In his exercise of this right, Mr. Boylan has appointed himself and may appoint others to the board. We have three independent directors who qualify for service on the audit committee. Our board of directors has determined that Jack H. Stark, John T. McNabb II, and Stanley A. Lybarger are independent under the independence standards of the NYSE and eligible to serve on the audit committee.
Our general partner has the sole responsibility for providing the employees and other personnel necessary to conduct our operations. All of the employees that conduct our business are employed by affiliates of our general partner, although we sometimes refer to these individuals in this report as our employees.
Director Independence
Although most companies listed on the NYSE are required to have a majority of independent directors serving on the board of directors of the listed company, the NYSE does not require a publicly-traded limited partnership like us to have a majority of independent directors on the board of directors of our general partner, or to establish a compensation or a nominating and corporate governance committee. All of our audit committee members are required to meet the independence and financial literacy tests established by the NYSE and the Exchange Act.
97
Committees of the Board of Directors
The board of directors of our general partner has an audit committee and a conflicts committee, and may have such other committees as the board of directors shall determine from time to time. Each of the standing committees of the board of directors will have the composition and responsibilities described below.
Audit Committee
Our general partner has an audit committee comprised of three directors who each meet the independence and experience standards established by the NYSE and the Exchange Act. Jack H. Stark, John T. McNabb II, and Stanley A. Lybarger serve as members of our audit committee. Mr. Lybarger began serving as Chairman of the audit committee upon his appointment on March 5, 2014. Mr. McNabb served as Chairman prior to that date. Our board of directors has determined that Mr. Lybarger, Mr. Stark, and Mr. McNabb each have such accounting or related financial management expertise sufficient to qualify as an audit committee financial expert in accordance with Item 407(d) of Regulation S-K. Our audit committee assists the board of directors in its oversight of the integrity of our financial statements and our compliance with legal and regulatory requirements and corporate policies and controls. Our audit committee has the sole authority to retain and terminate our independent registered public accounting firm, approve all auditing services and related fees and the terms thereof, and pre-approve any non-audit services to be rendered by our independent registered public accounting firm. Our audit committee is also responsible for confirming the independence and objectivity of our independent registered public accounting firm. Our independent registered public accounting firm is given unrestricted access to our audit committee.
Conflicts Committee
At least two members of the board of directors of our general partner will serve on our conflicts committee to review specific matters that may involve conflicts of interest in accordance with the terms of our partnership agreement. John T. McNabb II, Jack H. Stark, and Stanley A. Lybarger serve as the members of the conflicts committee. Mr. McNabb serves as the Chairman of the conflicts committee. The board of directors of our general partner determines whether to refer a matter to the conflicts committee on a case-by-case basis. The members of our conflicts committee may not be officers or employees of our general partner or directors, officers, or employees of its affiliates, and must meet the independence and experience standards established by the NYSE and the Exchange Act to serve on a committee of a board of directors. In addition, the members of our conflicts committee may not own any interest in our general partner or any interest in us or our subsidiaries other than common units acquired on the open market or awards under our incentive compensation plan. If our general partner seeks approval from the conflicts committee, then it will be presumed that, in making its decision, the conflicts committee acted in good faith, and in any proceeding brought by or on behalf of any limited partner or the partnership challenging such determination, the person bringing or prosecuting such proceeding will have the burden of overcoming such presumption. Please read “Conflicts of Interest and Duties.”
Directors and Executive Officers of Cypress Environmental Partners GP, LLC
Directors are elected by Holdings and hold office until their successors have been elected or qualified or until their earlier death, resignation, removal or disqualification. Executive officers are appointed by, and serve at the discretion of, the board of directors. The following table shows information for the directors and executive officers of our general partner.
| Name | Age | Position with Cypress Environmental Partners GP, LLC | ||
| Peter C. Boylan III | 57 | Chairman of the Board, Chief Executive Officer and President | ||
| Richard M. Carson | 54 | Senior Vice President and General Counsel | ||
| Jeffrey A. Herbers | 44 | Vice President and Chief Financial Officer | ||
| Cynthia A. Field | 60 | Director | ||
| Stanley A. Lybarger | 71 | Director & Audit Committee Chairman | ||
| John T. McNabb, II | 76 | Director & Conflicts Committee Chairman | ||
| Jack H. Stark | 76 | Director | ||
| Charles C. Stephenson, Jr. | 84 | Director |
98
Peter C. Boylan III became co-Founder, President and Chief Executive Officer of Holdings in April 2012, and Chairman of the Board, President and Chief Executive Officer of Cypress Environmental Partners, GP, LLC, in September 2013. Since March 2002, Mr. Boylan has been the Chief Executive Officer of Boylan Partners, LLC, a provider of investment and advisory services. From 1995 to 2004, Mr. Boylan served in a variety of senior executive management positions of various public and private companies controlled by Liberty Media Corporation, including serving as a board member, Chairman, President, Chief Executive Officer, Chief Operation Officer and Chief Financial Officer of several different companies. Mr. Boylan currently serves on the board of directors of publicly-traded BOK Financial Corporation. Mr. Boylan has also served on over a dozen other public and private company boards of directors over the last 20+ years. Mr. Boylan has extensive corporate senior executive management and leadership experience, and specific expertise with accounting, finance, audit, risk and compensation committee service, intellectual property, corporate development, health care, media, cable and satellite TV, software development, technology, energy and civic and community service. We believe this experience suits Mr. Boylan to serve as Chairman of the Board, Chief Executive Officer and President.
Richard M. Carson is Senior Vice President and General Counsel of Cypress Environmental Partners, GP, LLC, having served in that capacity since March 2016 and having previously served as Vice President and General Counsel since September 2013. Mr. Carson served as a director, officer, and shareholder of Gable & Gotwals, a Professional Corporation (“Gable Gotwals”), a law firm, where he practiced securities, corporate finance, transactional and environmental law, primarily for clients in the energy industry, including several master limited partnerships. Prior to joining Gable Gotwals, from 1999 to 2008, Mr. Carson served in the legal department of The Williams Companies, Inc. (“Williams”), where he counseled Williams in regard to securities, corporate finance, and environmental matters, particularly relating to Williams’ master limited partnership subsidiaries, Williams Partners L.P., Williams Pipeline Partners L.P., and Williams Energy Partners L.P. (predecessor to Magellan Midstream Partners, L.P.). Mr. Carson began his career in 1991 working in legal, compliance, and management roles, primarily in the environmental services industry, before joining Williams. Mr. Carson received a Juris Doctor in 1991 from the University of Oklahoma and a Bachelor of Science, Cum Laude, from the University of Tulsa’s Honors Program in 1988. Mr. Carson serves on the board of directors of Land Legacy, an environmental conservation land trust. He has previously served as the Chair of the Oklahoma Bar Association’s Environmental Law Section, and the chair of the Environmental Auditing Roundtable’s South-Central Region.
Jeffrey A. Herbers is Vice President and Chief Financial Officer of Cypress Environmental Partners, GP, LLC, having served in that capacity since November 2018. Prior to being appointed as Chief Financial Officer of Cypress Environmental Partners, GP, LLC, Mr. Herbers served as the Vice President and Chief Accounting Officer of Cypress Environmental Partners, GP, LLC from September 2016 to November 2017 and as the Interim Chief Financial Officer from November 2017 to November 2018. Mr. Herbers served as sole member of Jeff Herbers PLLC from December 2015 until September 2016. Mr. Herbers served as the Chief Accounting Officer of the general partner of NGL Energy Partners LP from February 2012 to November 2015, as the Director of Financial Reporting of SemGroup Corporation from August 2009 to January 2012, and as an auditor for Ernst & Young LLP from August 1998 to July 2009. Mr. Herbers holds a B.B.A. in accounting from the University of Tulsa. He is a certified public accountant and a member of the American Institute of Certified Public Accountants.
Cynthia A. Field has been a director on the board of Cypress Environmental Partners, GP, LLC since November 2018. Ms. Field has served as the Sole Manager of CF Inspection Management, LLC, a Women’s Business Enterprise by the Supplier Clearinghouse in California and as a National Women’s Business Enterprise by the Women’s Business Enterprise National Council, since August of 2013. Ms. Field was appointed President and Chief Executive Officer of CF Inspection in January 2018. Ms. Field is the daughter of Charles C. Stephenson, Jr., one of the directors on the board of Cypress Environmental Partners, GP, LLC. Ms. Field also serves as the Executive Director and a Trustee of the Charles & Peggy Stephenson Family Foundation, and as a member of the Gilcrease Museum National Advisory Board.
Stanley A. Lybarger has served as a director on the board of Cypress Environmental Partners, GP, LLC since March 5, 2014. Mr. Lybarger retired as president and chief executive officer of BOK Financial, a leading regional bank, on January 1, 2014. He continues to serve on the board of directors of that corporation. Mr. Lybarger had a 40-year career with BOK Financial. Mr. Lybarger served as its first president and chief operating officer, in addition to continuing to hold that title for Bank of Oklahoma. He became the chief executive officer for BOK Financial and Bank of Oklahoma in 1996. Mr. Lybarger earned B.A. and M.B.A. degrees from the University of Kansas, and a Certification from the Stonier Graduate School of Banking at Rutgers University. Mr. Lybarger has also been an industry and community leader for decades and has held leadership positions at a number of organizations, including serving on the Federal Advisory Council (a 12-member council which consults and advises the Federal Reserve Board of Governors in Washington, DC), the Executive Committee of the Financial Institutions Division of the American Bankers Association, Chairman of the Tulsa Stadium Trust, Chairman of the Tulsa Metro Chamber, Chairman of the Oklahoma State Chamber, Chairman of the Oklahoma Business Roundtable and Chairman of Tulsa Area United Way.
99
John T. McNabb II has served as a director on the board of Cypress Environmental Partners GP, LLC since January 14, 2014 and serves as Chairman of our conflicts committee. He co-founded the Trump Leadership Council in April 2016 and served on the council until January 2017. He has also served as Vice Chairman of the American Leadership Council since August 2018. Mr. McNabb has served on the boards of eight publicly-traded companies and currently sits on the board of Continental Resources (where he has served as Lead Director). Mr. McNabb was elected to serve as non-executive Chairman of the Board of Willbros Group, Inc. from September 2007 until August 2014 when he was appointed Executive Chairman. He was appointed Chief Executive Officer in October 2014 and elected to the board of Directors in August 2006. Effective December 1, 2015, Mr. McNabb retired from his positions as Chairman and Chief Executive Officer and did not stand for re-election when his term as Director expired in 2016. Mr. McNabb also serves as Senior Advisor and was formerly Vice Chairman, Corporate Finance of Duff & Phelps Securities LLC, a leading global financial advisory firm. Prior thereto, Mr. McNabb was a founder and Chairman of Growth Capital Partners LP and formerly was a Managing Director of Bankers Trust New York Corporation and a board member of BT Southwest Inc., a wholly-owned subsidiary of Bankers Trust. Prior thereto, he served in various capacities with The Prudential Insurance Company of America including having responsibility for a multi-billion dollar investment portfolio primarily focused on energy investments. He started his energy career with Mobil Oil in the E&P Division. He has owned equity interests in approximately twenty private energy related companies and acted in operating or financial roles in several. Mr. McNabb has also served as a director of twelve private energy companies located in both Canada and the United States. He is an emeritus member of the board of Visitors of The Fuqua School of Business at Duke University and served as Chairman of the Board of Visitors of The University of Houston and also served as Chairman of the Dean’s Advisory Board at The Bauer College of Business and as an Executive Professor of Finance at the University of Houston. Mr. McNabb holds BA and MBA degrees from Duke University and served in the US Air Force during the Vietnam conflict, rising to the rank of Captain and was awarded the Air Medal with three Oak Leaf Clusters and the Distinguished Flying Cross.
Jack H. Stark became a director of our board in April 2020. Mr. Stark has over 40 years of experience in the upstream E&P industry and is currently President and Chief Operating Officer of Continental Resources, Inc. ("Continental"). Mr. Stark joined Continental as Exploration Manager in 1992 and over his 28 years with Continental served as Senior Vice President of Exploration from 1998 to 2014 and was appointed President and Chief Operating Officer in 2014. Mr. Stark also served on Continental’s Board of Directors from 1998 until 2008. Prior to joining Continental, Mr. Stark was Exploration Manager for the Western Mid-Continent Region for Pacific Enterprises from 1988 to 1992 and held various staff and middle management positions with Cities Service Company, Texas Oil and Gas and Western Nuclear from 1978 to 1988. Mr. Stark holds a master’s degree of Science in Geology from Colorado State University and is a member of the American Association of Petroleum Geologists, The Petroleum Alliance of Oklahoma, WildCatters Club, Rocky Mountain Association of Geologists, Houston Geological Society and the Oklahoma City Geological Society.
Charles C. Stephenson, Jr. has been a director on the board of Cypress Environmental Partners, GP, LLC since the close of the initial public offering in January 2014. Previously, Mr. Stephenson served as Chairman of the Board of Premier Natural Resources, an independent oil and gas company of which he is also a co- founder. Mr. Stephenson is also an owner of Regent Private Capital II LLC and was a co-founder and director of Growth Capital Partners, an investment and merchant banking firm. From 1983 to 2006, Mr. Stephenson worked for Vintage Petroleum, Inc. which he founded and for which he served as Chairman of the Board, President, and Chief Executive Officer at the time of its sale to Occidental Petroleum in 2006. Mr. Stephenson received a B.S. in petroleum engineering from the University of Oklahoma. Mr. Stephenson is a member of the Society of Petroleum Engineers and has served on the board of the National Petroleum Council.
Board Leadership Structure
The chief executive officer of our general partner currently serves as the chairman of the board. The board of directors of our general partner has no policy with respect to the separation of the offices of chairman of the board of directors and chief executive officer. Instead, that relationship is defined and governed by the amended and restated limited liability company agreement of our general partner, which permits the same person to hold both offices. Directors of the board of directors of our general partner are designated or elected by a wholly-owned subsidiary of Holdings. Accordingly, unlike holders of common stock in a corporation, our unitholders will have only limited voting rights on matters affecting our business or governance, subject in all cases to any specific unitholder rights contained in our partnership agreement.
Board Role in Risk Oversight
Our organizational governance guidelines provide that the board of directors of our general partner is responsible for reviewing the process for assessing the major risks facing us and the options for their mitigation. This responsibility will be largely satisfied by our audit committee, which is responsible for reviewing and discussing with management and our registered public accounting firm our major risk exposures and the policies management has implemented to monitor such exposures, including our financial risk exposures and risk management policies.
Corporate Governance
The board of directors of our general partner has adopted Corporate Governance Guidelines that outline important policies and practices regarding our governance and a Code of Business Conduct and Ethics that applies to the directors, officers and employees of our general partner and its affiliates and us.
100
Non-management directors of our general partner meet in executive session without management participation at each meeting of the board of directors. These executive sessions are chaired by Stanley A. Lybarger, the chairman of our audit committee, or such independent director as he designates. Interested parties may communicate directly with the independent directors by submitting a communication in an envelope marked “Confidential” addressed to the “Independent Members of the Board of Directors” in care of Mr. Lybarger at:
Cypress Environmental Partners GP, LLC
5727 S. Lewis Ave., Suite 300
Tulsa, Oklahoma 74105
We make available free of charge, within the “Governance Documents” section of our website at www.cypressenvironmental.biz, the Corporate Governance Guidelines, the Code of Business Conduct and Ethics and our Audit Committee Charter. We intend to disclose any amendments to or waivers from the Code of Business Conduct and Ethics on our website. The information contained on, or connected to, our website is not incorporated by reference into this Annual Report on Form 10-K and should not be considered part of this or any other report that we file with or furnish to the SEC.
Item 11. Executive Compensation
Compensation Overview
We do not directly employ any of the persons responsible for managing our business. Our general partner, under the direction of its board of directors, is responsible for managing our operations and CEM LLC employs the employees who operate our business. The compensation payable to the officers of our general partner is paid by CEM LLC and such payments are reimbursed by us. However, we often refer to the employees and officers of our general partner as our employees and officers in this report.
This executive compensation disclosure provides an overview of the executive compensation program for our named executive officers identified below. For the year ended December 31, 2020, our named executive officers (“NEOs”) were:
| ● | Peter C. Boylan III, our Chairman, Chief Executive Officer, and President; |
| ● | Richard M. Carson, our Senior Vice President and General Counsel; and |
| ● | Jeffrey A. Herbers, our Vice President and Chief Financial Officer. |
Summary Compensation Table
The following table sets forth certain information with respect to the compensation paid to our NEOs for the years ended December 31, 2020, 2019, and 2018.
| Name and Principal Position | Year | Salary | Bonus (a) | Unit Awards (b) | Total | ||||||||||||||
| Peter C. Boylan III | 2020 | $ | 366,667 | $ | — | $ | 536,250 | $ | 902,917 | ||||||||||
| Chairman, Chief Executive Officer and President | 2019 | 466,807 | 891,159 | 463,881 | 1,821,847 | ||||||||||||||
| 2018 | 438,062 | — | 382,500 | 820,562 | |||||||||||||||
| Richard M. Carson | 2020 | $ | 252,000 | $ | — | $ | 151,866 | $ | 403,866 | ||||||||||
| Senior Vice President and General Counsel | 2019 | 312,500 | 234,500 | 161,350 | 708,350 | ||||||||||||||
| 2018 | 305,000 | 65,500 | 158,440 | 528,940 | |||||||||||||||
| Jeffrey A. Herbers | 2020 | $ | 180,000 | $ | — | $ | 120,549 | $ | 300,549 | ||||||||||
| Vice President and Chief Financial Officer | 2019 | 222,502 | 197,500 | 80,675 | 500,677 | ||||||||||||||
| 2018 | 196,253 | 37,500 | 61,145 | 294,898 | |||||||||||||||
| (a) | Represents cash bonus awards paid. For more information, see "Bonus awards" below. |
| (b) | Represents the grant date fair value of awards granted under the Cypress Energy Partners, L.P. 2013 Long-Term Incentive Plan as determined in accordance with FASB ASC Topic 718. For additional information, please see Note 10 to the Consolidated Financial Statements in Item 8 of this Annual Report. |
Narrative Disclosure to Summary Compensation Table
Elements of the compensation program. For 2020, the primary elements of compensation for our NEOs included base salary, cash bonus awards and equity awards.
101
Base compensation for 2020. Base salaries for our NEOs are set at levels deemed necessary to attract and retain talented individuals and are intended to be competitive with executive salaries in our industry.
The following table sets forth the current annualized base salary rates for our NEOs.
| Name and Principal Position | Current Base Salary | |||
| Peter C. Boylan III | $ | 300,000 | ||
| Chairman, Chief Executive Officer and President | ||||
| Richard M. Carson | $ | 220,500 | ||
| Senior Vice President and General Counsel | ||||
| Jeffrey A. Herbers | $ | 157,500 | ||
| Vice President and Chief Financial Officer |
On May 1, 2020, Mr. Boylan’s annual salary was temporarily reduced from $500,000 to $300,000, Mr. Carson’s annual salary was temporarily reduced from $315,000 to $220,500, and Mr. Herbers’ annual salary was temporarily reduced from $225,000 to $157,500. These reductions were made as part of a cost savings initiative, which included salary reductions for a large percentage of our corporate salaried employees. We implemented this cost savings initiative in response to the adverse market conditions in 2020.
Bonus awards. Our NEOs are eligible for bonuses under our short-term incentive plan (“STI Plan”). Bonuses under the STI Plan are typically paid in March of the year following the performance year. We use target percentages of salary and various financial, safety, and individual performance metrics to guide in the calculation of the bonus amounts, although the bonus amounts under the STI Plan are subject to adjustment at the discretion of the board of directors. No bonuses were paid to our NEOs for 2020, as part of our cost savings initiative in light of the adverse market conditions in 2020.
Bonuses for our NEOs under the STI Plan for the 2018 plan year were delayed as a result of the bankruptcy of our customer PG&E. Upon the successful sale of our pre-petition receivables from PG&E in November 2019, the board finalized the amounts of the bonuses for the 2018 STI plan year and paid these bonuses to the NEOs in December 2019. Accordingly, these bonuses are reported in the 2019 year in the Summary Compensation Table above.
In 2018, Mr. Carson and Mr. Herbers received certain bonuses related to their efforts toward the sale of the Pecos, Texas water treatment facility and toward the acquisition by Holdings of two businesses.
The following table summarizes bonus awards to our NEOs:
| Year | Description | Boylan | Carson | Herbers | |||||||||||
| 2020 | STI for 2020 plan year | $ | — | $ | — | $ | — | ||||||||
| 2019 | STI for 2019 plan year | $ | 475,000 | $ | 180,000 | $ | 135,000 | ||||||||
| 2019 | STI for 2018 plan year | 416,159 | 54,500 | 62,500 | |||||||||||
| $ | 891,159 | $ | 234,500 | $ | 197,500 | ||||||||||
| 2018 | Bonus for sale of Pecos, Texas facility | $ | — | $ | 20,000 | $ | 11,500 | ||||||||
| 2018 | First bonus for acquisition of business by Holdings | — | 35,000 | 20,000 | |||||||||||
| 2018 | Second bonus for acquisition of business by Holdings | — | 10,500 | 6,000 | |||||||||||
| $ | — | $ | 65,500 | $ | 37,500 | ||||||||||
Discretionary long-term equity incentive awards. In connection with our IPO, we adopted the Cypress Energy Partners, L.P. 2013 Long-Term Incentive Plan, or the LTIP, under which we make periodic grants of equity and equity-based awards in us to our NEOs and other key employees. The phantom units are subject to potential accelerated vesting as described below under “Severance and change in control arrangements.”
102
Outstanding Equity Awards at December 31, 2020
The following table provides information regarding the outstanding and unvested long-term equity incentive awards held by our NEOs as of December 31, 2020. None of our NEOs held any option awards that were outstanding as of December 31, 2020.
| Unit Awards | ||||||||||
| Name and Principal Position | Grant Date | Number of Units That Have Not Vested | Market Value of Units That Have Not Vested | |||||||
| # | (a) | |||||||||
| Peter C. Boylan III | May 5, 2020 | 125,000 | (b) | 287,500 | ||||||
| Chairman, Chief Executive Officer and President | July 9, 2019 | 115,000 | (c) | 264,500 | ||||||
| April 9, 2018 | 125,000 | (b) | 287,500 | |||||||
| March 9, 2017 | 47,120 | (b) | 108,376 | |||||||
| March 10, 2016 | 29,546 | (b) | 67,956 | |||||||
| Richard M. Carson | May 5, 2020 | 35,400 | (b) | 81,420 | ||||||
| Senior Vice President and General Counsel | July 9, 2019 | 40,000 | (c) | 92,000 | ||||||
| April 9, 2018 | 44,000 | (b) | 101,200 | |||||||
| March 9, 2017 | 15,737 | (b) | 36,195 | |||||||
| March 10, 2016 | 9,868 | (b) | 22,696 | |||||||
| Jeffrey A. Herbers | May 5, 2020 | 28,100 | (b) | 64,630 | ||||||
| Vice President and Chief Financial Officer | July 9, 2019 | 20,000 | (c) | 46,000 | ||||||
| April 9, 2018 | 13,500 | (b) | 31,050 | |||||||
| March 9, 2017 | 5,008 | (b) | 11,518 | |||||||
| November 2, 2016 | 3,384 | (b) | 7,783 | |||||||
| (a) | Amount shown reflects the per-unit value based upon the December 31, 2020 closing price of $2.30 per common unit. |
| (b) | Represents phantom units granted under the LTIP and scheduled to vest in three equal annual installments on the third, fourth and fifth anniversaries of the grant date. |
| (c) | Represents phantom units granted under the LTIP with half vesting in three equal tranches in April 2022, April 2023, and April 2024, respectively, contingent only on the continued service of the recipients through the vesting dates; one-fourth vesting either in April 2022, April 2023, April 2024, or not at all, depending on our performance relative to specified profitability targets and contingent on the continued service of the recipients through the vesting dates; and one-fourth vesting either in April 2022, April 2023, April 2024, or not at all, depending on the market value and yield of our common units relative to specified targets on those dates and contingent on the continued service of the recipients through the vesting dates. |
Severance and change in control arrangements. Except for Mr. Boylan, none of our NEOs has entered into any employment or severance agreements with our general partner or any of its affiliates. Pursuant to arrangements between Mr. Boylan and Holdings, if Mr. Boylan’s employment is terminated without cause (including a deemed termination upon a change in control of Holdings), Mr. Boylan would receive severance payments equal to two times his annual salary and all outstanding equity awards would vest. In addition, if Mr. Boylan’s employment is terminated by Holdings without cause or by Mr. Boylan for good reason or due to Mr. Boylan’s death or disability, Mr. Boylan and his covered dependents would receive 12 months of continued health insurance coverage.
The terms of Mr. Carson’s phantom unit awards provide that in the event of a change in control of the partnership, his phantom units would become fully vested in the event Mr. Carson is terminated without cause within six months after such change in control.
Retirement, Health, Welfare and Additional Benefits
We provide a basic benefits package that is available to all full-time employees, which currently includes medical, dental, disability, life insurance, and a 401(k) plan. We do not currently provide matching contributions for the 401(k) plan. We do not maintain a defined benefit pension plan for our executive officers, because we believe such plans primarily reward longevity rather than performance.
103
Director Compensation
Officers and owners of our general partner who also serve as directors do not receive additional compensation for their service as directors. Our independent directors who are not officers, employees, or owners of our general partner receive cash and equity-based compensation for their services as directors.
Our non-employee director compensation program consists of the following:
| ● | an annual cash retainer of $25,000, |
| ● | an additional annual cash retainer of (i) $5,000 for service as the chair of our conflicts committee and (ii) $7,500 for service as the chair of our audit committee, and |
| ● | an annual equity-based award granted under our LTIP. Equity-based awards are subject to vesting in equal annual installments over a period of three years, based upon continued service as an independent director. |
Non-employee directors also receive reimbursement for out-of-pocket expenses associated with attending board or committee meetings and director and officer liability insurance coverage. Each director will be fully indemnified by us for actions associated with being a director to the fullest extent permitted under Delaware law.
The following table provides information regarding the compensation earned by our non-employee directors during the year ended December 31, 2020.
| Name | Cash Fees Earned | Unit Awards (a) | Total | |||||||||
| Henry Cornell (d) | $ | 6,250 | $ | — | $ | 6,250 | ||||||
| Stanley A. Lybarger (b) | $ | 32,500 | $ | 39,384 | $ | 71,884 | ||||||
| John T. McNabb II (b) | $ | 30,000 | $ | 39,384 | $ | 69,384 | ||||||
| Jack Stark (c) | $ | 18,750 | $ | 39,384 | $ | 58,134 | ||||||
| (a) | Represents the grant date fair value of the awards, as determined in accordance with FASB ASC Topic 718. For additional information, please see Note 10 to the Consolidated Financial Statements included in Item 8 in this Annual Report. |
| (b) | As of December 31, 2020, Mr. Lybarger and Mr. McNabb held 15,124 unvested restricted units. |
| (c) | On April 6, 2020, Jack H. Stark was appointed as a new director of the General Partner’s Board. Mr. Stark's annual retainer is $25,000, which is paid in quarterly installments. As of December 31, 2020, Mr. Stark held 7,200 unvested restricted units. |
| (d) | On April 1, 2020, Henry Cornell resigned as a director of the General Partner’s Board. Mr. Cornell’s annual retainer was $25,000, payable in quarterly installments. |
Compensation Committee Interlocks and Insider Participation
As a limited partnership, we are not required by the NYSE to establish a compensation committee. Mr. Boylan, who serves as the Chairman of the Board, participates in his capacity as a director in the deliberations of the Board concerning executive officer compensation. In addition, Mr. Boylan makes recommendations to the Board regarding named executive officer compensation but abstains from any decisions regarding his own compensation.
Compensation Committee Report
We do not have a compensation committee. The board of directors of our general partner has reviewed and discussed the Compensation Overview set forth above and based on this review and discussion has approved it for inclusion in this Annual Report on Form 10-K.
Members of the Board of Directors of Cypress Environmental Partners, GP, LLC
| Peter C. Boylan III | Jack H. Stark | Charles C. Stephenson, Jr. |
| Stanley A. Lybarger | John T. McNabb II | Cynthia A. Field |
104
| ITEM 12. | SECURITY OWNERSHIP OF CERTAIN BENEFICIAL OWNERS AND MANAGEMENT AND RELATED STOCKHOLDER MATTERS |
The following table sets forth the beneficial ownership of units of Cypress Environmental Partners, L.P., as of March 15, 2021, held by beneficial owners of 5.0% or more of the units, by each director and named executive officer of Cypress Environmental Partners, GP, LLC, our general partner, and by all directors and executive officers of our general partner as a group. The percentage of units beneficially owned is based on a total of 12,313,305 common units and 5,769,231 preferred units outstanding.
The amounts and percentage of units beneficially owned are reported on the basis of regulations of the SEC governing the determination of beneficial ownership of securities. Under the rules of the SEC, a person is deemed to be a “beneficial owner” of a security if that person has or shares “voting power,” which includes the power to vote or to direct the voting of such security, or “investment power,” which includes the power to dispose of or to direct the disposition of such security. In computing the number of common units beneficially owned by a person and the percentage ownership of that person, common units subject to options or warrants held by that person that are currently exercisable or exercisable within 60 days of March 15, 2021, if any, are deemed outstanding, but are not deemed outstanding for computing the percentage ownership of any other person. Except as indicated by footnote, the persons named in the table below have sole voting and investment power with respect to all units shown as beneficially owned by them, subject to community property laws where applicable. Unless otherwise indicated, the address for each of the beneficial owners below is 5727 S. Lewis Ave., Suite 300, Tulsa, Oklahoma 74105.
| Name of Beneficial Owner | Common Units Beneficially Owned | Preferred Units Beneficially Owned | Total Units Beneficially Owned | Percentage of Units Beneficially Owned | ||||||||||||
| Cypress Environmental Holdings, LLC (a) | 6,957,349 | — | 6,957,349 | 38.4 | % | |||||||||||
| Charles C. Stephenson, Jr. | 413,740 | 5,769,231 | 6,182,971 | 34.2 | % | |||||||||||
| Cynthia A. Field | 118,900 | — | 118,900 | * | ||||||||||||
| Peter C. Boylan III | 205,223 | — | 205,223 | * | ||||||||||||
| John T. McNabb II | 83,826 | — | 83,826 | * | ||||||||||||
| Richard M. Carson | 78,772 | — | 78,772 | * | ||||||||||||
| Stanley A. Lybarger | 45,880 | — | 45,880 | * | ||||||||||||
| Jeffrey A. Herbers | 16,921 | — | 16,921 | * | ||||||||||||
| Jack H. Stark | — | — | — | * | ||||||||||||
| All directors and executive officers as a group (consisting of 8 persons) | 963,262 | 5,769,231 | 6,732,493 | 37.3 | % | |||||||||||
| * | indicates that person or entity owns less than one percent. |
| (a) | As of year-end, Holdings owns 57% of our common units. |
The following table sets forth the beneficial ownership of Cypress Environmental Holdings, LLC as of March 15, 2021:
| Name of Beneficial Owner | Ownership
Interest Ratio (1) |
|||
| Cynthia A. Field Trust | 36.750 | % | ||
| Charles C. Stephenson, Jr. | 27.468 | % | ||
| CEP Capital Partners, LLC (2) | 24.500 | % | ||
| Henry Cornell | 1.333 | % | ||
| Cornell Investment Partners, L.P. | 0.667 | % | ||
| Stephenson Grandchildren Family LLC | 9.282 | % | ||
| (1) | Holdings is managed by a three-member board of directors consisting of Peter C. Boylan III, Cynthia A. Field and Charles C. Stephenson, Jr. The election of each director requires the affirmative vote of members representing at least a majority of the voting ratio of Holdings and the concurrence of CEP Capital Partners, LLC. |
105
| (2) | CEP Capital Partners, LLC is owned and controlled by affiliates of Peter C. Boylan III, Chairman, Chief Executive Officer and President of CELP. |
Securities Authorized for Issuance under Equity Compensation Plans
The following table provides certain information with respect to our Long-Term Incentive Plan as of December 31, 2020:
| Plan Category | Number of Securities to be Issued upon Exercise of Outstanding Options, Warrants and Rights | Weighted Average Exercise Price of Outstanding Options, Warrants and Rights | Number of Securities Remaining Available for Future Issuance under Equity Compensation Plans | |||||||||
| Equity compensation plans approved by security holders | 1,181,072 | — | 931,396 | |||||||||
| Equity compensation plans not approved by security holders | — | — | — | |||||||||
| Total | 1,181,072 | — | 931,396 | |||||||||
Amounts shown represent outstanding phantom units. The phantom units do not have an exercise price.
| ITEM 13. | CERTAIN RELATIONSHIPS AND RELATED TRANSACTIONS |
Parent of Smaller Reporting Entities
We have no parents, though Holdings may be considered to be our parent by virtue of its indirect ownership of 6,957,349 common units, representing 57% of our outstanding common units. The owners of Holdings also own 100% of Cypress Environmental GP Holdings, LLC, which owns 100% of our general partner.
Conflicts of Interest and Duties
Under our partnership agreement, our general partner has a contractual duty to manage us in a manner it believes is in the best interests of our partnership and unitholders. However, because our general partner is a wholly-owned subsidiary of Holdings, the officers and directors of our general partner have a duty to manage the business of our general partner in a manner that is in the best interests of Holdings. As a result of this relationship, conflicts of interest may arise in the future between us and our unitholders, on the one hand, and our general partner and its affiliates, including Holdings, on the other hand. For example, our general partner will be entitled to make determinations that affect the amount of cash distributions we make to the holders of common units, which in turn has an effect on whether our general partner receives incentive cash distributions. In addition, our general partner may determine to manage our business in a way that directly benefits Holdings’ businesses, rather than indirectly benefitting Holdings solely through its ownership interests in us. We expect that any future decision by Holdings in this regard will be made on a case-by-case basis. However, all of these actions are permitted under our partnership agreement and will not be a breach of any duty (fiduciary or otherwise) of our general partner.
Delaware law provides that Delaware limited partnerships may, in their partnership agreements, expand, restrict or eliminate the duties (including fiduciary duties) otherwise owed by the general partner to limited partners and the partnership. As permitted by Delaware law, our partnership agreement contains various provisions replacing the fiduciary duties that would otherwise be owed by our general partner with contractual standards governing the duties of the general partner and contractual methods of resolving conflicts of interest. The effect of these provisions is to restrict the remedies available to unitholders for actions that might otherwise constitute breaches of our general partner’s fiduciary duties. Our partnership agreement also provides that affiliates of our general partner, including Holdings and its controlled affiliates, are permitted to compete with us, and neither our general partner nor its affiliates have any obligation to present business opportunities to us. By purchasing a common unit, the purchaser agrees to be bound by the terms of our partnership agreement, and pursuant to the terms of our partnership agreement, each holder of common units consents to various actions and potential conflicts of interest contemplated in our partnership agreement that might otherwise be considered a breach of fiduciary or other duties under Delaware law.
As of December 31, 2020, the general partner, its controlled affiliates, and the directors and executive officers own 7,858,462 common units, representing 64% of our total outstanding common units, and 100% of our total outstanding preferred units. In addition, our general partner owns a 0.0% non-economic general partner interest in us.
106
Distributions and Payments to Our General Partner and Its Affiliates (exclusive of Directors and Executive Officers)
The following table summarizes the distributions and payments to be made by us to our general partner and its controlled affiliates in connection with the formation, ongoing operation, and liquidation of Cypress Environmental Partners, L.P. These distributions and payments were determined by and among affiliated entities and, consequently, are not the result of arm’s-length negotiations.
Operational Stage
| Distributions of available cash to our general partner and its controlled affiliates |
We will generally make cash distributions to the unitholders pro rata, including Holdings and its controlled affiliates, as holder of an aggregate of 6,957,349 common units. In addition, if distributions exceed the minimum quarterly distribution and target distribution levels, the incentive distribution rights held by affiliates of our general partner will entitle the IDR owners to increasing percentages of the distributions in steps, up to 50% of the distributions above the highest target distribution level.
In 2020, 2019, and 2018, our general partner and its affiliates received common and subordinated distributions of approximately $3.3 million, $6.5 million, and $6.4 million, respectively. In 2020, 2019 and 2018, an affiliate of our general partner received preferred unit distributions of $4.1 million, $4.1 million, and $1.4 million, respectively. |
|
| Payments to our general partner and its affiliates |
Prior to January 1, 2020, the omnibus agreement required Holdings to provide certain general and administrative services, including executive management services and expenses associated with our being a publicly-traded entity (such as audit, tax, and transfer agent fees, among others) in return for a fixed annual fee (adjusted for inflation) that was payable quarterly. In an effort to simplify this arrangement so it would be easier for investors to understand, in November 2019, with the approval of the Conflicts Committee of the Board of Directors, we and Holdings agreed to terminate the management fee provisions of the omnibus agreement effective December 31, 2019. Beginning January 1, 2020, the executive management services and other general and administrative expenses that Holdings previously incurred and charged to us via the annual administrative fee are charged directly to us as they are incurred and are now paid directly by the Partnership. Under our current cost structure, these direct expenses have been lower than the annual administrative fee that we previously paid, although we experience more variability in our quarterly general and administrative expense now that we are incurring the expenses directly than when we paid a consistent administrative fee each quarter. In 2019 and 2018, we reimbursed our general partner $4.5 million and $4.0 million in annual administrative fees, respectively, for expenses incurred by it and its affiliates in providing certain partnership overhead services to us, including the provision of executive management services by certain officers of our general partner.
The Partnership does not have any employees. We are managed and operated by the directors and officers of our general partner. All of the employees who conduct our business are employed by affiliates of our general partner, although we often refer to these individuals in this report as our employees. Affiliates of our general partner charge us the actual compensation costs for these employees. For employees who support both our business and also businesses of our affiliates, the compensation cost is allocated among us and our affiliates based on estimates of the amount of time these employees spend on our businesses relative to those of our affiliates. |
|
| Withdrawal or removal of our general partner | If our general partner withdraws or is removed, its general partner interest and its incentive distribution rights will either be sold to the new general partner for cash or converted into common units, in each case for an amount equal to the fair market value of those interests. | |
| Liquidation Stage | ||
| Liquidation | Upon our liquidation, the partners, including our general partner, will be entitled to receive liquidating distributions according to their respective capital account balances. |
107
Agreements with Affiliates
On January 21, 2014, we and other parties entered into the various agreements associated with the closing of our IPO, including the vesting of assets in, and the assumption of liabilities by, us and our subsidiaries.
Omnibus Agreement
We are party to an omnibus agreement with Holdings and other related parties. The omnibus agreement provides for, among other things, our right of first offer on Holdings’ and its subsidiaries’ assets used in, and entities primarily engaged in, providing water treatment and other water and environmental services. So long as Holdings controls our General Partner, the omnibus agreement will remain in full force and effect, unless we and Holdings agree to terminate it sooner. If Holdings ceases to control our General Partner, either party may terminate the omnibus agreement. We and Holdings may agree to further amend the omnibus agreement; however, amendments that the General Partner determines are adverse to our unitholders will also require the approval of the Conflicts Committee of our Board of Directors.
Indemnification
Under our amended and restated omnibus agreement, Holdings will indemnify us, without giving effect to any cap, for the following matters:
| ● | Retained Assets: all events and conditions associated with any assets retained by Holdings regardless of when they occur; |
| ● | Litigation: any legal proceedings attributable to ownership or operation of the contributed assets prior to the closing of the IPO, except that indemnification for any legal proceeding not known at the time of the closing of the IPO is subject to an aggregate deductible of $250,000; |
| ● | TIR Restructuring Transactions: the acquisition of the shares in Tulsa Inspection Resources, Inc. and the merger of Tulsa Inspection Resources, Inc. with the TIR Entities; and |
| ● | Tax Liabilities: for a period up to 60 days past the expiration of any applicable statute of limitations, any tax liability attributable to the assets contributed to us arising prior to the closing of the IPO or otherwise related to Holdings’ contribution of those assets to us in connection with the IPO. |
We have agreed to indemnify Holdings, without giving effect to any deductible or cap, for events and conditions associated with the operation of our assets that occur after the closing of the IPO to the extent Holdings is not required to indemnify us as described above.
Alati Arnegard, LLC
We provide management services to a 25% owned entity, Alati Arnegard, LLC (“Arnegard”). Management fee revenue earned from Arnegard totaled $0.7 million in each of 2020, 2019, and 2018.
CF Inspection Management, LLC
We have also entered into an agreement with CF Inspection, a nationally-qualified woman-owned company affiliated with one of Holdings’ owners and a Director of our General Partner. CF Inspection allows us to offer various services to clients that require the services of an approved Women’s Business Enterprise (“WBE”), as CF Inspection is certified as a National Women’s Business Enterprise by the Women’s Business Enterprise National Council. We own 49% of CF Inspection and Cynthia A. Field, an affiliate of Holdings and a Director of our General Partner, owns the remaining 51% of CF Inspection. For the years ended December 31, 2020, 2019, and 2018, CF Inspection, which is part of the Inspection Services segment, represented 5.0%, 3.3%, and 3.4% of our consolidated revenue, respectively.
Pipeline and Process Services
Entities owned by Holdings provide contract labor support to our Pipeline & Process Services segment. During the years ended December 31, 2020, 2019, and 2018, we incurred $0.6 million, $0.2 million, and $0.1 million of expense associated with these services, which is included in costs of services in our Consolidated Statements of Operations.
108
Sale of Preferred Equity
On May 29, 2018 (the “Closing Date”), we entered into a Series A Preferred Unit Purchase Agreement (the “Preferred Unit Purchase Agreement”) with an entity controlled by Charles C. Stephenson, Jr. (the “Purchaser”), an affiliate of our General Partner, where we issued and sold in a private placement 5,769,231 Series A Preferred Units representing limited partner interests in the Partnership (the “Preferred Units”) to the Purchaser for a cash purchase price of $7.54 per Preferred Unit, resulting in gross proceeds to the Partnership of $43.5 million.
The Preferred Unit Purchase Agreement contains customary representations, warranties, and covenants of the Partnership and the Purchaser. The Partnership and the Purchaser agreed to indemnify each other and their respective officers, directors, managers, employees, agents, counsel, accountants, investment bankers, and other representatives against certain losses resulting from breaches of their respective representations, warranties, and covenants, subject to certain negotiated limitations and survival periods set forth in the Preferred Unit Purchase Agreement.
Pursuant to the Preferred Unit Purchase Agreement, and in connection with the closing of this transaction, our General Partner executed the First Amendment to First Amended and Restated Agreement of Limited Partnership of the Partnership, which authorizes and establishes the rights and preferences of the Preferred Units. The Preferred Units shall have voting rights that are identical to the voting rights of the common units into which such Preferred Units would be converted at the then-applicable conversion rate.
The Purchaser is entitled to receive quarterly distributions that represent an annual return of 9.5% on the Preferred Units. Of this 9.5% annual return, we have the option to pay 7.0% in kind (in the form of issuing additional preferred units) for the first twelve quarters after the Closing Date.
After the third anniversary of the Closing Date, the Purchaser will have the option to convert the Preferred Units into common units on a one-for-one basis. If certain conditions are met after the third anniversary of the Closing Date, we will have the option to cause the Preferred Units to convert to common units. After the third anniversary of the Closing Date, we will also have the option to redeem the Preferred Units. The Partnership may redeem the Preferred Units (a) at any time after the third anniversary of the closing date and on or prior to the fourth anniversary of the closing date at a redemption price equal to 105% of the issue price, and (b) at any time after the fourth anniversary of the closing date at a redemption price equal to 101% of the issue price.
Our Credit Agreement, as amended in March 2021, contains significant restrictions on our ability to pay cash distributions on common and preferred units.
Procedures for Review, Approval and Ratification of Related Person Transactions
The board of directors of our general partner adopted a related party transactions policy in connection with the closing of the IPO that provides that the board of directors of our general partner or its authorized committee will review on at least a quarterly basis all related person transactions that are required to be disclosed under SEC rules and, when appropriate, initially authorize or ratify all such transactions. In the event that the board of directors of our general partner or its authorized committee considers ratification of a related person transaction and determines not to so ratify, the code of business conduct and ethics will provide that our management will make all reasonable efforts to cancel or annul the transaction.
The related party transactions policy provides that, in determining whether or not to recommend the initial approval or ratification of a related person transaction, the board of directors of our general partner or its authorized committee should consider all of the relevant facts and circumstances available, including (if applicable) but not limited to: (1) whether there is an appropriate business justification for the transaction; (2) the benefits that accrue to us as a result of the transaction; (3) the terms available to unrelated third-parties entering into similar transactions; (4) the impact of the transaction on a director’s independence (in the event the related person is a director, an immediate family member of a director or an entity in which a director or an immediate family member of a director is a partner, shareholder, member or executive officer); (5) the availability of other sources for comparable products or services; (6) whether it is a single transaction or a series of ongoing, related transactions; and (7) whether entering into the transaction would be consistent with the code of business conduct and ethics.
ITEM 14. PRINCIPAL ACCOUNTANT FEES AND SERVICES
We have engaged Ernst & Young LLP as our independent registered public accounting firm. The following table sets forth fees we have paid to Ernst & Young LLP in 2020, 2019, and 2018.
| Year Ended December 31 | ||||||||||||
| Audit and Non-Audit Fees | 2020 | 2019 | 2018 | |||||||||
| (in thousands) | ||||||||||||
| Audit fees (a) | $ | 594 | $ | 678 | $ | 648 | ||||||
| Tax fees (b) | 107 | 107 | 121 | |||||||||
| Other (c) | 2 | 2 | 2 | |||||||||
| Total | $ | 703 | $ | 787 | $ | 771 | ||||||
| (a) | Fees for audit services include fees associated with the annual audit of Cypress Environmental Partners, L.P., reviews of the Partnership’s quarterly reports, and SEC filings. |
| (b) | Includes fees for tax services for Cypress Environmental Partners, L.P. and affiliates in connection with tax compliance, tax advice, and tax planning. |
| (c) | Includes annual fee for accounting research subscription. |
Audit Committee Pre-Approval Policies and Procedures
Our audit committee has adopted an audit committee charter which requires the audit committee to pre-approve all audit and non-audit services to be provided by our independent registered public accounting firm. The audit committee does not delegate its pre-approval responsibilities to management or to an individual member of the audit committee.
109
| ITEM 15. | EXHIBITS AND FINANCIAL STATEMENT SCHEDULES |
| (a) | Documents to be filed as part of this Annual Report |
| 1. | A list of the financial statements included in this Annual Report on Form 10-K is set forth in Part II, Item 8 of this Annual Report on Form 10-K. |
| 2. | Financial Statement Schedules: Financial Statement Schedules are omitted because they are not required, not significant, not applicable or the information is shown in another schedule, the financial statements or the notes to Consolidated Financial Statements. |
| 3. | Exhibits: See “Exhibit Index” below. |
110
Exhibit Index
|
Exhibit number |
Description | |
| 2.1 | Contribution, Conveyance and Assumption Agreement, dated February 20, 2015, by and among Cypress Energy Holdings, LLC, Cypress Environmental Partners, LLC, Cypress Environmental Partners, L.P., Cypress Environmental Partners, GP, LLC, Cypress Energy Partners – TIR, LLC, Mr. Charles C. Stephenson, Jr. and Ms. Cynthia A. Field (incorporated by reference to Exhibit 2.1 of our Current Report on Form 8-K filed on February 23, 2015) | |
| 3.1 | First Amended and Restated Agreement of Limited Partnership of Cypress Environmental Partners, L.P. dated as of January 21, 2014 (incorporated by reference to Exhibit 3.1 of our Current Report on Form 8-K filed on January 27, 2014) | |
| 3.2 | First Amendment to First Amended and Restated Agreement of Limited Partnership of Cypress Environmental Partners, L.P. dated as of May 29, 2018 (incorporated by reference to Exhibit 3.1 of our Current Report on Form 8-K filed on May 31, 2018) | |
| 3.3 | Second Amendment to First Amended and Restated Agreement of Limited Partnership of Cypress Energy Partners, L.P., dated as of March 5, 2020 (incorporated by reference to Exhibit 3.1 of our Current Report on Form 8-K filed on March 6, 2020) | |
| 3.4 | Amended and Restated Limited Liability Company Agreement of Cypress Environmental Partners, GP, LLC dated as of January 21, 2014 (incorporated by reference to Exhibit 3.2 of our Current Report on Form 8-K filed on January 27, 2014) | |
| 3.5 | First Amendment to Amended and Restated Limited Liability Agreement of Cypress Energy Partners GP, LLC, dated as of March 5, 2020 (incorporated by reference to Exhibit 3.3 of our Current Report on Form 8-K filed on March 6, 2020) | |
| 3.6 | Certificate of Limited Partnership of Cypress Environmental Partners, L.P. (incorporated by reference to Exhibit 3.7 of our Registration Statement on Form S-1/A filed on December 17, 2013) | |
| 3.7 | Certificate of Amendment to the Certificate of Limited Partnership of Cypress Energy Partners, L.P., dated as of March 2, 2020 (incorporated by reference to Exhibit 3.2 of our Current Report on Form 8-K filed on March 6, 2020) | |
| 3.8 | Certificate of Formation of Cypress Environmental Partners, GP, LLC (incorporated by reference to Exhibit 3.5 of our Registration Statement on Form S-1/A filed on December 17, 2013) | |
| 3.9 | First Amendment to the Certificate of Formation of Cypress Energy Partners GP, LLC, dated as of February 27, 2020 (incorporated by reference to Exhibit 3.4 of our Current Report on Form 8-K filed on March 6, 2020) | |
| 4.1* | Description of Registrant’s Securities Registered Pursuant to Section 12 of the Securities Exchange Act of 1934 | |
| 10.1 † | Cypress Environmental Partners, L.P. 2013 Long-Term Incentive Plan (incorporated by reference to Exhibit 10.3 of our Current Report on Form 8-K filed on January 27, 2014) | |
| 10.2 | First Amendment to the Cypress Energy Partners, L.P. 2013 Long-Term Incentive Plan (incorporated by reference to Exhibit 4.2 of our Registration Statement on Form S-8 filed on March 18, 2019) | |
| 10.3 † | Form of Cypress Environmental Partners, L.P. 2013 Long-Term Incentive Plan Phantom Unit Agreement (incorporated by reference to Exhibit 10.4 of our Registration Statement on Form S-1/A filed on December 17, 2013) | |
| 10.4 | Amendment No. 1 to Credit Agreement dated March 2, 2021, by and among Cypress Environmental Partners, L.P., certain of its affiliates as co-borrowers and guarantors, Deutsche Bank AG, New York Branch, as lender, issuing bank, swing line lender and collateral agent and other lenders from time to time party thereto, and Deutsche Bank Trust Company Americas, as the administrative agent (incorporated by reference to Exhibit 10.1 of our Current Report on Form 8-K filed on March 4, 2021) |
111
| 10.5 | Series A Preferred Unit Purchase Agreement Between Cypress Environmental Partners, L.P. and Stephenson Equity, Co. No. 3, dated as of May 29, 2018 (incorporated by reference to Exhibit 10.1 of our Current Report on Form 8-K filed on May 31, 2018) | |
| 10.6 | Amended and Restated Omnibus Agreement, dated February 20, 2015, among Cypress Energy Holdings, LLC, Cypress Environmental Management, LLC, Cypress Environmental Partners, LLC, Cypress Environmental Partners, L.P., Cypress Environmental Partners, GP, LLC, Cypress Energy Partners – TIR, LLC, Tulsa Inspection Resources, LLC, Tulsa Inspection Resources – Canada ULC, Tulsa Inspection Resources Holdings, LLC and Tulsa Inspection Resources – Nondestructive Examination, LLC (incorporated by reference to Exhibit 10.1 of our Current Report on Form 8-K filed on February 23, 2015) | |
| 10.7 | Second Amended and Restated Omnibus Agreement among Cypress Energy Holdings, LLC, Cypress Environmental Management, LLC, Cypress Environmental Partners, LLC, Cypress Environmental Partners, L.P., Cypress Environmental Partners GP, LLC, Tulsa Inspection Resources, LLC and Tulsa Inspection Resources – Canada ULC (incorporated by reference to Exhibit 10.1 of our Current Report on Form 8-K filed on January 1, 2020) | |
| 10.8 | At Market Issuance Sales Agreement by and between Cypress Energy Partners, L.P. and B. Riley FBR, Inc., dated April 5, 2020 (incorporated by reference to Exhibit 1.1 of our Current Report on Form 8-K filed on April 5, 2020) | |
| 10.9 | Cypress Energy Partners, L.P. Employee Unit Purchase Plan (incorporated by reference to Exhibit 10.1 of our Current Report on Form 8-K filed on November 12, 2019) | |
| 21.1* | List of Subsidiaries of Cypress Environmental Partners, L.P. | |
| 23.1* | Consent of Ernst & Young LLP | |
| 31.1 * | Chief Executive Officer Certification Pursuant to Exchange Act Rule 13a-14(a) or Rule 15d-14(a), as Adopted Pursuant to Section 302 of the Sarbanes-Oxley Act of 2002 | |
| 31.2 * | Chief Financial Officer Certification Pursuant to Exchange Act Rule 13a-14(a) or Rule 15d-14(a), as Adopted Pursuant to Section 302 of the Sarbanes-Oxley Act of 2002 | |
| 32.1** | Chief Executive Officer Certification Pursuant to Exchange Act Rule 13a-14(b) or Rule 15d-14(b) and Section 1350 of Chapter 63 of Title 18 of the United States Code, as Adopted pursuant to Section 906 of the Sarbanes-Oxley Act of 2002 | |
| 32.1** | Chief Financial Officer Certification Pursuant to Exchange Act Rule 13a-14(b) or Rule 15d-14(b) and Section 1350 of Chapter 63 of Title 18 of the United States Code, as Adopted pursuant to Section 906 of the Sarbanes-Oxley Act of 2002 | |
| 101 INS* | XBRL Instance Document | |
| 101 SCH* | XBRL Schema Document | |
| 101 CAL* | XBRL Calculation Linkbase Document |
112
| 101DEF* | XBRL Definition Linkbase Document | |
| 101LAB* | XBRL Label Linkbase Document | |
| 101PRE* | XBRL Presentation Linkbase Document | |
| 104* | Cover Page Interactive Date File |
| * | Filed herewith. |
| ** | Furnished herewith. |
| † | Management contract or compensatory plan or arrangement. |
| ITEM 16. | SUMMARY |
None.
113
Pursuant to the requirements of Section 13 or 15(d) of the Securities Exchange Act of 1934, the registrant has duly caused this report to be signed on its behalf by the undersigned, thereunto duly authorized.
| Cypress Environmental Partners, L.P. | ||
| By: Cypress Environmental Partners, GP, LLC, its general partner | ||
| /s/ Jeffrey A. Herbers | ||
| By: | Jeffrey A. Herbers | |
| Title: | Chief Financial Officer | |
Pursuant to the requirements of the Securities Exchange Act of 1934, this report has been signed below by the following persons on behalf of the registrant and in the capacities and on the dates indicated.
| Signature | Title | Date | ||
| /s/ Peter C. Boylan III | Chief Executive Officer and Chairman of the Board | March 22, 2021 | ||
| Peter C. Boylan III | ||||
| /s/ Jeffrey A. Herbers | Vice President and Chief Financial Officer | March 22, 2021 | ||
| Jeffrey A. Herbers | (Principal Accounting and Financial Officer) | |||
| /s/ Cynthia A. Field | Director | March 22, 2021 | ||
| Cynthia A. Field | ||||
| /s/ Stanley A. Lybarger | Director | March 22, 2021 | ||
| Stanley A. Lybarger | ||||
| /s/ John T. McNabb, II | Director | March 22, 2021 | ||
| John T. McNabb, II | ||||
| /s/ Jack H. Stark | Director | March 22, 2021 | ||
| Jack H. Stark | ||||
| /s/ Charles C. Stephenson, Jr. | Director | March 22, 2021 | ||
| Charles C. Stephenson, Jr. |
114