Attached files
| file | filename |
|---|---|
| EX-10.2 - EX-10.2 - Super Micro Computer, Inc. | exhibit102-nonqualifiedsto.htm |
| EX-10.1 - EX-10.1 - Super Micro Computer, Inc. | exhibit101-noticeofstockop.htm |
| 8-K - 8-K - Super Micro Computer, Inc. | smci-20210301.htm |

INVESTOR EVENT Exhibit 99.1
DISCLOSURES Cautionary Statement Regarding Forward Looking Statements Statements contained in this presentation that are not historical fact may be forward-looking statements within the meaning of Section 27A of the Securities Act of 1933 and Section 21E of the Securities Exchange Act of 1934. Such forward-looking statements may relate to, among other things, the Company’s ability to resume fast growth, introduce new products that will lead the industry, achieve its 5 year growth targets in its targeted markets, achieve its total revenue target in 3 to 6 years, achieve additional capacity expansion in the targeted timeframe, achieve the 3 year targets in its model with respect to (among other things) annual growth rate, revenue, gross margin, R&D, SG&A, operating margin, and tax rate, and execute on the Company’s strategy during the global COVID-19 pandemic. Such forward-looking statements do not constitute guarantees of future performance and are subject to a variety of risks and uncertainties that could cause our actual results to differ materially from those anticipated, including: (i) the global COVID-19 pandemic continues to present significant uncertainties for all parts of our business including our supply chain, our production operations and customer demand, (ii) our quarterly operating results may fluctuate, which could cause rapid declines in our stock price, (iii) as we increasingly target larger customers and larger sales opportunities, our customer base may become more concentrated, our cost of sales may increase, our margins may be lower and our sales may be less predictable, (iv) if we fail to meet publicly announced financial guidance or other expectations about our business, our stock could decline in value, (v) the average sales prices for our server solutions could decline if customers do not continue to purchase our latest generation products or additional components, and (vi) adverse economic conditions may harm our business. Additional factors that could cause actual results to differ materially from those projected or suggested in any forward-looking statements are contained in our filings with the Securities and Exchange Commission, including those factors discussed under the caption "Risk Factors" in such filings, particularly in our Annual Report on Form 10-K for our fiscal year ended June 30, 2020. Use of Non-GAAP Financial Measures Each of non-GAAP gross margin, non-GAAP R&D, non-GAAP SG&A, non-GAAP operating margin, and non-GAAP tax rate excludes stock-based compensation, one-time employee performance bonuses, legal settlement costs, controls remediation expenses, impairments of investments, and other various items. Management presents non- GAAP financial measures because it considers them to be important supplemental measures of performance. Management uses the non-GAAP financial measures for planning purposes, including analysis of the Company's performance against prior periods, the preparation of operating budgets and to determine appropriate levels of operating and capital investments. Management also believes that the non-GAAP financial measures provide additional insight for analysts and investors in evaluating the Company's financial and operational performance. However, these non-GAAP financial measures have limitations as an analytical tool, and are not intended to be an alternative to financial measures prepared in accordance with GAAP. A reconciliation of FY2019 and FY2020 GAAP gross margin to non-GAAP gross margin, from R&D to non-GAAP R&D, SG&A to non-GAAP SG&A, operating margin to non-GAAP operating margin, and tax rate to non-GAAP tax rate are included in the tables at the back of this presentation. The forward-looking non-GAAP measures for gross margin, R&D, SG&A, operating margin, and tax rate cannot be reconciled to their closest GAAP measure without unreasonable effort because they pertain to events that have not yet occurred and are not currently possible to estimate with a reasonable degree of accuracy.

Topic Speaker Vision Charles Liang, CEO and Chairman of the Board Financial David Weigand, CFO Q&A AGENDA

Building Block Solutions - New Technologies - New Features - System Optimization - Inventory Reduction - Service Cost Down - Time-to-Market Silicon Valley Advantages - Close to Leading Technology Partners - First Time-to-Market Disadvantages - Higher Cost - Much Higher Cost - COVID-19 Under the Same Roof US/TW/NL - From Marketing, Design to Production and Service - US, Taiwan and Netherlands - Quick response for Business - Secure Solutions Optimized Total Solution - Motherboard, Power Supplies, Chassis and Thermal solutions - Firmware, Software and Service - Application-optimized, Greener & Best TCO and TCE. Save power equal to 30 fossil-fuel power plants SUPERMICRO DNA - INNOVATIONS

SMCI vs INDUSTRY GROWTH RATE 2009 2010 2011 2012 2013 2014 2015 2016 2017 2018 2019 2020 2021 2022 % 10K Delay Impact Stock Delisted COVID19 -40 -20 0 20 40 60 80 100 2001 2002 2003 2004 2005 2006 2007 2008 Supermicro Industry Avg* Target* *Industry Avg based on Gartner & IDC estimates
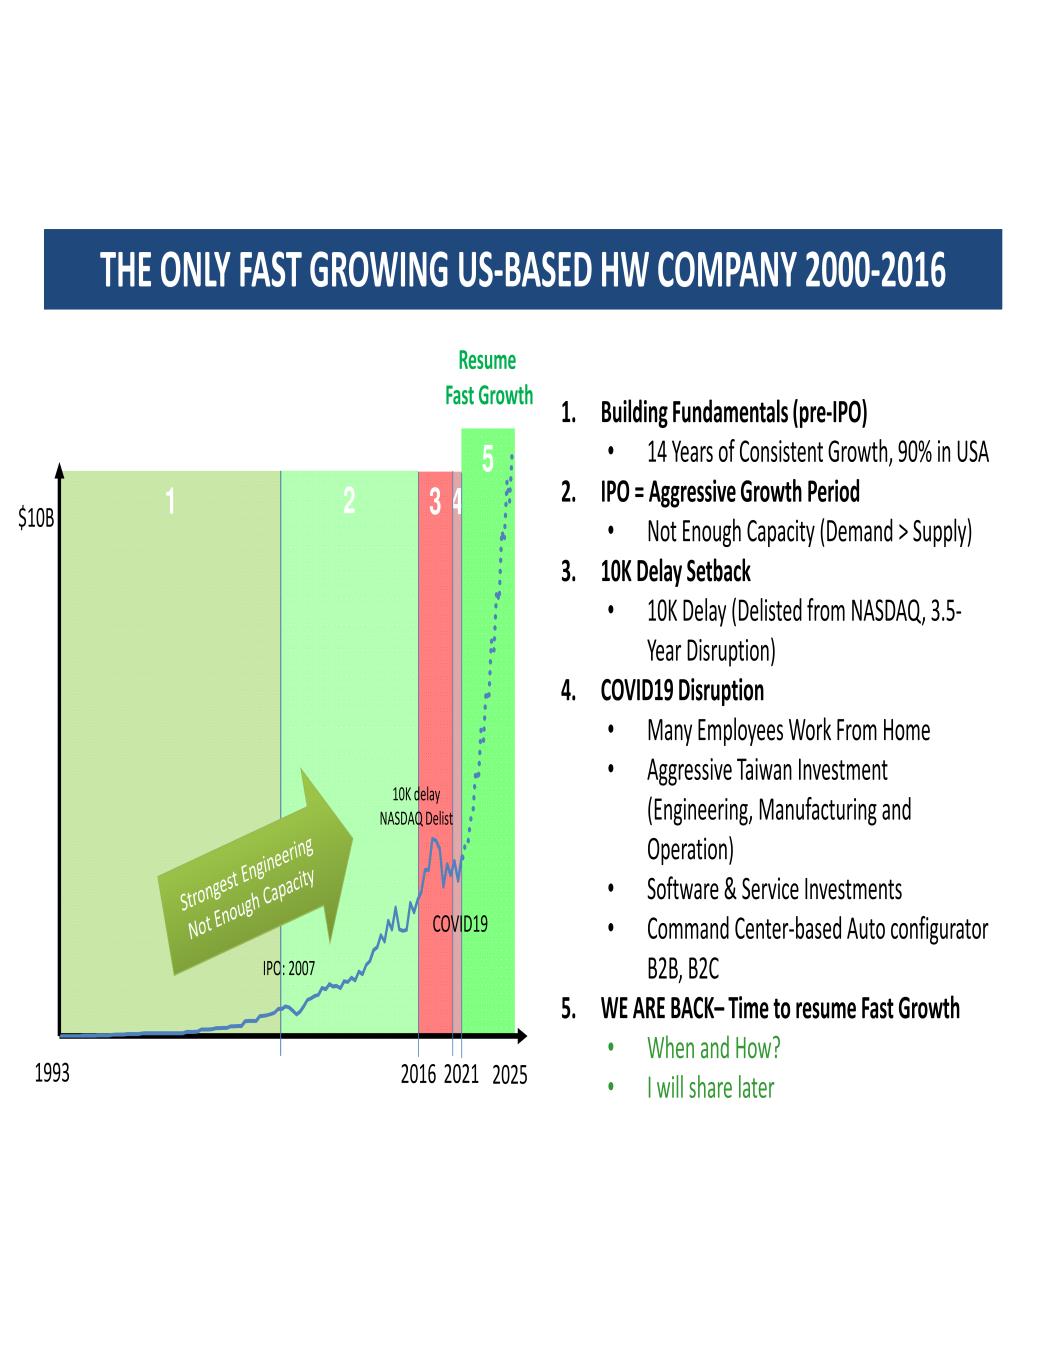
1. Building Fundamentals (pre-IPO) • 14 Years of Consistent Growth, 90% in USA 2. IPO = Aggressive Growth Period • Not Enough Capacity (Demand > Supply) 3. 10K Delay Setback • 10K Delay (Delisted from NASDAQ, 3.5- Year Disruption) 4. COVID19 Disruption • Many Employees Work From Home • Aggressive Taiwan Investment (Engineering, Manufacturing and Operation) • Software & Service Investments • Command Center-based Auto configurator B2B, B2C 5. WE ARE BACK– Time to resume Fast Growth • When and How? • I will share later THE ONLY FAST GROWING US-BASED HW COMPANY 2000-2016 432 5 1 1993 IPO: 2007 20212016 2025 $10B 10K delay NASDAQ Delist COVID19 Resume Fast Growth
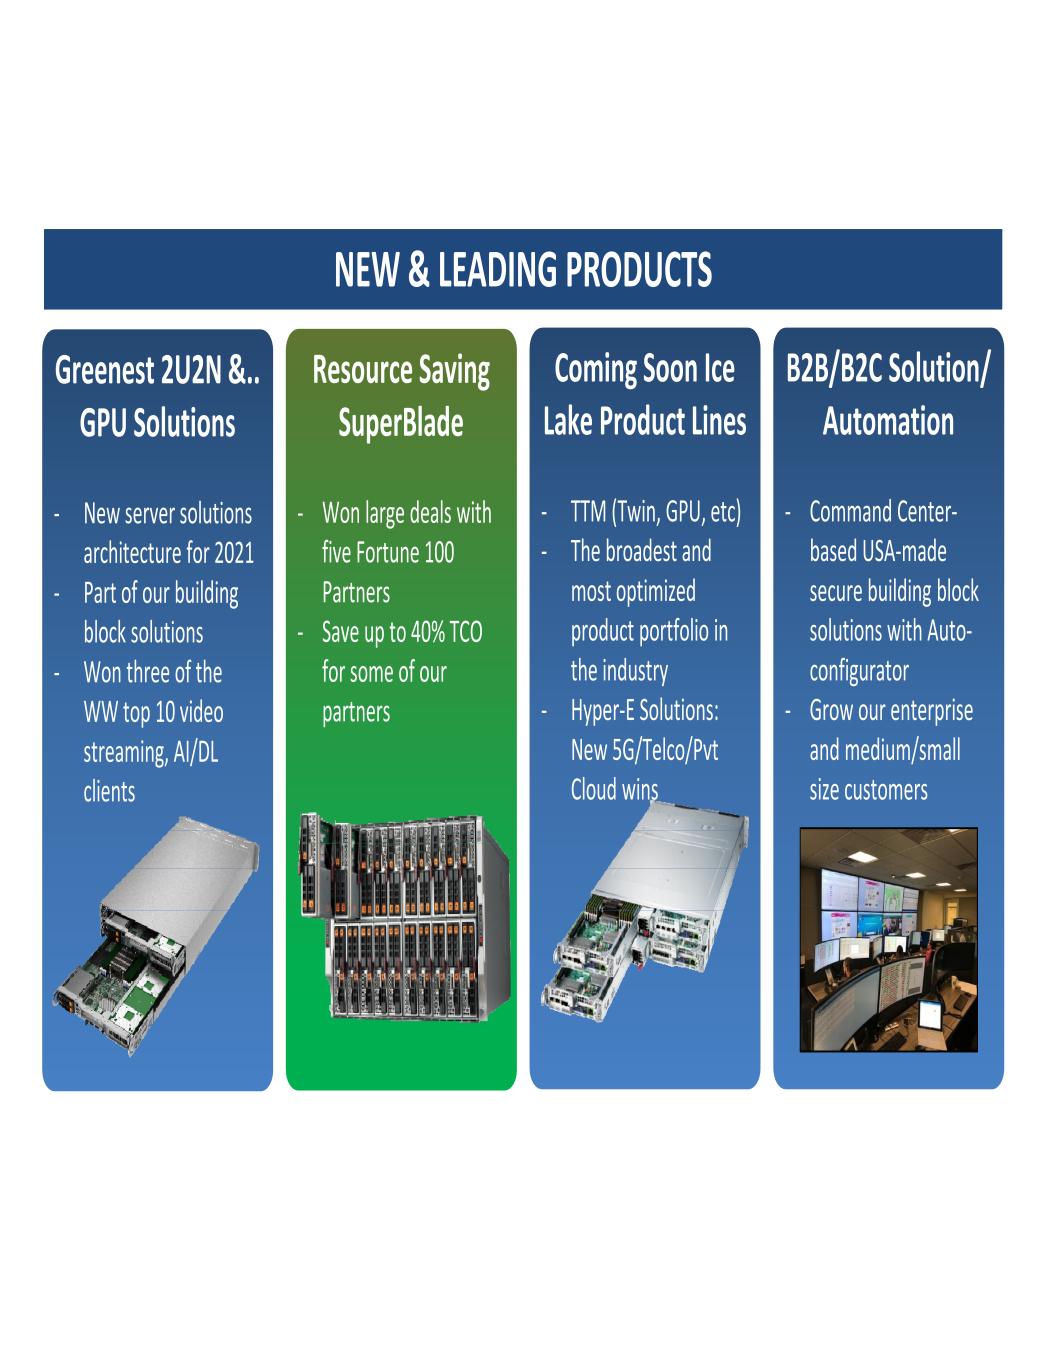
Greenest 2U2N &.. GPU Solutions - New server solutions architecture for 2021 - Part of our building block solutions - Won three of the WW top 10 video streaming, AI/DL clients Resource Saving SuperBlade - Won large deals with five Fortune 100 Partners - Save up to 40% TCO for some of our partners Coming Soon Ice Lake Product Lines - TTM (Twin, GPU, etc) - The broadest and most optimized product portfolio in the industry - Hyper-E Solutions: New 5G/Telco/Pvt Cloud wins B2B/B2C Solution/ Automation - Command Center- based USA-made secure building block solutions with Auto- configurator - Grow our enterprise and medium/small size customers NEW & LEADING PRODUCTS

Organic (Enterprise & Channel), AI / ML OEM & Large DC 5G, Telco & Edge/IoT 2021 TAM* $35B $20B $35B Supermicro Current Market Share 7% ($2.5B) 2% ($0.4B) 1% ($0.4B) Target 5-yr CAGR 13% ($4.5B) 35% ($1.8B) 45% ($2.2B) *IDC and SMCI est. AI excludes off-prem. 5G/Edge is server only. OEM and large DC primarily server infrastructure for tier-1 hyperscalers/public cloud. MAIN GROWTH DRIVERS WW CAGR* (2020 – 2025) 8%2% 6% $xB % % %

US HQ & BIG TAIWAN HQ: IMPROVING ECONOMIES OF SCALE AND COST Historical: USA Centric Operation Now/Post-COVID19: USA + Taiwan Centric Operation • USA heavily impacted by COVID19 and is slowly improving • Taiwan has no impact, especially with much lower costs Long Term: Resume USA Centric Operation with New Business Taiwan Silicon Valley, USA
$10B+ Total Annual Revenue in 3-6 Years CUSTOMER FOCUS
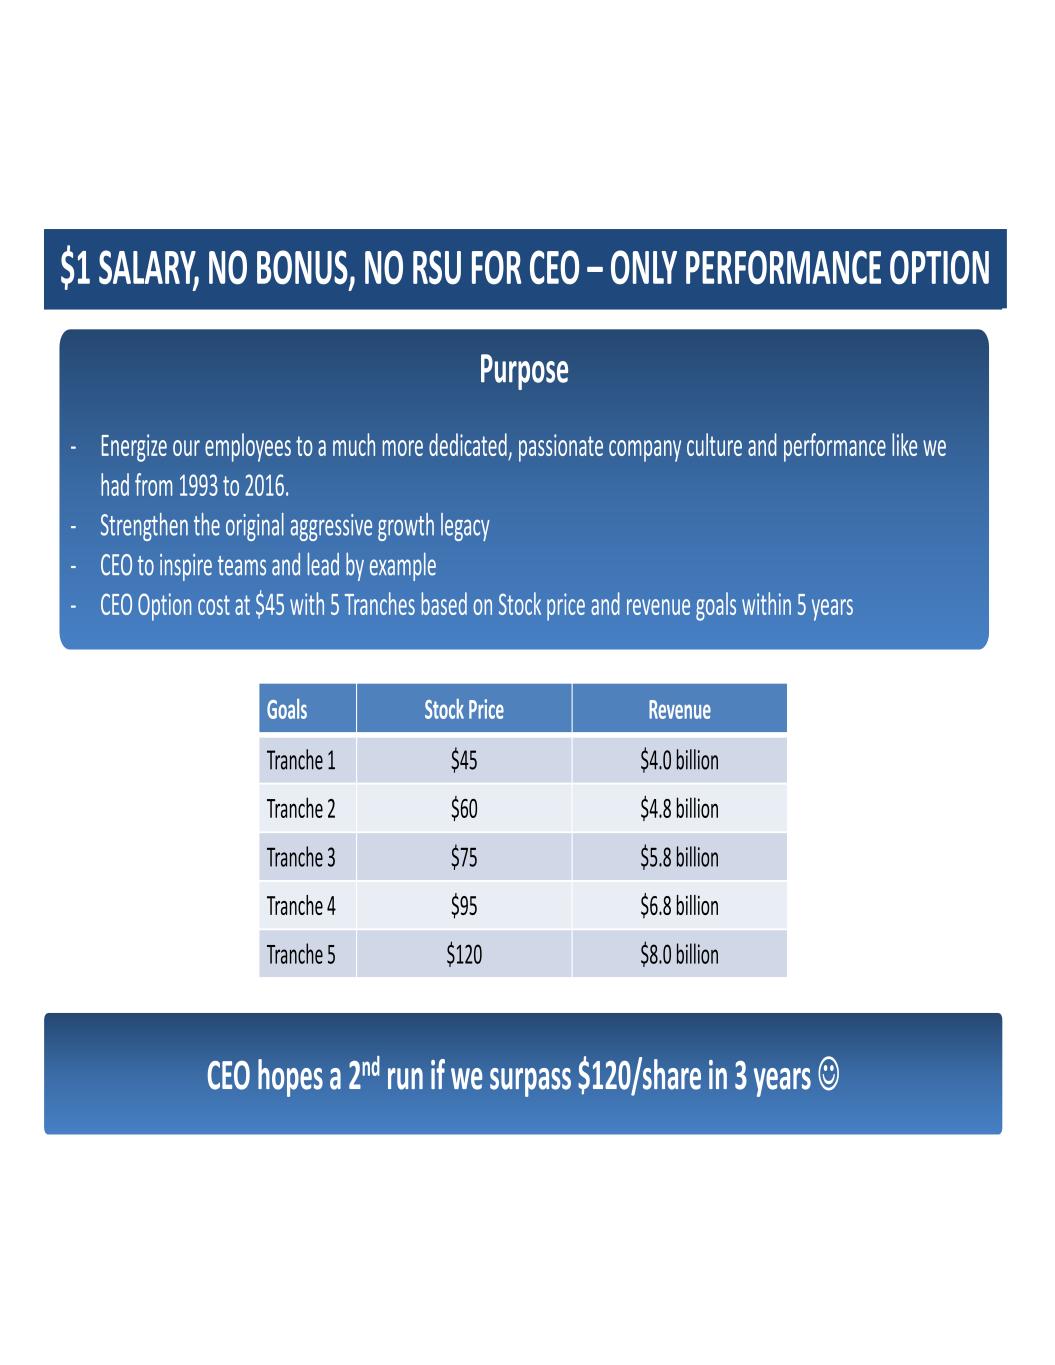
$1 SALARY, NO BONUS, NO RSU FOR CEO - Only Performance Option CEO hopes a 2nd run if we surpass $120/share in 3 years Purpose - Energize our employees to a much more dedicated, passionate company culture and performance like we had from 1993 to 2016. - Strengthen the original aggressive growth legacy - CEO to inspire teams and lead by example - CEO Option cost at $45 with 5 Tranches based on Stock price and revenue goals within 5 years Goals Stock Price Revenue Tranche 1 $45 $4.0 billion Tranche 2 $60 $4.8 billion Tranche 3 $75 $5.8 billion Tranche 4 $95 $6.8 billion Tranche 5 $120 $8.0 billion 1 SALARY, NO BONUS, NO RSU FOR CEO – ONLY PERFORMANCE PTION
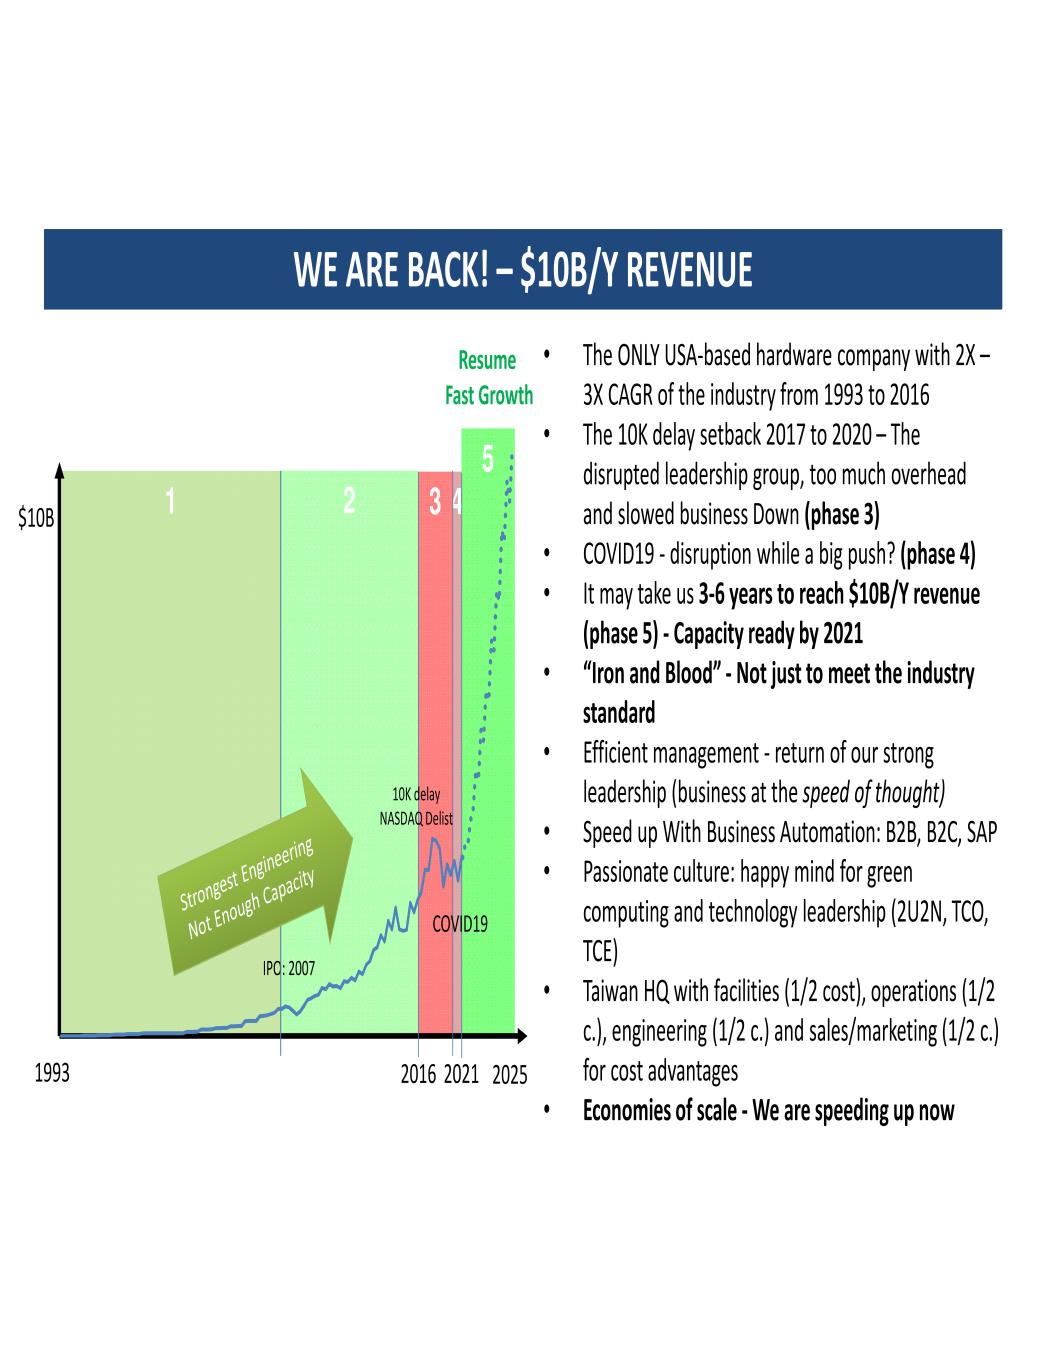
432 5 1 1993 IPO: 2007 20212016 • The ONLY USA-based hardware company with 2X – 3X CAGR of the industry from 1993 to 2016 • The 10K delay setback 2017 to 2020 – The disrupted leadership group, too much overhead and slowed business Down (phase 3) • COVID19 - disruption while a big push? (phase 4) • It may take us 3-6 years to reach $10B/Y revenue (phase 5) - Capacity ready by 2021 • “Iron and Blood” - Not just to meet the industry standard • Efficient management - return of our strong leadership (business at the speed of thought) • Speed up With Business Automation: B2B, B2C, SAP • Passionate culture: happy mind for green computing and technology leadership (2U2N, TCO, TCE) • Taiwan HQ with facilities (1/2 cost), operations (1/2 c.), engineering (1/2 c.) and sales/marketing (1/2 c.) for cost advantages • Economies of scale - We are speeding up now WE ARE BACK! – $10B/Y REVENUE 2025 $10B 10K delay NASDAQ Delist COVID19 Resume Fast Growth

INCREASING LONG TERM VALUE Supermicro Legacy Investments in Supermicro Investment View • 21% CAGR from 2010 – 2018 • 27 year history of profits • Advantage of being a U.S. designer/manufacturer of server solutions • San Jose and Taiwan capital improvements allow capacity for growth • Investments in new people, IT Infrastructure and R&D support additional growth. Proportionately, the biggest headcount increase is in Taiwan R&D • $200M share repurchase plan returns value to shareholders • Completion of capacity expansion returns focus to customers • Growth in Taiwan Mfg. and R&D offers improved efficiencies and lower cost

HISTORICAL PERSPECTIVE GAAP FY19 FY20 Annual Revenue Growth Rate 4.2% -4.6% Gross Margin 14.2% 15.8% R&D 5.1% 6.6% SG&A 6.2% 6.6% Operating Margin 2.9% 2.6% Tax Rate 16.6% 3.4%

DRIVING GROWTH - OPERATING LEVERAGE & EARNINGS Non-GAAP ** FY19 FY20 Target Model 3 years Annual Revenue Growth Rate 4.2% -4.6% 17%-23% Gross Margin 14.2% 15.9% 14%-17% R&D 4.8% 5.7% 4%-5% SG&A 4.4% 5.2% 3.5%-5% Operating Margin 5.0% 5.0% 5%-8% Tax Rate 20% 10% 16%-21% **Except Annual Revenue Growth Rate which is GAAP A reconciliation of GAAP to non-GAAP financial measures can be found in the appendix of this presentation.
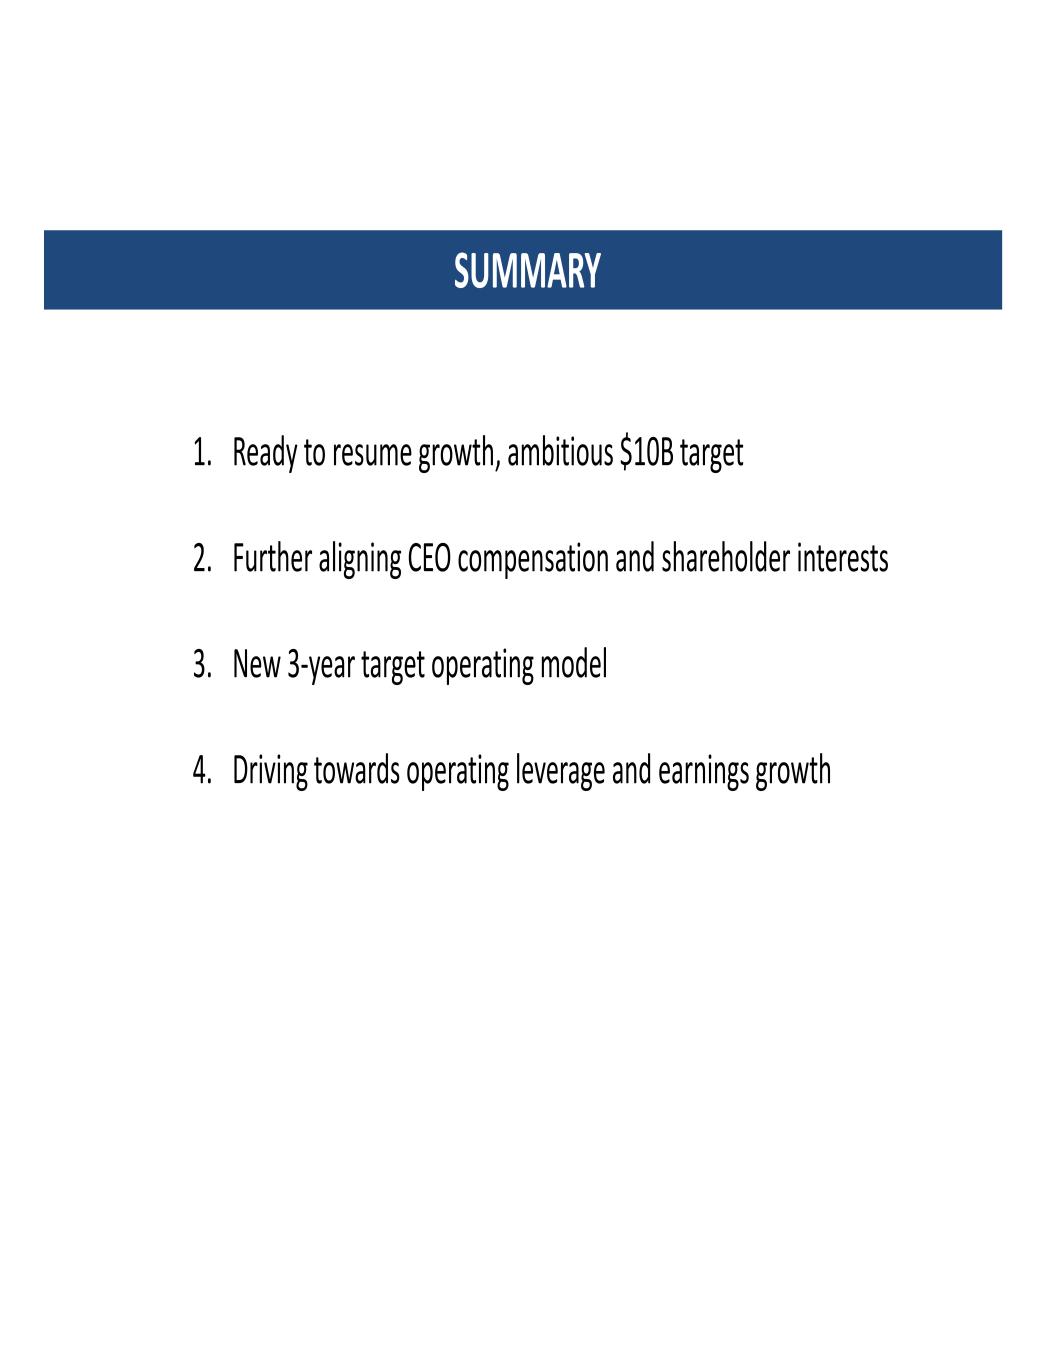
SUMMARY 1. Ready to resume growth, ambitious $10B target 2. Further aligning CEO compensation and shareholder interests 3. New 3-year target operating model 4. Driving towards operating leverage and earnings growth
Q & A Preferred Question Method: Raise Your Hand, Turn on Your Camera Alternate Method: Submit questions via “Q&A” options Building Block Solutions Green Computing New Taiwan HQ for cost down Resume fast growth: 2X to 3X

APPENDIX
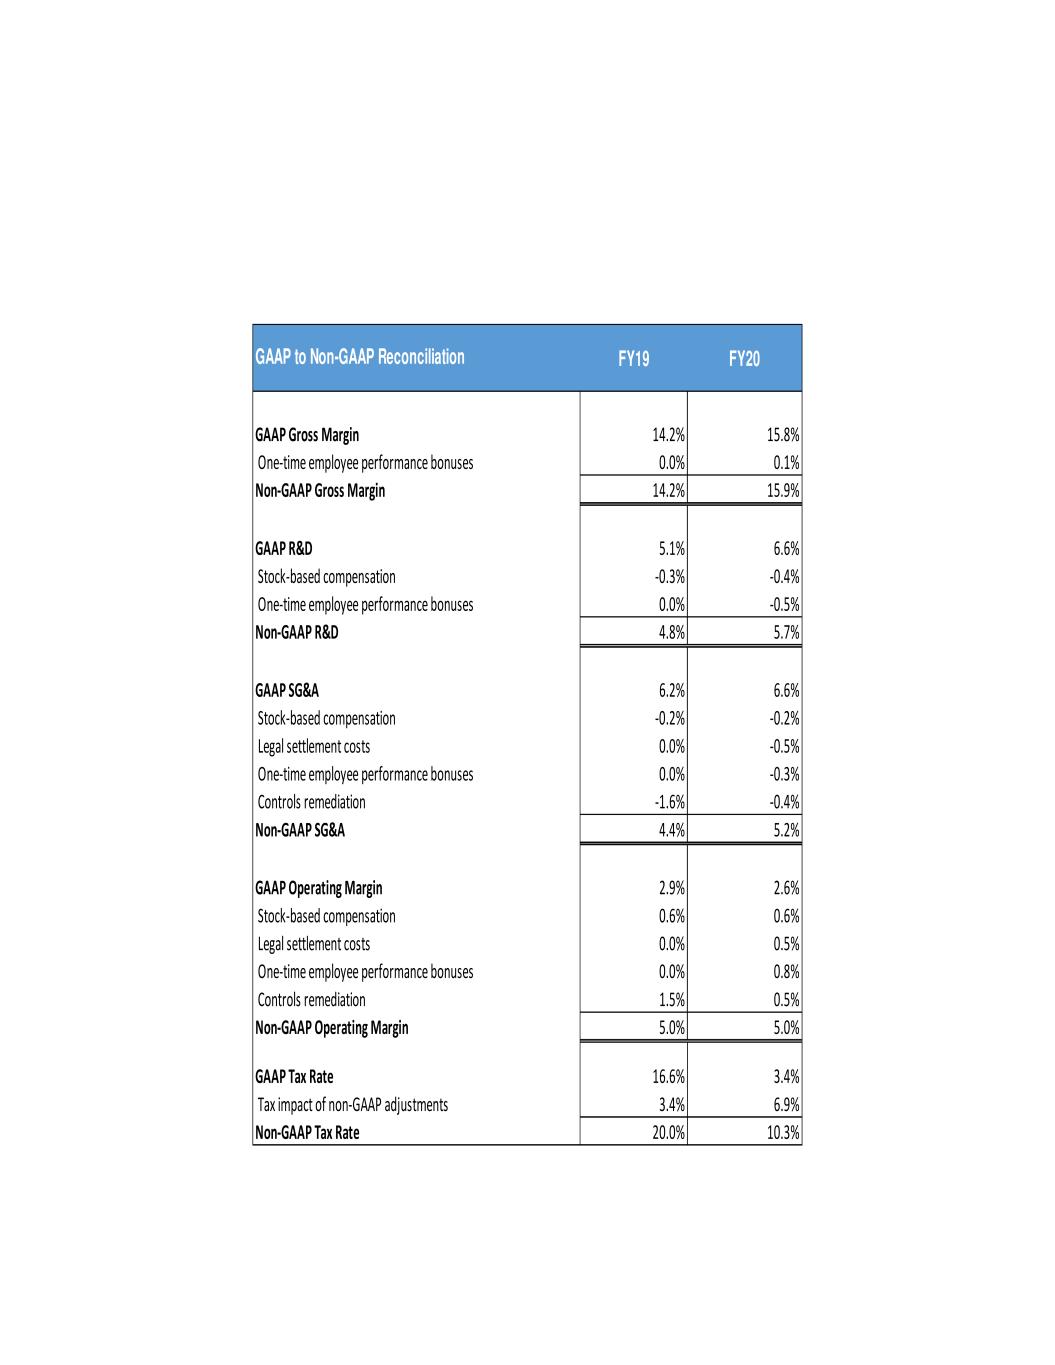
GAAP to Non-GAAP Reconciliation FY19 FY20 GAAP Gross Margin 14.2% 15.8% One-time employee performance bonuses 0.0% 0.1% Non-GAAP Gross Margin 14.2% 15.9% GAAP R&D 5.1% 6.6% Stock-based compensation -0.3% -0.4% One-time employee performance bonuses 0.0% -0.5% Non-GAAP R&D 4.8% 5.7% GAAP SG&A 6.2% 6.6% Stock-based compensation -0.2% -0.2% Legal settlement costs 0.0% -0.5% One-time employee performance bonuses 0.0% -0.3% -1.6% -0.4% Non-GAAP SG&A 4.4% 5.2% GAAP Operating Margin 2.9% 2.6% Stock-based compensation 0.6% 0.6% Legal settlement costs 0.0% 0.5% One-time employee performance bonuses 0.0% 0.8% 1.5% 0.5% Non-GAAP Operating Margin 5.0% 5.0% GAAP Tax Rate 16.6% 3.4% 3.4% 6.9% Non-GAAP Tax Rate 20.0% 10.3% Tax impact of non-GAAP adjustments Controls remediation Controls remediation
