Attached files
| file | filename |
|---|---|
| EX-21.1 - EXHIBIT 21.1 - Super Micro Computer, Inc. | smci-ex211_2019630x10k.htm |
| EX-32.2 - EXHIBIT 32.2 - Super Micro Computer, Inc. | smci-ex322_2019630x10k.htm |
| EX-32.1 - EXHIBIT 32.1 - Super Micro Computer, Inc. | smci-ex321_2019630x10k.htm |
| EX-31.2 - EXHIBIT 31.2 - Super Micro Computer, Inc. | smci-ex312_2019630x10k.htm |
| EX-31.1 - EXHIBIT 31.1 - Super Micro Computer, Inc. | smci-ex311_2019630x10k.htm |
| EX-10.59 - EXHIBIT 10.59 - Super Micro Computer, Inc. | smci-ex1059_2019630x10k.htm |
| EX-10.58 - EXHIBIT 10.58 - Super Micro Computer, Inc. | smci-ex1058_2019630x10k.htm |
| EX-10.57 - EXHIBIT 10.57 - Super Micro Computer, Inc. | smci-ex1057_2019630x10k.htm |
| EX-10.56 - EXHIBIT 10.56 - Super Micro Computer, Inc. | smci-ex1056_2019630x10k.htm |
| EX-10.55 - EXHIBIT 10.55 - Super Micro Computer, Inc. | smci-ex1055_2019630x10k.htm |
| EX-10.54 - EXHIBIT 10.54 - Super Micro Computer, Inc. | smci-ex1054_2019630x10k.htm |
| EX-4.5 - EXHIBIT 4.5 - Super Micro Computer, Inc. | smci-ex45_2019630x10k.htm |
UNITED STATES
SECURITIES AND EXCHANGE COMMISSION
Washington, D.C. 20549
__________________________________________________________________________
Form 10-K
x | ANNUAL REPORT PURSUANT TO SECTION 13 OR 15(d) OF THE SECURITIES EXCHANGE ACT OF 1934 |
For the fiscal year ended June 30, 2019
or
¨ | TRANSITION REPORT PURSUANT TO SECTION 13 OR 15(d) OF THE SECURITIES EXCHANGE ACT OF 1934 |
For the transition period from to
Commission File Number 001-33383
__________________________________________________________________________
Super Micro Computer, Inc.
(Exact name of registrant as specified in its charter)
Delaware | 77-0353939 | |
(State or other jurisdiction of incorporation or organization) | (I.R.S. Employer Identification No.) | |
980 Rock Avenue
San Jose, CA 95131
(Address of principal executive offices, including zip code)
(408) 503-8000
(Registrant’s telephone number, including area code)
__________________________________________________________________________
Securities registered pursuant to Section 12(b) of the Act:
Title of each class | Trading Symbol | Name of each exchange on which registered |
Common Stock, $0.001 par value per share | SMCI | OTC |
Securities registered pursuant to section 12(g) of the Act: None
Indicate by check mark if the registrant is a well-known seasoned issuer, as defined in Rule 405 of the Securities Act. Yes ¨ No x
Indicate by check mark if the registrant is not required to file reports pursuant to Section 13 or Section 15(d) of the Act. Yes ¨ No x
Indicate by check mark whether the registrant (1) has filed all reports required to be filed by Section 13 or 15(d) of the Securities Exchange Act of 1934 during the preceding 12 months (or for such shorter period that the registrant was required to file such reports), and (2) has been subject to such filing requirements for the past 90 days. Yes ¨ No x
Indicate by check mark whether the registrant has submitted electronically every Interactive Data File required to be submitted pursuant to Rule 405 of Regulation S-T (§232.405 of this chapter) during the preceding 12 months (or for such shorter period that the registrant was required to submit such files). Yes ¨ No x
Indicate by check mark whether the registrant is a large accelerated filer, an accelerated filer, a non-accelerated filer, a smaller reporting company, or an emerging growth company. See the definitions of “large accelerated filer,” “accelerated filer,” “smaller reporting company,” and “emerging growth company” in Rule 12b-2 of the Exchange Act.
Large accelerated filer x | Accelerated filer ¨ | |
Non-accelerated filer ¨ | Smaller reporting company ¨ | |
Emerging growth company ¨ | ||
If an emerging growth company, indicate by check mark if the registrant has elected not to use the extended transition period for complying with any new or revised financial accounting standards provided pursuant to Section 13(a) of the Exchange Act. ¨
Indicate by check mark whether the registrant is a shell company (as defined in Rule 12b of the Exchange Act) Yes ¨ No x
The aggregate market value of the registrant’s common stock held by non-affiliates, based upon the closing price of the common stock on December 31, 2018, as reported by the OTC Market, was $596,876,261. Shares of common stock held by each executive officer and director and by each person who owns 5% or more of the outstanding common stock, based on filings with the Securities Exchange Commission, have been excluded since such persons may be deemed affiliates. This determination of affiliate status is not necessarily a conclusive determination for other purposes.
As of November 30, 2019, there were 50,085,282 shares of the registrant’s common stock, $0.001 par value, outstanding, which is the only class of common stock of the registrant issued.
DOCUMENTS INCORPORATED BY REFERENCE
None
SUPER MICRO COMPUTER, INC.
ANNUAL REPORT ON FORM 10-K
FOR THE FISCAL YEAR ENDED JUNE 30, 2019
TABLE OF CONTENTS
Page | ||
PART I | ||
Item 1. | ||
Item 1A. | ||
Item 1B. | ||
Item 2. | ||
Item 3. | ||
Item 4. | ||
PART II | ||
Item 5. | ||
Item 6. | ||
Item 7. | ||
Item 7A. | ||
Item 8. | ||
Item 9. | ||
Item 9A. | ||
Item 9B. | ||
PART III | ||
Item 10. | ||
Item 11. | ||
Item 12. | ||
Item 13. | ||
Item 14. | ||
PART IV | ||
Item 15. | ||
Unless the context requires otherwise, the words “Super Micro,” “Supermicro,” “we,” “Company,” “us” and “our” in this document refer to Super Micro Computer, Inc. and where appropriate, our wholly owned subsidiaries. Supermicro, the Company logo and our other registered or common law trademarks, service marks, or trade names appearing in this Annual Report on Form 10-K are the property of Super Micro Computer, Inc. or its affiliates. Other trademarks, service marks, or trade names appearing in this Annual Report on Form 10-K are the property of their respective owners.
1
Explanatory Note
We are filing this comprehensive Annual Report on Form 10-K (this “Annual Report”) for the fiscal year ended June 30, 2019 with expanded financial and other disclosures in lieu of filing a separate Annual Report on Form 10-K for the fiscal year ended June 30, 2018 and separate Quarterly Reports on Form 10-Q for the quarterly periods ended September 30, 2017, December 31, 2017, and March 31, 2018. Prior to the filing of this Annual Report, we filed separate Quarterly Reports on Form 10-Q for the quarterly periods ended September 30, 2018, December 31, 2018, and March 31, 2019 (collectively, the “2019 10-Qs”). This Annual Report is being filed to facilitate the dissemination of financial and other information to investors. We do not intend to file a separate Annual Report on Form 10-K for the fiscal year ended June 30, 2018 or Quarterly Reports on Form 10-Q for the quarterly periods ended September 30, 2017, December 31, 2017 and March 31, 2018.
We did not file our Annual Report on Form 10-K for the fiscal year ended June 30, 2017 (the “2017 10-K”) until May 17, 2019. On that date we also filed amended Quarterly Reports on Form 10-Q/A for the quarters ended September 30, 2016, December 31, 2016 and March 31, 2017 (the “2017 Amended Quarterly Reports” and with the 2017 10-K, the “2017 Reports”). Some of the financial statements contained in the 2017 Reports were restated. The circumstances leading to the need to restate those financial statements, and our efforts to investigate, assess and remediate those matters, are more fully described in those reports.
Our delay in the filing of this Annual Report was primarily due to the time required to (a) complete the preparation of the 2017 Reports, including the restatement of certain of our previously issued consolidated financial statements; (b) prepare the financial statements for each of the quarters in our fiscal year ended June 30, 2018; (c) prepare and file the Quarterly Reports on Form 10-Q for each of the quarters in our fiscal year ended June 30, 2019; (d) prepare the consolidated financial statements for the fiscal years ended June 30, 2019 and 2018; and (e) prepare other disclosures contained herein.
2
SPECIAL NOTE REGARDING FORWARD-LOOKING STATEMENTS
This Annual Report contains “forward-looking statements” within the meaning of Section 27A of the Securities Act of 1933 and Section 21E of the Securities Exchange Act of 1934, as amended that involve risks and uncertainties. These statements relate to future events or our future financial performance. In some cases, you can identify forward-looking statements by terminology including “would,” “could,” “may,” “will,” “should,” “expect,” “intend,” “plan,” “anticipate,” “believe,” “estimate,” “predict,” “potential,” or “continue,” the negative of these terms or other comparable terminology. In evaluating these statements, you should specifically consider various factors, including the risks described below, under Part I, Item 1A, “Risk Factors”, and in other parts of this Form 10-K as well as in our other filings with the SEC. Moreover, we operate in a very competitive and rapidly changing environment. New risks emerge from time to time. It is not possible for our management to predict all risks, nor can we assess the impact of all factors on our business or the extent to which any factor, or combination of factors, may cause actual results to differ materially from those contained in any forward-looking statements we may make. In light of these risks, uncertainties and assumptions, the future events and trends discussed in this Annual Report may not occur and actual results could differ materially and adversely from those anticipated or implied in the forward-looking statements.
We undertake no obligation to update or revise any forward-looking statements, whether as a result of new information, future events or otherwise, except as required by law. We cannot guarantee future results, levels of activity, performance or achievements. Given these risks and uncertainties, readers are cautioned not to place undue reliance on such forward-looking statements.
PART I
Item 1. Business
Overview
We are a Silicon Valley founded, headquartered and operated provider of application-optimized high performance and high-efficiency server and storage systems. We develop and provide end-to-end green computing solutions to the cloud computing, data centers, enterprise, big data, artificial intelligence ("AI"), High-Performance Computing ("HPC"), edge computing and Internet of Things/embedded (“IoT”) markets. Our solutions range from complete server, storage, modular blade servers, blades and workstations to full racks, networking devices, server management software, server sub-systems and global support and services. We offer our customers a high degree of flexibility and customization by providing a broad array of server configurations from which they can choose the optimal solutions to fit their computing needs. Our server and storage systems, subsystems and accessories are architecturally designed to provide high levels of reliability, quality, configurability, and scalability.
We perform the majority of our research and development efforts, at our San Jose, California headquarters, which we believe increases the efficiency of communication and collaboration between design teams, streamlines the development process and reduces time-to-market. This building block approach allows us to provide a broad range of products and enables us to build and deliver application-optimized solutions based upon customers’ requirements.
Our resource-saving architecture continues our tradition of leading the market with green IT innovation. Leveraging an overall architecture that optimizes data center power, cooling, shared resources and refresh cycles, we believe this approach helps the environment and provides total cost of ownership (“TCO”) savings for our customers. Furthermore, our architecture disaggregates central processing units (“CPU”) and memory, which allows each resource to be refreshed independently thereby allowing data centers to reduce refresh cycle costs.
We conduct our operations principally from our Silicon Valley headquarters in California and subsidiaries in Taiwan and the Netherlands. Our sales and marketing activities are conducted through a combination of our direct sales force and indirect sales channel partners. In our indirect sales channels, we work with distributors, value added resellers, system integrators, and original equipment manufacturers ("OEMs") to market and sell our optimized solutions to their end customers. During each of the fiscal years 2019 and 2018, we sold to over 850 direct customers in over 110 countries. During the same periods, through our indirect sales channels, we have also sold to numerous end users. We commenced operations in 1993 and have been profitable every year since inception.
3
The Supermicro Solution
We develop and manufacture high-performance server and storage solutions based upon an innovative, modular and open architecture. Our primary competitive advantages are the breadth of our product portfolio that can better match exact customer requirements and our ability to deliver new technologies to market faster. Our integrated internal research and development resources along with our deep understanding of complex computing and storage requirements enable us to deliver the advanced functionality and capabilities required by our customers. We believe that our approach provides us with greater flexibility to quickly and efficiently develop optimized server solutions for our customers’ specific application requirements.
Rapid Time-to-Market Server Solutions
Our in-house design competencies, control of design of many of the components used within our server and storage systems and our building block architecture enable us to rapidly develop, build and test server and storage systems, subsystems and accessories with unique configurations. As a result, when new technologies are brought to market, we are generally able to quickly design, integrate and assemble a broad portfolio of solutions by leveraging common building blocks across product lines. We work closely with the leading microprocessor, graphics processing units (“GPU”), memory, disk/flash, and interconnect vendors and other hardware and software suppliers to coordinate the design of our new products with their product release schedules, thereby enhancing our ability to rapidly introduce new products incorporating the latest technology.
Improved Power Efficiency and Thermal Management
We believe that we are an industry leader in power-saving technology. We have designed flexible power management systems, which customize or eliminate components to reduce overall power consumption. We have developed proprietary power supplies capable of integration across a wide range of server system form factors which can significantly enhance power efficiency. We have also developed thermal management technologies to reduce the effects of heat dissipation from our servers. Our products achieve a competitive price-to-performance ratio while minimizing energy costs and reducing the risk of server malfunction caused by overheating. We have also developed power management software that controls power consumption of server clusters by policy-based administration.
High-Density Servers
Our servers are designed to enable customers to maximize computing power while minimizing the physical space utilized, which allows our customers to deploy our server and storage systems in scale-out configurations. Our systems can offer significantly more memory, hard drive, solid-state drive (“SSD”), storage and expansion slots than traditional server and storage systems with a comparable server form factor. For example, our BigTwin® solutions contain two or four full feature dual-processor hot-pluggable compute nodes with All-Flash Non-Volatile Memory express (“NVMe”) support in a two rack unit (“2U”) server. This high-density design is well suited for our customers that require highly space-efficient solutions and delivers better efficiency through sharing resources across systems.
Strategy
Our objective is to be the world’s leading provider of application-optimized, high-performance server, storage and networking solutions. Achieving this objective requires continuous development and innovation of our solutions with better price-performance and architectural advantages compared with our prior generation of solutions and with solutions offered by our competitors. We believe that our ability to innovate and execute will enable us to maintain or improve our relative competitive position in many product areas and provide us with additional long-term growth opportunities. Key elements of our strategy include sustaining our time-to-market advantage, enhancing our software management solutions, expanding our service and support offerings, further optimizing our global operating structure and deepening our relationships with customers, partners, suppliers and manufacturers.
Maintain Our Time-to-Market Advantage
We believe one of our major competitive advantages is our ability to rapidly incorporate the latest technological innovations into our products. We intend to maintain our time-to-market advantage by continuing our investment in our research and development efforts to rapidly develop new proprietary server, storage and networking solutions based on industry-standard components. We plan to continue to work closely with technology partners such as Intel Corporation (“Intel”), Nvidia Corporation (“Nvidia”) and Advanced Micro Devices, Inc. (“AMD”), to develop products that are compatible with the latest generation of industry-standard technologies and maintain our time-to-market advantage.
4
Enhance Our Software Management Solutions
We have introduced and plan to continue to develop additional server, storage and networking management software capabilities as well as partner with software suppliers for software solutions that are integrated with our server products. We have invested in system management software like industry standard Redfish APIs for automation, RAS functionality to improve quality, and diagnostics to help reduce debug times. We have partnerships with security researchers, and have also invested in security technologies and testing tools like Root of Trust for improving product security on BIOS and BMC images. This strategy will enable our customers to simplify and automate the large scale deployment, configuration and monitoring of our servers.
Expand Our Service and Support Offerings
We intend to continue to expand our global customer service and support offerings that enable our customers to purchase service and support together with our complete server and storage systems as complete solution packages. Our service and support are designed to help our customers improve uptime, reduce costs and enhance the productivity of our products. We believe that continued enhancement of these offerings will support the continued growth of our business and increase our market-penetration with enterprise customers.
Further Optimize Our Global Operating Structure
We plan to continue to increase our worldwide manufacturing capacity and logistics abilities in the United States, the Netherlands and Taiwan to more efficiently serve our customers and lower our overall manufacturing costs. We remain focused on our global tax structure to optimally manage our tax obligations. Within our global operating structure, we employ stringent due diligence and qualification processes to select our contract manufacturers, which we regularly audit for process, quality, security and control. Our global manufacturing process is designed to ensure the end-to-end security of our products.
Deepen Our Relationships with Suppliers and Manufacturers
Our efficient supply chain and combined internal and outsourced manufacturing strategy allow us to build application optimized systems while minimizing costs. We plan to continue leveraging our relationships with suppliers and contract manufacturers, two of which are related parties, to maintain and improve our cost structure as we benefit from economies of scale.
We have also partnered with industry leading software suppliers, including Microsoft, RedHat and SAP for software solutions that are integrated with our server and storage systems.
Products and Services
We offer a broad range of application-optimized server solutions, including storage, rackmount and blade server and storage systems and subsystems and accessories, which can be used to build complete server and storage systems serving a variety of markets, including cloud computing, data center, enterprise, big data, HPC, AI, 5G, IoT, embedded and edge computing. The percentage of our net sales represented by sales of server and storage systems increased to 81.7% in fiscal year 2019 from 79.3% in fiscal year 2018 and from 70.0% in fiscal year 2017, and the percentage of our net sales represented by sales of subsystems and accessories was 18.3% in fiscal year 2019, 20.7% in fiscal year 2018 and 30.0% in fiscal year 2017.
Server and Storage Systems
We sell server and storage systems in rackmount, blade, and multi-node (Twin) form factors, which support single, dual, and multiprocessor architectures. A summary of our server and storage systems and their markets are listed below.
Our SuperBlade® and MicroBlade™ system families are each designed to share common computing resources, thereby saving space and power over standard rackmount servers. We believe that with our SuperBlade and MicroBlade servers, leveraging our unique disaggregated resource-saving architectures customers can upgrade individual compute modules and other Blade resources for multiple generations of technology, thereby reducing their overall acquisition costs and environmental impact.
Our SuperStorage systems provide high-density storage while leveraging high-efficiency power to maximize performance-per-watt savings to reduce TCO for enterprise data centers, big data, and other high-performance applications. For example, our All-Flash NVMe systems can deliver better performance and efficiency than traditional storage solutions; and our
5
Simply Double SuperStorage systems which include twice the number of hotswap bays as 2U industry-standard systems, offer up to twice the storage capacity and input/output operations per second in the same amount of space.
Our Twin family of multi-node server systems including 1U and 2U Twin™, 1U and 2U TwinPro™, 4U FatTwin™, and new 2U BigTwin™ are optimized for density, performance, and power efficiency for customers' storage, HPC, Hyper-converged infrastructure and cloud computing requirements. The new 2U four-node BigTwin delivers double the density of traditional rackmounts while supporting maximum performance and functionality with up to 205 watt Intel Xeon Scalable Processors, 24 DIMMS and All-Flash NVMe.
Our Ultra Server systems in 1U and 2U platforms are designed to deliver performance, flexibility, scalability and serviceability that are ideal for demanding enterprise workloads. They provide enterprise IT professionals with the ability to select a single server platform that can easily be reconfigured for many applications reducing qualification time and lowering spare inventory required.
Our GPU or accelerated computing server systems in 1U, 2U, 4U, 10U, and blade platforms deliver advanced parallel processing capabilities built on the latest GPU designs, and provide high performance in calculation-intensive applications. We work closely with GPU leaders, specifically Nvidia, Intel and others to offer a rich set of GPU based systems.
Our multi-processor product line supports four and eight-socket configurations for high-performance memory-intensive enterprise applications with 192 DIMMS for up to 36 terabytes memory capacity and 23 PCI-E expansion slots. We recently expanded our offerings to support SAP HANA in-memory databases with optimal performance.
Our Data Center Optimized server systems deliver superior performance-per-watt to optimize data center TCO with an improved thermal architecture utilizing efficient power components and offset processors to help eliminate CPU preheating and support a 5+ year product life cycle.
Our MicroCloud server systems are high density, multi-node UP servers with up to 24 hot-pluggable nodes in a compact 3U form factor. MicroCloud integrates advanced technologies within a compact functional design to deliver high performance in environments with space and power constraints. These combined features provide a cost-effective solution for IT professionals implementing new hosting architectures for small and medium sized businesses and public/private cloud computing applications.
Our IoT server and storage systems are compact, smart and secure products that reside on the edge of the network, connecting smart sensors and devices to the cloud over wireless or wired networks. These server and storage systems are built on open architectures to ensure interoperability, ease of services deployment and enable a broad ecosystem of solution providers. The IoT server and storage systems empower users to securely aggregate, share and filter data for analysis. These server and storage systems help ensure that data generated by devices can travel securely and efficiently from the edge of the network to the cloud and back, without replacing existing infrastructure.
Our internally developed switch products include our 1G/10G/40G/100G Ethernet, InfiniBand and Omni Path switches for rack-mount servers. These switches enable us to offer more complete solutions for our customers.
Data center, cloud and HPC customers can use Supermicro as a one-stop shop for complete rack level solutions. Our SuperRack total server solutions provide rack level solutions that incorporate server, storage, networking and software with a wide range of flexible accessory options. Our SuperRack total solutions offer testing and validation, complete installation, user-friendly cabling and cable identification, and effortless integration of our high density server, storage and blade systems.
Server Software Management Solutions
Our open industry-standard remote system management solutions, such as our Server Management suite, including Supermicro Server Manager (“SSM”), Supermicro Power Management software (“SPM”), Supermicro Update Manager (“SUM”), and SuperDoctor 5, have been designed to help manage large-scale heterogeneous data center environments from the cloud to the edge.
Server Subsystems and Accessories
In addition to our complete systems business, we offer a large array of modular server subsystems and accessories such as serverboards, chassis, power supplies and other accessories. These subsystems are the foundation of our server solutions and span product offerings from the entry-level single and dual processor server segment to the high-end multi-
6
processor market. The majority of the subsystems and accessories we sell individually are optimized to work together and are ultimately integrated into complete server and storage systems.
Serverboards
We design our serverboards with the latest hardware technologies and infrastructure software. Each serverboard is designed and optimized to adhere to specific physical, electrical, and design requirements to work with certain combinations of chassis and power supplies and achieve maximum functionality.
Chassis and Power Supplies
Our chassis are designed to efficiently house our servers while maintaining interoperability, adhering to industry standards, and increasing output efficiency through power supply design. We believe that our latest generation of power supplies achieves the maximum power efficiency commercially available to date. Our server chassis come with hot-plug, heavy-duty fans, fan speed control, and an advanced air shroud design to maximize airflow and system reliability.
Supermicro Global Services
We provide global service and support offerings for our direct and OEM customers and our indirect sales channel partners directly or through approved distributors and third-party partners. Our services include server and storage system integration, configuration and software upgrades and updates. We also identify service requirements, create and execute project plans, conduct verification testing and training and provide technical documentation.
Global Services: Our strategic direct and OEM customers may purchase a variety of on-site support service plans. Our service plans vary depending on specific services, response times, coverage hours and duration, repair priority levels, spare parts requirements, logistics, data privacy and security needs. Our Global Services team provides help desk services and on-site product support for our server and storage systems.
Support Services: Our customer support services offer competitive market warranties, generally from one-to-three years, and warranty extension options for products sold by our direct sales team and approved indirect sales channel partners. Our customer support team provides ongoing maintenance and technical support for our products through our website and 24-hour continuous direct phone-based support.
Research and Development
We perform the majority of our research and development activities in-house in San Jose, California, increasing the communication and collaboration between design teams to streamline the development process and reducing time-to-market. We believe that the combination of our focus on internal research and development activities, our close working relationships with customers and vendors and our modular design approach allows us to minimize time-to-market. We continue to invest in reducing our design and manufacturing costs and improving the performance, cost-effectiveness and power and space-efficiency of our solutions.
Our research and development teams focus on the development of new and enhanced products that can support emerging technological and engineering innovations while highly optimizing the overall system performance. Much of our research and development activity relates to the new product cycles of leading processor vendors. We work closely with Intel, Nvidia and AMD, among others, to develop products that are compatible with the latest generation of industry-standard technologies under development. Our collaborative approach with these vendors allows us to coordinate the design of our new products with their product release schedules, thereby enhancing our ability to rapidly introduce new products incorporating the latest technology. We work closely with their respective development teams to optimize system performance and reduce system-level issues. Similarly, we work very closely with our customers to identify their needs and develop our new product plans accordingly.
Customers
During each of the fiscal years 2019 and 2018, we sold to over 850 direct customers in over 110 countries. During the same periods, through our indirect sales channels, we have also sold to numerous end users. These customers represent a diverse set of market verticals including cloud computing, data center, enterprise, artificial intelligence and machine learning, big data, HPC and IoT. In fiscal years 2019 and 2018, no customer represented greater than 10% of our total net sales.
7
Sales and Marketing
Our sales and marketing activities are conducted through a combination of our direct sales force and our indirect sales channel partners. Our direct sales force is primarily focused on selling complete systems and solutions, including management software and global services to large scale cloud, enterprise and OEM customers.
We work with distributors, value-added resellers, system integrators, and OEMs to market and sell application optimized solutions to their end customers. We provide sales and marketing assistance and training to our indirect sales channel partners and OEMs, who in turn provide service and support to end customers. We leverage our relationships in our indirect sales channel and with our OEMs to penetrate select industry segments where our products can provide a superior alternative to existing solutions.
We maintain close contact with our indirect sales channel partners and end customers. We often collaborate during the sales process with our indirect sales channel partners and the end customer’s technical staff to help determine the optimal system configuration for the customer’s needs. Our interaction with our indirect sales channel partners and end customers allows us to monitor customer requirements and develop new products to meet their needs.
International Sales
Our global sales efforts are supported both by our international offices in the Netherlands, Taiwan, United Kingdom, China and Japan as well as by our United States based sales team. Product fulfillment and first level support for our international customers are provided by Supermicro Global Services and through our indirect sales channel and OEMs. Sales to customers located outside of the United States represented 41.9%, 43.4% and 42.8% of net sales in fiscal years 2019, 2018 and 2017, respectively.
Marketing
Our marketing programs are designed to create a global awareness and branding for our company, understanding of the unique value we bring to customers, and inform existing and potential customers, the trade press, indirect sales channel partners and OEMs about the capabilities and benefits of using our products and solutions. Our marketing efforts support the sale and distribution of our products through direct sales and indirect channels. We rely on a variety of marketing vehicles, including advertising, public relations, web, social media, participation in industry trade shows and conferences to help gain market acceptance. We provide funds for cooperative marketing to our indirect sales channel partners to extend the reach of our marketing efforts. We also actively utilize our suppliers’ cooperative marketing programs and jointly benefit from their marketing development funds to which we are entitled.
Intellectual Property
We seek to protect our intellectual property rights with a combination of patents, trademarks, copyrights, trade secret laws, and disclosure restrictions. We rely primarily on trade secrets, technical know-how, and other unpatented proprietary information relating to our design and product development activities. We also enter into confidentiality and proprietary rights agreements with our employees, consultants, and other third parties and control access to our designs, documentation and other proprietary information.
Manufacturing and Quality Control
We manufacture the majority of our systems at our San Jose, California headquarters. We believe we are the only major server and storage vendor that designs, develops, and manufactures the majority of their systems in the United States. Global assembly, test and quality control of our servers are performed at our manufacturing facilities in San Jose, California, the Netherlands, and Taiwan. Each of our facilities has been certified according to ISO 9001, ISO 14001 and/or ISO 13485 standards. Our suppliers and contract manufacturers are required to support the same standards to maintain consistent product and service quality and continuous improvement of quality and environmental performance.
We use several third-party suppliers and contract manufacturers for materials and sub-assemblies, such as serverboards, chassis, disk drives, SSDs, power supplies, fans and computer processors. We believe that selectively using outsourced manufacturing services allows us to focus on our core competencies in product design and development and increases our operational flexibility. We believe our manufacturing strategy allows us to adjust manufacturing capacity in response to changes in customer demand and to rapidly introduce new products to the market. We use Ablecom Technology, Inc. (“Ablecom”) and its affiliate Compuware Technology, Inc. ("Compuware"), both of which are related parties, for contract
8
design and manufacturing coordination support. We work with Ablecom to optimize modular designs for our chassis and several other components. Ablecom also coordinates the manufacturing of chassis for us. In addition to providing a large volume of contract manufacturing services to us, Ablecom warehouses multiple components and subassemblies manufactured by various suppliers before shipment to our facilities in the United States, Europe and Asia. We also have a series of agreements with Compuware, including multiple product development, production and service agreements, product manufacturing agreements and lease agreements for office space. See Part II, Item 8, Note 12, “Related Party Transactions” to the consolidated financial statements and Part III, Item 13, “Certain Relationships and Related Transactions and Director Independence.”
We monitor our inventory continuously to be able to meet customer delivery requirements and to avoid inventory obsolescence. Due to our building-block designs, our inventory can generally be used with multiple different products, lowering working capital requirements and reducing the risk of inventory write-downs.
Competition
The market for our products is highly competitive, rapidly evolving and subject to new technological developments, changing customer needs and new product introductions. In particular, in recent years the market has been subject to substantial change. We compete primarily with large vendors of X86 based general purpose servers and components. In addition, we also compete with smaller vendors that specialize in the sale of server components and systems. Over the last several years, we have experienced increased competition from Original Design Manufacturers ("ODMs”) that benefit from their scale and very low cost manufacturing and are increasingly offering their own branded products. We believe our principal competitors include:
• | Global technology vendors such as Cisco, Dell, Hewlett-Packard Enterprise, Huawei, IBM, and Lenovo; and |
• | ODMs, such as Inspur, Quanta Computer, and Wiwynn Corporation. |
The principal competitive factors in our market include the following:
• | First to market with new emerging technologies; |
• | High product performance, efficiency and reliability; |
• | Early identification of emerging opportunities; |
• | Cost-effectiveness; |
• | Interoperability of products; |
• | Scalability; and |
• | Localized and responsive customer support on a worldwide basis. |
We believe that we compete favorably with respect to most of these factors. However, most of our competitors have longer operating histories, significantly greater resources, greater name recognition and deeper market penetration. They may be able to devote greater resources to the development, promotion and sale of their products than we can, which could allow them to respond more quickly to new technologies and changes in customer needs. See Part I, Item 1A, "Risk Factors" risk titled “The market in which we participate is highly competitive, and if we do not compete effectively, we may not be able to increase our market penetration, grow our net sales or improve our gross margins.”
Employees
As of June 30, 2019, we employed 3,670 full time employees, consisting of 1,533 employees in research and development, 430 employees in sales and marketing, 362 employees in general and administrative and 1,345 employees in manufacturing. Of these employees, 2,281 employees are based in our San Jose facilities. As of June 30, 2018, we employed 3,266 full time employees, consisting of 1,346 employees in research and development, 390 employees in sales and marketing,316 employees in general and administrative and 1,214 employees in manufacturing. Of these employees, 2,090 employees are based in our San Jose facilities. We consider our highly qualified and motivated employees to be a key factor in our business success. Our employees are not represented by any collective bargaining organization, and we have never experienced a work stoppage. We believe that our relations with our employees are good.
Corporate Information
We were founded in, and maintain our worldwide headquarters and the majority of our employees in San Jose, California. We are one of the largest employers in the City of San Jose and an active member of the San Jose and Silicon Valley community.
9
We were incorporated in California in September 1993. We reincorporated in Delaware in March 2007. Our common stock is quoted on the OTC Markets under the symbol "SMCI.” Our principal executive offices are located at 980 Rock Avenue, San Jose, CA 95131, and our telephone number is (408) 503-8000. Our website address is www.supermicro.com.
Financial Information about Segments and Geographic Areas
Please see Part II, Item 8, Note 17, “Segment Reporting” to the consolidated financial statements in this Annual Report for information regarding our international operations, and see Part I, Item 1A, “Risk Factors” for further information on risks associated with our international operations.
Working Capital
We focus considerable attention on managing our inventories and other working-capital-related items. We manage inventories by communicating with our customers and partners and using our industry experience to forecast demand. We place manufacturing orders for our products that are based on forecasted demand. We generally maintain substantial inventories of our products because the computer server industry is characterized by short lead-time orders and quick delivery schedules. As a result, we do not have a significant backlog of unfilled customer orders.
Available Information
Our Annual Report on Form 10-K, Quarterly Reports on Form 10-Q, Current Reports on Form 8-K and amendments to reports filed or furnished pursuant to Sections 13(a) and 15(d) of the Securities Exchange Act of 1934, as amended (the “Exchange Act”) are available free of charge, on or through our website at www.supermicro.com, as soon as reasonably practicable after we electronically file such reports with, or furnish those reports to, the SEC. Information contained on our website is not incorporated by reference in, or made part of this Annual Report or our other filings with or reports furnished to the SEC. The SEC also maintains a website that contains our SEC filings.
10
Item 1A. Risk Factors
Risks Related to Our Material Weaknesses in Internal Control Over Financial Reporting and Related Matters
We face risks related to being delinquent in our SEC reporting obligations.
Primarily due to the matters that led to our restatement of prior financial statements and the material weaknesses identified in connection therewith, which are more fully detailed in our 2017 10-K, immediately prior to the filing of this Annual Report, our SEC filings, including our Annual Reports on Form 10-K for the fiscal years ended June 30, 2018 and 2019 and our Quarterly Reports on Form 10-Q for the quarterly periods ended September 30, 2017, December 31, 2017, March 31, 2018, September 30, 2018, December 31, 2018, March 31, 2019 and September 30, 2019, were delinquent. Following this filing, our only delinquent report will be our Quarterly Report on Form 10-Q for the quarterly period ended September 30, 2019. While we cannot give assurance as to when we will file this outstanding quarterly report, our current intention is to file it in or before January 2020, and thereafter resume a timely filing schedule with respect to our future SEC reports. We expect to continue to face many of the risks and challenges related to the matters that led to the delay in the filing of our 2017 10-K, including the following:
• | We may fail to remediate material weaknesses in our internal control over financial reporting and other material weaknesses may be identified in the future, which would adversely affect the accuracy and timing of our financial reporting; |
• | Failure to timely file our SEC reports and make our current financial information available, has placed, and will continue to place, downward pressure on our stock price and result in the continued inability of our employees to sell the shares of our common stock underlying their awards granted pursuant to our equity compensation plans, which has adversely affected, and may continue to adversely affect, hiring and employee retention; |
• | Further delay in the filing of our SEC reports will delay our ability to seek the relisting of our common stock on a national securities exchange, and as a result, may continue to reduce the liquidity of our common stock; |
• | Litigation and claims as well as regulatory examinations, investigations, proceedings and orders arising out of our failure to file SEC reports on a timely basis, including the reasons and causes for such failure to file, will continue to divert management attention and resources from the operation of our business; |
• | We may not be able to recapture lost business or business opportunities due to ongoing reputational harm; and |
• | Negative reports or actions on our commercial credit ratings would increase our costs of, or reduce our access to, future commercial credit arrangements and limit our ability to refinance existing indebtedness. |
If one or more of the foregoing risks or challenges persist, our business, operations and financial condition are likely to be materially and adversely affected.
We have identified material weaknesses in our internal control over financial reporting, which could, if not remediated, adversely affect our ability to report our financial condition and results of operations in a timely and accurate manner.
We have concluded that our internal control over financial reporting was not effective as of June 30, 2019 due to the existence of material weaknesses in such controls, and we have also concluded that our disclosure controls and procedures were not effective as of June 30, 2019 due to material weaknesses in our internal control over financial reporting, all as described in Part II, Item 9A, “Controls and Procedures” of this Annual Report. While we have initiated remediation measures to address the identified material weaknesses, we cannot provide assurance that our remediation efforts will be adequate to allow us to conclude that such controls will be effective in the future. We also cannot assure you that additional material weaknesses in our internal control over financial reporting will not arise or be identified in the future. We intend to continue our control remediation activities and to continue to improve our overall control environment and our operational, information technology, financial systems, and infrastructure procedures and controls, as well as to continue to train, retain and manage our personnel who are essential to effective internal controls. In doing so, we will continue to incur expenses and expend management time on compliance-related issues. If we are unable to successfully complete our remediation efforts or favorably assess the effectiveness of our internal control over financial reporting, our operating results, financial position, ability to accurately report our financial results and timely file our SEC reports, and stock price could be adversely affected.
Moreover, because of the inherent limitations of any control system, material misstatements due to error or fraud may not be prevented or detected on a timely basis, or at all. If we are unable to provide reliable and timely financial reports in the future, our business and reputation may be further harmed. Restated financial statements and failures in internal controls may also cause us to fail to meet reporting obligations, negatively affect investor and customer confidence in our management or result in adverse publicity and concerns from investors and customers, any of which could have a negative effect on the price of
11
our common stock, subject us to further regulatory investigations, potential penalties or stockholder litigation, and have a material adverse impact on our business and financial condition.
The circumstances that led to the delay in the filing of our 2017 10-K, and our efforts to investigate, assess and remediate those matters have also caused substantial delays in the preparation and filing of our annual and quarterly reports for periods after June 30, 2017, including this Annual Report.
Our ability to resume a timely filing schedule with respect to our SEC reporting is subject to a number of contingencies, including whether and how quickly we are able to effectively remediate the identified material weaknesses in our internal control over financial reporting. We cannot give assurances as to when we will file our Quarterly Report on Form 10-Q for the quarter ended September 30, 2019, our current intention is to file it in or before January 2020, and thereafter resume a timely filing schedule with respect to our future SEC reports.
Investors will need to evaluate certain decisions with respect to our common stock in light of our lack of current financial information due to our inability to file our Quarterly Report on Form 10-Q for the quarter ended September 30, 2019, on a timely basis. Accordingly, any investment in our common stock involves a greater degree of risk. Our lack of current public information may have an adverse impact on investor confidence, which could lead to a reduction in our stock price. In addition, for so long as we are not current in our SEC filings, we are precluded from registering our securities with the SEC for offer and sale. This precludes us from raising debt or equity financing in the public markets, limits our access to the private markets and also limits our ability to use stock options and other equity-based awards to attract, retain and provide incentives to our employees.
The delisting of our common stock may continue to have a material adverse effect on the trading and price of our common stock, and we cannot assure you that our common stock will be relisted, or that once relisted, it will remain listed.
As a result of the delay in the filing of our periodic reports with the SEC, we were unable to comply with Nasdaq’s listing standards and our common stock was suspended from trading on The Nasdaq Global Select Market effective August 23, 2018 and formally delisted effective March 22, 2019.
The delisting of our common stock from Nasdaq has had and may continue to have a material adverse effect on us by, among other things, causing investors to dispose of our shares and limiting:
• | The liquidity of our common stock; |
• | The market price of our common stock; |
• | The number of institutional and other investors that will consider investing in our common stock; |
• | The availability of information concerning the trading prices and volume of our common stock; |
• | The number of broker-dealers willing to execute trades in shares of our common stock; and |
• | Our ability to obtain equity or debt financing for the continuation of our operations. |
Following the filing of our Quarterly Report on Form 10-Q for the quarterly period ended September 30, 2019 and any other required filings with the SEC, and compliance with any other prerequisite requirements, we intend to apply to relist our common stock on a national securities exchange. However, while we are working expeditiously to relist our common stock, no assurances can be provided that we will be able to do so in a timely manner or at all. If we are unable to relist our common stock, or even if our common stock is relisted, no assurance can be provided that an active trading market will develop or, if one develops, that it will continue. The lack of an active trading market may limit the liquidity of an investment in our common stock, meaning you may not be able to sell any shares of common stock you own at times, or at prices, attractive to you. Any of these factors may materially adversely affect the price of our common stock.
The outcome of litigation and other claims as well as regulatory examinations, investigations, proceedings and orders arising out of the matters that led to the delay in the filing of our 2017 10-K and our other SEC reports are unpredictable, and any orders, actions or rulings not in our favor could have a material adverse effect on our business, results of operations and financial condition.
Our company and certain of our current and former executive officers are defendants in certain legal proceedings and putative class actions. Please see Part I, Item 3, “Legal Proceedings.” These proceedings have resulted in significant expenses and the diversion of management attention from our business. In addition, the circumstances that led to the delay in the filing of our 2017 10-K and our continued SEC filing delays have created the risk of additional litigation and claims by investors and examinations, investigations, proceedings and orders by regulatory authorities. These include a broad range of potential actions that may be taken against us by the SEC or other regulatory agencies, including a cease and desist order, suspension of trading
12
of our securities, deregistration of our securities, sanctioning of our officers and directors and/or the assessment of possible civil monetary penalties. Any such further actions could be expensive and damaging to our business, results of operations and financial condition.
We have incurred significant expenses related to the matters that led to the delay in the filing of our 2017 10-K and expect to continue to incur significant expenses related to the remediation of deficiencies in our internal control over financial reporting and disclosure controls and procedures, and any resulting litigation.
We have devoted substantial internal and external resources towards investigating, discovering, understanding and remediating the matters that led to the delay in the filing of our 2017 10-K (all as described in the 2017 10-K). As a result of these efforts, we have incurred substantial incremental fees and expenses for additional accounting, financial and other consulting and professional services, as well as the implementation and maintenance of systems and processes that will need to be updated, supplemented or replaced. Specifically, in connection with these efforts, we incurred professional fees of approximately $67 million in fiscal year 2019 and $42 million in fiscal year 2018, and we continue to incur additional fees in the current fiscal year. We have taken a number of steps in order to strengthen our corporate culture, sales processes, and accounting function so as to allow us to be able to provide timely and accurate financial reporting. To the extent these steps are not successful, we could be required to devote significant additional time and incur significant additional expenses. Even if these steps are successful, we expect to continue to incur significant legal fees in future periods as we address litigation and regulatory action arising from the matters that led to the delay in the filing our 2017 10-K. The expenses we are incurring in this regard, as well as the substantial time devoted by our management to identify and address the internal control deficiencies, could have a material adverse effect on our business, results of operations and financial condition.
If we are unable to become current in our SEC reports by June 30, 2020, we may lose the right to convert our existing credit facility into a five-year revolving credit facility, and may be unable to access outside financing.
Under the terms of the credit agreement with Bank of America, N.A. (“Bank of America”), dated April 19, 2018, as amended in June 2019, we are required to deliver our audited financial statements for the fiscal years ended June 30, 2018 and 2019 by March 31, 2020. With the filing of this Annual Report, we have satisfied that requirement. The credit facility expires on June 30, 2020, although we have the right to convert it to a five-year revolving credit facility if we are current in all SEC filing obligations and meet certain other conditions. If we are unable to become current in our SEC filing obligations by that date, we may lose the ability to elect for such a conversion, and any amounts then outstanding under the existing credit facility could become due and payable. As of November 30, 2019, we did not have any outstanding principal obligations under the Bank of America credit facility.
We may be unable to secure other outside financing, if needed, to fund ongoing operations and other capital needs. Any sources of financing that may be available to us could also be at higher costs and require us to satisfy more restrictive covenants, which could limit or restrict our operations, cash flows and earnings. We cannot ensure that additional financing would be available to us, or be sufficient or available on satisfactory terms. In addition, unless and until we have filed all required reports with the SEC, we will be precluded from registering our securities with the SEC for offer and sale, and the failure to timely file our SEC reports will limit our ability to use “short-form” Form S-3 registration statements for registering our securities for sale with the SEC until we again meet the filing requirements of Form S-3 including having timely filed all Exchange Act reports required to be filed during the twelve calendar months prior to the filing of the registration statement on Form S-3.
The matters leading to the delay in the filing of our 2017 10-K and our lack of effective internal control over financial reporting, including adverse publicity and potential concerns from our customers, have had and could continue to have an adverse effect on our business and financial condition.
We have been and could continue to be the subject of negative publicity focused on the matters that led to the delay in the filing of our 2017 10-K. We may be adversely impacted by negative reactions to this publicity from our customers or others with whom we do business. Concerns include the time and effort required to address our accounting and control environment and our ability to be a long-term provider to our customers. The continued occurrence of any of the foregoing could harm our business and have an adverse effect on our financial condition.
If we are unable to maintain the effectiveness of our internal control over financial reporting, our operating results, financial position and stock price could be adversely affected.
Pursuant to Section 404 of the Sarbanes-Oxley Act of 2002, our management is required to report on the effectiveness of our internal control over financial reporting in our annual reports, and annually our independent auditors must attest to and
13
report on the effectiveness of our internal control over financial reporting. It is necessary for us to maintain effective internal control over financial reporting to prevent fraud and errors and to maintain effective disclosure controls and procedures so that we can provide timely and reliable financial and other information. A failure to maintain adequate internal controls may adversely affect our ability to provide financial statements that accurately reflect our financial condition and report information on a timely basis.
As described in Part II, Item 9A, “Controls and Procedures” of this Annual Report, we have concluded that there are material weaknesses in our internal control over financial reporting and that our disclosure controls and procedures were ineffective as of June 30, 2019. This adversely affected our ability to timely and accurately report our results of operations and financial condition. We cannot ensure that other errors or material weaknesses will not be identified in the future. If we fail to maintain an effective system of internal control over financial reporting, the accuracy and timeliness of our financial reporting may be adversely affected.
Although we are working to remediate our material weaknesses, and are focused on re-establishing effective internal controls over financial reporting in order to prevent and detect material misstatements in our annual and quarterly financial statements and prevent fraud, we cannot ensure that such efforts will be effective. If we fail to maintain effective internal controls in future periods, this could further cause investors to lose confidence in our reported financial and other information, and our operating results, financial position and stock price could be adversely affected.
Risks Related to Our Business and Industry
Our quarterly operating results will likely fluctuate in the future, which could cause rapid declines in our stock price.
We believe that our quarterly operating results will continue to be subject to fluctuation due to various factors, many of which are beyond our control. Factors that may affect quarterly operating results include:
• | Fluctuations based upon seasonality, with the quarters ending March 31 and September 30 typically being weaker; |
• | Fluctuations in the timing and size of large customer orders; |
• | Variability of our margins based on the mix of server and storage systems, subsystems and accessories we sell and the percentage of our sales to internet data center, cloud computing customers or certain geographical regions; |
• | Fluctuations in availability and costs associated with key components, particularly memory, storage solutions, and other materials needed to satisfy customer requirements; |
• | The timing of the introduction of new products by leading microprocessor vendors and other suppliers; |
• | Changes in our product pricing policies, including those made in response to new product announcements; |
• | Mix of whether customer purchases are of partially or fully integrated systems or subsystems and accessories and whether made directly or through our indirect sales channel partners; |
• | The effect of mergers and acquisitions among our competitors, suppliers, customers, or partners; |
• | General economic conditions in our geographic markets; |
• | Geopolitical tensions, including trade wars, tariffs and/or sanctions in our geographic markets; |
• | Impact of regulatory changes on our cost of doing business; and |
• | Costs associated with the circumstances leading to the restatement of our previously issued financial statements, and our efforts to investigate, assess and remediate those matters, as well as related legal proceedings. |
In addition, customers may hesitate to purchase, or not continue to purchase, our products based upon our delay in the filing of our reports with the SEC and/or past unwarranted reports about security risks associated with the use of our products. Accordingly, it is difficult to accurately forecast our growth and results of operations on a quarterly basis. If we fail to meet expectations of investors or analysts, our stock price may fall rapidly and without notice. Furthermore, the fluctuation of quarterly operating results may render less meaningful period-to-period comparisons of our operating results, and you should not rely upon them as an indication of future performance.
As we increasingly target larger customers and larger sales opportunities, our customer base may become more concentrated, our cost of sales may increase, our margins may be lower and our sales may be less predictable.
We have become increasingly dependent upon larger sales to grow our business. In particular, in recent years, we have completed larger sales to leading internet data center and cloud customers and large enterprise customers. No single customer accounted for 10% or more of net sales in fiscal years 2019, 2018 or 2017. If customers buy our products in greater volumes and their business becomes a larger percentage of our net sales, we may grow increasingly dependent on those customers to maintain our growth. If our largest customers do not purchase our products at the levels, in the timeframes or within the geographies that we expect, our ability to maintain or grow our net sales will be adversely affected.
14
Increased sales to larger customers may also cause fluctuations in results of operations. Large orders are generally subject to intense competition and pricing pressure which can have an adverse impact on our margins and results of operations. Likewise, larger customers may seek to fulfill all or substantially all of their requirements in a single or a few orders, and not make another significant purchase for a substantial period of time. Accordingly, a significant increase in revenue during the period in which we recognize the revenue from a large customer may be followed by a period of time during which the customer either does not purchase any products or only a small number of our products.
Additionally, as we and our partners focus increasingly on selling to larger customers and attracting larger orders, we expect greater costs of sales. Our sales cycle may become longer and more expensive, as larger customers typically spend more time negotiating contracts than smaller customers. Larger customers often seek greater levels of support in the implementation and use of our server solutions.
As a result of the above factors, our quarter-to-quarter results of operations may be subject to greater fluctuation and our stock price may be adversely affected.
We may fail to meet publicly announced financial guidance or other expectations about our business, which would cause our stock to decline in value.
We typically provide forward looking financial guidance when we announce our financial results from the prior quarter. We undertake no obligation to update such guidance at any time. Frequently in the past, our financial results have failed to meet the guidance we provided. There are a number of reasons why we have failed to meet guidance in the past and might fail again in the future, including, but not limited to, the factors described in these Risk Factors.
Increases in average selling prices for our server solutions have significantly contributed to increases in net sales in some of the periods covered by this Annual Report. Such prices are subject to decline if customers do not continue to purchase our latest generation products or additional components, which could harm our results of operations.
Increases in average selling prices for our server solutions have significantly contributed to increases in net sales in some of the periods covered by this Annual Report. As with most electronics based products, average selling prices of server and storage products are typically highest at the time of introduction of new products, which utilize the latest technology, and tend to decrease over time as such products become commoditized and are ultimately replaced by even newer generation products. We cannot predict the timing or amount of any decline in the average selling prices of our server solutions that we may experience in the future. In some instances, our agreements with our indirect sales channel partners limit our ability to reduce prices unless we make such price reductions available to them, or price protect their inventory. If we are unable to decrease the average per unit manufacturing costs faster than the rate at which average selling prices continue to decline, our business, financial condition and results of operations will be harmed.
Our cost structure and ability to deliver server solutions to customers in a timely manner may be adversely affected by volatility of the market for core components and certain materials for our products.
Prices of certain materials and core components utilized in the manufacture of our server and storage solutions, such as serverboards, chassis, CPUs, memory, hard drives and SSDs, represent a significant portion of our cost of sales. We generally do not enter into long-term supply contracts for these materials and core components, but instead purchase these materials and components on a purchase order basis. Prices of these core components and materials are volatile, and, as a result, it is difficult to predict expense levels and operating results. In addition, if our business growth renders it necessary or appropriate to transition to longer term contracts with materials and core component suppliers, our costs may increase and our gross margins could correspondingly decrease.
Because we often acquire materials and key components on an as needed basis, we may be limited in our ability to effectively and efficiently respond to customer orders because of the then-current availability or the terms and pricing of these materials and key components. Our industry has experienced materials shortages and delivery delays in the past, and we may experience shortages or delays of critical materials in the future. From time to time, we have been forced to delay the introduction of certain of our products or the fulfillment of customer orders as a result of shortages of materials and key components, which can adversely impact our revenue. If shortages, supply or demand imbalances or delays arise, the prices of these materials and key components may increase or the materials and key components may not be available at all. In the event of shortages, some of our larger competitors may have greater abilities to obtain materials and key components due to their larger purchasing power. We may not be able to secure enough key components or materials at reasonable prices or of acceptable quality to build new products to meet customer demand, which could adversely affect our business, results of
15
operations and financial condition. In addition, from time to time, we have accepted customer orders with various types of component pricing protection. Such arrangements have increased our exposure to component pricing fluctuations and have adversely affected our financial results in certain quarters.
If we were to lose any of our current supply or contract manufacturing relationships, the process of identifying and qualifying a new supplier or contract manufacturer who will meet our quality and delivery requirements, and who will appropriately safeguard our intellectual property, may require a significant investment of time and resources, adversely affecting our ability to satisfy customer purchase orders and delaying our ability to rapidly introduce new products to market. Similarly, if any of our suppliers were to cancel, materially change contracts or commitments to us or fail to meet the quality or delivery requirements needed to satisfy customer demand for our products, whether due to shortages or other reasons, our reputation and relationships with customers could be damaged. We could lose orders, be unable to develop or sell some products cost-effectively or on a timely basis, if at all, and have significantly decreased revenues, margins and earnings, which would have a material adverse effect on our business, results of operations and financial condition.
Adverse economic conditions may harm our business.
Our business depends on the overall demand for our products and on the economic health of our current and prospective customers. We market and sell our products both domestically and in international markets. If economic conditions, including currency exchange rates, in the areas in which we market and sell our products and other key potential markets for our products continue to remain uncertain or deteriorate, our customers may delay or reduce their spending on our products. If our customers or potential customers experience economic hardship, this could reduce the demand for our products, delay and lengthen sales cycles, lower prices for our products, and lead to slower growth or even a decline in our revenues, operating results and cash flows.
We may lose sales or incur unexpected expenses relating to insufficient, excess or obsolete inventory.
To offer greater choices and optimization of our products to benefit our customers, we maintain a high level of inventory. If we fail to maintain sufficient inventory, we may not be able to meet demand for our products on a timely basis, and our sales may suffer. If we overestimate customer demand for our products, we could experience excess inventory of our products and be unable to sell those products at a reasonable price, or at all. As a result, we may need to record higher inventory reserves. In addition, from time to time we assume greater inventory risk in connection with the purchase or manufacture of more specialized components in connection with higher volume sales opportunities. We have from time to time experienced inventory write downs associated with higher volume sales that were not completed as anticipated. We expect that we will experience such write downs from time to time in the future related to existing and future commitments. Excess or obsolete inventory levels for these or other reasons could result in unexpected expenses or increases in our reserves against potential future charges which would adversely affect our business, results of operations and financial condition.
We may encounter difficulties with our ERP systems.
Many companies have experienced delays and difficulties with the implementation of new or changed ERP systems that have had a negative effect on their business. We have incurred and expect to continue to incur additional expenses related to our ERP systems, as we continue to further enhance and develop them, including by automating certain internal controls. See Part II, Item 9A, "Controls and Procedures" of this Annual Report for a more fulsome description of our material weaknesses and remediation efforts surrounding our ERP systems. Any future disruptions, delays or deficiencies in the design and further enhancement of our ERP system could result in potentially much higher costs than we currently anticipate and could adversely affect our ability to provide services, fulfill contractual obligations, file reports with the SEC in a timely manner and/or otherwise operate our business, or otherwise impact our controls environment. Any of these consequences could have an adverse effect on our business, results of operations and financial condition.
System security violations, data protection breaches, cyber-attacks and other related cyber-security issues could disrupt our internal operations or compromise the security of our products, and any such disruption could reduce our expected revenues, increase our expenses, damage our reputation and adversely affect our stock price.
Experienced computer programmers and hackers may be able to penetrate our network and misappropriate or compromise our confidential information or that of third parties, create system disruptions or cause shutdowns. Computer programmers and hackers also may be able to develop and deploy viruses, worms and other malicious software programs that attack our products or otherwise exploit any security vulnerabilities of our products. While we employ a number of protective measures, including firewalls, anti-virus and endpoint detection and response technologies, these measures may fail to prevent or detect attacks on our systems. We experienced unauthorized intrusions into our network between 2011 and 2018. None of
16
these intrusions, individually or in the aggregate, has had a material adverse effect on our business, operations, or products. We have taken steps to enhance the security of our network and computer systems but, despite these efforts, we may experience future intrusions, which could adversely affect our business, operations, or products. In addition, our hardware and software or third party components and software that we utilize in our products may contain defects in design or manufacture, including “bugs” and other problems that could unexpectedly interfere with the operation or security of the products. The costs to us to eliminate or mitigate cyber or other security problems, bugs, viruses, worms, malicious software programs and security vulnerabilities could be significant and, if our efforts to address these problems are not successful, could result in interruptions, delays, cessation of service and loss of existing or potential customers that may impede our sales, manufacturing, distribution or other critical functions. Any claim that our products or systems are subject to a cyber-security risk, whether valid or not, could damage our reputation and adversely impact our revenues and results of operations.
We manage and store various proprietary information and sensitive or confidential data relating to our business as well as information from our suppliers and customers. Breaches of our or any of our third party suppliers’ security measures or the accidental loss, inadvertent disclosure or unapproved dissemination of proprietary information or sensitive or confidential data about us or our customers or suppliers, including the potential loss or disclosure of such information or data as a result of fraud, trickery or other forms of deception, could expose us or our customers or suppliers to a risk of loss or misuse of this information, result in litigation and potential liability for us, damage our brand and reputation or otherwise harm our business.
To the extent we experience cyber-security incidents in the future, our relationships with our customers and suppliers may be materially impacted, our brand and reputation may be harmed and we could incur substantial costs in responding to and remediating the incidents and in resolving any investigations or disputes that may arise with respect to them, any of which would cause our business, operations, or products to be adversely affected. In addition, the cost and operational consequences of implementing and adding further data protection measures could be significant.
Because our products and services may store, process and use data, some of which contains personal information, we are subject to complex and evolving federal, state and foreign laws and regulations regarding privacy, data protection and other matters, which are subject to change.
We are subject to a variety of laws and regulations in the United States and other countries that involve matters central to our business, including with respect to user privacy, rights of publicity, data protection, content, protection of minors and consumer protection. These laws can be particularly restrictive in countries outside the United States. Both in the United States and abroad, these laws and regulations constantly evolve and remain subject to significant change. In addition, the application and interpretation of these laws and regulations are often uncertain, particularly in the new and rapidly evolving industry in which we operate. Because our products and services store, process and use data, some of which contains personal information, we are subject to complex and evolving federal, state and foreign laws and regulations regarding privacy, data protection and other matters. Many of these laws and regulations are subject to change and uncertain interpretation and even our inadvertent failure to comply with such laws and regulations could result in investigations, claims, damages to our reputation, changes to our business practices, increased cost of operations and declines in user growth, retention or engagement, any of which could materially adversely affect our business, results of operations and financial condition. Costs to comply with and implement these privacy-related and data protection measures could be significant.
Global privacy legislation, enforcement, and policy activity for privacy and data protection are rapidly expanding and creating a complex regulatory compliance environment. Costs to comply with and implement these privacy-related and data protection measures could be significant. For example, the EU General Data Protection Regulation 2016/679 (“GDPR”), which came into effect on May 25, 2018, imposes stringent EU data protection requirements on companies established in the European Union or companies that offer goods or services to, or monitor the behavior of, individuals in the European Union. The GDPR establishes a robust framework of data subjects’ rights and imposes onerous accountability obligations on companies, with penalties for noncompliance of up to the greater of 20 million euros or four percent of annual global revenue. In addition, numerous states in the U.S. are also expanding data protection through legislation. For example, in June 2018, California enacted the California Consumer Privacy Act, which takes effect on January 1, 2020, and will give California residents expanded privacy rights and protections and provide for civil penalties for violations and a private right of action for data breaches. At the same time, certain developing countries in which we do business have already or are also currently considering adopting privacy and data protection laws and regulations. While we have implemented policies and procedures to address GDPR and other data privacy requirements, failure to comply or concerns about our practices or compliance with GDPR or other privacy-related laws and regulations could materially adversely affect our business, results of operations and financial condition.
17
If we do not successfully manage the expansion of our international manufacturing capacity, our business could be harmed.
Since inception, we have conducted a substantial majority of our manufacturing operations in San Jose, California. We continue to increase our manufacturing capacity in Taiwan and in the Netherlands. If we are unable to successfully ramp up our international manufacturing capacity, we may incur unanticipated costs, difficulties in making timely delivery of products or suffer other business disruptions which could adversely impact our results of operations.
We may not be able to successfully manage our business for growth and expansion.
Over time we expect to continue to make investments to pursue new customers and expand our product offerings to grow our business. We expect that our annual operating expenses will continue to increase as we invest in sales and marketing, research and development, manufacturing and production infrastructure, and strengthen customer service and support resources for our customers. Our failure to expand operational and financial or internal control systems timely or efficiently could result in additional operating inefficiencies, which could increase our costs and expenses more than we had planned and prevent us from successfully executing our business plan. We may not be able to offset the costs of operation expansion by leveraging the economies of scale from our growth in negotiations with our suppliers and contract manufacturers. Additionally, if we increase our operating expenses in anticipation of the growth of our business and this growth does not meet our expectations, our financial results will be negatively impacted.
If our business grows, we will have to manage additional product design projects, materials procurement processes and sales efforts and marketing for an increasing number of SKUs, as well as expand the number and scope of our relationships with suppliers, distributors and end customers. If we fail to manage these additional responsibilities and relationships successfully, we may incur significant costs, which may negatively impact our operating results. Additionally, in our efforts to be first to market with new products with innovative functionality and features, we may devote significant research and development resources to products and product features for which a market does not develop quickly, or at all. If we are not able to predict market trends accurately, we may not benefit from such research and development activities, and our results of operations may suffer.
Managing our business for long-term growth also requires us to successfully manage a substantial increase in our number of employees. We must continue to hire, train and manage new employees as needed. Our failure to timely file our SEC reports and the delisting of our common stock on Nasdaq has adversely impacted our ability to attract new employees and retain existing employees and will likely continue to adversely impact us as long as these circumstances persist. If our new hires perform poorly, or if we are unsuccessful in hiring, training, managing and integrating these new employees, or if we are not successful in retaining our existing employees, our business may be harmed. The additional headcount we have added and may continue to add has increased and will continue to increase our cost base, which will make it more difficult for us to offset any future revenue shortfalls by offsetting expense reductions in the short term. If we fail to successfully manage our growth, we will be unable to execute our business plan.
Our future effective income tax rates could be affected by changes in the relative mix of our operations and income among different geographic regions and by changes in domestic and foreign income tax laws, which could affect our future operating results, financial condition and cash flows.
We seek to structure our worldwide operations to take advantage of certain international tax planning opportunities and incentives. Our future effective income tax rates could be adversely affected if tax authorities challenge our international tax structure or if the relative mix of our United States and international income changes for any reason, or due to changes in U.S. or international tax laws. In particular, a substantial portion of our revenue is generated from customers located outside the United States. Prior to December 22, 2017, foreign withholding taxes and United States income taxes were not provided on undistributed earnings for certain non-United States subsidiaries, because such earnings were intended to be indefinitely reinvested in the operations of those subsidiaries. On December 22, 2017, the U.S. federal government enacted the Tax Cuts and Jobs Act (“2017 Tax Reform Act”). As a result of the 2017 Tax Reform Act, we recorded a one-time write down of our U.S. deferred tax assets and liabilities resulting from the U.S. federal corporate income tax rate decrease from 35% to 21%, and a one-time transition tax, in our income tax provision for the fiscal year ended June 30, 2018. We expect further guidance may be forthcoming from federal and state tax agencies, which could result in additional impacts. See Part II, Item 8, Note 14, “Income Taxes” to the consolidated financial statements in this Annual Report for further discussion of the impact of the 2017 Tax Reform Act.
The effectiveness of our tax planning activities is based upon certain assumptions that we make regarding our future operating performance and tax laws. We continue to optimize our tax structure to align with our business operations and growth
18
strategy. We cannot assure you that we will be able to lower our effective tax rate as a result of our current or future tax planning activities nor that such rate will not increase in the future.
If negative publicity arises with respect to us, our employees, our third-party service providers or our partners, our business and operating results could be adversely affected, regardless of whether the negative publicity is true.
Negative publicity about our company or our products, even if inaccurate or untrue, could adversely affect our reputation and the confidence in our products, which could harm our business and operating results. For example, in October 2018, a news article was published alleging that malicious hardware chips were implanted on our motherboards during the manufacturing process at the facilities of a contract manufacturer in China. We undertook a thorough investigation of this claim with the assistance of a leading, independent third-party investigations firm wherein we tested a representative sample of our motherboards, including the specific type of motherboard depicted in the news article and motherboards purchased by companies referenced in the article, as well as more recently manufactured motherboards. After completing these examinations as well as a range of functional tests, the investigations firm reported that it had found no evidence of malicious hardware on our motherboards. In addition, neither the publisher of the news article nor any of our customers have ever provided a single example of any such altered motherboard. However, despite repeated denials of any tampering by our customers and us, and the announcement of the results of this independent investigation, this false allegation had a substantial negative impact on the trading price of our common stock and our reputation and it may continue to have a negative impact in the future.
Harm to our reputation can also arise from many other sources, including employee misconduct, as has been experienced in the past, and misconduct by our partners and outsourced service providers. Additionally, negative publicity with respect to our partners or service providers could also affect our business and operating results to the extent that we rely on these partners or if our customers or prospective customers associate our company with these partners.
The market in which we participate is highly competitive, and if we do not compete effectively, we may not be able to increase our market penetration, grow our net sales or improve our gross margins.
The market for server and storage solutions is intensely competitive and rapidly changing. The market continues to evolve with the growth of public cloud shifting server and storage purchasing from traditional data centers to lower margin public cloud vendors. Barriers to entry in our market are relatively low and we expect increased challenges from existing as well as new competitors. Some of our principal competitors offer server solutions at a lower price, which has resulted in pricing pressures on sales of our server solutions. We expect further downward pricing pressure from our competitors and expect that we will have to price some of our server and storage solutions aggressively to increase our market share with respect to those products or geographies, particularly for internet data center and cloud customers and other large sale opportunities. If we are unable to maintain the margins on our server and storage solutions, our operating results could be negatively impacted. In addition, if we do not develop new innovative solutions, or enhance the reliability, performance, efficiency and other features of our existing server and storage solutions, our customers may turn to our competitors for alternatives. In addition, pricing pressures and increased competition generally may also result in reduced sales, less efficient utilization of our manufacturing operations, lower margins or the failure of our products to achieve or maintain widespread market acceptance, any of which could have a material adverse effect on our business, results of operations and financial condition.
Our principal competitors include global technology companies such as Cisco, Dell, Hewlett-Packard Enterprise, Huawei, IBM, and Lenovo. In addition, we also compete with a number of other vendors who also sell application optimized servers, contract manufacturers and original design manufacturers (“ODMs”), such as Inspur, Quanta Computer, and Wiwynn Corporation. ODMs sell server solutions marketed or sold under a third-party brand.
Many of our competitors enjoy substantial competitive advantages, such as:
• | Greater name recognition and deeper market penetration; |
• | Longer operating histories; |
• | Larger sales and marketing organizations and research and development teams and budgets; |
• | More established relationships with customers, contract manufacturers and suppliers and better channels to reach larger customer bases and larger sales volume allowing for better costs; |
• | Larger customer service and support organizations with greater geographic scope; |
• | A broader and more diversified array of products and services; and |
• | Substantially greater financial, technical and other resources. |
Some of our current or potential ODM competitors are also currently or have in the past been suppliers to us. As a result, they may possess sensitive knowledge or experience which may be used against us competitively and/or which may
19
require us to alter our supply arrangements or sources in a way which could adversely impact our cost of sales or results of operations.
Our competitors may be able to respond more quickly and effectively than we can to new or changing opportunities, technologies, standards or customer requirements. Competitors may seek to copy our innovations and use cost advantages from greater size to compete aggressively with us on price. Certain customers are also current or prospective competitors and as a result, assistance that we provide to them as customers may ultimately result in increased competitive pressure against us. Furthermore, because of these advantages, even if our application optimized server and storage solutions are more effective than the products that our competitors offer, potential customers might accept competitive products in lieu of purchasing our products. The challenges we face from larger competitors will become even greater if consolidation or collaboration between or among our competitors occurs in our industry. Also, initiatives like the Open Compute Project, a project to establish more industry standard data center configurations, could have the impact of supporting an approach which is less favorable to the flexibility and customization that we offer. These changes could have a significant impact on the market and impact our results of operations. For all of these reasons, we may not be able to compete successfully against our current or future competitors, and if we do not compete effectively, our ability to increase our net sales may be impaired.
Any failure to adequately expand or retain our sales force will impede our growth.
We expect that our direct sales force will continue to grow as larger customers increasingly require a direct sales approach. Competition for direct sales personnel with the advanced sales skills and technical knowledge we need is intense, and we face significant competition for direct sales personnel from our competitors. Our ability to grow our revenue in the future will depend, in large part, on our success in recruiting, training, retaining and successfully managing sufficient qualified direct sales personnel. We have experienced much greater turnover in our sales and marketing personnel as compared to other departments and other companies, which we believe has been due in part to our employees' inability to exercise their stock options since our registration statement on Form S-8 lost its effectiveness due to our delinquent filings. New hires require significant training and may take six months or longer before they reach full productivity. Our recent hires and planned hires may not become as productive as we would like, and we may be unable to hire sufficient numbers of qualified individuals in the future in the markets where we do business. If we are unable to hire, develop and retain sufficient numbers of productive sales personnel, our customer relationships and resulting sales of our server solutions will suffer.
We must work closely with our suppliers to make timely new product introductions.
We rely on our close working relationships with our suppliers, including Intel, AMD and Nvidia, to anticipate and deliver new products on a timely basis when new generation materials and key components are made available. Intel, AMD and Nvidia are the only suppliers of the microprocessors we use in our server and storage systems. If we are not able to maintain our relationships with our suppliers or continue to leverage their research and development capabilities to develop new technologies desired by our customers, our ability to quickly offer advanced technology and product innovations to our customers would be impaired. We have no long term agreements that obligate our suppliers to continue to work with us or to supply us with products.
Our suppliers’ failure to improve the functionality and performance of materials and key components for our products may impair or delay our ability to deliver innovative products to our customers.
We need our material and key component suppliers, such as Intel, AMD and Nvidia, to provide us with components that are innovative, reliable and attractive to our customers. Due to the pace of innovation in our industry, many of our customers may delay or reduce purchase decisions until they believe that they are receiving best of breed products that will not be rendered obsolete by an impending technological development. Accordingly, demand for new server and storage systems that incorporate new products and features is significantly impacted by our suppliers’ new product introduction schedules and the functionality, performance and reliability of those new products. If our materials and key component suppliers fail to deliver new and improved materials and components for our products, we may not be able to satisfy customer demand for our products in a timely manner, or at all. If our suppliers’ components do not function properly, we may incur additional costs and our relationships with our customers may be adversely affected.
We rely on a limited number of suppliers for certain raw materials used to manufacture our products.
Certain raw materials used in the manufacture of our products are available from a limited number of suppliers. Shortages could occur in these essential materials due to an interruption of supply or increased demand in the industry. One of our suppliers accounted for 21.8%, 26.0% and 31.0% of total purchases of raw materials for the fiscal years ended June 30, 2019, 2018 and 2017, respectively. Ablecom and Compuware, related parties, accounted for 9.2%, 9.0% and 11.1% of our total
20
cost of sales for the fiscal years ended June 30, 2019, 2018 and 2017, respectively. If any of our largest suppliers discontinue their operations or if our relationships with them are adversely impacted, we could experience a material adverse effect on our business, results of operations and financial condition.
We rely on indirect sales channels for a significant percentage of our revenue and any disruption in these channels could adversely affect our sales.
Sales of our products through our indirect sales channel accounted for 39.3%, 41.5% and 47.8% of our net sales in fiscal years 2019, 2018 and 2017, respectively. We depend on our indirect sales channel partners to assist us in promoting market acceptance of our products and anticipate that a significant portion of our revenues will continue to result from sales through indirect channels. To maintain and potentially increase our revenue and profitability, we will have to successfully preserve and expand our existing distribution relationships as well as develop new channel relationships. Our indirect sales channel partners also sell products offered by our competitors and may elect to focus their efforts on these sales. If our competitors offer our indirect sales channel more favorable terms or have more products available to meet the needs of their customers, or utilize the leverage of broader product lines sold through the indirect sales channel, those channel partners may de-emphasize or decline to carry our products. In addition, the order decision-making process in our indirect sales channel is complex and involves several factors, including end customer demand, warehouse allocation and marketing resources, which can make it difficult to accurately predict total sales for the quarter until late in the quarter. We also do not control the pricing or discounts offered by our indirect sales channel partners to the end customers. To maintain our participation in the marketing programs of our indirect sales channel partners, we have provided and expect to continue to offer cooperative marketing arrangements and offer short-term pricing concessions.
The discontinuation of cooperative marketing arrangements or pricing concessions could have a negative effect on our business, results of operations and financial condition. Our indirect sales channel partners could also modify their business practices, such as payment terms, inventory levels or order patterns. If we are unable to maintain successful relationships in our indirect sales channel or expand our channel or we experience unexpected changes in payment terms, inventory levels or other practices in our indirect sales channel, our business will suffer.
Our direct sales efforts may create confusion for our end customers and harm our relationships in our indirect sales channel and with our OEMs.
We expect our direct sales force to continue to grow as our business grows. As our direct sales force becomes larger, our direct sales efforts may lead to conflicts in our indirect sales channel and with our OEMs, who may view our direct sales efforts as undermining their efforts to sell our products. If an indirect sales channel partner or OEM deems our direct sales efforts to be inappropriate, they may not effectively market our products, may emphasize alternative products from competitors, or may seek to terminate our business relationship. Disruptions in our indirect channels could cause our revenues to decrease or fail to grow as expected. Our failure to implement an effective direct sales strategy that maintains and expands our relationships in our indirect sales channel and with our OEMs could lead to a decline in sales, harm relationships and adversely affect our business, results of operations and financial condition.
Our research and development expenditures, as a percentage of our net sales, are considerably higher than many of our competitors and our earnings will depend upon maintaining revenues and margins that offset these expenditures.
Our strategy is to focus on being consistently rapid-to-market with flexible and application optimized server and storage systems that take advantage of our own internal development and the latest technologies offered by microprocessor manufacturers and other component vendors. Consistent with this strategy, we spend higher amounts, as a percentage of revenues, on research and development costs than many of our competitors. If we cannot sell our products in sufficient volume and with adequate gross margins to compensate for such investment in research and development, our earnings may be materially and adversely affected.
Our failure to deliver high quality server and storage solutions could damage our reputation and diminish demand for our products.
Our server and storage solutions are critical to our customers’ business operations. Our customers require our server and storage solutions to perform at a high level, contain valuable features and be extremely reliable. The design of our server and storage solutions is sophisticated and complex, and the process for manufacturing, assembling and testing our server solutions is challenging. Occasionally, our design or manufacturing processes may fail to deliver products of the quality that our customers require. For example, in the past certain vendors have provided us with defective components that failed under
21
certain applications. As a result, our products needed to be repaired and we incurred costs in connection with the recall and diverted resources from other projects.
New flaws or limitations in our server and storage solutions may be detected in the future. Part of our strategy is to bring new products to market quickly, and first-generation products may have a higher likelihood of containing undetected flaws. If our customers discover defects or other performance problems with our products, our customers’ businesses, and our reputation, may be damaged. Customers may elect to delay or withhold payment for defective or underperforming server and storage solutions, request remedial action, terminate contracts for untimely delivery, or elect not to order additional products, which could result in a decrease in revenue, an increase in our provision for doubtful accounts or in collection cycles for accounts receivable or subject us to the expense and risk of litigation. We may incur expense in recalling, refurbishing or repairing defective server and storage solutions sold to our customers or remaining in our inventory. If we do not properly address customer concerns about our products, our reputation and relationships with our customers may be harmed. For all of these reasons, customer dissatisfaction with the quality of our products could substantially impair our ability to grow our business.
Conflicts of interest may arise between us and Ablecom and Compuware, and those conflicts may adversely affect our operations.
We use Ablecom, a related party, for contract design and manufacturing coordination support and warehousing, and Compuware, also a related party and an affiliate of Ablecom, for distribution, contract manufacturing and warehousing. We work with Ablecom to optimize modular designs for our chassis and certain of other components. We outsource to Compuware a portion of our design activities and a significant part of our manufacturing of subassemblies, particularly power supplies. Our purchases of products from Ablecom and Compuware represented 9.2%, 9.0%, and 11.1% of our cost of sales for fiscal years 2019, 2018 and 2017, respectively. Ablecom and Compuware’s sales to us constitute a substantial majority of Ablecom and Compuware’s net sales. Ablecom and Compuware are both privately-held Taiwan-based companies. In addition, we have entered into a distribution agreement with Compuware, under which we have appointed Compuware as a nonexclusive distributor of our products in Taiwan, China and Australia.
Steve Liang, Ablecom’s Chief Executive Officer and largest shareholder, is the brother of Charles Liang, our President, Chief Executive Officer and Chairman of our board of directors (“the Board”). Steve Liang owned approximately 0.4% of our common stock as of June 30, 2017, but owned no shares as of June 30, 2018 and thereafter. Charles Liang and his spouse, Sara Liu, our Co-Founder, Senior Vice President and director, jointly own approximately 10.5% of Ablecom’s capital stock, while Mr. Steve Liang and other family members own approximately 28.8% of Ablecom’s outstanding common stock. Bill Liang, a brother of both Charles Liang and Steve Liang, also is a member of the Board of Directors of Ablecom. Certain family members of Yih-Shyan (Wally) Liaw, who until January 2018 was our Senior Vice President of International Sales and director, own approximately 11.7% of Ablecom’s capital stock.
Bill Liang is also the Chief Executive Officer of Compuware, a member of Compuware’s Board of Directors and a holder of a significant equity interest in Compuware. Steve Liang is also a member of Compuware’s Board of Directors and is an equity holder of Compuware.
Mr. Charles Liang as our Chief Executive Officer and Chairman of the Board and as a significant stockholder of our company, has considerable influence over the management of our business relationships. Accordingly, we may be disadvantaged by the economic interests of Mr. Charles Liang and Ms. Sara Liu as stockholders of Ablecom and Mr. Charles Liang's personal relationship with Ablecom’s Chief Executive Officer. We may not negotiate or enforce contractual terms as aggressively with Ablecom or Compuware as we might with an unrelated party, and the commercial terms of our agreements may be less favorable than we might obtain in negotiations with third parties. If our business dealings with Ablecom or Compuware are not as favorable to us as arms-length transactions, our results of operations may be harmed.
If Ablecom or Compuware are acquired or sold, new ownership could reassess the business and strategy of Ablecom or Compuware, and as a result, our supply chain could be disrupted or the terms and conditions of our agreements with Ablecom or Compuware may change. As a result, our operations could be negatively impacted or costs could increase, either of which could adversely affect our margins and results of operations.
Our reliance on Ablecom could be subject to risks associated with our reliance on a limited source of contract manufacturing services and inventory warehousing.
We plan to continue to maintain our manufacturing relationship with Ablecom in Asia. In order to provide a larger volume of contract manufacturing services for us, we anticipate that Ablecom will continue to warehouse for us an increasing
22
number of components and subassemblies manufactured by multiple suppliers prior to shipment to our facilities in the United States and Europe. We also anticipate that we will continue to lease office space from Ablecom in Taiwan to support our research and development efforts. We operate a joint management company with Ablecom to manage the common areas shared by us and Ablecom for our separately constructed manufacturing facilities in Taiwan.
If our commercial relationship with Ablecom deteriorates, we may experience delays in our ability to fulfill customer orders. Similarly, if Ablecom’s facility in Asia is subject to damage, destruction or other disruptions, our inventory may be damaged or destroyed, and we may be unable to find adequate alternative providers of contract manufacturing services in the time that we or our customers require. We could lose orders and be unable to develop or sell some products cost-effectively or on a timely basis, if at all.
Currently, we purchase contract manufacturing services primarily for our chassis products from Ablecom. If our commercial relationship with Ablecom were to deteriorate or terminate, establishing direct relationships with those entities supplying Ablecom with key materials for our products or identifying and negotiating agreements with alternative providers of warehouse and contract manufacturing services might take a considerable amount of time and require a significant investment of resources. Pursuant to our agreements with Ablecom and subject to certain exceptions, Ablecom has the exclusive right to be our supplier of the specific products developed under such agreements. As a result, if we are unable to obtain such products from Ablecom on terms acceptable to us, we may need to discontinue a product or develop substitute products, identify a new supplier, change our design and acquire new tooling, all of which could result in delays in our product availability and increased costs. If we need to use other suppliers, we may not be able to establish business arrangements that are, individually or in the aggregate, as favorable as the terms and conditions we have established with Ablecom. If any of these things should occur, our net sales, margins and earnings could significantly decrease, which would have a material adverse effect on our business, results of operations and financial condition.
Our growth into markets outside the United States exposes us to risks inherent in international business operations.
We market and sell our systems and subsystems and accessories both inside and outside the United States. We intend to expand our international sales efforts, especially into Asia, and we are expanding our business operations in Europe and Asia, particularly in China, Taiwan, the Netherlands and Japan. In particular, we have made, and continue to make, substantial investments for the purchase of land and the development of new facilities in Taiwan to accommodate our expected growth and the migration of a substantial portion of our contract manufacturing operations from China to Taiwan. Our international expansion efforts may not be successful. Our international operations expose us to risks and challenges that we would otherwise not face if we conducted our business only in the United States, such as:
• | Heightened price sensitivity from customers in emerging markets; |
• | Our ability to establish local manufacturing, support and service functions, and to form channel relationships with value added resellers in non-United States markets; |
• | Localization of our systems and components, including translation into foreign languages and the associated expenses; |
• | Compliance with multiple, conflicting and changing governmental laws and regulations; |
• | Foreign currency fluctuations; |
• | Limited visibility into sales of our products by our channel partners; |
• | Greater concentration of competitors in some foreign markets than in the United States; |
• | Laws favoring local competitors; |
• | Weaker legal protections of intellectual property rights and mechanisms for enforcing those rights; |
• | Market disruptions created by public health crises in regions outside the United States, such as Avian flu, SARS and other diseases; |
• | Import and export tariffs; |
• | Difficulties in staffing and the costs of managing foreign operations, including challenges presented by relationships with workers’ councils and labor unions; and |
• | Changing regional economic and political conditions. |
These factors could limit our future international sales or otherwise adversely impact our operations or our results of operations.
Our results of operations may be subject to fluctuations based upon our investment in corporate ventures.
We have a 30% minority interest in a China corporate venture that was established to market and sell corporate venture branded systems in China based upon products and technology we supply. We record earnings and losses from the
23
corporate venture using the equity method of accounting. Our loss exposure is limited to the remainder of our equity investment in the corporate venture which as of June 30, 2019 and 2018 was $1.7 million and $2.4 million, respectively. Although we currently do not intend to make any additional investment in this corporate venture, if we were to do so in the future, our exposure to potential losses would increase. We may make investments in other corporate ventures. We do not control this corporate venture and any fluctuation in the results of operations of the corporate venture or any other similar transaction that we may enter into in the future could adversely impact, or result in fluctuations in, our results of operations.
The United States could withdraw from or materially modify certain international trade agreements, or change tariff, trade, or tax provisions related to the global manufacturing and sales of our products in ways that we currently cannot predict.
A portion of our business activities are conducted in foreign countries, including the Netherlands, Taiwan, China, United Kingdom and Japan. Our business benefits from free trade agreements, and we also rely on various U.S. corporate tax provisions related to international commerce as we manufacture, market and sell our products globally. Starting in July 2018, the U.S. announced a series of lists covering thousands of categories of Chinese origin products subject to potential special tariffs of 10% to 25% of import value, in addition to the regular tariffs that have historically applied to such products. Many categories of Chinese imports became subject to the 10% additional tariff in September 2018, including certain components in our products. This 10% additional tariff was increased to 25% effective May 10, 2019. In addition, on August 1, 2019, President Trump announced that a special 15% tariff will be imposed on the approximately $300 billion of inbound trade from China not already subject to a special tariff. Based on prior announcements by the Trump Administration, it is possible that the special 15% tariff could be increased to 25% in the future. The precise impact of the special tariffs on Chinese products is impossible to predict at this time. As a result of these tariffs and the uncertainty surrounding the impact of any future special tariffs on Chinese products, we have begun to migrate a substantial portion of our subcontracted business operations from China to Taiwan. We are continuing to evaluate the impact of the announced and other proposed tariffs on products and components that we import from China, and we may experience a material increase in the cost of our products, which may result in our products becoming less attractive relative to products offered by our competitors.
These developments, or the perception that any of them could occur, may have a material adverse effect on global economic conditions and the stability of global financial markets, and may significantly reduce global trade and, in particular, trade between the impacted nations and the United States. Any of these factors, or any changes to U.S. corporate tax policies related to international commerce, could depress economic activity and have a material adverse effect on our business, financial condition and results of operations.
Failure to comply with the U.S. Foreign Corrupt Practices Act, other applicable anti-corruption and anti-bribery laws, and applicable trade control laws could subject us to penalties and other adverse consequences.
We manufacture and sell our products in several countries outside of the United States, both to direct and OEM customers as well as through our indirect sales channel. Our operations are subject to the U.S. Foreign Corrupt Practices Act (the “FCPA”) as well as the anti-corruption and anti-bribery laws in the countries where we do business. The FCPA prohibits covered parties from offering, promising, authorizing or giving anything of value, directly or indirectly, to a “foreign government official” with the intent of improperly influencing the official’s act or decision, inducing the official to act or refrain from acting in violation of lawful duty or obtaining or retaining an improper business advantage. The FCPA also requires publicly traded companies to maintain records that accurately and fairly represent their transactions, and to have an adequate system of internal accounting controls. In addition, other applicable anti-corruption laws prohibit bribery of domestic government officials, and some laws that may apply to our operations prohibit commercial bribery, including giving or receiving improper payments to or from non-government parties, as well as so-called “facilitation” payments. In addition, we are subject to U.S. and other applicable trade control regulations that restrict with whom we may transact business, including the trade sanctions enforced by the U.S. Treasury, Office of Foreign Assets Control. If we fail to comply with laws and regulations restricting dealings with sanctioned countries, we may be subject to civil or criminal penalties. Any future violations could have an adverse impact on our ability to sell our products to United States federal, state and local government and related entities.
In addition, while we have implemented policies, internal controls and other measures reasonably designed to promote compliance with applicable anti-corruption and anti-bribery laws and regulations, and certain safeguards designed to ensure compliance with U.S. trade control laws, our employees or agents have in the past engaged and may in the future engage in improper conduct for which we could be held responsible. If we, or our employees or agents acting on our behalf, are found to have engaged in practices that violate these laws and regulations, we could suffer severe fines and penalties, profit disgorgement, injunctions on future conduct, securities litigation, bans on transacting government business and other consequences that may have a material adverse effect on our business, results of operations and financial condition. In addition,
24
our brand and reputation, our sales activities or our stock price could be adversely affected if we become the subject of any negative publicity related to actual or potential violations of anti-corruption, anti-bribery or trade control laws and regulations.
Any failure to protect our intellectual property rights, trade secrets and technical know-how could impair our brand and our competitiveness.
Our ability to prevent competitors from gaining access to our technology is essential to our success. If we fail to protect our intellectual property rights adequately, we may lose an important advantage in the markets in which we compete. Trademark, patent, copyright and trade secret laws in the United States and other jurisdictions as well as our internal confidentiality procedures and contractual provisions are the core of our efforts to protect our proprietary technology and our brand. Our patents and other intellectual property rights may be challenged by others or invalidated through administrative process or litigation, and we may initiate claims or litigation against third parties for infringement of our proprietary rights. Such administrative proceedings and litigation are inherently uncertain and divert resources that could be put towards other business priorities. We may not be able to obtain a favorable outcome and may spend considerable resources in our efforts to defend and protect our intellectual property.
Furthermore, legal standards relating to the validity, enforceability and scope of protection of intellectual property rights are uncertain. Effective patent, trademark, copyright and trade secret protection may not be available to us in every country in which our products are available. The laws of some foreign countries may not be as protective of intellectual property rights as those in the United States, and mechanisms for enforcement of intellectual property rights may be inadequate.
Accordingly, despite our efforts, we may be unable to prevent third parties from infringing upon or misappropriating our intellectual property and using our technology for their competitive advantage. Any such infringement or misappropriation could have a material adverse effect on our business, results of operations and financial condition.
Resolution of claims that we have violated or may violate the intellectual property rights of others could require us to indemnify our customers, indirect sales channel partners or vendors, redesign our products, or pay significant royalties to third parties, and materially harm our business.
Our industry is marked by a large number of patents, copyrights, trade secrets and trademarks and by frequent litigation based on allegations of infringement or other violation of intellectual property rights. Our primary competitors have substantially greater numbers of issued patents than we have which may position us less favorably in the event of any claims or litigation with them. Other third parties have in the past sent us correspondence regarding their intellectual property or filed claims that our products infringe or violate third parties’ intellectual property rights. In addition, increasingly non-operating companies are purchasing patents and bringing claims against technology companies. We have been subject to several such claims and may be subject to such claims in the future.
Successful intellectual property claims against us from others could result in significant financial liability or prevent us from operating our business or portions of our business as we currently conduct it or as we may later conduct it. In addition, resolution of claims may require us to redesign our technology, to obtain licenses to use intellectual property belonging to third parties, which we may not be able to obtain on reasonable terms, to cease using the technology covered by those rights, and to indemnify our customers, indirect sales channel partners or vendors. Any claim, regardless of its merits, could be expensive and time consuming to defend against, and divert the attention of our technical and management resources.
If we lose Charles Liang, our President, Chief Executive Officer and Chairman, or any other current key employee or are unable to attract additional key employees, we may not be able to implement our business strategy in a timely manner.
Our future success depends in large part upon the continued service of our current executive management team and other current key employees. In particular, Charles Liang, our President, Chief Executive Officer and Chairman of the Board, is critical to the overall management of our company as well as to our strategic direction. Mr. Liang co-founded our company and has been our Chief Executive Officer since our inception. His experience in running our business and his personal involvement in key relationships with suppliers, customers and strategic partners are extremely valuable to our company. We currently do not have a succession plan for the replacement of Mr. Liang if it were to become necessary. Additionally, we are particularly dependent on the continued service of our existing research and development personnel because of the complexity of our products and technologies. Our employment arrangements with our executives and employees do not require them to provide services to us for any specific length of time, and they can terminate their employment with us at any time, with or without notice, without penalty. The loss of services of any of these executives or of one or more other key members of our team could seriously harm our business.
25
If we are unable to attract and integrate additional key employees in a manner that enables us to scale our business and operations effectively, or if we do not maintain competitive compensation policies to retain our employees, our ability to operate effectively and efficiently could be limited.
To execute our growth plan, we must attract additional highly qualified personnel, including additional engineers and executive staff. Competition for qualified personnel is intense, especially in Silicon Valley, where we are headquartered. We have experienced in the past and may continue to experience difficulty in hiring and retaining highly skilled employees with appropriate qualifications. The delay in the filing of our required Exchange Act period reports with the SEC precludes us from registering our securities with the SEC for offer and sale and limits our ability to use stock options and other equity-based awards to attract, retain and provide incentives to employees. Since September 2017, our employees have been unable to sell their holdings of our common stock, which has contributed to the loss of experienced engineering and sales personnel. If we are unable to attract and integrate additional key employees in a manner that enables us to scale our business and operations effectively, or if we do not maintain competitive compensation policies to retain our employees, our ability to operate effectively and efficiently could be limited.
Backlog does not provide a substantial portion of our net sales in any quarter.
Our net sales are difficult to forecast because we do not have sufficient backlog of unfilled orders or sufficient recurring revenue to meet our quarterly net sales targets at the beginning of a quarter. Rather, a majority of our net sales in any quarter depend upon customer orders that we receive and fulfill in that quarter. Because our expense levels are based in part on our expectations as to future net sales and to a large extent are fixed in the short term, we might be unable to adjust spending in time to compensate for any shortfall in net sales. Accordingly, any significant shortfall of revenues in relation to our expectations would harm our operating results.
Our business and operations are especially subject to the risks of earthquakes and other natural catastrophic events.
Our corporate headquarters, including our most significant research and development and manufacturing operations, are located in the Silicon Valley area of Northern California, a region known for seismic activity. We have also established significant manufacturing and research and development operations in Taiwan which is also subject to seismic activity risks. We do not currently have a comprehensive disaster recovery program and as a result, a significant natural disaster, such as an earthquake, could have a material adverse impact on our business, operating results, and financial condition. Although we are in the process of preparing such a program, there is no assurance that it will be effective in the event of such a disaster.
Our operations involve the use of hazardous and toxic materials, and we must comply with environmental laws and regulations, which can be expensive, and may affect our business, results of operations and financial condition.
We are subject to federal, state and local regulations relating to the use, handling, storage, disposal and human exposure to hazardous and toxic materials. If we were to violate or become liable under environmental laws in the future as a result of our inability to obtain permits, human error, accident, equipment failure or other causes, we could be subject to fines, costs or civil or criminal sanctions, face third-party property damage or personal injury claims or be required to incur substantial investigation or remediation costs, which could be material, or experience disruptions in our operations, any of which could have a material adverse effect on our business, results of operations and financial condition. In addition, environmental laws could become more stringent over time imposing greater compliance costs and increasing risks and penalties associated with violations, which could harm our business, results of operations and financial condition.
We also face increasing complexity in our product design as we adjust to new and future requirements relating to the materials composition of our products, including the restrictions on lead and other hazardous substances applicable to specified electronic products placed on the market in the European Union (Restriction on the Use of Hazardous Substances Directive 2002/95/EC, also known as the RoHS Directive). We are also subject to laws and regulations such as California’s “Proposition 65” which requires that clear and reasonable warnings be given to consumers who are exposed to certain chemicals deemed by the State of California to be dangerous, such as lead. We expect that our operations will be affected by other new environmental laws and regulations on an ongoing basis. Although we cannot predict the ultimate impact of any such new laws and regulations, they will likely result in additional costs, and could require that we change the design and/or manufacturing of our products, any of which could have a material adverse effect on our business, results of operations and financial condition.
We are also subject to the Section 1502 of the Dodd Frank Act concerning the supply of certain minerals coming from the conflict zones in and around the Democratic Republic of Congo. This United States legislation includes disclosure requirements regarding the use of conflict minerals mined from the Democratic Republic of Congo and adjoining countries and
26
procedures regarding a manufacturer’s efforts to prevent the sourcing of such conflict minerals. These requirements could affect the sourcing and availability of minerals used in the manufacture of semiconductor or other devices. As a result, there may only be a limited pool of suppliers who provide conflict-free metals, and we cannot assure you that we will be able to obtain products in sufficient quantities or at competitive prices.
Risks Related to Owning Our Stock
The trading price of our common stock is likely to be volatile, and you might not be able to sell your shares at or above the price at which you purchased the shares.
The trading prices of technology company securities historically have been highly volatile and the trading price of our common stock has been and is likely to continue to be subject to wide fluctuations. Factors, in addition to those outlined elsewhere in this filing, that may affect the trading price of our common stock include:
• | The risk that we are not able to relist our common stock on a national securities exchange; |
• | The outcome of litigation and claims as well as regulatory examinations, investigations, proceedings and orders arising out of our failure to file SEC reports on a timely basis, the circumstances leading to the need to restate certain of our previously issued financial statements, and our efforts to investigate, assess and remediate related matters; |
• | Actual or anticipated variations in our operating results, including failure to achieve previously provided guidance; |
• | Announcements of technological innovations, new products or product enhancements, strategic alliances or significant agreements by us or by our competitors; |
• | Changes in recommendations by any securities analysts that elect to follow our common stock; |
• | The financial projections we may provide to the public, any changes in these projections or our failure to meet these projections; |
• | False or misleading press releases or articles regarding our company or our products; |
• | The loss of a key customer; |
• | The loss of key personnel; |
• | Technological advancements rendering our products less valuable; |
• | Lawsuits filed against us, including those described in Part I, Item 3, “Legal Proceedings”; |
• | Changes in operating performance and stock market valuations of other companies that sell similar products; |
• | Price and volume fluctuations in the overall stock market; |
• | Market conditions in our industry, the industries of our customers and the economy as a whole; and |
• | Other events or factors, including those resulting from war, incidents of terrorism, political instability or responses to these events. |
Future sales of shares by existing stockholders could cause our stock price to decline.
Attempts by existing stockholders to sell substantial amounts of our common stock in the public market could cause the trading price of our common stock to decline significantly. All of our shares are eligible for sale in the public market, including shares held by directors, executive officers and other affiliates, sales of which are subject to volume limitations and other requirements under Rule 144 under the Securities Act. In addition, shares subject to outstanding options and reserved for future issuance under our stock option plans are eligible for sale in the public market to the extent permitted by the provisions of various vesting agreements. If these additional shares are sold, or if it is perceived that they will be sold in the public market, the trading price of our common stock could decline.
If securities analysts do not resume research or reporting about our business or if they downgrade our stock, the price of our stock could decline.
There is currently only one industry analyst covering our common stock as of the date of this Annual Report. The research and reports that industry or financial analysts publish about us or our business likely have an effect on the trading price of our common stock. If an industry analyst decides not to cover our company, or if an industry analyst decides to cease covering our company at some point in the future, we could lose visibility in the market, which in turn could cause our stock price to decline. If industry analysts do not resume research reports on our business or downgrade our stock, our stock price would likely decline rapidly in response.
27
The concentration of our capital stock ownership with insiders will likely limit your ability to influence corporate matters.
As of November 30, 2019, our executive officers, directors, current five percent or greater stockholders and affiliated entities together beneficially owned 24.2% of our common stock, net of treasury stock. As a result, these stockholders, acting together, have significant influence over all matters that require approval by our stockholders, including the election of directors and approval of significant corporate transactions. Corporate action might be taken even if other stockholders oppose them. This concentration of ownership might also have the effect of delaying or preventing a change of control of our company that other stockholders may view as beneficial.
Provisions of our certificate of incorporation and bylaws and Delaware law might discourage, delay or prevent a change of control of our company or changes in our management and, as a result, depress the trading price of our common stock.
Our certificate of incorporation and bylaws contain provisions that could discourage, delay or prevent a change in control of our company or changes in our management that the stockholders of our company may deem advantageous. These provisions:
• | Establish a classified Board of Directors so that not all members of our Board are generally elected at one time, provided that in our next annual meeting we will elect all of the members of our Board due to our inability to hold annual meetings for the preceding two fiscal years; |
• | Require super-majority voting to amend some provisions in our certificate of incorporation and bylaws; |
• | Authorize the issuance of “blank check” preferred stock that our Board could issue to increase the number of outstanding shares and to discourage a takeover attempt; |
• | Limit the ability of our stockholders to call special meetings of stockholders; |
• | Prohibit stockholder action by written consent, which requires all stockholder actions to be taken at a meeting of our stockholders; |
• | Provide that our Board is expressly authorized to adopt, alter or repeal our bylaws; and |
• | Establish advance notice requirements for nominations for election to our Board or for proposing matters that can be acted upon by stockholders at stockholder meetings. |
In addition, we are subject to Section 203 of the Delaware General Corporation Law, which, subject to some exceptions, prohibits “business combinations” between a Delaware corporation and an “interested stockholder,” which is generally defined as a stockholder who becomes a beneficial owner of 15% or more of a Delaware corporation’s voting stock for a three-year period following the date that the stockholder became an interested stockholder. Section 203 could have the effect of delaying, deferring or preventing a change in control that our stockholders might consider to be in their best interests.
These anti-takeover defenses could discourage, delay or prevent a transaction involving a change in control of our company. These provisions could also discourage proxy contests and make it more difficult for stockholders to elect directors of their choosing and cause us to take corporate actions other than those stockholders desire.
Our common stock is currently quoted on the OTC Market, which may have an unfavorable impact on our stock price and liquidity.
Effective at the open of business on August 23, 2018, our common stock was suspended from trading on the Nasdaq Global Select Market, and our common stock was subsequently delisted on March 22, 2019. Since the date our common stock was suspended from trading on the Nasdaq Global Select Market, our common stock has been quoted on the OTC Market. The OTC Market is a significantly more limited market than Nasdaq. The quotation of our shares on the OTC Market may result in a less liquid market available for existing and potential stockholders to trade shares of our common stock, could depress the trading price of our common stock and could have a long-term adverse impact on our ability to raise capital in the future.
We do not expect to pay any cash dividends for the foreseeable future.
We do not anticipate that we will pay any cash dividends to holders of our common stock in the foreseeable future. In addition, under the terms of the credit agreement with Bank of America, dated April 19, 2018, we cannot pay any dividends, with limited exceptions. Accordingly, investors must rely on sales of their common stock after price appreciation, which may never occur, as the only way to realize any future gains on their investment. Investors seeking cash dividends in the foreseeable future should not purchase our common stock.
28
Item 1B. Unresolved Staff Comments
None.
Item 2. Properties
As of June 30, 2019, we owned approximately 1,308,000 square feet and leased approximately 768,000 square feet of office and manufacturing space. Our long-lived assets located outside of the United States represented 21.5%, 22.9% and 22.1% of total long-lived assets in fiscal years 2019, 2018 and 2017, respectively. See Part II, Item 8, Note 17, “Segment Reporting” to the consolidated financial statements in this Annual Report for a summary of long-lived assets by geographic region.
Our principal executive offices, research and development center and production operations are located in San Jose, California where we own approximately 1,097,000 square feet of office and manufacturing space. These facilities are subject to a revolving line of credit with $1.1 million outstanding as of June 30, 2019. We lease approximately 246,000 square feet of warehouse space in Fremont, California under a lease that expires in July 2020, lease approximately 46,000 square feet of office space in San Jose, California under a lease that expires in January 2022, and lease approximately 5,000 square feet of office in Jersey City, New Jersey under a lease that expires in July 2020. Our European headquarters for manufacturing and service operations is located in Den Bosch, the Netherlands where we lease approximately 165,000 square feet of office and manufacturing space under three leases, which expire in July 2025 and June 2026. In Asia, our manufacturing facilities are located in Taoyuan County, Taiwan where we own approximately 211,000 square feet of office and manufacturing space on 7.0 acres of land. These manufacturing facilities are subject to an existing term loan with $22.5 million remaining outstanding as of June 30, 2019. Our research and development center, service operations, and warehouse space in Asia are located in an approximately 106,000 square feet facility in Taipei, Taiwan under eleven leases that expire at various dates ranging from October 2019 through July 2022 and an approximately 194,000 square feet facility in Taoyuan, Taiwan under seven leases that expire in December 2021. We lease approximately 3,000 square feet of office space in Shanghai and Beijing, China for sales and service operations under two leases that expire in April 2020 and August 2020, respectively. In addition, we lease approximately 3,000 square feet of office space in Japan under two leases, which expire in January 2020 and April 2020, respectively.
Additionally, we own 36 acres of land in San Jose, California that would allow us to expand our Green Computing Park. We remodeled one warehouse with approximately 310,000 square feet of storage space and completed the construction of a new manufacturing and warehouse building with approximately 182,000 square feet of manufacturing space in August 2015. In fiscal years 2018 and 2019, we continued to engage several contractors for the development and construction of improvements on the property. We completed the construction of a second new manufacturing and warehouse building in the first quarter of fiscal year 2018. We financed this development through our operating cash flows and borrowings from banks. See Part II, Item 8, Note 10, “Short-term Debt” to the consolidated financial statements in this Annual Report for a discussion of our company’s short-term debt.
We believe that our existing properties, including both owned and leased, are in good condition and are suitable for the conduct of our business.
Item 3. Legal Proceedings
From time to time, we have been involved in various legal proceedings arising from the course of business activities. In management’s opinion, the resolution of any matters will not have a material adverse effect on our consolidated financial condition, results of operations or liquidity.
On September 4, 2015, a complaint was filed against us, our CEO, and our former CFO in the U.S. District Court for the Northern District of California (Deason v. Super Micro Computer, Inc., et al., No. 15-cv-04049). The complaint claimed that the defendants violated Section 10(b) of the Securities Exchange Act of 1934 because of alleged misrepresentations and/or omissions in public statements which supposedly were revealed when we announced on August 31, 2015 that the filing of our Annual Report on Form 10-K for fiscal year 2015 would be delayed to allow us to complete an investigation into certain marketing expenses. On January 12, 2018, after an initial round of successful motion to dismiss briefing leading to Plaintiff filing an amended complaint, we and the named individual defendants filed another motion to dismiss on the grounds that the amended complaint failed to state a claim because it did not plead falsity or scienter. On June 27, 2018, the Court granted our motion to dismiss without leave to amend and entered judgment in favor of us and the other defendants. On July 24, 2018, Plaintiff filed a notice of appeal to the 9th Circuit Court of Appeals; however, Plaintiff subsequently filed a voluntary notice dismissing the appeal and, thus, ending the litigation on November 1, 2018.
29
On February 8, 2018, two putative class action complaints were filed against us, our CEO, and our former CFO in the U.S. District Court for the Northern District of California (Hessefort v. Super Micro Computer, Inc., et al., No. 18-cv-00838 and United Union of Roofers v. Super Micro Computer, Inc., et al., No. 18-cv-00850). The complaints contain similar allegations, claiming that the defendants violated Section 10(b) of the Securities Exchange Act due to alleged misrepresentations and/or omissions in public statements regarding recognition of revenue. The court subsequently appointed New York Hotel Trades Council & Hotel Association of New York City, Inc. Pension Fund as lead plaintiff and it filed an amended complaint naming our Senior Vice President of Investor Relations as an additional defendant. On June 21, 2019, plaintiff filed a further amended complaint naming our former Senior Vice President of International Sales, Corporate Secretary, and Director as an additional defendant. On July 26, 2019, we filed a motion to dismiss which remains pending. We believe the allegations filed are without merit, and intend to vigorously defend against the lawsuit.
We cooperated with the SEC in its investigation of marketing expenses that contained certain irregularities discovered by our management, which irregularities were disclosed on August 31, 2015. In addition, we have received subpoenas from the SEC in connection with the matters underlying our inability to timely file our Form 10-K for the fiscal year ending June 30, 2017. We also received a subpoena from the SEC following the publication of a false and widely discredited news article in October 2018 concerning our products. We are cooperating fully to comply with these government requests.
Due to the inherent uncertainties of legal proceedings, we cannot predict the outcome of these proceedings at this time, and we can give no assurance that they will not have a material adverse effect on our financial position or results of operations.
Item 4. Mine Safety Disclosures
Not applicable.
30
PART II
Item 5. | Market for Registrant's Common Equity, Related Stockholder Matters and Issuer Purchases of Equity Securities |
Market Information
Effective at the open of business on August 23, 2018, our common stock was suspended from trading on the Nasdaq Global Select Market. Effective March 22, 2019, our common stock was delisted from the Nasdaq Global Select Market. Since the date our common stock was suspended from trading on the Nasdaq Global Select Market, our common stock has been quoted on the OTC Market and is currently traded under the symbol “SMCI.” Any OTC Market quotations reflect inter-dealer prices, without retail mark-up, mark-down or commission and may not necessarily represent actual transactions. Prior to the suspension, we had traded on the Nasdaq Global Select Market since March 29, 2007, and prior to that time there was no public market for our common stock.
Holders
As of November 30, 2019, there were 31 registered stockholders of record of our common stock. Because most of our shares are held by brokers and other institutions on behalf of stockholders, we are unable to estimate the total number of beneficial stockholders represented by these holders of record.
Dividend Policy
We have never declared or paid cash dividends on our capital stock. We intend to retain any future earnings and do not expect to pay any dividends in the foreseeable future. Under the terms of the credit agreement with Bank of America, dated April 19, 2018, we may not pay any dividends.
Equity Compensation Plan
Please see Part III, Item 12, “Security Ownership of Certain Beneficial Owners and Management and Related Stockholder Matters” of this Annual Report for disclosure relating to our equity compensation plans.
Stock Performance Graph
This performance graph shall not be deemed “soliciting material” or to be "filed" with the SEC for purposes of Section 18 of the Exchange Act, or otherwise subject to the liabilities under that Section, and shall not be deemed to be incorporated by reference into any filing of Super Micro Computer, Inc. under the Securities Act of 1933, as amended, or the Exchange Act.
The following graph compares our cumulative five-year total stockholder return on our common stock with the cumulative return of the Nasdaq Computer Index, the Nasdaq Composite Index and a new industry peer group, which we refer to as the FY2019 Peer Group, consisting of: Cray Inc., Extreme Networks, Inc., Infinera Corporation, NetApp, Inc., and NetGear, Inc. In selecting the companies for inclusion in the FY2019 Peer Group, we considered and selected companies with similar industry comparability, net revenues, and operating income as our company. Due to our delisting from the Nasdaq Global Select Market on March 22, 2019, we have added the FY2019 Industry Peer Group.
The graph reflects an investment of $100 (with reinvestment of all dividends, if any) in our common stock, the Nasdaq Computer Index, the Nasdaq Composite Index and the FY2019 Peer Group, on June 30, 2014 and our relative performance tracked through June 30, 2019. The stockholder return shown on the graph below is not necessarily indicative of future performance, and we do not make or endorse any predictions as to future stockholder returns.
31
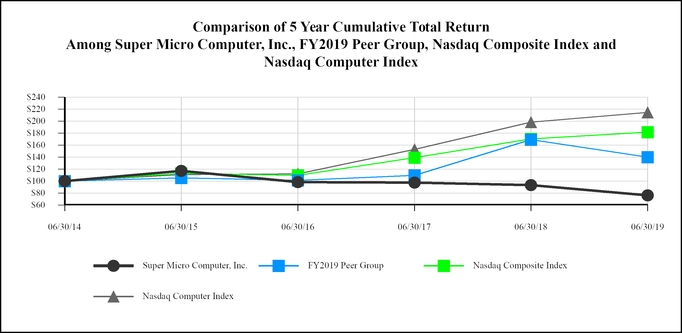
6/30/2014 | 6/30/2015 | 6/30/2016 | 6/30/2017 | 6/30/2018 | 6/30/2019 | |||||||||||||
Super Micro Computer, Inc. | 100.00 | 117.06 | 98.34 | 97.55 | 93.59 | 76.57 | ||||||||||||
FY2019 Peer Group | 100.00 | 105.68 | 101.44 | 109.63 | 169.32 | 140.32 | ||||||||||||
Nasdaq Composite Index | 100.00 | 113.13 | 109.86 | 139.30 | 170.37 | 181.62 | ||||||||||||
Nasdaq Computer Index | 100.00 | 110.81 | 112.37 | 153.16 | 198.30 | 214.60 | ||||||||||||
Recent Sales of Unregistered Securities
During fiscal years 2018 and 2019 we granted a consultant restricted stock units covering a total of 26,491 shares of our common stock for services rendered. The restricted stock units were fully vested at the time of grant. The issuances did not involve a public offering of securities and we believe that the transactions were exempt from the registration requirements of the Securities Act pursuant to Section 4(a)(2) thereof and Rule 506 of Regulation D promulgated thereunder.
Issuer Purchases of Equity Securities
None.
32
Item 6. Selected Financial Data
The following selected consolidated financial data should be read in conjunction with Part I, Item 7, "Management’s Discussion and Analysis of Financial Condition and Results of Operations" and the consolidated financial statements and the notes thereto included in Part II, Item 8, "Financial Statements and Supplementary Data" of this Annual Report to fully understand factors that may affect the comparability of the information presented below. We derived the selected consolidated balance sheet data as of June 30, 2019 and 2018, and the consolidated statement of operations data for the years ended June 30, 2019, 2018 and 2017 from our audited consolidated financial statements and accompanying notes included in this Annual Report. The consolidated balance sheet data as of June 30, 2017, 2016 and 2015, and the consolidated statement of operations data for the years ended June 30, 2016 and 2015 are derived from our audited consolidated financial statements which are not included in this Annual Report. Operating results for any year are not necessarily indicative of results to be expected for any future periods.
Years Ended June 30, | |||||||||||||||||||
2019 | 2018 | 2017 | 2016 | 2015 | |||||||||||||||
(in thousands, except per share data) | |||||||||||||||||||
Consolidated Statements of Operations Data: | |||||||||||||||||||
Net sales | $ | 3,500,360 | $ | 3,360,492 | $ | 2,484,929 | $ | 2,225,022 | $ | 1,954,353 | |||||||||
Cost of sales | 3,004,838 | 2,930,498 | 2,134,971 | 1,894,521 | 1,647,769 | ||||||||||||||
Gross profit | 495,522 | 429,994 | 349,958 | 330,501 | 306,584 | ||||||||||||||
Operating expenses: | |||||||||||||||||||
Research and development | 179,907 | 165,104 | 143,992 | 124,223 | 101,402 | ||||||||||||||
Sales and marketing | 77,154 | 71,579 | 66,445 | 58,338 | 47,496 | ||||||||||||||
General and administrative | 141,228 | 98,597 | 44,646 | 40,449 | 25,040 | ||||||||||||||
Total operating expenses | 398,289 | 335,280 | 255,083 | 223,010 | 173,938 | ||||||||||||||
Income from operations | 97,233 | 94,714 | 94,875 | 107,491 | 132,646 | ||||||||||||||
Other income (expense), net | (1,020 | ) | (773 | ) | (984 | ) | 1,507 | 956 | |||||||||||
Interest expense | (6,690 | ) | (5,726 | ) | (2,300 | ) | (1,594 | ) | (965 | ) | |||||||||
Income before income tax provision | 89,523 | 88,215 | 91,591 | 107,404 | 132,637 | ||||||||||||||
Income tax provision | (14,884 | ) | (38,443 | ) | (24,434 | ) | (35,323 | ) | (40,082 | ) | |||||||||
Share of loss from equity investee, net of taxes | (2,721 | ) | (3,607 | ) | (303 | ) | — | — | |||||||||||
Net income | $ | 71,918 | $ | 46,165 | $ | 66,854 | $ | 72,081 | $ | 92,555 | |||||||||
Net income per common share: | |||||||||||||||||||
Basic | $ | 1.44 | $ | 0.94 | $ | 1.38 | $ | 1.50 | $ | 1.99 | |||||||||
Diluted | $ | 1.39 | $ | 0.89 | $ | 1.29 | $ | 1.39 | $ | 1.85 | |||||||||
Shares used in per share calculation: | |||||||||||||||||||
Basic | 49,917 | 49,345 | 48,383 | 47,917 | 46,434 | ||||||||||||||
Diluted | 51,716 | 52,151 | 51,679 | 51,836 | 50,094 | ||||||||||||||
Stock-based compensation: | |||||||||||||||||||
Cost of sales | $ | 1,663 | $ | 1,812 | $ | 1,382 | $ | 1,157 | $ | 962 | |||||||||
Research and development | 12,981 | 13,893 | 12,559 | 10,651 | 9,195 | ||||||||||||||
Sales and marketing | 1,805 | 1,980 | 2,144 | 1,934 | 1,601 | ||||||||||||||
General and administrative | 4,735 | 6,971 | 3,580 | 3,188 | 2,678 | ||||||||||||||
Total stock-based compensation | $ | 21,184 | $ | 24,656 | $ | 19,665 | $ | 16,930 | $ | 14,436 | |||||||||
33
As of June 30, | |||||||||||||||||||
2019 | 2018 | 2017 | 2016 | 2015 | |||||||||||||||
(in thousands) | |||||||||||||||||||
Consolidated Balance Sheet Data: | |||||||||||||||||||
Cash and cash equivalents | $ | 248,164 | $ | 115,377 | $ | 110,606 | $ | 178,820 | $ | 92,920 | |||||||||
Working capital | 815,802 | 719,321 | 588,636 | 544,698 | 438,144 | ||||||||||||||
Total assets | 1,682,594 | 1,769,505 | 1,515,130 | 1,191,483 | 1,122,031 | ||||||||||||||
Long-term obligations | 135,449 | 114,296 | 68,754 | 85,200 | 26,062 | ||||||||||||||
Total stockholders’ equity | 941,176 | 843,652 | 773,846 | 696,653 | 593,585 | ||||||||||||||
34
Item 7. Management's Discussion and Analysis of Financial Condition and Results of Operations
The following discussion should be read in conjunction with the consolidated financial statements and related notes which appear elsewhere in this Annual Report. This discussion contains forward-looking statements that involve risks and uncertainties. Our actual results could differ materially from those anticipated in these forward-looking statements as a result of various factors, including those discussed below and elsewhere in this Annual Report, particularly under the heading "Risk Factors."
Nasdaq Delisting of our Common Stock
As a result of the delay in filing our periodic reports with the SEC and failure to hold an annual meeting, we were unable to comply with the Nasdaq listing standards and our common stock was suspended from trading on the Nasdaq Global Select Market effective August 23, 2018 and formally delisted effective March 22, 2019. Following the suspension of trading, our common stock has been quoted on the OTC Market and is currently traded under the symbol “SMCI.” For further information regarding trading in our common stock, refer to Part II, Item 5, “Market for Registrant's Common Equity, Related Stockholder Matters and Issuer Purchases of Equity Securities” in this Annual Report.
Overview
We are a global leader and innovator of high-performance, high-efficiency server and storage technology. We develop and provide end-to-end green computing solutions to the cloud computing, data centers, enterprise, big data, AI, HPC, edge computing and IoT markets. Our solutions range from complete server, storage, modular blade servers, blades and workstations to full racks, networking devices, server management software, server sub-systems and global support and services.
We commenced operations in 1993 and have been profitable every year since inception. For fiscal years 2019, 2018 and 2017, our net income was $71.9 million, $46.2 million and $66.9 million, respectively. In order to increase our sales and profits, we believe that we must continue to develop flexible and application optimized server and storage solutions and be among the first to market with new features and products. We must also continue to expand our software and customer service and support offerings, particularly as we increasingly focus on larger enterprise customers. We measure our financial success based on various indicators, including growth in net sales, gross profit margin and operating margin. Among the key non-financial indicators of our success is our ability to rapidly introduce new products and deliver the latest application-optimized server and storage solutions. In this regard, we work closely with microprocessor and other key component vendors to take advantage of new technologies as they are introduced. Historically, our ability to introduce new products rapidly has allowed us to benefit from technology transitions such as the introduction of new microprocessors and storage technologies, and as a result, we monitor the introduction cycles of Intel Corporation, Advanced Micro Devices, Inc., Nvidia Corporation, Samsung Electronics Company Limited, Micron Technology, Inc. and others carefully. This also impacts our research and development expenditures as we continue to invest more in our current and future product development efforts.
During fiscal years 2018 and 2019, we continued to concentrate our efforts on selling server and storage systems to larger customers such as enterprise and data center customers. As a result of these efforts, sales of server and storage systems represented sequentially greater percentages of our net sales over the course of the two fiscal years, rising from 70.0% of net sales in fiscal year 2017 to 79.3% in fiscal year 2018 and 81.7% in fiscal year 2019. Server and storage systems generally have higher average selling prices and provide an opportunity to sell services. The substantial increase in our net sales from fiscal year 2017 to fiscal year 2018 reflected both this concentration on selling server and storage systems and an increased demand for our products. The further increase in our net sales from fiscal year 2018 to fiscal year 2019, which was less substantial than the prior year’s increase in net sales, reflected our continued concentration on selling server and storage systems, but also reflected a softening demand for our products due to an overall market slowdown in the second half of fiscal year 2019. In addition, adverse publicity associated with false assertions made against our company in a news article published in October 2018 and the unrelated suspension of trading in our common stock on NASDAQ in August 2018 may have been factors contributing to the slower growth in our net sales for fiscal year 2019.
Financial Highlights
The following is a summary of financial highlights of fiscal years 2019 and 2018:
• | Net sales increased by 4.2% and 35.2% in fiscal years 2019 and 2018, respectively, as compared to fiscal years 2018 and 2017, respectively. |
35
• | Gross margin increased to 14.2% in fiscal year 2019 from 12.8% in fiscal year 2018, primarily due to lower prices for key components, a favorable geographic mix with less competitive pricing, and increased service revenues that have higher margins. Gross margin in fiscal year 2018 decreased by 130 basis points from 14.1% in fiscal year 2017 primarily due to higher costs of key components resulting from shortages of memory and SSDs, higher volume of server and storage systems sales configured with these key components and a less favorable geographical mix of sales resulting in a higher cost of sales. |
• | Operating expenses increased by 18.8% and 31.4% in fiscal years 2019 and 2018, respectively, as compared to fiscal years 2018 and 2017, respectively. The increase in both fiscal years was primarily due to an increase in professional fees incurred to investigate, assess and begin remediating the causes that led to the delay in filing our periodic reports with the SEC and the associated restatement of certain of our previously issued financial statements, as well as an increase in the number of employees to support our growth. |
• | Net income increased to $71.9 million as compared to $46.2 million in fiscal year 2018, which was primarily due to a reduction in our effective tax rate to 16.6% as compared to 43.6% in fiscal year 2018 and a $1.3 million increase in income before taxes. Net income in fiscal year 2018 decreased by $20.7 million from $66.9 million in fiscal year 2017 primarily due to an increase in our effective tax rate to 43.6% in fiscal year 2018, in part due to the remeasurement of our deferred tax assets under the 2017 Tax Reform Act, as compared to 26.7% in fiscal year 2017. |
• | Our cash and cash equivalents were $248.2 million, $115.4 million and $110.6 million at the end of fiscal years 2019, 2018, and 2017, respectively. In fiscal year 2019, we generated net cash of $141.8 million, of which $262.6 million was generated from operating activities related to increased net income and improved working capital management while we invested $24.8 million primarily in new manufacturing capacity and used $95.8 million in financing activities primarily to repay outstanding loans. In fiscal year 2018, we generated net cash of $7.6 million, of which $84.3 million was generated from operating activities related to improved working capital management while we invested $25.9 million primarily in new manufacturing capacity and used $50.8 million in financing activities to primarily repay outstanding loans. |
Subsequent Events
For details, see Part II, Item 8, Note 19, “Subsequent Events” in our notes to the consolidated financial statements in this Annual Report.
Critical Accounting Policies
General
Our discussion and analysis of our financial condition and results of operations are based upon our consolidated financial statements, which have been prepared in accordance with generally accepted accounting principles in the United States. The preparation of these consolidated financial statements requires us to make estimates and judgments that affect the reported amount of assets, liabilities, net sales and expenses. We evaluate our estimates on an on-going basis, and base our estimates on historical experience and on various other assumptions that we believe to be reasonable under the circumstances, the results of which form the basis for making the judgments we make about the carrying values of assets and liabilities that are not readily apparent from other sources. Because these estimates can vary depending on the situation, actual results may differ from the estimates. Making estimates and judgments about future events is inherently unpredictable and is subject to significant uncertainties, some of which are beyond our control. Should any of these estimates and assumptions change or prove to have been incorrect, it could have a material impact on our results of operations, financial position and statement of cash flows.
A summary of significant accounting policies is included in Part II, Item 8, Note 1, “Organization and Summary of Significant Accounting Policies” in our notes to the consolidated financial statements in this Annual Report. Management believes the following are the most critical accounting policies and reflect the significant estimates and assumptions used in the preparation of the consolidated financial statements.
Revenue recognition for periods after adoption of ASC 606 as of July 1, 2018
We adopted the new accounting guidance issued by the Financial Accounting Standards Board (“FASB”), Revenue from Contracts with Customers, (“ASC 606”) as of July 1, 2018 using the modified retrospective method for all contracts not completed as of the date of adoption. For contracts that were modified before the effective date, we considered the effect of all
36
modifications when identifying performance obligations and allocating transaction price, which did not have a material effect on the adjustment to retained earnings. We recognized the cumulative effect of initially applying ASC 606 as an adjustment to the opening balance of retained earnings. The comparative information has not been recast and continues to be reported under the accounting standards in effect for those periods.
ASC 606 provides a unified model in determining when and how revenue is recognized with the core principle that revenue should be recognized when a customer obtains control of the promised goods or services in an amount that reflects the consideration to which the entity expects to be entitled in exchange for those goods or services.
We generate revenues from the sale of server and storage systems, subsystems, accessories, services, server software management solutions, and support services.
Product sales. We recognize revenue from sales of products as control is transferred to customers, which generally happens at the point of shipment or upon delivery, unless customer acceptance is uncertain. Products sold are delivered via shipment from our facilities or drop shipment directly to our customer from our vendor. We may use distributors to sell products to end customers. Revenue from distributors is recognized when the distributor obtains control of the product, which generally happens at the point of shipment or upon delivery, unless customer acceptance is uncertain, and in the amount of consideration to which we expect to be entitled.
As part of determining the transaction price in contracts with customers, we estimate reserves for future sales returns based on a review of our history of actual returns for each major product line. Based upon historical experience a refund liability is recorded at the time of sale for estimated product returns and an asset is recognized for the amount expected to be recorded in inventory upon product return, less the expected recovery costs. We also reduce revenue for the estimated costs of customer and distributor programs and incentive offerings such as price protection and rebates as well as the estimated costs of cooperative marketing arrangements where the fair value of the benefit derived from the costs cannot be reasonably estimated. Any provision for customer and distributor programs and other discounts is recorded as a reduction of revenue at the time of sale based on an evaluation of the contract terms and historical experience.
Services sales. Our sale of services mainly consists of extended warranty and on-site services. Revenue related to extended warranty commences upon the expiration of the standard warranty period and is recognized ratably over the contractual period as we stand ready to perform any required warranty service. Revenue related to on-site services commences upon recognition of the product sale and is recognized ratably over the contractual period as the on-site services are made available to the customer. These service contracts are typically one to five years in length. Service revenue has been less than 10% of net sales for all periods presented and is not separately disclosed.
Contracts with multiple promised goods and services. Certain of our contracts contain multiple promised goods and services. Performance obligations in a contract are identified based on the promised goods or services that will be transferred to the customer that are both capable of being distinct, whereby the customer can benefit from the service either on its own or together with other resources that are readily available from third parties or from us, and are distinct in the context of the contract, whereby the transfer of the services is separately identifiable from other promises in the contract. If these criteria are not met, the promised goods and services are accounted for as a combined performance obligation. Revenue allocated to each performance obligation is recognized at the time the related performance obligation is satisfied by transferring control of the promised good or service to a customer.
If the contract contains a single performance obligation, the entire transaction price is allocated to the single performance obligation. Contracts that contain multiple performance obligations require an allocation of the transaction price to each performance obligation based on a relative standalone selling price basis. We determine standalone selling prices based on the price at which the performance obligation is sold separately. If the standalone selling price is not observable through past transactions, we estimate the standalone selling price taking into account available information, such as internally approved pricing guidelines with respect to geographies, customer type, internal costs, and gross margin objectives, for the related performance obligations.
When we receive consideration from a customer prior to transferring goods or services to the customer, we record a contract liability (deferred revenue). We also recognize deferred revenue when we have an unconditional right to consideration (i.e., a receivable) before transfer of control of goods or services to a customer.
We consider shipping & handling activities as costs to fulfill the sales of products. Shipping revenue is included in net sales when control of the product is transferred to the customer, and the related shipping and handling costs are included in cost
37
of products sold. Taxes imposed by governmental authorities on our revenue producing activities with customers, such as sales taxes and value added taxes, are excluded from net sales.
Revenue recognition for periods prior to adoption of ASC 606 as of July 1, 2018
Product sales. We recognize revenue from sales of products upon meeting all of the following revenue recognition criteria, which is typically met upon shipment or delivery of our products to customers, unless customer acceptance is uncertain or significant obligations to the customer remain: (i) persuasive evidence of an arrangement exists through customer contracts and orders, (ii) the customer takes title and assumes the risks and rewards of ownership, (iii) the sales price charged is fixed or determinable as evidenced by customer contracts and orders and (iv) collectibility is reasonably assured.
We estimate reserves for future sales returns based on a review of our history of actual returns for each major product line. We also reduce revenue for customer and distributor programs and incentive offerings such as price protection and rebates as well as cooperative marketing arrangements where the fair value of the benefit identified from the costs cannot be reasonably estimated.
We may use distributors to sell products to end customers. Revenue from distributors may be recognized on sell-in or sell-through basis depending on the terms of the arrangement with the distributor.
We record costs related to shipping and handling in sales and marketing expenses. Shipping and handling fees billed to customers are included in net sales.
Services sales. Our sale of services mainly consists of extended warranty and on-site services. These services are sold at the time of the sale of the underlying products. Revenue related to extended warranty commences upon the expiration of the standard warranty period and is recognized ratably over the contractual period. Revenue related to on-site services commences upon recognition of the product sale and is recognized ratably over the contractual period. These service contracts are typically one to five years in length. Service revenue has been less than 10% of net sales for all periods presented and is not separately disclosed.
Multiple-element arrangements. Certain of our arrangements contain multiple elements, consisting of both our products and services. Revenue allocated to each element is recognized when all the revenue recognition criteria are met for that element.
We allocate arrangement consideration at the inception of an arrangement to all deliverables, if they represent a separate unit of accounting, based on their relative estimated stand-alone selling prices. A deliverable qualifies as a separate unit of accounting when the delivered element has stand-alone value to the customer. The guidance establishes the following hierarchy to determine the relative estimated stand-alone selling price to be used for allocating arrangement consideration to deliverables: (i) vendor-specific objective evidence of fair value (“VSOE”), (ii) third-party evidence of selling price (“TPE”) if VSOE is not available, or (iii) the vendor's best estimated selling price (“BESP”) if neither VSOE nor TPE are available.
We do not have VSOE for deliverables in our arrangements, and TPE is generally not available because our products are highly differentiated, and we are unable to obtain reliable information on the products and pricing practices of our competitors. BESP reflects our estimate of what the selling price of a deliverable would be if it were sold regularly on a stand-alone basis.
As such, BESP is generally used to allocate the total arrangement consideration at the arrangement inception. We determine BESP for a product by considering multiple factors including, but not limited to, geographies, customer types, internal costs, gross margin objectives and pricing practices.
Product Warranties
We offer product warranties ranging from 15 to 39 months against any defective products. These standard warranties are assurance type warranties and we do not offer any services beyond the assurance that the product will continue working as specified. Therefore, under recently adopted guidance, ASC 606, these warranties are not considered separate performance obligations in the arrangement. Based on historical experience, we accrue for estimated returns of defective products at the time revenue is recognized. We monitor warranty obligations and may make revisions to its warranty reserve if actual costs of product repair and replacement are significantly higher or lower than estimated. Accruals for anticipated future warranty costs are charged to cost of sales and included in accrued liabilities and other long-term liabilities. Warranty accruals are based on
38
estimates that are updated on an ongoing basis taking into consideration inputs such as new product introductions, changes in the volume of claims compared with our historical experience, and the changes in the cost of servicing warranty claims. We account for the effect of such changes in estimates prospectively.
Inventories
Inventories are stated at weighted average cost, subject to lower of cost or net realizable value. Net realizable value is the estimated selling price of our products in the ordinary course of business, less reasonably predictable costs of completion, disposal, and transportation. Inventories consist of purchased parts and raw materials (principally electronic components), work in process (principally products being assembled) and finished goods. We evaluate inventory on a quarterly basis for lower of cost or net realizable value and excess and obsolescence and, as necessary, write down the valuation of units based upon our forecasted usage and sales, anticipated selling price, product obsolescence and other factors. Once inventory is written down, its new value is maintained until it is sold or scrapped. Prior to July 1, 2017, inventories were stated at weighted-average cost, subject to lower of cost or market.
We receive various rebate incentives from certain suppliers based on our contractual arrangements, including volume-based rebates. The rebates earned are recognized as a reduction of cost of inventories and reduce the cost of sales in the period when the related inventory is sold.
Income Taxes
We account for income taxes under an asset and liability approach. Deferred income taxes reflect the impact of temporary differences between assets and liabilities recognized for financial reporting purposes and such amounts recognized for income tax reporting purposes, net of operating loss carry-forwards and other tax credits measured by applying enacted tax laws related to the financial statement periods. Valuation allowances are provided when necessary to reduce deferred tax assets to an amount that is more likely than not to be realized.
We recognize tax liabilities for uncertain income tax positions on the income tax return based on the two-step process. The first step is to determine whether it is more likely than not that each income tax position would be sustained upon audit. The second step is to estimate and measure the tax benefit as the amount that has a greater than 50% likelihood of being realized upon ultimate settlement with the tax authority. Estimating these amounts requires us to determine the probability of various possible outcomes. We evaluate these uncertain tax positions on a quarterly basis. This evaluation is based on the consideration of several factors, including changes in facts or circumstances, changes in applicable tax law, settlement of issues under audit and new exposures. If we later determine that our exposure is lower or that the liability is not sufficient to cover our revised expectations, we adjust the liability and effect a related charge in our tax provision during the period in which we make such a determination.
Stock-Based Compensation
We measure and recognize compensation expense for all share-based awards made to employees and non-employees, including stock options and restricted stock units ("RSUs"). The share-based awards granted to non-employees have not been material to date. We are required to estimate the fair value of share-based awards on the date of grant. We recognize the grant date fair value of all share-based awards over the requisite service period and account for forfeitures as they occur. Prior to July 1, 2017, we estimated forfeitures and expensed the value of awards that were ultimately expected to vest over the requisite service periods. The fair value of RSUs with service conditions or performance conditions is based on the closing market price of our common stock on the date of grant. The fair value for RSUs with service conditions, or time-based RSUs, is amortized on a straight-line basis over the requisite service period. The fair value for RSUs with performance conditions ("PRSUs") is recognized on a ratable basis over the requisite service period when it is probable the performance conditions of the awards will be met. We reassess the probability of vesting at each reporting period and adjust our total compensation cost of the awards based on this probability assessment.
We estimate the fair value of stock options granted using a Black-Scholes option pricing model and a single option award approach. This model requires us to make estimates and assumptions with respect to the expected term of the option and the expected volatility of the price of our common stock. The expected term represents the period that our stock-based awards are expected to be outstanding and was determined based on our historical experience. The expected volatility is based on the implied and historical volatility of our common stock. The fair value is then amortized on a straight-line basis over the requisite service periods of the awards, which is generally the vesting period.
Variable Interest Entities
39
We determine at the inception of each arrangement whether an entity in which we hold an investment or in which we have other variable interests is considered a variable interest entity ("VIE"). We consolidate VIEs when we are the primary beneficiary. The primary beneficiary of a VIE is the party that meets both of the following criteria: (1) has the power to make decisions that most significantly affect the economic performance of the VIE and (2) has the obligation to absorb losses or the right to receive benefits that in either case could potentially be significant to the VIE. Periodically, we assess whether any changes in the interest or relationship with the entity affect the determination of whether the entity is still a VIE and, if so, whether we are the primary beneficiary. If we are not the primary beneficiary in a VIE, we account for the investment or other variable interest in accordance with applicable GAAP.
We have concluded that Ablecom Technology, Inc. ("Ablecom") and its affiliate, Compuware Technology, Inc. ("Compuware") are VIEs in accordance with applicable accounting standards and guidance; however, we are not the primary beneficiary as we do not have the power to direct the activities that are most significant to the entities and therefore, we do not consolidate these entities. In performing this analysis, we considered our explicit arrangements with Ablecom and Compuware, including the supplier arrangements. Also, as a result of the substantial related party relationships between us and these two companies, we considered whether any implicit arrangements exist that would cause us to protect those related parties’ interests from suffering losses. We determined that no material implicit arrangements exist with Ablecom, Compuware, or their shareholders.
We and Ablecom jointly established Super Micro Asia Science and Technology Park, Inc. (the “Management Company”) in Taiwan to manage the common areas shared by us and Ablecom for our separately constructed manufacturing facilities. In fiscal year 2012, each company contributed $0.2 million and owns 50% of the Management Company. We have concluded that the Management Company is a VIE and we are the primary beneficiary as we have the power to direct the activities that are most significant to the Management Company. For the fiscal years ended 2019, 2018 and 2017, the accounts of the Management Company have been consolidated with our accounts, and a noncontrolling interest has been recorded for Ablecom’s interest in the net assets and operations of the Management Company. Net income (loss) attributable to Ablecom’s interest was not material for the periods presented and was included in general and administrative expenses in our consolidated statements of operations.
Results of Operations
Net Sales
Net sales consist of sales of our server and storage solutions, including systems and related services and subsystems and accessories. The main factors that impact our net sales are the number of compute nodes sold, the average selling prices per node for our server and storage system sales and units shipped and the average selling price per unit for our subsystem and accessories. The prices for our server and storage systems range widely depending upon the configuration, including the number of compute nodes in a server system as well as the level of integration of key components such as SSDs, and memory, and the prices for our subsystems and accessories can also vary widely based on whether a customer is purchasing power supplies, server boards, chassis or other accessories. A compute node is an independent hardware configuration within a server system capable of having its own CPU, memory and storage and that is capable of running its own instance of a non-virtualized operating system. The number of compute nodes sold, which can vary by product, is an important metric we use to track our business. Measuring volume using compute nodes enables more consistent measurement across different server form factors and across different vendors. As with most electronics-based product life cycles, average selling prices typically are highest at the time of introduction of new products that utilize the latest technology and tend to decrease over time as such products mature in the market and are replaced by next generation products. Additionally, in order to remain competitive throughout all industry cycles, we actively change our selling price per unit in response to changes in costs for key components such as memory and SSDs.
The following table presents net sales by product type for fiscal years 2019, 2018 and 2017 (dollars in millions):
40
Years Ended June 30, | 2019 over 2018 Change | 2018 over 2017 Change | |||||||||||||||||||||||
2019 | 2018 | 2017 | $ | % | $ | % | |||||||||||||||||||
Server and storage systems | $ | 2,858.6 | $ | 2,663.6 | $ | 1,740.6 | $ | 195.0 | 7.3 | % | $ | 923.0 | 53.0 | % | |||||||||||
Percentage of total net sales | 81.7 | % | 79.3 | % | 70.0 | % | |||||||||||||||||||
Subsystems and accessories | 641.7 | 696.9 | 744.3 | (55.2 | ) | (7.9 | )% | (47.4 | ) | (6.4 | )% | ||||||||||||||
Percentage of total net sales | 18.3 | % | 20.7 | % | 30.0 | % | |||||||||||||||||||
Total net sales | $ | 3,500.3 | $ | 3,360.5 | $ | 2,484.9 | $ | 139.8 | 4.2 | % | $ | 875.6 | 35.2 | % | |||||||||||
Fiscal Year 2019 Compared with Fiscal Year 2018
In fiscal year 2019, we continued our strategy of focusing on selling server and storage systems to larger customers such as enterprise and internet data center and cloud customers. The year-over-year increase in server and storage systems sales was primarily due to an increase of average selling price per compute node by approximately 15%, offset by a decrease of approximately 6.5% in the number of units of compute nodes shipped, which is attributable to an overall market slowdown in the second half of fiscal year 2019. The increase in the average selling prices of our server and storage systems was primarily due to higher sales of our complete systems configured with higher density computing and more memory and storage capacity. During the first half of fiscal year 2019, we increased our average selling prices primarily to remain consistent with the increases in the cost of memory and SSDs on a year-over year basis. During October 2018, a 10% tariff was applied to certain key components made in China and was partially incorporated into our average selling prices to the extent that component sourcing alternatives were not available. As costs for memory and SSDs began to decline in the second half of fiscal year 2019, our average selling prices to customers declined accordingly. The year-over-year decrease in net sales of our subsystems and accessories in fiscal year 2019 was primarily due to lower sales of subsystems and accessories through our indirect sales channel.
Fiscal Year 2018 Compared with Fiscal Year 2017
In fiscal year 2018, we continued our strategy of focusing on selling server and storage systems to larger customers such as enterprise and internet data center and cloud customers. The substantial increase year-over-year in server and storage systems sales was primarily due to an increase of average selling price per compute node by approximately 32% and an increase of approximately 14% in the number of units of compute nodes shipped due to an increased demand for our products. The increase in the average selling prices of our server and storage systems was primarily due to higher sales of our complete systems configured with higher density computing and more memory and storage capacity. During fiscal year 2018, our average selling prices to customers increased as a result of the increases in the cost of memory and SSDs. The year-over-year decrease in net sales of our subsystems and accessories in fiscal year 2018 was primarily due to lower sales of subsystem and accessories through our indirect sales channel as we continued to promote our sales of server and storage systems to our direct customers and OEMs.
The following table presents the percentages of net sales from products sold through our indirect sales channel and to our direct customers and OEMs for fiscal years 2019, 2018 and 2017:
Years Ended June 30, | 2019 over 2018 Change | 2018 over 2017 Change | ||||||||||||
2019 | 2018 | 2017 | % | % | ||||||||||
Indirect sales channel | 39.3 | % | 41.5 | % | 47.8 | % | (2.2 | )% | (6.3 | )% | ||||
Direct customers and OEMs | 60.7 | % | 58.5 | % | 52.2 | % | 2.2 | % | 6.3 | % | ||||
Total net sales | 100.0 | % | 100.0 | % | 100.0 | % | ||||||||
Fiscal Year 2019 Compared with Fiscal Year 2018
The year-over-year decrease in net sales through our indirect sales channel as a percentage of total net sales was primarily due to the higher sales to our direct customers and OEMs. The year-over-year increase in net sales to direct customers and OEMs as a percentage of total net sales was primarily due to higher sales of our server and storage systems to internet data center and cloud, enterprise and OEM customers.
41
Fiscal Year 2018 Compared with Fiscal Year 2017
The year-over-year decrease in net sales through our indirect sales channel as a percentage of total net sales was primarily due to the lower sales of our subsystems and accessories, which are typically sold through our indirect sales channel. The year-over-year increase in net sales to direct customers and OEMs as a percentage of total net sales was primarily due to the higher volume of sales of our server and storage systems to our internet data center and cloud, enterprise and OEM customers.
The following table presents percentages of net sales by geographic region for fiscal years 2019, 2018 and 2017:
Years Ended June 30, | 2019 over 2018 Change | 2018 over 2017 Change | ||||||||||||
2019 | 2018 | 2017 | % | % | ||||||||||
United States | 58.1 | % | 56.6 | % | 57.2 | % | 1.5 | % | (0.6 | )% | ||||
Europe | 17.5 | % | 16.3 | % | 18.3 | % | 1.2 | % | (2.0 | )% | ||||
Asia | 20.3 | % | 22.7 | % | 20.2 | % | (2.4 | )% | 2.5 | % | ||||
Others | 4.1 | % | 4.4 | % | 4.3 | % | (0.3 | )% | 0.1 | % | ||||
Total net sales | 100.0 | % | 100.0 | % | 100.0 | % | ||||||||
Fiscal Year 2019 Compared with Fiscal Year 2018
The year-over-year increase in net sales in the United States as a percentage of total net sales was primarily due to the higher sales of our server and storage systems to our direct customers and OEMs. The year-over-year decrease in net sales in Asia as a percentage of total net sales was due primarily to decreased sales through our indirect sales channel in China, partially offset by increased sales in Taiwan to enterprise datacenter customers. The increased percentage of net sales in Europe was primarily due to higher sales in the Netherlands to enterprise and cloud computing customers.
Fiscal Year 2018 Compared with Fiscal Year 2017
The year-over-year decline in net sales in the United States and Europe as a percentage of total net sales was primarily due to higher sales growth in Asia, particularly China and Taiwan, as compared to other regions.
Cost of Sales and Gross Margin
Cost of sales primarily consists of the costs to manufacture our products, including the costs of materials, contract manufacturing, shipping, personnel and related expenses including stock-based compensation, equipment and facility expenses, warranty costs and inventory excess and obsolescence provisions. The primary factors that impact our cost of sales are the mix of products sold and cost of materials, which include purchased parts and material costs, shipping costs, salary and benefits and overhead costs related to production. Cost of sales as a percentage of net sales may increase over time if decreases in average selling prices are not offset by corresponding decreases in our costs. Our cost of sales as a percentage of net sales is also impacted by the extent to which we are able to efficiently utilize our expanding manufacturing capacity. Because we generally do not have long-term fixed supply agreements, our cost of sales is subject to change based on the cost of materials and market conditions. As a result, our cost of sales as a percentage of net sales in any period can increase due to significant component price increases resulting from component shortages.
We use several suppliers and contract manufacturers to design and manufacture subsystems in accordance with our specifications, with most final assembly and testing performed at our manufacturing facility in San Jose, California. During the fiscal years 2019 and 2018, we continued to expand manufacturing and service operations in Taiwan and the Netherlands primarily to support our Asian and European customers and have continued to work on improving our utilization of our overseas manufacturing capacity. We work with Ablecom, one of our key contract manufacturers and also a related party to optimize modular designs for our chassis and certain of other components. We also outsource to Compuware, also a related party, a portion of our design activities and a significant part of our manufacturing of components, particularly power supplies. Our purchases of products from Ablecom and Compuware represented 9.2%, 9.0% and 11.1% of our cost of sales for fiscal years 2019, 2018 and 2017, respectively. For further details on our dealings with related parties, see Part II, Item 8, Note 12, “Related Party Transactions.”
Cost of sales and gross margin for fiscal years 2019, 2018 and 2017, are as follows (dollars in millions):
42
Years Ended June 30, | 2019 over 2018 Change | 2018 over 2017 Change | |||||||||||||||||||||||
2019 | 2018 | 2017 | $ | % | $ | % | |||||||||||||||||||
Cost of sales | $ | 3,004.8 | $ | 2,930.5 | $ | 2,135.0 | $ | 74.3 | 2.5 | % | $ | 795.5 | 37.3 | % | |||||||||||
Gross profit | 495.5 | 430.0 | 350.0 | 65.5 | 15.2 | % | 80.0 | 22.9 | % | ||||||||||||||||
Gross margin | 14.2 | % | 12.8 | % | 14.1 | % | 1.4 | % | (1.3 | )% | |||||||||||||||
Fiscal Year 2019 Compared with Fiscal Year 2018
The year-over-year increase in cost of sales was primarily attributable to an increase of $25.8 million in product cost related to the increase in net sales volume, increased expense of $23.3 million in the provision for excess inventory and obsolescence, an increase in overhead costs of $10.7 million attributable to increased tariffs for import of components from China, an increase of $8.6 million in compensation and benefits including stock-based compensation as a result of an increase in annual salaries and benefits and an increase in the number of operations personnel we employ to support the growth of our business, and an increase of warranty provision of $5.4 million related to the increase in net sales.
The year-over-year increase in the gross margin percentage was primarily due to lower costs of memory and SSDs components in the second half of fiscal year 2019 and the timing of adjusting our average selling prices. In addition, in fiscal year 2019 as compared with fiscal year 2018, we had lower net sales in Asia where pricing is typically lower and the market there is more competitive which resulted in a shift in geographic mix that had a positive impact on our gross margin percentage.
Fiscal Year 2018 Compared with Fiscal Year 2017
The year-over-year increase in cost of sales was primarily attributable to an increase of $772.6 million in product costs due to an increase in key component prices in combination with an increase in net sales volume, an increase of $7.8 million in compensation and benefits including stock-based compensation as a result of an increase in annual salaries and benefits and an increase in the number of operations personnel to support the growth of our business, an increase of $6.9 million in facility expense as a result of the expansion of our Green Computing Park in San Jose, California and an increase of $11.6 million in overhead costs due to an increase in freight charges and other manufacturing costs driven by the increase in net sales, offset by a decrease of $6.1 million in the provision for excess inventory and obsolescence.
The year-over-year decrease in the gross margin percentage was primarily due to lower sales of our subsystems and accessories and higher sales of our server and storage systems, which reflected higher costs in key component sourcing due to component shortages, partially offset by higher average selling prices per compute node. In fiscal year 2018, the growth in net sales in Asia was higher than in fiscal year 2017, which negatively impacted our gross margin due to more competitive pricing in Asia as compared to other regions.
Operating Expenses
Research and development expenses consist of personnel expenses including: salaries, benefits, stock-based compensation and incentive bonuses, and related expenses for our research and development personnel, as well as product development costs such as materials and supplies, consulting services, third-party testing services and equipment and facility expenses related to our research and development activities. All research and development costs are expensed as incurred. We occasionally receive non-recurring engineering funding from certain suppliers and customers for joint development. Under these arrangements, we are reimbursed for certain research and development costs that we incur as part of the joint development efforts with our suppliers and customers. These amounts offset a portion of the related research and development expenses and have the effect of reducing our reported research and development expenses.
Sales and marketing expenses consist primarily of personnel expenses, including: salaries, benefits, stock-based compensation and incentive bonuses, and related expenses for our sales and marketing personnel, costs for tradeshows, independent sales representative fees and marketing programs. From time to time, we receive cooperative marketing funding from certain suppliers. Under these arrangements, we are reimbursed for certain marketing costs that we incur as part of the joint promotion of our products and those of our suppliers. These amounts offset a portion of the related expenses and have the effect of reducing our reported sales and marketing expenses. The timing, magnitude and estimated usage of these programs can result in significant variations in reported sales and marketing expenses from period to period. Spending on cooperative marketing, reimbursed by our suppliers, typically increases in connection with new product releases by our suppliers.
43
General and administrative expenses consist primarily of general corporate costs, including personnel expenses such as: salaries, benefits, stock-based compensation and incentive bonuses, and related expenses for our general and administrative personnel, financial reporting, information technology, corporate governance and compliance and outside legal, audit, tax fees, insurance and bad debt.
Operating expenses for fiscal years 2019, 2018 and 2017 are as follows (dollars in millions):
Years Ended June 30, | 2019 over 2018 Change | 2018 over 2017 Change | |||||||||||||||||||||||
2019 | 2018 | 2017 | $ | % | $ | % | |||||||||||||||||||
Research and development | $ | 179.9 | $ | 165.1 | $ | 144.0 | $ | 14.8 | 9.0 | % | $ | 21.1 | 14.7 | % | |||||||||||
Percentage of total net sales | 5.1 | % | 4.9 | % | 5.8 | % | |||||||||||||||||||
Sales and marketing | 77.2 | 71.6 | 66.4 | 5.6 | 7.8 | % | 5.2 | 7.8 | % | ||||||||||||||||
Percentage of total net sales | 2.2 | % | 2.1 | % | 2.7 | % | |||||||||||||||||||
General and administrative | 141.2 | 98.6 | 44.7 | 42.6 | 43.2 | % | 53.9 | 120.6 | % | ||||||||||||||||
Percentage of total net sales | 4.0 | % | 2.9 | % | 1.8 | % | |||||||||||||||||||
Total operating expenses | $ | 398.3 | $ | 335.3 | $ | 255.1 | 63.0 | 18.8 | % | 80.2 | 31.4 | % | |||||||||||||
Percentage of total net sales | 11.4 | % | 10.0 | % | 10.3 | % | |||||||||||||||||||
Fiscal Year 2019 Compared with Fiscal Year 2018
The year-over-year increase in research and development expenses was due to an increase of $16.0 million in personnel expenses, an decrease of $3.3 million in reimbursements received for certain research and development costs that we incur as part of the joint development of our and our suppliers’ and customers’ products, offset by a decrease of $6.1 million in product development costs. Our personnel expenses increased primarily as a result of an increase in annual salaries and benefits, and an increase in the number of research and development personnel to support our expanded product development initiatives and to support the growth of our business in many market verticals.
The year-over-year increase in sales and marketing expenses was due to an increase of $6.1 million in personnel expenses, as a result of an increase in annual salaries and benefits and an increase in the number of sales and marketing personnel, offset by a $1.5 million decrease in expenses related to advertising and promotion activities.
The year-over-year increase in general and administrative expenses was attributable to an increase of $31.7 million in professional fees that were primarily incurred to investigate, assess and begin remediating the causes that led to the delay in filing our periodic reports with the SEC and the associated restatement of certain of our previously issued financial statements, an increase of $7.2 million in bad debt provision expenses primarily as a result of our inability to collect receivables from certain international customers and an increase of $2.7 million primarily attributable to increase in sales tax accrual and insurance costs.
Fiscal Year 2018 Compared with Fiscal Year 2017
The year-over-year increase in research and development expenses was due to an increase of $21.1 million in personnel expenses, an decrease of $4.2 million in reimbursements received for certain research and development costs that we incur as part of the joint development of our and our suppliers’ and customers’ products, offset by a decrease of $3.9 million in product development costs and $1.1 million increase of deferred gain related to our remaining performance obligations in association with the contribution of certain technology rights to the equity investee in China. Our personnel expenses increased primarily as a result of an increase in annual salaries and benefits and an increase in the number of research and development personnel to support our product development and growth of business.
The year-over-year increase in sales and marketing expenses was due to an increase of $7.0 million in personnel expenses, as a result of an increase in annual salaries and benefits and an increase in the number of sales and marketing personnel, offset by a decrease of $1.8 million in advertising and promotion expenses driven by higher reimbursements received under our cooperative marketing arrangements with certain vendors.
The year-over-year increase in general and administrative expenses was due to an increase of $45.8 million in professional fees that were primarily incurred to investigate, assess and begin remediating the causes that led to the delay in filing our periodic reports with the SEC and the associated restatement of certain of our previously issued financial statements
44
and an increase of $8.1 million in personnel expenses. Our personnel expenses in general and administrative expenses increased primarily as a result of an increase in annual salaries and benefits and an increase in the number of personnel to support our expanded business.
Interest and Other Expense, Net
Other expense, net consists primarily of interest earned on our investment and cash balances and foreign exchange gains and losses.
Interest expense represents interest expense on our term loans and lines of credit.
Interest and other expense, net for fiscal years 2019, 2018 and 2017 are as follows (dollars in millions):
Years Ended June 30, | 2019 over 2018 Change | 2018 over 2017 Change | |||||||||||||||||||||||
2019 | 2018 | 2017 | $ | % | $ | % | |||||||||||||||||||
Other expense, net | $ | (1.0 | ) | $ | (0.8 | ) | $ | (1.0 | ) | $ | (0.2 | ) | 25.0 | % | $ | 0.2 | (20.0 | )% | |||||||
Interest expense | (6.7 | ) | (5.7 | ) | (2.3 | ) | (1.0 | ) | 17.5 | % | (3.4 | ) | 147.8 | % | |||||||||||
Interest and other expense, net | $ | (7.7 | ) | $ | (6.5 | ) | $ | (3.3 | ) | $ | (1.2 | ) | 18.5 | % | $ | (3.2 | ) | 97.0 | % | ||||||
Fiscal Year 2019 Compared with Fiscal Year 2018
The year-over-year increase in interest and other expense, net was primarily due to an increase of $1.0 million in interest expense related to amortization of loan origination fees in connection with refinancing of our debt in the last quarter of fiscal year 2018, an increase in other expense of $2.1 million primarily as a result of an impairment recorded for certain investments, offset by an increase of $1.9 million attributable to increase in interest income on our interest bearing deposits and foreign exchange gain due to favorable foreign currency fluctuations.
Fiscal Year 2018 Compared with Fiscal Year 2017
The year-over-year increase in interest and other expense, net was primarily due to an increase of $3.4 million in interest expense attributable to increased borrowings under our credit facilities to support our growth.
Provision for Income Taxes
Our income tax provision is based on our taxable income generated in the jurisdictions in which we operate, primarily the United States, Taiwan, and the Netherlands. Our effective tax rate differs from the statutory rate primarily due to research and development tax credits, foreign derived intangible income deduction, and foreign tax credits, which were partially offset by state taxes, stock based compensation, taxes on foreign earnings, and unrecognized tax benefits. A reconciliation of the federal statutory income tax rate to our effective tax rate is set forth in Part II, Item 8, Note 14, “Income Taxes” to the consolidated financial statements in this Annual Report.
Provision for income taxes and effective tax rates for fiscal years 2019, 2018 and 2017 are as follows (dollars in millions):
Years Ended June 30, | 2019 over 2018 Change | 2018 over 2017 Change | |||||||||||||||||||||||
2019 | 2018 | 2017 | $ | % | $ | % | |||||||||||||||||||
Income tax provision | $ | 14.9 | $ | 38.4 | $ | 24.4 | $ | (23.5 | ) | (61.2 | )% | $ | 14.0 | 57.4 | % | ||||||||||
Percentage of total net sales | 0.4 | % | 1.1 | % | 1.0 | % | |||||||||||||||||||
Effective tax rate | 16.6 | % | 43.6 | % | 26.7 | % | |||||||||||||||||||
Fiscal Year 2019 Compared with Fiscal Year 2018
The year-over-year decrease in the effective tax rate was primarily due to a reduction of the statutory tax rate from 28.1% to 21% as a result of the tax reform, and a prior year recording of a one-time $12.9 million write down of U.S. deferred tax assets and liabilities, and a one-time transition tax of $2.8 million, all as a result of the 2017 Tax Reform Act.
45
Fiscal Year 2018 Compared with Fiscal Year 2017
The year-over-year increase in the effective tax rate was primarily due to a $12.9 million one-time write down of U.S. deferred tax assets and liabilities, resulting from the U.S. federal corporate income tax rate decrease from 35% to 21% effective January 1, 2018, and the U.S. federal one-time transition tax of $2.8 million, each as a result of the 2017 Tax Reform Act. The Company’s statutory tax rate was reduced from 35% in 2017 to 28.1% in 2018 which includes a blended rate for the current year related to tax reform. The blended rate was a result of rate change from 35% to 21%, effective as of January 1, 2018, for all taxpayers, including fiscal year tax payers.
Liquidity and Capital Resources
We have financed our growth primarily with funds generated from operations, in addition to utilizing borrowing facilities, particularly in relation to the financing of real property acquisitions as well as working capital. Our cash and cash equivalents were $248.2 million and $115.4 million as of June 30, 2019 and 2018, respectively. Our cash in foreign locations was $124.6 million and $114.0 million as of June 30, 2019 and 2018, respectively.
Amounts held outside of the U.S. are generally utilized to support non-U.S. liquidity needs. Due to the enactment of the 2017 Tax Reform Act, all of our cash, cash equivalents and investments held by foreign subsidiaries were subject to U.S. taxation under the one-time transition tax as further discussed in Part II, Item 8, Note 14, "Income Taxes". Subsequent repatriations generally will not be taxable from a U.S. federal tax perspective but may be subject to state income or foreign withholding tax. Where local restrictions prevent an efficient intercompany transfer of funds, our intent is to keep cash balances outside of the U.S. and to meet liquidity needs through ongoing cash flows, external borrowings, or both. We do not expect restrictions or potential taxes incurred on repatriation of amounts held outside of the U.S. to have a material effect on our overall liquidity, financial condition or results of operations.
We believe that our current cash, cash equivalents, credit lines and internally generated cash flows will be generally sufficient to support our operating businesses, remediation efforts, maturing debt and interest payments for the twelve months following the issuance of these consolidated financial statements.
Our key cash flow metrics were as follows (dollars in millions):
Years Ended June 30, | 2019 over 2018 | 2018 over 2017 | |||||||||||||||||
2019 | 2018 | 2017 | |||||||||||||||||
Net cash provided by (used in) operating activities | $ | 262.6 | $ | 84.3 | $ | (96.2 | ) | $ | 178.3 | $ | 180.5 | ||||||||
Net cash used in investing activities | $ | (24.8 | ) | $ | (25.9 | ) | $ | (29.4 | ) | $ | 1.1 | $ | 3.5 | ||||||
Net cash (used in) provided by financing activities | $ | (95.8 | ) | $ | (50.8 | ) | $ | 57.7 | $ | (45.0 | ) | $ | (108.5 | ) | |||||
Net increase (decrease) in cash, cash equivalents and restricted cash | $ | 141.8 | $ | 7.6 | $ | (67.9 | ) | $ | 134.2 | $ | 75.5 | ||||||||
Operating Activities
Net cash provided by operating activities increased by $178.3 million for fiscal year 2019 as compared to fiscal year 2018. The increase was due primarily to a reduction of net working capital of $160.6 million due to improved working capital management and reduced costs for key components in the second half of fiscal year 2019, higher net income in fiscal year 2019 of $25.8 million, the change in the non-cash charges related to an increase in excess and obsolete inventory of $23.3 million for aged inventory and $7.2 million for bad debt, partially offset by a reduction of $30.7 million in the non-cash charges related to the change in our deferred income tax assets, primarily as a result of the 2017 Tax Reform Act and a decrease of $8.0 million from the change in deferred revenue compared to prior year, related to the lower growth in services business year-over-year.
Net cash provided by operating activities increased by $180.5 million for fiscal year 2018 as compared to fiscal year 2017. The increase was due primarily to a reduction of net working capital of $136.1 million due to improved working capital management in the second half of fiscal year 2018, an increase of $36.5 million from the change in deferred revenue related to the growth in our services business year-over-year, an increase in the non-cash charges related to the change in our deferred income tax assets of $19.0 million, primarily as a result of the 2017 Tax Reform Act, partially offset by lower net income of $20.7 million for the period.
Investing Activities
46
Net cash used in investing activities was $24.8 million, $25.9 million and $29.4 million for the fiscal years 2019, 2018 and 2017, respectively, as we continued to invest in our Green Computing Park in San Jose to expand our capacity and office space.
Financing Activities
Net cash used in financing activities increased by $45.0 million for fiscal year 2019 as compared to fiscal year 2018 primarily due to increased debt repayments of $43.1 million. Net cash used in financing activities was $50.8 million in fiscal year 2018 primarily due to net debt repayments of $48.7 million as compared to net cash provided by financing activities in fiscal year 2017 of $57.7 million related to net debt borrowings of $66.6 million and $10.9 million raised from the proceeds from the exercise of stock options, partially offset by stock repurchases of $18.5 million.
Other Factors Affecting Liquidity and Capital Resources
Activities under Revolving Lines of Credit and Term Loans
Bank of America
2016 Bank of America Credit Facility
In June 2016, we entered into a credit agreement with Bank of America (the “2016 Bank of America Credit Facility”). Prior to its maturity in April 2018, we repaid and terminated the 2016 Bank of America Credit Facility using the proceeds from our 2018 Bank of America Credit Facility (defined below). Immediately prior to its termination, the 2016 Bank of America Credit Facility (giving effect to all amendments since the inception of the 2016 Bank of America Credit Facility), provided for (i) a $85.0 million revolving line of credit including a $5.0 million letter of credit sublimit, (ii) a $20.0 million revolving line of credit for our Taiwan and the Netherlands entities, and (iii) a five-year $50.0 million term loan. The 2016 Bank of America Credit Facility term loan was secured by seven buildings located in San Jose, California and the property, plant and equipment and the inventory in those buildings. The principal and interest of the 2016 Bank of America Credit Facility term loan were payable monthly through June 30, 2021 with an interest rate at the LIBOR rate plus 1.25% per annum. The interest rate for the $85.0 million revolving line of credit was at the LIBOR rate plus 1.25% per annum. The interest rate of the $20.0 million revolving line of credit was equal to a minimum of 0.9% per annum plus the lender's cost of funds, as defined in the agreements.
2018 Bank of America Credit Facility
In April 2018, we entered into a revolving line of credit with Bank of America (the "2018 Bank of America Credit Facility"), which replaced the 2016 Bank of America Credit Facility. The 2018 Bank of America Credit Facility provides for a revolving credit line and other financial accommodations of up to $250.0 million extended by certain lenders, including a $5.0 million letter of credit sublimit, which was extended to $15.0 million in October 2019. The 2018 Bank of America Credit Facility was originally set to expire after 364 days and has been extended to June 30, 2020 through subsequent amendments. Prior to its maturity, at our option and if certain conditions are satisfied, including being current on all of our delinquent quarterly and annual filings with the SEC, the 2018 Bank of America Credit Facility may convert into a five-year revolving credit facility. If and upon such conversion, the lenders for the 2018 Bank of America Credit Facility shall extend, in aggregate, a principal amount of up to $400.0 million. Prior to the 2018 Bank of America Credit Facility’s conversion to the five-year revolving credit facility, interest shall accrue at the LIBOR rate plus 2.75% per annum. Upon the 2018 Bank of America Credit Facility converting to the five-year revolving credit facility, interest shall accrue at the LIBOR rate plus an amount between 1.50% and 2.00% for loans to both Super Micro Computer and Super Micro Computer B.V. Under the terms of the 2018 Bank of America Credit Facility, we are required to grant the lenders a continuing security interest in and lien upon all amounts credited to any of our deposit accounts. Interest accrued on any loans under the 2018 Bank of America Credit Facility is due on the first day of each month, and the loans are due and payable in full on the termination date of the 2018 Bank of America Credit Facility, unless payment is required earlier as determined by the lenders. Voluntary prepayments are permitted without early repayment fees or penalties. The terms of the arrangement require any amounts in the deposit accounts to be applied against our line of credit the next business day. Subject to customary exceptions, the 2018 Bank of America Credit Facility is secured by substantially all of Super Micro Computer’s assets. If converted to a five-year revolving credit facility, Super Micro Computer’s assets, and at our option, Super Micro Computer B.V.'s assets will be used as collateral for the 2018 Bank of America Credit Facility. Under the terms of the 2018 Bank of America Credit Facility, we are not permitted to either repurchase our shares or pay any dividends.
47
In the fourth fiscal quarter of 2018, we paid $3.2 million in fees to the lenders and third parties in connection with the 2018 Bank of America Credit Facility. The replacement of the 2016 Bank of America Credit Facility by the 2018 Bank of America Credit Facility is accounted for as a modification of the existing credit facility to the extent the lenders before and after the modification were the same. Any unamortized fees relating to the 2016 Bank of America Credit Facility and the fees paid for the 2018 Bank of America Credit Facility are amortized over the term of the 2018 Bank of America Credit Facility as interest expense in our consolidated statements of operation and any unamortized amounts are classified within prepaid and other current assets in our consolidated balance sheets.
On January 31, 2019, we paid a fee and entered into an amendment of the 2018 Bank of America Credit Facility that resulted in the extension of the maturity date from April 19, 2019 to June 30, 2019. On June 27, 2019, we entered into a second amendment of the 2018 Bank of America Credit Facility that extended the maturity date from June 30, 2019 to June 30, 2020.
As of June 30, 2019 and 2018, the total outstanding borrowings under the 2018 Bank of America Credit facility were $1.1 million and $67.3 million, respectively. The interest rates under the 2018 Bank of America Credit Facility as of June 30, 2019 and 2018 were 4.5% per annum and 4.75% per annum, respectively. As of June 30, 2019, a $3.2 million letter of credit was outstanding under the 2018 Bank of America Credit Facility. The balance of debt issuance costs outstanding were $0.3 million and $2.8 million as of June 30, 2019 and 2018, respectively. As of June 30, 2019, our available borrowing capacity under the 2018 Bank of America Credit Facility was $245.7 million, subject to the borrowing base limitation and compliance with other applicable terms.
CTBC Bank
In April 2016, we entered into a credit agreement with CTBC Bank Co., Ltd ("CTBC Bank") that provides for (i) a 12-month NTD $700.0 million ($21.6 million U.S. dollar equivalent) term loan facility secured by the land and building located in Bade, Taiwan with an interest rate equal to the lender's established NTD interest rate plus 0.25% per annum, which was adjusted monthly, the term loan facility also included a 12-month guarantee of up to NTD $100.0 million ($3.1 million U.S. dollar equivalent) with an annual fee equal to 0.50% per annum, and (ii) a 12-month revolving line of credit of up to 80.0% of eligible accounts receivable in an aggregate amount of up to $40.0 million with an interest rate equal to the lender's established USD interest rate plus 0.30% per annum, which was adjusted monthly (collectively, the “2016 CTBC Credit Facility”). The total borrowings allowed under the 2016 CTBC Credit Facility was capped at $40.0 million. We extended the 2016 CTBC Credit Facility to mature on May 31, 2017.
In May 2017, we renewed the 2016 CTBC Credit Facility, such that it provided for (i) a 12-month NTD $700.0 million ($23.0 million U.S. dollar equivalent) term loan facility secured by the land and building located in Bade, Taiwan with an interest rate equal to the lender's established NTD interest rate plus 0.25% per annum, which was adjusted monthly, which term loan facility also included a 12-month guarantee of up to NTD $100.0 million ($3.3 million U.S. dollar equivalent) with an annual fee equal to 0.5% per annum, and (ii) a 12-month revolving line of credit of up to 80.0% of eligible accounts receivable in an aggregate amount of up to $50.0 million with an interest rate equal to the lender's established USD interest rate plus an interest rate ranging from 0.40% to 0.45% per annum, which was adjusted monthly. The total borrowings allowed under the renewed 2016 CTBC Credit Facility were capped at $50.0 million. The 2016 CTBC Credit Facility was to mature on April 30, 2018 but prior to the maturity, we entered into the 2018 CTBC Credit Facility (defined below) with CTBC Bank in January 2018, which replaced the 2016 CTBC Credit Facility.
In January 2018, we entered into a credit agreement with CTBC Bank that provided for (i) a 12-month NTD $700.0 million ($23.6 million U.S. dollar equivalent) term loan facility secured by the land and building located in Bade, Taiwan with an interest rate equal to the lender's established NTD interest rate plus 0.25% per annum, which was adjusted monthly, which term loan facility also included a 12-month guarantee of up to NTD $100.0 million ($3.4 million U.S. dollar equivalent) with an annual fee equal to 0.50% per annum, and (ii) a 12-month NTD $1,500.0 million ($50.5 million U.S. dollar equivalent) term loan facility with an interest rate equal to the lender's established NTD interest rate plus 0.25% per annum, which was adjusted monthly (collectively, the “2018 CTBC Credit Facility”). The total borrowings allowed under the 2018 CTBC Credit Facility was initially capped at $50.0 million and in August 2018 was reduced to $40.0 million. In June 2019 prior to its maturity, the 2018 CTBC Credit Facility was replaced by the 2019 CTBC Credit Facility (defined below).
In June 2019, we entered into a credit agreement with CTBC Bank that provides for (i) a 12-month NTD $700.0 million ($22.5 million U.S. dollar equivalent) term loan facility secured by the land and building located in Bade, Taiwan with an interest rate equal to the lender's established NTD interest rate plus 0.25% per annum which is adjusted monthly, which term loan facility also includes a 12-month guarantee of up to NTD $100.0 million ($3.2 million U.S. dollar equivalent) with an annual fee equal to 0.50% per annum, (ii) a 180-day NTD $1,500.0 million ($48.2 million U.S. dollar equivalent) term loan facility up to 100% of eligible accounts receivable in an aggregate amount with an interest rate equal to the lender's established
48
NTD interest rate ranging from 0.30% to 0.50% per annum which is adjusted monthly, and (ⅲ) a 12-month revolving line of credit of up to 100% of eligible accounts receivable in an aggregate amount of up to $50.0 million with an interest rate equal to the lender's established USD interest rate plus an interest rate ranging from 0.30% to 0.50% per annum which is adjusted monthly (collectively, the “2019 CTBC Credit Facility”). The total borrowings allowed under the 2019 CTBC Credit Facility was capped at $50.0 million. The 2019 CTBC Credit Facility is to mature on June 30, 2020.
The total outstanding borrowings under the 2019 and 2018 CTBC Credit Facility term loans were denominated in NTD and remeasured into U.S. dollars of $22.5 million and $22.9 million at June 30, 2019 and 2018, respectively. At June 30, 2019, we did not have any outstanding balance under the 2019 CTBC Credit Facility revolving line of credit. As of June 30, 2018, the total outstanding borrowings under the 2018 CTBC Credit Facility revolving line of credit was $25.9 million in U.S. dollars. The interest rate for these loans were 0.93% per annum as of June 30, 2019 and 0.95% per annum as of June 30, 2018. At June 30, 2019, the amount available for future borrowing under the 2019 CTBC Credit Facility was $27.5 million. As of June 30, 2019, the net book value of land and building located in Bade, Taiwan collateralizing the 2019 CTBC Credit Facility term loan was $25.8 million.
Covenant Compliance
2018 Bank of America Credit Facility
The credit agreement with Bank of America related to the 2018 Bank of America Credit Facility contains customary representations and warranties and customary affirmative and negative covenants applicable to us and our subsidiaries. The credit agreement contains a financial covenant, which requires that we maintain a Fixed Charge Coverage Ratio, as defined in the agreement of at least 1.00 for each twelve-month period while a Trigger Period, as defined in the agreement, is in effect. We have been in compliance with all the covenants under the 2018 Bank of America Credit Facility.
On September 7, 2018, Bank of America issued an extension letter to us in connection with the 2018 Bank of America Credit Facility, which extended the delivery date of our audited consolidated financial statements, compliance certificates and other material reports for the fiscal year ended June 30, 2018 to January 31, 2019. On January 31, 2019, we entered into an amendment of the loan and security agreement with respect to the 2018 Bank of America Credit Facility to, among other matters, (a) extend the delivery date of our audited consolidated financial statements, compliance certificates and other material reports for the fiscal year ended June 30, 2018 to June 30, 2019, and (b) require the delivery, by no later than March 31, 2019 of our audited consolidated financial statements for the fiscal year ended June 30, 2019. In April 2019, we paid a fee to extend the delivery to June 30, 2019 of our audited consolidated financial statements for the fiscal year ended June 30, 2017. In connection with the second amendment of the 2018 Bank of America Credit Facility to extend the maturity of the 2018 Bank of America Credit Facility, we are required to deliver our audited consolidated financial statements for the fiscal year ended June 30, 2018 by December 31, 2019, and deliver our audited consolidated financial statements for the fiscal year ended June 30, 2019 by March 31, 2020. If we elect to deliver the audited consolidated financial statements for the fiscal years ended June 30, 2019 and 2018 together in a combined filing with the SEC, we are required to deliver our audited financial statements by March 31, 2020.
CTBC Bank
There are no financial covenants associated with the 2018 CTBC Credit Facility or the 2019 CTBC Credit Facility.
Share Repurchase Program
In July 2016, our Board of Directors adopted a program to repurchase from time to time at management’s discretion up to $100.0 million of our common stock in the open market or in private transactions during the next twelve months at prevailing market prices. In fiscal year 2017, we purchased 888,097 shares of our common stock in the open market at a weighted average price of $20.79 per share for approximately $18.5 million. Repurchases were made under the program using our cash on hand. The repurchase program ended in July 2017. Under the terms of the 2018 Bank of America Credit Facility, we are not permitted to repurchase our common stock.
Contractual Obligations
The following table describes our contractual obligations as of June 30, 2019:
49
Payments Due by Period | |||||||||||||||||||
Less Than 1 Year | 1 to 3 Years | 3 to 5 Years | More Than 5 Years | Total | |||||||||||||||
(in thousands) | |||||||||||||||||||
Operating leases | $ | 6,582 | $ | 6,270 | $ | 2,341 | $ | 2,279 | $ | 17,472 | |||||||||
Capital leases, including interest | 164 | 143 | 1 | — | 308 | ||||||||||||||
Debt, including interest (1) | 23,906 | — | — | — | 23,906 | ||||||||||||||
Purchase commitments (2) | 299,542 | 246 | — | — | 299,788 | ||||||||||||||
Total (3) | $ | 330,194 | $ | 6,659 | $ | 2,342 | $ | 2,279 | $ | 341,474 | |||||||||
__________________________
(1) | Amount reflects total anticipated cash payments, including anticipated interest payments based on the interest rates under our 2018 Bank of America Credit Facility and 2019 CTBC Credit Facility at June 30, 2019. |
(2) | Amount reflects total gross purchase commitments under our manufacturing arrangements with third-party contract manufacturers or vendors. See Part II, Item 8, Note 15, “Commitments and Contingencies” to the consolidated financial statements in this Annual Report for a discussion of purchase commitments. |
(3) | The table above excludes liabilities for deferred revenue of $203.4 million, $5.0 million of deferred gain related to our remaining performance obligations in association with the contribution of certain technology rights to a privately-held company located in China, and unrecognized tax benefits and related interest and penalties accrual of $20.1 million. Deferred revenue represents billed services in advance which include extended warranty, on-site technical support, and software maintenance. We have not provided a detailed estimate of the payment timing of unrecognized tax benefits due to the uncertainty of when the related tax settlements will become due. See Part II, Item 8, Note 14, “Income Taxes” to the consolidated financial statements in this Annual Report for a discussion of income taxes. |
We expect to fund our remaining contractual obligations from our ongoing operations and existing cash and cash equivalents on hand.
Recent Accounting Pronouncements
For a description of recent accounting pronouncements, including the expected dates of adoption and estimated effects, if any, on our consolidated financial statements, see Part II, Item 8, Note 1, “Organization and Summary of Significant Accounting Policies” to the consolidated financial statements in this Annual Report.
Off-Balance Sheet Arrangements
We do not have any off-balance sheet arrangements.
Quarterly Results of Operations
As described in the Explanatory Note, we are presenting our quarterly results of operations for the periods ended March 31, 2018, December 31, 2017 and September 30, 2017 herein, in lieu of filing separate Quarterly Reports on Form 10-Q for such periods.
Net Sales
The following table presents net sales by product type for the three months ended March 31, 2018 and 2017, December 31, 2017 and 2016, and September 30, 2017 and 2016 (dollars in millions):
50
Three months ended March 31, | Change | Three months ended December 31, | Change | Three months ended September 30, | Change | |||||||||||||||||||||||||||||||||||||||
2018 | 2017 | $ | % | 2017 | 2016 | $ | % | 2017 | 2016 | $ | % | |||||||||||||||||||||||||||||||||
Server and storage systems | $ | 669.1 | $ | 427.6 | $ | 241.5 | 56.5 | % | $ | 629.7 | $ | 456.1 | $ | 173.6 | 38.1 | % | $ | 542.4 | $ | 358.9 | $ | 183.5 | 51.1 | % | ||||||||||||||||||||
% of total net sales | 80.1 | % | 69.6 | % | 76.1 | % | 68.8 | % | 75.7 | % | 67.9 | % | ||||||||||||||||||||||||||||||||
Subsystems and accessories | 166.0 | 187.2 | (21.2 | ) | (11.3 | )% | $ | 197.3 | $ | 207.1 | $ | (9.8 | ) | (4.7 | )% | $ | 174.3 | $ | 169.9 | $ | 4.4 | 2.6 | % | |||||||||||||||||||||
% of total net sales | 19.9 | % | 30.4 | % | 23.9 | % | 31.2 | % | 24.3 | % | 32.1 | % | ||||||||||||||||||||||||||||||||
Total net sales | $ | 835.1 | $ | 614.8 | $ | 220.3 | 35.8 | % | $ | 827.0 | $ | 663.2 | $ | 163.8 | 24.7 | % | $ | 716.7 | $ | 528.8 | $ | 187.9 | 35.5 | % | ||||||||||||||||||||
The period-over-period substantial increase in our net sales in fiscal year 2018, as compared to fiscal year 2017, reflects our continued trend of concentrating our efforts on selling server and storage systems to larger customers such as internet data center and cloud computing and enterprise customers and a stronger industry-wide market for server and storage solutions.
Comparison of Three Months Ended March 31, 2018 and 2017
The period-over-period increase in server and storage systems sales was primarily due to an increase in the average selling price per compute node by approximately by 25% and an increase in the number of units of compute nodes shipped of approximately 22%. The period-over-period decrease in sales of subsystems and accessories was primarily due to a decrease in the volume of subsystems and accessories shipped of approximately 26%, offset by an increase in the average selling price per unit by approximately 11%.
Comparison of Three Months Ended December 31, 2017 and 2016
The period-over-period increase in server and storage systems sales was primarily due to an increase of average selling price per compute node by approximately 23% and an increase in the number of units of compute nodes shipped, of approximately 16%. The period-over-period decrease in sales of subsystems and accessories is primarily due to a decrease in the volume of subsystems and accessories shipped of approximately 18%, offset by an increase in the average selling price per unit by approximately 14%.
Comparison of Three Months Ended September 30, 2017 and 2016
The period-over-period increase in server and storage systems sales was primarily due to an increase of average selling price per compute node by approximately 43%. The increase in the average selling prices of our server and storage systems was primarily due to higher sales of our complete systems configured with higher density computing and more memory and storage capacity and as a result of the increases in the cost of memory and SSDs. The period-over-period increase in sales of subsystems and accessories is primarily due to an increase in the average selling price per unit by approximately 8%, offset by a decrease in the number of units shipped by approximately 8%.
The following table presents the percentages of net sales from products sold through our indirect sales channel and to our direct customers and OEMs for the three months ended March 31, 2018 and 2017, December 31, 2017 and 2016, and September 30, 2017 and 2016:
Three months ended March 31, | Change | Three months ended December 31, | Change | Three months ended September 30, | Change | |||||||||||||||||||||
2018 | 2017 | % | 2017 | 2016 | % | 2017 | 2016 | % | ||||||||||||||||||
Indirect sales channel | 42.8 | % | 46.6 | % | (3.8 | )% | 41.5 | % | 46.5 | % | (5.0 | )% | 47.3 | % | 50.7 | % | (3.4 | )% | ||||||||
Direct customers and OEMs | 57.2 | % | 53.4 | % | 3.8 | % | 58.5 | % | 53.5 | % | 5.0 | % | 52.7 | % | 49.3 | % | 3.4 | % | ||||||||
Total net sales | 100.0 | % | 100.0 | % | 100.0 | % | 100.0 | % | 100.0 | % | 100.0 | % | ||||||||||||||
The period-over-period decrease in net sales through our indirect sales channel as a percentage of total net sales in each of the three month periods presented in fiscal year 2018, as compared with the corresponding three month periods in fiscal year 2017 were primarily due to the lower sales of our subsystems and accessories. The period-over-period increase in net sales
51
to direct customers and OEMs as a percentage of total net sales in each of the three month periods presented in fiscal year 2018, as compared with the corresponding three month periods in fiscal year 2017 were primarily due to the increased volume of our server and storage systems to our internet data center and cloud, enterprise and OEM customers, in addition to higher average selling prices.
The following table presents percentages of net sales by geographic region for the three months ended March 31, 2018 and 2017, December 31, 2017 and 2016, and September 30, 2017 and 2016:
Three months ended March 31, | Change | Three months ended December 31, | Change | Three months ended September 30, | Change | |||||||||||||||||||||
2018 | 2017 | % | 2017 | 2016 | % | 2017 | 2016 | % | ||||||||||||||||||
United States | 54.5 | % | 56.4 | % | (1.9 | )% | 54.3 | % | 58.5 | % | (4.2 | )% | 57.6 | % | 58.9 | % | (1.3 | )% | ||||||||
Europe | 18.0 | % | 17.1 | % | 0.9 | % | 16.5 | % | 18.8 | % | (2.3 | )% | 14.8 | % | 20.3 | % | (5.5 | )% | ||||||||
Asia | 22.5 | % | 21.5 | % | 1.0 | % | 24.8 | % | 18.7 | % | 6.1 | % | 23.6 | % | 16.5 | % | 7.1 | % | ||||||||
Other | 5.0 | % | 5.0 | % | — | % | 4.4 | % | 4.0 | % | 0.4 | % | 4.0 | % | 4.3 | % | (0.3 | )% | ||||||||
Total net sales | 100.0 | % | 100.0 | % | 100.0 | % | 100.0 | % | 100.0 | % | 100.0 | % | ||||||||||||||
Comparison of Three Months Ended March 31, 2018 and 2017
The period-over-period decline in net sales in the United States as a percentage of total net sales was primarily due to higher sales growth of our server and storage systems in China, Taiwan, the Netherlands, United Kingdom and Germany as compared to the United States. The higher sales in Asia and Europe were due to the higher sales of our server and storage systems to our internet data center and cloud, enterprise and OEM customers.
Comparison of Three Months Ended December 31, 2017 and 2016
The period-over-period decline in net sales in the United States and Europe as a percentage of total net sales was primarily due to higher sales growth of our server and storage systems in Asia, particularly China and Taiwan as compared to the United States and Europe. The higher sales in Asia were due to the higher sales of our server and storage systems to our internet data center and cloud, enterprise and OEM customers.
Comparison of Three Months Ended September 30, 2017 and 2016
The period-over-period net sales in the United States, Europe and other countries declined as a percentage of total net sales primarily due to higher sales growth of our server and storage systems in Asia, particularly China and Taiwan as compared to the United States, Europe and other countries. The higher sales in Asia were due to the higher sales of our server and storage systems to our internet data center and cloud, enterprise and OEM customers.
The following table presents net sales by product type for the nine months ended March 31, 2018 and six months ended December 31, 2017 (dollars in millions):
Nine months ended March 31, | Change | Six months ended December 31, | Change | ||||||||||||||||||||||||||
2018 | 2017 | $ | % | 2017 | 2016 | $ | % | ||||||||||||||||||||||
Server and storage systems | $ | 1,841.2 | $ | 1,242.6 | $ | 598.6 | 48.2 | % | $ | 1,172.1 | $ | 815.0 | $ | 357.1 | 43.8 | % | |||||||||||||
% of total net sales | 77.4 | % | 68.8 | % | 75.9 | % | 68.4 | % | |||||||||||||||||||||
Subsystems and accessories | $ | 537.6 | $ | 564.2 | $ | (26.6 | ) | (4.7 | )% | $ | 371.6 | $ | 376.9 | $ | (5.3 | ) | (1.4 | )% | |||||||||||
% of total net sales | 22.6 | % | 31.2 | % | 24.1 | % | 31.6 | % | |||||||||||||||||||||
Total net sales | $ | 2,378.8 | $ | 1,806.8 | $ | 572.0 | 31.7 | % | $ | 1,543.7 | $ | 1,191.9 | $ | 351.8 | 29.5 | % | |||||||||||||
The period-over-period substantial increase in our net sales in fiscal year 2018, as compared to fiscal year 2017 for both the nine months ended March 31, 2019 and the six months ended December 31, 2018 reflects our continued focus on selling server and storage systems to larger customers such as internet data center and cloud computing and enterprise
52
customers, as well as higher average selling prices during a stronger industry-wide expanded market for server and storage solutions.
Comparison of Nine Months Ended March 31, 2018 and 2017
The period-over-period increase in server and storage systems sales was primarily due to an increase in the average selling price per compute node by approximately 30% and an increase in the number of units of compute nodes shipped by approximately 14%. The period-over-period decrease in sales of subsystems and accessories was primarily due to a decrease in the volume of subsystems and accessories shipped of approximately 17%, offset by an increase in the average selling price per unit by approximately 11%.
Comparison of Six Months Ended December 31, 2017 and 2016
The period-over-period increase in server and storage systems sales was primarily due to an increase in the average selling price per compute node by approximately 32% and an increase in the number of units of compute nodes shipped by approximately 10%. The period-over-period decrease in sales of subsystems and accessories was primarily due to a decrease in the volume of subsystems and accessories shipped by approximately 13%, offset by an increase in the average selling price per unit by approximately 11%.
The following table presents the percentages of net sales from products sold through our indirect sales channel and to our direct customers and OEMs for the nine months ended March 31, 2018 and six months ended December 31, 2017:
Nine months ended March 31, | Change | Six months ended December 31, | Change | ||||||||||||||
2018 | 2017 | % | 2017 | 2016 | % | ||||||||||||
Indirect sales channel | 43.7 | % | 47.8 | % | (4.1 | )% | 44.2 | % | 48.4 | % | (4.2 | )% | |||||
Direct customers and OEMs | 56.3 | % | 52.2 | % | 4.1 | % | 55.8 | % | 51.6 | % | 4.2 | % | |||||
Total net sales | 100.0 | % | 100.0 | % | 100.0 | % | 100.0 | % | |||||||||
The period-over-period decrease in net sales through our indirect sales channel as a percentage of total net sales in each of the nine and six month periods presented in fiscal year 2018, as compared with the corresponding nine and six month periods in fiscal year 2017 were primarily due to the lower sales of our subsystems and accessories. The period-over-period increase in net sales to direct customers and OEMs as a percentage of total net sales in each of the nine and six month periods presented in fiscal year 2018, as compared with the corresponding nine and six month periods in fiscal year 2017 were primarily due to the higher sales of server and storage systems to our internet data center, cloud computing, enterprise and OEM customers.
The following table presents percentages of net sales by geographic region for the nine months ended March 31, 2018 and six months ended December 31, 2017 :
Nine months ended March 31, | Change | Six months ended December 31, | Change | ||||||||||||||
2018 | 2017 | % | 2017 | 2016 | % | ||||||||||||
United States | 55.4 | % | 57.9 | % | (2.5 | )% | 55.8 | % | 58.7 | % | (2.9 | )% | |||||
Europe | 16.5 | % | 18.6 | % | (2.1 | )% | 15.8 | % | 19.4 | % | (3.6 | )% | |||||
Asia | 23.6 | % | 19.0 | % | 4.6 | % | 24.2 | % | 17.7 | % | 6.5 | % | |||||
Other | 4.5 | % | 4.5 | % | — | % | 4.2 | % | 4.2 | % | — | % | |||||
Total net sales | 100.0 | % | 100.0 | % | 100.0 | % | 100.0 | % | |||||||||
The period-over-period decline in net sales as a percentage of total net sales in the United States and Europe in each of the nine and six month periods presented in fiscal year 2018, as compared with the corresponding nine and six month periods in fiscal year 2017 were primarily due to higher sales growth of our server and storage systems in Asia, particularly China and Taiwan as compared to both the United States and Europe. The higher sales in Asia were attributable to the higher sales of our server and storage systems to our internet data center, cloud computing, enterprise and OEM customers.
53
Cost of Sales and Gross Margin
Cost of sales and gross margin for the three months ended March 31, 2018 and 2017, December 31, 2017 and 2016, and September 30, 2017 and 2016 are as follows (dollars in millions):
Three months ended March 31, | Change | Three months ended December 31, | Change | Three months ended September 30, | Change | |||||||||||||||||||||||||||||||||||||||
2018 | 2017 | $ | % | 2017 | 2016 | $ | % | 2017 | 2016 | $ | % | |||||||||||||||||||||||||||||||||
Cost of Sales | $ | 729.2 | $ | 529.5 | $ | 199.7 | 37.7 | % | $ | 721.3 | $ | 567.1 | $ | 154.2 | 27.2 | % | $ | 630.7 | $ | 446.2 | $ | 184.5 | 41.3 | % | ||||||||||||||||||||
Gross Profit | $ | 105.9 | $ | 85.3 | $ | 20.6 | 24.2 | % | $ | 105.7 | $ | 96.1 | $ | 9.6 | 10.0 | % | $ | 86.1 | $ | 82.6 | $ | 3.5 | 4.2 | % | ||||||||||||||||||||
Gross Margin | 12.7 | % | 13.9 | % | (1.2 | )% | 12.8 | % | 14.5 | % | (1.7 | )% | 12.0 | % | 15.6 | % | (3.6 | )% | ||||||||||||||||||||||||||
Comparison of Three Months Ended March 31, 2018 and 2017
The period-over-period increase in cost of sales was primarily attributable to an increase of $189.9 million in product cost reflecting higher key component prices and the increase in net sales volume, an increase of $2.0 million in personnel expenses, an increase of $2.5 million in other manufacturing related costs, an increase of $1.3 million of depreciation expense and an increase in other cost of sales of $4.0 million.
The period-over-period decrease in the gross margin percentage was primarily due to lower sales of our subsystems and accessories and higher sales of our server and storage systems, which reflected higher costs in key component sourcing due to component shortages partially offset by higher average selling prices per compute node. The period-over-period growth in net sales in Asia was higher in the three months ended March 31, 2018 which negatively impacted our gross margin due to more competitive pricing in Asia as compared to other regions.
Comparison of Three Months Ended December 31, 2017 and 2016
The period-over-period increase in cost of sales was primarily attributable to an increase of $149.3 million in product cost reflecting higher key component prices and the increase in net sales volume, an increase of $1.1 million in personnel expenses, an increase of $1.3 million in depreciation and an increase in other cost of sales of $2.5 million.
The period-over-period decrease in the gross margin percentage was primarily due to lower sales of our subsystems and accessories and higher sales of our server and storage systems, which reflected higher costs in key component sourcing due to component shortages, partially offset by higher average selling prices per compute node. The period-over-period growth in net sales in Asia was higher in the three months ended December 31, 2017 compared to the other major sales regions, this shift in sales mix negatively impacted our gross margin due to lower pricing in Asia as compared to other regions.
Comparison of Three Months Ended September 30, 2017 and 2016
The period-over-period increase in cost of sales was primarily attributable to an increase of $176.0 million in product cost reflecting higher key component prices and the increase in net sales volume, an increase of $3.5 million in overhead-related costs related to meeting increased demand, an increase of $1.1 million in personnel expenses, and an increase in other cost of sales of $3.9 million.
The period-over-period decrease in the gross margin percentage was primarily due to lower sales of our subsystems and accessories and higher sales of our server and storage systems, which reflected higher costs in key component sourcing due to component shortages, partially offset by higher average selling prices per compute node. The period-over-period growth in net sales in Asia was higher in the three months ended September 30, 2017, which negatively impacted our gross margin due to more competitive pricing in Asia as compared to other regions.
Cost of sales and gross margin for the nine months ended March 31, 2018 and six months ended December 31, 2017 are as follows (dollars in millions):
54
Nine months ended March 31, | Change | Six months ended December 31, | Change | ||||||||||||||||||||||||||
2018 | 2017 | $ | % | 2017 | 2016 | $ | % | ||||||||||||||||||||||
Cost of Sales | $ | 2,081.2 | $ | 1,542.7 | $ | 538.5 | 34.9 | % | $ | 1,352.0 | $ | 1,013.3 | $ | 338.7 | 33.4 | % | |||||||||||||
Gross Profit | $ | 297.7 | $ | 264.0 | $ | 33.7 | 12.8 | % | $ | 191.8 | $ | 178.7 | $ | 13.1 | 7.3 | % | |||||||||||||
Gross Margin | 12.5 | % | 14.6 | % | (2.1 | )% | 12.4 | % | 15.0 | % | (2.6 | )% | |||||||||||||||||
Comparison of Nine Months Ended March 31, 2018 and 2017
The period-over-period increase in cost of sales was primarily attributable to an increase of $515.2 million in product costs reflecting higher key component prices and the increase in net sales volume, an increase of $4.9 million in other manufacturing-related costs, an increase of $4.2 million in compensation and benefits, an increase of $3.2 million in depreciation, an increase of $6.0 million in overhead-related expenses to meet increased demand and an increase in other cost of sales of $5.0 million.
The period-over-period decrease in the gross margin percentage was primarily due to lower sales of our subsystems and accessories and higher sales of our server and storage systems, which reflected higher costs in key component sourcing due to component shortages partially offset by higher average selling prices per compute node. The period-over-period growth in net sales in Asia was higher in the nine months ended March 31, 2018 which negatively impacted our gross margin due to more competitive pricing in Asia as compared to other regions.
Comparison of Six Months Ended December 31, 2017 and 2016
The period-over-period increase in cost of sales was primarily attributable to an increase of $325.3 million in product costs reflecting higher key component prices and the increase in net sales volume, an increase of $2.2 million in compensation and benefits, an increase of $3.5 million in overhead-related expenses to meet increased demand, an increase of $1.9 million in depreciation and an increase in other cost of sales of $5.8 million.
The period-over-period decrease in the gross margin percentage was primarily due to lower sales of our subsystems and accessories and higher sales of our server and storage systems, which reflected higher costs in key component sourcing due to component shortages, partially offset by higher average selling prices per compute node. The period-over-period growth in net sales in Asia was higher in the six months ended December 31, 2017, which negatively impacted our gross margin due to more competitive pricing in Asia as compared to other regions.
Operating Expenses
Operating expenses for the three months ended March 31, 2018 and 2017, December 31, 2017 and 2016, and September 30, 2017 and 2016, are as follows (dollars in millions):
Three months ended March 31, | Change | Three months ended December 31, | Change | Three months ended September 30, | Change | |||||||||||||||||||||||||||||||||||||||
2018 | 2017 | $ | % | 2017 | 2016 | $ | % | 2017 | 2016 | $ | % | |||||||||||||||||||||||||||||||||
Research and development | $ | 42.3 | $ | 36.0 | $ | 6.3 | 17.5 | % | $ | 39.5 | $ | 35.4 | $ | 4.1 | 11.6 | % | $ | 40.7 | $ | 34.1 | $ | 6.6 | 19.4 | % | ||||||||||||||||||||
Percentage of total net sales | 5.1 | % | 5.9 | % | 4.8 | % | 5.3 | % | 5.7 | % | 6.4 | % | ||||||||||||||||||||||||||||||||
Sales and marketing | $ | 18.9 | $ | 16.2 | $ | 2.7 | 16.7 | % | $ | 18.0 | $ | 16.8 | $ | 1.2 | 7.1 | % | $ | 16.8 | $ | 15.2 | $ | 1.6 | 10.5 | % | ||||||||||||||||||||
Percentage of total net sales | 2.3 | % | 2.6 | % | 2.2 | % | 2.5 | % | 2.3 | % | 2.9 | % | ||||||||||||||||||||||||||||||||
General and administrative | $ | 23.6 | $ | 11.6 | $ | 12.0 | 103.4 | % | $ | 25.5 | $ | 10.4 | $ | 15.1 | 145.2 | % | $ | 19.3 | $ | 10.8 | $ | 8.5 | 78.7 | % | ||||||||||||||||||||
Percentage of total net sales | 2.7 | % | 1.9 | % | 3.1 | % | 1.6 | % | 2.7 | % | 2.0 | % | ||||||||||||||||||||||||||||||||
Total operating expenses | $ | 84.8 | $ | 63.8 | $ | 21.0 | 32.9 | % | $ | 83.0 | $ | 62.6 | $ | 20.4 | 32.6 | % | $ | 76.7 | $ | 60.1 | $ | 16.6 | 27.6 | % | ||||||||||||||||||||
Percentage of total net sales | 10.1 | % | 10.4 | % | 10.0 | % | 9.4 | % | 10.7 | % | 11.4 | % | ||||||||||||||||||||||||||||||||
Comparison of Three Months Ended March 31, 2018 and 2017
55
The period-over-period increase in research and development expenses was primarily due to an increase of $4.8 million in personnel expenses, and a decrease of $1.3 million in reimbursements received for certain research and development costs that we incur pursuant to joint development arrangements with certain of our suppliers and customers.
The period-over-period increase in sales and marketing expenses was primarily due to an increase of $1.9 million in personnel expenses and an increase of $0.8 million in advertising and promotion expenses driven by higher promotional expense associated with our net sales.
The period-over-period increase in general and administrative expenses was primarily due to an increase of $2.9 million in personnel expenses and an increase of $10.1 million in professional fees that were primarily incurred to investigate, assess and begin remediating the causes that led to the delay in filing our periodic reports with the SEC and the associated restatement of certain of our previously issued financial statements, offset by a decrease of $1.0 million in other individually insignificant general and administrative expenses.
Our personnel expenses increased in each of research and development, sales and marketing, and general and administrative expenses, primarily as a result of our annual compensation review and an increase in the number of personnel.
Comparison of Three Months Ended December 31, 2017 and 2016
The period-over-period increase in research and development expenses was primarily due to an increase of $6.3 million in personnel expenses, offset by a decrease of $2.2 million in product development costs.
The period-over-period increase in sales and marketing expenses was primarily due to an increase of $2.0 million in personnel expenses, offset by a decrease in advertising and promotion expenses driven by increased marketing rebates earned under market development arrangements with certain vendors.
The period-over-period increase in general and administrative expenses was primarily due to an increase of $2.8 million in personnel expenses and an increase of $12.3 million in professional fees that were primarily incurred to investigate, assess and begin remediating the causes that led to the delay in filing our periodic reports with the SEC and the associated restatement of certain of our previously issued financial statements.
Our personnel expenses increased in each of research and development, sales and marketing, and general and administrative expenses, primarily as a result of our annual compensation review as well as an increase in the number of personnel.
Comparison of Three Months Ended September 30, 2017 and 2016
The period-over-period increase in research and development expenses was primarily due to an increase of $5.1 million in personnel expenses, and an increase of $1.2 million in product development costs.
The period-over-period increase in sales and marketing expenses was primarily due to an increase of $1.8 million in personnel expenses.
The period-over-period increase in general and administrative expenses was primarily due to an increase of $3.2 million in personnel expenses and an increase of $6.7 million in professional fees that were primarily incurred to investigate, assess and begin remediating the causes that led to the delay in filing our periodic reports with the SEC and the associated restatement of certain of our previously issued financial statements. These increases were offset by a decrease of $0.8 million in other individually insignificant general and administrative expenses and a decrease of $0.7 million in the allowance for doubtful accounts.
Our personnel expenses increased in each of research and development, sales and marketing, and general and administrative expenses, primarily as a result of our annual compensation review as well as an increase in the number of personnel.
Operating expenses for the nine months ended March 31, 2018 and six months ended December 31, 2017 are as follows (dollars in millions):
56
Nine months ended March 31, | Change | Six months ended December 31, | Change | ||||||||||||||||||||||||||
2018 | 2017 | $ | % | 2017 | 2016 | $ | % | ||||||||||||||||||||||
Research and development | $ | 122.5 | $ | 105.6 | $ | 16.9 | 16.0 | % | $ | 80.2 | $ | 69.6 | $ | 10.6 | 15.2 | % | |||||||||||||
Percentage of total net sales | 5.1 | % | 5.8 | % | 5.2 | % | 5.8 | % | |||||||||||||||||||||
Sales and marketing | $ | 53.7 | $ | 48.2 | $ | 5.5 | 11.4 | % | $ | 34.8 | $ | 31.9 | $ | 2.9 | 9.1 | % | |||||||||||||
Percentage of total net sales | 2.3 | % | 2.7 | % | 2.3 | % | 2.7 | % | |||||||||||||||||||||
General and administrative | $ | 68.2 | $ | 32.8 | $ | 35.4 | 107.9 | % | $ | 44.7 | $ | 21.2 | $ | 23.5 | 110.8 | % | |||||||||||||
Percentage of total net sales | 2.9 | % | 1.8 | % | 2.9 | % | 1.8 | % | |||||||||||||||||||||
Total operating expenses | $ | 244.5 | $ | 186.6 | $ | 57.8 | 31.0 | % | $ | 159.7 | $ | 122.7 | $ | 37.0 | 30.2 | % | |||||||||||||
Percentage of total net sales | 10.3 | % | 10.3 | % | 10.3 | % | 10.3 | % | |||||||||||||||||||||
Comparison of Nine Months Ended March 31, 2018 and 2017
The period-over-period increase in research and development expenses was primarily due to an increase of $16.2 million in personnel expenses, a decrease of $1.3 million in reimbursements received for certain research and development costs that we incur pursuant to joint development arrangements with certain of our suppliers and customers, offset by a decrease of $1.0 million in product development costs.
The period-over-period increase in sales and marketing expenses was primarily due to an increase of $5.7 million in personnel expenses, offset by a decrease in other individually insignificant sales and marketing expenses.
The period-over-period increase in general and administrative expenses was primarily due to an increase of $8.9 million in personnel expenses, and an increase of $29.1 million in professional fees that were primarily incurred to investigate, assess and begin remediating the causes that led to the delay in filing our periodic reports with the SEC and the associated restatement of certain of our previously issued financial statements. These increases were offset by a decrease of $1.5 million in other individually insignificant general and administrative expenses, and a decrease of $1.0 million in allowance for doubtful accounts.
Our personnel expenses increased in each of research and development, sales and marketing, and general and administrative expenses, primarily as a result of our annual compensation review as well as an increase in the number of personnel.
Comparison of Six Months Ended December 31, 2017 and 2016
The period-over-period increase in research and development expenses was primarily due to an increase of $11.4 million in personnel expenses, offset by a decrease of $1.0 million in product development costs.
The period-over-period increase in sales and marketing expenses was primarily due to an increase of $3.8 million in personnel expenses, offset by a decrease in advertising and promotion expenses driven by increased marketing rebates earned under market development arrangements with certain vendors and a decrease in other individually insignificant sales and marketing expense.
The period-over-period increase in general and administrative expenses was primarily due to an increase of $6.0 million in personnel expenses, and an increase of $19.0 million in professional fees that were primarily incurred to investigate, assess and begin remediating the causes that led to the delay in filing our periodic reports with the SEC and the associated restatement of certain of our previously issued financial statements. These increases were offset by a decrease of $0.7 million in other individually insignificant general and administrative expenses, including a decrease of $0.8 million in the allowance for doubtful accounts.
Our personnel expenses increased in each of research and development, sales and marketing, and general and administrative expenses, primarily as a result of our annual compensation review as well as an increase in the number of personnel.
Interest and Other Income (Expense), Net
57
Interest and other income (expense), net for the three months ended March 31, 2018 and 2017, December 31, 2017 and 2016, and September 30, 2017 and 2016, are as follows (dollars in millions):
Three months ended March 31, | Change | Three months ended December 31, | Change | Three months ended September 30, | Change | |||||||||||||||||||||||||||||||||||||||
2018 | 2017 | $ | % | 2017 | 2016 | $ | % | 2017 | 2016 | $ | % | |||||||||||||||||||||||||||||||||
Other income (expense), net | $ | (0.4 | ) | $ | (1.5 | ) | $ | 1.1 | (73.3 | )% | $ | (0.4 | ) | $ | 0.7 | $ | (1.1 | ) | (157.1 | )% | $ | (0.8 | ) | $ | (0.4 | ) | $ | (0.4 | ) | 100.0 | % | |||||||||||||
Interest expense | (1.3 | ) | (0.6 | ) | (0.7 | ) | 116.7 | % | (1.1 | ) | (0.5 | ) | (0.6 | ) | 120.0 | % | (1.1 | ) | (0.3 | ) | (0.8 | ) | 266.7 | % | ||||||||||||||||||||
Interest and other income (expense), net | $ | (1.7 | ) | $ | (2.1 | ) | $ | 0.4 | $ | (1.5 | ) | $ | 0.2 | $ | (1.7 | ) | $ | (1.9 | ) | $ | (0.7 | ) | $ | (1.2 | ) | |||||||||||||||||||
Comparison of Three Months Ended March 31, 2018 and 2017
Interest and other expense, net remained largely consistent period-over-period.
Comparison of Three Months Ended December 31, 2017 and 2016
The period-over-period increase in interest and other income (expense), net was primarily due to an increase of $0.6 million in interest expense attributable to increased borrowings under our credit facilities to support our growth and an increase in foreign exchange losses of $1.1 million attributable to unfavorable foreign currency fluctuations.
Comparison of Three Months Ended September 30, 2017 and 2016
The period-over-period increase in interest and other expense, net was primarily due to an increase of $0.8 million in interest expense attributable to increased borrowings under our credit facilities to support our growth and an impairment recorded for an investment, offset by favorable foreign currency fluctuations.
Interest and other income (expense), net for the nine months ended March 31, 2018 and six months ended December 31, 2017 are as follows (dollars in millions):
Nine months ended March 31, | Change | Six months ended December 31, | Change | ||||||||||||||||||||||||||
2018 | 2017 | $ | % | 2017 | 2016 | $ | % | ||||||||||||||||||||||
Other income (expense), net | $ | (1.6 | ) | $ | (1.3 | ) | $ | (0.3 | ) | 23.1 | % | $ | (1.2 | ) | $ | 0.2 | $ | (1.4 | ) | (700.0 | )% | ||||||||
Interest expense | (3.5 | ) | (1.4 | ) | (2.1 | ) | 150.0 | % | (2.2 | ) | (0.8 | ) | (1.4 | ) | 175.0 | % | |||||||||||||
Interest and other income (expense), net | $ | (5.1 | ) | $ | (2.7 | ) | $ | (2.4 | ) | $ | (3.4 | ) | $ | (0.6 | ) | $ | (2.8 | ) | |||||||||||
Comparison of Nine Months Ended March 31, 2018 and 2017
The period-over-period increase in interest and other expense, net was primarily due to an increase of $2.1 million in interest expense attributable to increased borrowings under our credit facilities to support our growth.
Comparison of Six Months Ended December 31, 2017 and 2016
The period-over-period increase in interest and other income (expense), net was primarily due to an increase of $1.4 million in interest expense attributable to increased borrowings under our credit facilities to support our growth and an increase of $1.4 million primarily attributable to an impairment recorded for an investment and an increase in foreign exchange losses due to unfavorable foreign currency fluctuations.
Provision for Income Taxes
Provision for income taxes and effective tax rates for the three months ended March 31, 2018 and 2017, December 31, 2017 and 2016, and September 30, 2017 and 2016, are as follows (dollars in millions):
58
Three months ended March 31, | Change | Three months ended December 31, | Change | Three months ended September 30, | Change | |||||||||||||||||||||||||||||||||||||||
2018 | 2017 | $ | % | 2017 | 2016 | $ | % | 2017 | 2016 | $ | % | |||||||||||||||||||||||||||||||||
Income tax provision | $ | 4.2 | $ | 4.0 | $ | 0.2 | 5.0 | % | $ | 20.8 | $ | 10.8 | $ | 10.0 | 92.6 | % | $ | 0.7 | $ | 6.3 | $ | (5.6 | ) | (88.9 | )% | |||||||||||||||||||
Percentage of total net sales | 0.5 | % | 0.7 | % | 2.5 | % | 1.6 | % | 0.1 | % | 1.2 | % | ||||||||||||||||||||||||||||||||
Effective tax rate | 21.4 | % | 20.8 | % | 98.2 | % | 32.1 | % | 9.8 | % | 29.0 | % | ||||||||||||||||||||||||||||||||
Comparison of Three Months Ended March 31, 2018 and 2017
The period-over-period increase in the effective tax rate was primarily attributable to the benefit related to the release of certain tax reserves following the completion of an income tax audit in a foreign jurisdiction in the prior period.
Comparison of Three Months Ended December 31, 2017 and 2016
The period-over-period increase in the effective tax rate was primarily attributable to a $12.9 million one-time write down of U.S. deferred tax assets and liabilities, resulting from the U.S. federal corporate income tax rate decrease from 35% to 21%, and a U.S. federal one-time transition tax of $2.8 million, each in connection with the 2017 Tax Reform Act.
Comparison of Three Months Ended September 30, 2017 and 2016
The year-over-year decrease in the effective tax rate was primarily due to a reduction of the statutory tax rate from 28.1% to 21%, as a result of tax reform, and a prior year recording of a one-time $12.9 million write down of U.S. deferred tax assets and liabilities, and a one-time transition tax of $2.8 million, all as a result of the 2017 Tax Reform Act.
Provision for income taxes and effective tax rates for the nine months ended March 31, 2018 and six months ended December 31, 2017 are as follows (dollars in millions):
Nine months ended March 31, | Change | Six months ended December 31, | Change | ||||||||||||||||||||||||||
2018 | 2017 | $ | % | 2017 | 2016 | $ | % | ||||||||||||||||||||||
Income tax provision | $ | 25.7 | $ | 21.1 | $ | 4.6 | 21.8 | % | $ | 21.6 | $ | 17.1 | $ | 4.5 | 26.3 | % | |||||||||||||
Percentage of total net sales | 1.1 | % | 1.2 | % | 1.4 | % | 1.4 | % | |||||||||||||||||||||
Effective tax rate | 53.5 | % | 28.3 | % | 75.3 | % | 30.9 | % | |||||||||||||||||||||
Comparison of Nine Months Ended March 31, 2018 and 2017
The period-over-period increase in the effective tax rate was primarily attributable to a $12.9 million one-time write down of U.S. deferred tax assets and liabilities, resulting from the U.S. federal corporate income tax rate decrease from 35% to 21%, and a U.S. federal one-time transition tax of $2.8 million, each in connection with the 2017 Tax Reform Act.
Comparison of Six Months Ended December 31, 2017 and 2016
The period-over-period increase in the effective tax rate was primarily attributable to a $12.9 million one-time write down of U.S. deferred tax assets and liabilities, resulting from the U.S. federal corporate income tax rate decrease from 35% to 21%, and a U.S. federal one-time transition tax of $2.8 million, each in connection with the 2017 Tax Reform Act.
Quarterly Financial Information (Unaudited)
As described in the Explanatory Note, we are presenting our quarterly financial information for the periods ended March 31, 2018, December 31, 2017 and September 30, 2017 herein in lieu of filing separate Quarterly Reports on Form 10-Q for such periods.
59
SUPER MICRO COMPUTER, INC.
CONSOLIDATED BALANCE SHEETS (unaudited)
(in thousands, except share and per share amounts)
March 31, | December 31, | September 30 | June 30, | ||||||||||||
2018 | 2017 | 2017 | 2017 | ||||||||||||
ASSETS | |||||||||||||||
Current assets: | |||||||||||||||
Cash and cash equivalents | $ | 135,897 | $ | 129,214 | $ | 137,456 | $ | 110,606 | |||||||
Accounts receivable, net | 347,807 | 354,981 | 329,825 | 324,004 | |||||||||||
Inventories | 822,069 | 844,847 | 778,214 | 736,668 | |||||||||||
Prepaid expenses and other current assets | 115,012 | 112,581 | 98,584 | 89,888 | |||||||||||
Total current assets | 1,420,785 | 1,441,623 | 1,344,079 | 1,261,166 | |||||||||||
Investment in equity investee | 4,027 | 4,426 | 5,393 | 6,067 | |||||||||||
Property, plant and equipment, net | 197,561 | 199,002 | 197,760 | 195,576 | |||||||||||
Deferred income taxes, net | 28,461 | 27,136 | 39,191 | 39,119 | |||||||||||
Other assets | 13,907 | 15,036 | 13,202 | 13,202 | |||||||||||
Total assets | $ | 1,664,741 | $ | 1,687,223 | $ | 1,599,625 | $ | 1,515,130 | |||||||
LIABILITIES AND STOCKHOLDERS’ EQUITY | |||||||||||||||
Current liabilities: | |||||||||||||||
Accounts payable | $ | 411,116 | $ | 489,959 | $ | 414,458 | $ | 396,895 | |||||||
Accrued liabilities | 104,105 | 93,152 | 87,426 | 79,867 | |||||||||||
Income taxes payable | 4,742 | 7,736 | 4,312 | 1,364 | |||||||||||
Short-term debt, net of debt issuance costs | 186,284 | 177,650 | 179,857 | 161,447 | |||||||||||
Deferred revenue | 50,738 | 43,414 | 50,911 | 32,957 | |||||||||||
Total current liabilities | 756,985 | 811,911 | 736,964 | 672,530 | |||||||||||
Deferred revenue, non-current | 72,894 | 61,399 | 53,776 | 47,548 | |||||||||||
Other long-term liabilities | 21,810 | 20,899 | 20,750 | 21,206 | |||||||||||
Total liabilities | 851,689 | 894,209 | 811,490 | 741,284 | |||||||||||
Stockholders’ equity: | |||||||||||||||
Common stock and additional paid-in capital, $0.001 par value | |||||||||||||||
Authorized shares: 100,000,000 | |||||||||||||||
Issued shares: 50,808,161, 50,712,177, 50,623,630 and 50,273,527 at March 31, 2018, December 31, 2017, September 30, 2017 and June 30, 2017, respectively | 326,863 | 321,738 | 316,203 | 308,271 | |||||||||||
Treasury stock (at cost), 1,333,125 shares | (20,491 | ) | (20,491 | ) | (20,491 | ) | (20,491 | ) | |||||||
Accumulated other comprehensive income (loss) | 522 | 204 | 72 | (77 | ) | ||||||||||
Retained earnings | 505,997 | 491,402 | 492,185 | 485,973 | |||||||||||
Total Super Micro Computer, Inc. stockholders’ equity | 812,891 | 792,853 | 787,969 | 773,676 | |||||||||||
Noncontrolling interest | 161 | 161 | 166 | 170 | |||||||||||
Total stockholders’ equity | 813,052 | 793,014 | 788,135 | 773,846 | |||||||||||
Total liabilities and stockholders’ equity | $ | 1,664,741 | $ | 1,687,223 | $ | 1,599,625 | $ | 1,515,130 | |||||||
60
SUPER MICRO COMPUTER, INC.
CONSOLIDATED STATEMENTS OF OPERATIONS (unaudited)
(in thousands, except per share amounts)
Three Months Ended | |||||||
September 30, | |||||||
2017 | 2016 | ||||||
Net sales | $ | 716,737 | $ | 528,763 | |||
Cost of sales | 630,683 | 446,211 | |||||
Gross profit | 86,054 | 82,552 | |||||
Operating expenses: | |||||||
Research and development | 40,668 | 34,150 | |||||
Sales and marketing | 16,796 | 15,163 | |||||
General and administrative | 19,271 | 10,816 | |||||
Total operating expenses | 76,735 | 60,129 | |||||
Income from operations | 9,319 | 22,423 | |||||
Other expense, net | (796 | ) | (449 | ) | |||
Interest expense | (1,083 | ) | (330 | ) | |||
Income before income tax provision | 7,440 | 21,644 | |||||
Income tax provision | (726 | ) | (6,271 | ) | |||
Share of loss from equity investee, net of taxes | (635 | ) | — | ||||
Net income | $ | 6,079 | $ | 15,373 | |||
Net income per common share: | |||||||
Basic | $ | 0.12 | $ | 0.32 | |||
Diluted | $ | 0.12 | $ | 0.30 | |||
Weighted-average shares used in calculation of net income per common share: | |||||||
Basic | 49,097 | 48,165 | |||||
Diluted | 52,449 | 51,120 | |||||
61
SUPER MICRO COMPUTER, INC.
CONSOLIDATED STATEMENTS OF OPERATIONS (unaudited)
(in thousands, except per share amounts)
Three Months Ended | Six Months Ended | ||||||||||||||
December 31, | December 31, | ||||||||||||||
2017 | 2016 | 2017 | 2016 | ||||||||||||
Net sales | $ | 826,983 | $ | 663,200 | $ | 1,543,720 | $ | 1,191,963 | |||||||
Cost of sales | 721,289 | 567,064 | 1,351,972 | 1,013,275 | |||||||||||
Gross profit | 105,694 | 96,136 | 191,748 | 178,688 | |||||||||||
Operating expenses: | |||||||||||||||
Research and development | 39,544 | 35,458 | 80,212 | 69,608 | |||||||||||
Sales and marketing | 17,995 | 16,776 | 34,791 | 31,939 | |||||||||||
General and administrative | 25,460 | 10,381 | 44,731 | 21,197 | |||||||||||
Total operating expenses | 82,999 | 62,615 | 159,734 | 122,744 | |||||||||||
Income from operations | 22,695 | 33,521 | 32,014 | 55,944 | |||||||||||
Other (expense) income, net | (394 | ) | 690 | (1,190 | ) | 241 | |||||||||
Interest expense | (1,088 | ) | (497 | ) | (2,171 | ) | (827 | ) | |||||||
Income before income tax provision | 21,213 | 33,714 | 28,653 | 55,358 | |||||||||||
Income tax provision | (20,840 | ) | (10,838 | ) | (21,566 | ) | (17,109 | ) | |||||||
Share of loss from equity investee, net of taxes | (1,156 | ) | — | (1,791 | ) | — | |||||||||
Net (loss) income | $ | (783 | ) | $ | 22,876 | $ | 5,296 | $ | 38,249 | ||||||
Net (loss) income per common share: | |||||||||||||||
Basic | $ | (0.02 | ) | $ | 0.48 | $ | 0.11 | $ | 0.79 | ||||||
Diluted | $ | (0.02 | ) | $ | 0.44 | $ | 0.10 | $ | 0.74 | ||||||
Weighted-average shares used in calculation of net (loss) income per common share: | |||||||||||||||
Basic | 49,335 | 48,124 | 49,216 | 48,144 | |||||||||||
Diluted | 49,335 | 51,521 | 52,220 | 51,352 | |||||||||||
62
SUPER MICRO COMPUTER, INC.
CONSOLIDATED STATEMENTS OF OPERATIONS (unaudited)
(in thousands, except per share amounts)
Three Months Ended | Nine Months Ended | ||||||||||||||
March 31, | March 31, | ||||||||||||||
2018 | 2017 | 2018 | 2017 | ||||||||||||
Net sales | $ | 835,110 | $ | 614,798 | $ | 2,378,830 | $ | 1,806,761 | |||||||
Cost of sales | 729,193 | 529,461 | 2,081,165 | 1,542,736 | |||||||||||
Gross profit | 105,917 | 85,337 | 297,665 | 264,025 | |||||||||||
Operating expenses: | |||||||||||||||
Research and development | 42,284 | 36,017 | 122,496 | 105,625 | |||||||||||
Sales and marketing | 18,893 | 16,249 | 53,684 | 48,188 | |||||||||||
General and administrative | 23,555 | 11,546 | 68,286 | 32,743 | |||||||||||
Total operating expenses | 84,732 | 63,812 | 244,466 | 186,556 | |||||||||||
Income from operations | 21,185 | 21,525 | 53,199 | 77,469 | |||||||||||
Other expense, net | (388 | ) | (1,517 | ) | (1,578 | ) | (1,276 | ) | |||||||
Interest expense | (1,326 | ) | (558 | ) | (3,497 | ) | (1,385 | ) | |||||||
Income before income tax provision | 19,471 | 19,450 | 48,124 | 74,808 | |||||||||||
Income tax provision | (4,159 | ) | (4,023 | ) | (25,725 | ) | (21,132 | ) | |||||||
Share of loss from equity investee, net of taxes | (717 | ) | (77 | ) | (2,508 | ) | (77 | ) | |||||||
Net income | $ | 14,595 | $ | 15,350 | $ | 19,891 | $ | 53,599 | |||||||
Net income per common share: | |||||||||||||||
Basic | $ | 0.30 | $ | 0.32 | $ | 0.40 | $ | 1.11 | |||||||
Diluted | $ | 0.28 | $ | 0.30 | $ | 0.38 | $ | 1.04 | |||||||
Weighted-average shares used in calculation of net income per common share: | |||||||||||||||
Basic | 49,425 | 48,445 | 49,285 | 48,243 | |||||||||||
Diluted | 51,679 | 51,918 | 52,090 | 51,579 | |||||||||||
63
Related Party Transactions
Consolidated Balance Sheets (unaudited)
March 31, | December 31, | September 30, | June 30, | ||||||||||||
2018 | 2017 | 2017 | 2017 | ||||||||||||
ASSETS | |||||||||||||||
Accounts receivable, net | $ | 1,723 | $ | 4,834 | $ | 4,008 | $ | 6,877 | |||||||
Prepaid expenses and other current assets | 20,291 | 20,315 | 11,777 | 13,327 | |||||||||||
Total assets | $ | 22,014 | $ | 25,149 | $ | 15,785 | $ | 20,204 | |||||||
LIABILITIES | |||||||||||||||
Accounts payable | $ | 80,760 | $ | 74,257 | $ | 56,630 | $ | 55,928 | |||||||
Accrued liabilities | 17,066 | 15,060 | 11,316 | 8,450 | |||||||||||
Other long-term liabilities | 3,850 | 4,200 | 4,550 | 4,900 | |||||||||||
Total liabilities | $ | 101,676 | $ | 93,517 | $ | 72,496 | $ | 69,278 | |||||||
Consolidated Statements of Operations (unaudited)
Three Months Ended | |||||||
September 30, | |||||||
2017 | 2016 | ||||||
Net sales | $ | 11,929 | $ | 3,567 | |||
Cost of sales | 60,516 | 50,220 | |||||
Three Months Ended | Six Months Ended | ||||||||||||||
December 31, | December 31, | ||||||||||||||
2017 | 2016 | 2017 | 2016 | ||||||||||||
Net sales | $ | 16,656 | $ | 6,410 | $ | 28,585 | $ | 9,974 | |||||||
Cost of sales | 68,428 | 64,999 | 128,944 | 115,220 | |||||||||||
Three Months Ended | Nine Months Ended | ||||||||||||||
March 31, | March 31, | ||||||||||||||
2018 | 2017 | 2018 | 2017 | ||||||||||||
Net sales | $ | 17,614 | $ | 10,217 | $ | 46,199 | $ | 20,191 | |||||||
Cost of sales | 62,861 | 62,523 | 191,805 | 177,742 | |||||||||||
Item 7A. Quantitative and Qualitative Disclosure About Market Risk
Interest Rate Risk
The primary objectives of our investment activities are to preserve principal, provide liquidity and maximize income without significantly increasing the risk. Some of the securities we invest in are subject to market risk. This means that a change in prevailing interest rates may cause the fair value of the investment to fluctuate. To minimize this risk, we maintain our portfolio of cash equivalents and short-term investments in money market funds and certificates of deposit. Our investment in an auction rate security has been classified as non-current due to the lack of a liquid market for these securities. Since our results of operations are not dependent on investments, the risk associated with fluctuating interest rates is limited to our investment portfolio, and we believe that a 10% change in interest rates would not have a significant impact on our results of operations. As of June 30, 2019, our investments were in money market funds, certificates of deposits and auction rate securities.
64
We are exposed to changes in interest rates as a result of our borrowings under our term loan and revolving lines of credit. The interest rates for the term loans and the revolving lines of credit ranged from 0.93% to 4.50% at June 30, 2019 and 0.95% to 4.75% at June 30, 2018. Based on the outstanding principal indebtedness of $23.6 million under our credit facilities as of June 30, 2019, we believe that a 10% change in interest rates would not have a significant impact on our results of operations.
Foreign Currency Risk
To date, our international customer and supplier agreements have been denominated primarily in U.S. dollars and accordingly, we have limited exposure to foreign currency exchange rate fluctuations from customer agreements, and do not currently engage in foreign currency hedging transactions. The functional currency of our subsidiaries in the Netherlands and Taiwan is the U.S. dollar. However, certain transactions in these entities are denominated in a currency other than the U.S. dollar, and thus we are subject to foreign currency exchange rate fluctuations associated with re-measurement to U.S. dollars. Such fluctuations have not been significant historically. Foreign exchange gain (loss) for fiscal years 2019, 2018 and 2017 was $0.5 million, $(0.6) million and $(1.3) million, respectively.
65
Item 8. Financial Statements and Supplementary Data
INDEX TO CONSOLIDATED FINANCIAL STATEMENTS
Page | |
66
REPORT OF INDEPENDENT REGISTERED PUBLIC ACCOUNTING FIRM
To the Stockholders and the Board of Directors of Super Micro Computer, Inc.
Opinion on the Financial Statements
We have audited the accompanying consolidated balance sheets of Super Micro Computer, Inc. and subsidiaries (the "Company") as of June 30, 2019 and 2018, the related consolidated statements of operations, comprehensive income, stockholders' equity, and cash flows, for each of the three years in the period ended June 30, 2019, and the related notes (collectively referred to as the "financial statements"). In our opinion, the financial statements present fairly, in all material respects, the financial position of the Company as of June 30, 2019 and 2018, and the results of its operations and its cash flows for each of the three years in the period ended June 30, 2019, in conformity with accounting principles generally accepted in the United States of America.
We have also audited, in accordance with the standards of the Public Company Accounting Oversight Board (United States) (PCAOB), the Company's internal control over financial reporting as of June 30, 2019, based on criteria established in Internal Control - Integrated Framework (2013) issued by the Committee of Sponsoring Organizations of the Treadway Commission (COSO) and our report dated December 19, 2019, expressed an adverse opinion on the Company’s internal control over financial reporting because of material weaknesses.
Change in Accounting Principle
As discussed in Note 1 to the financial statements, effective July 1, 2018, the Company has changed its method of accounting for revenue due to adoption of Accounting Standards Codification Topic 606 (ASU No. 2014-09), Revenue from Contracts with Customers, and all subsequent amendments (collectively, “ASC 606”). The Company adopted ASC 606 using the modified retrospective approach.
Basis for Opinion
These financial statements are the responsibility of the Company's management. Our responsibility is to express an opinion on the Company's financial statements based on our audits. We are a public accounting firm registered with the PCAOB and are required to be independent with respect to the Company in accordance with the U.S. federal securities laws and the applicable rules and regulations of the Securities and Exchange Commission and the PCAOB.
We conducted our audits in accordance with the standards of the PCAOB. Those standards require that we plan and perform the audit to obtain reasonable assurance about whether the financial statements are free of material misstatement, whether due to error or fraud. Our audits included performing procedures to assess the risks of material misstatement of the financial statements, whether due to error or fraud, and performing procedures that respond to those risks. Such procedures included examining, on a test basis, evidence regarding the amounts and disclosures in the financial statements. Our audits also included evaluating the accounting principles used and significant estimates made by management, as well as evaluating the overall presentation of the financial statements. We believe that our audits provide a reasonable basis for our opinion.
Critical Audit Matters
The critical audit matters communicated below are matters arising from the current-period audit of the financial statements that were communicated or required to be communicated to the audit committee and that (1) relate to accounts or disclosures that are material to the financial statements and (2) involved our especially challenging, subjective, or complex judgments. The communication of critical audit matters does not alter in any way our opinion on the financial statements, taken as a whole, and we are not, by communicating the critical audit matters below, providing separate opinions on the critical audit matters or on the accounts or disclosures to which they relate.
Related Party Transactions - Variable Interest Entity Primary Beneficiary Determination - Refer to Note 1 to the financial statements
Critical Audit Matter Description
The Company has a variety of business relationships defined by various agreements with Ablecom Technology, Inc. (“Ablecom”) and its affiliate, Compuware Technology, Inc. ("Compuware"). Ablecom is one of the Company’s major contract manufacturers; Compuware is both a distributor of the Company’s products and a contract manufacturer for the Company.
67
Purchases from Ablecom and Compuware were $144.5 million and $139.6 million, respectively, for the fiscal year ended June 30, 2019. Net sales to Compuware as a distributor were $17.7 million for the fiscal year ended June 30, 2019.
The Company concluded that Ablecom and Compuware are variable interest entities (VIEs) and that it is not the primary beneficiary as it does not have the power to direct the activities that are most significant to Ablecom and Compuware. Therefore, the Company does not consolidate Ablecom and Compuware. The Company considered its explicit arrangements with Ablecom and Compuware, including its supplier arrangements, and as a result of the substantial related party relationships between the Company, Ablecom and Compuware, the Company also considered whether any implicit arrangements exist that would cause the Company to protect those related parties’ interests from suffering losses. The Company determined that no material implicit arrangements exist with Ablecom, Compuware, or their shareholders.
We identified management’s conclusion that it is not the primary beneficiary as a critical audit matter because of the judgments necessary for management to determine whether any explicit and implicit arrangements exist that would cause the Company to protect those related parties’ interest from absorbing losses, as well as the material weaknesses identified by the Company in all five components of Internal Control - Integrated Framework (2013) issued by COSO. This required extensive audit effort due to the complexity and variety of related party relationships with Ablecom and Compuware and required a high degree of auditor judgment when performing audit procedures to audit the Company’s conclusion that it is not the primary beneficiary.
How the Critical Audit Matter Was Addressed in the Audit
Our audit procedures related to management’s conclusion that it is not the primary beneficiary included the following, among others:
• | We evaluated and tested whether the arrangements are accurately considered and that arrangements have been included in the consideration by comparing those related parties we had identified during our audit procedures for proper inclusion in the Company’s evaluation and performed inspection of source documents on a sample basis. |
• | We tested management’s assertion that it does not have the power to direct the activities that are most significant to, or obligation to absorb the losses of, Ablecom and Compuware by reviewing all agreements and transactions between the parties. |
• | We obtained confirmations directly from Ablecom and Compuware regarding the nature of their business relationships with the Company, the extent of power, if any, held by the Company over the most significant activities of Ablecom and Compuware’s businesses, and the existence of any implicit arrangements that may have a bearing on the Company’s ability to have power over Ablecom and Compuware. |
As a result of the material weaknesses identified by the Company in all five components of Internal Control - Integrated Framework (2013) issued by COSO, we increased the extent of testing around the Company’s procedures for assessing whether the arrangements with Ablecom and Compuware are off market or whether they force Ablecom and Compuware to absorb losses. We also increased the extent of testing to determine if there are any agreements that provide the Company with power to direct the activities that are most significant to Ablecom and Compuware.
Inventories - Excess and Obsolescence Reserve - Refer to Notes 1 and 5 to the financial statements
Critical Audit Matter Description
The Company’s inventories are stated at weighted average cost, subject to lower of cost or net realizable value, and as necessary, the Company writes down the valuation of inventories for excess and obsolescence. The provision for excess and obsolete inventory for the fiscal year ended June 30, 2019, was $28.5 million.
We identified the excess and obsolescence reserve as a critical audit matter because of the judgments management makes to estimate the excess and obsolescence reserve, as well as the material weaknesses identified by the Company in all five components of Internal Control - Integrated Framework (2013) issued by COSO. This required a high degree of auditor judgment and an increased extent of effort when performing audit procedures to evaluate the methodology and the reasonableness of the excess and obsolescence reserve.
68
How the Critical Audit Matter Was Addressed in the Audit
Our audit procedures related to the Company’s excess and obsolescence reserve included the following procedures, among others:
• | We gained an understanding and evaluated the Company’s methodology for determining inventory that is excess or obsolete and the key assumptions and judgments made as part of the process. |
• | We evaluated the assumptions used by the Company to define what is considered aged inventory by assessing historical trends in the Company’s product life cycle as well as evaluating the underlying calculations applied to the aged inventory. |
• | We evaluated the inventory valuation utilizing the methodology above to assess the inventory reserve rate applied to different aging buckets. |
As a result of the Company’s material weaknesses identified by the Company in all five components of Internal Control - Integrated Framework (2013) issued by COSO, we increased the extent of testing on reports derived from the Company’s systems and applications.
Revenue - Refer to Note 3 to the financial statements
Critical Audit Matter Description
The Company recognizes revenue from sales of products as control is transferred to customers, which generally happens at the point of shipment or upon delivery, unless customer acceptance is uncertain. Revenue from distributors is recognized when the distributor obtains control of the product, which generally happens at the point of shipment or upon delivery, unless customer acceptance is uncertain. Net sales for the fiscal year ended June 30, 2019 was $3.5 billion, which principally consist of product sales.
We identified the timing of revenue recognition for product sales (i.e., whether the Company recorded product sales in the appropriate fiscal year) as a critical audit matter because of the material weaknesses identified by the Company associated with revenue recognition accounting controls and the material weaknesses in all five components of Internal Control - Integrated Framework (2013) issued by COSO. This made auditing the timing of revenue recognition for product sales more challenging and required an increased extent of audit effort, including the need for us to involve specialists and modify the nature and extent of our audit procedures and the evidence obtained.
How the Critical Audit Matter Was Addressed in the Audit
Our audit procedures related to the timing of revenue recognition for product sales included the following, among others:
• | We selected a sample of product sales from the period immediately preceding the Company’s fiscal year end and obtained the invoice, purchase order, customer contract or agreement, packing list, bill of lading, proof of delivery, and evidence of cash collection, in order to evaluate whether revenue was recognized in the appropriate fiscal year. |
• | We selected a sample of product sales for the year and obtained the related contract to identify whether customer acceptance clauses existed that delayed the timing of revenue recognition. |
• | We selected a sample of credit memos from the period immediately subsequent to the Company’s fiscal year end and obtained the credit memo and the related invoice, return merchandise authorization form, and shipping documents, as applicable and among others, to evaluate whether revenue was recognized in the fiscal year ended June 30, 2019 before control was transferred to the customer or customer acceptance was certain. |
• | We obtained and evaluated internal certifications provided by the Company’s employees related to sales transactions in order to identify the existence of side agreements that could impact the timing of revenue recognition. We also selected a sample of employees and conducted interviews to corroborate the accuracy and completeness of the information provided in the certifications. |
• | We selected a sample of the Company’s top customers and confirmed the terms and conditions of the master sales |
69
agreement or purchase orders directly with the customer.
As a result of the material weaknesses, among other modifications to the nature and extent of our audit procedures and the evidence obtained, we involved forensic specialists, increased the number of selections we would have otherwise made if the Company’s controls were designed and operating effectively. With the assistance of information technology and data analytics specialists, we also performed data extraction procedures to test the accuracy and completeness of the revenue information generated from the Company’s systems and applications.
/s/ Deloitte & Touche LLP
San Jose, California
December 19, 2019
We have served as the Company's auditor since fiscal 2003.
70
SUPER MICRO COMPUTER, INC.
CONSOLIDATED BALANCE SHEETS
(in thousands, except share and per share amounts)
June 30, | June 30, | ||||||
2019 | 2018 | ||||||
ASSETS | |||||||
Current assets: | |||||||
Cash and cash equivalents | $ | 248,164 | $ | 115,377 | |||
Accounts receivable, net of allowances of $8,906 and $1,945 at June 30, 2019 and 2018, respectively (including amounts receivable from related parties of $13,439 and $3,082 at June 30, 2019 and 2018, respectively) | 393,624 | 451,393 | |||||
Inventories | 670,188 | 853,252 | |||||
Prepaid expenses and other current assets (including receivables from related parties of $21,302 and $24,016 at June 30, 2019 and 2018, respectively) | 109,795 | 110,856 | |||||
Total current assets | 1,421,771 | 1,530,878 | |||||
Investment in equity investee | 1,701 | 2,376 | |||||
Property, plant and equipment, net | 207,337 | 196,631 | |||||
Deferred income taxes, net | 41,126 | 25,583 | |||||
Other assets | 10,659 | 14,037 | |||||
Total assets | $ | 1,682,594 | $ | 1,769,505 | |||
LIABILITIES AND STOCKHOLDERS’ EQUITY | |||||||
Current liabilities: | |||||||
Accounts payable (including amounts due to related parties of $59,809 and $77,810 at June 30, 2019 and 2018, respectively) | $ | 360,470 | $ | 527,158 | |||
Accrued liabilities (including amounts due to related parties of $10,536 and $18,394 at June 30, 2019 and 2018, respectively) | 114,678 | 102,478 | |||||
Income taxes payable | 13,021 | 7,191 | |||||
Short-term debt | 23,647 | 116,181 | |||||
Deferred revenue | 94,153 | 58,549 | |||||
Total current liabilities | 605,969 | 811,557 | |||||
Deferred revenue, non-current | 109,266 | 89,731 | |||||
Other long-term liabilities (including related party balance of $3,000 and $3,500 at June 30, 2019 and 2018, respectively) | 26,183 | 24,565 | |||||
Total liabilities | 741,418 | 925,853 | |||||
Commitments and contingencies (Note 15) | |||||||
Stockholders’ equity: | |||||||
Common stock and additional paid-in capital, $0.001 par value | |||||||
Authorized shares: 100,000,000 | |||||||
Issued shares: 51,289,413 and 50,914,571 at June 30, 2019 and 2018, respectively | 349,683 | 331,550 | |||||
Treasury stock (at cost), 1,333,125 shares at June 30, 2019 and 2018 | (20,491 | ) | (20,491 | ) | |||
Accumulated other comprehensive (loss) income | (80 | ) | 165 | ||||
Retained earnings | 611,903 | 532,271 | |||||
Total Super Micro Computer, Inc. stockholders’ equity | 941,015 | 843,495 | |||||
Noncontrolling interest | 161 | 157 | |||||
Total stockholders’ equity | 941,176 | 843,652 | |||||
Total liabilities and stockholders’ equity | $ | 1,682,594 | $ | 1,769,505 | |||
See accompanying notes to consolidated financial statements.
71
SUPER MICRO COMPUTER, INC.
CONSOLIDATED STATEMENTS OF OPERATIONS
(in thousands, except per share amounts)
Years Ended June 30, | |||||||||||
2019 | 2018 | 2017 | |||||||||
Net sales (including related party sales of $69,906, $68,637 and $33,821 in fiscal years 2019, 2018 and 2017, respectively) | $ | 3,500,360 | $ | 3,360,492 | $ | 2,484,929 | |||||
Cost of sales (including related party purchases of $276,843, $262,747, and $236,062 in fiscal years 2019, 2018 and 2017, respectively) | 3,004,838 | 2,930,498 | 2,134,971 | ||||||||
Gross profit | 495,522 | 429,994 | 349,958 | ||||||||
Operating expenses: | |||||||||||
Research and development | 179,907 | 165,104 | 143,992 | ||||||||
Sales and marketing | 77,154 | 71,579 | 66,445 | ||||||||
General and administrative | 141,228 | 98,597 | 44,646 | ||||||||
Total operating expenses | 398,289 | 335,280 | 255,083 | ||||||||
Income from operations | 97,233 | 94,714 | 94,875 | ||||||||
Other expense, net | (1,020 | ) | (773 | ) | (984 | ) | |||||
Interest expense | (6,690 | ) | (5,726 | ) | (2,300 | ) | |||||
Income before income tax provision | 89,523 | 88,215 | 91,591 | ||||||||
Income tax provision | (14,884 | ) | (38,443 | ) | (24,434 | ) | |||||
Share of loss from equity investee, net of taxes | (2,721 | ) | (3,607 | ) | (303 | ) | |||||
Net income | $ | 71,918 | $ | 46,165 | $ | 66,854 | |||||
Net income per common share: | |||||||||||
Basic | $ | 1.44 | $ | 0.94 | $ | 1.38 | |||||
Diluted | $ | 1.39 | $ | 0.89 | $ | 1.29 | |||||
Weighted-average shares used in calculation of net income per common share: | |||||||||||
Basic | 49,917 | 49,345 | 48,383 | ||||||||
Diluted | 51,716 | 52,151 | 51,679 | ||||||||
See accompanying notes to consolidated financial statements.
72
SUPER MICRO COMPUTER, INC.
CONSOLIDATED STATEMENTS OF COMPREHENSIVE INCOME
(in thousands)
Years Ended June 30, | |||||||||||
2019 | 2018 | 2017 | |||||||||
Net income | $ | 71,918 | $ | 46,165 | $ | 66,854 | |||||
Other comprehensive (loss) income, net of tax: | |||||||||||
Foreign currency translation (loss) gain | (245 | ) | 280 | 19 | |||||||
Net changes in unrealized loss on investments | — | (38 | ) | (11 | ) | ||||||
Total other comprehensive (loss) income | (245 | ) | 242 | 8 | |||||||
Total comprehensive income | $ | 71,673 | $ | 46,407 | $ | 66,862 | |||||
See accompanying notes to consolidated financial statements.
73
SUPER MICRO COMPUTER, INC.
CONSOLIDATED STATEMENTS OF STOCKHOLDERS’ EQUITY
(in thousands, except share amounts)
Common Stock and Additional Paid-In Capital | Treasury Stock | Accumulated Other Comprehensive (Loss) Income | Retained Earnings | Non-controlling Interest | Total Stockholders’ Equity | ||||||||||||||||||||||||
Shares | Amount | Shares | Amount | ||||||||||||||||||||||||||
Balance at June 30, 2016 | 48,999,717 | $ | 279,465 | (445,028 | ) | $ | (2,030 | ) | $ | (85 | ) | $ | 419,119 | $ | 184 | $ | 696,653 | ||||||||||||
Exercise of stock options, net of taxes | 1,007,065 | 10,878 | — | — | — | — | — | 10,878 | |||||||||||||||||||||
Release of common stock shares upon vesting of restricted stock units | 411,739 | — | — | — | — | — | — | — | |||||||||||||||||||||
Shares withheld for the withholding tax on vesting of restricted stock units | (144,994 | ) | (3,554 | ) | — | — | — | — | — | (3,554 | ) | ||||||||||||||||||
Purchase of treasury stock | — | — | (888,097 | ) | (18,461 | ) | — | — | — | (18,461 | ) | ||||||||||||||||||
Stock-based compensation | — | 19,665 | — | — | — | — | — | 19,665 | |||||||||||||||||||||
Tax benefit resulting from stock option and restricted stock unit transactions | — | 1,817 | — | — | — | — | — | 1,817 | |||||||||||||||||||||
Net changes in unrealized loss on investments, net of taxes | — | — | — | — | (11 | ) | — | — | (11 | ) | |||||||||||||||||||
Foreign currency translation gain | — | — | — | — | 19 | — | — | 19 | |||||||||||||||||||||
Net income (loss) | — | — | — | — | — | 66,854 | (14 | ) | 66,840 | ||||||||||||||||||||
Balance at June 30, 2017 | 50,273,527 | $ | 308,271 | (1,333,125 | ) | $ | (20,491 | ) | $ | (77 | ) | $ | 485,973 | $ | 170 | $ | 773,846 | ||||||||||||
Cumulative effect of adjustment from adoption of new accounting standard, net of taxes | — | 52 | — | — | — | 133 | — | 185 | |||||||||||||||||||||
Exercise of stock options, net of taxes | 267,970 | 3,043 | — | — | — | — | — | 3,043 | |||||||||||||||||||||
Release of common stock shares upon vesting of restricted stock units | 572,789 | — | — | — | — | — | — | — | |||||||||||||||||||||
Shares withheld for the withholding tax on vesting of restricted stock units | (199,715 | ) | (4,472 | ) | — | — | — | — | — | (4,472 | ) | ||||||||||||||||||
Stock-based compensation | — | 24,656 | — | — | — | — | — | 24,656 | |||||||||||||||||||||
Net changes in unrealized loss on investments, net of taxes | — | — | — | — | (38 | ) | — | — | (38 | ) | |||||||||||||||||||
Foreign currency translation gain | — | — | — | — | 280 | — | — | 280 | |||||||||||||||||||||
Net income (loss) | — | — | — | — | — | 46,165 | (13 | ) | 46,152 | ||||||||||||||||||||
Balance at June 30, 2018 | 50,914,571 | $ | 331,550 | (1,333,125 | ) | $ | (20,491 | ) | $ | 165 | $ | 532,271 | $ | 157 | $ | 843,652 | |||||||||||||
Cumulative effect of adjustment from adoption of new accounting standards, net of taxes | — | — | — | — | — | 7,714 | — | 7,714 | |||||||||||||||||||||
Release of common stock shares upon vesting of restricted stock units | 549,886 | — | — | — | — | — | — | — | |||||||||||||||||||||
Shares withheld for the withholding tax on vesting of restricted stock units | (175,044 | ) | (3,051 | ) | — | — | — | — | — | (3,051 | ) | ||||||||||||||||||
Stock-based compensation | — | 21,184 | — | — | — | — | — | 21,184 | |||||||||||||||||||||
Foreign currency translation loss | — | — | — | — | (245 | ) | — | — | (245 | ) | |||||||||||||||||||
Net income | — | — | — | — | — | 71,918 | 4 | 71,922 | |||||||||||||||||||||
Balance at June 30, 2019 | 51,289,413 | $ | 349,683 | (1,333,125 | ) | $ | (20,491 | ) | $ | (80 | ) | $ | 611,903 | $ | 161 | $ | 941,176 | ||||||||||||
See accompanying notes to consolidated financial statements.
74
SUPER MICRO COMPUTER, INC.
CONSOLIDATED STATEMENTS OF CASH FLOWS
(in thousands)
Years Ended June 30, | |||||||||||
2019 | 2018 | 2017 | |||||||||
OPERATING ACTIVITIES: | |||||||||||
Net income | $ | 71,918 | $ | 46,165 | $ | 66,854 | |||||
Reconciliation of net income to net cash provided by (used in) operating activities: | |||||||||||
Depreciation and amortization | 24,202 | 21,846 | 16,357 | ||||||||
Stock-based compensation expense | 21,184 | 24,656 | 19,665 | ||||||||
Excess tax benefits from stock-based compensation | — | — | (2,310 | ) | |||||||
Allowance (recoveries) for doubtful accounts | 7,058 | (96 | ) | 334 | |||||||
Provision for excess and obsolete inventories | 32,946 | 9,649 | 15,729 | ||||||||
Other | 733 | 909 | — | ||||||||
Impairment of investments | 2,661 | — | — | ||||||||
Share of loss from equity investee | 2,721 | 3,607 | 303 | ||||||||
Foreign currency exchange (gain) loss | (313 | ) | 171 | 1,274 | |||||||
Deferred income taxes, net | (17,100 | ) | 13,570 | (5,434 | ) | ||||||
Changes in operating assets and liabilities: | |||||||||||
Accounts receivable, net (including changes in related party balances of $(10,357), $3,795, and $(6,828) in fiscal years 2019, 2018, and 2017, respectively) | 85,027 | (127,082 | ) | (149,455 | ) | ||||||
Inventories | 119,314 | (126,232 | ) | (235,590 | ) | ||||||
Prepaid expenses and other assets (including changes in related party balances of $2,714, $(10,689), and $(3,705) in fiscal years 2019, 2018, and 2017, respectively) | 8,410 | (15,714 | ) | (2,856 | ) | ||||||
Accounts payable (including changes in related party balances of $(18,001), $21,882, and $10,987 in fiscal years 2019, 2018, and 2017, respectively) | (173,410 | ) | 132,533 | 135,320 | |||||||
Income taxes payable | 5,831 | 5,827 | (1,873 | ) | |||||||
Accrued liabilities (including changes in related party balances of $(7,858), $9,944, and $3,096 in fiscal years 2019, 2018, and 2017, respectively) | 11,456 | 23,238 | 17,329 | ||||||||
Deferred revenue | 59,800 | 67,775 | 31,236 | ||||||||
Other long-term liabilities (including changes in related party balances of $(500), $(1,400), and $4,900 in fiscal years 2019, 2018, and 2017, respectively) | 116 | 3,525 | (3,071 | ) | |||||||
Net cash provided by (used in) operating activities | 262,554 | 84,347 | (96,188 | ) | |||||||
INVESTING ACTIVITIES: | |||||||||||
Purchases of property, plant and equipment (including payments to related parties of $4,472, $6,005, and $4,570 in fiscal years 2019, 2018, and 2017, respectively) | (24,849 | ) | (24,824 | ) | (29,365 | ) | |||||
Proceeds from redemption of auction rate security | — | 1,000 | — | ||||||||
Investments in privately held companies | — | (2,100 | ) | — | |||||||
Net cash used in investing activities | (24,849 | ) | (25,924 | ) | (29,365 | ) | |||||
FINANCING ACTIVITIES: | |||||||||||
Proceeds from borrowings, net of debt issuance costs | 41,760 | 107,337 | 207,029 | ||||||||
Repayment of debt | (67,700 | ) | (220,299 | ) | (140,452 | ) | |||||
Net (repayment) borrowings on asset-backed revolving line of credit, net of costs | (65,945 | ) | 64,226 | — | |||||||
Payment of other fees for debt financing | (625 | ) | (414 | ) | — | ||||||
Advances under receivables financing arrangement | — | — | 227 | ||||||||
Proceeds from exercise of stock options | — | 3,043 | 10,878 | ||||||||
Excess tax benefits from stock-based compensation | — | — | 2,310 | ||||||||
Payments of obligations under capital leases | (267 | ) | (253 | ) | (253 | ) | |||||
Payment of withholding tax on vesting of restricted stock units | (3,051 | ) | (4,472 | ) | (3,554 | ) | |||||
Payments to acquire treasury stock | — | — | (18,461 | ) | |||||||
Net cash (used in) provided by financing activities | (95,828 | ) | (50,832 | ) | 57,724 | ||||||
Effect of exchange rate fluctuations on cash | (119 | ) | (6 | ) | (45 | ) | |||||
Net increase (decrease) in cash, cash equivalents, and restricted cash | 141,758 | 7,585 | (67,874 | ) | |||||||
Cash, cash equivalents and restricted cash at beginning of year | 120,382 | 112,797 | 180,671 | ||||||||
Cash, cash equivalents and restricted cash at end of year | $ | 262,140 | $ | 120,382 | $ | 112,797 | |||||
75
Supplemental disclosure of cash flow information: | |||||||||||
Cash paid for interest | $ | 3,861 | $ | 4,541 | $ | 2,082 | |||||
Cash paid for taxes, net of refunds | $ | 23,604 | $ | 14,734 | $ | 30,809 | |||||
Non-cash investing and financing activities: | |||||||||||
Equipment purchased under capital leases | $ | — | $ | — | $ | 314 | |||||
Unpaid property, plant and equipment purchases (including due to related parties of $1,609, $654 and $1,168 as of June 30, 2019, 2018 and 2017, respectively) | $ | 9,232 | $ | 2,285 | $ | 5,056 | |||||
Contribution of certain technology rights to equity investee | $ | 3,000 | $ | — | $ | 7,000 | |||||
See accompanying notes to consolidated financial statements.
76
SUPER MICRO COMPUTER, INC.
NOTES TO CONSOLIDATED FINANCIAL STATEMENTS
Note 1. Organization and Summary of Significant Accounting Policies
Organization
Super Micro Computer, Inc. (“Super Micro Computer”) was incorporated in 1993. Super Micro Computer is a global leader in server technology and green computing innovation. Super Micro Computer develops and provides high performance server and storage solutions based upon an innovative, modular and open-standard architecture. Super Micro Computer has operations primarily in the United States, the Netherlands, Taiwan, China and Japan.
Basis of Presentation
The accompanying consolidated financial statements have been prepared in accordance with generally accepted accounting principles in the United States of America (“U.S. GAAP”). The consolidated financial statements of Super Micro Computer include the accounts of Super Micro Computer and entities consolidated under the variable interest model or the voting interest model. Noncontrolling interests are not presented separately in the consolidated statements of operations, and consolidated statements of comprehensive income as the amounts are immaterial. All intercompany accounts and transactions of Super Micro Computer and its consolidated entities (collectively, the "Company") have been eliminated in consolidation. For equity investments over which the Company is able to exercise significant influence over the investee but does not control the investee, and is not the primary beneficiary of the investee’s activities are accounted for using the equity method. Investments in equity securities which do not have readily determinable fair values and for which the Company is not able to exercise significant influence over the investee are accounted for under the measurement alternative which is the cost minus impairment, if any, plus or minus changes resulting from observable price changes in orderly transactions for the identical or a similar securities of the same investee. Prior to July 1, 2018, investments for which the Company was not able to exercise significant influence over the investee were accounted for under the cost method.
Certain reclassifications have been made to the amounts for the fiscal year 2017 consolidated statement of operations and consolidated statement of cash flows in order to conform to the current year’s presentation.
Use of Estimates
U.S. GAAP requires management to make estimates and assumptions that affect the reported amounts of assets and liabilities and disclosure of contingent assets and liabilities at the date of the financial statements and the reported amounts of revenues and expenses during the reporting periods. Such estimates include, but are not limited to: allowances for doubtful accounts and sales returns, inventory valuation, useful lives of property, plant and equipment, product warranty accruals, stock-based compensation, impairment of investments and long-lived assets, and income taxes. The Company’s estimates are evaluated on an ongoing basis and changes in the estimates are recognized prospectively. Actual results could differ from those estimates.
Fair Value of Financial Instruments
The Company accounts for certain assets and liabilities at fair value, which is the price that would be received upon the sale of an asset or paid to transfer a liability in an orderly arms-length transaction between market participants. When measuring fair value, the Company takes into account the characteristics of the asset or liability that a market participant would consider when pricing the asset or liability at the measurement date. The Company considers one or more techniques for measuring fair value: market approach, income approach, and cost approach. The valuation techniques include inputs that are based on three different levels of observability to the market. The Company categorizes each of its fair value measurements in one of these three levels based on the lowest level input that is significant to the fair value measurement in its entirety. These levels are:
• | Level 1 - Unadjusted quoted prices in active markets that are accessible at the measurement date for identical, unrestricted assets or liabilities; |
• | Level 2 - Quoted prices in markets that are not active or financial instruments for which all significant inputs are observable, either directly or indirectly; and |
77
• | Level 3 - Prices or valuations that require inputs that are both significant to the fair value measurement and unobservable. |
Accounts receivable and accounts payable are carried at cost, which approximates fair value due to the short maturity of these instruments. Cash equivalents, certificates of deposit and investments in auction rate securities are carried at fair value. Short-term debt is carried at amortized cost, which approximates its fair value based on borrowing rates currently available to the Company for loans with similar terms.
Cash and Cash Equivalents
The Company considers all highly liquid instruments with an original maturity of three months or less from the date of purchase to be cash equivalents. Cash equivalents consist primarily of money market funds and certificates of deposit with original maturities of less than three months.
Restricted Cash and Cash Equivalents
Restricted cash is comprised of amounts held in bank accounts which are controlled by the lenders pursuant to the terms of certain debt agreements, certificates of deposit primarily related to leases and customs requirements, and money market accounts held in escrow pursuant to the Company’s workers’ compensation program. These restricted cash balances have been excluded from the Company's cash and cash equivalents balance.
Investments in Auction Rate Securities
The Company classifies its investments in auction rate securities ("auction rate securities") as non-current available-for-sale investments. The auction rate securities consist of municipal securities, which are debt securities. The Company uses discounted cash flow to estimate the fair value of any auction rate securities. These auction rate securities are recorded within other assets in the consolidated balance sheets at fair value. Unrealized gains and losses on auction rate securities are included as a component of accumulated other comprehensive (loss) income, net of tax.
Inventories
Inventories are stated at weighted average cost, subject to lower of cost or net realizable value. Net realizable value is the estimated selling price of our products in the ordinary course of business, less reasonably predictable costs of completion, disposal, and transportation. Inventories consist of purchased parts and raw materials (principally electronic components), work in process (principally products being assembled) and finished goods. The Company evaluates inventory on a quarterly basis for lower of cost or net realizable value and excess and obsolescence and, as necessary, writes down the valuation of units based upon the Company's forecasted usage and sales, anticipated selling price, product obsolescence and other factors. Once inventory is written down, its new value is maintained until it is sold or scrapped. Prior to July 1, 2017, inventories were stated at weighted-average cost, subject to lower of cost or market.
The Company receives various rebate incentives from certain suppliers based on its contractual arrangements, including volume-based rebates. The rebates earned are recognized as a reduction of cost of inventories and reduce the cost of sales in the period when the related inventory is sold.
Property, Plant and Equipment
Property, plant and equipment is recorded at cost and depreciated using the straight-line method over the estimated useful lives of the related assets as follows:
78
Software | 3 to 5 years |
Machinery and equipment | 3 to 7 years |
Furniture and fixtures | 5 years |
Buildings | 39 years |
Building improvements | Up to 20 years |
Land improvements | 15 years |
Leasehold improvements | Shorter of lease term or estimated useful life |
For assets acquired and financed under capital leases, the present value of the future minimum lease payments is recorded at the date of acquisition as property, plant and equipment with the corresponding amount recorded as a capital lease obligation, and the amortization is computed on a straight-line basis over the shorter of the lease term or estimated useful life.
Long-Lived Assets
The Company evaluates its long-lived assets for impairment whenever events or changes in circumstances indicate that the carrying amount of an asset may not be recoverable. When the sum of the undiscounted future net cash flows expected to result from the use of the asset and its eventual disposition is less than its carrying amount, an impairment loss would be measured based on the fair value of the asset compared to the carrying amount. No impairment charge for long-lived assets has been recorded in any of the periods presented.
Revenue Recognition
The Company’s revenue recognition policy and related disclosures are discussed in Note 3, “Revenue.”
Allowances for Doubtful Accounts
Customers are subjected to a credit review process that evaluates each customer’s financial position and ability to pay. On a quarterly basis, the Company makes estimates of its uncollectible accounts receivable by analyzing the aging of accounts receivable, history of bad debts, customer concentrations, customer-credit-worthiness, and current economic trends to evaluate the adequacy of the allowance for doubtful accounts. The Company's provision for (recovery of) bad debt was $7.1 million, $(0.1) million, and $0.3 million in fiscal years 2019, 2018 and 2017, respectively.
Cost of Sales
Cost of sales primarily consists of the costs of materials, contract manufacturing, in-bound shipping, personnel and related expenses including stock-based compensation, equipment and facility expenses, warranty costs and provision for lower of cost or net realizable value and excess and obsolete inventory.
Product Warranties
The Company offers product warranties ranging from 15 to 39 months against any defective products. These standard warranties are assurance type warranties and the Company does not offer any services beyond the assurance that the product will continue working as specified. Therefore, under recently adopted guidance, Revenue from Contracts with Customers, (“ASC 606”), these warranties are not considered separate performance obligations in the arrangement. Based on historical experience, the Company accrues for estimated returns of defective products at the time revenue is recognized. The Company monitors warranty obligations and may make revisions to its warranty reserve if actual costs of product repair and replacement are significantly higher or lower than estimated. Accruals for anticipated future warranty costs are charged to cost of sales and included in accrued liabilities and other long-term liabilities. Warranty accruals are based on estimates that are updated on an ongoing basis taking into consideration inputs such as new product introductions, changes in the volume of claims compared with the Company's historical experience, and the changes in the cost of servicing warranty claims. The Company accounts for the effect of such changes in estimates prospectively. The following table presents for the fiscal years ended June 30, 2019, 2018 and 2017, the reconciliation of the changes in accrued warranty costs which is included as a component of accrued liabilities and other long-term liabilities (in thousands):
79
Years Ended June 30, | |||||||||||
2019 | 2018 | 2017 | |||||||||
Balance, beginning of the year | $ | 9,884 | $ | 7,721 | $ | 7,129 | |||||
Provision for warranty | 22,991 | 20,868 | 21,642 | ||||||||
Costs utilized | (26,281 | ) | (19,904 | ) | (21,256 | ) | |||||
Change in estimated liability for pre-existing warranties | 4,440 | 1,199 | 206 | ||||||||
Balance, end of the year | $ | 11,034 | $ | 9,884 | $ | 7,721 | |||||
Current portion | 8,661 | 7,589 | 5,976 | ||||||||
Non-current portion | $ | 2,373 | $ | 2,295 | $ | 1,745 | |||||
Research and Development
Research and development expenses consist of personnel expenses including: salaries, benefits, stock-based compensation and incentive bonuses, and related expenses for our research and development personnel, as well as materials and supplies, consulting services, third-party testing services and equipment and facility expenses related to our research and development activities. All research and development costs are expensed as incurred. The Company occasionally receives funding from certain suppliers and customers towards its development efforts. Such amounts are recorded as a reduction of research and development expenses and were $2.8 million, $6.1 million, and $10.3 million for the fiscal years ended June 30, 2019, 2018 and 2017, respectively.
Software development costs, including costs to develop software sold, leased, or otherwise marketed, that are incurred subsequent to the establishment of technological feasibility are capitalized if significant. Costs incurred during the application development stage for internal-use software are capitalized if significant. Capitalized software development costs are amortized using the straight-line amortization method over the estimated useful life of the applicable software. Such software development costs required to be capitalized have not been material to date.
Advertising Costs
Advertising costs, net of reimbursements received under the cooperative marketing arrangements with the Company's vendors, are expensed as incurred. Total advertising and promotional expenses were $2.4 million, $3.5 million, and $5.4 million for the fiscal years ended June 30, 2019, 2018 and 2017, respectively.
Stock-Based Compensation
The Company measures and recognizes compensation expense for all share-based awards made to employees and non-employees, including stock options and restricted stock units ("RSUs"). The share-based awards granted to non-employees have not been material to date. The Company is required to estimate the fair value of share-based awards on the date of grant. The Company recognizes the grant date fair value of all share-based awards over the requisite service period and accounts for forfeitures as they occur. Prior to July 1, 2017, the Company estimated forfeitures and expensed the value of awards that were ultimately expected to vest over the requisite service periods. The fair value of RSUs with service conditions or performance conditions is based on the closing market price of the Company's common stock on the date of grant. The fair value for RSUs with service conditions, or time-based RSUs, is amortized on a straight-line basis over the requisite service period. The fair value for RSUs with performance conditions ("PRSUs") is recognized on a ratable basis over the requisite service period when it is probable the performance conditions of the awards will be met. The Company reassesses the probability of vesting at each reporting period and adjusts the total compensation expense of the award based on this probability assessment.
The Company estimates the fair value of stock options granted using a Black-Scholes option pricing model. This model requires the Company to make estimates and assumptions with respect to the expected term of the option and the expected volatility of the price of the Company's common stock. The expected term represents the period that the Company’s stock-based awards are expected to be outstanding and was determined based on the Company's historical experience. The expected volatility is based on the implied and historical volatility of the Company’s common stock. The fair value is then amortized on a straight-line basis over the requisite service periods of the awards, which is generally the vesting period.
80
Leases
Leases are evaluated and recorded as capital leases if one of the following is true at inception: (a) the present value of minimum lease payments meets or exceeds 90% of the fair value of the asset, (b) the lease term is greater than or equal to 75% of the economic life of the asset, (c) the lease arrangement contains a bargain purchase option, or (d) title to the property transfers to the Company at the end of the lease. The Company records an asset and liability for capital leases at present value of the minimum lease payments based on the incremental borrowing rate. Assets are depreciated over the useful life in accordance with the Company’s depreciation policy while rental payments and interest on the liability are accounted for using the effective interest method.
Leases that are not classified as capital leases are accounted for as operating leases. Operating lease agreements that have tenant improvement allowances are evaluated for lease incentives. For leases that contain escalating rent payments, the Company recognizes rent expense on a straight-line basis over the lease term, with any lease incentives amortized as a reduction of rent expense over the lease term.
Income Taxes
The Company accounts for income taxes under an asset and liability approach. Deferred income taxes reflect the impact of temporary differences between assets and liabilities recognized for financial reporting purposes and such amounts recognized for income tax reporting purposes, net operating loss carry-forwards and other tax credits measured by applying enacted tax laws related to the financial statement periods. Valuation allowances are provided when necessary to reduce deferred tax assets to an amount that is more likely than not to be realized.
The Company recognizes tax liabilities for uncertain income tax positions on the income tax return based on the two-step process. The first step is to determine whether it is more likely than not that each income tax position would be sustained upon audit. The second step is to estimate and measure the tax benefit as the amount that has a greater than 50% likelihood of being realized upon ultimate settlement with the tax authority. Estimating these amounts requires the Company to determine the probability of various possible outcomes. The Company evaluates these uncertain tax positions on a quarterly basis. This evaluation is based on the consideration of several factors, including changes in facts or circumstances, changes in applicable tax law, settlement of issues under audit and new exposures. If the Company later determines that its exposure is lower or that the liability is not sufficient to cover its revised expectations, the Company adjusts the liability and effects a related charge in its tax provision during the period in which the Company makes such a determination.
Variable Interest Entities
The Company determines at the inception of each arrangement whether an entity in which the Company holds an investment or in which the Company has other variable interests is considered a variable interest entity ("VIE"). The Company consolidates VIEs when it is the primary beneficiary. The primary beneficiary of a VIE is the party that meets both of the following criteria: (1) has the power to make decisions that most significantly affect the economic performance of the VIE and (2) has the obligation to absorb losses or the right to receive benefits that in either case could potentially be significant to the VIE. Periodically, the Company assesses whether any changes in the interest or relationship with the entity affect the determination of whether the entity is still a VIE and, if so, whether the Company is the primary beneficiary. If the Company is not the primary beneficiary in a VIE, the Company accounts for the investment or other variable interest in accordance with applicable GAAP.
The Company has concluded that Ablecom Technology, Inc. (“Ablecom”) and its affiliate, Compuware Technology, Inc. ("Compuware") are VIEs in accordance with applicable accounting standards and guidance; however, the Company is not the primary beneficiary as it does not have the power to direct the activities that are most significant to the entities and therefore, the Company does not consolidate these entities. In performing its analysis, the Company considered its explicit arrangements with Ablecom and Compuware, including the supplier arrangements. Also, as a result of the substantial related party relationships between the Company and these entities, the Company considered whether any implicit arrangements exist that would cause the Company to protect those related parties’ interests from suffering losses. The Company determined it has no material implicit arrangements with Ablecom, Compuware or their shareholders.
The Company and Ablecom jointly established Super Micro Asia Science and Technology Park, Inc. (the "Management Company") in Taiwan to manage the common areas shared by the Company and Ablecom for its separately constructed manufacturing facilities. In fiscal year 2012, each company contributed $0.2 million and owns 50% of the
81
Management Company. The Company has concluded that the Management Company is a VIE, and the Company is the primary beneficiary as it has the power to direct the activities that are most significant to the Management Company. For the fiscal years ended 2019, 2018 and 2017, the accounts of the Management Company have been consolidated with the accounts of Super Micro Computer, and a noncontrolling interest has been recorded for Ablecom's interest in the net assets and operations of the Management Company. Net income (loss) attributable to Ablecom's interest was not material for the periods presented and was included in general and administrative expenses in the Company's consolidated statements of operations.
Foreign Currency Transactions
The functional currency of the Company’s international subsidiaries is the U.S. dollar, with the exception of Super Micro Asia and Technology Park, Inc., a consolidated variable interest entity. Monetary assets and liabilities of the Company's international subsidiaries that are denominated in foreign currency are remeasured into U.S. dollars at period-end exchange rates. Non-monetary assets and liabilities that are denominated in the foreign currency are remeasured into U.S. dollars at the historical rates. Revenue and expenses that are denominated in the foreign currency are remeasured into U.S. dollars at the average exchange rates during the period. Remeasurement of foreign currency accounts and resulting foreign exchange transaction gains and losses, which have not been material, are reflected in the consolidated statements of operations in other expense, net.
The functional currency of Super Micro Asia and Technology Park, Inc. is New Taiwanese Dollar (“NTD$”). Assets and liabilities are translated to U.S. dollars at the period-end exchange rate. Revenues and expenses are translated using the average exchange rate for the period. The effects of foreign currency translation are included in stockholders’ equity as a component of accumulated other comprehensive (loss) income in the accompanying consolidated balance sheets and periodic movements are summarized as a line item in the consolidated statements of comprehensive income.
The functional currency of the Company's equity method investee is the local currency. Adjustments for the Company's share of the effects of foreign currency translation from local currency to U.S. dollars are recorded as increases or decreases to the carrying value of the investment and included in stockholders’ equity as a component of accumulated other comprehensive (loss) income in the accompanying consolidated balance sheets and periodic movements are summarized as a line item in the consolidated statements of comprehensive income.
Net Income Per Common Share
Basic net income per common share is computed by dividing net income by the weighted-average number of shares of common stock outstanding during the period. Diluted net income per common share is computed by dividing net income by the weighted-average number of shares of common stock outstanding during the period increased to include the number of additional shares of common stock that would have been outstanding if the potentially dilutive securities had been issued. Potentially dilutive securities include outstanding stock options and unvested RSUs. Contingently issuable shares are included in computing basic net income per common share as of the date that all necessary conditions, including service vesting conditions have been satisfied. Contingently issuable shares are considered for computing diluted net income per common share as of the beginning of the period in which all necessary conditions have been satisfied and the only remaining vesting condition is a service vesting condition.
Under the treasury stock method, an increase in the fair market value of the Company's common stock results in a greater dilutive effect from outstanding stock options and RSUs. Additionally, the exercise of stock options and the vesting of RSUs results in a further dilutive effect on net income per share.
The computation of basic and diluted net income per common share is as follows (in thousands, except per share amounts):
82
Years Ended June 30, | |||||||||||
2019 | 2018 | 2017 | |||||||||
Numerator: | |||||||||||
Net income | $ | 71,918 | $ | 46,165 | $ | 66,854 | |||||
Denominator: | |||||||||||
Weighted-average shares outstanding | 49,917 | 49,345 | 48,383 | ||||||||
Effect of dilutive securities | 1,799 | 2,806 | 3,296 | ||||||||
Weighted-average diluted shares | 51,716 | 52,151 | 51,679 | ||||||||
Basic net income per common share | $ | 1.44 | $ | 0.94 | $ | 1.38 | |||||
Diluted net income per common share | $ | 1.39 | $ | 0.89 | $ | 1.29 | |||||
For the fiscal years ended June 30, 2019, 2018 and 2017, the Company had stock options, RSUs and PRSUs outstanding that could potentially dilute basic earnings per share in the future, but were excluded from the computation of diluted net income per share in the periods presented, as their effect would have been anti-dilutive. The anti-dilutive common share equivalents resulting from outstanding equity awards were 3,758,000, 2,221,000, and 1,620,000 for the fiscal years ended June 30, 2019, 2018 and 2017, respectively.
Concentration of Supplier Risk
Certain materials used by the Company in the manufacture of its products are available from a limited number of suppliers. Shortages could occur in these materials due to an interruption of supply or increased demand in the industry. One supplier accounted for 21.8%, 26.0%, and 31.0% of total purchases for the fiscal years ended June 30, 2019, 2018 and 2017, respectively. Ablecom and Compuware, related parties of the Company as noted in Note 12, "Related Party Transactions", accounted for 9.2%, 9.0%, and 11.1% of total cost of sales for the fiscal years ended June 30, 2019, 2018 and 2017, respectively.
Concentration of Credit Risk
Financial instruments which potentially subject the Company to concentration of credit risk consist primarily of cash and cash equivalents, restricted cash, investment in an auction rate security and accounts receivable. No single customer accounted for 10% or more of the net sales in fiscal years 2019, 2018 and 2017. One customer accounted for 17.0% and 11.6% of accounts receivable, net as of June 30, 2019 and 2018, respectively.
Accounting Pronouncements Recently Adopted
In May 2014, the Financial Accounting Standards Board (“FASB”) issued new accounting guidance, ASC 606, that supersedes nearly all U.S. GAAP on revenue recognition and eliminates industry-specific guidance. ASC 606 provides a unified model in determining when and how revenue is recognized with the core principle that revenue should be recognized when a customer obtains control of promised goods or services in an amount that reflects the consideration to which the entity expects to be entitled in exchange for those goods or services. Since its issuance, the FASB has issued several amendments to ASC 606. The Company adopted ASC 606 on July 1, 2018 using the modified retrospective method. In connection with the adoption of ASC 606, the Company recorded a transition adjustment to increase retained earnings by $6.8 million as of July 1, 2018. The comparative information has not been recast and continues to be reported under the accounting standards in effect for those periods.
The primary impact of the adoption of ASC 606 was the acceleration of revenue recognition for (i) sales to distributors where the Company previously accounted for such sales on a sell-through basis and (ii) software arrangements. The following tables summarize the impacts of the adoption of ASC 606 on the Company’s consolidated financial statements. The adoption of ASC 606 did not have any impact on the net cash provided by operating activities.
Selected Captions from the Consolidated Balance Sheet as of June 30, 2019 (in thousands)
83
As Reported | Adjustments | Balances without adoption of ASC 606 | |||||||||
ASSETS | |||||||||||
Accounts receivable, net of allowances | $ | 393,624 | $ | (21,404 | ) | $ | 372,220 | ||||
Inventories | 670,188 | 14,823 | 685,011 | ||||||||
Prepaid expenses and other current assets | 109,795 | (2,478 | ) | 107,317 | |||||||
Deferred income taxes, net | 41,126 | 1,131 | 42,257 | ||||||||
LIABILITIES AND STOCKHOLDERS' EQUITY | |||||||||||
Accrued liabilities | $ | 114,678 | $ | (6,392 | ) | $ | 108,286 | ||||
Deferred revenue | 94,153 | 2,611 | 96,764 | ||||||||
Income taxes payable | 13,021 | (831 | ) | 12,190 | |||||||
Deferred revenue, non-current | 109,266 | 3,992 | 113,258 | ||||||||
Retained earnings | 611,903 | (7,308 | ) | 604,595 | |||||||
Selected Captions from the Consolidated Statement of Operations for the year ended June 30, 2019 (in thousands)
As reported | Adjustments | Balances without adoption of ASC 606 | |||||||||
Net sales | $ | 3,500,360 | $ | 12,591 | $ | 3,512,951 | |||||
Cost of sales | 3,004,838 | 15,981 | 3,020,819 | ||||||||
Gross profit | 495,522 | (3,390 | ) | 492,132 | |||||||
General and administrative | 141,228 | (2,491 | ) | 138,737 | |||||||
Income before income tax provision | 89,523 | (899 | ) | 88,624 | |||||||
Income tax provision | 14,884 | (404 | ) | 14,480 | |||||||
Net income | 71,918 | (495 | ) | 71,423 | |||||||
In July 2015, the FASB issued an amendment to the accounting guidance, Inventory: Simplifying the Measurement of Inventory. The amendment requires entities to measure inventory at the lower of cost and net realizable value thereby simplifying the existing guidance under which an entity must measure inventory at the lower of cost or market. The Company adopted the accounting guidance on July 1, 2017. The effect of the adoption had no impact on the consolidated financial statements and related disclosures.
In January 2016, the FASB issued new guidance, Financial Instruments - Overall: Recognition and Measurement of Financial Assets and Financial Liabilities. This guidance changes the accounting for equity investments, financial liabilities under the fair value option, and the presentation and disclosure requirements for financial instruments. The most significant impact of this accounting standard update is that it requires the remeasurement of equity investments not accounted for under the equity method to be recorded at fair value through the consolidated statement of operations at the end of each reporting period. The Company adopted this accounting standard update as of July 1, 2018. The result of the adoption did not have a material impact on the consolidated financial statements. As a result of the adoption of the new standard, the Company’s equity investments are accounted for as follows:
• | Marketable equity securities that have a readily determinable fair value are measured and recorded at fair value. |
• | Non-marketable equity securities that do not have a readily determinable fair value and for which the Company does not control the investee nor is it able to exert significant influence over the investee are measured using a measurement alternative recorded at cost less any impairment, plus or minus changes resulting from qualifying observable price changes. |
84
• | Equity method investments are equity securities for which the Company does not control the investee but is able to exert significant influence over the investee. These investments are measured at cost less any impairment, plus or minus the Company's share of equity method investee income or loss. |
In March 2016, the FASB issued new accounting guidance, Compensation-Stock Compensation: Improvements to Employee Share-Based Payment Accounting on the accounting for certain aspects of share-based payment to employees, including the accounting for income taxes, forfeitures, and statutory tax withholding requirements as well as classification in the statement of cash flows. Early adoption is permitted for any interim or annual periods. The Company adopted the accounting guidance on July 1, 2017 that resulted in the recognition of excess tax benefits in the Company's provision for income taxes rather than paid-in capital, as well as the adjustment in stock-based compensation expense as a result of its change in forfeiture policy. The new guidance eliminated the requirement to delay the recognition of excess tax benefits until it reduces current taxes payable. The new guidance also requires the Company to record, subsequent to the adoption, excess tax benefits and tax deficiencies in the period these arise. As a result of the adoption, the Company recorded a reduction in income tax payable of $0.2 million, an increase in common stock and additional paid-in capital of $0.1 million and an increase in retained earnings of $0.1 million.
In March 2016, the FASB issued new accounting guidance Investments - Equity Method and Joint Ventures: Simplifying the Transition to Equity Method of Accounting. The amendments in this update eliminate the requirement that an entity retroactively adopt the equity method of accounting if an investment qualifies for use of the equity method as a result of increase in ownership interest or degree of influence. In accordance with the amendments, an equity method investor will begin to apply the equity method when the investor obtains significant influence without having to retroactively adjust the investment and record a cumulative catch up for the years when the investment did not qualify for the equity method of accounting. The Company adopted the accounting guidance on July 1, 2017. The result of the adoption had no impact on the consolidated financial statements and related disclosures.
In August 2016, the FASB issued an amendment to the accounting guidance, Statement of Cash Flows: Classification of Certain Cash Receipts and Cash Payments. This amendment consists of eight provisions that provide guidance on the classification of certain cash receipts and cash payments. If practicable, this amendment should be applied using a retrospective transition method to each period presented. For the provisions that are impracticable to apply retrospectively, those provisions may be applied prospectively as of the earliest date practicable. The Company adopted the accounting guidance on July 1, 2018. The result of the adoption did not have a material impact on the consolidated statements of cash flows.
In October 2016, the FASB issued an amendment to the accounting guidance, Intra-Entity Transfers of Assets Other Than Inventory. This amendment simplifies the accounting for income tax consequences of intra-entity transfers of assets other than inventory by requiring recognition of current and deferred income tax consequences when such transfers occur. The Company adopted the accounting guidance on July 1, 2018. The result of the adoption did not have a material impact on the consolidated financial statements and related disclosures.
In November 2016, the FASB issued an amendment to the accounting guidance, Statement of Cash Flows: Restricted Cash. This amendment addresses presentations of total cash, cash equivalents, and amounts generally described as restricted cash or restricted cash equivalents. Amounts generally described as restricted cash and restricted cash equivalents should be included with cash and cash equivalents when reconciling the beginning-of-period and end-of-period total amounts shown on the statement of cash flows. The Company adopted the accounting guidance on July 1, 2018 using a retrospective transition method to each period presented. The adoption did not have a material impact on the consolidated statements of cash flows. Presentation of prior period information has been retrospectively adjusted.
In February 2017, the FASB issued new accounting guidance, Other Income-Gains and Losses from the Derecognition of Nonfinancial Assets: Clarifying the Scope of Asset Derecognition Guidance and Accounting for Partial Sales of Nonfinancial Assets. This guidance clarifies the scope and application on the sale or transfer of nonfinancial assets and in substance nonfinancial assets to noncustomers, including partial sales. The Company adopted this guidance on July 1, 2018. Prior to adoption, the Company had previously contributed certain technology rights in exchange for 30% ownership in a privately-held company (the “Corporate Venture”) and accounted for the transaction in accordance with the guidance related to exchanges of a nonfinancial asset for a noncontrolling ownership interest in ASC 845 - Nonmonetary Transactions, which has been eliminated by the new guidance. As a result of the adoption of the new guidance, the Company recognized
85
$3.0 million increase in the carrying value of the equity-method investment, a $2.1 million increase in deferred gain, and a $0.9 million increase in retained earnings.
In August 2018, the Securities and Exchange Commission (“SEC”) adopted amendments to certain disclosure requirements in Securities Act Release No. 33-10532, Disclosure Update and Simplification. The amendments became effective on November 5, 2018. The SEC staff subsequently indicated that it would not object if a filer’s first presentation of changes in stockholders’ equity is included in its Form 10-Q for the quarter that begins after the final rule’s effective date. Among the amendments is the requirement to present the changes in stockholders’ equity in the interim financial statements (either in a separate statement or footnote) in Quarterly Reports on Form 10-Q. The analysis should present a reconciliation of the beginning balance to the ending balance of each period for which a consolidated statement of operations is required to be filed. The Company adopted this guidance in the first quarter of fiscal year 2019, and presented the changes in stockholders’ equity in the Company’s Quarterly Reports on Form 10-Q for the first, second, and third quarters of fiscal year 2019.
Accounting Pronouncements Not Yet Adopted
In February 2016, the FASB issued an amendment to the accounting guidance, Leases. The amendment will supersede the existing lease guidance, including on-balance sheet recognition of operating leases for lessees. Since its issuance, the FASB has issued several amendments to the new lease standard. The standard is effective for the Company from July 1, 2019 and the Company will apply this standard using the modified retrospective approach and will not restate prior comparative periods. The Company will elect the “package of practical expedients” under the transition guidance of the new standard, which permits it not to reassess under the new standard its prior conclusions about lease identification, lease classification and initial direct costs, for leases that are in effect as of the date of adoption of the new lease guidance. While the Company is currently finalizing its implementation of new policies, processes and internal controls to comply with the new rules, it is anticipated that the adoption of the new standard will result in the recognition of right-of-use assets and lease liabilities on the Company’s consolidated balance sheet of $14.8 million and $15.2 million, respectively, as of July 1, 2019, primarily related to real estate leases. The adoption of the new standard will not have a material impact on the Company’s consolidated statement of operations or consolidated statement of cash flows.
In June 2016, the FASB issued authoritative guidance, Financial Instruments-Credit Losses: Measurement of Credit Losses on Financial Instruments, that amends the impairment model for certain financial assets by requiring the use of an expected loss methodology, which will result in more timely recognition of credit losses. The amendment is effective for the Company from July 1, 2020. Early adoption is permitted. The Company is currently evaluating the effect the guidance will have on its consolidated financial statement disclosures, results of operations and financial position.
In February 2018, the FASB issued Income Statement - Reporting Comprehensive Income: Reclassification of Certain Tax Effects from Accumulated Other Comprehensive Income, which allows companies to reclassify stranded tax effects resulting from the Tax Cuts and Jobs Act ("2017 Tax Reform Act"), from accumulated other comprehensive income to retained earnings. The guidance also requires certain new disclosures regardless of the election and is effective for the Company from July 1, 2019. The adoption of the guidance will not have a material impact on its consolidated financial statements.
In June 2018, the FASB issued amended guidance to expand the scope of ASC 718 - Compensation-Stock Compensation, to include share-based payment transactions for acquiring goods and services from non-employees. The amendments specify that the guidance applies to all share-based payment transactions in which a grantor acquires goods or services to be used or consumed in a grantor’s own operations by issuing share-based payment awards. The new amendment is effective for the Company from July 1, 2019. The adoption of the new standard will not have a material impact on its consolidated financial statements and related disclosures.
In August 2018, the FASB issued amended guidance, Fair Value Measurement: Disclosure Framework-Changes to the Disclosure Requirements for Fair Value Measurement, to modify the disclosure requirements on fair value measurements based on the concepts in the Concepts Statement, including the consideration of costs and benefits. The new standard is effective for the Company from July 1, 2020. The Company is currently evaluating the effect the guidance will have on its consolidated financial statement disclosures.
In August 2018, the FASB issued amended guidance to align the requirements for capitalizing implementation costs incurred in a hosting arrangement that is a service contract with the requirements for capitalizing implementation costs
86
incurred to develop or obtain internal-use software (and hosting arrangements that include an internal use software license). The accounting for the service element of a hosting arrangement that is a service contract is not affected by the amendments. According to the amendments, the entity shall determine which implementation costs to capitalize as an asset related to the service contract and which costs to expense. It requires the entity (customer) to expense the capitalized implementation costs of a hosting arrangement that is a service contract over the term of the hosting arrangement. The new standard is effective for the Company from July 1, 2020. The Company is currently evaluating the effect the guidance will have on its consolidated financial statement disclosures, results of operations and financial position.
Note 2. Fair Value Disclosure
The financial assets of the Company measured at fair value on a recurring basis are included in cash equivalents and other assets. The Company classifies its cash equivalents and other assets, except for its investment in an auction rate security, within Level 1 or Level 2 in the fair value hierarchy because the Company uses quoted prices in active markets or alternative pricing sources and models using market observable inputs to determine their fair value. The Company’s investment in an auction rate security is classified within Level 3 of the fair value hierarchy as the determination of its fair value was not based on observable inputs as of June 30, 2019 and 2018. See Note 1, "Organization and Summary of Significant Accounting Policies", for a discussion of the Company’s policies regarding the fair value hierarchy. The Company used discounted cash flows to estimate the fair value of the auction rate security as of June 30, 2019 and 2018. The material factors used in preparing the discounted cash flows are (i) the discount rate utilized to present value the cash flows, (ii) the time period until redemption and (iii) the estimated rate of return.
Financial Assets and Liabilities Measured on a Recurring Basis
The following table sets forth the Company’s cash equivalents, certificates of deposit and investment in auction rate security as of June 30, 2019 and 2018 which are measured at fair value on a recurring basis by level within the fair value hierarchy. These are classified based on the lowest level of input that is significant to the fair value measurement (in thousands):
June 30, 2019 | Level 1 | Level 2 | Level 3 | Asset at Fair Value | |||||||||||
Money market funds (1) | $ | 1,162 | $ | — | $ | — | $ | 1,162 | |||||||
Certificates of deposit (2) | — | 1,285 | — | 1,285 | |||||||||||
Auction rate security | — | — | 1,571 | 1,571 | |||||||||||
Total assets measured at fair value | $ | 1,162 | $ | 1,285 | $ | 1,571 | $ | 4,018 | |||||||
June 30, 2018 | Level 1 | Level 2 | Level 3 | Asset at Fair Value | |||||||||||
Money market funds (1) | $ | 1,136 | $ | — | $ | — | $ | 1,136 | |||||||
Certificates of deposit (2) | — | 30,219 | — | 30,219 | |||||||||||
Auction rate security | — | — | 1,571 | 1,571 | |||||||||||
Total assets measured at fair value | $ | 1,136 | $ | 30,219 | $ | 1,571 | $ | 32,926 | |||||||
(1) $0.4 million and $0.3 million in money market funds are included in cash and cash equivalents and $0.8 million and $0.8 million in money market funds are included in restricted cash, non-current in other assets in the consolidated balance sheets as of June 30, 2019 and 2018, respectively.
(2) $0.2 million and $29.2 million in certificates of deposit are included in cash and cash equivalents and $1.1 million and $1.0 million in certificates of deposit are included in restricted cash, non-current in other assets in the consolidated balance sheets as of June 30, 2019 and 2018, respectively.
The above table excludes $247.6 million and $85.9 million of cash included in cash and cash equivalents, $11.7 million and $2.8 million of restricted cash included in prepaid expenses and other current assets, and $0.4 million and $0.4 million of restricted cash, non-current included in other assets in the consolidated balance sheets as of June 30, 2019 and 2018, respectively. There were no transfers between Level 1, Level 2 or Level 3 securities in fiscal years 2019 and 2018.
87
The following table provides a reconciliation of the Company’s financial assets measured at fair value on a recurring basis, consisting of auction rate securities, using significant unobservable inputs (Level 3) for fiscal years 2019 and 2018 (in thousands):
Years Ended June 30, | |||||||
2019 | 2018 | ||||||
Balance as of the beginning of the fiscal year | $ | 1,571 | $ | 2,625 | |||
Sales and settlements at par | — | (1,000 | ) | ||||
Total unrealized loss included in other comprehensive income | — | (54 | ) | ||||
Balance as of the end of the fiscal year | $ | 1,571 | $ | 1,571 | |||
The following is a summary of the Company’s investment in an auction rate security as of June 30, 2019 and 2018 (in thousands):
June 30, 2019 and 2018 | |||||||||||||||
Cost Basis | Gross Unrealized Holding Gains | Gross Unrealized Holding Losses | Fair Value | ||||||||||||
Auction rate security | $ | 1,750 | $ | — | $ | (179 | ) | $ | 1,571 | ||||||
The Company measures the fair value of outstanding debt for disclosure purposes on a recurring basis. As of June 30, 2019 and 2018, total debt of $23.6 million and $116.2 million, respectively, are reported at amortized cost. This outstanding debt is classified as Level 2 as it is not actively traded. The amortized cost of the outstanding debt approximates the fair value.
Financial Assets Measured on a Non-recurring Basis
The Company's non-marketable equity securities are investments in privately held companies without readily determinable fair values. Prior to July 1, 2018, the Company accounted for its investment in non-marketable equity securities at cost less impairment. Realized gains and losses on non-marketable equity securities sold or impaired were recognized in other income (expense), net. Upon adoption of the new guidance, Financial Instruments - Overall: Recognition and Measurement of Financial Assets and Financial Liabilities, on July 1, 2018, the Company classifies its investment in non-marketable equity instruments as Level 3 as the fair value is determined using significant unobservable inputs. During the fiscal year ended June 30, 2019 the Company did not record any upward or downward adjustments to the carrying values of the non-marketable equity securities. During fiscal year 2019, the Company recorded impairment charges of $2.7 million for its non-marketable equity securities which had an initial cost basis of $2.7 million as it was determined the carrying value of the investments were not recoverable. During fiscal years 2018 and 2017, the Company did not record any other-than-temporary impairments on financial assets required to be measured at fair value on a non-recurring basis.
There were no transfers of financial assets measured on a non-recurring basis between Level 1, Level 2 or Level 3 securities in fiscal years 2019, 2018 and 2017.
Note 3. Revenue
Revenue recognition for periods after the Company’s adoption of ASC 606 as of July 1, 2018
The Company adopted ASC 606 as of July 1, 2018 using the modified retrospective method for all contracts not completed as of the date of adoption. For contracts that were modified before the effective date, the Company considered the effect of all modifications when identifying performance obligations and allocating transaction price, which did not have a material effect on the adjustment to retained earnings. The Company recognized the cumulative effect of initially applying ASC 606 as an adjustment to the opening balance of retained earnings. The comparative information has not been recast and continues to be reported under the accounting standards in effect for those periods.
88
ASC 606 provides a unified model in determining when and how revenue is recognized with the core principle that revenue should be recognized when a customer obtains control of the promised goods or services in an amount that reflects the consideration to which the entity expects to be entitled in exchange for those goods or services.
The Company generates revenues from the sale of server and storage systems, subsystems, accessories, services, server software management solutions, and support services.
Product sales. The Company recognizes revenue from sales of products as control is transferred to customers, which generally happens at the point of shipment or upon delivery, unless customer acceptance is uncertain. Products sold by the Company are delivered via shipment from the Company’s facilities or drop shipment directly to its customers from a Company vendor. The Company may use distributors to sell products to end customers. Revenue from distributors is recognized when the distributor obtains control of the product, which generally happens at the point of shipment or upon delivery, unless customer acceptance is uncertain, and in the amount of consideration to which the Company expects to be entitled.
As part of determining the transaction price in contracts with customers, the Company estimates reserves for future sales returns based on a review of its history of actual returns for each major product line. Based upon historical experience, a refund liability is recorded at the time of sale for estimated product returns and an asset is recognized for the amount expected to be recorded in inventory upon product return, less the expected recovery costs. The Company also reduces revenue for the estimated costs of customer and distributor programs and incentive offerings such as price protection and rebates as well as the estimated costs of cooperative marketing arrangements where the fair value of the benefit derived from the costs cannot be reasonably estimated. Any provision for customer and distributor programs and other discounts is recorded as a reduction of revenue at the time of sale based on an evaluation of the contract terms and historical experience.
Services sales. The Company’s sale of services mainly consists of extended warranty and on-site services. Revenue related to extended warranty commences upon the expiration of the standard warranty period and is recognized ratably over the contractual period as the Company stands ready to perform any required warranty service. Revenue related to on-site services commences upon recognition of the product sale and is recognized ratably over the contractual period as the on-site services are made available to the customer. These service contracts are typically one to five years in length. Service revenue has been less than 10% of net sales for all periods presented and is not separately disclosed.
Contracts with multiple promised goods and services. Certain of the Company’s contracts contain multiple promised goods and services. Performance obligations in a contract are identified based on the promised goods or services that will be transferred to the customer that are both capable of being distinct, whereby the customer can benefit from the service either on its own or together with other resources that are readily available from third parties or from the Company, and are distinct in the context of the contract, whereby the transfer of the services is separately identifiable from other promises in the contract. If these criteria are not met, the promised goods and services are accounted for as a combined performance obligation. Revenue allocated to each performance obligation is recognized at the time the related performance obligation is satisfied by transferring control of the promised good or service to a customer.
If the contract contains a single performance obligation, the entire transaction price is allocated to the single performance obligation. Contracts that contain multiple performance obligations require an allocation of the transaction price to each performance obligation based on a relative standalone selling price basis. The Company determines standalone selling prices based on the price at which the performance obligation is sold separately. If the standalone selling price is not observable through past transactions, the Company estimates the standalone selling price taking into account available information, such as internally approved pricing guidelines with respect to geographies, customer type, internal costs, and gross margin objectives, for the related performance obligations.
When the Company receives consideration from a customer prior to transferring goods or services to the customer, the Company records a contract liability (deferred revenue). The Company also recognizes deferred revenue when it has an unconditional right to consideration (i.e., a receivable) before transfer of control of goods or services to a customer.
The Company considers shipping & handling activities as costs to fulfill the sales of products. Shipping revenue is included in net sales when control of the product is transferred to the customer, and the related shipping and handling costs are included in cost of products sold. Taxes imposed by governmental authorities on the Company's revenue producing activities with customers, such as sales taxes and value added taxes, are excluded from net sales.
Revenue recognition for periods prior to the Company’s adoption of ASC 606 as of July 1, 2018
89
Product sales. The Company recognizes revenue from sales of products upon meeting all of the following revenue recognition criteria, which is typically met upon shipment or delivery of its products to customers, unless customer acceptance is uncertain or significant obligations to the customer remain: (i) persuasive evidence of an arrangement exists through customer contracts and orders, (ii) the customer takes title and assumes the risks and rewards of ownership, (iii) the sales price charged is fixed or determinable as evidenced by customer contracts and orders and (iv) collectibility is reasonably assured.
The Company estimates reserves for future sales returns based on a review of its history of actual returns for each major product line. The Company also reduces revenue for customer and distributor programs and incentive offerings such as price protection and rebates as well as cooperative marketing arrangements where the fair value of the benefit identified from the costs cannot be reasonably estimated.
The Company may use distributors to sell products to end customers. Revenue from distributors may be recognized on sell-in or sell-through basis depending on the terms of the arrangement between the Company and the distributor.
The Company records costs related to shipping and handling in sales and marketing expenses. Shipping and handling fees billed to customers are included in net sales.
Services sales. The Company’s sale of services mainly consists of extended warranty and on-site services. These services are sold at the time of the sale of the underlying products. Revenue related to extended warranty commences upon the expiration of the standard warranty period and is recognized ratably over the contractual period. Revenue related to on-site services commences upon recognition of the product sale and is recognized ratably over the contractual period. These service contracts are typically one to five years in length. Service revenue has been less than 10% of net sales for all periods presented and is not separately disclosed.
Multiple-element arrangements. Certain of the Company’s arrangements contain multiple elements, consisting of both the Company’s products and services. Revenue allocated to each element is recognized when all the revenue recognition criteria are met for that element.
The Company allocates arrangement consideration at the inception of an arrangement to all deliverables, if they represent a separate unit of accounting, based on their relative estimated stand-alone selling prices. A deliverable qualifies as a separate unit of accounting when the delivered element has stand-alone value to the customer. The guidance establishes the following hierarchy to determine the relative estimated stand-alone selling price to be used for allocating arrangement consideration to deliverables: (i) vendor-specific objective evidence of fair value (“VSOE”), (ii) third-party evidence of selling price (“TPE”) if VSOE is not available, or (iii) the vendor's best estimated selling price (“BESP”) if neither VSOE nor TPE are available.
The Company does not have VSOE for deliverables in its arrangements, and TPE is generally not available because its products are highly differentiated, and the Company is unable to obtain reliable information on the products and pricing practices of the Company’s competitors. BESP reflects the Company’s estimate of what the selling price of a deliverable would be if it were sold regularly on a stand-alone basis.
As such, BESP is generally used to allocate the total arrangement consideration at the arrangement inception. The Company determines BESP for a product by considering multiple factors including, but not limited to, geographies, customer types, internal costs, gross margin objectives and pricing practices.
Disaggregation of Revenue
The Company disaggregates revenue by type of product, by geographical market, and by products sold to indirect sales channel partners or direct customers and OEMs that depict the nature, amount, and timing of revenue and cash flows. Service revenues are not a significant component of total revenue and are aggregated within the respective categories.
The following is a summary of net sales by product type (in thousands):
90
Years Ended June 30, | ||||||||||||||||||||
2019 | 2018 | 2017 | ||||||||||||||||||
Amount | Percent of Net Sales | Amount | Percent of Net Sales | Amount | Percent of Net Sales | |||||||||||||||
Server and storage systems | $ | 2,858,644 | 81.7 | % | $ | 2,663,580 | 79.3 | % | $ | 1,740,633 | 70.0 | % | ||||||||
Subsystems and accessories | 641,716 | 18.3 | % | 696,912 | 20.7 | % | 744,296 | 30.0 | % | |||||||||||
Total | $ | 3,500,360 | 100.0 | % | $ | 3,360,492 | 100.0 | % | $ | 2,484,929 | 100.0 | % | ||||||||
Server and storage systems constitute an assembly and integration of subsystems and accessories, and related services.
Subsystems and accessories are comprised of serverboards, chassis and accessories.
International net sales are based on the country and region to which the products were shipped. The following is a summary for the fiscal years ended June 30, 2019, 2018 and 2017, of net sales by geographic region (in thousands):
Years Ended June 30, | |||||||||||
2019 | 2018 | 2017 | |||||||||
United States | $ | 2,032,948 | $ | 1,902,106 | $ | 1,422,667 | |||||
Asia | 712,211 | 762,701 | 500,956 | ||||||||
Europe | 611,014 | 547,507 | 453,798 | ||||||||
Other | 144,187 | 148,178 | 107,508 | ||||||||
$ | 3,500,360 | $ | 3,360,492 | $ | 2,484,929 | ||||||
The following table presents the percentages of net sales from products sold through the Company's indirect sales channel and to its direct customers and OEMs for fiscal years 2019, 2018 and 2017:
Years Ended June 30, | 2019 over 2018 | 2018 over 2017 | ||||||||||||
2019 | 2018 | 2017 | % | % | ||||||||||
Indirect sales channel | 39.3 | % | 41.5 | % | 47.8 | % | (2.2 | )% | (6.3 | )% | ||||
Direct customers and OEMs | 60.7 | % | 58.5 | % | 52.2 | % | 2.2 | % | 6.3 | % | ||||
Total net sales | 100.0 | % | 100.0 | % | 100.0 | % | ||||||||
Contract Balances
Generally, the payment terms of the Company’s offerings range from 30 to 60 days. In certain instances, customers may prepay for products and services in advance of delivery. Receivables relate to the Company’s right to consideration for performance obligations completed (or partially completed) for which the Company has an unconditional right to consideration.
Contract assets are rights to consideration in exchange for goods or services that the Company has transferred to a customer when such right is conditional on something other than the passage of time. Such contract assets are insignificant to the Company’s consolidated financial statements.
Contract liabilities consist of deferred revenue and relate to amounts invoiced to or advance consideration received from customers, which precede the Company’s satisfaction of the associated performance obligation(s). The Company’s deferred revenue primarily results from customer payments received upfront for extended warranties and on-site services because these performance obligations are satisfied over time. On July 1, 2018, deferred revenue totaled $143.5 million after recognizing the cumulative effect of initially applying ASC 606. Of that amount, $53.9 million was recognized as revenue during the fiscal year ended June 30, 2019.
Deferred revenue increased during the fiscal year ended June 30, 2019 because the amounts for service contracts invoiced during the period exceeded the recognition of revenue from contracts entered into in prior periods.
91
Transaction Price Allocated to the Remaining Performance Obligations
Remaining performance obligations represent in aggregate the amount of transaction price that has been allocated to performance obligations not delivered, or only partially undelivered, as of the end of the reporting period. The Company applies the optional exemption to not disclose information about remaining performance obligations that are part of a contract that has an original expected duration of one year or less. These performance obligations generally consist of services, such as on-site integration services that are contracted for one year or less, and products for which control has not yet been transferred. The value of the transaction price allocated to remaining performance obligations as of June 30, 2019 was approximately $203.4 million. The Company expects to recognize approximately 46% of remaining performance obligations as revenue in the next 12 months, and the remainder thereafter.
Capitalized Contract Acquisition Costs and Fulfillment Cost
Contract acquisition costs are those incremental costs that the Company incurs to obtain a contract with a customer that it would not have incurred if the contract had not been obtained. Contract acquisition costs consist primarily of incentive bonuses. Contract acquisition costs are considered incremental and recoverable costs of obtaining and fulfilling a contract with a customer and are therefore capitalizable. The Company applies the practical expedient to expense incentive bonus costs as incurred if the amortization period would be one year or less, generally upon delivery of the associated server and storage systems or components. Where the amortization period of the contract cost would be more than a year, the Company allocates the incentive bonus cost asset between hardware and service performance obligations and expenses the cost allocated to the hardware performance obligations upon delivery of associated server and storage systems or components and amortizes the cost allocated to service performance obligations over the period the services are expected to be provided. Such contract acquisition costs that are subject to capitalization are insignificant to the Company’s consolidated financial statements.
Contract fulfillment costs consist of costs paid in advance for outsourced services provided by third parties to the extent they are not in the scope of other guidance. Fulfillment costs paid in advance for outsourced services provided by third parties are capitalized and amortized over the period the services are expected to be provided. Such fulfillment costs are insignificant to the Company’s consolidated financial statements.
Note 4. Accounts Receivable Allowances
The Company has established an allowance for doubtful accounts. The allowance for doubtful accounts is based upon the age of outstanding receivables, credit risk of specific customers, historical trends related to past losses and other relevant factors. Accounts receivable allowances as of June 30, 2019, 2018 and 2017 consisted of the following (in thousands):
Beginning Balance | Charged to Cost and Expenses | Additions/ (Deductions) | Ending Balance | ||||||||||||
Allowance for doubtful accounts: | |||||||||||||||
Year ended June 30, 2019 | $ | 1,945 | $ | 7,058 | $ | (97 | ) | $ | 8,906 | ||||||
Year ended June 30, 2018 | 2,370 | (96 | ) | (329 | ) | 1,945 | |||||||||
Year ended June 30, 2017 | 2,033 | 334 | 3 | 2,370 | |||||||||||
Note 5. Inventories
Inventories as of June 30, 2019 and 2018 consisted of the following (in thousands):
June 30, | |||||||
2019 | 2018 | ||||||
Finished goods | $ | 492,387 | $ | 633,348 | |||
Work in process | 43,598 | 61,162 | |||||
Purchased parts and raw materials | 134,203 | 158,742 | |||||
Total inventories | $ | 670,188 | $ | 853,252 | |||
92
During fiscal years 2019, 2018 and 2017, the Company recorded a provision for excess and obsolete inventory to cost of sales totaling $28.5 million, $9.4 million and $15.7 million, respectively, excluding a provision for adjusting the cost of certain inventories to net realizable value of $4.4 million in fiscal year 2019. The adjustment for lower of cost or net realizable value and lower of cost or market was not material in fiscal years 2018 and 2017.
Note 6. Property, Plant, and Equipment
Property, plant and equipment as of June 30, 2019 and 2018 consisted of the following (in thousands):
June 30, | |||||||
2019 | 2018 | ||||||
Buildings | $ | 86,136 | $ | 88,689 | |||
Land | 74,926 | 74,919 | |||||
Machinery and equipment | 79,946 | 71,081 | |||||
Buildings construction in progress (1) | 14,189 | 1,779 | |||||
Building and leasehold improvements | 22,307 | 18,760 | |||||
Software | 18,415 | 15,522 | |||||
Furniture and fixtures | 20,193 | 18,475 | |||||
316,112 | 289,225 | ||||||
Accumulated depreciation and amortization | (108,775 | ) | (92,594 | ) | |||
Property, plant and equipment, net | $ | 207,337 | $ | 196,631 | |||
__________________________
(1) Primarily relates to the development and construction costs associated with the Company’s Green Computing Park located in San Jose, California.
Note 7. Prepaid Expenses and Other Assets
Prepaid expenses and other current assets as of June 30, 2019 and 2018 consisted of the following (in thousands):
June 30, | |||||||
2019 | 2018 | ||||||
Receivables from vendors (1) | $ | 83,050 | $ | 93,003 | |||
Restricted cash | 11,673 | 2,803 | |||||
Prepaid expenses | 7,269 | 6,321 | |||||
Deferred service costs | 3,374 | 2,920 | |||||
Others | 4,429 | 5,809 | |||||
Total prepaid expenses and other current assets | $ | 109,795 | $ | 110,856 | |||
__________________________
(1) Includes receivables from contract manufacturers based on certain buy-sell arrangements of $82.0 million and $87.4 million as of June 30, 2019 and 2018, respectively.
Other assets as of June 30, 2019 and 2018 consisted of the following (in thousands):
93
June 30, | |||||||
2019 | 2018 | ||||||
Deferred service costs, non-current | $ | 3,572 | $ | 3,583 | |||
Restricted cash, non-current | 2,303 | 2,202 | |||||
Investment in auction rate security | 1,571 | 1,571 | |||||
Non-marketable equity securities (1) | 878 | 3,539 | |||||
Deposits | 686 | 671 | |||||
Prepaid expense, non-current | 1,649 | 2,471 | |||||
Total other assets | $ | 10,659 | $ | 14,037 | |||
__________________________
(1) For the fiscal year ended June 30, 2019, the balance represents investment in non-marketable equity securities without readily determinable fair values. For the fiscal year ended June 30, 2018, the balance represents investments in equity securities accounted for under the cost method.
Cash, cash equivalents and restricted cash as of June 30, 2019 and 2018 consisted of the following (in thousands):
June 30, | |||||||
2019 | 2018 | ||||||
Cash and cash equivalents | $ | 248,164 | $ | 115,377 | |||
Restricted cash included in prepaid expenses and other current assets | 11,673 | 2,803 | |||||
Restricted cash included in other assets | 2,303 | 2,202 | |||||
Total cash, cash equivalents and restricted cash | $ | 262,140 | $ | 120,382 | |||
Note 8. Investment in a Corporate Venture
In October 2016, the Company entered into agreements pursuant to which the Company contributed certain technology rights in connection with an investment in a privately-held company (the "Corporate Venture") located in China to expand the Company's presence in China. The Corporate Venture is 30% owned by the Company and 70% owned by another company in China. The transaction was closed in the third fiscal quarter of 2017 and the investment has been accounted for using the equity method. As such, the Corporate Venture is also a related party. As of June 30, 2019 and June 30, 2018, the Company's equity investment in the Corporate Venture was $1.7 million and $2.4 million, respectively, and was recorded under investment in equity investee on the Company's consolidated balance sheet. The Company's share of losses of the Corporate Venture were $2.7 million, $3.6 million, and $0.3 million for the fiscal years ended June 30, 2019, June 30, 2018, and June 30, 2017, respectively.
The Company recorded a deferred gain related to the contribution of certain technology rights of $7.0 million in the third fiscal quarter of 2017. The amortization of the deferred gain is being recognized as a credit to research and development expenses in the Company's consolidated statement of operations over a period of five years which represents the estimated period over which the remaining obligations will be fulfilled.
As a result of the adoption of new accounting guidance as of the beginning of fiscal year 2019, the Company recorded an increase of $3.0 million to the investment in equity investee for the contribution of those technology rights, and corresponding increases in deferred gain and retained earnings of $2.1 million and $0.9 million, respectively. As of June 30, 2019 and 2018, the Company had unamortized deferred gain balance of $2.0 million and $1.4 million, respectively, in accrued liabilities and $3.0 million and $3.5 million, respectively, in other long-term liabilities in the Company’s consolidated balance sheets.
The Company monitors the investment for events or circumstances indicative of potential other-than-temporary impairment and makes appropriate reductions in carrying values if it determines that an impairment charge is required. No impairment charge was recorded for the fiscal years being presented.
Additionally, the Company sold products worth $52.2 million, $21.7 million, $10.9 million to the Corporate Venture in the fiscal years 2019, 2018, 2017, respectively, and the Company's share of intra-entity profits on the products that remained
94
unsold by the Corporate Venture as of June 30, 2019 and June 30, 2018 have been eliminated and have reduced the Company's investment in the Corporate Venture. The Company had $13.1 million and $2.9 million due from the Corporate Venture in accounts receivable, net as of June 30, 2019 and 2018, respectively, in its consolidated balance sheets.
Note 9. Accrued Liabilities
Accrued liabilities as of June 30, 2019 and 2018 consisted of the following (in thousands):
June 30, | |||||||
2019 | 2018 | ||||||
Accrued payroll and related expenses | $ | 25,552 | $ | 25,532 | |||
Contract manufacturers liability | 25,308 | 28,754 | |||||
Accrued professional fees | 11,756 | 6,626 | |||||
Customer deposits | 11,133 | 14,938 | |||||
Accrued warranty costs | 8,661 | 7,589 | |||||
Accrued cooperative marketing expenses | 5,830 | 6,413 | |||||
Others | 26,438 | 12,626 | |||||
Total accrued liabilities | $ | 114,678 | $ | 102,478 | |||
Note 10. Short-term Debt
Short-term debt obligations as of June 30, 2019 and 2018 consisted of the following (in thousands):
June 30, | |||||||
2019 | 2018 | ||||||
Line of credit: | |||||||
Bank of America | $ | 1,116 | $ | 67,346 | |||
CTBC Bank | — | 25,900 | |||||
Total line of credit | 1,116 | 93,246 | |||||
Term loan: CTBC Bank | 22,531 | 22,935 | |||||
Total short-term debt | $ | 23,647 | $ | 116,181 | |||
Activities under Revolving Lines of Credit and Term Loans
Bank of America
2016 Bank of America Credit Facility
In June 2016, the Company entered into a credit agreement with Bank of America (the “2016 Bank of America Credit Facility”). Prior to its maturity in April 2018, the Company repaid and terminated the 2016 Bank of America Credit Facility using the proceeds from its 2018 Bank of America Credit Facility (defined below). Immediately prior to its termination, the 2016 Bank of America Credit Facility (giving effect to all amendments since the inception of the 2016 Bank of America Credit Facility), provided for (i) a $85.0 million revolving line of credit including a $5.0 million letter of credit sublimit (ii) a $20.0 million revolving line of credit for the Company's Taiwan and the Netherlands entities, and (iii) a five-year $50.0 million term loan. The 2016 Bank of America Credit Facility term loan was secured by seven buildings located in San Jose, California and the property, plant and equipment and the inventory in those buildings. The principal and interest of the 2016 Bank of America Credit Facility term loan were payable monthly through June 30, 2021 with an interest rate at the LIBOR rate plus 1.25% per annum. The interest rate for the $85.0 million revolving line of credit was at the LIBOR rate plus 1.25% per annum. The interest rate of the $20.0 million revolving line of credit was equal to a minimum of 0.9% per annum plus the lender's cost of funds, as defined in the agreements.
95
2018 Bank of America Credit Facility
In April 2018, the Company entered into a revolving line of credit with Bank of America (the "2018 Bank of America Credit Facility"), which replaced the 2016 Bank of America Credit Facility. The 2018 Bank of America Credit Facility provides for a revolving credit line and other financial accommodations of up to $250.0 million extended by certain lenders, including a $5.0 million letter of credit sublimit, which was extended to $15.0 million in October 2019. The 2018 Bank of America Credit Facility was originally set to expire after 364 days and has been extended to June 30, 2020 through subsequent amendments. Prior to its maturity, at the Company's option and if certain conditions are satisfied, including the Company being current on all of its delinquent quarterly and annual filings with the SEC, the 2018 Bank of America Credit Facility may convert into a five-year revolving credit facility. If and upon such conversion, the lenders for the 2018 Bank of America Credit Facility shall extend, in aggregate, a principal amount of up to $400.0 million. Prior to the 2018 Bank of America Credit Facility’s conversion to the five-year revolving credit facility, interest shall accrue at the LIBOR rate plus 2.75% per annum. Upon the 2018 Bank of America Credit Facility converting to the five-year revolving credit facility, interest shall accrue at the LIBOR rate plus an amount between 1.50% and 2.00% for loans to both Super Micro Computer and Super Micro Computer B.V. Under the terms of the 2018 Bank of America Credit Facility, the Company is required to grant the lenders a continuing security interest in and lien upon all amounts credited to any of the Company's deposit accounts. Interest accrued on any loans under the 2018 Bank of America Credit Facility is due on the first day of each month, and the loans are due and payable in full on the termination date of the 2018 Bank of America Credit Facility, unless payment is required earlier as determined by the lenders. Voluntary prepayments are permitted without early repayment fees or penalties. The terms of the arrangement require any amounts in the deposit accounts to be applied against the Company's line of credit the next business day. Subject to customary exceptions, the 2018 Bank of America Credit Facility is secured by substantially all of Super Micro Computer’s assets. If converted to the five-year revolving credit facility, Super Micro Computer’s assets, and at the Company's option, Super Micro Computer B.V.'s assets will be used as collateral for the 2018 Bank of America Credit Facility. Under the terms of the 2018 Bank of America Credit Facility, the Company is not permitted to either repurchase its common stock or pay any dividends.
In the fourth fiscal quarter of 2018, the Company paid $3.2 million in fees to the lenders and third parties in connection with the 2018 Bank of America Credit Facility. The replacement of the 2016 Bank of America Credit Facility by the 2018 Bank of America Credit Facility is accounted for as a modification of the existing credit facility to the extent the lenders before and after the modification were the same. Any unamortized fees relating to the 2016 Bank of America Credit Facility and the fees paid for the 2018 Bank of America Credit Facility are amortized over the term of the 2018 Bank of America Credit Facility as interest expense in the Company's consolidated statements of operation and any unamortized amounts are classified within prepaid and other current assets in the Company's consolidated balance sheets.
On January 31, 2019, the Company paid a fee and entered into an amendment of the 2018 Bank of America Credit Facility that resulted in the extension of the maturity date from April 19, 2019 to June 30, 2019. On June 27, 2019, the Company entered into a second amendment of the 2018 Bank of America Credit Facility that extended the maturity date from June 30, 2019 to June 30, 2020.
As of June 30, 2019 and 2018 the total outstanding borrowings under the 2018 Bank of America Credit facility were $1.1 million and $67.3 million, respectively. The interest rates under the 2018 Bank of America Credit Facility as of June 30, 2019 and 2018 were 4.5% per annum and 4.75% per annum, respectively. As of June 30, 2019, a $3.2 million letter of credit was outstanding under the 2018 Bank of America Credit Facility. The balance of debt issuance costs outstanding were $0.3 million and $2.8 million as of June 30, 2019 and 2018, respectively. As of June 30, 2019, the Company's available borrowing capacity under the 2018 Bank of America Credit Facility was $245.7 million, subject to the borrowing base limitation and compliance with other applicable terms.
CTBC Bank
In April 2016, the Company entered into a credit agreement with CTBC Bank Co., Ltd ("CTBC Bank") that provides for (i) a 12-month NTD $700.0 million ($21.6 million U.S. dollar equivalent) term loan facility secured by the land and building located in Bade, Taiwan with an interest rate equal to the lender's established NTD interest rate plus 0.25% per annum which was adjusted monthly, the term loan facility also included a 12-month guarantee of up to NTD $100.0 million ($3.1 million U.S. dollar equivalent) with an annual fee equal to 0.50% per annum, and (ii) a 12-month revolving line of credit of up to 80.0% of eligible accounts receivable in an aggregate amount of up to $40.0 million with an interest rate equal to the lender's established USD interest rate plus 0.30% per annum which was adjusted monthly (collectively, the “2016 CTBC Credit Facility”). The total borrowings allowed under the 2016 CTBC Credit Facility was capped at $40.0 million. The Company extended the 2016 CTBC Credit Facility to mature on May 31, 2017.
96
In May 2017, the Company renewed the 2016 CTBC Credit Facility, such that it provided for (i) a 12-month NTD $700.0 million ($23.0 million U.S. dollar equivalent) term loan facility secured by the land and building located in Bade, Taiwan with an interest rate equal to the lender's established NTD interest rate plus 0.25% per annum, which was adjusted monthly, which term loan facility also included a 12-month guarantee of up to NTD $100.0 million ($3.3 million U.S. dollar equivalent) with an annual fee equal to 0.5% per annum, and (ii) a 12-month revolving line of credit of up to 80.0% of eligible accounts receivable in an aggregate amount of up to $50.0 million with an interest rate equal to the lender's established USD interest rate plus an interest rate ranging from 0.40% to 0.45% per annum which was adjusted monthly. The total borrowings allowed under the renewed 2016 CTBC Credit Facility were capped at $50.0 million. The 2016 CTBC Credit Facility was to mature on April 30, 2018 but prior to the maturity, the Company entered into the 2018 CTBC Credit Facility (defined below) with CTBC Bank in January 2018, which replaced the 2016 CTBC Credit Facility.
In January 2018, the Company entered into a credit agreement with CTBC Bank that provided for (i) a 12-month NTD $700.0 million ($23.6 million U.S. dollar equivalent) term loan facility secured by the land and building located in Bade, Taiwan with an interest rate equal to the lender's established NTD interest rate plus 0.25% per annum, which was adjusted monthly, which term loan facility also included a 12-month guarantee of up to NTD $100.0 million ($3.4 million U.S. dollar equivalent) with an annual fee equal to 0.50% per annum, and (ii) a 12-month NTD $1,500.0 million ($50.5 million U.S. dollar equivalent) term loan facility with an interest rate equal to the lender's established NTD interest rate plus 0.25% per annum, which was adjusted monthly (collectively, the “2018 CTBC Credit Facility”). The total borrowings allowed under the 2018 CTBC Credit Facility was initially capped at $50.0 million and in August 2018 was reduced to $40.0 million. In June 2019 prior to its maturity, the 2018 CTBC Credit Facility was replaced by the 2019 CTBC Credit Facility (defined below).
In June 2019, the Company entered into a credit agreement with CTBC Bank that provides for (i) a 12-month NTD $700.0 million ($22.5 million U.S. dollar equivalent) term loan facility secured by the land and building located in Bade, Taiwan with an interest rate equal to the lender's established NTD interest rate plus 0.25% per annum which is adjusted monthly, which term loan facility also includes a 12-month guarantee of up to NTD $100.0 million ($3.2 million U.S. dollar equivalent) with an annual fee equal to 0.50% per annum, (ii) a 180-day NTD $1,500.0 million ($48.2 million U.S. dollar equivalent) term loan facility up to 100% of eligible accounts receivable in an aggregate amount with an interest rate equal to the lender's established NTD interest rate ranging from 0.30% to 0.50% per annum which is adjusted monthly, and (ⅲ) a 12-month revolving line of credit of up to 100% of eligible accounts receivable in an aggregate amount of up to $50.0 million with an interest rate equal to the lender's established USD interest rate plus an interest rate ranging from 0.30% to 0.50% per annum which is adjusted monthly (collectively, the “2019 CTBC Credit Facility”). The total borrowings allowed under the 2019 CTBC Credit Facility was capped at $50.0 million. The 2019 CTBC Credit Facility is to mature on June 30, 2020.
The total outstanding borrowings under the 2019 and 2018 CTBC Credit Facility term loan were denominated in NTD and remeasured into U.S. dollars of $22.5 million and $22.9 million at June 30, 2019 and 2018, respectively. At June 30, 2019 , the Company did not have any outstanding balance under the 2019 CTBC Credit Facility revolving line of credit. As of June 30, 2018, the total outstanding borrowings under the 2018 CTBC Credit Facility revolving line of credit were $25.9 million in U.S. dollars. The interest rate for these loans were 0.93% per annum as of June 30, 2019 and 0.95% per annum as of June 30, 2018. At June 30, 2019, the amount available for future borrowing under the 2019 CTBC Credit Facility was $27.5 million. As of June 30, 2019, the net book value of land and building located in Bade, Taiwan collateralizing the 2019 CTBC Credit Facility term loan was $25.8 million.
Covenant Compliance
2018 Bank of America Credit Facility
The credit agreement with Bank of America related to the 2018 Bank of America Credit Facility contains customary representations and warranties and customary affirmative and negative covenants applicable to the Company and its subsidiaries. The credit agreement contains a financial covenant, which requires that the Company maintain a Fixed Charge Coverage Ratio, as defined in the agreement of at least 1.00 for each twelve-month period while a Trigger Period, as defined in the agreement, is in effect. The Company has been in compliance with all the covenants under the 2018 Bank of America Credit Facility.
On September 7, 2018, Bank of America issued an extension letter to the Company in connection with the 2018 Bank of America Credit Facility, which extended the delivery date of the Company's audited consolidated financial statements, compliance certificates and other material reports for the fiscal year ended June 30, 2018 to January 31, 2019. On January 31,
97
2019, the Company entered into an amendment of the loan and security agreement with respect to the 2018 Bank of America Credit Facility to, among other matters, (a) extend the delivery date of the Company's audited consolidated financial statements, compliance certificates and other material reports for the fiscal year ended June 30, 2018 to June 30, 2019, and (b) require the delivery, by no later than March 31, 2019 of the Company's audited consolidated financial statements for the fiscal year ended June 30, 2019. In April 2019, the Company paid a fee to extend the delivery to June 30, 2019 of its audited consolidated financial statements for the fiscal year ended June 30, 2017. In connection with the second amendment of the 2018 Bank of America Credit Facility to extend the maturity of the 2018 Bank of America Credit Facility, the Company is required to deliver its audited consolidated financial statements for the fiscal year ended June 30, 2018 by December 31, 2019, and deliver its audited consolidated financial statements for the fiscal year ended June 30, 2019 by March 31, 2020. If the Company elects to deliver the audited consolidated financial statements for the fiscal years ended June 30, 2019 and 2018 together in a combined filing with the SEC, the Company is required to deliver its audited financial statements by March 31, 2020.
CTBC Bank
There are no financial covenants associated with the 2018 CTBC Credit Facility or the 2019 CTBC Credit Facility.
Note 11. Other Long-term Liabilities
Other long-term liabilities as of June 30, 2019 and 2018 consisted of the following (in thousands):
June 30, | |||||||
2019 | 2018 | ||||||
Accrued unrecognized tax benefits including related interest and penalties | $ | 20,102 | $ | 17,872 | |||
Accrued warranty costs, non-current | 2,373 | 2,295 | |||||
Others | 3,708 | 4,398 | |||||
Total other long-term liabilities | $ | 26,183 | $ | 24,565 | |||
Note 12. Related Party Transactions
The Company has a variety of business relationships with Ablecom and Compuware. Ablecom and Compuware are both Taiwan corporations. Ablecom is one of the Company’s major contract manufacturers; Compuware is both a distributor of the Company’s products and a contract manufacturer for the Company. Ablecom’s Chief Executive Officer, Steve Liang, is the brother of Charles Liang, the Company’s President, Chief Executive Officer and Chairman of the Board of Directors. Steve Liang owned approximately 0.4% of the Company's common stock as of June 30, 2017, but owned no shares as of June 30, 2018 and thereafter. As of June 30, 2019, Charles Liang and his spouse, Sara Liu, who is also an officer and director of the Company, collectively owned approximately 10.5% of Ablecom’s capital stock. Certain family members of Yih-Shyan (Wally) Liaw, who until January 2018 was the Senior Vice President of International Sales and a director of the Company, owned approximately 11.7% of Ablecom’s capital stock as of June 30, 2019. The Company does not own, nor has it ever owned, any of Ablecom’s capital stock. Steve Liang and his family members owned approximately 28.8% of Ablecom’s stock as of June 30, 2019. Bill Liang, a brother of both Charles Liang and Steve Liang, is a member of the Board of Directors of Ablecom. Bill Liang is also the Chief Executive Officer of Compuware, a member of Compuware’s Board of Directors and a holder of a significant equity interest in Compuware. Steve Liang is also a member of Compuware’s Board of Directors and is an equity holder of Compuware. None of the Company, Charles Liang or Sara Liu own any capital stock of Compuware.
Dealings with Ablecom
The Company has entered into a series of agreements with Ablecom, including multiple product development, production and service agreements, product manufacturing agreements, manufacturing services agreements and lease agreements for warehouse space.
Under these agreements, the Company outsources to Ablecom a portion of its design activities and a significant part of its server chassis manufacturing as well as an immaterial portion of other components. Ablecom manufactured approximately 96.3% and 97.0% of the chassis included in the products sold by the Company during fiscal years 2019 and 2018, respectively. With respect to design activities, Ablecom generally agrees to design certain agreed-upon products according to the Company’s specifications, and further agrees to build the tools needed to manufacture the products. The Company pays Ablecom for the
98
design and engineering services, and further agrees to pay Ablecom for the tooling. The Company retains full ownership of any intellectual property resulting from the design of these products and tooling.
With respect to the manufacturing aspects of the relationship, Ablecom purchases most of materials needed to manufacture the chassis from third parties and the Company provides certain components used in the manufacturing process (such as power supplies) to Ablecom through consignment or sales transactions. Ablecom uses these materials and components to manufacture the completed chassis and then sell them back to the Company. For the components purchased from the Company, Ablecom sells the components back to the Company at a price equal to the price at which the Company sold the components to Ablecom. The Company and Ablecom frequently review and negotiate the prices of the chassis the Company purchases from Ablecom. In addition to inventory purchases, the Company also incurs other costs associated with design services, tooling and other miscellaneous costs from Ablecom.
The Company’s exposure to financial loss as a result of its involvement with Ablecom is limited to potential losses on its purchase orders in the event of an unforeseen decline in the market price and/or demand of the Company’s products such that the Company incurs a loss on the sale or cannot sell the products. Outstanding purchase orders from the Company to Ablecom were $31.0 million and $39.3 million at June 30, 2019 and 2018, respectively, representing the maximum exposure to financial loss. The Company does not directly or indirectly guarantee any obligations of Ablecom, or any losses that the equity holders of Ablecom may suffer. Since Ablecom manufactures substantially all the chassis that the Company incorporates into its products, if Ablecom were to suddenly be unable to manufacture chassis for the Company, the Company’s business could suffer if the Company is unable to quickly qualify substitute suppliers who can supply high-quality chassis to the Company in volume and at acceptable prices.
Dealings with Compuware
The Company has entered into a distribution agreement with Compuware, under which the Company appointed Compuware as a non-exclusive distributor of the Company’s products in Taiwan, China and Australia. Compuware assumes the responsibility to install the Company's products at the site of the end customer, if required, and administers customer support in exchange for a discount from the Company's standard price for its purchases.
The Company also has entered into a series of agreements with Compuware, including a multiple product development, production and service agreements, product manufacturing agreements, and lease agreements for office space.
Under these agreements, the Company outsources to Compuware a portion of its design activities and a significant part of its power supplies manufacturing as well as an immaterial portion of other components. With respect to design activities, Compuware generally agrees to design certain agreed-upon products according to the Company’s specifications, and further agrees to build the tools needed to manufacture the products. The Company pays Compuware for the design and engineering services, and further agrees to pay Compuware for the tooling. The Company retains full ownership of any intellectual property resulting from the design of these products and tooling. With respect to the manufacturing aspects of the relationship, Compuware purchases most of materials needed to manufacture the power supplies from outside markets and uses these materials to manufacture the products and then sell those products to the Company. The Company and Compuware frequently review and negotiate the prices of the power supplies the Company purchases from Compuware.
Compuware also manufactures motherboards, backplanes and other components used on printed circuit boards for the Company. The Company sells to Compuware most of the components needed to manufacture the above products. Compuware uses the components to manufacture the products and then sells the products back to the Company at a purchase price equal to the price at which the Company sold the components to Compuware, plus a “manufacturing value added” fee and other miscellaneous material charges and costs. The Company and Compuware frequently review and negotiate the amount of the “manufacturing value added” fee that will be included in the price of the products the Company purchases from Compuware. In addition to the inventory purchases, the Company also incurs costs associated with design services, tooling assets, and miscellaneous costs.
The Company’s exposure to financial loss as a result of its involvement with Compuware is limited to potential losses on its purchase orders in the event of an unforeseen decline in the market price and/or demand of the Company’s products such that the Company incurs a loss on the sale or cannot sell the products. Outstanding purchase orders from the Company to Compuware were $70.6 million and $111.7 million at June 30, 2019 and 2018, respectively, representing the maximum exposure to financial loss. The Company does not directly or indirectly guarantee any obligations of Compuware, or any losses that the equity holders of Compuware may suffer.
99
The Company’s results from transactions with Ablecom and Compuware for each of the fiscal years ended June 30, 2019, 2018, and 2017 are as follows (in thousands):
Years Ended June 30, | |||||||||||
2019 | 2018 | 2017 | |||||||||
Ablecom | |||||||||||
Purchases (1) | $ | 145,273 | $ | 152,332 | $ | 123,734 | |||||
Compuware | |||||||||||
Net sales | $ | 17,651 | $ | 46,921 | $ | 22,959 | |||||
Purchases (1) | 139,579 | 119,548 | 118,912 | ||||||||
__________________________
(1) Includes principally purchases of inventory and other miscellaneous items.
The Company's net sales to Ablecom were not material for the fiscal years ended June 30, 2019, 2018, and 2017.
The Company had the following balances related to transactions with Ablecom and Compuware as of June 30, 2019 and 2018 (in thousands):
June 30, | |||||||
2019 | 2018 | ||||||
Ablecom | |||||||
Accounts receivable and other receivables | $ | 7,236 | $ | 7,884 | |||
Accounts payable and accrued liabilities | 33,928 | 49,187 | |||||
Compuware | |||||||
Accounts receivable and other receivables | $ | 14,396 | $ | 16,295 | |||
Accounts payable and accrued liabilities | 34,417 | 45,617 | |||||
In October 2016, the Company entered into agreements pursuant to which the Company contributed certain technology rights in connection with an investment in the Corporate Venture, which is accounted for using the equity method. See Note 8, "Investment in a Corporate Venture" for a discussion of the investment and the transactions that took place during the fiscal years 2019, 2018, and 2017.
Note 13. Stock-based Compensation and Stockholders’ Equity
Share Repurchase Program
In July 2016, the Company’s Board of Directors adopted a program to repurchase from time to time at management’s discretion up to $100.0 million of the Company’s common stock in the open market or in private transactions during the following twelve months at prevailing market prices. In fiscal year 2017, the Company purchased 888,097 shares of the Company's common stock in the open market at a weighted average price of $20.79 for $18.5 million. Repurchases were made under the program using the Company’s cash resources. The repurchase program ended in July 2017.
Equity Incentive Plan
In January 2016, the Board of Directors approved the 2016 Equity Incentive Plan (the "2016 Plan") and reserved for issuance 4,700,000 shares of common stock for awards of stock options, stock appreciation rights, restricted stock, RSUs and other equity-based awards. The 2016 Plan was approved by the stockholders of the Company and became effective on March 8, 2016. As of the date the 2016 Plan became effective, 8,696,444 shares of common stock were reserved for outstanding awards under the Company's 2006 Equity Incentive Plan (the "2006 Plan"). Such awards remained outstanding under the 2006 Plan following the adoption of the 2016 Plan, although no further awards have been or will be granted under the 2006 Plan. Up to
100
2,800,000 shares subject to awards that remained outstanding under the 2006 Plan at the time the 2016 Plan became effective, if those awards were or are forfeited at any time after the 2016 Plan became effective, will become available for use under the 2016 Plan. At the time the 2016 Plan became effective, all remaining ungranted shares under the 2006 Plan were canceled. Under the 2016 Plan, the exercise price per share for incentive stock options granted to employees owning shares representing more than 10% of the Company's outstanding voting stock at the time of grant cannot be less than 110% of the fair value of the underlying shares on the grant date. Nonqualified stock options and incentive stock options granted to all other persons are granted at a price not less than 100% of the fair value. Options generally expire ten years after the date of grant. Stock options and RSUs generally vest over four years; 25% at the end of one year and one sixteenth per quarter thereafter. Under the 2016 Plan, the Company granted PRSUs to its Chief Executive Officer, 50% of which vest based on the achievement of certain performance metrics at the end of the performance period while the remainder vest in equal amounts over the following ten quarters provided he continues to be employed by the Company. As of June 30, 2019, the Company had 843,917 authorized shares available for future issuance under the 2016 Plan.
Determining Fair Value
The Company's fair value of RSUs and PRSUs is based on the closing market price of the Company's common stock on the date of grant. The Company estimates the fair value of stock options granted using the Black-Scholes-option-pricing model. This fair value is then amortized ratably over the requisite service periods of the awards, which is generally the vesting period. The key inputs in using the Black-Scholes-option-pricing model were as follows:
Expected Term—The Company’s expected term represents the period that the Company’s stock-based awards are expected to be outstanding and was determined based on the Company's historical experience.
Expected Volatility—Expected volatility is based on the Company's implied and historical volatility.
Expected Dividend—The Black-Scholes valuation model calls for a single expected dividend yield as an input and the Company has no plans to pay dividends.
Risk-Free Interest Rate—The risk-free interest rate used in the Black-Scholes valuation method is based on the United States Treasury zero coupon issues in effect at the time of grant for periods corresponding with the expected term of option.
The fair value of stock option grants for the fiscal years ended June 30, 2019, 2018 and 2017 was estimated on the date of grant using the Black-Scholes option pricing model with the following assumptions:
Years Ended June 30, | |||||||||||
2019 | 2018 | 2017 | |||||||||
Risk-free interest rate | 2.32% - 2.97% | 1.92% - 2.86% | 1.12% - 2.03% | ||||||||
Expected term | 6.05 years | 5.82 years | 5.31 - 5.38 years | ||||||||
Dividend yield | — | % | — | % | — | % | |||||
Volatility | 47.34% - 50.28% | 45.32% - 48.07% | 43.36% - 49.64% | ||||||||
Weighted-average fair value | $ | 9.25 | $ | 10.98 | $ | 10.71 | |||||
The following table shows total stock-based compensation expense included in the consolidated statements of operations for the fiscal years ended June 30, 2019, 2018 and 2017 (in thousands):
101
Years Ended June 30, | |||||||||||
2019 | 2018 | 2017 | |||||||||
Cost of sales | $ | 1,663 | $ | 1,812 | $ | 1,382 | |||||
Research and development | 12,981 | 13,893 | 12,559 | ||||||||
Sales and marketing | 1,805 | 1,980 | 2,144 | ||||||||
General and administrative | 4,735 | 6,971 | 3,580 | ||||||||
Stock-based compensation expense before taxes | 21,184 | 24,656 | 19,665 | ||||||||
Income tax impact | (4,349 | ) | (6,902 | ) | (5,946 | ) | |||||
Stock-based compensation expense, net | $ | 16,835 | $ | 17,754 | $ | 13,719 | |||||
Prior to adoption of ASU 2016-09, Compensation – Stock Compensation (Topic 718): Improvements to Employee Share-Based Payment Accounting, cash flows resulting from the tax benefits for tax deductions resulting from the exercise of stock options and vesting of RSUs and PRSUs in excess of the compensation expense recorded for those options (excess tax benefits) issued or modified since July 1, 2006 are classified as cash from financing activities. Upon adoption of the new guidance on July 1, 2017, the cash flows from excess tax benefits related to such awards are classified as cash from operating activities. Excess tax benefits for stock options issued prior to July 1, 2006 are classified as cash from operating activities. Prior to adoption of ASU 2016-09, Compensation – Stock Compensation (Topic 718): Improvements to Employee Share-Based Payment Accounting, the Company had $1.8 million of excess tax benefits recorded in additional paid-in capital in the fiscal year ended June 30, 2017 and had excess tax benefits classified as cash from financing activities of $2.3 million in the fiscal year ended June 30, 2017 for options issued since July 1, 2006. The Company adopted the accounting guidance on July 1, 2017 and as a result of the adoption, the Company recorded $0.5 million of excess tax benefit in income tax expense in the fiscal year ended June 30, 2018.
As of June 30, 2019, $6.9 million of unrecognized compensation cost related to stock options is expected to be recognized over a weighted-average period of 2.58 years, $31.5 million of unrecognized compensation cost related to unvested RSUs is expected to be recognized over a weighted-average period of 2.77 years and $0.3 million of unrecognized compensation cost related to unvested PRSUs is expected to be recognized over a period of 1.5 years.
Stock Option Activity
The following table summarizes stock option activity during the fiscal years ended June 30, 2019, 2018 and 2017 under all plans:
102
Options Outstanding | Weighted Average Exercise Price per Share | Weighted Average Remaining Contractual Term (in Years) | Aggregate Intrinsic Value (in thousands) | |||||||||
Balance as of June 30, 2016 (7,495,131 shares exercisable at weighted average exercise price of $13.35 per share) | 8,960,867 | 14.88 | ||||||||||
Granted | 473,000 | 24.27 | ||||||||||
Exercised | (1,007,065 | ) | 10.80 | |||||||||
Forfeited/Cancelled | (51,143 | ) | 17.96 | |||||||||
Balance as of June 30, 2017 (7,348,320 shares exercisable at weighted average exercise price of $14.58 per share) | 8,375,659 | 15.88 | ||||||||||
Granted | 489,705 | 23.58 | ||||||||||
Exercised | (267,970 | ) | 11.36 | |||||||||
Forfeited/Cancelled | (296,256 | ) | 15.36 | |||||||||
Balance as of June 30, 2018 (7,563,189 shares exercisable at weighted average exercise price of $15.71 per share) | 8,301,138 | 16.50 | ||||||||||
Granted | 434,320 | 18.58 | ||||||||||
Forfeited/Cancelled | (1,360,823 | ) | 8.94 | |||||||||
Balance as of June 30, 2019 (6,624,009 shares exercisable at weighted average exercise price of $17.65 per share) | 7,374,635 | 18.02 | 3.82 | $ | 25,798 | |||||||
Options vested and exercisable at June 30, 2019 | 6,624,009 | 17.65 | 3.27 | $ | 24,811 | |||||||
No options were exercised in the fiscal year ended June 30, 2019. The total pretax intrinsic value of options exercised during the fiscal years ended June 30, 2018 and 2017 was $4.0 million and $14.0 million, respectively. Additional information regarding options outstanding as of June 30, 2019, is as follows:
Options Outstanding | Options Vested and Exercisable | |||||||||||||||
Range of Exercise Prices | Number Outstanding | Weighted- Average Remaining Contractual Term (Years) | Weighted- Average Exercise Price Per Share | Number Exercisable | Weighted- Average Exercise Price Per Share | |||||||||||
$7.94 - $10.35 | 897,340 | 2.15 | $ | 9.20 | 897,340 | $ | 9.20 | |||||||||
10.68 - 12.50 | 805,871 | 2.04 | 11.79 | 805,871 | 11.79 | |||||||||||
12.68 - 13.67 | 752,762 | 2.60 | 13.34 | 639,772 | 13.39 | |||||||||||
14.23 - 15.22 | 869,966 | 3.26 | 14.69 | 827,076 | 14.68 | |||||||||||
15.54 - 17.96 | 857,451 | 3.50 | 17.47 | 812,830 | 17.47 | |||||||||||
18.59 - 20.54 | 804,519 | 3.10 | 18.95 | 789,758 | 18.92 | |||||||||||
20.70 - 24.70 | 844,988 | 7.06 | 22.12 | 455,083 | 21.72 | |||||||||||
25.40 - 26.75 | 842,984 | 4.60 | 26.00 | 836,830 | 26.00 | |||||||||||
26.95 - 37.06 | 663,254 | 6.51 | 30.29 | 523,949 | 31.00 | |||||||||||
39.19 | 35,500 | 4.50 | 39.19 | 35,500 | 39.19 | |||||||||||
$7.94 - $39.19 | 7,374,635 | 3.82 | $ | 18.02 | 6,624,009 | $ | 17.65 | |||||||||
RSU and PRSU Activity
In January 2015, the Company began to grant RSUs to employees. The Company grants RSUs to certain employees as part of its regular employee equity compensation review program as well as to selected new hires. RSUs are share awards that entitle the holder to receive freely tradable shares of the Company's common stock upon vesting.
In August 2017, the Compensation Committee granted two PRSU awards to the Company's Chief Executive Officer, both of which have both performance and service conditions. The first award was a one-year PRSU and the second award was a
103
two-year PRSU. The one-year PRSUs would be earned based on the Company’s performance as it relates to a revenue growth metric and a minimum non-GAAP operating margin metric during the fiscal year ended June 30, 2018 with eligibility up to 200% of the targeted number of units based on revenue growth if the minimum non-GAAP operating margin is achieved. If the performance metrics were met, 50% of the PRSUs would vest at June 30, 2018 while the remainder would vest in equal amounts over the following ten quarters if the Company's Chief Executive Officer continued to be employed during those ten quarters. In December 2019, the Compensation Committee of the Company's Board of Directors determined that the Company achieved the revenue and non-GAAP operating margin metrics for the fiscal year ended June 30, 2018 at a level that entitled the Chief Executive Officer to 200% of the originally targeted number of shares subject to the one-year PRSU. 50% of the PRSUs so earned were vested as of June 30, 2018, and an additional 20% of the PRSUs vested during the four quarters ended June 30, 2019, in accordance with the terms of the grant.
The two-year PRSUs would be earned based on the Company’s performance for the average non-GAAP operating margin metric for the two fiscal years ended June 30, 2019 with eligibility up to 100% of the targeted number of units. If the performance metrics would have been met, 50% of the PRSUs would have vested at June 30, 2019 while the remainder would have been vested in equal amounts over the following ten quarters if the Chief Executive Officer continued to be employed during those ten quarters. In December 2019, the Compensation Committee of the Company's Board of Directors has determined that the Company did not achieve the required performance metrics for these two-year PRSUs to be earned and, consequently, this PRSU terminated in December 2019.
The following table summarizes RSUs and PRSUs activity during the fiscal years ended June 30, 2019 and 2018 under all plans:
Time-based RSUs Outstanding | Weighted Average Grant-Date Fair Value per Share | PRSUs Outstanding | Weighted Average Grant-Date Fair Value per Share | ||||||||||||
Balance as of June 30, 2016 | 926,983 | $ | 30.23 | — | |||||||||||
Granted | 808,020 | 23.73 | — | ||||||||||||
Released | (411,739 | ) | 27.41 | — | |||||||||||
Forfeited | (96,907 | ) | 26.40 | — | |||||||||||
Balance as of June 30, 2017 | 1,226,357 | 26.11 | — | ||||||||||||
Granted | 986,680 | 21.90 | 120,000 | (1) | $ | 27.10 | |||||||||
Released (2) | (572,789 | ) | 26.34 | — | |||||||||||
Forfeited | (159,643 | ) | 24.90 | — | |||||||||||
Balance as of June 30, 2018 | 1,480,605 | 23.34 | 120,000 | 27.10 | |||||||||||
Granted | 1,086,911 | 18.37 | — | ||||||||||||
Released (2) | (549,886 | ) | 24.87 | — | |||||||||||
Forfeited | (144,528 | ) | 20.25 | — | |||||||||||
Balance as of June 30, 2019 | 1,873,102 | $ | 20.25 | 120,000 | $ | 27.10 | |||||||||
__________________________
(1) | Reflects the number of PRSUs that have been earned based on the achievement of performance metrics. |
(2) | The number of shares released excludes 172,857 RSUs that were vested but not released in fiscal year 2019. The number of shares released also excludes 24,000 and 60,000 PRSUs that were vested but not released in fiscal years 2019 and 2018, respectively. These vested RSUs and PRSUs will be released upon the effectiveness of the Company's registration statement on Form S-8. |
The total pretax intrinsic value of RSUs and PRSUs vested was $14.3 million, $16.8 million and $11.3 million for the fiscal years ended June 30, 2019, 2018 and 2017, respectively. In fiscal years 2019, 2018 and 2017, upon vesting and release, 549,886, 572,789 and 411,739 shares of RSUs were partially net share-settled such that the Company withheld 175,044, 199,715 and 144,994 shares, respectively, with value equivalent to the employees' minimum statutory obligation for the applicable income and other employment taxes, and remitted the cash to the appropriate taxing authorities. The total shares withheld were based on the value of the RSUs on their respective vesting dates as determined by the Company's closing stock price. Total payments for the employees' tax obligations to tax authorities were$3.1 million, $4.5 million and $3.6 million for
104
the fiscal years ended June 30, 2019, 2018 and 2017, respectively, and are reflected as a financing activity within the consolidated statements of cash flows. These net-share settlements had the effect of share repurchases by the Company as they reduced and retired the number of shares that would have otherwise been issued as a result of the vesting and did not represent an expense to the Company. Pursuant to the terms of the 2016 Plan, shares withheld in connection with net-share settlements are returned to the 2016 Plan and are available for future grants under the 2016 Plan.
Note 14. Income Taxes
The components of income before income tax provision for the fiscal years ended June 30, 2019, 2018 and 2017 are as follows (in thousands):
Years Ended June 30, | |||||||||||
2019 | 2018 | 2017 | |||||||||
United States | $ | 45,126 | $ | 39,394 | $ | 82,078 | |||||
Foreign | 44,397 | 48,821 | 9,513 | ||||||||
Income before income tax provision | $ | 89,523 | $ | 88,215 | $ | 91,591 | |||||
The income tax provision for the fiscal years ended June 30, 2019, 2018 and 2017, consists of the following (in thousands):
Years Ended June 30, | |||||||||||
2019 | 2018 | 2017 | |||||||||
Current: | |||||||||||
Federal | $ | 12,308 | $ | 11,090 | $ | 26,033 | |||||
State | 2,917 | 815 | 695 | ||||||||
Foreign | 16,531 | 12,984 | 4,001 | ||||||||
31,756 | 24,889 | 30,729 | |||||||||
Deferred: | |||||||||||
Federal | (13,078 | ) | 14,304 | (6,782 | ) | ||||||
State | (2,888 | ) | 265 | 353 | |||||||
Foreign | (906 | ) | (1,015 | ) | 134 | ||||||
(16,872 | ) | 13,554 | (6,295 | ) | |||||||
Income tax provision | $ | 14,884 | $ | 38,443 | $ | 24,434 | |||||
105
The Company’s net deferred tax assets as of June 30, 2019 and 2018 consist of the following (in thousands):
June 30, | |||||||
2019 | 2018 | ||||||
R&D credit | $ | 20,858 | $ | 16,281 | |||
Deferred revenue | 18,963 | 10,347 | |||||
Inventory valuation | 11,856 | 7,354 | |||||
Stock-based compensation | 6,080 | 5,119 | |||||
Accrued vacation and bonus | 2,681 | 2,276 | |||||
Warranty accrual | 1,948 | 1,669 | |||||
Marketing fund accrual | 554 | 678 | |||||
Other | 4,559 | 3,644 | |||||
Total deferred income tax assets | 67,499 | 47,368 | |||||
Deferred tax liabilities-depreciation and other | (5,406 | ) | (5,504 | ) | |||
Valuation allowance | (20,967 | ) | (16,281 | ) | |||
Deferred income tax assets, net | 41,126 | 25,583 | |||||
The Company assesses its deferred tax assets for recoverability on a regular basis, and where applicable, a valuation allowance is recorded to reduce the total deferred tax asset to an amount that will, more likely than not, be realized in the future. As of June 30, 2019, the Company believes that most of its deferred tax assets are “more-likely-than not” to be realized with the exception of California R&D tax credits that have not met the “more-likely than not” realization threshold criteria. As a result, at June 30, 2019, the gross excess credits of $26.4 million, or net of federal tax benefit of $20.9 million, are subject to a full valuation allowance. At June 30, 2018, the gross excess credits of $20.5 million, or net of federal tax benefit of $16.2 million, are subject to a full valuation allowance. The change in valuation allowance from 2018 to 2019 is $4.7 million. The Company will continue to review its deferred tax assets in accordance with the applicable accounting standards. The net deferred tax assets balance as of June 30, 2019 and 2018 was $41.1 million and $25.6 million, respectively.
In December 2017, the U.S. federal government enacted the 2017 Tax Reform Act. The 2017 Tax Reform Act reduced the U.S. federal corporate income tax rate from 35% to 21% effective January 1, 2018 and created a one-time transition tax on foreign earnings of U.S. subsidiaries that were not previously subject to U.S. income tax. Under U.S. GAAP, changes in tax rates and tax law are accounted for in the period of enactment and deferred tax assets and liabilities are measured at the enacted tax rate. As a result, the Company has completed its analysis and has recorded a one-time $12.9 million, net write down of its U.S. deferred tax assets and liabilities resulting from the U.S. federal corporate income tax rate decrease from 35% to 21%, and a one-time transition tax of $2.8 million, in its income tax provision for the fiscal year ended June 30, 2018. The Company expects further guidance may be forthcoming from the federal and state tax agencies, which could result in additional impacts.
The 2017 Tax Reform Act also creates a new requirement that Global Intangible Low-Taxed Income (“GILTI”) earned by controlled foreign corporations (“CFCs”) that must be included currently in the gross income of a CFC’s U.S. stockholder starting in the tax year that begins after 2017. The tax impact from GILTI has been recorded in the Company's income tax provision for the fiscal year ended June 30, 2019, net of foreign tax credit, and is not material to the Company's income tax provision for the fiscal year ended June 30, 2019.
Under U.S. GAAP, the Company is allowed to make an accounting policy choice of either (i) treating taxes due on future U.S. inclusions in taxable income related to GILTI as a current-period expense when incurred (the “period cost method”) or (ii) factoring such amounts into a company’s measurement of its deferred taxes. The Company's selection of an accounting policy for the fiscal year ended June 30, 2018 with respect to the GILTI tax rules is to treat GILTI tax as a current period expense under the period cost method.
Under the 2017 Tax Reform Act, starting on July 1, 2018, the Company is no longer subject to federal income tax on earnings remitted from our foreign subsidiaries. The Company previously asserted that all of its foreign undistributed earnings were indefinitely reinvested. As a result of the 2017 Tax Reform Act, the Company has determined that its foreign undistributed earnings are indefinitely reinvested except for Netherlands. The Company may repatriate foreign earnings from Netherlands which are previously taxed income as a result of the 2017 Tax Reform Act. The tax impact of such repatriation is estimated to be immaterial.
106
The following is a reconciliation for the fiscal years ended June 30, 2019, 2018 and 2017, of the statutory rate to the Company’s effective federal tax rate:
Years Ended June 30, | |||||||||
2019 | 2018 | 2017 | |||||||
Tax at statutory rate | 21.0 | % | 28.1 | % | 35.0 | % | |||
Uncertain tax positions | 2.5 | 6.3 | (7.6 | ) | |||||
Stock-based compensation | 2.1 | 1.8 | 2.5 | ||||||
Settlement with tax authority | 1.6 | — | 2.0 | ||||||
Foreign tax rate differences | 1.1 | (6.0 | ) | 0.8 | |||||
State income tax, net of federal tax benefit | 0.5 | (0.1 | ) | 4.6 | |||||
Tax reform related | — | 17.9 | — | ||||||
Qualified production activity deduction | — | (1.3 | ) | (3.0 | ) | ||||
Foreign withholding tax | — | — | 1.1 | ||||||
Federal provision true-up | (1.6 | ) | 1.5 | 0.1 | |||||
Subpart F income inclusion | (2.1 | ) | 0.7 | — | |||||
Research and development tax credit | (9.5 | ) | (8.7 | ) | (9.4 | ) | |||
Other | 1.0 | 3.4 | 0.6 | ||||||
Effective tax rate | 16.6 | % | 43.6 | % | 26.7 | % | |||
As of June 30, 2019, the Company had state research and development tax credit carryforwards of $34.3 million. The state research and development tax credits will carryforward indefinitely to offset future state income taxes.
107
The following table summarizes the activity related to the unrecognized tax benefits (in thousands):
________________________
Gross* Unrecognized Income Tax Benefits | |||
Balance at June 30, 2016 | $ | 19,395 | |
Gross increases: | |||
For current year’s tax positions | 5,732 | ||
For prior years’ tax positions | 1,119 | ||
Gross decreases: | |||
Settlements and releases due to the lapse of statutes of limitations | (7,029 | ) | |
Balance at June 30, 2017 | 19,217 | ||
Gross increases: | |||
For current year’s tax positions | 6,864 | ||
For prior years’ tax positions | — | ||
Gross decreases: | |||
Settlements and releases due to the lapse of statutes of limitations | (964 | ) | |
Balance at June 30, 2018 | 25,117 | ||
Gross increases: | |||
For current year’s tax positions | 7,789 | ||
For prior years’ tax positions | — | ||
Gross decreases: | |||
Settlements and releases due to the lapse of statutes of limitations | (4,858 | ) | |
Balance at June 30, 2019 | $ | 28,048 | |
*excludes interest, penalties, federal benefit of state reserves
The total amount of unrecognized tax benefits that would affect the effective tax rate, if recognized, was $18.6 million and $16.6 million as of June 30, 2019 and 2018, respectively.
The Company’s policy is to include interest and penalties related to unrecognized tax benefits within the provision for taxes in the consolidated statements of operations. As of June 30, 2019 and 2018, the Company had accrued $1.5 million and $1.3 million for the payment of interest and penalties relating to unrecognized tax benefits, respectively.
In October 2019, the Taiwan tax authority completed its audit in Taiwan for fiscal year 2018 and proposed a transfer pricing adjustment on the Company which resulted in additional tax liability of $1.6 million. The Company accepted the proposed adjustment in October 2019 and intends to pay the $1.6 million tax liability in January 2020. The impact of this adjustment on the income statement will be offset by the release of previously unrecognized tax benefits related to the fiscal year audited in the period in which the proposed adjustment was accepted.
The Company believes that it has adequately provided reserves for all uncertain tax positions; however, amounts asserted by tax authorities could be greater or less than the Company’s current position. Accordingly, the Company’s provision on federal, state and foreign tax related matters to be recorded in the future may change as revised estimates are made as or the underlying matters are settled or otherwise resolved.
The federal statute of limitations remains open in general for tax years ended June 30, 2016 through 2019. Various states statute of limitations remain open in general for tax years ended June 30, 2015 through 2019. Certain statutes of limitations in major foreign jurisdictions remain open in general for the tax years ended June 30, 2013 through 2019. It is reasonably possible that our gross unrecognized tax benefits will decrease by approximately $4.8 million in the next 12 months, primarily due to the lapse of the statute of limitations. These adjustments, if recognized, would positively impact our effective tax rate, and would be recognized as additional tax benefits.
108
Note 15. Commitments and Contingencies
Litigation and Claims— In February 2018, the Company became a party to legal proceedings whereby complainants have alleged that it has violated Section 10(b) of the Securities Exchange Act due to alleged misrepresentations and/or omissions. In July 2019, the Company filed a motion to dismiss which remains pending. See Note 19, "Subsequent Events" for further details. From time to time, the Company has been involved in various legal proceedings arising from the normal course of business activities. In management’s opinion, the resolution of any matters will not have a material adverse effect on the Company’s consolidated financial condition, results of operations or liquidity.
The Company has entered into indemnification agreements with its current and former directors and executive officers. Under these agreements, the Company has agreed to indemnify such individuals to the fullest extent permitted by law against liabilities that arise by reason of their status as directors or officers and to advance expenses incurred by such individuals in connection with related legal proceedings. It is not possible to determine the maximum potential amount of payments the Company could be required to make under these agreements due to the limited history of prior indemnification claims and the unique facts and circumstances involved in each claim. However, the Company maintains directors and officers liability insurance coverage to reduce its exposure to such obligations.
Purchase Commitments— The Company has agreements to purchase inventory and non-inventory items primarily through the next 12 months. As of June 30, 2019, these remaining noncancelable commitments were $299.8 million, including $101.6 million for related parties.
Lease Commitments—The Company leases offices and equipment under noncancelable operating leases which expire at various dates through 2026. In addition, the Company leases certain of its equipment under capital leases. The future minimum lease commitments under all leases are as follows (in thousands):
Year ending: | Capital Leases | Operating Leases | |||||
June 30, 2020 | $ | 164 | $ | 6,582 | |||
June 30, 2021 | 103 | 3,831 | |||||
June 30, 2022 | 40 | 2,439 | |||||
June 30, 2023 | 1 | 1,175 | |||||
June 30, 2024 | — | 1,166 | |||||
Thereafter | — | 2,279 | |||||
Total minimum lease payments | 308 | $ | 17,472 | ||||
Less: Amounts representing interest | 14 | ||||||
Present value of minimum lease payments | 294 | ||||||
Less: Long-term portion | 140 | ||||||
Current portion | $ | 154 | |||||
Rent expense for the fiscal years ended June 30, 2019, 2018 and 2017, was $6.7 million, $5.9 million and $5.0 million, respectively.
Standby Letter of Credit - In October 2018, Bank of America issued a standby letter of credit on behalf of the Company to a beneficiary for an initial value of $3.2 million to facilitate the ongoing operations of the Company. The standby letter of credit is automatically extended without amendment for successive one-year periods from the original expiration date of November 1, 2019 and will do so until canceled through written notice from the issuer. In October 2019, upon the Company's request, Bank of America increased the amount under the letter of credit issued to the beneficiary to $6.4 million. No amounts have been drawn under the standby letter of credit.
Note 16. Retirement Plans
109
The Company sponsors a 401(k) savings plan for eligible United States employees and their beneficiaries. Contributions by the Company are discretionary, and no contributions have been made by the Company for the fiscal years ended June 30, 2019, 2018 and 2017.
Beginning in March 2003, employees of Super Micro Computer, B.V. are required to deduct a portion of their gross wages based on a defined age-dependent premium and invest the amount in a defined contribution plan. The Company is required to match the amount that is deducted monthly from employees’ wages. Similar to contributions into a 401(k) plan, the Company's obligation is limited to the contributions made to the contribution plan. Investment risk and investment rewards are assumed by the employees and not by the Company. For the fiscal years ended June 30, 2019, 2018 and 2017, the Company’s matching contribution was $0.5 million, $0.5 million, and $0.4 million, respectively.
The Company contributes to a defined contribution pension plan administered by the government of Taiwan that covers all eligible employees within Taiwan. Pension plan benefits are based primarily on participants’ compensation and years of service credited as specified under the terms of Taiwan’s plan. The funding policy is consistent with the local requirements of Taiwan. The Company's obligation is limited to the contributions made to the pension plan. The Company has no control over the investment strategy of the assets of the government administered pension plan. For the fiscal years ended June 30, 2019, 2018 and 2017, the Company’s contribution was $1.6 million, $1.5 million and $1.9 million, respectively.
Note 17. Segment Reporting
The Company operates in one operating segment that develops and provides high performance server solutions based upon an innovative, modular and open-standard architecture. The Company’s chief operating decision maker is the Chief Executive Officer.
The following is a summary of property, plant and equipment, net (in thousands):
June 30, | |||||||
2019 | 2018 | ||||||
Long-lived assets: | |||||||
United States | $ | 162,835 | $ | 151,567 | |||
Asia | 41,915 | 42,533 | |||||
Europe | 2,587 | 2,531 | |||||
$ | 207,337 | $ | 196,631 | ||||
The Company’s revenue is presented on a disaggregated basis in Note 3, “Revenue” by type of product, by geographical market, and by products sold through its indirect sales channel or to its direct customers and OEMs.
Note 18. Quarterly Financial Information (Unaudited)
The following table presents the Company’s unaudited consolidated quarterly financial data. This information has been prepared on a basis consistent with that of the audited consolidated financial statements. The Company believes that all necessary adjustments, consisting of normal recurring accruals and adjustments, have been included to present fairly the quarterly financial data. The Company's quarterly results of operations for these periods are not necessary indicative of future results of operations.
110
Three Months Ended | |||||||||||||||||||||||||||||||
Jun. 30 | Mar. 31 | Dec. 31 | Sep. 30, | Jun. 30 | Mar. 31 | Dec. 31 | Sep. 30, | ||||||||||||||||||||||||
2019 | 2019 | 2018 | 2018 | 2018 | 2018 | 2017 | 2017 | ||||||||||||||||||||||||
(In thousands, except per share data) | |||||||||||||||||||||||||||||||
Net sales | $ | 854,234 | $ | 743,499 | $ | 931,509 | $ | 971,118 | $ | 981,662 | $ | 835,110 | $ | 826,983 | $ | 716,737 | |||||||||||||||
Gross Profit | $ | 132,034 | $ | 112,327 | $ | 127,922 | $ | 123,239 | $ | 132,329 | $ | 105,917 | $ | 105,694 | $ | 86,054 | |||||||||||||||
Net income (loss) | $ | 23,710 | $ | 10,646 | $ | 18,220 | $ | 19,342 | $ | 26,274 | $ | 14,595 | $ | (783 | ) | $ | 6,079 | ||||||||||||||
Net income (loss) per common share: | |||||||||||||||||||||||||||||||
Basic | $ | 0.47 | $ | 0.21 | $ | 0.37 | $ | 0.39 | $ | 0.53 | $ | 0.30 | $ | (0.02 | ) | $ | 0.12 | ||||||||||||||
Diluted | $ | 0.46 | $ | 0.21 | $ | 0.36 | $ | 0.37 | $ | 0.50 | $ | 0.28 | $ | (0.02 | ) | $ | 0.12 | ||||||||||||||
Note 19. Subsequent Events
On February 8, 2018, two putative class action complaints were filed against us, our CEO, and our former CFO in the U.S. District Court for the Northern District of California (Hessefort v. Super Micro Computer, Inc., et al., No. 18-cv-00838 and United Union of Roofers v. Super Micro Computer, Inc., et al., No. 18-cv-00850). The complaints contain similar allegations, claiming that the defendants violated Section 10(b) of the Securities Exchange Act due to alleged misrepresentations and/or omissions in public statements regarding recognition of revenue. The court subsequently appointed New York Hotel Trades Council & Hotel Association of New York City, Inc. Pension Fund as lead plaintiff and it filed an amended complaint naming our Senior Vice President of Investor Relations as an additional defendant. On June 21, 2019, plaintiff filed a further amended complaint naming our former Senior Vice President of International Sales, Corporate Secretary, and Director as an additional defendant. On July 26, 2019, we filed a motion to dismiss which remains pending. We believe the allegations filed are without merit and intend to vigorously defend against the lawsuit.
As a result of the 2017 Tax Reform Act, in December 2019, the Company realigned its international business operations and group structure. As a part of this restructuring, the Company moved certain intellectual property back to the United States. This tax restructuring is not expected to have a material impact on the estimated annual effective tax rate.
Item 9. Changes in and Disagreements with Accountants on Accounting and Financial Disclosure
None.
Item 9A. Controls and Procedures
Background
Prior to the issuance of the Company’s consolidated financial statements for the fiscal year ended June 30, 2017, the audit committee (the “Audit Committee”) of the Company’s Board of Directors (the “Board”) investigated and assessed certain accounting and internal control matters at the Company, principally focused on certain revenue recognition matters. Concurrently, new members of the Company’s management, under the direction of the Audit Committee, performed a thorough analysis of the Company’s historical financial statements, accounting policies and financial reporting, as well as the Company’s disclosure controls and procedures and its internal control over financial reporting. Management concluded that our disclosure controls and procedures were not effective as of June 30, 2017 because of certain material weaknesses in our internal control over financial reporting, as described in our 2017 10-K.
The Company is committed to remediating these material weaknesses and strengthening its internal control over financial reporting, and our management has developed a comprehensive plan for this remediation and strengthening. In consultation with the Audit Committee, our management began developing this plan during the comprehensive analysis described above and continued developing it after we filed the 2017 10-K. We began to implement certain elements of the plan during fiscal years 2018 and 2019, and have continued to implement the plan during the current fiscal year. Among other actions, our actions to date have included both strengthening existing individual controls and designing and implementing new individual controls. However, before our management can conclude that these new and strengthened controls are sufficient to remediate the material weaknesses, the controls must operate effectively for a sufficient period of time. As of June 30, 2019,
111
sufficient time had not elapsed since we implemented the new and strengthened controls for our management to determine that they operated effectively as of that date. For this reason, although we have taken many actions to strengthen our internal control over financial reporting and the Company’s disclosure controls and procedures, our management did not conclude that any of the material weaknesses identified in the 2017 10-K had been remediated as of June 30, 2019. The actions we have taken to address these material weaknesses are described below under “Remediation Plan and Status.”
In connection with the preparation and filing of this Annual Report on Form 10-K, we have conducted the requisite evaluations of the effectiveness of our disclosure controls and procedures and of our internal control over financial reporting, both as of June 30, 2019.
Evaluation of Disclosure Controls and Procedures
Under the supervision, and with the participation, of our management, including our Chief Executive Officer (“CEO”) and Chief Financial Officer (“CFO”), we evaluated the effectiveness of our disclosure controls and procedures as defined in Rules 13a-15(e) and 15d-15(e) under the Securities Exchange Act of 1934, as amended (the “Exchange Act”), as of June 30, 2019. Based on this evaluation of our disclosure controls and procedures, our CEO and CFO have concluded that our disclosure controls and procedures were not effective as of June 30, 2019 because of certain material weaknesses in our internal control over financial reporting, as further described below.
Notwithstanding the conclusion by our CEO and CFO that our disclosure controls and procedures as of June 30, 2019 were not effective, and notwithstanding the material weaknesses in our internal control over financial reporting described below, management believes that the consolidated financial statements and related financial information included in this Annual Report fairly present in all material respects our financial condition, results of operations and cash flows as of the dates presented, and for the periods ended on such dates, in conformity with accounting principles generally accepted in the United States of America (“U.S. GAAP”).
Management’s Report on Internal Control Over Financial Reporting
Management is responsible for establishing and maintaining adequate internal control over financial reporting, as such term is defined in Exchange Act Rules 13a-15(f) and 15d-15(f).
Internal control over financial reporting is a process designed by, or under the supervision of, our CEO and CFO to provide reasonable assurance regarding the reliability of financial reporting and the preparation of our consolidated financial statements for external purposes in accordance with U.S. GAAP. Management’s internal control over financial reporting includes those policies and procedures that (i) pertain to the maintenance of records that, in reasonable detail, accurately and fairly reflect the transactions and dispositions of our assets, (ii) provide reasonable assurance that transactions are appropriately recorded to permit preparation of financial statements in accordance with U.S. GAAP and that our receipts and expenditures are made only in accordance with authorizations of management, acting under authority delegated to them by the Board, and (iii) provide reasonable assurance regarding prevention or timely detection of unauthorized acquisition, use or disposition of our assets that could have a material effect on our financial statements.
Management, including our CEO and CFO, assessed our internal control over financial reporting as of June 30, 2019. In making this assessment, management used the criteria set forth by the Committee of Sponsoring Organizations of the Treadway Commission in its Internal Control - Integrated Framework (2013) (the “COSO Framework”). Based on this assessment, management has determined that we did not maintain effective internal control over financial reporting as of June 30, 2019 because of the material weaknesses described below.
A material weakness in internal controls is a deficiency, or a combination of deficiencies, in internal control over financial reporting, such that there is a reasonable possibility that a material misstatement of our annual or interim financial statements will not be prevented or detected on a timely basis. Because of its inherent limitations, even appropriate internal control over financial reporting may not prevent or detect misstatements.
In connection with management’s assessment of the Company’s internal control over financial reporting described above, management has identified the deficiencies described below that constitute material weaknesses in our internal control over financial reporting as of June 30, 2019.
Control Environment
112
In our Annual Report on Form 10-K for the year ended June 30, 2017 we disclosed the identification of deficiencies in the control environment component of the COSO Framework that constituted material weaknesses, either individually or in the aggregate. These deficiencies related to all the principles associated with the control environment component of the COSO Framework.
We are committed to remediating the underlying cause of these material weaknesses and are taking actions to enhance our internal control over financial reporting relating to the material weaknesses. However, we are still in the process of implementing our comprehensive remediation plan and we have not had sufficient time to test the effectiveness of the new and strengthened controls as of June 30, 2019. Consequently, deficiencies that constitute material weaknesses, either individually or in the aggregate, in the control environment and other components remain.
The material weaknesses noted above cannot be considered remediated until each control has been appropriately designed, has operated for a sufficient period of time, and management has concluded, through testing, that the control is operating effectively. Due to the interdependencies between the COSO Framework components, the material weakness in our control environment contributed to other material weaknesses within our system of internal control over financial reporting.
Risk Assessment
We identified deficiencies in the risk assessment component of the COSO Framework that aggregated to a material weakness. These deficiencies related to the principles associated with the risk assessment component of the COSO Framework, specifically principles within the component related to: (i) identifying, assessing, and communicating appropriate control objectives, (ii) identifying and analyzing risks to achieve these objectives, (iii) contemplating fraud risks, and (iv) identifying and assessing changes in the business that could impact the system of internal controls. As of June 30, 2019, our risk assessment component framework had not yet operated for a sufficient period of time for us to determine its effectiveness.
Control Activities
We identified deficiencies in the control activities component of the COSO Framework that aggregated to a material weakness. These deficiencies related to principles associated with the control activities component of the COSO Framework, specifically principles within the component related to (i) selecting and developing control activities that mitigate risks, (ii) selecting and developing general controls over technology and (iii) deploying control activities through policies that establish what is expected and procedures that put policies into action. We did not design or operate certain control activities to sufficiently respond to potential risks of material misstatement in the area of revenue recognition. We did not effectively select and develop certain information technology (“IT”) general controls and we also had control deficiencies at both the IT administrator and end-user levels across multiple applications relevant to financial reporting. We also had deficiencies related to segregation of duties. Deficiencies in control activities contributed to the potential for there to have been material accounting errors in substantially all financial statements account balances and disclosures.
Information and Communication
We identified deficiencies in the information and communication component of the COSO Framework that aggregated to a material weakness. These deficiencies related to principles associated with the information and communications component of the COSO Framework, specifically principles within the component related to (i) generating and using relevant quality information and (ii) internally communicating information, including objectives and responsibilities for internal control, necessary to support the functioning of internal control. We rely on manual business processes to compensate for a lack of extensive integration in our information systems. We also rely heavily on each of our various functions, such as sales, operations, accounting, legal and management, to communicate to the other functions information that the entire organization needs to operate an effective internal control environment. In certain areas, our control activity deficiencies resulted from insufficient communication of information among our internal functions.
Monitoring of Controls
We identified deficiencies in the monitoring of controls component of the COSO Framework that aggregated to a material weakness. There were deficiencies related to a principle associated with the monitoring of controls component of the COSO Framework, specifically selecting, developing and performing ongoing and/or separate evaluations. We lacked controls (i) to determine whether components of internal control were present and functioning and (ii) to detect incorrect accounting practices.
The material weaknesses noted above contributed to the following additional material weaknesses:
113
Revenue Recognition Accounting
We identified deficiencies in revenue recognition accounting controls that resulted in material weaknesses, either individually or in the aggregate, as we did not appropriately design, or effectively operate, internal controls over certain aspects of accurate recording, presentation, and disclosure of revenue and related costs. The following were contributing factors to the material weaknesses in revenue recognition accounting:
• | Our internal controls did not consistently identify and properly account for certain key non-standard contract or arrangement terms for sales transactions. |
• | Our internal controls failed to consistently identify transactions where the terms of the sales arrangements with our customers were not properly documented in a form that fully reflected the final understanding between the parties as to the specific nature and terms of the agreed-upon transaction. |
• | Our internal controls failed to consistently identify, resolve, document, and allow for proper accounting where there were inconsistencies among the various documents underlying our sales transactions, and we did not always communicate the existence or resolution of those inconsistencies to our accounting organization to enable the proper recognition of revenue. |
• | Internal controls intended to establish a consistent approach for reviewing pricing and establishing supportable estimates of standalone selling price in allocating revenue between multiple performance obligations have not been implemented for a sufficient period of time to demonstrate the controls were operating effectively. |
Information Technology General Controls
We identified deficiencies related to IT general controls that represented a material weakness, either individually or in the aggregate. The following were contributing factors to the material weakness in information technology and general controls:
• | We have a decentralized approach to developing IT policies and practices and to monitoring our IT controls. As a result, our internal procedures for granting and monitoring employee access, and managing changes to various applications and infrastructure layers relevant to our financial reporting are not consistent across those applications and infrastructure layers. In addition, some of our internally-developed applications relevant to financial reporting lack system tracking capabilities to monitor access changes or application changes. We have also authorized certain users with broad access, both as a user and as an administrator, to all parts of our primary accounting system without adequate monitoring or recording of how they used that access. As a result of these factors, we have material weaknesses related to access controls and change management. The fact that we have material weaknesses related to access controls and change management means that it is possible that our business process controls that depend on the affected information systems, or that depend on data or financial reports generated from the affected information systems, could be adversely affected due to the access control and change management issues, although we have identified no instances of any adverse effect due to these deficiencies. |
The effectiveness of our internal control over financial reporting as of June 30, 2019 has been audited by Deloitte & Touche LLP, our independent registered public accounting firm, as stated in its report that is included herein.
Remediation Plan and Status
As previously disclosed, starting in the second half of fiscal year 2018 and throughout fiscal year 2019, we began to design and implement processes and procedures to remediate material weaknesses identified as of June 30, 2017.
Our management is committed to remediating identified control deficiencies (including both those that rise to the level of a material weakness and those that do not), fostering continuous improvement in our internal controls and enhancing our overall internal controls environment. Our management believes that these remediation actions, along with additional actions, when fully implemented, will remediate the material weaknesses we have identified and strengthen our internal control over financial reporting. We are committed to improving our internal control processes and intend to continue to review and improve our financial reporting controls and procedures. As we continue to evaluate and work to improve our internal control over financial reporting, we may take additional or different measures to address control deficiencies with the overall objective to
114
design and operate internal controls that mitigate identified risks and enable an effective system of internal control over external financial reporting.
We have taken the following actions, among others, to address previously disclosed material weaknesses:
• | Restructured our sales organization, which resulted in the resignations of the Senior Vice President of International Sales, the Senior Vice President of Worldwide Sales, the Vice President, Strategic Accounts, the Vice President, Strategic Sales, the Vice President, Business Development and certain other sales personnel. |
• | Appointed experienced professionals to key accounting and finance and compliance leadership positions, including the appointments of a new Chief Financial Officer and a new Corporate Controller in January 2018, and the creation of, and appointments to, two newly established roles of Chief Compliance Officer and Vice President of Internal Audit in May 2018 and August 2018, respectively. |
• | Reviewed and amended our Code of Conduct to align with the organizational changes described above and to strengthen certain provisions regarding compliance and reporting violations of the Code of Conduct. |
• | Adopted an Internal Audit Charter setting forth the responsibilities of the internal audit function and establishing that the Vice President of Internal Audit reports directly to the Audit Committee and that the Audit Committee has authority to provide adequate funding for this function. |
• | Changed our organizational structure to narrow the scope of responsibilities of certain of our senior executives and to revise various reporting relationships, which included the appointment of a new Senior Vice President of Worldwide Sales, and a new Senior Vice President of Operations. |
• | Conducted training in the following areas: |
– | Revenue recognition training for our global sales force, various operations personnel, and certain senior executives, including our CEO, which included detailed examples of acceptable and unacceptable sales practices, |
– | Reviewed with our senior management team our amended Code of Conduct, |
– | Reviewed with our CEO enhanced processes for periodic evaluations by the CEO and the CFO of the effectiveness of our disclosure controls and procedures, and the periodic assessments by the CEO and the CFO of the effectiveness of our internal control over financial reporting, and other compliance matters, and |
– | Shipping and cut-off training for accounting and operations personnel that included new requirements for quarter-end procedures. |
• | Enhanced the sales sub-certification document that supports our CEO’s and CFO’s financial statement certifications and expanded the sub-certification participation population to the global sales force. |
To date, we have taken the following actions related to material weaknesses that, as of June 30, 2019, had not yet been fully implemented or had not been in place for a sufficient period of time to demonstrate that they were having their desired effect:
• | Upgraded our accounting department to include the new roles of Senior Director of Tax, Financial Audit Director and Information Technology Audit Director, as well as replaced certain of our accounting personnel with more experienced individuals, including rebuilding and expanding our revenue recognition team. |
• | Enhanced the financial statement risk assessment and fraud risk assessment which are a foundational element of our Sarbanes-Oxley compliance program. |
• | Implemented a sequence of meetings around our processes to prepare and report on the consolidated financial statements that promotes cross-functional communication and broadens the accountability for internal controls. |
• | Implemented new revenue recognition processes and controls to: |
– | Effect an appropriate cutoff of shipping activity |
– | Increase the alignment of invoicing with physical shipment |
– | Identify and account for transactions that may not have met revenue recognition criteria |
– | Appropriately account for the allocation of revenue among performance obligations |
115
• | Assigned accountability for certain internal controls to our Compliance Department, such as our organizational-wide quarterly sales certification process. |
• | Conducted a process by which employees re-certified their understanding of, and compliance with, the Company’s Code of Conduct. |
• | Adopted a charter for our compliance program to promote an organizational culture that encourages the highest standards of ethical business conduct and compliance with the law, exercises appropriate due diligence to prevent and detect unlawful conduct, and protects the Company’s reputation. |
Our management believes that meaningful progress has been made on the remaining remediation efforts. Management regards successful completion of our remaining remediation actions as an important priority. Some of the more significant remaining remediation activities include:
• | Developing and implementing an ongoing compliance training program regarding significant accounting and financial reporting matters, as well as broad compliance matters, for accounting, financial reporting, sales and operations personnel, as well as for our CEO, our other corporate executives and the Board. |
• | Integrating the responsibility for internal controls across business functions to assign accountability for internal controls beyond the accounting and finance team. |
• | Increasing standardization and automation within accounting processes to improve the reliability of information used by existing accounting personnel. |
• | Implementing a governance committee for our Sarbanes-Oxley compliance program and assigning individual accountability for internal controls. |
• | Redesigning and implementing necessary changes to the existing system of internal controls in the context of the revised and more comprehensive risk assessment. |
• | Updating selected policies and assigning accountable policy owners related to revenue recognition. |
• | Reevaluating the boundary applications that interface with our primary accounting and reporting application and redesigning logical access and program change controls to enhance the reliability of information used to conduct other internal controls. |
• | Implementing and/or enhancing IT general controls and segregation of duties controls: |
– | Monitoring instances in which individuals are granted broad access |
– | Strengthening provisioning of privileged access roles |
– | Developing change management capabilities in certain boundary applications and implementing new change management controls |
• | Identifying and properly accounting for non-standard terms, including increased information sharing between Sales and other departments on sales transactions |
• | Identifying and resolving instances in which customer contracts and purchase orders have conflicting terms, including the new processes to ensure customer master data is complete, accurate and updated as needed on a timely basis |
• | Enhancing procedures to ensure contracts create enforceable rights and obligations, including standardizing the method by which we accept customer purchase orders. |
• | Developing a system of daily reports related to revenue recognition that enable ongoing monitoring for non-standard transactions and the appropriate allocation of revenue among performance obligations. |
• | Testing of sufficient instances of the performance of controls to determine operational effectiveness. |
Changes in Internal Control Over Financial Reporting
116
Other than the ongoing remediation efforts described above, there were no changes in our internal control over financial reporting identified in connection with the evaluation required by Rule 13a-15(d) and 15d-15(d) of the Exchange Act that occurred during the three months ended June 30, 2019 that have materially affected, or are reasonably likely to materially affect, our internal control over financial reporting.
117
REPORT OF INDEPENDENT REGISTERED PUBLIC ACCOUNTING FIRM
To the shareholders and the Board of Directors of Super Micro Computer, Inc.
Opinion on Internal Control over Financial Reporting
We have audited the internal control over financial reporting of Super Micro Computer, Inc. and subsidiaries (the “Company”) as of June 30, 2019, based on criteria established in Internal Control - Integrated Framework (2013) issued by the Committee of Sponsoring Organizations of the Treadway Commission (COSO). In our opinion, because of the effect of the material weaknesses identified below on the achievement of the objectives of the control criteria, the Company has not maintained effective internal control over financial reporting as of June 30, 2019, based on criteria established in Internal Control - Integrated Framework (2013) issued by COSO.
We have also audited, in accordance with the standards of the Public Company Accounting Oversight Board (United States) (PCAOB), the consolidated financial statements as of and for the year June 30, 2019, of the Company and our report dated December 19, 2019, expressed an unqualified opinion on those financial statements and included an explanatory paragraph regarding the Company’s change in method of accounting for revenue in fiscal year 2019 due to the adoption of Accounting Standards Codification 606, Revenue from Contracts with Customers.
Basis for Opinion
The Company’s management is responsible for maintaining effective internal control over financial reporting and for its assessment of the effectiveness of internal control over financial reporting, included in the accompanying Management’s Report on Internal Control Over Financial Reporting. Our responsibility is to express an opinion on the Company’s internal control over financial reporting based on our audit. We are a public accounting firm registered with the PCAOB and are required to be independent with respect to the Company in accordance with the U.S. federal securities laws and the applicable rules and regulations of the Securities and Exchange Commission and the PCAOB.
We conducted our audit in accordance with the standards of the PCAOB. Those standards require that we plan and perform the audit to obtain reasonable assurance about whether effective internal control over financial reporting was maintained in all material respects. Our audit included obtaining an understanding of internal control over financial reporting, assessing the risk that a material weakness exists, testing and evaluating the design and operating effectiveness of internal control based on the assessed risk, and performing such other procedures as we considered necessary in the circumstances. We believe that our audit provides a reasonable basis for our opinion.
Definition and Limitations of Internal Control over Financial Reporting
A company’s internal control over financial reporting is a process designed to provide reasonable assurance regarding the reliability of financial reporting and the preparation of financial statements for external purposes in accordance with generally accepted accounting principles. A company’s internal control over financial reporting includes those policies and procedures that (1) pertain to the maintenance of records that, in reasonable detail, accurately and fairly reflect the transactions and dispositions of the assets of the company; (2) provide reasonable assurance that transactions are recorded as necessary to permit preparation of financial statements in accordance with generally accepted accounting principles, and that receipts and expenditures of the company are being made only in accordance with authorizations of management and directors of the company; and (3) provide reasonable assurance regarding prevention or timely detection of unauthorized acquisition, use, or disposition of the company’s assets that could have a material effect on the financial statements.
Because of its inherent limitations, internal control over financial reporting may not prevent or detect misstatements. Also, projections of any evaluation of effectiveness to future periods are subject to the risk that controls may become inadequate because of changes in conditions, or that the degree of compliance with the policies or procedures may deteriorate.
Material Weaknesses
A material weakness is a deficiency, or a combination of deficiencies, in internal control over financial reporting, such that there is a reasonable possibility that a material misstatement of the company’s annual or interim financial statements will not be prevented or detected on a timely basis. The following material weaknesses have been identified and included in management's assessment:
118
Control Environment
The Company has identified deficiencies in the control environment component of the COSO Framework that constituted material weaknesses, either individually or in the aggregate. These deficiencies related to all the principles associated with the control environment component of the COSO Framework. The Company is still in the process of implementing its comprehensive remediation plan and has not had sufficient time to test the effectiveness of certain remediation actions as of June 30, 2019. Consequently, deficiencies that constitute material weaknesses, either individually or in the aggregate, in the control environment and other components remain.
Due to the interdependencies between the COSO Framework components, the material weakness in the control environment contributed to other material weaknesses within the Company’s system of internal control over financial reporting.
Risk Assessment
The Company identified deficiencies in the risk assessment component of the COSO Framework that aggregated to a material weakness. These deficiencies related to the principles associated with the risk assessment component of the COSO Framework, specifically principles within the component related to: (i) identifying, assessing, and communicating appropriate control objectives, (ii) identifying and analyzing risks to achieve these objectives, (iii) contemplating fraud risks, and (iv) identifying and assessing changes in the business that could impact the system of internal controls. As of June 30, 2019, the Company’s risk assessment component framework had not yet operated for a sufficient period of time to determine its effectiveness.
Control Activities
The Company identified deficiencies in the control activities component of the COSO Framework that aggregated to a material weakness. These deficiencies related to principles associated with the control activities component of the COSO Framework, specifically principles within the component related to (i) selecting and developing control activities that mitigate risks, (ii) selecting and developing general controls over technology and (iii) deploying control activities through policies that establish what is expected and procedures that put policies into action. The Company did not design or operate certain control activities to sufficiently respond to potential risks of material misstatement in the area of revenue recognition. The Company did not effectively select and develop certain information technology (“IT”) general controls and also had control deficiencies at both the IT administrator and end-user levels across multiple applications relevant to financial reporting. The Company also had deficiencies related to segregation of duties. Deficiencies in control activities contributed to the potential for there to have been material accounting errors in substantially all financial statements account balances and disclosures.
Information and Communication
The Company identified deficiencies in the information and communication component of the COSO Framework that aggregated to a material weakness. These deficiencies related to principles associated with the information and communications component of the COSO Framework, specifically principles within the component related to (i) generating and using relevant quality information and (ii) internally communicating information, including objectives and responsibilities for internal control, necessary to support the functioning of internal control. The Company relies on manual business processes to compensate for a lack of extensive integration in their information systems. The Company also relies heavily on each of the various functions, such as sales, operations, accounting, legal and management, to communicate to the other functions information that the entire organization needs to operate an effective internal control environment. In certain areas, control activity deficiencies resulted from insufficient communication of information among internal functions.
Monitoring of Controls
The Company identified deficiencies in the monitoring of controls component of the COSO Framework that aggregated to a material weakness. There were deficiencies related to a principle associated with the monitoring of controls component of the COSO Framework, specifically selecting, developing and performing ongoing and/or separate evaluations. The Company lacked controls (i) to determine whether components of internal control were present and functioning and (ii) to detect incorrect accounting practices.
The material weaknesses noted above contributed to the following additional material weaknesses:
Revenue Recognition Accounting
The Company identified deficiencies in revenue recognition accounting controls that resulted in material weaknesses, either individually or in the aggregate, as the Company did not appropriately design, or effectively operate, internal controls
119
over certain aspects of accurate recording, presentation, and disclosure of revenue and related costs. The following were contributing factors to the material weaknesses in revenue recognition accounting:
• | Internal controls did not consistently identify and properly account for certain key non-standard contract or arrangement terms for sales transactions. |
• | Internal controls failed to consistently identify transactions where the terms of the sales arrangements with customers were not properly documented in a form that fully reflected the final understanding between the parties as to the specific nature and terms of the agreed-upon transaction. |
• | Internal controls failed to consistently identify, resolve, document, and allow for proper accounting where there were inconsistencies among the various documents underlying sales transactions, and the Company did not always communicate the existence or resolution of those inconsistencies to the accounting organization to enable the proper recognition of revenue. |
• | Internal controls intended to establish a consistent approach for reviewing pricing and establishing supportable estimates of standalone selling price in allocating revenue between multiple performance obligations have not been implemented for a sufficient period of time to demonstrate the controls were operating effectively. |
Information Technology General Controls
The Company identified deficiencies related to IT general controls that represented a material weakness, either individually or in the aggregate. The following were contributing factors to the material weakness in information technology and general controls:
• | The Company has a decentralized approach to developing IT policies and practices and to monitoring our IT controls. As a result, the Company’s internal procedures for granting and monitoring employee access and managing changes to various applications and infrastructure layers relevant to financial reporting are not consistent across those applications and infrastructure layers. In addition, some of the Company’s internally-developed applications relevant to financial reporting lack system tracking capabilities to monitor access changes or application changes. The Company has also authorized certain users with broad access, both as a user and as an administrator, to all parts of the primary accounting system without adequate monitoring or recording of how they used that access. As a result of these factors, the Company has material weaknesses related to access controls and monitoring for changes to applications. The fact that the Company had material weaknesses related to access controls and change management means that it is possible that business process controls that depend on the affected information systems, or that depend on data or financial reports generated from affected information systems, could be adversely affected due to the access control and change management issues, although the Company has identified no instances of any adverse effect due to these deficiencies. |
These material weaknesses were considered in determining the nature, timing, and extent of audit tests applied in our audit of the consolidated financial statements as of and for the year ended June 30, 2019, of the Company, and this report does not affect our report on such financial statements.
/s/ Deloitte & Touche LLP
San Jose, California
December 19, 2019
Item 9B. Other Information
None.
120
PART III
Item 10. Directors, Executive Officers, and Corporate Governance
Executive Officers and Directors
The following table sets forth information regarding our current directors and executive officers and their ages as of November 30, 2019:
Name | Age | Position(s) | ||
Charles Liang | 62 | President, Chief Executive Officer and Chairman of the Board | ||
Kevin Bauer | 59 | Senior Vice President, Chief Financial Officer | ||
Alex Hsu | 71 | Chief Operating Officer | ||
Don Clegg | 60 | Senior Vice President of Worldwide Sales | ||
George Kao | 59 | Senior Vice President of Operations | ||
David Weigand | 61 | Senior Vice President, Chief Compliance Officer | ||
Sara Liu | 58 | Co-Founder, Senior Vice President and Director | ||
Daniel W. Fairfax (1)(4) | 64 | Director | ||
Michael S. McAndrews (1)(4) | 66 | Director | ||
Hwei-Ming (Fred) Tsai (1)(2)(3)(4) | 64 | Director | ||
Saria Tseng (2)(3)(4) | 49 | Director | ||
Sherman Tuan (2)(3)(4) | 66 | Director | ||
Tally Liu (1)(4) | 68 | Director | ||
__________________________
(1)Member of the Audit Committee
(2)Member of the Compensation Committee
(3)Member of the Nominating and Corporate Governance Committee
(4)Determined by the Board of Directors to be “independent”
Executive Officers and Management Directors
Charles Liang founded Super Micro and has served as our President, Chief Executive Officer and Chairman of the Board since our inception in September 1993. Mr. Liang has been developing server and storage system architectures and technologies for the past two decades. From July 1991 to August 1993, Mr. Liang was President and Chief Design Engineer of Micro Center Computer Inc., a high-end motherboard design and manufacturing company. From January 1988 to April 1991, Mr. Liang was Senior Design Engineer and Project Leader for Chips & Technologies, Inc., a chipset technology company, and Suntek Information International Group, a system and software development company. Mr. Liang has been granted many server technology patents. Mr. Liang holds an M.S. in Electrical Engineering from the University of Texas at Arlington and a B.S. in Electrical Engineering from National Taiwan University of Science & Technology in Taiwan. Our Nominating and Corporate Governance Committee (“Governance Committee”) concluded that Mr. Liang should serve on the Board based on his skills, experience and qualifications in managing technology businesses, his technical expertise, and his long familiarity with our company’s business.
Kevin Bauer has served as our Senior Vice President, Chief Financial Officer since January 2018 and previously served as our Senior Vice President, Corporate Development and Strategy beginning January 2017. Prior to his employment with our company, Mr. Bauer was the Senior Vice President and Chief Financial Officer of Pericom Semiconductor Corporation, a semiconductor company, from February 2014 until its sale to Diodes, Incorporated in November 2015 and, thereafter, assisted Diodes with the integration of Pericom until November 2016. Prior to that he was Chief Financial Officer of Exar Corporation, a semiconductor manufacturer, from June 2009 through December 2012, Corporate Controller from August 2004 to June 2009 and Operations Controller from February 2001 to August 2004. Previously, Mr. Bauer was Operations Controller at WaferTech LLC (a subsidiary of Taiwan Semiconductor Manufacturing Company Limited) from July 1997 to February 2001. Prior to WaferTech, he was at VLSI Technology for ten years where he held a variety of increasingly more senior finance roles culminating in his position as Director and Group Controller. Mr. Bauer received an M.B.A. from Santa Clara University and a B.S. in Business Administration from California Lutheran University.
121
Alex Hsu serves as our Chief Operating Officer. Mr. Hsu has served in various positions with the Company since October 2003, including as the Chairman of Supermicro Taiwan since February 2018, Sr. Chief Executive of Strategic Business since August 2009, Executive Director of Supermicro Technology (Beijing) Co. Ltd. since August 2009, Chief Sales and Marketing Officer from July 2006 to August 2009, Senior Vice President of Sales from October 2004 to July 2006 and President of European Offices and Vice President of Operations (USA) from October 2003 to October 2004. From January 2002 to September 2003, Mr. Hsu was President and Chief Operating Officer of Bizlink Group, an IT solutions company. From January 2001 to January 2002, he was a private investor and consultant working with startup companies in Silicon Valley. From August 1999 to December 2000, he was President and Chief Operating Officer at Oplink Communications, Inc., a networking solutions company. Mr. Hsu has over 40 years of experience in the IT industry and served in various managerial and executive positions at Philips, Acer, Hewlett-Packard and Umax group. Mr. Hsu holds an M.B.A. and a B.S. in Electrical Engineering from National Chao-Tung University in Taiwan.
Don Clegg serves as our Senior Vice President of Worldwide Sales. He previously served as our Vice President of Marketing and Worldwide Business Development. Mr. Clegg has been an employee since April 2006 and has held various senior sales and marketing roles with the Company during that time. Mr. Clegg started his career as a Design Engineer and evolved from Engineer to Vice President of Sales and Marketing working at several established and startup Silicon Valley system and semiconductor companies. Mr. Clegg graduated with high honors from Brigham Young University, where he earned a B.S. in Electrical Engineering.
George Kao serves as our Senior Vice President of Operations and previously served as our Vice President of Operations. Mr. Kao joined the Company in October 2016. Mr. Kao was Vice President of Operations of Pericom Semiconductor Corp. from October 2006 to September 2016. Mr. Kao served as a Chief Operating Officer of Orient Semiconductor Electronics Philippines, Inc., a subsidiary of Orient Semiconductor Electronics Ltd., from July 2003 to March 2006. Mr. Kao joined Orient Semiconductor Electronics Philippines, Inc. from Santa Clara-based Foveon after a 20-year career in technology in the United States that began at National Semiconductor. Mr. Kao holds a B.S. in Electrical Engineering from California State Polytechnic University in San Luis Obispo.
David Weigand has served as our Senior Vice President, Chief Compliance Officer since May 2018. Prior to his employment with our company, Mr. Weigand was a Vice President at Hewlett Packard Enterprise (HPE) from November 2016 until April 2018 and served as Vice President, Tax at Silicon Graphics International, Inc., from September 2013 until its acquisition by HPE in November 2016. Prior to that he was Vice President, Chief Financial Officer of Renesas Electronics America, a semiconductor company formed by the merger of the semiconductor businesses of NEC Corporation, Hitachi and Mitsubishi Electric from October 2010 until April 2013, and Vice President, Controller of NEC Electronics America from October 2004 until September 2010. Mr. Weigand holds a M.S. degree in Taxation from the University of Hartford and a B.S. degree in Accounting from San Jose State University and is a Certified Public Accountant in California (Inactive).
Sara Liu co-founded Super Micro in September 1993, has been a member of our Board of Directors since March 2007 and currently serves as our Co-Founder, Senior Vice President, and a director. She has held a variety of positions with the Company, including Treasurer from inception to May 2019, Senior Vice President of Operations from May 2014 to February 2018, and Chief Administrative Officer from October 1993 to May 2019. From 1985 to 1993, Ms. Liu held accounting and operational positions for several companies, including Micro Center Computer Inc. Ms. Liu holds a B.S. in Accounting from Providence University in Taiwan. Ms. Liu is married to Mr. Charles Liang, our Chairman, President and Chief Executive Officer. Our Governance Committee concluded that Ms. Liu should serve on the Board based on her skills, experience, her general expertise in business and operations and her long familiarity with our company’s business.
Non-Management Directors
Daniel W. Fairfax has been a member of our Board of Directors since July 2019. Mr. Fairfax served as Senior Vice President and Chief Financial Officer of Brocade Communications, a networking equipment company ("Brocade") from June 2011 to November 2017. Brocade was acquired by Broadcom in November 2017. Mr. Fairfax previously served as Brocade's Vice President of Global Services from August 2009 to June 2011 and Brocade's Vice President of Business Operations from January 2009 to August 2009. Prior to Brocade, Mr. Fairfax served as Chief Financial Officer of Foundry Networks, Inc., from January 2007 until December 2008. Foundry Networks was acquired by Brocade in December 2008. Earlier in his career Mr. Fairfax served in executive financial management and/or general management positions as GoRemote Internet Communications, Ironside Technologies, Acta Technology, NeoVista Software, Siemens and Spectra-Physics. He began his career as a consultant with the National Telecommunications Practice Group of Ernst & Young. Mr. Fairfax currently serves on the board of directors of Energous Corporation, where he is the chair of the audit committee. Mr. Fairfax holds an MBA degree from The University of Chicago Booth School of Business and a Bachelor of Arts degree, with a major in Economics, from
122
Whitman College. Our Governance Committee concluded that Mr. Fairfax should serve on the Board based on his skills, experience, his financial literacy and his familiarity with technology businesses.
Michael S. McAndrews has been a member of our Board of Directors since February 2015. Mr. McAndrews has served as a Principal of Abbott, Stringham & Lynch, an accounting firm serving the Silicon Valley, since September 2013. From June 2002 to June 2013, he served as a Partner at PricewaterhouseCoopers LLP, a multinational professional services network, where he provided tax planning and consulting services to multinational public companies, private companies and their owners and emerging businesses in a variety of industries including high-technology, manufacturing, food processing and wholesale/retail distribution. From November 1979 to June 2002, he worked for Arthur Andersen and Company, a global professional services firm. He served as Partner from 1993 to 2002 where he focused primarily on providing tax planning and compliance services to high technology companies ranging in size from start-ups to large multinational public companies. Mr. McAndrews is a certified public accountant with an active license in California and holds a Bachelor of Science in Commerce, Accounting degree from Santa Clara University. Our Governance Committee concluded that Mr. McAndrews should serve on the Board based on his skills, experience, his financial literacy and his familiarity with technology businesses.
Hwei-Ming (Fred) Tsai has been a member of our Board of Directors since August 2006. Mr. Tsai served as an independent director of ANZ Bank (Taiwan) Limited, a wholly owned subsidiary of Australia and New Zealand Banking Group Limited from September 2013 to April 2019. Mr. Tsai has also served as an independent director of Dynapack International Technology Corporation, a public company in Taiwan, since June 2017. Mr. Tsai has been an independent business consultant since January 2010. Mr. Tsai served as Executive Vice President and Chief Financial Officer of SinoPac Bancorp, a financial holding company based in Los Angeles, California from February 2001 and August 2005, respectively, to December 2009. He also served as Senior Executive Vice President of Far East National Bank, a commercial bank that is held by SinoPac Bancorp from December 2002 to December 2009. Mr. Tsai holds a Master in Professional Accounting from the University of Texas at Austin and a B.A. in Accounting from National Taiwan University in Taiwan. Our Governance Committee concluded that Mr. Tsai should serve on the Board based on his skills, experience and qualifications in capital finance, his financial literacy and his familiarity with our company’s business.
Saria Tseng has been a member of our Board of Directors since November 2016. Ms. Tseng has served as Vice President of Strategic Corporate Development, General Counsel and Secretary of Monolithic Power Systems, Inc. a fabless manufacturer of high-performance analog and mixed-signal semiconductors since 2004. From 2001 to 2004, Ms. Tseng served as Vice President, General Counsel and Corporate Secretary of MaXXan Systems, an enterprise class storage network system. Previously, Ms. Tseng was an attorney at Gray Cary (now DLA Piper) and Jones Day. Ms. Tseng is a member of the state bar in both California and New York and is a member of the bar association of the Republic of China, Taiwan. She holds Master of Law degrees from the University of California at Berkeley and the Chinese Culture University in Taipei. Our Governance Committee concluded that Ms. Tseng should serve on the Board based on her skills, experience and qualifications in business and corporate law, her legal expertise and her familiarity with technology business.
Sherman Tuan has been a member of our Board of Directors since February 2007. Mr. Tuan is founder of PurpleComm, Inc. (doing business as 9x9.tv), a platform for connected TV, where he has served as Chief Executive Officer since January 2005 and Chairman of the Board since June 2003. From September 1999 to May 2002, he was director of Metromedia Fiber Network, Inc., a fiber optical networking infrastructure provider. Mr. Tuan was co-founder of AboveNet Communications, Inc., an internet connectivity solutions provider, where he served as President from March 1996 to January 1998, Chief Executive Officer from March 1996 to May 2002 and director from March 1996 to September 1999. Mr. Tuan holds a degree in Electrical Engineering from Feng-Chia University in Taiwan. Our Governance Committee concluded that Mr. Tuan should serve on the Board based on his skills, experience and qualifications in managing technology businesses, his technical expertise, and his familiarity with our company’s business.
Tally Liu was appointed to our Board of Directors and our Audit Committee on January 30, 2019, and was appointed as the chair of the Audit Committee on June 30, 2019. Mr. Liu has been retired since 2015. Prior to his retirement, Mr. Liu was Chief Executive Officer of Wintec Industries, a supply chain solutions company for high-tech manufacturers, from 2012 to 2015. Prior to Wintec, Mr. Liu served as Chairman of the Board and Chief Executive Officer of Newegg, Inc., an internet consumer technology retailer, from 2008 to 2010, and as President of Newegg in 2008. Prior to Newegg, Mr. Liu held various positions with Knight Ridder Inc., including Vice President, Finance & Advance Technology and Vice President of Internal Audit. Mr. Liu served as President of the International Newspapers Financial Executives (INFE) for one year before it merged with other media associations. A Certified Public Accountant from 1982-2007, Mr. Liu is a member of the American Institute of Certified Public Accountants (AICPA) with retired status, and was previously a member of the Florida Institute of Certified Public Accountants (FICPA). Mr. Liu is also a Certified Information System Auditor (CISA) and Certified Information Security Manager (CISM), with non-practice status, with the Information Systems Audit and Control Association (ISACA) and has also been certified in Control Self-assessment (CCSA) by the Institute of Internal Auditors (IIA). After earning his BA of Commerce
123
from National Chengchi University, Taipei, Taiwan, and MBA from Florida Atlantic University, Mr. Liu received executive leadership training at the Stanford Advanced Finance Program in 1986 and at Harvard Business School in the Advanced Management Program (AMP) in 1998. Mr. Liu is not related to any member of our Board of Directors or any of our officers. Our Governance Committee concluded that Mr. Liu should serve on the Board based on his skills, experience, his financial literacy and his familiarity with technology businesses.
Except for Mr. Charles Liang and Ms. Sara Liu who are married, there are no other family relationships among any of our directors or executive officers.
Composition of the Board
Our authorized number of directors is eight. There are currently eight directors. Our amended and restated certificate of incorporation provides for a classified Board of Directors divided into three classes. The members of each class are elected to serve a term expiring at the third succeeding annual meeting of stockholders after such election. Vacancies may be filled by a majority of the directors then in office, although less than a quorum, or by a sole remaining director. Alternatively, the Board of Directors, at its option, may reduce the number of directors, provided that no decrease in the number of directors constituting the Board of Directors shall shorten the term of any incumbent director.
The current composition of the Board of Directors is:
Class I Directors (1) | Charles Liang Sherman Tuan Tally Liu |
Class II Directors (1) | Daniel W. Fairfax Michael S. McAndrews |
Class III Directors (1) | Sara Liu Hwei-Ming (Fred) Tsai Saria Tseng |
__________________________
(1) | Because we did not, prior to the filing of this Annual Report, file our Annual Reports on Form 10-K for fiscal years 2017 and 2018 in a timely manner, we were unable to hold our annual meetings following the fiscal years 2017 and 2018.. We are not able to hold an annual meeting until such time as we have filed all delinquent Annual Reports on Form 10-K and our Annual Report on Form 10-K for the most recently completed fiscal year. The Class II Directors’ terms were originally to expire at the annual meeting following fiscal 2017, the Class III Directors’ terms were originally to expire at the annual meeting following 2018 and the Class I Directors' terms will expire at the annual meeting following fiscal year 2019, which we expect to hold in the first half of calendar 2020. We expect that the Class I Directors, Class II Directors and Class III Directors will all come up for election at that annual meeting. |
CORPORATE GOVERNANCE
Corporate Governance Guidelines
We have adopted “Corporate Governance Guidelines” to help ensure that the Board of Directors is independent from management, appropriately performs its function as the overseer of management, and that the interests of the Board of Directors and management align with the interests of our stockholders. The “Corporate Governance Guidelines” are available at www.Supermicro.com by first clicking on “About Us” and then “Investor Relations” and then “Corporate Governance.”
Code of Ethics
We have adopted a “Code of Business Conduct and Ethics” that is applicable to all directors, executive officers and employees and embodies our principles and practices relating to the ethical conduct of our business and our long-standing commitment to honesty, fair dealing and full compliance with all laws affecting our business. Our “Code of Business Conduct and Ethics” is available at www.Supermicro.com by first clicking on “About Us” and then “Investor Relations” and then “Corporate Governance.” Any substantive amendment or waiver of the Code relating to executive officers or directors will be made only after approval by our Board of Directors and will be promptly disclosed on our website within four business days.
Director Independence
124
Although our common stock is not currently listed on Nasdaq, we have operated in accordance with Nasdaq listing standards with respect to director independence requirements. The rules of Nasdaq generally require that a majority of the members of a listed company's board of directors be independent. In addition, the listing rules generally require that, subject to specified exceptions, each member of a listed company's audit committee, compensation committee, and nominating and corporate governance committees be independent. Audit Committee members must also satisfy the independence criteria set forth in Rule 10A-3 under the Securities Exchange Act of 1934, as amended (the "Exchange Act") and the listing requirements of The Nasdaq Stock Market. In addition, compensation committee members must satisfy the independence criteria set forth in Rule 10C-1 under the Exchange Act and the listing requirements of The Nasdaq Stock Market.
The Board affirmatively determines the independence of each director and nominee for election as a director in accordance with Nasdaq listing standards.
Based on these standards, our Board of Directors has determined that six of its current eight members, Daniel W. Fairfax, Michael S. McAndrews, Hwei-Ming (Fred) Tsai, Saria Tseng, Sherman Tuan and Tally Liu, are "independent directors" under the applicable rules and regulations of the SEC and the listing requirements and rules of The Nasdaq Stock Market.
Executive Sessions
Non-management directors meet in executive session without management present each time the Board holds its regularly scheduled meetings.
Communications with the Board of Directors
The Board of Directors welcomes the submission of any comments or concerns from stockholders or other interested parties. If you wish to send any communications to the Board of Directors, you may use one of the following methods:
•Write to the Board at the following address:
Board of Directors
Super Micro Computer, Inc.
c/o General Counsel
980 Rock Avenue
San Jose, California 95131
•E-mail the Board of Directors at BODInquiries@supermicro.com
Communications that are intended specifically for the independent directors or non-management directors should be sent to the e-mail address or street address noted above, to the attention of the "Independent Directors."
MEETINGS AND COMMITTEES OF THE BOARD
Board Meetings
Each director is expected to devote sufficient time, energy and attention to ensure diligent performance of his or her duties and to attend all Board and committee meetings. We encourage, but do not require, each Board member to attend our annual meeting of stockholders. We have not held an annual meeting of stockholders since March 1, 2017 (following the completion of our fiscal year on June 30, 2016). The Board held five meetings during fiscal year 2018, four of which were regularly scheduled meetings and one of which was a special meeting. The Board held 16 meetings during fiscal year 2019, four of which were regularly scheduled meetings and 12 of which were special meetings. All directors attended at least 75% of the meetings of the Board and the committees on which they served during the time they were members of the Board or such committees during fiscal year 2018 and during fiscal year 2019, except that Sherman Tuan attended only 21% of such meetings during fiscal year 2019 due to an illness beginning in April 2018. He resumed attending Board and committee meetings on a consistent basis starting in April 2019. For fiscal years 2015, 2016 and 2017, Mr. Tuan’s attendance rate for Board and committee meetings was 100%, 75% and 100%, respectively.
Board Leadership Structure
Our Chairman, Charles Liang, is also our Chief Executive Officer. The Board and our Nominating and Corporate Governance Committee (the "Governance Committee") believe that it is appropriate for Mr. Liang to serve as both the Chief
125
Executive Officer and Chairman due to the relatively small size of our Board, and the fact that Mr. Liang is the founder of our company with extensive experience in our industry. We do not currently have a lead independent director.
Board Role in the Oversight of Risk
The Board exercises oversight over our risk management activities, requesting and receiving reports from management. The Board exercises this oversight responsibility directly and through its committees. Our Board has delegated primary responsibility for oversight of risks relating to financial controls and reporting to our Audit Committee, which in turn reports to the full Board on such matters as appropriate. The Audit Committee also assists the Board in oversight of certain risks, particularly in the areas of internal controls over financial reporting, financial reporting and review of related party transactions.
Our management with oversight from our Compensation Committee has reviewed its compensation policies and practices with respect to risk-taking incentives and risk management and does not believe that potential risks arising from its compensation polices or practices are reasonably likely to have a material adverse effect on our company.
Committees of the Board of Directors
The Board has three standing committees to facilitate and assist the Board in discharging its responsibilities: the Audit Committee, the Compensation Committee and the Governance Committee. In accordance with applicable Nasdaq listing standards, each of these committees is comprised solely of non-employee, independent directors. The charter for each committee is available at www.Supermicro.com by first clicking on “About Us” and then “Investor Relations” and then “Corporate Governance.” In January 2019, the Board of Directors approved amendments to the charters for each of the Audit Committee, the Compensation Committee and the Governance Committee, which amendments are reflected in the descriptions contained herein. The charter of each committee also is available in print to any stockholder who requests it. The following table sets forth the current members of each of the standing Board committees:
Audit Committee | Compensation Committee | Nominating and Corporate Governance Committee | ||
Tally Liu (1) | Sherman Tuan (1) | Hwei-Ming (Fred) Tsai (1) | ||
Daniel W. Fairfax | Hwei-Ming (Fred) Tsai | Saria Tseng | ||
Michael S. McAndrews | Saria Tseng | Sherman Tuan | ||
Hwei-Ming (Fred) Tsai | ||||
__________________________
(1) | Committee Chairperson |
Audit Committee
The Audit Committee has four members. The Audit Committee met nine times in fiscal year 2019, four of which were regularly scheduled meetings and five of which were special meetings. During fiscal year 2018, the Audit Committee met 42 times, four of which were regularly scheduled meetings and 38 of which were special meetings. The Board has determined that each member of our Audit Committee meets the requirements for independence under the applicable listing standards of Nasdaq and the rules of the SEC. The Board has also determined that each member of our Audit Committee is an “audit committee financial expert” as defined under applicable SEC rules.
As outlined more specifically in the Audit Committee charter, the Audit Committee has, among other duties, the following responsibilities:
• | Appoints, retains and approves the compensation of our independent auditors, and the review and evaluation of the auditors’ qualifications, independence and performance; |
• | Oversees the independent auditors’ audit work and reviews and pre-approves all audit and non-audit services that may be performed by them; |
• | Discusses with the independent auditors any audit problems, difficulties and management’s response, and matters that the Public Company Accounting Oversight Board and the SEC require to be discussed with the committee; |
• | Reviews and discusses with management press releases regarding our financial results, as well as financial information and earnings guidance provided to securities analysts and rating agencies; |
• | Reviews and approves the planned scope of our annual audit; |
126
• | Monitors the rotation of partners of the independent auditors on our engagement team as required by law; |
• | Reviews our financial statements and discusses with management and the independent auditors the results of the annual audit and the review of our quarterly financial statements; |
• | Reviews our critical accounting policies and estimates; |
• | Oversees the adequacy of our financial controls; |
• | Periodically reviews with management and the independent auditors our disclosure controls and procedures and internal control over financial reporting; |
• | Reviews and approves the internal audit function’s (i) audit plan, (ii) all major changes to the audit plan, (iii) the scope, progress and results of executing the internal audit plan, and (iv) the annual performance of the internal audit function |
• | Reviews and approves all related party transactions; |
• | Establishes and oversees procedures for the receipt, retention and treatment of complaints regarding accounting, internal controls or auditing matters and oversees enforcement, compliance and remedial measures under our Code of Business Conduct and Ethics; |
• | Initiates investigations and hire legal, accounting and other outside advisors or experts to assist the Audit Committee, as it deems necessary to fulfill its duties; |
• | Periodically discusses with management our major financial risk exposures and steps management has taken to monitor and control the exposures, including our risk assessment and risk management guidelines and policies; and |
• | Reviews and evaluates, at least annually, the adequacy of the Audit Committee charter and recommends any proposed changes to the Board for approval. |
Compensation Committee
The Compensation Committee has three members. The Compensation Committee met seven times in fiscal year 2019, four of which were regularly scheduled meetings and three of which were special meetings. During fiscal year 2018, the Compensation Committee met four times, all of which were regularly scheduled meetings. The Compensation Committee is comprised solely of non-employee directors. The Board has determined that each member of our Compensation Committee meets the requirements for independence under the applicable Nasdaq listing standards.
As outlined more specifically in the Compensation Committee charter, the Compensation Committee has, among other duties, the following responsibilities:
• | Periodically reviews and advises the Board concerning our overall compensation philosophy, policies and plans, including a review and approval of a group of companies for general executive compensation competitive comparisons, approval of target pay and performance objectives against this group, and monitoring of our executive compensation levels and their performance relative to this group; |
• | Reviews and approves corporate goals and objectives relevant to compensation of the Chief Executive Officer and other executive officers; |
• | Evaluates the performance of the Chief Executive Officer and other executive officers in light of those goals and objectives, including generally against the overall performance of executive officers at comparable companies, all while taking into account our risk management policies and practices; |
• | Reviews and approves the compensation of the Chief Executive Officer and other executive officers; |
• | Reviews and approves our incentive compensation plans and equity compensation plans; |
• | Monitors and assesses risks associated with our compensation policies, including whether such policies could lead to unnecessary risk-taking behavior, and consults with management regarding such risks; |
• | Administers the issuance of restricted stock grants, stock options and other equity awards to executive officers, directors and other eligible individuals under our equity compensation plans; and |
• | Reviews and evaluates, at least annually, the performance of the Compensation Committee and its members, including compliance of the Compensation Committee with its charter and the adequacy of the Compensation Committee charter. |
In general, the Compensation Committee discharges the Board's responsibilities regarding the determination of executive compensation, and reviews and makes recommendations to the full Board in the determination of non-employee director compensation. The Compensation Committee also makes recommendations to the full Board regarding non-ordinary course executive compensation matters, including with respect to new or amended employment contracts, severance or change-in-control plans or arrangements. The Compensation Committee may delegate its responsibilities to subcommittees comprised of one or more Compensation Committee members, subject to requirements of our bylaws and applicable laws, regulations and the terms of our executive compensation plans. Additional information about the Compensation Committee's processes for determining executive and non-employee director compensation, including the role of the Compensation Committee's
127
compensation consultant and our executive officers, can be found in the "Executive Compensation" and "2019 Director Compensation" sections of this Annual Report.
Nominating and Corporate Governance Committee
The Governance Committee has three members. The Governance Committee met six times in fiscal year 2019, four of which were regularly scheduled meetings and two of which were special meetings. During fiscal year 2018, the Governance Committee met five times, four of which were regularly scheduled meetings and one of which was a special meeting. The Governance Committee is comprised solely of non-employee directors. The Board has determined that each member of our Governance Committee meets the requirements for independence under the applicable Nasdaq listing standards.
As outlined more specifically in the Governance Committee charter, the Governance Committee has, among other duties, the following responsibilities:
• | Identifies individuals qualified to become directors; |
• | Evaluates and selects, or recommends to the Board, director nominees for each election of directors; |
• | Develops and recommends to the Board criteria for selecting qualified director candidates in the context of the current make-up of the Board; |
• | Considers any nominations of director candidates validly made by our stockholders; |
• | Reviews committee structures and compositions and recommends to the Board concerning qualifications, appointment and removal of committee members; |
• | Develops, recommends for approval by the Board and reviews on an ongoing basis the adequacy of the corporate governance principles applicable us; |
• | Develops and recommends to the Board our Corporate Governance Guidelines; |
• | Reviews, on a periodic basis, the adequacy of our Corporate Governance Guidelines and recommends any proposed changes to the Board; |
• | Oversees compliance with our Corporate Governance Guidelines and reports on such compliance to the Board; |
• | Assists the Board in the evaluation of the Board and each committee; and |
• | Periodically reviews the scope of responsibilities of the Governance Committee and the committee's performance of its duties. |
Delinquent Section 16(a) Reports
The members of the Board, our executive officers and persons who hold more than 10% of our outstanding common stock are subject to the reporting requirements of Section 16(a) of the Exchange Act, which require them to file reports with respect to their ownership of our common stock and their transactions in our common stock. Based upon (i) the copies of Section 16(a) reports that we received from such persons for their fiscal year 2019 and 2018 transactions in our common stock and their common stock holdings and (ii) the written representations, if any, received from one or more of such persons that no annual Form 5 reports were required to be filed by them for fiscal year 2019 or 2018, we believe that all reporting requirements under Section 16(a) were met in a timely manner by the persons who were executive officers, members of the Board or greater than 10% stockholders during such fiscal year, other than one late report made by each of Sherman Tuan, Charles Liang, Sara Liu, and Kevin Bauer in fiscal year 2018, in each case with respect to one transaction.
Item 11. Executive Compensation
EXECUTIVE COMPENSATION
Compensation Discussion and Analysis
In this section we provide an explanation and analysis of the material elements of the compensation provided to our Chief Executive Officer, Chief Financial Officer and other three most highly compensated executive officers who were serving as executive officers at the end of our fiscal years 2019 and 2018 (collectively referred to as our “named executive officers”).
Our named executive officers and their positions during fiscal year 2019 were:
128
Charles Liang | President, Chief Executive Officer and Chairman of the Board |
Kevin Bauer | Senior Vice President, Chief Financial Officer |
Don Clegg | Senior Vice President, Worldwide Sales |
George Kao | Senior Vice President, Operations |
David Weigand | Senior Vice President, Chief Compliance Officer |
Our named executive officers and their positions during fiscal year 2018 were:
Charles Liang | President, Chief Executive Officer and Chairman of the Board |
Kevin Bauer | Senior Vice President, Chief Financial Officer |
Howard Hideshima (1) | Former Senior Vice President, Chief Financial Officer |
Sara Liu | Senior Vice President |
Phidias Chou (1) | Former Senior Vice President, Worldwide Sales |
Wally Liaw (1) | Former Senior Vice President, International Sales |
__________________________
(1) | Messrs. Hideshima, Chou and Liaw resigned effective January 30, 2018. None of them received any severance or other enhanced benefits in connection with their termination of employment. |
Process Overview
The Compensation Committee of the Board discharges the Board’s responsibilities relating to compensation of all of our executive officers. During both fiscal year 2019 and 2018, the Compensation Committee was comprised of three non-employee directors, all of whom are independent pursuant to the applicable listing rules of NASDAQ and Rule 16b-3 under the Exchange Act.
The agenda for meetings is determined by the Chair of the Compensation Committee with the assistance of our Chief Financial Officer. Committee meetings are regularly attended by our Chief Financial Officer and our General Counsel. However, neither our Chief Financial Officer nor our General Counsel attends the portion of meetings during which his own performance or compensation is being discussed. Our Chief Financial Officer and General Counsel support the Compensation Committee in its work by providing information relating to our financial plans, performance assessments of our executive officers and other personnel-related data. In addition, the Compensation Committee has the authority under its charter to hire, terminate and approve fees for advisors, consultants and agents as it deems necessary to assist in the fulfillment of its responsibilities. As part of making an overall assessment of each named executive officer’s role and performance, and structuring our compensation programs for fiscal year 2019 and 2018, respectively, the Compensation Committee reviewed recommendations of our Chief Executive Officer, as well as publicly available peer group compensation data.
Compensation Philosophy and Objectives
Our executive compensation philosophy is to link the named executive officers’ compensation to, and reward, corporate performance. The base salaries, quarterly bonuses and equity award grants for the named executive officers are determined in part by the Compensation Committee reviewing data on prevailing compensation practices of comparable technology companies with whom we compete for executive talent, and generally evaluating such information in connection with our corporate goals and compensation practices, all as further described below. In general, our compensation philosophy has been unchanged over the last several years.
During fiscal year 2018, however, in order to take another step in linking executive pay to performance, our Compensation Committee decided that a significant portion of our Chief Executive Officer’s periodic long-term equity award should be in the form of performance-based restricted stock units (“PRSUs”). In general, PRSUs represent an opportunity to earn a defined number of shares of our common stock if we and/or the recipient achieve pre-set performance goals over time. PRSUs generally encourage long-term commitment to the company and commitment to performance that is designed to boost long-term company results. Mr. Liang received two PRSU grants in fiscal year 2018 that are further described below: one grant with a performance period of one year, running from July 1, 2017 to June 30, 2018; and a second grant with a performance period of two years, running from July 1, 2017 to June 30, 2019. The Compensation Committee currently plans to expand its use of performance-based equity awards like PRSUs in future long-term equity awards to named executive officers in order to more tightly link the investment interests of our stockholders to the compensation interests of our senior executive leaders.
129
The Compensation Committee considers various sources of comparative data when determining executive compensation levels, including compensation data from a sample of public companies assembled for the Compensation Committee by Radford, an Aon Hewitt company ("Radford"). For fiscal years 2019 and 2018 compensation decisions, the sample public companies consisted of the following:
Ciena Corp | Infinera Corporation |
Cray, Inc. | Juniper Networks, Inc. |
Diebold Nixdorf, Inc. | NetApp, Inc. |
Extreme Networks, Inc. | NETGEAR, Inc. |
F5 Networks, Inc. | Plexus Corp. |
In selecting the companies for inclusion in the sample, the following factors were considered: industry comparability, net revenues, operating income, market capitalization and whether the company may compete against us for executive talent. These companies ranged in annual revenue from approximately $455.9 million to $6.1 billion for fiscal year 2019 and from approximately $392.5 million to $5.9 billion for fiscal year 2018. These companies also ranged in operating income (loss) from approximately $1.2 billion to $(362.9) million for fiscal year 2019 and from approximately $1.2 billion to approximately $(183.1) million for fiscal year 2018. For fiscal years 2019 and 2018, our net sales were $3.5 billion and $3.4 billion, respectively, and our operating income was $97.2 million and $94.7 million, respectively.
The Compensation Committee does not benchmark compensation based upon the sample companies reviewed nor does the Compensation Committee employ any other formulaic process in making compensation decisions. Rather, the Compensation Committee uses its subjective judgment based upon a review of all information, including an annual review for each officer of his or her level of responsibility, contributions to our financial results and our overall performance. The Compensation Committee's generalized assessment of these factors influences named executive officer compensation, and this information is not weighted in any specific manner. The Compensation Committee then uses comparative compensation data as a market check on its compensation decisions. Recognizing that over-reliance on external comparisons can be of concern, the Compensation Committee uses external comparisons as only one point of reference and is mindful of the value and limitations of comparative data.
For both fiscal years 2019 and 2018, the compensation paid to several of our named executive officers, including our Chief Executive Officer, was significantly below median compensation levels for similar positions at comparable companies. The Compensation Committee was comfortable with this outcome in light of the level of stock ownership held by such persons, particularly our CEO. Recently, to induce new executives to join our company, we have utilized fixed bonuses until such time as we establish a more formal short-term bonus program. In the future, we may need to increase our recruiting of new executives from outside of our company. This in turn may require us to pay higher or different forms of compensation.
Finally, we believe that creating stockholder value requires not only managerial talent but active and unified participation by all employees. In recognition of this belief, we try to minimize the number of compensation arrangements that are distinct or exclusive to one or more of our named executive officers. We currently provide base salary, quarterly bonus opportunities and long-term equity incentive compensation to a considerable number of our domestic and international employees, in addition to our named executive officers.
Additional Information on the Compensation Committee's Compensation Consultant
For both fiscal years 2019 and 2018, the Compensation Committee directly engaged Radford to assist it in obtaining and reviewing information relevant to named executive officer compensation decisions. The independence and performance of Radford are of the utmost importance to the Compensation Committee. In fiscal year 2019, after Radford had advised the Compensation Committee regarding executive officer compensation decisions, our management commissioned Radford to provide additional services to management for similar compensation studies to evaluate certain components of total compensation for our employees generally. The Compensation Committee has assessed the independence of Radford in the light of all relevant factors, including the additional services and other factors required by the Securities and Exchange Commission, that could give rise to a potential conflict of interest with respect to Radford during fiscal years 2019 and 2018. Based on these reviews and assessments, the Compensation Committee did not identify any conflicts of interest raised by the work performed by Radford.
The Role of the Most Recent Stockholder Say-on-Pay Vote
130
The Compensation Committee, with the entire Board, and our management value the opinions of our stockholders. At our last annual meeting of stockholders, which was held on March 1, 2017 (the "Fiscal Year 2016 Annual Meeting"), we provided our stockholders the opportunity to vote to approve, on an annual advisory basis, the compensation of our named executive officers as disclosed in the proxy statement for our Fiscal Year 2016 Annual Meeting. At the meeting, over 99% of the stockholders who were present and entitled to vote on this “say-on-pay” proposal approved the compensation of our named executive officers. Although the say-on-pay vote was non-binding, the Compensation Committee has considered, and expects to continue to consider, the outcome of the vote when making future compensation decisions for our named executive officers. In determining named executive officer compensation for both fiscal years 2019 and 2018, our Compensation Committee specifically considered the strong support expressed by our stockholders at the Fiscal Year 2016 Annual Meeting in the say-on-pay vote as one factor in deciding that our compensation policies and procedures for fiscal years 2019 and 2018 should largely remain consistent with our policies and procedures in prior years.
Role of Executive Officers in the Compensation Process
Each year, management provides recommendations to the Compensation Committee regarding compensation program design and evaluations of executive and company performance. In particular, in fiscal years 2019 and 2018, our Chief Executive Officer and Chief Financial Officer provided the Compensation Committee with their views on the appropriate company performance considerations for use in our short-term and long-term incentive programs. Management's input was provided based on its view of investor expectations and our operating plans and financial goals. At the end of fiscal years 2019 and 2018, our Chief Executive Officer provided the Compensation Committee with his views of the nature and extent of our performance against expectations. Finally, our Chief Executive Officer also provided the Compensation Committee with regular performance evaluations of the other named executive officers, including his views as to their impact on strategic initiatives and organizational goals, as well as their leadership behaviors. In fiscal years 2019 and 2018, the Compensation Committee also had access to the comparative compensation data discussed above, which had been furnished by Radford. While the Compensation Committee carefully considers all recommendations made by members of management, ultimate authority for all compensation decisions regarding our named executive officers rests with the Compensation Committee and the Board.
Fiscal Year 2019 and 2018 Named Executive Officer Compensation Components
For fiscal years 2019 and 2018, the principal components of compensation for our named executive officers were:
• | Base salary; |
• | Bonuses; and |
• | Equity-based incentive compensation consisting of grants of: (1) for fiscal year 2019, stock options and/or time-based restricted stock units (“RSUs”) to certain named executive officers; and (2) for fiscal year 2018, stock options, time-based RSUs and/or PRSUs to certain named executive officers. |
Base Salary. We pay base salaries to our named executive officers to provide them with a base level of fixed income for services rendered to us. Base salaries for our named executive officers other than the Chief Executive Officer are determined annually by the Compensation Committee based upon recommendations by our Chief Executive Officer, taking into account factors such as salary norms in comparable companies and publicly available data regarding compensation increases in our industry, subjective assessments of the nature of the officers' positions and an annual review of the contribution and experience of each executive officer. For the Chief Executive Officer, the Compensation Committee considers substantially the same type of information, as well as our overall size in terms of annual revenue and number of employees and the Chief Executive Officer’s overall stock ownership.
In determining base salaries for fiscal year 2019, the Compensation Committee decided to maintain all named executive officer base salaries at fiscal year 2018 levels because the Compensation Committee believed it was not appropriate to increase base salaries at a time when we were still in the process of completing our review and analysis of the matters that led to the delay filing the 2017 10-K.
131
Principal Position During Fiscal Year 2019 | Fiscal Year 2018 Base Salary Rate | Fiscal Year 2019 Base Salary Rate | Base Salary % Change | |||||||||
Charles Liang | President, Chief Executive Officer and Chairman of the Board | $ | 365,160 | $ | 365,160 | — | % | |||||
Kevin Bauer | Senior Vice President, Chief Financial Officer | $ | 329,600 | $ | 329,600 | — | % | |||||
Don Clegg | Senior Vice President, Worldwide Sales | $ | 320,000 | $ | 320,000 | — | % | |||||
George Kao | Senior Vice President, Operations | $ | 301,600 | $ | 301,600 | — | % | |||||
David Weigand | Senior Vice President, Chief Compliance Officer | $ | 270,000 | $ | 270,000 | — | % | |||||
In determining base salaries for fiscal year 2018, the Compensation Committee decided to maintain most named executive officer base salaries at fiscal year 2017 levels, except we increased the annual base salary rate for Mr. Bauer by 3.0% in the first quarter of fiscal year 2018 as an annual merit increase, prior to the time that Mr. Bauer was a named executive officer. The Compensation Committee determined to maintain the other named executive officers’ base salary rates at fiscal year 2017 levels in light of the matters that led to the delay in the company filing the 2017 10-K.
Principal Position During Fiscal Year 2018 | Fiscal Year 2017 Base Salary Rate | Fiscal Year 2018 Base Salary Rate | Base Salary % Change | |||||||||
Charles Liang | President, Chief Executive Officer and Chairman of the Board | $ | 365,160 | $ | 365,160 | — | % | |||||
Kevin Bauer | Senior Vice President, Chief Financial Officer | $ | 320,000 | $ | 329,600 | 3.0 | % | |||||
Howard Hideshima (1) | Former Senior Vice President, Chief Financial Officer | $ | 322,023 | $ | 322,023 | — | % | |||||
Sara Liu | Senior Vice President | $ | 238,156 | $ | 238,156 | — | % | |||||
Phidias Chou (1) | Former Senior Vice President, Worldwide Sales | $ | 287,317 | $ | 287,317 | — | % | |||||
Wally Liaw (1) | Former Senior Vice President, International Sales | $ | 233,327 | $ | 233,327 | — | % | |||||
__________________________
(1) | Mr. Hideshima, Mr. Chou and Mr. Liaw resigned effective January 30, 2018. |
Short-term bonuses. We did not pay short-term bonuses to our Chief Executive Officer or to our Senior Vice President and Co-Founder in either fiscal year 2018 or fiscal year 2019. With respect to our other named executive officers, we have individualized short-term cash bonus arrangements. In some cases, these arrangements pre-date the time that these individuals became named executive officers, and in other cases, the arrangements were negotiated at the time the individual was hired or was designated as named executive officer. In some cases, these arrangements provide for fixed bonus payments and in other cases these arrangements provide for variable bonus payments or a hybrid thereof.
Equity-Based Incentive Compensation. Stock options and other equity-based awards are an important component of the total compensation of our named executive officers. We believe that equity-based awards align the interests of each named executive officer with those of our stockholders. They also provide named executive officers a significant, long-term interest in our success and help retain key named executive officers in a competitive market for executive talent. Our 2016 Equity Incentive Plan authorizes the Compensation Committee to grant stock options and other equity-based awards to eligible named executive officers. The number of shares owned by, or subject to equity-based awards held by, each named executive officer is periodically reviewed and additional awards are considered based upon a generalized assessment of past performance of the executive and the relative holdings of other executive officers. The Compensation Committee has historically granted equity awards to employees on a two-year cycle.
Due to the fact that we failed to file our 2017 10-K by its due date, the effectiveness of our registration statement on Form S-8 covering equity awards under our 2016 Equity Incentive Plan was suspended. It has remained suspended since that time, and the effectiveness of this registration statement on Form S-8 will not be revived until we are able to file all our delinquent quarterly and annual reports with the SEC. On advice of counsel, the Compensation Committee has refrained from making equity awards to our named executive officers during the period of time when our registration statement on Form S-8 was not effective. The equity grants to named executive officers described below were all made either (i) at a time when our registration statement on Form S-8 was still effective or (ii) to individuals who had not been designated by the Board as executive officers at the time of grant, but who were, later in the same fiscal year, designated as executive officers by the Board. Once we are again current in our SEC filings and the effectiveness of our registration statement on Form S-8 is revived, our Compensation Committee expects that
132
it will grant additional equity awards to our named executive officers that will reflect the lack of equity awards since the effectiveness of our registration statement on Form S-8 was suspended.
Fiscal Year 2019 Grants. For fiscal year 2019, the Compensation Committee determined to provide certain named executive officers with grants of stock options and/or time-based RSUs. In particular, the Compensation Committee determined to provide the following awards:
Type of Award | Quantity (at Target) of Award | Rationale for Providing (or Not Providing) the Award | |||
Charles Liang | · N/A | · N/A | · Registration statement on Form S-8 not effective | ||
Kevin Bauer | · N/A | · N/A | · Registration statement on Form S-8 not effective | ||
Don Clegg | · Stock options · RSUs | · 20,000 · 6,000 | · Normal refresh grant when not an executive officer · Normal refresh grant when not an executive officer | ||
George Kao | · Stock options | · 5,940 | · Normal refresh grant when not an executive officer | ||
David Weigand | · Stock options · RSUs | · 20,000 · 10,000 | · Initial hire grant; not yet an executive officer · Initial hire grant; not yet an executive officer | ||
Stock Options. In general, for fiscal year 2019, the Compensation Committee used stock options to directly align the compensation interests of participating named executive officers with the investment interests of our stockholders. The stock options described above for Messrs. Clegg and Weigand were granted on July 31, 2018 with a 10-year term and an exercise price equal to the closing market price of our common stock on the grant date ($22.10 per share). The stock options described above for Mr. Kao were granted on October 30, 2018 with a 10-year term and an exercise price equal to the closing market price of our common stock on the grant date ($13.00 per share). These stock options vested as to 25% of the award on May 1, 2019, October 30, 2019 and April 30, 2019 for Messrs. Clegg, Kao and Weigand, respectively, and generally vested (or vest) as to 1/16th of the award per quarter after the first vesting date (fully vested by May 1, 2022, April 30, 2022 and October 30, 2022, respectively). The Compensation Committee provided for these vesting schedules in accordance with our company’s standard practice, which the Compensation Committee believes is common among the companies with whom we compete for talent. The Compensation Committee determined the particular size of the stock option grants for these named executive officers based on our company’s normal refresh grant practices (for Messrs. Clegg and Kao) or the amounts agreed upon at the time of hire (for Mr. Weigand).
RSUs. In general, for fiscal year 2019, RSUs represented the right to receive a defined number of shares of our common stock after completing a period of service established at the grant date, and encourage long-term commitment to the company. Messrs. Clegg and Weigand’s RSUs vested as to 25% of the award on May 16, 2019 and generally vested (or vest) as to 1/16th of the award per quarter after the first vesting date (fully vested by May 16, 2022). The Compensation Committee determined the particular size of the RSU awards for these individuals based on our company’s normal refresh grant practices (for Messrs. Clegg and Kao) or the amounts agreed upon at the time of hire (for Mr. Weigand).
Fiscal Year 2018 Grants. For fiscal year 2018, the Compensation Committee determined to provide certain named executive officers with grants of stock options, time-based RSUs and/or PRSUs. In particular, the Compensation Committee determined to provide the following awards:
Type of Award | Quantity (at Target) of Award | Rationale for Providing (or Not Providing) the Award | |||
Charles Liang | · Stock options · PRSUs (one-year performance period) · PRSUs (two-year performance period) | · 130,000 · 60,000 at target · 60,000 at target | · Refresh grant, registration statement on Form S-8 effective at time of grant · Refresh grant, adding performance element, registration statement on Form S-8 effective at time of grant · Refresh grant, adding different performance element, registration statement on Form S-8 effective at time of grant | ||
Kevin Bauer | · N/A | · N/A | · Registration statement on Form S-8 not effective when became named executive officer | ||
Howard Hideshima | · N/A | · N/A | · Not on schedule for refresh grant | ||
Sara Liu | · N/A | · N/A | · Registration statement on Form S-8 not effective when scheduled for refresh grant | ||
Phidias Chou | · N/A | · N/A | · Not on schedule for refresh grant | ||
Wally Liaw | · N/A | · N/A | · Not on schedule for refresh grant | ||
133
Stock Options. In general, the Compensation Committee used stock options to directly align the compensation interests of the participating named executive officer with the investment interests of our stockholders. The stock options described above were granted on August 2, 2017 with a 10-year term and an exercise price equal to the closing market price of our common stock on the grant date ($26.95 per share). Mr. Liang’s stock options vested immediately as to 12.5% of the award and generally vested (or vest) as to 1/36th of the award per month after the first vesting date (fully vested by August 2, 2020). The Compensation Committee determined the particular size of the stock option grant for Mr. Liang based on its subjective judgment of the appropriate size of this option grant, when coupled with the PRSU grants discussed below, to provide appropriate incentive for Mr. Liang to continue to lead the company into the future.
PRSUs. In general, PRSUs represent an opportunity to earn a defined number of shares of our common stock if we and/or the recipient achieve pre-set performance goals over time. PRSUs generally encourage long-term commitment to the company and commitment to performance that is designed to boost long-term company results. Mr. Liang received two PRSU grants in fiscal year 2018: one grant with a performance period of one year, running from July 1, 2017 to June 30, 2018; and a second grant with a performance period of two years, running from July 1, 2017 to June 30, 2019. The rationale for the two separate grants was to have two different performance metrics on which Mr. Liang should focus: revenue growth in fiscal year 2018 (for the first PRSU) and non-GAAP operating margin for fiscal years 2018 and 2019 (for the second PRSU).
The first PRSU provided for 60,000 RSUs at target, with the opportunity to earn from zero to as many as 120,000 RSUs based on revenue growth in fiscal year 2018 over fiscal year 2017, as reflected in our audited financial statements; provided that if non-GAAP operating margin was not at least 3.5%, no RSUs would be earned, regardless of growth. Our company exceeded the revenue growth target for earning the maximum number of units for fiscal year 2018, so that Mr. Liang earned 120,000 RSUs. The second PRSU also provided for 60,000 RSUs at target (specified average non-GAAP operating margin over the two-year period comprised of fiscal years 2018 and 2019), as reflected in our audited financial statements and a defined calculation of adjustments from the GAAP financial statement to reach the non-GAAP operating margin. 60,000 units was the maximum number that could be earned under the second PRSU. Our company did not achieve the minimum average non-GAAP operating margin specified for fiscal years 2018 and 2019, so none of the units under the second PRSU were earned, and the PRSU expired. The Compensation Committee did not apply any discretion in determining whether the performance metrics had been met, nor did it adjust the metrics after they had been established.
In addition to their performance-based conditions, the PRSUs were subject to service-based vesting as follows: one-half of each earned award was to vest on the final day of its performance period; the remaining portion of the one-year PRSUs then vested on the last day of each of the company’s next 10 fiscal quarters; and the remaining portion of the two-year PRSUs would have then vested (or vest) on the last day of each of the company’s next six fiscal quarters (but no PRSUs were earned based on our company’s performance).
The Compensation Committee determined the particular size of PRSU grants for Mr. Liang based on its subjective judgment of the appropriate size for these PRSU grants when coupled with the option grant discussed above needed to provide appropriate incentive for Mr. Liang to continue to lead the company into the future and to focus on the specific performance metrics associated with each PRSU grant.
Stock Ownership Guidelines
Other than as discussed below under “Stock Retention Policy,” we currently do not require our directors or executive officers to own a particular amount of our common stock. The Compensation Committee is satisfied that stock and option holdings among our directors and named executive officers has historically been sufficient to provide motivation and to align this group’s interests with those of our stockholders. We have not been able to make equity awards to our Board members since the effectiveness of our registration statement on Form S-8 was suspended in October 2017. The Compensation Committee believes that, once we are again able to make such equity awards to our Board members, their stock and stock option holdings will again align their interests with the interests of our stockholders. Our insider trading policy prohibits any of our directors, executive officers, employees or contractors from engaging in any transactions in publicly-traded options, such as puts and calls, and other derivative securities, including any hedging or similar transaction, with respect to our common stock.
Stock Retention Policy
We have adopted a stock retention policy which requires that our Chief Executive Officer hold a significant portion of the shares of our common stock acquired under our equity incentive plan for at least 36 months. Under the policy, the Chief Executive Officer must retain at least 50% of all “net” shares received (“net” shares means those shares remaining after the sale or withholding of shares in payment of the exercise price, if applicable, and withholding taxes) for at least 36 months following the date on which an equity award is vested, settled or exercised, as applicable.
134
Recoupment Policy
We established a Recoupment Policy that is applicable to our named executive officers. Under the Recoupment Policy, if we are required to prepare an accounting restatement due to material noncompliance with the financial reporting requirements under United States securities laws, the Compensation Committee shall be entitled to recover from any current or former executive officer any excess incentive-based compensation received by such person during the three-year period prior to the date on which we are required to prepare the restatement. This Recoupment Policy applies to both equity-based and cash-based incentive compensation awards. The “excess incentive-based compensation” is the difference between the actual amount that was paid, and the amount that would have been paid under the restated financial results.
As indicated in the Explanatory Note, certain consolidated financial statements included in our 2017 10-K were restated. Our Compensation Committee has reviewed whether any of our executive officers or former executive officers received excess incentive-based compensation. The committee concluded that no executive officer or former executive officer received excess incentive-based compensation and, accordingly, determined not to pursue any potential recoupment from any executive officer or former executive officer.
Other Benefits
Health and Welfare Benefits
Our named executive officers receive the same health and welfare benefits as are offered to our other employees, including medical, dental, vision, life, accidental death and dismemberment and disability insurance coverage, flexible spending account participation and holiday pay. The same contribution amounts, percentages and plan design provisions are applicable to all employees. We offer these health and welfare benefits generally to help provide a competitive compensation package to employees to assist with the attraction, hiring and retention of employees.
Retirement Program
Our named executive officers may participate in the same tax-qualified, employee-funded 401(k) plan that is offered to all our other employees. We do not maintain a supplemental executive retirement plan, nor do we offer any defined benefit retirement plans or other defined contribution plans to our named executive officers. We offer these retirement program benefits generally to help provide a competitive compensation package to employees to assist with the attraction, hiring and retention of employees.
Perquisites
We do not provide perquisites or personal benefits to any of our named executive officers.
Employment Arrangements, Severance and Change of Control Benefits
We have not entered into employment agreements with any of our named executive officers. Mr. Hideshima had, and each of Messrs. Bauer, Clegg, Kao and Weigand currently has, a signed offer letter which provides for at-will employment. Each such offer letter provides for an initial base salary rate, an initial stock option grant and rights to participate in our employee benefit plans as described above. We do not have any written employment arrangements with Mr. Liang. We do not have any arrangements with any of our named executive officers that provide for any severance or other benefits in the event of termination or change of control of our company.
Tax and Accounting Treatment of Compensation
In our review and establishment of named executive officer compensation programs and payments, we consider, but do not place substantial emphasis on, the anticipated accounting and tax treatment of our compensation programs to us and our named executive officers. Among other factors that receive greater consideration are the net costs to us and our ability to effectively administer executive compensation in the short and long-term interests of stockholders.
Section 162(m) of the U.S. Internal Revenue Code of 1986, as amended (the “Code”), generally limits a company’s ability to deduct for tax purposes compensation in excess of $1.0 million paid in any single tax year to certain executive officers (and, beginning in 2018, certain former executive officers). Prior to 2017 tax reform legislation, compensation deemed to be performance-based in accordance with Section 162(m) could be exempt from this $1.0 million limitation, and compensation paid
135
to the Chief Financial Officer was not subject to the deductibility limitation of Section 162(m). After the 2017 tax reform legislation, performance-based exception no longer applies, except for the performance-based compensation that is grandfathered; and compensation paid to the Chief Financial Officer is subject to the deductibility limitation of Section 162(m). This legislation change does not have material impact to the Company for fiscal year 2019. The future impact is dependent on the future stock value of the Company. We continue to evaluate the impact of the 2017 tax reform legislation and related guidance and regulations for their potential impact on our company. Regardless of that impact, however, we will continue to design and maintain executive compensation arrangements that we believe will attract and retain the executive talent that we need to compete successfully, even if in certain cases such compensation is not deductible for federal income tax purposes. In addition, because of the uncertainties associated with the application and interpretation of Section 162(m) and the regulations issued thereunder, there can be no assurance that compensation intended to satisfy the requirements for deductibility under Section 162(m), as in effect prior to 2018, will in fact be deductible.
We account for equity compensation paid to our employees in accordance with Financial Accounting Standards Board Accounting Standards Codification Topic 718, Stock-Compensation (“ASC Topic 718”), which requires us to estimate and record expenses for each award of equity compensation over the service period of the award.
We intend that our plans, arrangements and agreements will be structured and administered in a manner that complies with (or is exempt from) the requirements of Section 409A of the Code. Participation in, and compensation paid under, our plans, arrangements and agreements may, in certain instances, result in the deferral of compensation that is subject to the requirements of Section 409A. If our plans, arrangements and agreements as administered fail to meet certain requirements under or exemptions from Section 409A, compensation earned thereunder may be subject to immediate taxation and tax penalties.
Summary
The Committee believes that our compensation philosophy and programs are designed to foster a performance-oriented culture that aligns our named executive officers’ interests with those of our stockholders. The Committee also believes that the compensation of our named executive officers is both appropriate and responsive to the goal of building stockholder value.
Compensation Committee Report
The Compensation Committee has reviewed and discussed the Compensation Discussion and Analysis (“CD&A”) with our management. Based on this review and these discussions, the Compensation Committee recommended to the Board of Directors that the CD&A be included in this Annual Report.
This report has been furnished by the Compensation Committee.
Sherman Tuan, Chair
Hwei-Ming (Fred) Tsai
Saria Tseng
Fiscal Year 2019 Summary Compensation Table
The following table sets forth information concerning the reportable compensation for our 2019 named executive officers for the fiscal years ended 2019, 2018 and 2017, as applicable.
FISCAL YEAR 2019 SUMMARY COMPENSATION TABLE
136
Name and Principal Position | Year | Salary ($)(1) | Bonus ($)(2) | Stock Awards ($)(3) | Option Awards ($)(4) | Non-Equity Incentive Plan Compensation ($) | Change in Pension Value and Nonqualified Deferred Compensation Earnings ($) | All Other Compensation ($) | Total ($) | |||||||||||||||||||||||||
Charles Liang | 2019 | $ | 386,212 | $ | — | $ | — | $ | — | $ | — | $ | — | $ | — | $ | 386,212 | |||||||||||||||||
President, Chief Executive Officer and Chairman of the Board | 2018 | 386,212 | — | 3,252,000 | 1,644,005 | — | — | — | 5,282,217 | |||||||||||||||||||||||||
2017 | 386,212 | 650 | — | — | — | — | — | 386,862 | ||||||||||||||||||||||||||
Kevin Bauer | 2019 | 340,356 | 80,004 | — | — | — | — | — | 420,360 | |||||||||||||||||||||||||
Senior Vice President and Chief Financial Officer | 2018 | 328,000 | 80,304 | — | — | — | — | — | 408,304 | |||||||||||||||||||||||||
2017 | 150,360 | 40,002 | 426,750 | 1,045,600 | — | — | — | 1,662,712 | ||||||||||||||||||||||||||
Don Clegg | 2019 | 336,910 | 146,419 | 132,600 | 215,600 | — | — | — | 831,529 | |||||||||||||||||||||||||
Senior Vice President | 2018 | 279,041 | 17,275 | — | — | — | — | 296,316 | ||||||||||||||||||||||||||
2017 | 264,062 | 7,123 | 19,924 | 37,150 | — | — | — | 328,259 | ||||||||||||||||||||||||||
George Kao | 2019 | 305,060 | 4,262 | — | 39,323 | — | — | — | 348,645 | |||||||||||||||||||||||||
Senior Vice President, Operations | 2018 | 299,667 | 3,016 | 161,700 | 252,924 | — | — | — | 717,307 | |||||||||||||||||||||||||
2017 | 208,763 | 20,650 | — | — | — | — | — | 229,413 | ||||||||||||||||||||||||||
David Weigand | 2019 | 270,000 | 48,921 | 221,000 | 215,600 | — | — | — | 755,521 | |||||||||||||||||||||||||
Senior Vice President, Chief Compliance Officer | 2018 | 46,038 | 15,000 | — | — | — | — | — | 61,038 | |||||||||||||||||||||||||
2017 | — | — | — | — | — | — | — | — | ||||||||||||||||||||||||||
__________________________
(1) | Amounts disclosed under "Salary" for fiscal year 2019 includes leave pay earned by the named executive officers for fiscal year 2019. |
(2) | Amounts disclosed under “Bonus” for fiscal year 2019 reflect primarily fixed amounts per the terms of employment offer letters or upon promotion, quarterly profit sharing and/or our sales bonus program. |
(3) | Amounts disclosed for fiscal year 2019 represent the grant date fair value of RSU awards granted during fiscal year 2019 calculated in accordance with ASC Topic 718 and are based on the closing market price of our common stock on the date of grant. |
(4) | Amounts disclosed for fiscal year 2019 represent the grant date fair value of each stock option award granted during fiscal year 2019 calculated in accordance with ASC Topic 718, using the Black Scholes option-pricing model. Assumptions used in the calculation of these amounts are included in Part II, Item 8, "Financial Statements and Supplementary Data", and Part II, Item 8, Note 13 “Stock-based Compensation and Stockholders’ Equity”, to our consolidated financial statements for fiscal year 2019 included in this Annual Report. |
Fiscal Year 2019 Grants of Plan-Based Awards
The following table provides information concerning all plan-based awards granted during fiscal year 2019 to each of our named executive officers.
FISCAL YEAR 2019 GRANTS OF PLAN-BASED AWARDS TABLE
Name | Grant Date | All Other Stock Awards: Number of Shares of Stock or Units (#) | All Other Option Awards: Number of Securities Underlying Options (#) | Exercise or Base Price of Option Awards ($/Sh) | Grant Date Fair Value of Stock and Option Awards ($)(1) | ||||||||||||||
Charles Liang | — | — | — | $ | — | $ | — | ||||||||||||
Kevin Bauer | — | — | — | — | — | ||||||||||||||
Don Clegg | 7/31/2018 | 6,000 | (2) | — | — | 132,600 | |||||||||||||
7/31/2018 | — | 20,000 | (3) | 22.10 | 215,600 | ||||||||||||||
George Kao | 10/30/2018 | — | 5,940 | (4) | 13.00 | 39,323 | |||||||||||||
David Weigand | 7/31/2018 | — | 20,000 | (5) | 22.10 | 215,600 | |||||||||||||
7/31/2018 | 10,000 | (6) | — | — | 221,000 | ||||||||||||||
__________________________
137
(1) | Represents the fair value of the stock options and RSU awards as of the date of grant, computed in accordance with ASC Topic 718. |
(2) | This RSU award vested at the rate of 25% on May 16, 2019 and generally vested (or will vest) at a rate of 1/16th per quarter thereafter, such that the RSUs will be fully vested on May 16, 2022. |
(3) | This stock option grant vested at the rate of 25% on May 1, 2019 and generally vested (or will vest) at a rate of 1/16th per quarter thereafter, such that the granted options will be fully vested on May 1, 2022. |
(4) | This stock option grant vested at the rate of 25% on October 30, 2019 and generally will vest at a rate of 1/16th per quarter thereafter, such that the granted options will be fully vested on October 30, 2022. |
(5) | This stock option grant vested at the rate of 25% on April 30, 2019 and generally vested (or will vest) at a rate of 1/16th per quarter thereafter, such that the granted options will be fully vested on April 30, 2022. |
(6) | This RSU award vested at the rate of 25% on May 16, 2019 and generally vested (or will vest) at a rate of 1/16th per quarter thereafter, such that the RSUs will be fully vested on May 16, 2022. |
Grants made in fiscal year 2019 are described more fully in the "Compensation Discussion and Analysis" section of this Annual Report. More information concerning the terms of the employment arrangements, if applicable, and the amounts payable pursuant to the employment arrangements, in effect with our named executive officers during fiscal year 2019 is provided under the "Employment Arrangements, Severance and Change of Control Benefits" section of this Annual Report.
Outstanding Equity Awards at 2019 Fiscal Year-End
The following table provides information concerning the outstanding equity-based awards as of June 30, 2019, held by our 2019 named executive officers.
OUTSTANDING EQUITY AWARDS AT 2019 FISCAL YEAR-END TABLE
138
Option Awards | Stock Awards | |||||||||||||||||||||
Name | Number of Securities Underlying Unexercised Options (#) Exercisable | Number of Securities Underlying Unexercised Options (#) Unexercisable | Option Exercise Price ($) | Option Expiration Date | Number of Shares or Units of Stock That Have Not Vested (#) | Market Value of Shares or Units of Stock That Have Not Vested ($)(1) | ||||||||||||||||
Charles Liang | 132,000 | — | $ | 18.59 | 4/25/2021 | |||||||||||||||||
231,260 | — | 20.70 | 1/21/2023 | |||||||||||||||||||
166,750 | — | 35.07 | 1/19/2025 | |||||||||||||||||||
85,763 | (2) | 44,237 | (2) | 26.95 | 8/2/2027 | |||||||||||||||||
36,000 | (3) | $ | 696,600 | |||||||||||||||||||
Kevin Bauer | 4,516 | (4) | 3,514 | (4) | 28.45 | 1/25/2027 | ||||||||||||||||
12,357 | (5) | 9,613 | (5) | 28.45 | 1/25/2027 | |||||||||||||||||
3,600 | (6) | 4,400 | (6) | 28.45 | 1/25/2027 | |||||||||||||||||
18,900 | (7) | 23,100 | (7) | 28.45 | 1/25/2027 | |||||||||||||||||
6,563 | (8) | $ | 126,994 | |||||||||||||||||||
Don Clegg | 14,970 | — | 13.61 | 8/2/2020 | ||||||||||||||||||
6,800 | — | 12.50 | 8/6/2022 | |||||||||||||||||||
6,000 | — | 26.75 | 8/4/2024 | |||||||||||||||||||
3,000 | (9) | 1,000 | (9) | 20.54 | 8/3/2026 | |||||||||||||||||
2,396 | (10) | 12,283 | (10) | 22.10 | 7/31/2028 | |||||||||||||||||
2,604 | (11) | 2,717 | (11) | 22.10 | 7/31/2028 | |||||||||||||||||
243 | (12) | $ | 4,702 | |||||||||||||||||||
4,500 | (13) | $ | 87,075 | |||||||||||||||||||
George Kao | 9,275 | 5,565 | (14) | 26.95 | 8/2/2027 | |||||||||||||||||
3,225 | 1,935 | (15) | 26.95 | 8/2/2027 | ||||||||||||||||||
— | 2,972 | (16) | 13.00 | 10/30/2028 | ||||||||||||||||||
— | 2,968 | (17) | 13.00 | 10/30/2028 | ||||||||||||||||||
2,250 | (18) | $ | 43,538 | |||||||||||||||||||
David Weigand | 3,016 | 13,056 | (19) | 22.10 | 7/31/2028 | |||||||||||||||||
1,984 | 1,944 | (20) | 22.10 | 7/31/2028 | ||||||||||||||||||
7,500 | (21) | $ | 145,125 | |||||||||||||||||||
__________________________
(1) | Represents the closing stock price per share of our common stock as of June 30, 2019 ($19.35) multiplied by the number of shares underlying RSUs that had not vested or that were unearned as of June 30, 2019. |
(2) | These nonqualified stock options vested at the rate of 12.5% on August 2, 2017 and generally vested (or will vest) at a rate of 1/36th per month thereafter, such that the granted options will be fully vested on August 2, 2020. |
(3) | These RSUs were originally granted as PRSUs and were earned based on performance during fiscal year 2018 at a rate of 200% of the target number of PRSUs (a total of 120,000 PRSUs for this award). 50% of the earned PRSUs (60,000) vested on June 30, 2018 and the remainder of the earned PRSUs (60,000) will vest ratably over the following ten fiscal quarters based on Mr. Liang’s continued employment with the Company. As of June 30, 2019, an additional 24,000 PRSUs had vested, leaving 36,000 unvested PRSUs. |
(4) | These incentive stock options vested at the rate of 25% on January 11, 2018 and vested (or generally will vest) at a rate of 1/16th per quarter thereafter, such that the granted options will be fully vested on January 11, 2021. |
(5) | These nonqualified stock options vested at the rate of 25% on January 11, 2018 and vested (or generally will vest) at a rate of 1/16th per quarter thereafter, such that the granted options will be fully vested on January 11, 2021. |
(6) | These nonqualified stock options vested at the rate of 20% on January 11, 2018 and vested (or generally will vest) at a rate of 1/20th per quarter thereafter, such that the granted options will be fully vested on January 11, 2022. |
(7) | These nonqualified stock options vested at the rate of 20% on January 11, 2018 and vested (or generally will vest) at a rate of 1/20th per quarter thereafter, such that the granted options will be fully vested on January 11, 2022. |
(8) | These RSUs vested at the rate of 25% on February 16, 2018 and vested (or generally will vest) at a rate of 1/16th per quarter thereafter, such that the RSUs will be fully vested on February 16, 2021. |
139
(9) | These incentive stock options vested at the rate of 25% on April 17, 2017 and vested (or generally will vest) at a rate of 1/16th per quarter thereafter, such that the granted options will be fully vested on April 17, 2020. |
(10) | These incentive stock options vested at the rate of 25% on May 1, 2019 and vested (or generally will vest) at a rate of 1/16th per quarter thereafter, such that the granted options will be fully vested on May 1, 2022. |
(11) | These nonqualified stock options vested at the rate of 25% on May 1, 2019 and vested (or generally will vest) at a rate of 1/16th per quarter thereafter, such that the granted options will be fully vested on May 1, 2022. |
(12) | These RSUs vested at the rate of 25% on May 16, 2017 and vested (or generally will vest) at a rate of 1/16th per quarter thereafter, such that the RSUs will be fully vested on May 16, 2020. |
(13) | These RSUs vested at the rate of 25% on May 16, 2019 and vested (or generally will vest) at a rate of 1/16th per quarter thereafter, such that the RSUs will be fully vested on May 16, 2022. |
(14) | These incentive stock options vested at the rate of 25% on October 12, 2017 and vested (or generally will vest) at a rate of 1/16th per quarter thereafter, such that the granted options will be fully vested on October 12, 2020. |
(15) | These nonqualified stock options vested at the rate of 25% on October 12, 2017 and vested (or generally will vest) at a rate of 1/16th per quarter thereafter, such that the granted options will be fully vested on October 12, 2020. |
(16) | These incentive stock options vested at the rate of 25% on October 30, 2019 and generally will vest at a rate of 1/16th per quarter thereafter, such that the granted options will be fully vested on October 30, 2022. |
(17) | These nonqualified stock options vested at the rate of 25% on October 30, 2019 and generally will vest at a rate of 1/16th per quarter thereafter, such that the granted options will be fully vested on October 30, 2022. |
(18) | These RSUs vested at the rate of 25% on November 16, 2017 and vested (or generally will vest) at a rate of 1/16th per quarter thereafter, such that the RSUs will be fully vested on November 16, 2020. |
(19) | These incentive stock options vested at the rate of 25% on April 30, 2019 and vested (or generally will vest) at a rate of 1/16th per quarter thereafter, such that the granted options will be fully vested on April 30, 2022. |
(20) | These nonqualified stock options vested at the rate of 25% on April 30, 2019 and vested (or generally will vest) at a rate of 1/16th per quarter thereafter, such that the granted options will be fully vested on April 30, 2022. |
(21) | These RSUs vested at the rate of 25% on May 16, 2019 and vested (or generally will vest) at a rate of 1/16th per quarter thereafter, such that the RSUs will be fully vested on May 16, 2022. |
Fiscal Year 2019 Option Exercises and Stock Vested
The following table sets forth the dollar amounts realized by each of our 2019 named executive officers pursuant to the exercise or vesting of equity-based awards during fiscal year 2019.
FISCAL YEAR 2019 OPTION EXERCISES AND STOCK VESTED TABLE
Option Awards | Stock Awards | |||||||||||||
Name | Number of Shares Acquired on Exercise (#) | Value Realized on Exercise ($) | Number of Shares Acquired on Vesting (#) | Value Realized on Vesting ($)(1) | ||||||||||
Charles Liang | — | $ | — | 24,000 | $ | 464,400 | ||||||||
Kevin Bauer | — | $ | — | 3,750 | $ | 68,655 | ||||||||
Don Clegg | — | $ | — | 243 | $ | 4,448 | ||||||||
George Kao | — | $ | — | 1,500 | $ | 27,461 | ||||||||
David Weigand | — | $ | — | — | $ | — | ||||||||
__________________________
(1) | The value is the closing price of our common stock on the date of vesting, multiplied by the number of shares vested, , except that in Mr. Liang’s case, the value is the closing price of our common stock on the June 30, 2019 ($23.65), which is the date the shares vested. Since our registration statement on Form S-8 was not effective, those vested shares for Mr. Liang have not been released. |
Fiscal Year 2019 Pension Benefits and Nonqualified Deferred Compensation
We do not provide any nonqualified deferred compensation arrangements or pension plans. As such, the Pension Benefits disclosure and Nonqualified Deferred Compensation disclosure for fiscal year 2019 are omitted from this Annual Report.
Fiscal Year 2019 Potential Payments Upon Termination or Change of Control
140
We do not currently, and did not during fiscal year 2019 have, any arrangements with any of our named executive officers that provide for any additional or enhanced severance or other compensation or benefits in the event of termination or change of control of our company.
Fiscal Year 2018 Summary Compensation Table
The following table sets forth information concerning the reportable compensation for our 2018 named executive officers for the fiscal years ended 2018, 2017 and 2016, as applicable.
FISCAL YEAR 2018 SUMMARY COMPENSATION TABLE
Name and Principal Position | Year | Salary ($) (1) | Bonus ($)(2) | Stock Awards ($)(3) | Option Awards ($)(4) | Non-Equity Incentive Plan Compensation ($) | Change in Pension Value and Non-qualified Deferred Compensation Earnings ($) | All Other Compensation ($) | Total ($) | |||||||||||||||||||||||||
Charles Liang | 2018 | $ | 386,212 | $ | — | $ | 3,252,000 | $ | 1,644,005 | $ | — | $ | — | $ | — | $ | 5,282,217 | |||||||||||||||||
President, Chief Executive Officer and Chairman of the Board | 2017 | 386,212 | 650 | — | — | — | — | — | 386,862 | |||||||||||||||||||||||||
2016 | 363,776 | — | — | — | — | — | — | 363,776 | ||||||||||||||||||||||||||
Kevin Bauer | 2018 | 328,000 | 80,304 | — | — | — | — | — | 408,304 | |||||||||||||||||||||||||
Senior Vice President and Chief Financial Officer | 2017 | 150,360 | 40,002 | 426,750 | 1,045,600 | — | — | — | 1,662,712 | |||||||||||||||||||||||||
2016 | — | — | — | — | — | — | — | — | ||||||||||||||||||||||||||
Howard Hideshima | 2018 | 213,439 | — | — | — | — | — | — | 213,439 | |||||||||||||||||||||||||
Former Senior Vice President and Chief Financial Officer | 2017 | 330,681 | 650 | 115,640 | 116,092 | — | — | 1,500 | 564,563 | |||||||||||||||||||||||||
2016 | 322,646 | — | — | — | — | — | — | 322,646 | ||||||||||||||||||||||||||
Sara Liu | 2018 | 243,642 | — | — | — | — | — | — | 243,642 | |||||||||||||||||||||||||
Senior Vice President | 2017 | 244,558 | 650 | — | — | — | — | — | 245,208 | |||||||||||||||||||||||||
2016 | 237,253 | — | 110,484 | 113,961 | — | — | — | 461,698 | ||||||||||||||||||||||||||
Phidias Chou | 2018 | 193,799 | 300 | — | — | — | — | — | 194,099 | |||||||||||||||||||||||||
Former Senior Vice President, Worldwide Sales | 2017 | 299,461 | 10,650 | — | — | — | — | — | 310,111 | |||||||||||||||||||||||||
2016 | 286,747 | 3,416 | 137,160 | 138,000 | — | — | — | 565,323 | ||||||||||||||||||||||||||
Wally Liaw | 2018 | 162,990 | — | — | — | — | — | — | 162,990 | |||||||||||||||||||||||||
Former Senior Vice President, International Sales | 2017 | 246,105 | 650 | — | — | — | — | — | 246,755 | |||||||||||||||||||||||||
2016 | 232,864 | — | 109,959 | 105,089 | — | — | — | 447,912 | ||||||||||||||||||||||||||
__________________________
(1) | Amounts disclosed under "Salary" for fiscal year 2018 include leave pay earned by the named executive officers for fiscal year 2018. |
(2) | Amounts disclosed under “Bonus” for fiscal year 2018 reflect fixed bonuses per the terms of an employment offer letter and our profit sharing program. |
(3) | Amounts disclosed for fiscal year 2018 represent the grant date fair value of RSU or PRSU awards granted during fiscal year 2018 calculated in accordance with Financial Accounting Standards Board Accounting Standards Codification Topic 718 ("ASC Topic 718"), and are based on the closing market price of our common stock on the date of grant. Assuming the highest level of performance is achieved for the PRSUs granted in fiscal year 2018, the grant date fair value of the PRSU awards would have been $3,252,000 for Mr. Liang’s one-year PRSUs and $1,626,000 for Mr. Liang’s two-year PRSUs. |
(4) | Amounts disclosed for fiscal year 2018 represent the grant date fair value of each stock option award calculated in accordance with ASC Topic 718, using the Black Scholes option-pricing model. Assumptions used in the calculation of these amounts are included in Part II, Item 8, "Financial Statements and Supplementary Data", and Part II, Item 8, Note 13 “Stock-based Compensation and Stockholders’ Equity,” to our consolidated financial statements for fiscal year 2018 included in this Annual Report. |
Fiscal Year 2018 Grants of Plan-Based Awards
The following table provides information concerning all plan-based awards granted during fiscal year 2018 to each of our 2018 named executive officers.
141
FISCAL YEAR 2018 GRANTS OF PLAN-BASED AWARDS TABLE
Name | Estimated Future Payouts Under Equity Incentive Plan Awards | All Other Stock Awards: Number of Shares of Stock or Units (#) | All Other Option Awards: Number of Securities Underlying Options (#) | Exercise or Base Price of Option Awards ($/Sh) | Grant Date Fair Value of Stock and Option Awards ($)(1) | |||||||||||||||||||||||
Grant Date | Threshold (#) | Target (#) | Maximum (#) | |||||||||||||||||||||||||
Charles Liang | 8/2/2017 | — | — | — | — | 130,000 | (2) | $ | 26.95 | $ | 1,644,005 | |||||||||||||||||
8/4/2017 | (3) | — | 60,000 | 120,000 | — | — | — | 1,626,000 | ||||||||||||||||||||
8/4/2017 | (4) | — | 60,000 | 60,000 | — | — | — | 1,626,000 | ||||||||||||||||||||
Kevin Bauer | — | — | — | — | — | — | — | — | ||||||||||||||||||||
Howard Hideshima | — | — | — | — | — | — | — | — | ||||||||||||||||||||
Sara Liu | — | — | — | — | — | — | — | — | ||||||||||||||||||||
Phideas Chou | — | — | — | — | — | — | — | — | ||||||||||||||||||||
Wally Liaw | — | — | — | — | — | — | — | — | ||||||||||||||||||||
__________________________
(1) | Represents the fair value of the stock options and RSU and PRSU awards as of the date of grant, computed in accordance with ASC Topic 718. |
(2) | This stock option grant vested at the rate of 12.5% on August 2, 2017 and then generally vested (or vests) at a rate of 1/36th per month thereafter, such that the granted options will be fully vested on August 2, 2020. |
(3) | This PRSU grant has a target opportunity of 60,000 PRSUs and a maximum opportunity of 200% of the target depending on revenue growth and minimum operating profit for fiscal year 2018. Of the PRSUs earned based on performance, 50% vested as of June 30, 2018 and the remainder of the earned PRSUs vested (or will vest) ratably over the following 10 fiscal quarters based on Mr. Liang’s continued employment with the Company. The Company’s performance for fiscal 2018 resulted in 120,000 PRSUs being earned under this award. |
(4) | This PRSU grant has a target opportunity of 60,000 PRSUs and a maximum opportunity of 100% of the target depending on average non-GAAP operating margin over a two-year period consisting of fiscal year 2018 and fiscal year 2019. Non-GAAP operating margin is defined as net income from operations, less stock-based compensation expense, divided by net sales (all as shown on the Company’s audited financial statements for such fiscal years). PRSUs earned based on performance, if any, would be 50% vested as of June 30, 2019, with the remainder vesting ratably over the following six fiscal quarters based on Mr. Liang’s continued employment with the Company. As of June 30, 2018, the performance period for this PRSU had not been completed, and it was not then determinable whether any of such PRSUs would be earned and/or vested. |
Grants made in fiscal year 2018 are described more fully in the "Compensation Discussion and Analysis" section of this Annual Report. More information concerning the terms of the employment arrangements, if applicable, and the amounts payable pursuant to the employment arrangements, in effect during fiscal year 2018 with our named executive officers is provided under the "Employment Arrangements, Severance and Change of Control Benefits" section of this Annual Report.
Outstanding Equity Awards at 2018 Fiscal Year-End
The following table provides information concerning the outstanding equity-based awards as of June 30, 2018, held by our 2018 named executive officers.
OUTSTANDING EQUITY AWARDS AT 2018 FISCAL YEAR-END TABLE
Option Awards | Stock Awards | ||||||||||||||||||||
Name | Number of Securities Underlying Unexercised Options (#) Exercisable | Number of Securities Underlying Unexercised Options (#) Unexercisable | Option Exercise Price ($) | Option Expiration Date | Number of Shares or Units of Stock That Have Not Vested (#) | Market Value of Shares or Units of Stock That Have Not Vested ($)(1) | |||||||||||||||
Charles Liang | 720,000 | — | $ | 10.66 | 3/4/2019 | ||||||||||||||||
132,000 | — | 18.59 | 4/25/2021 | ||||||||||||||||||
231,260 | — | 20.70 | 1/21/2023 | ||||||||||||||||||
145,906 | (2) | 20,844 | (2) | 35.07 | 1/19/2025 | ||||||||||||||||
47,847 | (3) | 82,153 | (3) | 26.95 | 8/2/2027 | ||||||||||||||||
60,000 | (4) | $ | 1,419,000 | ||||||||||||||||||
142
60,000 | (5) | 1,419,000 | |||||||||||||||||||
Kevin Bauer | 2,508 | (6) | 5,522 | (6) | 28.45 | 1/25/2027 | |||||||||||||||
6,865 | (7) | 15,105 | (7) | 28.45 | 1/25/2027 | ||||||||||||||||
2,000 | (8) | 6,000 | (8) | 28.45 | 1/25/2027 | ||||||||||||||||
10,500 | (9) | 31,500 | (9) | 28.45 | 1/25/2027 | ||||||||||||||||
10,313 | (10) | 243,902 | |||||||||||||||||||
Sara Liu | 19,615 | — | 11.81 | 1/25/2020 | |||||||||||||||||
16,285 | — | 11.81 | 1/25/2020 | ||||||||||||||||||
29,000 | — | 17.09 | 1/23/2022 | ||||||||||||||||||
23,000 | — | 17.96 | 1/20/2024 | ||||||||||||||||||
5,625 | 3,375 | (11) | 27.28 | 1/27/2026 | |||||||||||||||||
1,773 | (12) | 41,931 | |||||||||||||||||||
Howard Hideshima | 2,182 | — | 20.54 | 8/3/2026 | |||||||||||||||||
2,504 | — | 20.54 | 8/3/2026 | ||||||||||||||||||
6,352 | — | 26.75 | 8/4/2024 | ||||||||||||||||||
8,690 | — | 12.50 | 8/6/2022 | ||||||||||||||||||
10,886 | — | 13.61 | 8/2/2020 | ||||||||||||||||||
23,397 | — | 26.75 | 8/4/2024 | ||||||||||||||||||
37,810 | — | 12.50 | 8/6/2022 | ||||||||||||||||||
56,614 | — | 13.61 | 8/2/2020 | ||||||||||||||||||
Phidias Chou | 2,738 | — | 25.40 | 10/21/2025 | |||||||||||||||||
4,009 | — | 25.40 | 10/21/2025 | ||||||||||||||||||
6,150 | — | 15.22 | 10/24/2021 | ||||||||||||||||||
6,500 | — | 5.53 | 4/29/2019 | ||||||||||||||||||
16,773 | — | 14.23 | 10/21/2023 | ||||||||||||||||||
17,227 | — | 14.23 | 10/21/2023 | ||||||||||||||||||
18,970 | — | 8.36 | 10/26/2019 | ||||||||||||||||||
31,030 | — | 8.36 | 10/26/2019 | ||||||||||||||||||
32,850 | — | 15.22 | 10/24/2021 | ||||||||||||||||||
Wally Liaw | 1,482 | — | 28.71 | 4/27/2026 | |||||||||||||||||
2,234 | — | 28.71 | 4/27/2026 | ||||||||||||||||||
7,070 | — | 18.93 | 4/21/2024 | ||||||||||||||||||
7,671 | — | 13.61 | 8/2/2020 | ||||||||||||||||||
8,687 | — | 17.29 | 4/23/2022 | ||||||||||||||||||
10,079 | — | 13.61 | 8/2/2020 | ||||||||||||||||||
14,491 | — | 18.93 | 4/21/2024 | ||||||||||||||||||
18,313 | — | 17.29 | 4/23/2022 | ||||||||||||||||||
__________________________
(1) | Represents the closing stock price per share of our common stock as of June 30, 2018 ($23.65) multiplied by the number of shares underlying RSUs that had not vested or that were unearned as of June 30, 2018. |
(2) | These nonqualified stock options vested at the rate of 25% on November 1, 2015 and at a rate of 1/16th per quarter thereafter, such that the granted options were fully vested on November 1, 2018. |
(3) | These nonqualified stock options vested at the rate of 12.5% on August 2, 2017 and generally vested (or vest) at a rate of 1/36th per month thereafter, such that the granted options will be fully vested on August 2, 2020. |
(4) | This PRSU grant has a target opportunity of 60,000 PRSUs and a maximum opportunity of 200% of the target depending on revenue growth and minimum operating profit for fiscal year 2018, as shown in the Company’s audited financial statements. Of the PRSUs earned based on performance, 50% vested as of June 30, 2018 and the remainder of the earned PRSUs vested (or will vest) ratably over the following 10 fiscal quarters based on Mr. Liang’s continued |
143
employment with the Company. The Company’s performance for fiscal 2018 resulted in 120,000 PRSUs being earned under this award.
(5) | This PRSU grant has a target opportunity of 60,000 PRSUs and a maximum opportunity of 100% of the target generally depending on performance during the performance period of July 1, 2017 to June 30, 2019. In addition, 50% of the award vested on June 30, 2019 and the remainder of the award generally vested (or will vest), depending on final performance, at a rate of quarterly over the following six Company fiscal quarters. The performance achievement determination and number of PRSUs actually earned are based on the audited financial statements of the Company for the fiscal years ended June 30, 2019 and 2018, but was not determinable as of June 30, 2018. These PRSUs were not earned as of June 30, 2019. |
(6) | These incentive stock options vested at the rate of 25% on January 11, 2018 and generally vested (or vest) at a rate of 1/16th per quarter thereafter, such that the granted options will be fully vested on January 11, 2021. |
(7) | These nonqualified stock options vested at the rate of 25% on January 11, 2018 and generally vested (or vest) at a rate of 1/16th per quarter thereafter, such that the granted options will be fully vested on January 11, 2021. |
(8) | These nonqualified stock options vested at the rate of 20% on January 11, 2018 and generally vested (or vest) at a rate of 1/20th per quarter thereafter, such that the granted options will be fully vested on January 11, 2022. |
(9) | These nonqualified stock options vested at the rate of 20% on January 11, 2018 and generally vested (or vest) at a rate of 1/20th per quarter thereafter, such that the granted options will be fully vested on January 11, 2022. |
(10) | These RSUs vested at the rate of 25% on February 16, 2018 and generally vested (or vest) at a rate of 1/16th per quarter thereafter, such that the RSUs will be fully vested on February 16, 2021. |
(11) | These nonqualified stock options vested at the rate of 25% on December 12, 2016 and at a rate of 1/16th per quarter thereafter, such that the granted options were fully vested on December 12, 2019. |
(12) | These RSUs vested at the rate of 25% on February 10, 2017 and generally vested (or vest) at a rate of 1/16th per quarter thereafter, such that the RSUs will be fully vested on February 10, 2020. |
Fiscal Year 2018 Option Exercises and Stock Vested
The following table sets forth the dollar amounts realized by each of our 2018 named executive officers pursuant to the exercise or vesting of equity-based awards during fiscal year 2018.
2018 FISCAL YEAR OPTION EXERCISES AND STOCK VESTED TABLE
Option Awards | Stock Awards | |||||||||||||
Name | Number of Shares Acquired on Exercise (#) | Value Realized on Exercise ($) | Number of Shares Acquired on Vesting (#) | Value Realized on Vesting ($)(1) | ||||||||||
Charles Liang | — | $ | — | 60,000 | $ | 1,419,000 | ||||||||
Kevin Bauer | — | — | 4,687 | 94,019 | ||||||||||
Howard Hideshima | — | — | 703 | 16,852 | ||||||||||
Sara Liu | — | — | 1,012 | 22,568 | ||||||||||
Phidias Chou | — | — | 675 | 15,707 | ||||||||||
Wally Liaw | — | — | — | — | ||||||||||
__________________________
(1) | The value is the closing price of our common stock on the date the vested shares are released, except in Mr. Liang’s case, the value is the closing price of our common stock on the June 30, 2018 ($23.65), which is the date the shares vested. Since our registration statement on Form S-8 was not effective, those vested shares for Mr. Liang have not been released. |
Fiscal Year 2018 Pension Benefits and Nonqualified Deferred Compensation
We do not provide any nonqualified deferred compensation arrangements or pension plans. As such, the Pension Benefits disclosure and Nonqualified Deferred Compensation disclosure for fiscal year 2018 are omitted from this Annual Report.
Fiscal Year 2018 Potential Payments Upon Termination or Change of Control
We do not currently, and did not during fiscal year 2018 have, any arrangements with any of our named executive officers that provide for any additional or enhanced severance or other compensation or benefits in the event of termination or change of control of our company.
144
Fiscal Year 2018 Chief Executive Officer Pay Ratio
For fiscal year 2018, the ratio of the annual total compensation of Mr. Liang, our Chief Executive Officer (“2018 CEO Compensation”), to the median of the annual total compensation of all of our employees and those of our consolidated subsidiaries other than Mr. Liang (“2018 Median Annual Compensation”), was 75.8 to 1. For purposes of this pay ratio disclosure, 2018 CEO Compensation was determined to be $5,290,701, which represents the total compensation reported for Mr. Liang under the “Fiscal Year 2018 Summary Compensation Table", plus the Company’s contribution to group health and welfare benefits provided to Mr. Liang. 2018 Median Annual Compensation for the identified median employee was determined to be $69,796, also including the Company’s contribution to group health and welfare benefits provided to the median employee.
To identify the median employee, we examined our total employee population as of June 30, 2018 (the “2018 Determination Date”). We included all 2,090 U.S. full-time, part-time, seasonal and temporary employees of the Company and our consolidated subsidiaries. We also included all 1,115 full-time, part-time, seasonal and temporary employees of the Company and our consolidated subsidiaries in The Netherlands and Taiwan. We excluded independent contractors and “leased” workers. We excluded all our employees in China (47 individuals) and Japan (14 individuals), which together represented approximately 1.9% of our total employees worldwide (3,266 individuals). Our analysis identified 3,205 individuals who were not excluded.
To determine 2018 Median Annual Compensation, we generally reviewed compensation for the period beginning on July 1, 2017 and ending on the Determination Date. We totaled, for each included employee other than Mr. Liang, base earnings (salary, hourly wages and overtime, as applicable) and cash bonuses paid during the measurement period, plus the Company’s contribution to group health and welfare benefits. We did not use any statistical sampling or cost-of-living adjustments for purposes of this pay ratio disclosure. A portion of our employee workforce (full-time and part-time) worked for less than the full fiscal year (due to mid-measurement period start dates, disability status or similar factors, etc.). In determining the median employee, we generally annualized the total compensation for such individuals other than temporary or seasonal employees (but avoided creating full-time equivalencies) based on reasonable assumptions and estimates relating to our employee compensation program. Due to our permitted use of reasonable estimates and assumptions in preparing this pay ratio disclosure, the disclosure may involve a degree of imprecision, and thus this pay ratio disclosure is a reasonable estimate.
Fiscal Year 2019 Chief Executive Officer Pay Ratio
For fiscal year 2019, the ratio of the annual total compensation of Mr. Liang, our Chief Executive Officer (“2019 CEO Compensation”), to the median of the annual total compensation of all of our employees and those of our consolidated subsidiaries other than Mr. Liang (“2019 Median Annual Compensation”), was 4.74 to 1. For purposes of this pay ratio disclosure, 2019 CEO Compensation was determined to be $395,302, which represents the total compensation reported for Mr. Liang under the “Fiscal Year 2019 Summary Compensation Table,” plus the Company’s contribution to group health and welfare benefits provided to Mr. Liang. 2019 Median Annual Compensation for the identified median employee was determined to be $83,467, also including the Company’s contribution to group health and welfare benefits provided to the median employee. Due to our permitted use of reasonable estimates and assumptions in preparing this pay ratio disclosure, the disclosure may involve a degree of imprecision, and thus this pay ratio disclosure is a reasonable estimate.
In calculating our Chief Executive Officer pay ratio for fiscal year 2019, we used the same median employee as was used to calculate the Chief Executive Officer pay ratio for fiscal year 2018. This is because we believe that there has been no change in our employee population or employee compensation arrangements during fiscal year 2019 that would result in a significant change to our Chief Executive Officer pay ratio disclosure for fiscal year 2019.
2019 Director Compensation
Under our director compensation policy in effect for fiscal year 2019, we reimbursed non-employee directors for reasonable expenses in connection with attendance at Board and committee meetings. Our non-employee directors received an annual retainer of $60,000, payable quarterly in cash. In addition, the Chairperson of our Audit Committee received an additional annual retainer of $30,000 and the Chairperson of each of our Compensation Committee and our Nominating and Corporate Governance Committee received an additional annual retainer of $20,000 and $15,000, respectively, payable quarterly in cash. Each director serving in a non-chairperson capacity on our Audit Committee received an additional annual retainer of $15,000, each director serving in a non-chairperson capacity on our Compensation Committee received an additional annual retainer of $10,000 and each director serving in a non-chairperson capacity on our Nominating and Corporate Governance Committee received an additional annual retainer of $7,500, payable quarterly, in cash. Finally, non-employee directors were entitled to $2,000 per meeting for each meeting attended in excess of (1) the regular meetings of the Board and (2) up to 10 additional meetings beyond such regular meetings, provided that notice of the meeting was properly given, a quorum was present and the meeting was recorded.
145
Non-employee directors also were eligible to receive equity grants under our 2016 Equity Incentive Plan. Under our Board policy, non-employee directors were entitled to an annual grant of RSUs equal to $220,000. Initial grants upon election as a director were to be prorated based on the grant date relative to our annual stockholders' meeting. Generally, RSUs granted to non-employee directors were to vest on the earlier of the day prior to our next annual stockholders' meeting and the one-year anniversary of the grant date.
Since the effectiveness of our registration statement on Form S-8 was suspended when we became delinquent in filing our 2017 10-K, none of the equity grants to our non-employee directors contemplated by our policy were granted. We anticipate that, at such time as we are current in our SEC filings, and the effectiveness of our registration statement on Form S-8 is revived, we will grant additional equity awards to our non-employee directors in amounts that reflect the grants that would have been made to them had the effectiveness of our registration statement on Form S-8 not been suspended.
The following table shows for fiscal year 2019 certain information with respect to the compensation of all of our non-employee directors who served in such capacities during fiscal year 2019:
FISCAL YEAR 2019 DIRECTOR COMPENSATION
Name | Fees Earned or Paid in Cash ($)(1) | Stock Awards ($)(2) | Option Awards ($) | Total ($) | |||||||||||
Laura Black (3) | $ | 91,333 | $ | — | $ | — | $ | 91,333 | |||||||
Michael McAndrews | 71,333 | — | — | 71,333 | |||||||||||
Tally Liu | 28,542 | — | — | 28,542 | |||||||||||
Hwei-Ming (Fred) Tsai | 86,667 | — | — | 86,667 | |||||||||||
Saria Tseng | 63,833 | — | — | 63,833 | |||||||||||
Sherman Tuan | 60,833 | — | — | 60,833 | |||||||||||
__________________________
(1) | This column consists of annual director fees, non-employee committee chairman fees and other committee member fees earned for fiscal year 2019. |
(2) | The dollar amounts in this column represent the aggregate grant date fair values of the awards granted during fiscal year 2019 calculated in accordance with ASC Topic 718. Assumptions used in the calculation of the grant date fair value amounts are included in Part II, Item 8, "Financial Statements and Supplementary Data", and Item II, Part 8, Note 13, “Stock-based Compensation and Stockholders’ Equity” to our consolidated financial statements for fiscal year 2019 included in this Annual Report. |
(3) | Laura Black resigned from the Board on June 26, 2019 |
The table below sets forth the aggregate number of shares underlying option awards held by our non-employee directors as of June 30, 2019.
Name | Option Awards | |
Laura Black | 31,500 | |
Michael McAndrews | 27,000 | |
Hwei-Ming (Fred) Tsai | 40,000 | |
Saria Tseng | 22,500 | |
Sherman Tuan | 40,000 | |
2018 Director Compensation
Under our director compensation policy in effect for fiscal year 2018, we reimbursed non-employee directors for reasonable expenses in connection with attendance at Board and committee meetings. Our non-employee directors received an annual retainer of $40,000, payable quarterly in cash. In addition, the Chairperson of our Audit Committee received an additional annual retainer of $25,000, the Chairperson of each of our Compensation Committee and Nominating and Corporate Governance Committee received an additional annual retainer of $5,000 and each director serving in a non-chairperson capacity on our standing Board committees received an additional annual retainer of $2,500 per committee, payable quarterly in cash.
146
Our policy also provided that non-employee directors were eligible to receive stock options under our 2016 Equity Incentive Plan. Under our policy, non-employee directors were granted an initial stock option award to purchase 18,000 shares upon first becoming a member of our Board. A non-employee director serving as Chairperson of the Audit Committee was to receive an additional initial grant of stock options to purchase 12,000 shares. Non-employee directors serving as Chairperson of the Compensation or Nominating and Corporate Governance Committees were to receive an additional initial grant of stock options to purchase 2,000 shares. Each of these initial stock option grants generally would have vested and become exercisable over four years, with the first 25% of the award generally vesting on the first anniversary of the date of grant and the remainder generally vesting quarterly after the first vesting date. Immediately after each of our annual meetings of stockholders, each non-employee director was to be granted stock options to purchase 4,500 shares of our common stock, the Audit Committee Chairperson was to be granted additional stock options to purchase 3,000 shares of our common stock and the Chairperson of each of the Compensation and Nominating and Corporate Governance Committees was to be granted additional stock options to purchase 500 shares of our common stock. These stock options were to vest and become exercisable generally on the first anniversary of the date of grant or immediately prior to our next annual meeting of stockholders, if earlier.
The policy provided that stock options granted to non-employee directors during fiscal year 2018 would have a per share exercise price equal to 100% of the fair market value of the underlying shares on the date of grant, and will become fully vested if we undergo a change of control. Annual grants were reduced proportionally if the person did not serve for the full year after the annual grant.
As with the equity grants that would have been made in fiscal 2019 under our policy, no grants to non-employee directors were made during fiscal 2018, in light of the suspension of the effectiveness of our registration statement on Form S-8. We anticipate that, at such time as we are current in our SEC filings, and the effectiveness of our registration statement on Form S-8 is revived, we will grant additional equity awards to our non-employee directors in amounts that reflect the grants that would have been made to them had the effectiveness of our registration statement on Form S-8 not been suspended.
The following table shows for fiscal year 2018 certain information with respect to the compensation of all of our non-employee directors who served in such capacities during fiscal year 2018:
FISCAL YEAR 2018 DIRECTOR COMPENSATION
Name | Fees Earned or Paid in Cash ($)(1) | Stock Awards ($) | Option Awards ($)(2) | Total ($) | |||||||||||
Laura Black | $ | 123,000 | $ | — | $ | — | $ | 123,000 | |||||||
Michael McAndrews | 100,500 | — | — | 100,500 | |||||||||||
Hwei-Ming (Fred) Tsai | 110,000 | — | — | 110,000 | |||||||||||
Saria Tseng | 45,000 | — | — | 45,000 | |||||||||||
Sherman Tuan | 47,500 | — | — | 47,500 | |||||||||||
__________________________
(1) | This column consists of annual director fees, non-employee committee chairman fees and other committee member fees earned for fiscal year 2018. |
(2) | The dollar amounts in this column represent the aggregate grant date fair values of the awards granted during fiscal year 2018 calculated in accordance with ASC Topic 718, using the Black Scholes option-pricing model. Assumptions used in the calculation of the grant date fair value amounts are included in Part II, Item 8, "Financial Statements and Supplementary Data", and Item II, Part 8, Note 13, “Stock-based Compensation and Stockholders’ Equity” to our consolidated financial statements for fiscal year 2018 included in this Annual Report. |
The table below sets forth the aggregate number of shares underlying stock option awards held by our non-employee directors as of June 30, 2018. None of the non-employee directors held any unvested stock awards as of June 30, 2018.
147
Name | Option Awards | |
Laura Black | 31,500 | |
Michael McAndrews | 27,000 | |
Hwei-Ming (Fred) Tsai | 45,000 | |
Saria Tseng | 22,500 | |
Sherman Tuan | 45,000 | |
Compensation Committee Interlocks and Insider Participation
None of the members of the Compensation Committee is a current or former officer or employee of our company or had any relationship with our company requiring disclosure, except for Saria Tseng, who serves as Vice President of Strategic Corporate Development, General Counsel and Secretary of Monolithic Power Systems, Inc., a fabless manufacturer of high-performance analog and mixed-signal semiconductors (“MPS”), with which we have engaged in certain transactions. See “Part III. Item 13. Certain Relationships and Related Transactions and Director Independence-Transactions with Monolithic Power Systems.” In addition, during each of fiscal years 2019 and 2018, none of our executive officers served as a member of the Board of Directors of Compensation Committee of any other entity that has one or more executive officers who served on our Board of Directors of Compensation Committee. Saria Tseng, Hweng (Fred) Tsai and Sherman Tuan served on the Compensation Committee during each of fiscal years 2019 and 2018.
Compensation Program Risk Assessment
We have assessed our compensation programs for both fiscal years 2019 and 2018 and have concluded that risks arising from our compensation policies and practices are not reasonably likely to have a material adverse effect on us. We concluded that our compensation policies and practices do not encourage excessive or inappropriate risk-taking. We believe our programs are appropriately designed to encourage our employees to make decisions that result in positive short-term and long-term results for our business and our shareholders.
Item 12. Security Ownership of Certain Beneficial Owners and Management and Related Stockholder Matters
Security Ownership of Certain Beneficial Owners and Management
The following table sets forth certain information known to us regarding beneficial ownership of our common stock as of November 30, 2019 by:
• | Each of the named executive officers during fiscal year 2019; |
• | Each of our directors; |
• | All directors and executive officers as a group; and |
• | All person known to us beneficially own 5% or more of our outstanding common stock. |
148
Name and Address of Beneficial Owner (1) | Amount and Nature of Beneficial Ownership (2) | Percent of Common Stock Outstanding (3) | |||
Executive Officers and Directors: | |||||
Charles Liang (4) | 8,417,961 | 16.5 | % | ||
Kevin Bauer (5) | 58,953 | * | |||
Don Clegg (6) | 45,783 | * | |||
George Kao (7) | 22,538 | * | |||
David Weigand (8) | 11,250 | * | |||
Michael S. McAndrews (9) | 27,000 | * | |||
Hwei-Ming (Fred) Tsai (10) | 290,000 | * | |||
Saria Tseng (11) | 18,000 | * | |||
Sherman Tuan (12) | 47,650 | * | |||
Sara Liu (13) | 8,417,961 | 16.5 | % | ||
Tally Liu | — | * | |||
Daniel Fairfax | — | * | |||
All directors and executive officers as a group (13 persons) (14) | 8,939,135 | 17.5 | % | ||
5% Holders Not Listed Above: | |||||
Dimensional Fund Advisors (15) | 3,355,723 | 6.7 | % | ||
__________________________
* Represents beneficial ownership of less than one percent of the outstanding shares of common stock
(1) | Except as otherwise indicated, to our knowledge the persons named in this table have sole voting and investment power with respect to all shares of Common Stock shown as beneficially owned by them, subject to community property laws applicable and to the information contained in the footnotes to this table. |
(2) | Under the SEC rules, a person is deemed to be the beneficial owner of shares that can be acquired by such person within 60 days upon the exercise of options or RSUs subject to vesting. |
(3) | Calculated on the basis of 50,085,282 shares of common stock outstanding as of November 30, 2019, provided that any additional shares of Common Stock that a stockholder has the right to acquire within 60 days after November 30, 2019 are deemed to be outstanding for the purposes of calculating that stockholder’s percentage of beneficial ownership. |
(4) | Includes 637,891 options exercisable within 60 days after November 30, 2019. Also includes 96,000 PRSUs that have been earned and will be vested within 60 days after November 30, 2019, none of which have been yet released. Also includes 3,175,002 shares jointly held by Mr. Liang and Sara Liu, his spouse, 472,890 shares held directly by Ms. Liu and 61,000 options exercisable within 60 days after November 30, 2019. See footnote 13. |
(5) | Includes 52,499 shares issuable upon the exercise of options exercisable within 60 days after November 30, 2019. |
(6) | Includes 39,020 options exercisable or 2,250 RSUs exercisable within 60 days after November 30, 2019. |
(7) | Includes 17,735 options exercisable or RSUs subject to vesting, both within 60 days after November, 2019. |
(8) | Includes 7,500 options exercisable or 3,750 RSUs exercisable within 60 days after November 30, 2019. |
(9) | Includes 27,000 shares issuable upon the exercise of options exercisable within 60 days after November 30, 2019. |
(10) | Includes 40,000 shares issuable upon the exercise of options exercisable within 60 days after November 30, 2019. |
(11) | Includes 18,000 shares issuable upon the exercise of options exercisable within 60 days after November 30, 2019. |
(12) | Includes 40,000 shares issuable upon the exercise of options exercisable within 60 days after November 30, 2019. |
(13) | Includes 61,000 options exercisable within 60 days after November 30, 2019. Also includes 3,175,002 shares jointly held by Ms. Liu and Mr. Liang, her spouse, 3,969,793 shares held by Charles Liang, Ms. Liu’s spouse and 637,891 shares issuable upon the exercise of options within 60 days after November 30, 2019. Also includes 96,000 PRSUs held by Mr. Liang that have been earned and will be vested within 60 days after November 30, 2019, none of which have been yet released. See footnote 4. |
(14) | Includes 1,042,645 shares issuable upon the exercise of options exercisable within 60 days after November 30, 2019. |
(15) | The information with respect to the holdings of Dimensional Fund Advisors LP ("Dimensional Fund Advisors") is based solely on Schedule 13G filed on February 8, 2019 by Dimensional Fund Advisors. Dimensional Fund Advisors has the sole power to dispose or to direct the disposition of all of such shares. Dimensional Fund Advisors has the sole power to direct the vote of 3,355,723 of such shares. The address for Dimensional Fund Advisors is Building One 6300 Bee Cave Road, Austin, Texas 78746. |
Equity Compensation Plan Information
149
We currently maintain three compensation plans that provide for the issuance of our Common Stock to officers and other employees, directors and consultants. These consist of the 2006 Equity Incentive Plan and the 2016 Equity Incentive Plan. The 2006 Equity Incentive Plan and the 2016 Equity Incentive Plan have been approved by our stockholders. We no longer grant any equity-based awards under the 2006 Equity Incentive Plan. The following table sets forth information regarding outstanding options, RSUs, and PRSUs and shares reserved and remaining available for future issuance under the foregoing plans as of June 30, 2019:
Plan Category | Number of securities to be issued upon exercise of outstanding options, warrants and rights (a)(1) | Weighted-average exercise price of outstanding options, warrants and rights (b)(2)(3) | Number of securities remaining available for future issuance under equity compensation plans (excluding securities reflected in column (a)(c) | ||||||
Equity compensation plans approved by security holders | 9,283,737 | $ | 18.02 | 843,917 | |||||
Equity compensation plans not approved by security holders | — | — | — | ||||||
Total | 9,283,737 | 843,917 | |||||||
__________________________
(1) | This number includes 7,374,635 shares subject to outstanding options, 1,873,102 shares subject to outstanding RSU awards, and 36,000 shares subject to outstanding PRSU awards. |
(2) | The weighted average exercise price is calculated based solely on the exercise prices of the outstanding options and does not reflect the shares that will be issued upon the vesting of outstanding awards of RSUs and PRSUs, which have no exercise price. |
(3) | The weighted-average remaining contractual term of our outstanding options as of June 30, 2019 was 3.82 years. |
Item 13. Certain Relationships and Related Transactions and Director Independence
CERTAIN RELATIONSHIPS AND RELATED TRANSACTIONS AND DIRECTOR INDEPENDENCE
Procedures for Approval of Related Person Transactions
Pursuant to our Audit Committee charter, the Audit Committee has the responsibility for the review and approval of any related person transactions; provided that if the matter or transaction involves employment or compensation terms for services to our company, including retention or payment provisions relating to expert services, then it is presented to the Compensation Committee. In approving or rejecting a proposed transaction, or a relationship that encompasses many similar transactions, our Audit Committee will consider the relevant facts and circumstances available and deemed relevant, including but not limited to the risks, costs and benefits to us, the terms of the transaction, the availability of other sources for comparable services or products, and, if applicable, the impact on a director’s independence. Our Audit Committee approves only those transactions that, in light of known circumstances are not inconsistent with our best interests, as the Audit Committee determines in the good faith exercise of its discretion. In addition, we annually require each of our directors and executive officers to complete a directors’ and officers’ questionnaire that elicits information about related party transactions as such term is defined by SEC rules and regulations. These procedures are intended to determine whether any such related party transaction impairs the independence of a director or presents a conflict of interest on the part of a director, employee or officer.
Transactions with Related Parties, Promoters and Certain Control Persons
Director and Officer Indemnification
We have entered into agreements to indemnify our directors and executive officers to the fullest extent permitted under Delaware law. In addition, our certificate of incorporation contains provisions limiting the liability of our directors and our bylaws contain provisions requiring us to indemnify our officers and directors.
Equity-Based Awards
Please see the “Grants of Plan-Based Awards” table and the “Director Compensation” table above for information on stock option and restricted stock unit grants to our directors and named executive officers in fiscal years 2018 and 2019.
150
Employment Relationships
Hung-Fan (Albert) Liu, who is a brother of Sara Liu, our Co-Founder and Senior Vice President and a director, is employed in our operations organization in San Jose, California. Mr. Liu received a total compensation of approximately $272,000 and $341,000 in fiscal years 2019 and 2018, respectively. The total compensation includes salary, bonus and equity awards.
Shao Fen (Carly) Kao, who is a sister-in-law of Sara Liu, our Co-Founder and Senior Vice President and a director, is employed in our finance and accounting organization in San Jose, California. Ms. Kao received total compensation of approximately $132,000 and $140,000 in fiscal years 2019 and 2018, respectively. The total compensation includes salary, bonus and equity awards.
Transactions with Ablecom and Compuware
We have entered into a series of agreements with Ablecom Technology Inc. ("Ablecom"), a Taiwan corporation, and one of its affiliates, Compuware Technology, Inc ("Compuware"). Ablecom’s ownership of Compuware is below 50% but Compuware remains a related party as Ablecom still has significant influence over the operations. Ablecom’s Chief Executive
Officer, Steve Liang, is the brother of Charles Liang, our President, Chief Executive Officer and Chairman of our Board, and owned approximately 0.4% of our common stock as of June 30, 2017, but owned no shares as June 30, 2018 and thereafter. Charles Liang served as a Director of Ablecom during our fiscal year 2006, but is no longer serving in such capacity. In addition, Charles Liang and Sara Liu, his spouse, who is also an officer and director of ours, collectively owned approximately 10.5% of Ablecom’s capital stock throughout fiscal years 2018 and 2019. Steve Liang and his family members owned approximately 28.8% throughout fiscal years 2018 and 2019. Certain family members of Yih-Shyan (Wally) Liaw, who until January 2018 was the Senior Vice President of International Sales and a director of the Company, owned approximately 11.7% Ablecom’s capital stock throughout fiscal years 2018 and 2019. Bill Liang, a brother of both Charles Liang and Steve Liang, also is a member of the Board of Directors of Ablecom. Bill Liang is also the Chief Executive Officer of Compuware, a member of Compuware’s Board of Directors and a holder of a significant equity interest in Compuware. Steve Liang is also a member of Compuware’s Board of Directors and is an equity holder of Compuware. None of the Company, Charles Liang or Sara Liu own any capital stock of Compuware.
We have a series of agreements with Ablecom, including multiple product development, production and service agreements, product manufacturing agreements, manufacturing services agreements and lease agreements for warehouse space.
Under these agreements, we outsource a portion of our design activities and a significant part of our manufacturing of components such as server chassis to Ablecom. Ablecom agrees to design products according to our specifications. Additionally, Ablecom agrees to build the tools needed to manufacture the products. We have agreed to pay for the cost of chassis and related product tooling and engineering services and will pay for those items when the work has been completed.
We entered into a distribution agreement with Compuware, under which we appointed Compuware as a non-exclusive distributor of our products in Taiwan, China and Australia. We believe that the pricing and terms under the distribution agreement are similar to the pricing and terms of distribution arrangements we have with similar third-party distributors.
We have also entered into a series of agreements with Compuware, including a multiple product development, production and service agreements, product manufacturing agreements, and lease agreements for office space. Under these agreements, we outsource to Compuware a portion of our design activities and a significant part of our manufacturing of components, particularly power supplies. With respect to design activities, Compuware generally agrees to design certain agreed-upon products according to our specifications, and further agrees to build the tools needed to manufacture the products. We pay Compuware for the design and engineering services, and further agree to pay Compuware for the tooling.
We retain full ownership of any intellectual property resulting from the design of these products and tooling. With respect to the manufacturing aspects of the relationship, Compuware purchases most of materials needed to manufacture the power supplies from outside markets and uses these materials to manufacture the products and then sell to us. We review and frequently negotiate with Compuware the prices of the power supplies the we purchase from Compuware. Compuware also manufactures motherboards, backplanes and other components used on our printed circuit boards. We sell to Compuware most of the components needed to manufacture the above products. Compuware uses these components to manufacture and then sells back the products to us at a purchase price equal to the price at which we sold the components to Compuware, plus a “manufacturing value added” fee and other miscellaneous material charges and costs. We frequently review and negotiate with
151
Compuware the amount of the “manufacturing value added” fee that will be included in the price of the products we purchase from Compuware.
Ablecom’s sales to us comprise a substantial majority of Ablecom’s net sales. For fiscal years ended June 30, 2019, 2018 and 2017, we purchased products from Ablecom totaling $137.9 million, $144.4 million and $118.5 million, respectively. Amounts owed to Ablecom by us as of June 30, 2019 and 2018, were $33.9 million and $49.2 million, respectively. For the fiscal years ended June 30, 2019, 2018 and 2017, we paid Ablecom $7.4 million, $7.9 million and $5.2 million, respectively, for design services, tooling assets and miscellaneous costs.
Compuware’s sales of our products to others comprise a majority of Compuware’s net sales. For fiscal years ended June 30, 2019, 2018 and 2017, we sold products to Compuware totaling $17.7 million, $46.9 million and $23.0 million, respectively. Amounts owed to us by Compuware as of June 30, 2019 and 2018, were $14.4 million and $16.3 million, respectively. The price at which Compuware purchases the products from us is at a discount from our standard price for purchasers who purchase specified volumes from us. In exchange for this discount, Compuware assumes the responsibility to install our products at the site of the end customer and administers first-level customer support. For the fiscal years ended June 30, 2019, 2018 and 2017, we purchased products from Compuware totaling $138.9 million, $118.3 million and $117.8 million, respectively. Amounts we owed to Compuware as of June 30, 2019 and 2018, were $34.4 million and $45.6 million, respectively. For the fiscal years ended June 30, 2019, 2018 and 2017, we paid Compuware $0.7 million, $1.2 million and $1.1 million, respectively, for design services, tooling assets and miscellaneous costs.
Our exposure to financial loss as a result of our involvement with Ablecom is limited to potential losses on our purchase orders in the event of an unforeseen decline in the market price and/or demand for our products such that we incur a loss on the sale or cannot sell the products. Our outstanding purchase orders to Ablecom were $31.0 million and $39.3 million at June 30, 2019 and 2018, respectively, representing the maximum exposure to financial loss. We do not directly or indirectly guarantee any obligations of Ablecom, or any losses that the equity holders of Ablecom may suffer.
Our exposure to financial loss as a result of our involvement with Compuware is limited to potential losses on our purchase orders in the event of an unforeseen decline in the market price and/or demand for our products such that we incur a loss on the sale or cannot sell the products. Our outstanding purchase orders to Compuware were $70.6 million and $111.7 million at June 30, 2019 and 2018, respectively, representing the maximum exposure to financial loss. We do not directly or indirectly guarantee any obligations of Compuware, or any losses that the equity holders of Compuware may suffer.
Loans
In October 2018, our CEO, Charles Liang, personally borrowed approximately $12.9 million from Chang Chien-Tsun, the spouse of Steve Liang. The loan is unsecured, bore interest at 0.80% per month for the first six months and the loan has no maturity date. After the first six months, the loan bears interest at 0.85% per month. The loan was made at Charles Liang’s request, to provide funds to repay personal margin loans to two financial institutions, which loans had been secured by shares of our common stock held by Charles Liang. The lenders called the loans in October 2018, following the suspension of our common stock from trading on Nasdaq in August 2018 and the decline in the market price of our common stock in October 2018. As of November 30, 2019, the amount due on the unsecured loan (including principal and accrued interest) was approximately $14.5 million.
Transactions with Monolithic Power Systems
Monolithic Power Systems, Inc., a fabless manufacturer of high-performance analog and mixed-signal semiconductors (“MPS”), is a supplier that provides high-performance analog and mixed signal semiconductors for use in our products. Saria Tseng, who serves as a member on the Board of Directors, also serves as Vice President of Strategic Corporate Development, General Counsel and Secretary of MPS. We purchased approximately $0.3 million and $0.4 million of products from MPS for the years ended June 30, 2019 and 2018, respectively, for use in the manufacturing of our products. We did not owe any amounts to MPS as of June 30, 2019 and 2018.
Item 14. Principal Accounting Fees and Services
The Audit Committee appointed Deloitte & Touche LLP as our independent registered public accounting firm for the fiscal year 2019.
Independent Registered Public Accounting Firm Fees and Services
152
The following table sets forth the aggregate audit fees billed to us by our independent registered public accounting firm, Deloitte & Touche LLP, the member firms of Deloitte Touche Tohmatsu, and their respective affiliates (collectively, “Deloitte”), and fees paid to Deloitte for services in the fee categories indicated below for fiscal years 2019 and 2018. The Audit Committee has considered the scope and fee arrangements for all services provided by Deloitte, taking into account whether the provision of non-audit services is compatible with maintaining Deloitte’s independence, and has pre-approved the services described below.
Years Ended | |||||||
Amounts in '000s | June 30, 2019 | June 30, 2018 | |||||
Audit Fees (1) | 7,178 | 5,053 | |||||
Audit-Related Fees | — | — | |||||
Tax Fees | 48 | — | |||||
All Other Fees | 2 | 2 | |||||
Total | 7,228 | 5,055 | |||||
__________________________
(1) | Audit fees consist of the aggregate fees for professional services rendered for the audit of our consolidated financial statements, review of interim condensed consolidated financial statements and certain statutory audits. |
Audit Committee Pre-Approval Policies and Procedures
The Audit Committee has determined that all services performed by Deloitte & Touche LLP are compatible with maintaining the independence of Deloitte & Touche LLP. The Audit Committee’s policy on approval of services performed by the independent registered public accounting firm is to pre-approve all audit and permissible non-audit services to be provided by the independent registered public accounting firm during the fiscal year. The Audit Committee reviews each non-audit service to be provided and assesses the impact of the service on the firm’s independence.
PART IV
Item 15. Exhibits and Financial Statement Schedules
(a) 1. Financial Statements
See Index to consolidated financial statements in Part II, Item 8 of this Annual Report on Form 10-K, which is incorporated herein by reference.
2. Financial Statement Schedules
All financial statement schedules have been omitted because they are either not applicable or the required information is shown in the consolidated financial statements or notes thereto.
3. Exhibits
See the Exhibit Index which precedes the signature page of this Annual Report, which is incorporated herein by reference.
(b) Exhibits
See Item 15(a)(3) above.
(c) Financial Statement Schedules
See Item 15(a)(2) above.
EXHIBIT INDEX
Exhibit Number | Description | |
153
3.3 | ||
3.4 | ||
4.1 | ||
4.5+ | ||
10.1* | ||
10.2* | ||
10.3* | ||
10.4* | ||
10.5* | ||
10.6* | ||
10.7* | ||
10.8* | ||
10.9* | ||
10.10* | ||
10.11* | ||
10.12* | ||
10.13* | ||
10.14 | ||
10.15* | ||
10.16* | ||
10.17* | ||
10.18 | ||
10.19* | ||
10.20* | ||
10.21* | ||
10.22 | ||
10.23 | ||
10.24 | ||
10.25 | ||
10.26* | ||
10.27 | ||
10.28 | ||
10.29 | ||
10.30 | ||
10.31 | ||
10.32 | ||
10.33 | ||
10.34 | ||
10.35 | ||
10.36* | ||
10.37* | ||
10.38* | ||
10.39* | ||
10.40* | ||
10.41 | ||
10.42 | ||
10.43 | ||
10.44 | ||
10.45 | ||
10.46 | ||
10.47 | ||
10.48 | ||
10.49 | ||
10.50 | ||
10.51 | ||
10.52 | ||
10.53 | ||
10.54+ | ||
10.55*+‡ | ||
10.56*+‡ | ||
10.57*+‡ | ||
10.58*+‡ | ||
10.59+ | ||
14.1 | ||
21.1+ | ||
24.1+ | Power of Attorney (included in signature pages) | |
31.1+ | ||
31.2+ | ||
32.1+ | ||
32.2+ | ||
101.INS+ | XBRL Instance Document | |
101.SCH+ | XBRL Taxonomy Extension Schema Document | |
101.CAL+ | XBRL Taxonomy Extension Calculation Linkbase Document | |
101.DEF+ | XBRL Taxonomy Extension Definition Linkbase Document | |
101.LAB+ | XBRL Taxonomy Extension Label Linkbase Document | |
101.PRE+ | XBRL Taxonomy Extension Presentation Linkbase Document | |
__________________________
+ | Filed herewith |
(1) | Incorporated by reference to the same number exhibit filed with the Registrant’s Registration Statement on Form S-1 (Registration No. 333-138370), declared effective by the Securities and Exchange Commission on March 28, 2007. |
(2) | Incorporated by reference to the Company’s registration statement on Form S-8 (Commission File No. 333-142404) filed with the Securities and Exchange Commission on April 27, 2007. |
(3) | Incorporated by reference to Exhibit 10.1 from the Company’s Current Report on Form 8-K (Commission File No. 001-33383) filed with the Securities and Exchange Commission on June 29, 2007. |
(4) | Incorporated by reference to the Company’s Annual Report on Form 10-K (Commission File No. 001-33383) filed with the Securities and Exchange Commission on September 2, 2008. |
(5) | Incorporated by reference to the Company’s Current Report on Form 8-K (Commission File No. 001-33383) filed with the Securities and Exchange Commission on December 2, 2008. |
(6) | Incorporated by reference to the Company’s Quarterly Report on Form 10-Q (Commission File No. 001-33383) filed with the Securities and Exchange Commission on May 7, 2010. |
(7) | Incorporated by reference to Exhibit 10.34 from the Company’s Annual Report on Form 10-K (Commission File No. 001-33383) filed with the Securities and Exchange Commission on September 7, 2010. |
(8) | Incorporated by reference to Appendix A from the Company’s Definitive Proxy Statement on Schedule 14A (Commission File No. 001-33383) filed with the Securities and Exchange Commission on January 18, 2011. |
(9) | Incorporated by reference to the Company's Quarterly Report on Form 10-Q (Commission File No. 001-33383) filed with the Securities and Exchange Commission on November 7, 2011. |
(10) | Incorporated by reference to the Company's Current Report on Form 8-K (Commission File No. 001-33383) filed with the Securities and Exchange Commission on September 24, 2013. |
(11) | Incorporated by reference to the Company’s Quarterly Report on Form 10-Q (Commission File No. 001-33383) filed with the Securities and Exchange Commission on November 7, 2013. |
(12) | Incorporated by reference to the Company’s Quarterly Report on Form 10-Q (Commission File No. 001-33383) filed with the Securities and Exchange Commission on February 9, 2015. |
(13) | Incorporated by reference to the Company’s Annual Report on Form 10-K (Commission File No. 001-33383) filed with the Securities and Exchange Commission on September 10, 2015. |
(14) | Incorporated by reference to the Company’s Quarterly Report on Form 10-Q (Commission File No. 001-33383) filed with the Securities and Exchange Commission on November 16, 2015. |
(15) | Incorporated by reference to the Company’s Quarterly Report on Form 10-Q (Commission File No. 001-33383) filed with the Securities and Exchange Commission on February 4, 2016. |
(16) | Incorporated by reference to the Company's Current Report on Form 8-K (Commission File No. 001-33383) filed with the Securities and Exchange Commission on March 14, 2016. |
(17) | Incorporated by reference to the Company's registration statement on Form S-8 (Commission File No.333-210881) filed with the Securities and Exchange Commission on April 22, 2016. |
(18) | Incorporated by reference to the Company’s Quarterly Report on Form 10-Q (Commission File No. 001-33383) filed with the Securities and Exchange Commission on May 6, 2016. |
(19) | Incorporated by reference to the Company’s Annual Report on Form 10-K (Commission File No. 001-33383) filed with the Securities and Exchange Commission on August 26, 2016. |
(20) | Incorporated by reference to the Company’s Quarterly Report on Form 10-Q (Commission File No. 001-33383) filed with the Securities and Exchange Commission on May 10, 2017. |
(21) | Incorporated by reference to Exhibit 10.1 from the Company’s Current Report on 8-K (Commission File No. 001-33383) filed with the Securities and Exchange Commission on October 31, 2017. |
(22) | Incorporated by reference to Exhibit 10.1 from the Company’s Current Report on 8-K (Commission File No. 001-33383) filed with the Securities and Exchange Commission on January 17, 2018. |
(23) | Incorporated by reference to Exhibit 10.1 from the Company’s Current Report on 8-K (Commission File No. 001-33383) filed with the Securities and Exchange Commission on March 13, 2018. |
(24) | Incorporated by reference to Exhibit 10.1 from the Company’s Current Report on 8-K (Commission File No. 001-33383) filed with the Securities and Exchange Commission on September 12, 2018. |
(25) | Incorporated by reference to Exhibit 14.1 from the Company’s Current Report on 8-K (Commission File No. 001-33383) filed with the Securities and Exchange Commission on February 5, 2019. |
(26) | The certifications attached as Exhibit 32.1 and 32.2 accompany the Annual Report on Form 10-K pursuant to Section 906 of the Sarbanes-Oxley Act of 2002 and shall not be deemed “filed” by Super Micro Computer, Inc. for purposes of Section 18 of the Securities Exchange Act of 1934, as amended. |
(27) | Incorporated by reference to the Company's Annual Report on Form 10-K (Commission File No. 001-33383) filed with the Securities and Exchange Commission on May 17, 2019. |
(28) | Incorporated by reference to Exhibit 10.1 from the Company's Current report on 8-K (Commission File No. 001-33383) filed with the Securities and Exchange Commission on July 2, 2019. |
* | Management contract, or compensatory plan or arrangement |
‡ | Certain portions of this document, the disclosure of which would constitute a clearly unwarranted invasion of personal privacy, have been redacted in accordance with Regulation S-K Item 606(a)(6). |
Item 16. Form 10-K Summary
None.
SIGNATURES
Pursuant to the requirements of Section 13 or 15(d) of the Securities Exchange Act of 1934, the registrant has duly caused this report to be signed on its behalf by the undersigned, thereunto duly authorized.
SUPER MICRO COMPUTER, INC.
Date: | December 19, 2019 | /s/ CHARLES LIANG | |
Charles Liang President, Chief Executive Officer and Chairman of the Board (Principal Executive Officer) | |||
POWER OF ATTORNEY
KNOW ALL PERSONS BY THESE PRESENTS, that each person whose signature appears below constitutes and appoints Charles Liang and Kevin Bauer, jointly and severally, his or her attorney-in-fact, each with the full power of substitution, for such person, in any and all capacities, to sign any and all amendments to this Annual Report on Form 10-K, and to file the same, with all exhibits thereto and other documents in connection therewith, with the Securities and Exchange Commission, granting unto said attorney-in-fact and agent full power and authority to do and perform each and every act and thing requisite and necessary to be done in connection therewith, as fully to all intents and purposes as he or she might do or could do in person hereby ratifying and confirming all that each of said attorneys-in-fact and agents, or his or her substitute, may do or cause to be done by virtue hereof.
Pursuant to the requirements of the Securities Exchange Act of 1934, this report has been signed below by the following persons on behalf of the registrant and in the capacities indicated and on the dates indicated.
Signature | Title | Date | ||
/s/ CHARLES LIANG | President, Chief Executive Officer and Chairman of the Board (Principal Executive Officer) | December 19, 2019 | ||
Charles Liang | ||||
/s/ KEVIN BAUER | Senior Vice President, Chief Financial Officer (Principal Financial and Accounting Officer) | December 19, 2019 | ||
Kevin Bauer | ||||
/s/ SARA LIU | Director | December 19, 2019 | ||
Sara Liu | ||||
/s/ DANIEL W. FAIRFAX | Director | December 19, 2019 | ||
Daniel W. Fairfax | ||||
/s/ MICHAEL S. MCANDREWS | Director | December 19, 2019 | ||
Michael S. McAndrews | ||||
/s/ HWEI-MING (FRED) TSAI | Director | December 19, 2019 | ||
Hwei-Ming (Fred) Tsai | ||||
/s/ SARIA TSENG | Director | December 19, 2019 | ||
Saria Tseng | ||||
/s/ SHERMAN TUAN | Director | December 19, 2019 | ||
Sherman Tuan | ||||
/s/ TALLY LIU | Director | December 19, 2019 | ||
Tally Liu | ||||
158