Attached files
| file | filename |
|---|---|
| 8-K - 8-K - CIRCOR INTERNATIONAL INC | cir-20210304.htm |
| EX-99.1 - EX-99.1 - CIRCOR INTERNATIONAL INC | cir_q4x12312020xex991.htm |
INDUSTRIAL AEROSPACE & DEFENSE 2020 Fourth Quarter and Full Year Earnings Call March 4, 2021 This presentation contains certain statements that are “forward-looking statements” as that term is defined under the Private Securities Litigation Reform Act of 1995 (the “Act”). The words “may,” “hope,” “should,” “expect,” “plan,” “anticipate,” “intend,” “believe,” “estimate,” “predict,” “potential,” “continue,” and other expressions, which are predictions of or indicate future events and trends and which do not relate to historical matters, identify forward-looking statements, although not all forward-looking statements are accompanied by such words. We believe that it is important to communicate our future expectations to our stockholders, and we, therefore, make forward-looking statements in reliance upon the safe harbor provisions of the Act. However, there may be events in the future that we are not able to accurately predict or control and our actual results may differ materially from the expectations we describe in our forward-looking statements. Forward-looking statements, including statements about outlook for the fourth quarter, the expected and potential direct or indirect impacts of the COVID-19 pandemic on our business, the realization of cost reductions from restructuring activities and expected synergies, the number of new product launches and future cash flows from operating activities, involve known and unknown risks, uncertainties and other factors, which may cause our actual results, performance or achievements to differ materially from anticipated future results, performance or achievements expressed or implied by such forward-looking statements. Factors that could cause or contribute to such differences include, but are not limited to: the duration and severity of the COVID-19 pandemic and its impact on the global economy; changes in the price of and demand for oil and gas in both domestic and international markets; any adverse changes in governmental policies; variability of raw material and component pricing; changes in our suppliers’ performance; fluctuations in foreign currency exchange rates; changes in tariffs or other taxes related to doing business internationally; our ability to hire and retain key personnel; our ability to operate our manufacturing facilities at efficient levels including our ability to prevent cost overruns and reduce costs; our ability to generate increased cash by reducing our working capital; our prevention of the accumulation of excess inventory; our ability to successfully implement our divestiture; restructuring or simplification strategies; fluctuations in interest rates; our ability to successfully defend product liability actions; as well as the uncertainty associated with the current worldwide economic conditions and the continuing impact on economic and financial conditions in the United States and around the world, including as a result of COVID- 19, natural disasters, terrorist attacks and other similar matters. We advise you to read further about these and other risk factors set forth in Part II, Item 1A of this Quarterly Report on Form 10-Q and Part I, Item 1A, “Risk Factors” of our Annual Report on Form 10-K for the year ended December 31, 2019, which is filed with the Securities and Exchange Commission ("SEC") and is available on the SEC's website at www.sec.gov. We undertake no obligation to publicly update or revise any forward-looking statement, whether as a result of new information, future events or otherwise. See page 16 for information on the use of non-GAAP financial measures.

2020 Execution on Strategic Plan 2 Resilient business portfolio continues to deliver Strong operational execution Positioning CIRCOR to take advantage of market recovery • End market and product diversification helped mitigate the impact of a weaker macro environment • Strong year in Defense mostly offset pressure from Commercial Aerospace • Mission critical product portfolio enabled price increases despite market downturn • Steadfast in prioritizing health and safety while serving our customers • Achieved 25% decremental margins through price increases and $45 million of cost actions • Aerospace and Defense Margins expanded 290bps driven by productivity and price • CIRCOR Operating System delivered improved operating performance across most metrics • Completed exit from upstream O&G with sale of Instrumentation & Sampling and Distributed Valves • Continued to invest in innovation with 49 new products vs. 33 in 2019 • Exited the year with strong FCF … $20M in Q4 • Reduced net debt by $126M, (22)% vs 2019 … remains top priority

4Q’20 FY’20y/y y/y 3 Backlog Orders Organic % Revenue Organic %* AOI* AOI % GAAP EPS Adj. EPS* FCF* % of adj. net income 379 168 208 23 11.2% $(0.70) $0.66 20 152% (8)% (29)% (25)% (14)% (10)% (28)% (210) bps n/a (20)% 11% 379 736 773 68 8.7% $(9.28) $1.43 (35) - (8)% (25)% (18)% (20)% (12)% (38)% (270) bps (38)% (45)% n/a Organic orders and revenue pressured by COVID-19 … demand reduction across Industrial and Commercial Aerospace Adjusted operating income of $23 / 11.2% … sequential improvement through the year Adjusted EPS of $0.66 … volume impact partially offset by price and cost actions FCF of $20 … exited the year with strong operational cash flow Comments on 4Q results Strong underlying execution despite COVID-19 challenges Organic revenue, Adjusted Operating Income (AOI), Adjusted EPS, and Free Cash Flow (FCF) are non-GAAP measures ($ millions except EPS) 4Q and FY 2020 Reported Results

4Q’20 Industrial Segment Highlights ($ millions) 4Q 2020 Orders • Sequential improvement led by continued recovery in China and India, improvement in EMEA & Americas • Down y/y driven by tough 1Q’20 comp in Downstream 4Q 2020 Revenue • Sequential improvement in EMEA, Commercial Marine, and aftermarket • Revenue impacted by lower order intake in 2Q - 4Q 4Q 2020 AOI • AOI impacted by lower volume and inefficiencies due to COVID-19 offset by price (+1%) and cost actions Continuing Ops figures exclude the impact of businesses divested prior to the end of 4Q 2020. 4 $168 $150 $107 $122 4Q'19 Reported 4Q'19 3Q'20 4Q'20 vs. 3Q y/y +12% (22)% OrganicOrders Organic revenue and Adjusted Operating Income (AOI) are non-GAAP measures Revenue AOI vs. 3Q y/y +4% (13)% Organic vs. 3Q y/y +160bps (260)bps AOI expansion $164 $145 $124 $131 4Q'19 Reported 4Q'19 3Q'20 4Q'20 $21 $18 $10 $12 4Q'19 Reported 4Q'19 3Q'20 4Q'20 12.7% 12.1% 7.9% 9.5% Continuing Ops Continuing Ops Continuing Ops Numbers may not add due to rounding

4Q’20 Aerospace & Defense Segment Highlights ($ millions) 4Q 2020 Orders • Orders decline driven by timing of large Defense orders and continued pressure on Commercial demand due to COVID-19 4Q 2020 Revenue • Strong defense revenue mostly offset lower Commercial demand 4Q 2020 AOI • Strong margin rate driven by continued pricing (+3%), productivity and cost actions 5 $68 $59 $47 4Q'19 3Q'20 4Q'20 $79 $62 $78 4Q'19 3Q'20 4Q'20 vs. 3Q y/y (21)% (33)% OrganicOrders Revenue vs. 3Q y/y +25% (3)% Organic $19 $15 $19 4Q'19 3Q'20 4Q'20 AOI vs. 3Q y/y +30bps (20)bps AOI expansion 24.2% 23.7% 24.0% Organic revenue and Adjusted Operating Income (AOI) are non-GAAP measures Numbers may not add due to rounding
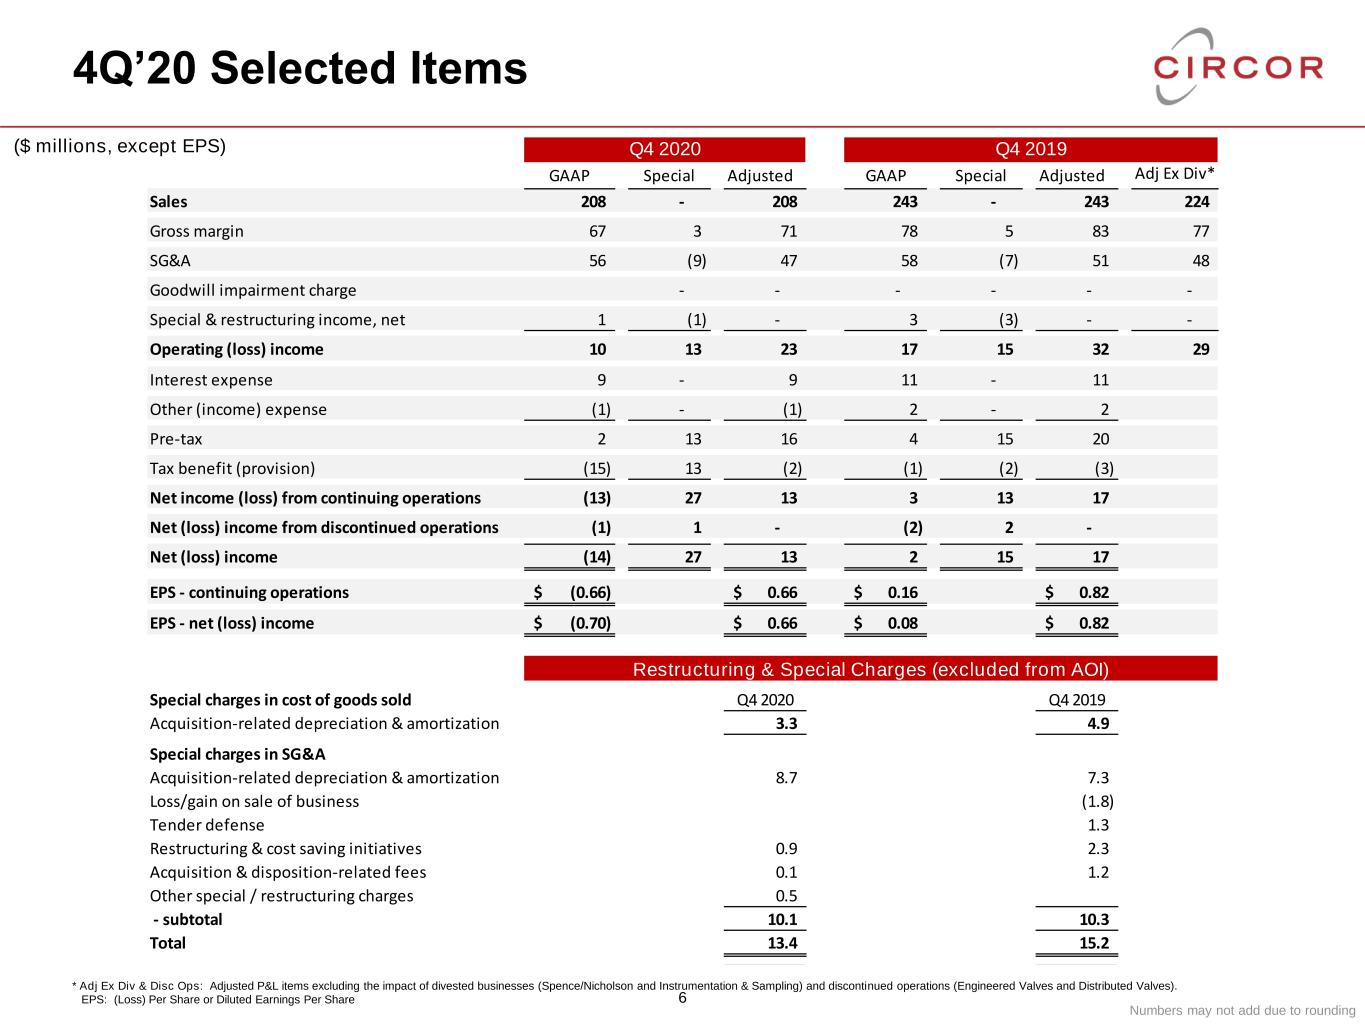
GAAP Special Adjusted GAAP Special Adjusted Adj Ex Div* Sales 208 - 208 243 - 243 224 Gross margin 67 3 71 78 5 83 77 SG&A 56 (9) 47 58 (7) 51 48 Goodwill impairment charge - - - - - - Special & restructuring income, net 1 (1) - 3 (3) - - Operating (loss) income 10 13 23 17 15 32 29 Interest expense 9 - 9 11 - 11 Other (income) expense (1) - (1) 2 - 2 Pre-tax 2 13 16 4 15 20 Tax benefit (provision) (15) 13 (2) (1) (2) (3) Net income (loss) from continuing operations (13) 27 13 3 13 17 Net (loss) income from discontinued operations (1) 1 - (2) 2 - Net (loss) income (14) 27 13 2 15 17 EPS - continuing operations (0.66)$ 0.66$ 0.16$ 0.82$ EPS - net (loss) income (0.70)$ 0.66$ 0.08$ 0.82$ Special charges in cost of goods sold Q4 2020 Q4 2019 Acquisition-related depreciation & amortization 3.3 4.9 Special charges in SG&A Acquisition-related depreciation & amortization 8.7 7.3 Loss/gain on sale of business (1.8) Tender defense 1.3 Restructuring & cost saving initiatives 0.9 2.3 Acquisition & disposition-related fees 0.1 1.2 Other special / restructuring charges 0.5 - subtotal 10.1 10.3 Total 13.4 15.2 Q4 2019 Restructuring & Special Charges (excluded from AOI) Q4 2020 4Q’20 Selected Items 6 * Adj Ex Div & Disc Ops: Adjusted P&L items excluding the impact of divested businesses (Spence/Nicholson and Instrumentation & Sampling) and discontinued operations (Engineered Valves and Distributed Valves). EPS: (Loss) Per Share or Diluted Earnings Per Share ($ millions, except EPS) Numbers may not add due to rounding

4Q’20 Cash Flow and Debt Position 7 4Q’194Q’20 y/y $17$24 40% Cash flow from operations driven by improved operating income and lower inventory Reduced net debt by $126 million in 2020 ... continue to use FCF to pay down debt in 2021 Targeting long-term leverage ratio of 2.0x to 2.5x net debt to EBITDA Comments on 4Q’20 Results 2(3) n/a $18$20 11% $654$520 (20)% 8576 (10)% $569$443 (22)% Cash Flow from Operations Capital Expenditures, net Free Cash Flow Total Debt Cash and Cash Equivalents Net Debt Free cash flow and net debt are non-GAAP measures ($ millions)
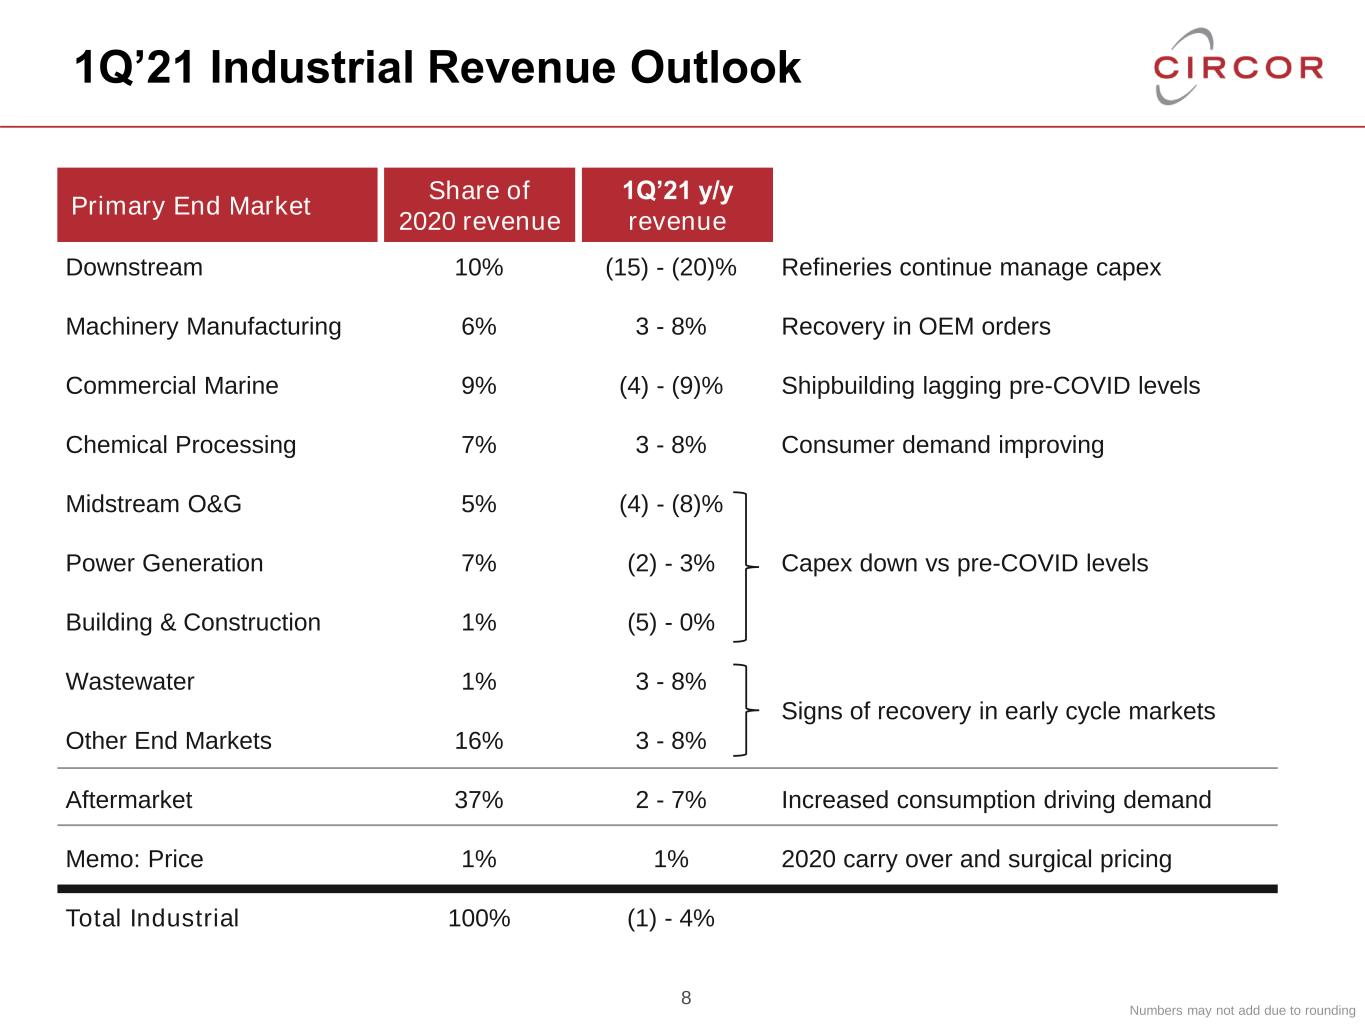
1Q’21 Industrial Revenue Outlook Primary End Market Share of 2020 revenue 1Q’21 y/y revenue Downstream Machinery Manufacturing Commercial Marine Chemical Processing Midstream O&G Power Generation Building & Construction Wastewater Other End Markets Aftermarket Memo: Price Total Industrial 10% 6% 9% 7% 5% 7% 1% 1% 16% 37% 1% 100% (15) - (20)% 3 - 8% (4) - (9)% 3 - 8% (4) - (8)% (2) - 3% (5) - 0% 3 - 8% 3 - 8% 2 - 7% 1% (1) - 4% Refineries continue manage capex Recovery in OEM orders Shipbuilding lagging pre-COVID levels Consumer demand improving Capex down vs pre-COVID levels Signs of recovery in early cycle markets Increased consumption driving demand 2020 carry over and surgical pricing 8 Numbers may not add due to rounding

1Q’21 A&D Revenue Outlook 9 D e fe n s e C o m m e rc ia l Primary End Market Share of 2020 revenue 1Q’21 y/y revenue Top programs Other OEM Aftermarket Memo: Price Defense subtotal Boeing / Airbus Other OEM Aftermarket Memo: Price Commercial subtotal Other end markets Total A&D 27% 23% 19% 4% 69% 7% 7% 2% 2% 16% 15% 100% (3) - (5)% 5 - 10% (10) - (16)% 1% (1) - (5)% (50) - (55)% (5) - (10)% (45) - (50)% 1% (35) - (40)% (0) – (5)% (7) – (12)% Timing of large shipments (JSF / CVN carrier) Growth from both new and existing programs Lower U.S. defense spares demand in 1Q Expect full year pricing in line with 2020 COVID-19 impact on demand for new aircraft Signs of recovery, still below pre-COVID levels COVID-19 impact on air traffic and utilization Expect full year pricing in line with 2020 Recovering from COVID-19 impact Numbers may not add due to rounding
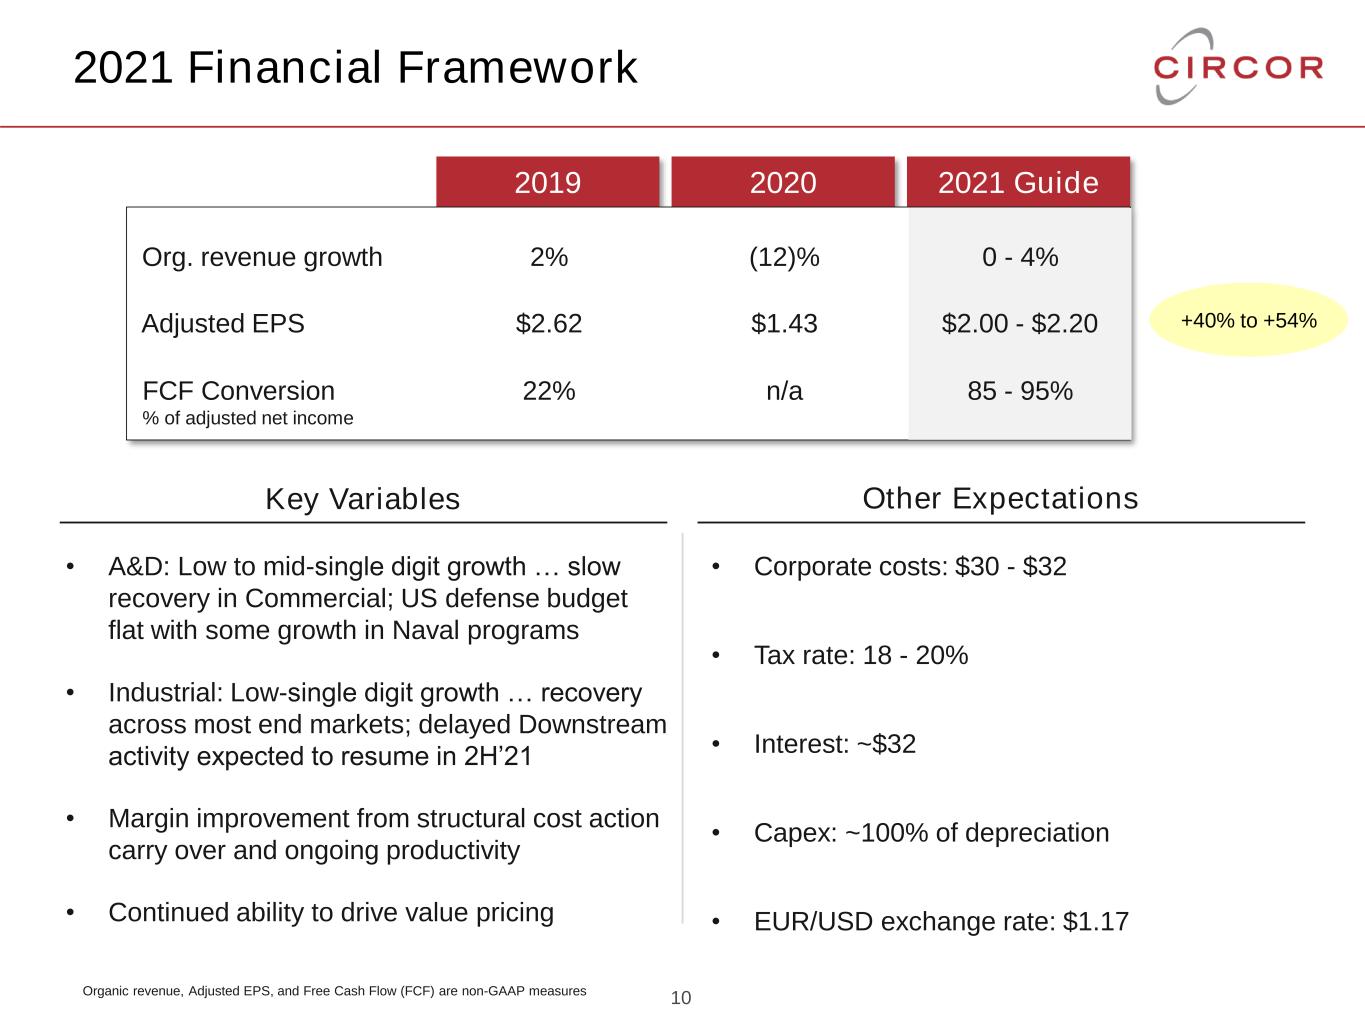
2019 2020 2021 Guide 2021 Financial Framework Org. revenue growth 2% (12)% 0 - 4% Adjusted EPS $2.62 $1.43 $2.00 - $2.20 Key Variables Other Expectations • A&D: Low to mid-single digit growth … slow recovery in Commercial; US defense budget flat with some growth in Naval programs • Industrial: Low-single digit growth … recovery across most end markets; delayed Downstream activity expected to resume in 2H’21 • Margin improvement from structural cost action carry over and ongoing productivity • Continued ability to drive value pricing • Corporate costs: $30 - $32 • Tax rate: 18 - 20% • Interest: ~$32 • Capex: ~100% of depreciation • EUR/USD exchange rate: $1.17 FCF Conversion % of adjusted net income 22% n/a 85 - 95% 10 +40% to +54% Organic revenue, Adjusted EPS, and Free Cash Flow (FCF) are non-GAAP measures

2021+ Strategic Priorities 11 • Attract, develop, and retain top talent • Foster diversity, equity, and inclusion People Accelerate Growth Allocate Capital Effectively Expand Margins • Invest in differentiated technology and digital – New products – Aftermarket support technology – Enhanced customer interface • Expand regionally • Value based pricing that reflects technology and market position • Ongoing simplification to address structural cost opportunity • Expand low-cost manufacturing and back-office operations • Manufacturing and supply chain optimization through CIRCOR Operating System • Enhance FCF with more efficient working capital management • Prioritize deleveraging • Target 2.0x to 2.5x net debt to adjusted EBITA leverage ratio

12 Appendix
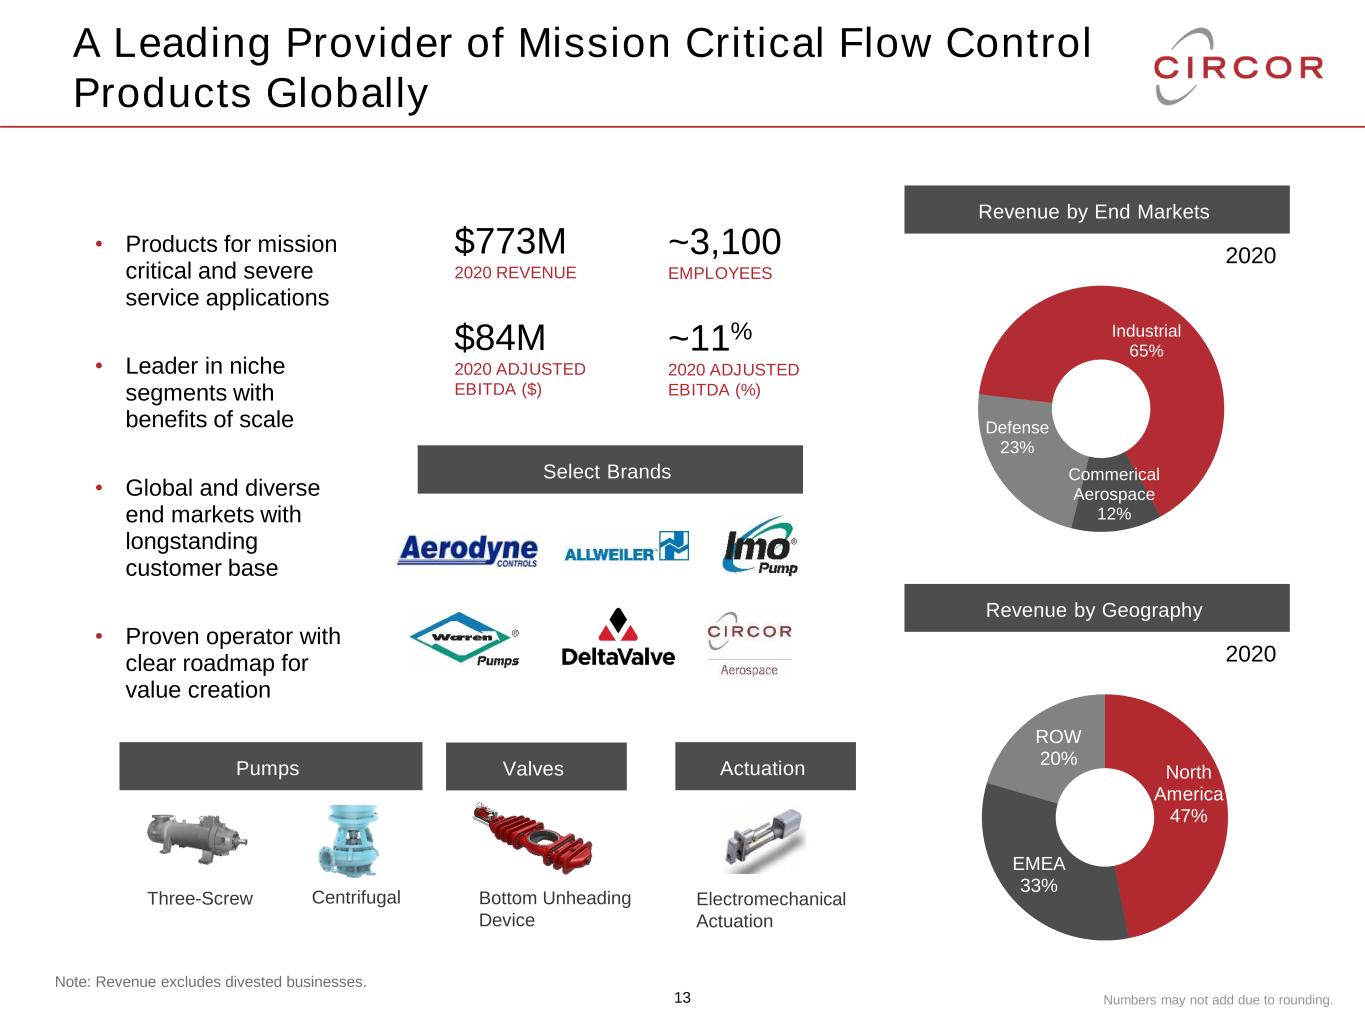
A Leading Provider of Mission Critical Flow Control Products Globally 13 Commerical Aerospace 12% Defense 23% Industrial 65% Revenue by End Markets • Products for mission critical and severe service applications • Leader in niche segments with benefits of scale • Global and diverse end markets with longstanding customer base • Proven operator with clear roadmap for value creation Three-Screw Centrifugal Bottom Unheading Device Electromechanical Actuation Pumps Valves Actuation Select Brands $773M 2020 REVENUE $84M 2020 ADJUSTED EBITDA ($) ~3,100 EMPLOYEES ~11% 2020 ADJUSTED EBITDA (%) Revenue by Geography North America 47% EMEA 33% ROW 20% 2020 2020 Numbers may not add due to rounding. Note: Revenue excludes divested businesses.
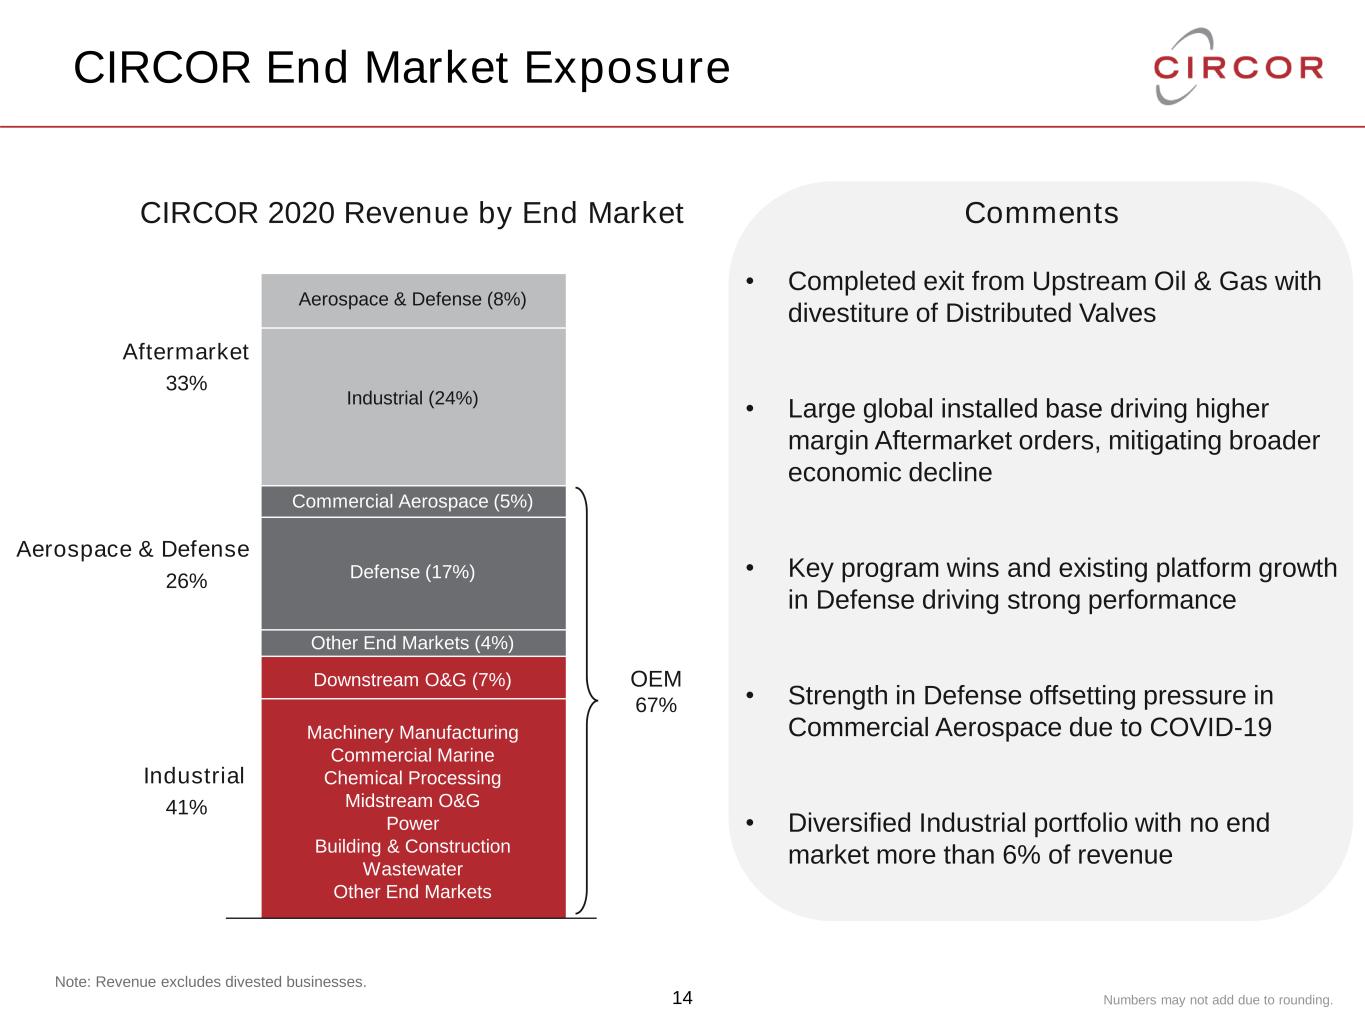
CIRCOR End Market Exposure 14 Commercial Aerospace (5%) Defense (17%) Numbers may not add due to rounding. Machinery Manufacturing Commercial Marine Chemical Processing Midstream O&G Power Building & Construction Wastewater Other End Markets Downstream O&G (7%) Aerospace & Defense (8%) Industrial (24%) OEM 67% • Completed exit from Upstream Oil & Gas with divestiture of Distributed Valves • Large global installed base driving higher margin Aftermarket orders, mitigating broader economic decline • Key program wins and existing platform growth in Defense driving strong performance • Strength in Defense offsetting pressure in Commercial Aerospace due to COVID-19 • Diversified Industrial portfolio with no end market more than 6% of revenue CIRCOR 2020 Revenue by End Market Comments Aftermarket Industrial Aerospace & Defense 33% 26% 41% Note: Revenue excludes divested businesses. Other End Markets (4%)

Financial goals 15 • +100 to 150 bps higher than end market growth driven by strategic initiatives • Continued execution on price initiatives • Near term (18-24 months) AOI% outlook • Industrial: low teens • A&D: mid-20s • CIRCOR Operating System delivering improved operating performance • FCF conversion of 90-95% of adjusted net income • Intense focus on working capital • Operating cash flow used to pay down debt • Targeting long-term leverage ratio of 2 to 2.5x net debt to EBITDA Organic Growth Margin Expansion Free Cash Flow Debt & Leverage

Use of Non-GAAP Financial Measures Within this presentation the Company uses non-GAAP financial measures, including Adjusted operating income, Adjusted operating margin, Adjusted net income, Adjusted earnings per share (diluted), EBITDA, Adjusted EBITDA, net debt, free cash flow and organic growth (and such measures further excluding discontinued operations). These non- GAAP financial measures are used by management in our financial and operating decision making because we believe they reflect our ongoing business and facilitate period-to- period comparisons. We believe these non-GAAP financial measures provide useful information to investors and others in understanding and evaluating the Company’s current operating performance and future prospects in the same manner as management does, if they so choose. These non-GAAP financial measures also allow investors and others to compare the Company’s current financial results with the Company’s past financial results in a consistent manner. For example: • We exclude costs and tax effects associated with restructuring activities, such as reducing overhead and consolidating facili ties. We believe that the costs related to these restructuring activities are not indicative of our normal operating costs. • We exclude certain acquisition-related costs, including significant transaction costs and amortization of inventory and fixed-asset step-ups and the related tax effects. We exclude these costs because we do not believe they are indicative of our normal operating costs. • We exclude the expense and tax effects associated with the non-cash amortization of acquisition-related intangible assets because a significant portion of the purchase price for acquisitions may be allocated to intangible assets that have lives up to 25 years. Exclusion of the non-cash amortization expense allows comparisons of operating results that are consistent over time for both our newly acquired and long-held businesses and with both acquisitive and non-acquisitive peer companies. • We also exclude certain gains/losses and related tax effects, which are either isolated or cannot be expected to occur again with any predictability, and that we believe are not indicative of our normal operating gains and losses. For example, we exclude gains/losses from items such as the sale of a business, significant litigation-related matters and lump-sum pension plan settlements. • We exclude the results of discontinued operations. • We exclude goodwill impairment charges. • Due to the significance of recently sold businesses and to provide a comparison of changes in our orders and revenue, we also discuss these changes on an “organic” basis. Organic is calculated assuming the divestitures completed prior to December 31, 2020 were completed on January 1, 2019 and excluding the impact of changes in foreign currency exchange rates. CIRCOR’s management uses these non-GAAP measures, in addition to GAAP financial measures, as the basis for measuring the Company’s operating performance and comparing such performance to that of prior periods and to the performance of our competitors. We use such measures when publicly providing our business outlook, assessing future earnings potential, evaluating potential acquisitions and dispositions and in our financial and operating decision-making process, including for compensation purposes. Investors should recognize that these non-GAAP measures might not be comparable to similarly titled measures of other companies. These measures should be considered in addition and not as a substitute for or superior to, any measure of performance, cash flow or liquidity prepared in accordance with accounting principles generally accepted in the United States. A reconciliation of the non-GAAP financial measures to the most directly comparable GAAP measures is available in the Company’s fourth quarter2020 news release available on its website at www.CIRCOR.com. Figures labeled “Adjusted” exclude certain charges and recoveries. A description of these charges and recoveries and a reconciliation of the non-GAAP financial measures to the most directly comparable GAAP measures is available in the Company’s fourth quarter 2020 news release available on its website at www.CIRCOR.com. 16
