Attached files
| file | filename |
|---|---|
| EX-10.8 - AMENDED AND RESTATED MANAGEMENT STOCK PURCHASE PLAN - CIRCOR INTERNATIONAL INC | cir_12312017xex108.htm |
| EX-32.1 - CERTIFICATION OF CEO & CFO PURSUANT TO SECTION 906 - CIRCOR INTERNATIONAL INC | cir_12312017ex321.htm |
| EX-31.2 - CERTIFICATION OF CFO PURSUANT TO SECTION 302 - CIRCOR INTERNATIONAL INC | cir_12312017ex312.htm |
| EX-31.1 - CERTIFICATION OF CEO PURSUANT TO SECTION 302 - CIRCOR INTERNATIONAL INC | cir_12312017ex311.htm |
| EX-23.1 - CONSENT OF PRICEWATERHOUSECOOPERS LLP - CIRCOR INTERNATIONAL INC | cir_12312017ex231.htm |
| EX-21 - SCHEDULE OF SUBSIDIARIES OF CIRCOR INTERNATIONAL, INC - CIRCOR INTERNATIONAL INC | cir_12312017ex21.htm |
| EX-10.6 - SECOND AMENDMENT TO THE 1999 STOCK OPTION PLAN - CIRCOR INTERNATIONAL INC | cir_12312017xex106.htm |
UNITED STATES
SECURITIES AND EXCHANGE COMMISSION
Washington, D.C. 20549
FORM 10-K
x | ANNUAL REPORT PURSUANT TO SECTION 13 OR 15(d) OF THE SECURITIES EXCHANGE ACT OF 1934 |
For the fiscal year ended December 31, 2017
OR
¨ | TRANSITION REPORT PURSUANT TO SECTION 13 OR 15(d) OF THE SECURITIES EXCHANGE ACT OF 1934 |
For the transition period from to .
Commission File Number 001-14962
CIRCOR INTERNATIONAL, INC.
(Exact name of registrant as specified in its charter)
Delaware | 04-3477276 | |
(State or Other Jurisdiction of Incorporation or Organization) | (I.R.S. Employer Identification No.) | |
c/o CIRCOR, Inc. | ||
30 Corporate Drive, Suite 200, Burlington, MA | 01803-4238 | |
(Address of principal executive offices) | (Zip Code) | |
(781) 270-1200
(Registrant’s telephone number, including area code)
Securities registered pursuant to Section 12 (b) of the Act:
Common Stock, par value $0.01 per share (registered on the New York Stock Exchange)
Securities registered pursuant to Section 12 (g) of the Act: None
Indicate by check mark if the registrant is a well-known seasoned issuer, as defined in Rule 405 of the Securities Act. Yes x No ¨
Indicate by check mark if the registrant is not required to file reports pursuant to Section 13 or Section 15(d) of the Exchange Act. Yes ¨ No x
Indicate by check mark whether the registrant (1) has filed all reports required to be filed by Section 13 or 15(d) of the Securities Exchange Act of 1934 during the preceding 12 months (or for such shorter period that the registrant was required to file such reports), and (2) has been subject to such filing requirements for the past 90 days. Yes x No ¨
Indicate by check mark whether the registrant has submitted electronically and posted on its corporate Web site, if any, every Interactive Data File required to be submitted and posted pursuant to Rule 405 of Regulation S-T (§ 232.405 of this chapter) during the preceding 12 months (or for such shorter period that the registrant was required to submit and post such files). Yes x No ¨
Indicate by check mark if disclosure of delinquent filers pursuant to Item 405 of Regulation S-K (§ 229.405 of this chapter) is not contained herein, and will not be contained, to the best of registrant’s knowledge, in definitive proxy or information statements incorporated by reference in Part III of this Form 10-K or any amendment to this Form 10-K. x
Indicate by check mark whether the registrant is a large accelerated filer, an accelerated filer, a non-accelerated filer, smaller reporting company, or an emerging growth company. See the definitions of “large accelerated filer,” “accelerated filer”, “smaller reporting company,” and “emerging growth company” in Rule 12b-2 of the Exchange Act.
Large accelerated filer | x | Accelerated filer | o | Emerging growth company | o | |
Non-accelerated filer | o | (Do not check if a smaller reporting company) | Smaller reporting company | o | ||
If an emerging growth company, indicate by check mark if the registrant has elected not to use the extended transition period for complying with any new or revised financial accounting standards provided pursuant to Section 13(a) of the Exchange Act. Yes ¨ No ¨
Indicate by check mark whether the registrant is a shell company (as defined in Rule 12b-2 of the Exchange Act). Yes ¨ No x
The aggregate market value of voting stock held by non-affiliates of the registrant as of June 30, 2017 was $953,820,000. The registrant does not have any non-voting common equity.
As of February 21, 2018, there were 19,793,160 shares of the registrant’s Common Stock outstanding.
DOCUMENTS INCORPORATED BY REFERENCE
Part III incorporates by reference certain portions of the information from the registrant’s definitive Proxy Statement for the 2017 Annual Meeting of Stockholders to be held on May 10, 2018. The definitive Proxy Statement will be filed with the Securities and Exchange Commission within 120 days of the close of the registrant’s year ended December 31, 2017.
Table of Contents
Page Number | ||
Part I | ||
Item 1 | ||
Item 1A | ||
Item 1B | ||
Item 2 | ||
Item 3 | ||
Item 4 | Mine Safety Disclosures | |
Part II | ||
Item 5 | ||
Item 6 | ||
Item 7 | ||
Item 7A | ||
Item 8 | ||
Item 9 | ||
Item 9A | ||
Item 9B | ||
Part III | ||
Item 10 | ||
Item 11 | ||
Item 12 | ||
Item 13 | ||
Item 14 | ||
Part IV | ||
Item 15 | ||
Item 16 | ||
Part I
Item 1. Business
This Annual Report on Form 10-K contains certain statements that are “forward-looking statements” as that term is defined under the Private Securities Litigation Reform Act of 1995 (the “Act”). The words “may,” “hope,” “should,” “expect,” “plan,” “anticipate,” “intend,” “believe,” “estimate,” “predict,” “potential,” “continue,” and other expressions which are predictions of or indicate future events and trends and which do not relate to historical matters, identify forward-looking statements. We believe that it is important to communicate our future expectations to our stockholders, and we, therefore, make forward-looking statements in reliance upon the safe harbor provisions of the Act. However, there may be events in the future that we are not able to accurately predict or control and our actual results may differ materially from the expectations we describe in our forward-looking statements. Forward-looking statements, including statements about the integration and impact of our recent acquisition of the fluid handling business of Colfax Corporation (“FH”), involve known and unknown risks, uncertainties and other factors, which may cause our actual results, performance or achievements to differ materially from anticipated future results, performance or achievements expressed or implied by such forward-looking statements. Factors that could cause or contribute to such differences include, but are not limited to, changes in the price of and demand for oil and gas in both domestic and international markets, our ability to successfully integrate acquired businesses, as contemplated, the possibility that expected benefits related to the FH acquisition may not materialize as expected, any adverse changes in governmental policies, variability of raw material and component pricing, changes in our suppliers’ performance, fluctuations in foreign currency exchange rates, changes in tariffs or other taxes related to doing business internationally, our ability to hire and retain key personnel, our ability to operate our manufacturing facilities at efficient levels including our ability to prevent cost overruns and reduce costs, our ability to generate increased cash by reducing our working capital, our prevention of the accumulation of excess inventory, our ability to successfully implement our restructuring or simplification strategies, fluctuations in interest rates, our ability to continue to successfully defend product liability actions, as well as the uncertainty associated with the current worldwide economic conditions and the continuing impact on economic and financial conditions in the United States and around the world as a result of natural disasters, terrorist attacks, current Middle Eastern conflicts and related matters. For a discussion of these risks, uncertainties and other factors, see Item 1A "Risk Factors". We undertake no obligation to publicly update or revise any forward-looking statement, whether as a result of new information, future events or otherwise.
Overview
CIRCOR International, Inc. was incorporated under the laws of Delaware on July 1, 1999. As used in this report, the terms “we,” “us,” “our,” the “Company” and “CIRCOR” mean CIRCOR International, Inc. and its subsidiaries (unless the context indicates another meaning). The term “common stock” means our common stock, par value $0.01 per share.
We design, manufacture and market differentiated technology products and sub-systems for markets including industrial, oil & gas, aerospace and defense, and commercial marine. CIRCOR has a diversified flow and motion control product portfolio with recognized, market-leading brands that fulfill its customers’ mission critical needs. The Company’s strategy is to grow organically and through complementary acquisitions; simplify CIRCOR’s operations; achieve world class operational excellence; and attract and retain top industry talent. We have a global presence and operate 28 major manufacturing facilities that are located in North America, Western Europe, Morocco, and India. The Company has the following reportable business segments: CIRCOR Energy ("Energy segment" or "Energy"), CIRCOR Advanced Flow Solutions ("Advanced Flow Solutions segment" or "AFS"), and CIRCOR Fluid Handling ("Fluid Handling"). We sell our products through distributors or representatives, Engineering, Procurement and Construction ("EPC") companies, as well as directly to end-user customers.
Strategies
Our objective is to enhance shareholder value by focusing on growth, margin expansion, strong free cash flow, and disciplined capital deployment. We have a four-point strategy to achieve these objectives.
1) Grow Organically and Through Acquisitions. We leverage the power of our global design capabilities to develop innovative products that solve our customers’ most challenging and critical problems. New products will be an increasingly important part of our growth strategy going forward. In addition, we are positioning ourselves to grow in parts of our end markets where our products are under-represented. This could include establishing a presence in higher growth geographies where we have a limited presence today. It also could include taking products established in one end-market (e.g., automatic re-circulation valves) and selling those solutions into other relevant end markets (e.g., power projects in the United States).
1
In addition to organic growth, we expect to acquire businesses over time. We are primarily focused on companies with differentiated technologies in complementary markets that we already understand and where we expect substantial growth. In addition to strategic fit and differentiated technology, the main criterion for an acquisition is return on invested capital.
2) Simplify CIRCOR. In 2013, we embarked on a long-term journey to simplify CIRCOR. We have a large number of facilities relative to our size and believe that simplifying this structure will not only expand our margins by reducing cost, but will help us improve our customer service, operations, and controls. We continue to drive product management by obtaining an in depth understanding of our customer needs and competitor capabilities in our end markets. This has allowed us to simplify the product portfolio and the number of unique products offered in the marketplace.
3) Achieve World Class Operational Excellence. Our Global Operations and Supply Chain organization is fully committed to achieving operational excellence in support of our customers’ expectations of perfect quality, on-time delivery and market competitiveness. We follow the CIRCOR Operating System ("COS") which creates a disciplined culture of continuous improvement for driving operational excellence including a sales and inventory operations plan that provides for world-class quality and delivery while maintaining an optimal level of working capital. COS is comprised of ten business process attributes designed to engage and empower our employees to recognize and eliminate waste, work real-time problem solving as part of their everyday job experience, and enhance our performance both in operations and business office processes. Under COS our employees participate in a regimented training program and receive regular prescriptive assessments / action plans to drive process maturity. Quantitative performance metrics will define site certification levels to attain and sustain a level of quality, productivity, inventory management and market competitiveness that delights our customers, shareholders, and employees.
4) Build the Best Team. Finally, we have a fundamental belief at CIRCOR that the best team wins. We are committed to attracting the most talented people in our industry and we are committed to investing, engaging, challenging and developing our employees. We believe the best people combined with robust process, appropriate metrics, and individual accountability will deliver extraordinary results.
Acquisitions
On December 11, 2017, we completed the acquisition of the fluid handling business of Colfax Corporation (“FH”). FH is a leader in the engineering, development‚ manufacturing‚ distribution‚ service and support of fluid handling systems. The total consideration paid to acquire FH consisted of $542.0 in cash, 3,283,424 unregistered shares of our common stock and the assumption of net pension and post-retirement liabilities of FH. See Note 3, "Business Acquisitions", of the consolidated financial statements for additional information.
Business Segments
Energy
Energy is a global provider of highly engineered integrated flow control solutions, valves and services for the Oil & Gas and Process Instrumentation markets.
We are focused on satisfying our customers’ mission-critical application needs by utilizing advanced technologies. Our flow control solutions can withstand extreme temperatures and pressures, and as such are used in the most critical and severe service applications. Our installations include land-based, topside, and sub-sea oil and gas production, refining and petrochemical process control, oil sand processing, critical pressure control and cryogenic applications.
We plan to grow Energy by expanding our capabilities in Oil & Gas both organically and inorganically across the Oil & Gas and Petrochemical markets.
Energy is headquartered in Houston, Texas and has manufacturing facilities in the North America, United Kingdom, Italy, and the Netherlands.
Markets and Applications
Energy serves an increasing range of energy-focused global markets. Key to our business strategy is targeting additional markets that can benefit from our innovative products and system solutions. Markets served today include Oil & Gas: upstream (on-shore and off-shore), mid-stream and downstream applications, as well as petrochemical processing. The upstream and mid-stream markets are primarily served by our large international project and North American short-cycle businesses, and
2
downstream and petrochemical markets are served primarily by our refinery valves and instrumentation and sampling businesses.
•Upstream Oil & Gas: These markets commonly include all the equipment between the outlet on the wellhead to the mainline transmission pipeline and it also incorporates all the activities associated with the installation of this equipment. Our diverse valve portfolio covers all facets of oil and gas production, both topside and sub-sea, and includes short cycle standard products and custom engineered valves.
•Mid-stream Oil & Gas: This market begins at the mainline transmission pipeline and extends to the fence around the refinery or petrochemical plant. It includes certain ancillary equipment, as well as the gas processing plants that prepare and purify raw natural gas for entry into the major pipeline systems and Liquid Natural Gas (LNG) processes. Our valves are used for flow control in the main transmission lines, gathering systems, and storage facilities. We also provide inspection and cleaning products and services to insure the integrity of transmission pipelines.
•Downstream Oil & Gas: The downstream market includes the refining, distillation, stripping, degassing, dehydrating, desulphurizing, and purifying of the crude oil to its constituent components as well as the conversion of natural gas to methane. In addition to flow control applications for feedstocks and process control across each downstream process unit, our refinery valves business provides highly specialized engineered solutions for coking and catalytic cracking that improve the safety and efficiency of operations within the refinery.
•Petrochemical Processing: The petrochemical processing market includes the refining and manufacture of chemicals derived from oil and gas, such as polyethylene. This market requires specific instrumentation and ancillary equipment to monitor the quality and efficiency of production. Our instrumentation and sampling business provides products that are used to facilitate these activities with the highest degree of precision.
Brands
Energy provides its flow control solutions and services through the following significant brands:
Circle Seal Controls, CIRCOR Tech, Contromatics, DeltaValve, Dopak Sampling, GO Regulators, Hoke-Gyrolok, Hydroseal, KF Valves, Mallard Control, Pibiviesse, Pipeline Engineering, TapcoEnpro, and Texas Sampling.
Products
Energy offers a range of flow control solutions (distributed and highly engineered) and services, including:
• | Valves (from 1/8 inch to 64 inches in diameter) |
• | Engineered Trunion and Floating Ball Valves |
• | Gate, Globe and Check Valves |
• | Butterfly Valves |
• | Instrumentation Fittings and Sampling Systems, including Sight Glasses & Gauge Valves |
• | Liquid Level Controllers, Liquid Level Switches, Plugs & Probes Pressure Controllers, Pressure Regulators |
• | Pipeline pigs, quick opening closure, pig signalers |
• | Delayed coking unheading devices and fluid catalytic converter and isolation valves |
For our manufactured valve products, we are subject to applicable federal, state and local regulations. In addition, many of our customers require us to comply with certain industrial standards, including those issued by the American Petroleum Institute, International Organization for Standardization, Underwriters’ Laboratory, American National Standards Institute, American Society of Mechanical Engineers, and the European Pressure Equipment Directive. We also need to meet standards that qualify us to be on authorized supplier lists with various global end users. In February 2017, our manufacturing facility in Milan, Italy received a notice from the American Petroleum Institute (API) that the facility no longer met its certification standards, but became compliant again in December of 2017. We are now fully qualified and licensed for the API 6D, API 6DSS and API 6A PSL4.
Customers
Energy’s products and services are sold to end-user customers, such as major oil companies, EPC companies, and distributors, through sales channels that include direct sales, sales representatives, and agents.
3
Revenue and Backlog
Energy accounted for $347.6 million, $322.0 million, and $383.7 million, or 53%, 55%, and 58% of our net revenues for the years ended December 31, 2017, 2016 and 2015, respectively. Energy’s backlog as of January 31, 2018 was $190.1 million compared with $140.0 million as of January 31, 2017. We expect to ship all but $2.5 million of the January 31, 2018 backlog by December 31, 2018. Energy backlog represents backlog orders we believe to be firm.
Advanced Flow Solutions
Advanced Flow Solutions ("AFS") is a diversified flow control technology platform. Our primary product focus areas are valves, actuation, motors, switches, high pressure pneumatic systems, and steam and process loop flow management solutions.
AFS products are used in aerospace, defense, power and process, and general industrial markets. These products are primarily focused on the following end markets: Aerospace and Defense, Power and Process, HVAC, Maritime and Industrial Gas.
We plan to grow Advanced Flow Solutions by increasing market share in existing and new markets through exceptional sales and customer service enabled by innovative, reliable and high quality solutions. Product portfolio expansion through acquisitions of differentiated technologies in current and adjacent applications is also a key part of our growth strategy
We have Advanced Flow Solutions facilities in North America, United Kingdom, France, Germany, Morocco, and India. Our Advanced Flow Solutions headquarters is in Corona, California.
Markets and Applications
Advanced Flow Solutions serves the aerospace, power and process, and general industrial markets.
•The commercial aerospace market that we serve includes systems and components on airliners and business jets, such as hydraulic, pneumatic, fuel and ground support equipment including maintenance, repair and overhaul (MRO). In addition, we serve the defense market, including military and naval applications where controls or motion switches are mission critical. We support fixed wing aircraft, rotorcraft, missile systems, ground vehicles, submarines, weapon systems and weapon launch systems, ordinance, fire control, fuel systems, pneumatic controls, and hydraulic and dockside support equipment including MRO.
•The power and process market is comprised of electric utilities and industrial power producers. Utilities generate, transmit, and distribute electricity for sale in a local market, while industrial power plants generate electrical power for use within the industrial facility, such as a power plant within a steel mill or within a desalination plant. Utilities and industrial power plants can be categorized by fuel or by design such as Cogeneration, Combined Cycle, Coal Gasification, Super-Critical, Ultra-Critical, Nuclear, and Hydro-electric. Our products are predominantly deployed around the boiler, turbine and generator of a power plant in applications such as heat transfer, steam and water control, pump protection and safety shutdown.
•The general industrial market includes a broad range of manufacturing operations for flow and energy control. Our products are used to automate and control plant utilities, increase energy efficiency in buildings and campuses, and safely regulate critical fluids such as industrial gases and cryogenic fluids used in manufacturing processes.
Brands
AFS manufactures and markets control valves, automatic recirculation valves, regulators, fluid controls, actuation systems, landing gear components, pneumatic controls, electro-mechanical controls, and other flow control products and systems. Advanced Flow Solutions provides actuation and fluid control systems and services through the following brands: CIRCOR Aerospace, CPC Cryolab, Aerodyne Controls, CIRCOR Bodet, CIRCOR Industria, CIRCOR Motors, Hale Hamilton, Laurence, Leslie Controls, Nicholson Steam Trap, Rockwood Swendeman, RTK, Schroedahl, and Spence Engineering.
Products
Advanced Flow Solutions offers a range of solutions, including:
• | Automatic Re-circulation Valves for pump protection |
• | Severe Service and General Service Control Valves |
• | Electromechanical, pneumatic and hydraulic, fluid and motion control systems |
4
• | Actuation components and sub-systems |
In the manufacture of our products, we must comply with certain certification standards, such as AS9100C, ISO 9001:2008, National Aerospace & Defense Contractors Accreditation Program, Federal Aviation Administration Certification and European Aviation Safety Agency as well as other customer qualification standards. Currently all of our manufacturing facilities comply with the applicable standards.
Customers
Advanced Flow Solutions products and services are used by a range of customers, including those in the military and defense, commercial aerospace, business and general aviation, process industries, and power generation markets. Our customers include aircraft manufacturers (OEM's) and Tier 1 suppliers to these manufacturers, power companies and their contractors and other industrial customers.
Revenue and Backlog
Advanced Flow Solutions accounted for $277.6 million, $268.2 million and $272.6 million, or 42%, 45% and 42% of our net revenues for the years ended December 31, 2017, 2016 and 2015, respectively. AFS backlog as of January 31, 2018 was $142.0 million compared with $122.9 million as of January 31, 2017. We expect to ship all but $21.3 million of the January 31, 2018 backlog by December 31, 2018.
AFS backlog represents orders we believe to be firm, including future customer demand requirements on long-term aerospace product platforms where we are the sole source provider. We determine the amount of orders to include in our backlog for such aircraft platforms based on 12 months demand published by our customers.
Fluid Handling
Fluid Handling, which consists of the FH business that we acquired in December 2017, is a global portfolio of highly engineered and differentiated fluid handling products, systems and services. Our primary products are positive displacement pumps, specialty centrifugal pumps, and lubrication management systems and services.
Our technology is focused on moving the most difficult fluids with extremely high efficiency for critical applications in the industrial, defense, power, Oil & Gas, and commercial marine end markets.
We plan to grow Fluid Handling by expanding our share in existing markets with innovative solutions and new product offerings through our strong sales and service network, and leveraging our brand and commercial position.
Fluid Handling is headquartered in Monroe, North Carolina, with primary manufacturing centers in North America, Germany, India, and China.
Markets and Applications
Fluid Handling serves the industrial, defense, power, Oil & Gas, and commercial marine markets.
• | Fluid Handling serves a variety of segments in the industrial market, including but not limited to basic chemical processing, biofuels, pharmaceutical manufacturing, building and construction, metal manufacturing, mining, water and wastewater treatment, and food and beverage. The applications covered in these markets includes handling of viscous and critical fluids that support rotating equipment, transfer and delivery of chemicals and additives, control of fluids for heat transfer, sludge removal, and production process control. |
• | The defense market we serve is primarily focused on naval vessels, with our pumps and valves used across most naval platforms in a wide variety of onboard applications. We are a trusted supplier to many of the world’s navies, leveraging our engineering and manufacturing capabilities to work directly with our customers in developing targeted solutions for mission critical applications including very low acoustic signature pumps for submarines. |
• | The power generation market is comprised of electric utilities, industrial power producers, and OEM power generating equipment providers. Our products and services are used across this segment in lubrication management for turbines and generators, as well as fuel delivery, heat transfer, and emissions reduction applications. We serve power generation facilities fueled by natural gas, oil, hydro, solar, nuclear, and coal. |
5
• | The Oil & Gas market is divided into three sub-segments: upstream, midstream, and downstream. In upstream, our products and services are used to manage equipment and fluids critical to the drilling of new wells, and also maximize, control, and maintain oil production from both new and existing wells. In midstream, our products are used in the transfer of oils and refined products via pipelines, ship vessels, railcars, and trucks. Our products and services are also used to manage and maintain storage terminals. In downstream, our products are used to support critical refining processes, while our services are focused on maximizing uptime across the refining complex. |
• | The commercial marine market includes shipbuilders, OEM suppliers of onboard equipment, and shipping fleet operators. Our products and services are designed specifically to support all aspects of fluid systems, including propulsion, ballast handling, cooling water, bilge, fuel, and mechanical hydraulics. |
• | In all of the markets we serve, we provide aftermarket components and, in limited applications, aftermarket services. |
Brands
Fluid Handling manufactures and markets products and services through the following brands:
Allweiler, IMO Pump, IMO AB, Warren Pump, Zenith, Portland Valve, Rosscor, SES, Houttuin, Tushaco, CIRCOR Reliability Services, Clarus, COT-Puritech, LSC, Sicelub, and Lubritech,
Products
Fluid Handling offers a range of fluid handling products and services, including:
• | 3 Screw Pumps |
• | 2 Screw Pumps |
• | Progressing Cavity Pumps |
• | Specialty Centrifugal Pumps |
• | Gear Metering Pumps |
• | Multiphase Pump Systems |
• | Oil Mist Systems, oil purifiers and tank cleaning systems |
Our products must comply with certification standards applicable to many of our end markets. These standards include but are not limited to ISO 9001:2008, ANSI/ASQC Q 9001, API 676, and Mil-I-45208.
Customers
Fluid Handling's products and services are sold directly to end-users, OEMs that supply specialized systems in their respective end markets, major defense contractors, and EPC companies through a global network of direct and indirect sales channels.
Revenue and Backlog
Fluid Handling accounted for $36.5 million, or 6%, of our net revenues for the year ended December 31, 2017. Fluid Handling backlog as of January 31, 2018 was $210.4 million. We expect to ship all but $40.0 million of the January 31, 2018 backlog by December 31, 2018.
See Note 17, “Business Segment and Geographical Information,” of our consolidated financial statements for further discussion of our segments.
CIRCOR Consolidated
Competition
The domestic and international markets for our products are highly competitive. Some of our competitors have substantially greater financial, marketing, personnel and other resources than us. We consider product brand, quality, performance, on-time delivery, customer service, price, distribution capabilities and breadth of product offerings to be the primary competitive factors in these markets. We believe that new product development and product engineering also are important to our success and that our position in the industry is attributable, in significant part, to our ability to develop innovative products and to adapt existing products to specific customer applications.
6
The primary competitors of our Energy segment include: Balon Corporation, Crane Co., Emerson Electric Company, Flowserve Corporation, IMI plc, P.e.r.a.r S.p.A, PetrolValves S.p.A, Cameron division of Schlumberger Limited, SPX Flow, Inc., and Valvitalia S.p.A.
The primary competitors of our AFS segment include: Crane Co., Curtiss-Wright Corporation, Marrotta Controls, Moog, Inc., Parker Hannifin Corp., and Woodward Inc.
The primary competitors of our Fluid Handling segment include: Leistritz AG, Curtiss-Wright Corporation, Netzsch GmbH, ITT Corporation, Seepex GmbH, and Naniwa Ltd.
New Product Development
Our engineering differentiation comes from our ability to offer products, solutions and services that address high pressure, high temperature, and caustic flow. Our solutions offer high standards of reliability, safety and durability in applications requiring precision movement and zero leakage.
We continue to develop new and innovative products to enhance our market positions. Our product development capabilities include designing and manufacturing custom applications to meet high tolerance or close precision requirements. For example, our Energy segment operation can meet the tolerance requirements of sub-sea, cryogenic environments as well as critical service steam applications. Our Advanced Flow Solutions segment continues to expand its integrated systems design and testing capability to support bundled sub-systems for aeronautics applications. These testing and manufacturing capabilities enable us to develop customer-specified applications. In many cases, the unique characteristics of our customer-specified technologies have been subsequently used in broader product offerings. The Fluid Handling segment provides unique fluid handling products for viscous and critical fluids with specific design and engineering capabilities.
We maintain a Global Engineering Center of Excellence in India with a capable technology and engineering team that complements the engineering resources in a business unit. Our research, development and engineering expenditures for the years ended December 31, 2017, 2016 and 2015 were $5.5 million, $5.9 million, and $5.9 million, respectively.
Customers
For the years ended December 31, 2017, 2016, and 2015, we had no customers from which we derive revenues that exceed 10% of the Company’s consolidated revenues. Our businesses sell into both long-term capital projects as well as short-cycle demand. As a result, we tend to experience fluctuations in orders, revenues and operating results at various points across economic and business cycles. Our businesses, particularly those in the Energy segment, are cyclical in nature due to the fluctuation of the worldwide price, supply and demand for oil and gas. When the worldwide demand for oil and gas is depressed, the demand for our products used in those markets decreases as our customers with higher production costs will cut back investment and reduce purchases from us. The number of active rigs and wells drilled in North American short-cycle Oil & Gas market is a strong indicator of demand especially for our distributed valves products. In addition, the level of capital expenditures by national oil companies or the oil majors in exploration and production activities drive demand for our long cycle, engineered valves products. Maintenance expenditures during refinery turnarounds drive demand for our refinery valve products. Similarly, although not to the same extent as the Oil & Gas markets, the aerospace, military and maritime markets have historically experienced cyclical fluctuations in demand.
Selling and Distribution
Across our businesses we utilize a variety of channels to market our products and solutions. Those channels include direct sales, distributors, commissioned representatives, and our service centers. Our distribution and representative networks typically offer technically trained sales forces with strong relationships in key markets.
We believe that our well-established sales and distribution channels constitute a competitive strength. We believe that we have good relationships with our representatives and distributors. We continue to implement marketing programs to enhance these relationships. Our ongoing distribution-enhancement programs include reducing lead times, introducing new products, and offering competitive pricing, application design, technical training, and service.
Intellectual Property
We own patents that are scheduled to expire between 2018 and 2030 and trademarks that can be renewed as long as we continue to use them. We do not believe the vitality and competitiveness of any of our business segments as a whole depends
7
on any one or more patents or trademarks. We own certain licenses such as software licenses, but we do not believe that our business as a whole depends on any one or more licenses.
Raw Materials
The raw materials used most often in our production processes are castings, forgings and bar stock of various materials, including stainless steel, carbon steel, bronze, copper, brass, titanium and aluminum. These materials are subject to price fluctuations that may adversely affect our results of operations. We purchase these materials from numerous suppliers and at times experience constraints on the supply of certain raw material as well as the inability of certain suppliers to respond to our needs. Historically, increases in the prices of raw materials have been partially offset by higher sales prices, active materials management, project engineering programs and the diversity of materials used in our production processes.
Employees and Labor Relations
As of January 31, 2018, our worldwide operations directly employed approximately 4,400 people. We have 91 employees in North America who are covered by two collective bargaining agreements. We also have the following employees covered by governmental regulations or workers' councils:
• | Germany - 698 employees |
• | Italy - 178 employees |
• | France - 143 employees in France |
• | Morocco - 87 employees |
• | Netherlands - 70 employees |
• | United Kingdom - 27 employees |
• | Columbia - 2 employees |
• | Spain - 2 employees |
We believe that our employee relations are good at this time.
Available Information
We file reports on Form 10-Q with the Securities and Exchange Commission on a quarterly basis, additional reports on Form 8-K from time to time, and a Definitive Proxy Statement and an annual report on Form 10-K on an annual basis. These and other reports filed by us, or furnished by us, to the SEC in accordance with section 13(a) or 15(d) of the Securities Exchange Act of 1934, as amended, are available free of charge from the SEC on its website at http://www.sec.gov. Additionally, our Form 10-Q, Form 8-K, Definitive Proxy Statement and Form 10-K reports are available without charge, as soon as reasonably practicable after they have been filed with the SEC, from our Investor Relations website at http://investors.CIRCOR.com. The information on our website is not part of, or incorporated by reference in, this Annual Report.
Item 1A. Risk Factors
Set forth below are certain risk factors that we believe are material to our stockholders. If any of the following risks occur, our business, financial condition, cash flows, results of operations and reputation could be harmed. You should also consider these risk factors when you read “forward-looking statements” elsewhere in this report. You can identify forward-looking statements by terms such as “may,” “hope,” “should,” “expect,” “plan,” “anticipate,” “intend,” “believe,” “estimate,” “predict,” “potential” or “continue,” the negative of those terms or other comparable terminology. Forward-looking statements are only predictions and can be adversely affected if any of the following risks occur:
Some of our end-markets are cyclical, which may cause us to experience fluctuations in revenues or operating results.
We have experienced, and expect to continue to experience, fluctuations in revenues and operating results due to economic and business cycles. We sell our products principally to aerospace, military, commercial aircraft, Oil & Gas exploration, transmission and refining, power generation, chemical processing and maritime markets. Although we serve a variety of markets to avoid a dependency on any one, a significant downturn in any one of these markets could cause a material reduction in our revenues that could be difficult to offset. In addition, decreased market demand typically results in excess manufacturing capacity among our competitors which, in turn, results in pricing pressure. As a consequence, a significant downturn in our markets can result in lower revenues and profit margins.
8
In particular, our Energy businesses are cyclical in nature as the worldwide demand for oil and gas fluctuates. Energy sector activity can fluctuate significantly in a short period of time, particularly in the United States, North Sea, the Middle East, Brazil and Australia, amongst other regions. When worldwide demand for oil and gas is depressed, the demand for our products used in maintenance and repair of existing oil and gas applications, as well as exploration or new oil and gas project applications, is reduced. A decline in oil price will have a similar impact on the demand for our products, particularly in markets, such as North America, where the cost of oil production is relatively higher. Demand for our products and services depends on a number of factors, including the number of oil & gas wells being drilled, the maintenance and condition of industry assets, the volume of exploration and production activities and the capital expenditures of asset owners and maintenance companies. The willingness of asset owners and operators to make capital expenditures to produce and explore for sources of energy will continue to be influenced by numerous factors over which we have no control, including:
• | the current and anticipated future prices for energy sources, including oil and natural gas, solar, wind and nuclear; |
• | level of excess production capacity; |
• | cost of exploring for and producing energy sources; |
• | worldwide economic activity and associated demand for energy sources; |
• | availability and access to potential hydrocarbon resources; |
• | national government political priorities; |
• | development of alternate energy sources; and |
• | environmental regulations. |
As a result, we historically have generated lower revenues and profits in periods of declining demand or prices for crude oil and natural gas. In the latter half of fiscal year 2014 continuing into 2017, our operating results were adversely affected due to dramatic decreases in the price of oil and our customers reduced their spending on our products as level of activity fell. Therefore, results of operations for any particular period are not necessarily indicative of the results of operations for any future period. Any future downward pricing pressure on crude oil could have a material adverse effect on our business, financial condition, cash flows, or results of operations.
We face significant competition and, if we are not able to respond, our revenues may decrease.
We face significant competition from a variety of competitors in each of our markets. Some of our competitors have substantially greater financial, marketing, personnel and other resources than we do. New competitors also could enter our markets. We consider product quality, performance, customer service, on-time delivery, price, distribution capabilities and breadth of product offerings to be the primary competitive factors in our markets. Our competitors may be able to offer more attractive pricing, duplicate our strategies, or develop enhancements to products that could offer performance features that are superior to our products. Competitive pressures, including those described above, and other factors could adversely affect our competitive position, resulting in a loss of market share or decreases in prices, either of which could have a material adverse effect on our business, financial condition, cash flows or results of operations. In addition, some of our competitors are based in foreign countries and have cost structures and prices based on foreign currencies.
The majority of our transactions are denominated in either U.S. dollar or Euro currency. Accordingly, currency fluctuations could cause our U.S. dollar and/or Euro priced products to be less competitive than our competitors’ products that are priced in other currencies.
If we cannot continue operating our manufacturing facilities at current or higher levels, our results of operations could be adversely affected.
We operate a number of manufacturing facilities for the production of our products. The equipment and management systems necessary for such operations may break down, perform poorly or fail, resulting in fluctuations in manufacturing efficiencies. Such fluctuations may affect our ability to deliver products to our customers on a timely basis, which could have a material adverse effect on our business, financial condition, cash flows or results of operations. We have continuously enhanced and improved Lean manufacturing techniques as part of the CIRCOR Operating System. We believe that this process produces meaningful reductions in manufacturing costs. However, continuous improvement of these techniques may cause short-term inefficiencies in production. If we ultimately are unable to continuously improve our processes, our results of operations may suffer.
Our acquisition of the fluid handling business of Colfax Corporation (FH) and the integration of its business, operations and employees with our own may be more difficult, costly or time consuming than expected, and the anticipated benefits and cost savings of the acquisition may not be fully realized, which could adversely impact our business, financial condition, cash flows and results of operations.
9
We completed the acquisition of FH on December 11, 2017. The success of the acquisition, including the achievement of anticipated benefits and cost savings of the acquisition, is subject to a number of uncertainties and will depend, in part, on our ability to successfully combine and integrate FH's business into our business in an efficient and effective manner. Potential difficulties that we may encounter in the integration process include the following:
• | the inability to successfully integrate FH's business into our own in a manner that permits us to achieve the cost savings and operating synergies anticipated to result from the acquisition, which could result in the anticipated benefits of the acquisition not being realized partly or wholly in the time frame currently anticipated or at all; |
• | loss of key management and technical personnel; |
• | integrating personnel, IT systems and corporate, finance and administrative infrastructures of FH into our company while maintaining focus on providing consistent, high quality products and services; |
• | coordinating and integrating our internal operations, compensation programs, policies and procedures, and corporate structures; |
• | potential unknown liabilities and unforeseen or increased costs and expenses; |
• | the possibility of faulty assumptions underlying expectations regarding potential synergies and the integration process; |
• | incurring significant acquisition-related costs and expenses; |
• | performance shortfalls as a result of the diversion of management’s attention caused by integrating operations; and |
• | servicing the substantial debt that we have incurred in connection with the acquisition. |
Any of these factors could result in us failing to realize the anticipated benefits of the acquisition, on the expected timeline or at all, and could adversely impact our business, financial condition, cash flows and results of operations.
Implementation of our acquisition strategy may not be successful, which could affect our ability to increase our revenues or could reduce our profitability.
One of our strategies is to increase our revenues and expand our markets through acquisitions that will provide us with complementary products and access to additional geographic markets. We expect to spend significant time and effort expanding our existing businesses and identifying, completing and integrating acquisitions. We expect to face competition for acquisition candidates that may limit the number of acquisition opportunities available to us and may result in higher acquisition prices. We cannot be certain that we will be able to identify, acquire or profitably manage additional companies or successfully integrate such additional companies without substantial costs, delays or other problems. Also, there can be no assurance that companies we acquire ultimately will achieve the revenues, profitability or cash flows, or generate the synergies upon which we justify our investment in them; as a result, any such under-performing acquisitions could result in impairment charges which would adversely affect our results of operations. In addition, acquisitions may involve a number of special risks, including: adverse effects on our reported operating results; use of cash; diversion of management’s attention; loss of key personnel at acquired companies; or unanticipated management or operational problems or legal liabilities.
Implementation of our divestiture, restructuring, or simplification strategies may not be successful, which could affect our ability to increase our revenues or could reduce our profitability.
We also continually review our current business and products to attempt to maximize our performance. We may in the future deem it appropriate to pursue the divestiture of product lines or businesses as conditions dictate. Any divestiture may result in a dilutive impact to our future earnings if we are unable to offset the dilutive impacts from the loss of revenue associated with the divested assets or businesses, as well as significant write-offs, including those related to goodwill and other intangible assets, which could have a material adverse effect on our results of operations and financial condition. A successful divestiture depends on various factors, including our ability to effectively transfer liabilities, contracts, facilities and employees to any purchaser, identify and separate the intellectual property to be divested from the intellectual property that we wish to retain, reduce fixed costs previously associated with the divested assets or business, and collect the proceeds from any divestitures. In addition, if customers of the divested business do not receive the same level of service from the new owners, this may adversely affect our other businesses to the extent that these customers also purchase other products offered by us. All of these efforts require varying levels of management resources, which may divert our attention from other business operations.
A focus of our Company is to simplify the way we are organized and the number of facilities we manage. We believe that such focus will reduce overhead structure, enhance operational synergies, and result in improved operating margins and customer service. Nevertheless, we may not achieve expected cost savings from restructuring and simplification activities and actual charges, costs and adjustments due to such activities may vary materially from our estimates. Our ability to realize anticipated cost savings, synergies, margin improvement, and revenue enhancements may be affected by a number of factors, including the following: our ability to effectively eliminate duplicative overhead, rationalize manufacturing capacity, synchronize
10
information technology systems, consolidate warehousing and distribution facilities and shift production to more economical facilities; significant cash and non-cash integration and implementation costs or charges in order to achieve those cost savings, which could offset any such savings; and our ability to avoid labor disruption in connection with integration efforts or divestitures.
If we do not realize the expected benefits or synergies of any acquisition, divestiture, restructuring, or simplification activities, our business, financial condition, cash flows and results of operations could be negatively impacted.
If we are unable to continue operating successfully overseas or to successfully expand into new international markets, our revenues may decrease.
We derive a significant portion of our revenue from sales outside the United States. In addition, one of our key growth strategies is to sell our products in international markets not significantly served by us in portions of Europe, Latin America and Asia. We market our products and services through direct sales, distributors, and technically trained commissioned representatives. We may not succeed in our efforts to further penetrate these markets. Moreover, conducting business outside the United States is subject to additional risks, including currency exchange rate fluctuations; changes in regional, political or economic conditions, trade protection measures such as tariffs or import or export restrictions; and complex, varying and changing government regulations and legal standards and requirements, particularly with respect to price protection, competition practices, export control regulations and restrictions, customs and tax requirements, immigration, anti-boycott regulations, data privacy, intellectual property, anti-corruption and environmental compliance, including U.S. customs and export regulations and restrictions and the Foreign Corrupt Practices Act, and the occurrence of any of these factors could materially and adversely affect our operations.
If we cannot pass on higher raw material or manufacturing costs to our customers, we may become less profitable.
One of the ways we attempt to manage the risk of higher raw material and manufacturing costs is to increase selling prices to our customers. The markets we serve are extremely competitive and customers may not accept price increases or may look to alternative suppliers, which may negatively impact our profitability and revenues.
If our suppliers cannot provide us with adequate quantities of materials to meet our customers’ demands on a timely basis or if the quality of the materials provided does not meet our standards, we may lose customers or experience lower profitability.
Some of our customer contracts require us to compensate those customers if we do not meet specified delivery obligations. We rely on numerous suppliers to provide us with our required materials and in many instances these materials must meet certain specifications. In addition, we continue to increase our dependence on lower cost foreign sources of raw materials, components, and, in some cases, completed products. Managing a geographically diverse supply base inherently poses significant logistical challenges. While we believe that we also have improved our ability to effectively manage a global supply base, a risk nevertheless exists that we could experience diminished supplier performance resulting in longer than expected lead times and/or product quality issues. The occurrence of such factors could have a negative impact on our ability to deliver products to customers within our committed time frames and could adversely impact our results of operations, financial conditions and cash flows.
Our international activities expose us to fluctuations in currency exchange rates that could adversely affect our results of operations and cash flows.
Our international manufacturing and sales activities expose us to changes in foreign currency exchange rates. Such fluctuations could result in our (i) paying higher prices for certain imported goods and services, (ii) realizing lower prices for any sales denominated in currencies other than U.S. dollars, (iii) realizing lower net income, on a U.S. dollar basis, from our international operations due to the effects of translation from weakened functional currencies, and (iv) realizing higher costs to settle transactions denominated in other currencies. Any of these risks could adversely affect our results of operations and cash flows. Our major foreign currency exposures involve the markets in Western Europe and Canada.
We may use forward contracts to help manage the currency risk related to certain business transactions denominated in foreign currencies. We primarily utilize forward exchange contracts with maturities of less than eighteen months. To the extent these transactions are completed, the contracts minimize our risk from exchange rate fluctuations because they offset gains and losses on the related foreign currency denominated transactions. However, there can be no assurances that we will be able to effectively utilize these forward exchange contracts in the future to offset significant risk related to fluctuations in currency
11
exchange rates. In addition, there can be no assurances that the counter party to the contract will perform their contractual obligations to us to realize the anticipated benefits of the contracts.
If we experience delays in introducing new products or if our existing or new products do not achieve or maintain market acceptance, our revenues may decrease.
Our industries are characterized by: intense competition; changes in end-user requirements; technically complex products; and evolving product offerings and introductions.
We believe our future success depends, in part, on our ability to anticipate or adapt to these factors and to offer, on a timely basis, products that meet customer demands. Failure to develop new and innovative products or to custom design existing products could result in the loss of existing customers to competitors or the inability to attract new business, either of which may adversely affect our revenues. The development of new or enhanced products is a complex and uncertain process requiring the anticipation of technological and market trends. We may experience design, manufacturing, marketing or other difficulties, such as an inability to attract a sufficient number of qualified engineers, which could delay or prevent our development, introduction or marketing of new products or enhancements and result in unexpected expenses.
If we fail to manufacture and deliver high quality products in accordance with industry standards, we may lose customers.
Product quality and performance are a priority for our customers since many of our product applications involve caustic or volatile chemicals and, in many cases, involve processes that require precise control of fluids. Our products are used in the aerospace, military, commercial aircraft, analytical equipment, Oil & Gas exploration, transmission and refining, power generation, chemical processing and maritime industries. These industries require products that meet stringent performance and safety standards, such as the standards of the American Petroleum Institute, International Organization for Standardization, Underwriters’ Laboratory, American National Standards Institute, American Society of Mechanical Engineers and the European Pressure Equipment Directive. If we fail to maintain and enforce quality control and testing procedures, our products will not meet these stringent performance and safety standards which are required by many of our customers. Non-compliance with the standards could result in a loss of current customers and damage our ability to attract new customers, which could have a material adverse effect on our business, financial condition, cash flows or results of operations.
We depend on our key personnel and the loss of their services may adversely affect our business.
We believe that our success depends on our ability to hire new talent and the continued employment of our senior management team and other key personnel. If one or more members of our senior management team or other key personnel were unable or unwilling to continue in their present positions, our business could be seriously harmed. In addition, if any of our key personnel joins a competitor or forms a competing company, some of our customers might choose to use the services of that competitor or those of a new company instead of our own. Other companies seeking to develop capabilities and products similar to ours may hire away some of our key personnel. If we are unable to maintain our key personnel and attract new employees, the execution of our business strategy may be hindered and our growth limited.
We face risks from product liability lawsuits that may adversely affect our business.
We, like other manufacturers, face an inherent risk of exposure to product liability claims in the event that the use of our products results in personal injury, property damage or business interruption to our customers. We may be subjected to various product liability claims, including, among others, that our products include inadequate or improper instructions for use or installation, or inadequate warnings concerning the effects of the failure of our products. Although we maintain strict quality controls and procedures, including the testing of raw materials and safety testing of selected finished products, we cannot be certain that our products will be completely free from defect. In addition, in certain cases, we rely on third-party manufacturers for our products or components of our products. Although we have liability insurance coverage, we cannot be certain that this insurance coverage will continue to be available to us at a reasonable cost or, if available, will be adequate to cover any such liabilities. For example, liability insurance typically does not afford coverage for a design or manufacturing defect unless such defect results in injury to person or property. We generally attempt to contractually limit liability to our customers to risks that are insurable but are not always successful in doing so. Similarly, we generally seek to obtain contractual indemnification from our third-party suppliers, and for us to be added as an additional insured party under such parties’ insurance policies. Any such indemnification or insurance is limited by its terms and, as a practical matter, is limited to the credit worthiness of the indemnifying or insuring party. In the event that we do not have adequate insurance or contractual indemnification, product liabilities could have a material adverse effect on our business, financial condition, cash flows or results of operations.
12
We rely on information technology in our operations, and any material failure, inadequacy, interruption or security failure of that technology could harm our business, financial condition, cash flows and results of operations.
We rely on information technology networks and systems, including the Internet, to process, transmit and store electronic information, and manage or support a variety of business processes, including operational and financial transactions and records, personal identifying information, payroll data and workforce scheduling information. We purchase some of our information technology from vendors, on whom our systems depend. We rely on commercially available systems, software, tools and monitoring to provide security for the processing, transmission and storage of company and customer information. Although we have taken steps to protect the security of our information systems and the data maintained in those systems, it is possible that our safety and security measures will not prevent the systems' improper functioning or the improper access or disclosure of confidential or personally identifiable information such as in the event of cyber-attacks. Security breaches, including physical or electronic break-ins, computer viruses, ransomware, attacks by hackers and similar breaches can create system disruptions or shutdowns or the unauthorized disclosure of confidential information. If company, personal or otherwise protected information is improperly accessed, tampered with or distributed, we may incur significant costs to remediate possible injury to the affected parties and we may be subject to sanctions and civil or criminal penalties if we are found to be in violation of the privacy or security rules under federal, state, or international laws protecting confidential information. Any failure to maintain proper functionality and security of our information systems could interrupt our operations, damage our reputation, subject us to liability claims or regulatory penalties and could have a material adverse effect on our business, financial condition, cash flows and results of operations.
The trading price of our common stock continues to be volatile and investors in our common stock may experience substantial losses.
The trading price of our common stock may be, and, in the past, has been volatile. Our common stock could decline or fluctuate in response to a variety of factors, including, but not limited to: our failure to meet our performance estimates or performance estimates of securities analysts; changes in financial estimates of our revenues and operating results or buy/sell recommendations by securities analysts; the timing of announcements by us or our competitors concerning significant product line developments, contracts or acquisitions or publicity regarding actual or potential results or performance; fluctuation in our quarterly operating results caused by fluctuations in revenue and expenses; substantial sales of our common stock by our existing shareholders; general stock market conditions; and fluctuations in oil and gas prices or other economic or external factors. While we attempt in our public disclosures to provide forward-looking information in order to enable investors to anticipate our future performance, such information by its nature represents our good-faith forecasting efforts. In recent years, the unprecedented nature of oil prices, credit and financial crises and economic recessions, together with the uncertain depth and duration of these crises, has rendered such forecasting more difficult. As a result, our actual results have differed materially, and going forward could differ materially, from our forecasts, which could cause further volatility in the value of our common stock.
In recent years the stock market as a whole experienced dramatic price and volume fluctuations. In the past, securities class action litigation has often been instituted against companies following periods of volatility in the market price of their securities. This type of litigation could result in substantial costs and a diversion of management attention and resources.
The costs of complying with existing or future governmental regulations on importing and exporting practices and of curing any violations of these regulations, could increase our expenses, reduce our revenues or reduce our profitability.
We are subject to a variety of laws and international trade practices including regulations issued by the United States Bureau of Industry and Security, the Department of Homeland Security, the Department of State and the Department of Treasury. We cannot predict the nature, scope or effect of future regulatory requirements to which our international trading practices might be subject or the manner in which existing laws might be administered or interpreted. Future regulations could limit the countries into which certain of our products may be sold or could restrict our access to, and increase the cost of obtaining products from, foreign sources. In addition, actual or alleged violations of such regulations could result in enforcement actions and/or financial penalties that could result in substantial costs.
If we are unable to generate sufficient cash flow, we may not be able to service our debt obligations, including making payments on our outstanding term loan.
Our ability to make payments of principal and interest on our indebtedness when due, including the significant indebtedness that we have incurred in connection with the acquisition of FH, depends upon our future performance, which will be subject to
13
general economic conditions, industry cycles and financial, business and other factors affecting our consolidated operations, many of which are beyond our control. If we are unable to generate sufficient cash flow from operations in the future to service our outstanding debt, we may be required to, among other things:
• | seek additional financing in the debt or equity markets; |
• | refinance or restructure all or a portion of our indebtedness; |
• | divert funds that would otherwise be invested in our operations; |
• | sell selected assets; or |
• | reduce or delay planned capital expenditures or operating expenditures. |
Such measures might not be sufficient to enable us to service our debt, which could negatively impact our financial results. In addition, we may not be able to obtain any such financing, refinancing or complete a sale of assets on economically favorable terms. In the case of financing or refinancing, favorable interest rates will be dependent on the health of the debt capital markets.
Our significant existing indebtedness could also have the effect, among other things, of reducing our flexibility to respond to changing business and economic conditions, reducing funds available for working capital, capital expenditures, acquisitions and other general corporate purposes or creating competitive disadvantages relative to other companies with lower debt levels.
Our credit agreement requires that we maintain certain ratios and limits our ability to issue equity, make acquisitions, incur debt, pay dividends, make investments, sell assets, merge or raise capital.
Our credit agreement, dated December 11, 2017, governs our indebtedness. This agreement includes provisions which place limitations on certain activities including our ability to: issue shares of our common stock; incur additional indebtedness; create any liens or encumbrances on our assets or make any guarantees; make certain investments; pay cash dividends above certain limits; or dispose of or sell assets or enter into a merger or a similar transaction. These restrictions may limit our ability to operate our business and may prohibit or limit our ability to execute our business strategy, compete, enhance our operations, take advantage of potential business opportunities as they arise or meet our capital needs. Furthermore, future debt instruments or other contracts could contain more restrictive financial or other covenants. The breach of any of these covenants by us or the failure by us to meet any of these conditions or requirements could result in a default under any or all of our indebtedness. If we are unable to service our indebtedness, our business, financial condition, cash flows and results of operations would be materially adversely affected.
Various restrictions and agreements could hinder a takeover of us which is not supported by our board of directors or which is leveraged.
Our amended and restated certificate of incorporation and amended and restated by-laws, as well as the Delaware General Corporation Law, contain provisions that could delay or prevent a change in control in a transaction that is not approved by our board of directors or that is on a leveraged basis or otherwise. These include provisions creating a staggered board, limiting the shareholders’ powers to remove directors, and prohibiting shareholders from calling a special meeting or taking action by written consent in lieu of a shareholders’ meeting. In addition, our board of directors has the authority, without further action by the shareholders, to set the terms of and to issue preferred stock. Issuing preferred stock could adversely affect the voting power of the owners of our common stock, including the loss of voting control to others.
Delaying or preventing a takeover could result in our shareholders ultimately receiving less for their shares by deterring potential bidders for our stock or assets.
A change in international governmental policies or restrictions could result in decreased availability and increased costs for certain components and finished products that we purchase from sources in foreign countries, which could adversely affect our profitability.
Like most manufacturers of flow control products, we attempt, where appropriate, to reduce costs by seeking lower cost sources of certain components and finished products. Many such sources are located in developing countries such as India and China, where a change in governmental approach toward U.S. trade could restrict the availability to us of such sources. In addition, periods of war or other international tension could interfere with international freight operations and hinder our ability to purchase such components and products. A decrease in the availability of these items could hinder our ability to timely meet our customers’ orders. We attempt, when possible, to mitigate this risk by maintaining alternate sources for these components and products and by maintaining the capability to produce such items in our own manufacturing facilities. However, even when we are able to mitigate this risk, the cost of obtaining such items from alternate sources or producing them ourselves is often considerably greater, and a shift toward such higher cost production could therefore adversely affect our profitability.
14
We, along with our customers and vendors, face the uncertainty in the public and private credit markets and in general economic conditions in the United States and around the world.
In recent years there has been at times disruption and general slowdown of the public and private capital and credit markets in the United States and around the world. Such conditions can adversely affect our revenue, results of operations and overall financial growth. Our business can be affected by a number of factors that are beyond our control such as general geopolitical, economic and business conditions and conditions in the financial services market, which each could materially impact our business, financial condition, cash flows and results of operations. Additionally, many lenders and institutional investors, at times, have reduced funding to borrowers, including other financial institutions. A constriction on future lending by banks or investors could result in higher interest rates on future debt obligations or could restrict our ability to obtain sufficient financing to meet our long-term operational and capital needs or could limit our ability in the future to consummate strategic acquisitions. Any uncertainty in the credit markets could also negatively impact the ability of our customers and vendors to finance their operations which, in turn, could result in a decline in our sales and in our ability to obtain necessary raw materials and components, thus potentially having an adverse effect on our business, financial condition, cash flows or results of operations.
Terrorist activity and/or political instability around the world could cause economic conditions to deteriorate and adversely impact our businesses.
In the past, terrorist attacks have negatively impacted general economic, market and political conditions. In particular, the 2001 terrorist attacks, compounded with changes in the national economy, resulted in reduced revenues in the aerospace and general industrial markets in 2002 and 2003. Although economic conditions have improved considerably, additional terrorist acts, acts of war or political instability (wherever located around the world) could cause damage or disruption to our business, our facilities or our employees which could significantly impact our business, financial condition or results of operations. The potential for future terrorist attacks, the national and international responses to terrorist attacks, political instability, and other acts of war or hostility, including the recent and current conflicts in Iraq, Afghanistan and the Middle East, have created many economic and political uncertainties, which could adversely affect our business and results of operations in ways that cannot presently be predicted. In addition, with manufacturing facilities located worldwide, including facilities located in North America, Western Europe, Morocco, and India, we may be impacted by terrorist actions not only against the United States but in other parts of the world as well. In some cases, we are not insured for losses and interruptions caused by terrorist acts and acts of war.
The costs of complying with existing or future environmental regulations and curing any violations of these regulations could increase our expenses or reduce our profitability.
We are subject to a variety of environmental laws relating to the storage, discharge, handling, emission, generation, use and disposal of chemicals, solid and hazardous waste and other toxic and hazardous materials used to manufacture, or resulting from the process of manufacturing, our products. We cannot predict the nature, scope or effect of future regulatory requirements to which our operations might be subject or the manner in which existing or future laws will be administered or interpreted. Future regulations could be applied to materials, products or activities that have not been subject to regulation previously. The costs of complying with new or more stringent regulations, or with more vigorous enforcement of these or existing regulations could be significant.
Environmental laws require us to maintain and comply with a number of permits, authorizations and approvals and to maintain and update training programs and safety data regarding materials used in our processes. Violations of these requirements could result in financial penalties and other enforcement actions. We also could be required to halt one or more portions of our operations until a violation is cured. Although we attempt to operate in compliance with these environmental laws, we may not succeed in this effort at all times. The costs of curing violations or resolving enforcement actions that might be initiated by government authorities could be substantial.
Regulations related to “conflict minerals” may cause us to incur additional expenses and could limit the supply and increase the cost of certain metals used in manufacturing our products.
Under the conflict minerals rule, public companies must disclose whether specified minerals, known as conflict minerals, that are necessary to the functionality or production of products manufactured or contracted to be manufactured. The rule, which became effective for 2013, requires a disclosure report to be filed by May 31st of each year, requires companies to perform due diligence, disclose and report whether or not such minerals originate from the Democratic Republic of Congo or an adjoining country. The conflicts mineral rule could affect sourcing at competitive prices and availability in sufficient quantities of certain minerals used in the manufacture of our products, including tantalum, tin, gold and tungsten. The number of suppliers who provide conflict-free minerals may be limited. In addition, there may be material costs associated with complying with the
15
disclosure requirements, such as costs related to determining the source of certain minerals used in our products, as well as costs of possible changes to products, processes, or sources of supply as a consequence of such verification activities. As our supply chain is complex, we may not be able to sufficiently verify the origins of the relevant minerals used in our products through the due diligence procedures that we implement, which may harm our reputation. In addition, we may encounter challenges to satisfy those customers who require that all of the components of our products be certified as conflict-free, which could place us at a competitive disadvantage if we are unable to do so.
We may be adversely affected by comprehensive tax reform
On December 22, 2017, the Tax Cuts and Jobs Act ("Tax Act") was signed into law. The Tax Act contains significant changes to corporate taxation, including reduction of the corporate tax rate from 35% to 21%, additional limitations on the tax deductibility of interest, substantial changes to the taxation of foreign earnings, immediate deductions for certain new investments instead of deductions for depreciation expense over time, and modification or repeal of many business deductions and credits. Notwithstanding the reduction in the corporate income tax rate, the overall impact of the Tax Act is uncertain, and our results of operations, cash flows or financial condition, as well as the trading price of our Common Stock, could be adversely affected.
Item 1B. Unresolved Staff Comments
None.
Item 2. Properties
We maintain 28 major manufacturing facilities worldwide, including operations located in North America, Western Europe, Morocco and India. We also maintain sales offices or warehouses from which we ship finished goods to customers, distributors and commissioned representative organizations. Our executive office is located in Burlington, Massachusetts and is leased.
Our Energy segment has major manufacturing facilities located in North America, Italy, United Kingdom, and the Netherlands. Properties in Nerviano, Italy and Spartanburg, South Carolina are leased. Our Advanced Flow Solutions segment has major manufacturing facilities located in North America, United Kingdom, Germany, France, India and Morocco. Properties in Hauppauge, New York and Corona, California are leased. Our Fluid Handling segment has major facilities located in North America and Netherlands. Properties in Germany and India are leased.
Segment | Leased | Owned | Total | |||||
Energy | 6 | 4 | 10 | |||||
Advanced Flow Solutions | 2 | 8 | 10 | |||||
Fluid Handling | 4 | 4 | 8 | |||||
Total | 12 | 16 | 28 | |||||
In general, we believe that our properties, including machinery, tools and equipment, are in good condition, are well maintained, and are adequate and suitable for their intended uses. Our manufacturing facilities generally operate five days per week on one or two shifts. We believe our manufacturing capacity could be increased by working additional shifts and weekends and by successful implementation of our CIRCOR Operating System. We also have low-cost sources for manufacturing in Mexico, India, and Morocco which have capacity to fulfill our manufacturing needs. We believe that our current facilities will meet our near-term production requirements without the need for additional facilities.
Item 3. Legal Proceedings
For information regarding our legal proceedings refer to the first two paragraphs of Note 14, “Contingencies, Commitment and Guarantees”, to the consolidated financial statements included in this Annual Report, which disclosure is incorporated herein by reference.
16
Item 4. Mine Safety Disclosures
Not applicable.
Part II
Item 5. Market for Registrant’s Common Equity, Related Stockholder Matters and Issuer Purchases of Equity Securities
Our common stock is traded on the New York Stock Exchange (“NYSE”) under the symbol “CIR.” Quarterly share prices and dividends declared and paid are incorporated herein by reference to Note 18, “Quarterly Financial Information”, of the consolidated financial statements included in this Annual Report.
Our Board of Directors is responsible for determining our dividend policy. The timing and level of any dividends will necessarily depend on our Board of Directors’ assessments of earnings, financial condition, capital requirements and other factors, including restrictions, if any, imposed by our lenders. On February 28, 2018, we announced the suspension of our nominal dividend, as part of our capital deployment strategy.
As of February 21, 2018, there were 19,793,160 shares of our common stock outstanding and we had 60 holders of record of our common stock. We believe the number of beneficial owners of our common stock was substantially greater on that date.
The graph below compares the cumulative 5-Year total return provided shareholders on CIRCOR International, Inc.'s common stock relative to the cumulative total returns of the S&P 500 index, the Russell 2000 index, our historical peer group (“2016 Peer Group”) and our updated peer group (“2017 Peer Group”). The companies included in the 2016 Peer Group and the 2017 Peer Group are listed in footnotes 1 and 2 below. We revised our peer group to incorporate peers relevant to our Fluid Handling business. An investment of $100 (with reinvestment of all dividends) is assumed to have been made in our common stock, in each index and in each of the peer groups on 12/31/2012 and its relative performance is tracked through 12/31/2017.
17
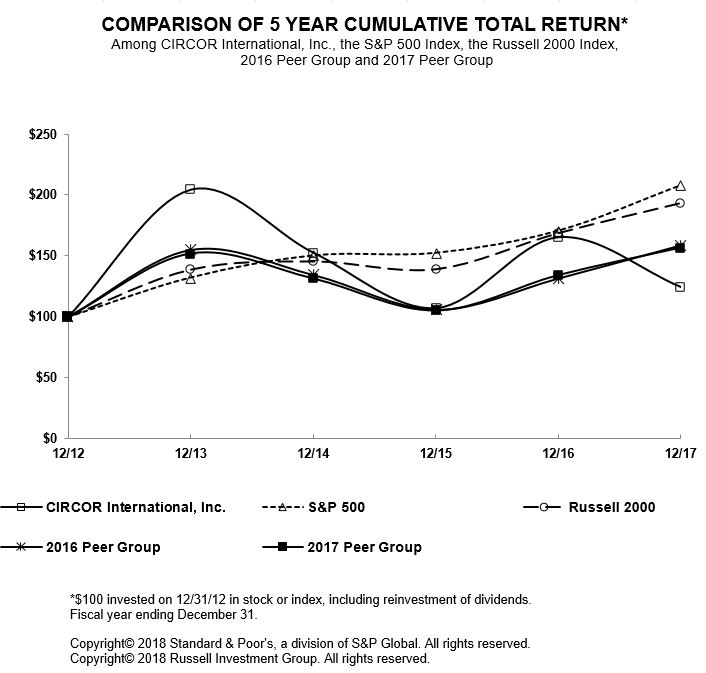
12/12 | 12/13 | 12/14 | 12/15 | 12/16 | 12/17 | ||||||||||||
CIRCOR International, Inc. | 100.00 | 204.60 | 152.98 | 107.30 | 165.64 | 124.63 | |||||||||||
S&P 500 | 100.00 | 132.39 | 150.51 | 152.59 | 170.84 | 208.14 | |||||||||||
Russell 2000 | 100.00 | 138.82 | 145.62 | 139.19 | 168.85 | 193.58 | |||||||||||
2016 Peer Group | 100.00 | 155.19 | 134.60 | 105.94 | 131.65 | 159.02 | |||||||||||
2017 Peer Group | 100.00 | 152.15 | 131.64 | 105.38 | 134.48 | 157.00 | |||||||||||
1. | There are seven companies included in the company's first customized peer group which are: Crane Co, Curtiss-Wright Corp, Flowserve Corp, IMI PLC, Pentair PLC, SPX FLOW Inc. and Woodward Inc. |
2. | The eight companies included in the company's second customized peer group are: Crane Co, Curtiss-Wright Corp, Flowserve Corp, Forum Energy Technologies Inc., IMI PLC, ITT Inc., SPX FLOW Inc. and Woodward Inc. |
Item 6. Selected Financial Data
The following table presents certain selected financial data that has been derived from our audited consolidated financial statements and related notes and should be read along with the section entitled “Management’s Discussion and Analysis of Financial Condition and Results of Operations” and our audited consolidated financial statements and notes included in this Annual Report.
The consolidated statements of income and consolidated statements of cash flows data for the years ended December 31, 2017, 2016 and 2015, and the consolidated balance sheet data as of December 31, 2017 and 2016 are derived from, and should be read in conjunction with, our audited consolidated financial statements and the related notes included in this Annual Report.
18
The consolidated statements of income and consolidated statements of cash flows data for the years ended December 31, 2014 and 2013, and the consolidated balance sheet data as of December 31, 2015, 2014 and 2013, are derived from our consolidated financial statements not included in this Annual Report.
Selected Financial Data
(in thousands, except per share data)
Years Ended December 31, | |||||||||||||||||||
2017 | 2016 | 2015 | 2014 | 2013 | |||||||||||||||
Statement of Income Data (1): | |||||||||||||||||||
Net revenues | $ | 661,710 | $ | 590,259 | $ | 656,267 | $ | 841,446 | $ | 857,808 | |||||||||
Gross profit | 200,820 | 183,115 | 199,332 | 257,020 | 267,601 | ||||||||||||||
Operating income | 20,568 | 10,918 | 26,174 | 64,757 | 69,173 | ||||||||||||||
Income before income taxes | 6,113 | 9,680 | 22,428 | 63,261 | 64,037 | ||||||||||||||
Net income | $ | 11,789 | $ | 10,101 | $ | 9,863 | $ | 50,386 | $ | 47,121 | |||||||||
Balance Sheet Data: | |||||||||||||||||||
Total assets | $ | 1,906,799 | $ | 820,756 | $ | 669,915 | $ | 724,722 | $ | 726,650 | |||||||||
Total debt | 795,208 | 251,200 | 90,500 | 13,684 | 49,638 | ||||||||||||||
Shareholders’ equity | 601,974 | 404,410 | 400,777 | 494,093 | 476,887 | ||||||||||||||
Total capitalization | $ | 1,397,182 | $ | 655,610 | $ | 491,277 | $ | 507,777 | $ | 526,525 | |||||||||
Other Financial Data: | |||||||||||||||||||
Cash flow provided by (used in): | |||||||||||||||||||
Operating activities | $ | 9,637 | $ | 59,399 | $ | 27,142 | $ | 70,826 | $ | 72,206 | |||||||||
Investing activities | (502,124 | ) | (210,481 | ) | (87,726 | ) | (1,842 | ) | (13,264 | ) | |||||||||
Financing activities | 535,568 | 158,764 | 2,251 | (37,724 | ) | (19,235 | ) | ||||||||||||
Interest expense, net | 10,777 | 3,310 | 2,844 | 2,652 | 3,161 | ||||||||||||||
Capital expenditures | 14,541 | 14,692 | 12,711 | 12,810 | 17,328 | ||||||||||||||
Diluted earnings per common share | $ | 0.70 | $ | 0.61 | $ | 0.58 | $ | 2.84 | $ | 2.67 | |||||||||
Diluted weighted average common shares outstanding | 16,849 | 16,536 | 16,913 | 17,768 | 17,629 | ||||||||||||||
Cash dividends declared per common share | $ | 0.15 | $ | 0.15 | $ | 0.15 | $ | 0.15 | $ | 0.15 | |||||||||
(1) | See Note 4, "Special and Restructuring charges, net" of the consolidated financial statements, for additional details on charges included in the twelve months ended December 31, 2017, December 31, 2016, and December 31, 2015 operating income above. The statement of income data for the year ended December 31, 2014 includes special and restructuring charges, net of $12.7 million. The statement of income data for the year ended December 31, 2013 includes special and restructuring charges, net of $8.6 million and intangible impairment charges of $6.9 million. |
(2) | On December 11, 2017 we acquired FH, on October 12, 2016 we acquired Critical Flow Solutions, and on April 15, 2015 we acquired Schroedahl. |
Item 7. Management’s Discussion and Analysis of Financial Condition and Results of Operations
See Item 1, Business, for additional detail on forward looking statements.
Company Overview
CIRCOR designs, manufactures and markets flow control solutions and other highly engineered products and sub-systems for markets including Oil & Gas, aerospace, power and process, pumps and industrial solutions. CIRCOR has a diversified product portfolio with recognized, market-leading brands that fulfill its customers’ unique application needs. See Part 1, Item 1, Business, for additional information regarding the description of our business.
On December 11, 2017, we completed the acquisition of the fluid handling business of Colfax Corporation (FH). The total consideration paid to acquire FH consisted of $542.0 in cash, 3,283,424 unregistered shares of our common stock and the assumption of net pension and post-retirement liabilities of FH. We financed the cash consideration through a combination of debt financing and cash on hand.
19
We expect the trend in lower capital expenditures, as well as deferred maintenance spending, by many national oil companies, oil majors and refineries to continue in 2018 and impact our project businesses including engineered and refinery valves. However, we expect to see modest growth in other markets we serve including the short-cycle on-shore North American distributed valves market and petrochemical processing market. We received a number of large orders in December 2017 for refinery valves, however, it is uncertain whether this trend will continue in 2018. Capital expenditures in the industrial end markets that we serve is expected to grow modestly. We expect to experience lower demand for our products that serve the power generation markets. Aerospace and defense end markets are expected to grow as demand for commercial air travel continues to increase and funding on military programs in the U.S. improves in 2018. We do not expect an improvement in the commercial marine sector as global shipbuilding continues to be constrained.
We continue to implement actions to mitigate the impact on our earnings with the lower demand and increasingly competitive environment. In addition, we are investing in products and technologies that help solve our customers’ most difficult problems. We expect to further simplify CIRCOR by standardizing technology, reducing facilities, consolidating suppliers and achieving world class operational excellence, including working capital management. We believe our cash flow from operations and financing capacity is adequate to support these activities. Finally, continuing to attract and retain talented personnel, including the enhancement of our global sales, operations, product management and engineering organizations, remains an important part of our strategy during 2018.
Basis of Presentation
All significant intercompany balances and transactions have been eliminated in consolidation. For 2017, we managed our businesses in three segments: Energy, Advanced Flow Solutions and Fluid Handling. For 2018, we expect to reorganize our segments by end market: Energy, Aerospace & Defense and Industrial. Prior year financial statements will be adjusted to reflect this new organization basis beginning in the first quarter of 2018.
We operate and report financial information using a 52-week fiscal year ending December 31. The data periods contained within our Quarterly Reports on Form 10-Q reflect the results of operations for the 13-week, 26-week and 39-week periods which generally end on the Sunday nearest the calendar quarter-end date.
Critical Accounting Policies
The Company’s discussion and analysis of its financial condition and results of operations is based upon its financial statements, which have been prepared in accordance with accounting principles generally accepted in the United States of America. The preparation of these financial statements requires management to make estimates and assumptions that affect the reported amounts of assets, liabilities, revenue and expenses and related disclosure of contingent liabilities. On an on-going basis, management evaluates its significant estimates, including those related to contracts accounted for under the percentage of completion method, bad debts, inventories, intangible assets and goodwill, purchase accounting, delivery penalties, income taxes, and contingencies including litigation. Management believes the most complex and sensitive judgments, because of their significance to the consolidated financial statements, result primarily from the need to make estimates about the effects of matters that are inherently uncertain. Management bases its estimates on historical experience, current market and economic conditions and other assumptions that management believes are reasonable. The results of these estimates form the basis for judgments about the carrying value of assets and liabilities where the values are not readily apparent from other sources. Actual results may differ from these estimates under different assumptions or conditions.
There have been no significant changes from the methodology applied by management for critical accounting estimates previously disclosed in our Annual Report on Form 10-K for the fiscal year ended December 31, 2016.
For goodwill, we perform an impairment assessment at the reporting unit level on an annual basis as of the end of our October month end or more frequently if circumstances warrant. In fiscal year 2017 when we performed our analysis, the fair value of each of our reporting units exceeded the respective carrying amount, and no goodwill impairments were recorded. The fair values utilized for our 2017 goodwill assessment exceeded the carrying amounts by more than 20% for our Energy, Aerospace, and Power, Process, & Industrial reporting units, respectively. The growth rate assumptions utilized were consistent with growth rates within the markets that we serve.
If our results significantly vary from our estimates, related projections, or business assumptions in the future due to change in industry or market conditions, we may be required to record impairment charges.
20
Results of Operations
2017 Compared With 2016
Consolidated Operations
(in thousands) | 2017 | 2016 | Total Change | Acquisitions | Operations | Foreign Exchange | |||||||||||||||||
Net Revenues | |||||||||||||||||||||||
Energy | $ | 347,578 | $ | 322,046 | $ | 25,532 | $ | 43,057 | $ | (18,897 | ) | $ | 1,372 | ||||||||||
Advanced Flow Solutions | 277,637 | 268,213 | 9,424 | — | 8,836 | 588 | |||||||||||||||||
Fluid Handling | 36,495 | — | 36,495 | 36,495 | — | — | |||||||||||||||||
Consolidated Net Revenues | $ | 661,710 | $ | 590,259 | $ | 71,451 | $ | 79,552 | $ | (10,061 | ) | $ | 1,960 | ||||||||||
Net revenues in 2017 were $661.7 million, an increase of $71.5 million from 2016 primarily driven by our October 2016 acquisition of Critical Flow Solutions ("CFS") ($43.1 million) and December 2017 acquisition of Fluid Handling ($36.5 million), partially offset by an operating decline in our Energy segment (as described in detail below).
Segment Results
The Chief Operating Decision Maker ("CODM") is the function that allocates the resources of the enterprise and assesses the performance of the Company's reportable operating segments. CIRCOR has determined that the CODM is solely comprised of its CEO, as the CEO has the ultimate responsibility for CIRCOR strategic decision-making and resource allocation.
Our CODM evaluates segment operating performance using segment operating income. Segment operating income is defined as GAAP operating income excluding intangible amortization and amortization of fair value step-ups of inventory and fixed assets from acquisitions completed subsequent to December 31, 2011, the impact of restructuring related inventory write-offs, impairment charges and special charges or gains. The Company also refers to this measure as adjusted operating income. The Company uses this measure because it helps management understand and evaluate the segments’ core operating results and facilitate comparison of performance for determining incentive compensation achievement.
For information regarding our segment determination refer to Note 17, “Business Segment and Geographical Information."
21
(in thousands) | 2017 | 2016 | Change | ||||||||
Net Revenues | |||||||||||
Energy | $ | 347,578 | $ | 322,046 | $ | 25,532 | |||||
Advanced Flow Solutions | 277,637 | 268,213 | 9,424 | ||||||||
Fluid Handling | 36,495 | — | 36,495 | ||||||||
Consolidated Net Revenues | $ | 661,710 | $ | 590,259 | $ | 71,451 | |||||
Operating Income | |||||||||||
Energy - Segment Operating Income | $ | 30,748 | $ | 34,619 | $ | (3,871 | ) | ||||
AFS - Segment Operating Income | 37,230 | 33,463 | 3,767 | ||||||||
Fluid Handling - Segment Operating Income | 5,460 | — | 5,460 | ||||||||
Corporate expenses | (21,744 | ) | (25,672 | ) | 3,928 | ||||||
Subtotal | 51,694 | 42,410 | 9,284 | ||||||||
Restructuring charges, net | 7,989 | 8,975 | (986 | ) | |||||||
Special charges, net | 6,063 | 8,196 | (2,133 | ) | |||||||
Special and restructuring charges, net (1) | 14,052 | 17,171 | (3,119 | ) | |||||||
Restructuring related inventory charges (1) | — | 2,846 | (2,846 | ) | |||||||
Amortization of inventory step-up | 4,300 | 1,366 | 2,934 | ||||||||
Impairment charges | — | 208 | (208 | ) | |||||||
Acquisition amortization | 12,542 | 9,901 | 2,641 | ||||||||
Acquisition depreciation | 233 | — | 233 | ||||||||
Restructuring and other costs | 17,075 | 14,321 | 2,754 | ||||||||
Consolidated Operating Income | $ | 20,567 | $ | 10,918 | $ | 9,649 | |||||
Consolidated Operating Margin | 3.1 | % | 1.8 | % | |||||||
(1) See Note 4 "Special and Restructuring charges, net" of the consolidated financial statements, for additional details. | |||||||||||
Energy Segment
(in thousands) | 2017 | 2016 | Change | ||||||||
Net Revenues | $ | 347,578 | $ | 322,046 | $ | 25,532 | |||||
Segment Operating Income | 30,748 | 34,619 | (3,871 | ) | |||||||
Segment Operating Margin | 8.8 | % | 10.7 | % | |||||||
Energy segment net revenues increased $25.5 million, or 8%, in 2017 compared to 2016. The increase was primarily driven by our October 2016 acquisition of CFS (+13%) and our North American short-cycle business (+12%), partially offset by declines in our large international projects business (-20%).
Segment operating income decreased $3.9 million, or 11%, to $30.7 million for 2017 compared to $34.6 million in 2016. The decrease in segment operating income was primarily due to the significant revenue decline in the large international projects business (-58%), partially offset by increased shipment volumes within our North American short-cycle business (+28%) and our CFS business in the downstream refining market (+24%).
Energy segment orders increased $118.9 million, or 44%, to $389.4 million for 2017 compared to $270.5 million in 2016, primarily due to CFS (+25%), our North American short-cycle business (+23%) due to improved demand and higher production activity in the U.S. shale plays, partially offset by lower orders in our large international projects business (-4%) due to a significant reduction in capital expenditures for exploration and production by the major oil companies resulting in fewer projects.
22
QUARTERLY ENERGY SEGMENT INFORMATION | ||||||||||
(in thousands, except percentages) | ||||||||||
(unaudited) | ||||||||||
2016 | 2017 | |||||||||
1ST QTR | 2ND QTR | 3RD QTR | 4TH QTR | TOTAL | 1ST QTR | 2ND QTR | 3RD QTR | 4TH QTR | TOTAL | |
Orders | 71,425 | 58,853 | 55,056 | 85,183 | 270,517 | 103,871 | 77,876 | 88,999 | 118,698 | 389,444 |
Net Revenues | 83,409 | 80,736 | 68,901 | 89,000 | 322,046 | 80,135 | 82,586 | 92,613 | 92,244 | 347,578 |
Operating Income | 9,296 | 9,293 | 6,755 | 9,276 | 34,619 | 6,864 | 8,858 | 7,397 | 7,630 | 30,748 |
Operating Margin | 11.1% | 11.5% | 9.8% | 10.4% | 10.7% | 8.6% | 10.7% | 8.0% | 8.3% | 8.8% |
Backlog (1) | 122,730 | 98,119 | 84,535 | 123,063 | 123,063 | 146,177 | 143,923 | 142,706 | 170,813 | 170,813 |
(1) at end of period. | ||||||||||
Advanced Flow Solutions Segment
(in thousands) | 2017 | 2016 | Change | ||||||||
Net Revenues | $ | 277,637 | $ | 268,213 | $ | 9,424 | |||||
Segment Operating Income | 37,230 | 33,463 | 3,767 | ||||||||
Segment Operating Margin | 13.4 | % | 12.5 | % | |||||||
Advanced Flow Solutions segment net revenues increased by $9.4 million, or 4%, in 2017 compared to 2016. The increase was primarily driven by increases in our aerospace and defense businesses (+5%) as demand rose due to higher production rates on a number of large platforms, as well as improved pricing on certain programs.
Segment operating income increased $3.8 million, or 11%, to $37.2 million for 2017 compared to $33.5 million for 2016. The increase in operating income was primarily as a result of improved pricing and operational efficiencies within our aerospace and defense businesses (+29%) and operational improvements within our industrial solutions business (+3%), which were partially offset by declines due to operational inefficiencies in our power and process businesses (-20%).
Advanced Flow Solutions segment orders increased $32.7 million, or 13%, to $287.9 million for 2017 compared to $255.2 million in 2016, primarily due to our aerospace and defense businesses (+11%).
QUARTERLY AFS SEGMENT INFORMATION | ||||||||||
(in thousands, except percentages) | ||||||||||
(unaudited) | ||||||||||
2016 | 2017 | |||||||||
1ST QTR | 2ND QTR | 3RD QTR | 4TH QTR | TOTAL | 1ST QTR | 2ND QTR | 3RD QTR | 4TH QTR | TOTAL | |
Orders | 65,357 | 76,464 | 56,262 | 57,134 | 255,217 | 80,210 | 65,055 | 69,093 | 73,501 | 287,859 |
Net Revenues | 67,389 | 65,656 | 65,932 | 69,236 | 268,213 | 65,073 | 68,645 | 67,080 | 76,840 | 277,638 |
Operating Income | 8,452 | 8,064 | 8,008 | 8,939 | 33,463 | 7,711 | 8,587 | 9,548 | 11,385 | 37,231 |
Operating Margin | 12.5% | 12.3% | 12.1% | 12.9% | 12.5% | 11.8% | 12.5% | 14.2% | 14.8% | 13.4% |
Backlog (1) | 137,332 | 145,930 | 135,721 | 119,332 | 119,332 | 135,631 | 135,671 | 135,547 | 133,289 | 133,289 |
(1) At end of period. | ||||||||||
Fluid Handling Segment
During the period from December 11 to December 31, 2017, Fluid Handling reported $36 million of net revenues. The revenues related to strong shipments for screw pumps into the general industry and commercial marine markets as well as the completion of a number of large projects delivered in this timeframe. Reliability Services delivered their largest equipment
23
order for oil mist equipment in this period. The high volume of activity in the period favorably impacted the operating results of $5.5 million. Orders during this period were $24 million consisting largely of run-rate bookings including aftermarket. We do not anticipate FH's 2017 results to be indicative of future revenue or margin run-rate performance.
Corporate Expenses
Corporate expenses decreased $3.9 million to $21.7 million for 2017. This decrease was primarily driven by lower variable compensation costs and reduced professional fees.
Special and Restructuring charges, net
During 2017, the Company recorded a total of $14.1 million of Special and restructuring charges. In our statement of operations, these charges are recorded in Special and restructuring charges, net. These costs are primarily related to our simplification and restructuring efforts. These restructuring charges and other special charges are described in further detail in Note 4, "Special and Restructuring charges, net", of the consolidated financial statements.
Restructuring and other costs
During 2017, the company recorded a total of $17.1 million of Restructuring and other costs. These charges represent plant, property, and equipment depreciation related to the step-up in fair value as part of our FH acquisition, intangible amortization in connection with acquisitions subsequent to December 31, 2011, and step-up in fair value of inventory acquired as part of our FH acquisition. These charges are recorded in either selling, general, and administrative expenses or cost of revenues based upon the nature of the underlying asset.
Interest Expense, Net
Interest expense increased $7.5 million to $10.8 million for 2017. This change in interest expense was primarily due to higher outstanding debt balances during the period as a result of the FH acquisition. We expect to incur higher interest costs in 2018 related to the increase in borrowing as part of the FH acquisition.
Other Expense (Income), Net
Other expense, net, was $3.7 million for 2017 compared to other income, net of $2.1 million in 2016. The difference of $5.8 million was primarily due to the impact of foreign currency fluctuations.
Comprehensive (Loss) Income
Comprehensive income increased $51.5 million, from a comprehensive loss of $0.2 million for the year-ended December 31, 2016 to comprehensive income of $51.3 million for the year-ended December 31, 2017, primarily driven by an increase of $47.6 million in favorable foreign currency balance sheet remeasurements. These favorable foreign currency balance sheet remeasurements were driven by the Euro ($40.6 million).
As of December 31, 2017, we had a cumulative currency translation adjustment of $17.5 million regarding our Brazil entity. If we were to cease to have a controlling financial interest in the Brazil entity, we would incur a non-cash charge of $17.5 million, which would be included as a special charge within the results of operations.
(Benefit from) Provision for Income Taxes
On December 22, 2017, the U.S. government enacted the Tax Cuts and Jobs Act (the “Tax Act”). The Tax Act includes significant changes to the U.S. corporate income tax system including: a federal corporate rate reduction from 35% to 21%; limitations on the deductibility of interest expense and executive compensation; creation of the base erosion anti-abuse tax (“BEAT”), a new minimum tax; and the transition of U.S. international taxation from a worldwide tax system to a modified territorial tax system. The change to a modified territorial tax system resulted in a one-time U.S. tax liability on those earnings which have not previously been repatriated to the U.S. (the “Transition Tax”), with future distributions not subject to U.S. federal income tax when repatriated. A majority of the provisions in the Tax Act are effective January 1, 2018.
In response to the Tax Act, the SEC staff issued guidance on accounting for the tax effects of the Tax Act. The guidance provides a one-year measurement period for companies to complete the accounting. We reflected the income tax effects of those aspects of the Tax Act for which the accounting is complete. To the extent our accounting for certain income tax effects of
24
the Tax Act is incomplete but we are able to determine a reasonable estimate, we recorded a provisional estimate in the financial statements. For items that we cannot determine a provisional estimate to be included in the financial statements, we continued to apply the provisions of the tax laws that were in effect immediately before the enactment of the Tax Act. As the analysis is completed, the ultimate impact may differ from these provisional amounts.
In connection with our initial analysis of the impact of the Tax Act, we have recorded a provisional estimate of $0.5 million net tax benefit for the period ended December 31, 2017. This benefit consists of provisional estimates of zero net expense for the Transition Tax liability, and $0.5 million benefit from the remeasurement of our deferred tax assets/liabilities due to the corporate rate reduction. On a provisional basis, the Company does not expect to owe the one-time Transition Tax liability, based on foreign tax pools that are in excess of U.S. tax rates. We are in process of determining the impact of the Tax Act on our U.S. foreign tax credit carryforwards (deferred tax asset), and are unable to record a provisional estimate at this time. Any adjustment, when determined, could have an adverse impact to our net deferred tax asset.
We have not completed our accounting for the income tax effects of certain elements of the Tax Act. The Tax Act creates a new requirement that certain income, such as Global Intangible Low-Taxed Income (“GILTI”), earned by a controlled foreign corporation must be included in the gross income of its U.S. shareholder. Because of the complexity of the new GILTI and BEAT tax rules, we are continuing to evaluate the impact of these provisions and whether taxes due on future U.S. inclusions related to GILTI or BEAT should be recorded as a current period expense when incurred, or factored into the measurement of deferred taxes. As a result, we have not included an estimate of the tax expense or benefit related to these items for the period ended December 31, 2017.
The effective tax rate was -93% for 2017 compared to -4% for 2016. The primary drivers for the lower tax rate in 2017 included non-taxable income from reduction of an acquisition-related earnout (-69%), the establishment of a valuation allowance in 2016 for certain state net operating loss carryforwards (-19%), change in tax reserves (-15%), reduced foreign losses in 2017 with no tax benefit (-12%), provisional revaluation of certain U.S. deferred tax assets and liabilities under the Tax Act (-8%), as described in more detail in Note 8, "Income Taxes", of the consolidated financial statements, and mix of lower taxed foreign earnings to U.S. earnings (-5%). This was partially offset by the tax benefit associated with the repatriation of foreign earnings which we completed in 2016 (+27%), state income taxes (+5%), and nondeductible transaction costs (+5%).
Restructuring Actions
Our announced restructuring actions which result in savings are summarized as follows:
• | During 2016 and 2017, we initiated certain restructuring activities, under which we continue to simplify our business ("2016 Actions" and "2017 Actions", respectively). Under these restructurings, we reduced expenses, primarily through reductions in force and closing a number of smaller facilities. |
• | In July 2015, we announced the closure of one of the two Corona, California manufacturing facilities ("California |
Restructuring"). Under this restructuring, we reduced certain general, manufacturing and facility related expenses.
• | On February 18, 2015, we announced a restructuring action ("2015 Announced Restructuring"), under which we continued to simplify our businesses. Under this action, we reduced certain general, administrative and manufacturing related expenses, primarily personnel related. |
The table below (in millions) outlines the cumulative effects on past and future earnings resulting from our announced restructuring plans.
Cumulative Planned Savings | Cumulative Projected & Actual Savings | Expected Periods of Savings Realization | |||||||
2017 Actions | $ | 6.9 | $ | 6.9 | Q2 2017 - Q4 2018 | ||||
2016 Actions | 14.1 | 13.3 | Q2 2016 - Q4 2017 | ||||||
California Restructuring | 3.0 | 3.0 | Q3 2016 - Q4 2017 | ||||||
2015 Announced Restructuring | 18.0 | 20.8 | Q1 2015 - Q4 2016 | ||||||
Total Savings | $ | 42.0 | $ | 44.0 | |||||
As shown in the table above, our projected cumulative restructuring savings are higher than our cumulative planned savings amounts. This is primarily attributed to reducing higher than planned general, administrative and manufacturing related
25
expenses. The expected periods of realization of the restructuring savings are fairly consistent with our original plans. Our restructuring actions are funded by cash generated by operations. All of the actions above have been completed.
During the first quarter of 2018, management approved certain restructuring actions to reduce structural costs in our manufacturing operations in Europe and to rationalize the service center network in our global Reliability Services business. The Company expects restructuring costs in the range of $11 million to $13 million (pre-tax), primarily related to a reductions in workforce. This range includes $2 million to $3 million of non-cash costs. We expect annual run rate savings of approximately $8 million, which will start to be realized in the latter half of 2018, from these actions.
Results of Operations
2016 Compared With 2015
Consolidated Operations
(in thousands) | 2016 | 2015 | Total Change | Acquisitions | Operations | Foreign Exchange | |||||||||||||||||
Net Revenues | |||||||||||||||||||||||
Energy | $ | 322,046 | $ | 383,655 | $ | (61,609 | ) | $ | 18,974 | $ | (79,467 | ) | $ | (1,116 | ) | ||||||||
Advanced Flow Solutions | 268,213 | 272,612 | (4,399 | ) | 6,106 | (8,010 | ) | (2,495 | ) | ||||||||||||||
Consolidated Net Revenues | $ | 590,259 | $ | 656,267 | $ | (66,008 | ) | $ | 25,080 | $ | (87,477 | ) | $ | (3,611 | ) | ||||||||
Net revenues in 2016 were $590.3million, a decrease of $66.0 million from 2015. The unfavorable effects of currency translation resulted in a decrease in revenues of $3.6 million in 2016. Sales increased $25.1 million due to our 2015 acquisition of Schroedahl and 2016 acquisition of CFS. Aside from the effects of currency translation and acquisitions, revenues decreased $87.5 million (-13%) primarily due to decreased demand in our North American short-cycle Energy business.
Segment Results
The Company uses segment operating income because it helps management understand and evaluate the segments’ operating results and facilitates a comparison of performance for determining compensation. Accordingly, the following segment data is reported on this basis.
26
(in thousands) | 2016 | 2015 | Change | ||||||||
Net Revenues | |||||||||||
Energy | $ | 322,046 | $ | 383,655 | $ | (61,609 | ) | ||||
Advanced Flow Solutions | 268,213 | 272,612 | (4,399 | ) | |||||||
Consolidated Net Revenues | $ | 590,259 | $ | 656,267 | $ | (66,008 | ) | ||||
$ | — | ||||||||||
Operating Income | — | ||||||||||
Energy - Segment Operating Income | $ | 34,619 | $ | 50,386 | $ | (15,767 | ) | ||||
AFS - Segment Operating Income | 33,463 | 33,811 | (348 | ) | |||||||
Corporate expenses | (25,672 | ) | (21,710 | ) | (3,962 | ) | |||||
Subtotal | 42,410 | 62,487 | (20,077 | ) | |||||||
Restructuring charges, net | 8,975 | 4,634 | 4,341 | ||||||||
Special charges, net | 8,196 | 9,720 | (1,524 | ) | |||||||
Special and restructuring charges, net (1) | 17,171 | 14,354 | 2,817 | ||||||||
Restructuring related inventory charges (1) | 2,846 | 9,391 | (6,545 | ) | |||||||
Amortization of inventory step-up | 1,366 | — | 1,366 | ||||||||
Impairment charges | 208 | 2,502 | (2,294 | ) | |||||||
Acquisition amortization | 9,901 | 6,838 | 3,063 | ||||||||
Brazil restatement impact | — | 3,228 | (3,228 | ) | |||||||
Restructuring and other cost, net | 14,321 | 21,959 | (7,638 | ) | |||||||
Consolidated Operating Income | $ | 10,918 | $ | 26,174 | $ | (15,256 | ) | ||||
Consolidated Operating Margin | 1.8 | % | 4.0 | % | |||||||
(1) See Note 4 "Special and Restructuring charges, net" of the consolidated financial statements, for additional details. | |||||||||||
Energy Segment
(in thousands) | 2016 | 2015 | Change | ||||||||
Net Revenues | $ | 322,046 | $ | 383,655 | $ | (61,609 | ) | ||||
Segment Operating Income | 34,619 | 50,386 | (15,767 | ) | |||||||
Segment Operating Margin | 10.7 | % | 13.1 | % | |||||||
Energy segment net revenues decreased $61.6 million, or 16%, in 2016 compared to 2015. The decrease was primarily driven by lower shipment volumes in our North American short-cycle business (-15%). Net revenues in other oil and gas businesses declined (-5%), offset by the acquisition of CFS (+5%). Energy segment orders decreased $68.9 million, or 20%, to $270.5 million for 2016 compared to $339.4 million in 2015, primarily due to lower bookings in the large international projects business (-15%) and in our North American short-cycle business (-5%). Lower orders in our long-cycle, large international projects business was impacted by reduced capital expenditures for exploration and production of oil and gas as well as project deferrals. Lower orders in our North American short-cycle business were impacted by the destocking of our distributors as well as lower production activity overall.
Segment operating income decreased $15.8 million, or 31%, to $34.6 million for 2016 compared to $50.4 million in 2015. The decrease in segment operating income was primarily due to lower shipment volumes from our North American short-cycle business (-37%). In addition, we recorded $3.2 million (-6%) of bad debt and inventory write-down charges during the fourth quarter related to past-due amounts and inventories associated with Petróleos de Venezuela ("PDVSA"). These declines were partially offset by segment operating income from CFS (+8%) and savings from our sourcing, restructuring and productivity initiatives (+4%).
27
QUARTERLY ENERGY SEGMENT INFORMATION | ||||||||||
(in thousands, except percentages) | ||||||||||
(unaudited) | ||||||||||
2015 | 2016 | |||||||||
1ST QTR | 2ND QTR | 3RD QTR | 4TH QTR | TOTAL | 1ST QTR | 2ND QTR | 3RD QTR | 4TH QTR | TOTAL | |
Orders | 120,344 | 83,710 | 64,877 | 70,480 | 339,411 | 71,425 | 58,853 | 55,056 | 85,183 | 270,517 |
Net Revenues | 105,619 | 97,753 | 88,679 | 91,604 | 383,655 | 83,409 | 80,736 | 68,901 | 89,000 | 322,046 |
Operating Income | 15,011 | 12,926 | 12,153 | 10,296 | 50,385 | 9,296 | 9,293 | 6,755 | 9,276 | 34,619 |
Operating Margin | 14.2% | 13.2% | 13.7% | 11.2% | 13.1% | 11.1% | 11.5% | 9.8% | 10.4% | 10.7% |
Backlog (1) | 204,231 | 192,760 | 159,727 | 131,554 | 131,554 | 122,730 | 98,119 | 84,535 | 123,063 | 123,063 |
(1) at end of period. | ||||||||||
Advanced Flow Solutions Segment
(in thousands) | 2016 | 2015 | Change | ||||||||
Net Revenues | $ | 268,213 | $ | 272,612 | $ | (4,399 | ) | ||||
Segment Operating Income | 33,463 | 33,811 | (348 | ) | |||||||
Segment Operating Margin | 12.5 | % | 12.4 | % | |||||||
Advanced Flow Solutions segment net revenues decreased by $4.4 million, or 2%, in 2016 compared to 2015. The decrease was primarily driven by declines in our aerospace business (-2%) and our industrial solutions business (-1%). These declines were offset by the April 2015 acquisition of Schroedahl (+2%). Advanced Flow Solutions segment orders increased $4.2 million, or 2%, to $255.2 million for 2016 compared to $251.0 million in 2015, primarily due to our aerospace business (+2%).
Segment operating income decreased $0.3 million, or 1%, to $33.5 million for 2016 compared to $33.8 million for 2015. The decrease in operating income was primarily as a result of the revenue declines (-2%) described above. These declines were offset by the Schroedahl acquisition (+7%) and restructuring savings and operational efficiencies in our California (+18%) and French (+5%) businesses.
QUARTERLY AFS SEGMENT INFORMATION | ||||||||||
(in thousands, except percentages) | ||||||||||
(unaudited) | ||||||||||
2015 | 2016 | |||||||||
1ST QTR | 2ND QTR | 3RD QTR | 4TH QTR | TOTAL | 1ST QTR | 2ND QTR | 3RD QTR | 4TH QTR | TOTAL | |
Orders | 61,968 | 57,998 | 63,638 | 67,375 | 250,979 | 65,357 | 76,464 | 56,262 | 57,134 | 255,217 |
Net Revenues | 60,241 | 69,153 | 70,579 | 72,639 | 272,612 | 67,389 | 65,656 | 65,932 | 69,236 | 268,213 |
Operating Income | 5,584 | 7,576 | 10,077 | 10,574 | 33,811 | 8,452 | 8,064 | 8,008 | 8,939 | 33,463 |
Operating Margin | 9.3% | 11.0% | 14.3% | 14.6% | 12.4% | 12.5% | 12.3% | 12.1% | 12.9% | 12.5% |
Backlog (1) | 147,587 | 151,474 | 144,926 | 137,494 | 137,494 | 137,332 | 145,930 | 135,721 | 119,332 | 119,332 |
(1) At end of period. | ||||||||||
Corporate Expenses
Corporate expenses increased $4.0 million to $25.7 million for 2016. This increase was primarily driven by compensation costs ($1.5 million) associated with filling open positions and higher performance on incentive plans, corporate development expenses (relating to potential mergers and acquisitions due diligence) of $1.2 million, and professional fees ($1.1 million).
28
Special and Restructuring charges, net and other charges
During 2016, the Company recorded a total of $20.0 million of Special and restructuring charges. In our statement of operations, these charges are recorded in costs of revenue ($2.8 million) and Special and restructuring charges, net ($17.2 million). These costs are primarily related to our simplification and restructuring efforts and also include a $4.5 million pension settlement charge in which participants received cash related to a pension settlement. The amount recorded in costs of revenues relates to inventory charges associated with the exit of non-strategic product lines. These restructuring charges and other special charges are described in further detail in Note 4, "Special and Restructuring charges, net", of the consolidated financial statements.
In relation to our 2016 and 2015 acquisitions of CFS and Schroedahl, respectively, we incurred $9.9 million of intangible asset amortization related to these acquisitions. This amortization is recorded within selling, general, and administrative expenses ($9.3 million) or cost of revenues ($0.6 million) depending upon the nature of the underlying intangible asset. In addition, we recorded $1.4 million of amortization expense related to the step-up in fair value of the inventory acquired as part of our CFS acquisition. This expense is included in cost of revenues.
Also during 2016, we also recorded a $0.2 million impairment charge for a China patent deemed to no longer have economic value. The impairment charge is included in the impairment charge line on our consolidated statement of income (loss).
In 2015, the Company recorded $23.7 million of Special and restructuring charges, net. In our statement of operations, these charges are recorded in costs of revenue ($9.4 million) and Special and restructuring charges, net ($14.4 million). These costs are primarily related to our simplification and restructuring efforts. The amount recorded in costs of revenues relates to inventory charges associated with the exit of non-strategic product lines. In addition, we incurred $3.2 million of Brazil restatement charges. These restructuring charges and other special charges are described in further detail in Note 4, “Special and Restructuring charges, net”, of the consolidated financial statements.
In relation to our Schroedahl acquisition we recorded $6.8 million of intangible asset amortization during 2015. This amortization is recorded within selling, general, and administrative expenses. Also during 2015, we recorded $2.5 million of plant, property, and equipment and intangible impairments related to our Brazil business. These impairment charges are included in the impairment charge line on our consolidated statement of operations.
Interest Expense, Net
Interest expense increased $0.5 million to $3.3 million for 2016. This change in interest expense was primarily due to higher outstanding debt balances during the period as a result of the CFS acquisition.
Other (Income) Expense, Net
Other income, net, was $2.1 million for 2016 compared to other expense, net of ($0.9 million) in 2015. The difference of $3.0 million was primarily due to the impact of foreign currency fluctuations.
Comprehensive (Loss) Income
Comprehensive loss was reduced from a comprehensive loss of $22.2 million for the year-ended December 31, 2015 to a comprehensive loss of $0.2 million for the year-ended December 31, 2016, primarily driven by an increase of $16.9 million in favorable foreign currency balance sheet remeasurements. These favorable foreign currency balance sheet remeasurements were driven by the Brazilian Real ($9.9 million) and Euro ($6.3 million).
As of December 31, 2016, we had a cumulative currency translation adjustment of $17.3 million regarding our Brazil entity.
(Benefit from) Provision for Income Taxes
The effective tax rate was -4% for 2016 compared to 56% for 2015. The primary drivers for the lower tax rate in 2016 included the tax benefit associated with the repatriation of foreign earnings which we completed in 2016 (-27%), reduced foreign losses in 2016 with no tax benefit (-27%), mix of lower taxed foreign earnings to U.S. earnings (-18%), and other items in 2016 including the prior year impact of a foreign audit settlement (-14%). This was partially offset by the establishment of a valuation allowance for certain state net operating loss carryforwards (+26%).
29
Liquidity and Capital Resources
Our liquidity needs arise primarily from capital investment in machinery, equipment and the improvement of facilities, funding working capital requirements to support business growth initiatives, acquisitions, dividend payments, and debt service costs. We have historically generated cash from operations and remain in a strong financial position, with resources available for reinvestment in existing businesses, strategic acquisitions and managing our capital structure on a short and long-term basis.
We completed the acquisition of FH on December 11, 2017. The total consideration paid to acquire FH consisted of $542 million in cash, 3,283,424 unregistered shares of our common stock and the assumption of net pension and post-retirement liabilities of FH. We financed the cash consideration through a combination of committed debt financing and cash on hand. Refer to Note 3, “Business Acquisitions,” of the consolidated financial statements for details. As a result of the transaction we incurred significant debt, including secured indebtedness, as described below.
The following table summarizes our cash flow activities for the year-ended indicated (in thousands):
2017 | 2016 | 2015 | |||||||||
Cash flow provided by (used in): | |||||||||||
Operating activities | $ | 9,637 | $ | 59,399 | $ | 27,142 | |||||
Investing activities | (502,124 | ) | (210,481 | ) | (87,726 | ) | |||||
Financing activities | 535,568 | 158,764 | 2,251 | ||||||||
Effect of exchange rate changes on cash and cash equivalents | 8,996 | (3,944 | ) | (8,498 | ) | ||||||
Increase (decrease) in cash and cash equivalents (1) | $ | 52,077 | $ | 3,738 | $ | (66,831 | ) | ||||
(1) Pursuant to the terms of the FH purchase agreement, $64.5 million of the cash balance as of December 31, 2017 is due back to Colfax Corporation (“Colfax”), which has been reflected as a current liability within the balance sheet. | |||||||||||
Cash Flow Activities for the Year Ended December 31, 2017 Compared to the Year Ended December 31, 2016
During the year ended December 31, 2017, we generated $9.6 million in cash flow from operating activities compared to $59.4 million during the year ended December 31, 2016. The $49.8 million decrease in operating cash was primarily driven by working capital changes including increased inventory purchases of $55.6 million primarily related to the demand ramp-up in our North American distributed valves business, partially offset by operating cash increases of $8.4 million due to the timing of vendor payments.
During the year ended December 31, 2017, we used $502.1 million for investing activities as compared to $210.5 million during the year ended December 31, 2016. The $291.6 million year over year increase in cash used was primarily driven by our purchase of the FH business in December of 2017.
During the year ended December 31, 2017, we generated $535.6 million from financing activities as compared to cash generated of $158.8 million during the year ended December 31, 2016. The $376.8 million year over year increase in cash generated from financing activities was primarily related to our purchase of the FH business. On December 11, 2017, we borrowed $785.0 million under a new term loan and entered into a new $150.0 million revolving line of credit on which we drew $40.0 million. Proceeds from these borrowings were used to fund the acquisition of FH and repay $97.5 million and $176.0 million of outstanding debt under our previous term loan and revolving line of credit, respectively.
As of December 31, 2017, total debt (including current portion) was $795.2 million compared to $251.2 million at December 31, 2016 due to borrowings from the New Credit Agreement (as defined below) related to the acquisition of Fluid Handling. Total debt as a percentage of total shareholders’ equity was 131% as of December 31, 2017 compared to 62% as of December 31, 2016. As of December 31, 2017, we had available capacity to borrow an additional $86.1 million under our revolving credit facility.
As a result of a significant portion of our cash balances being denominated in Euros and Canadian Dollars, the strengthening of the U.S. Dollar resulted in a $9.0 million increase in reported cash balances.
30
We entered into a secured Credit Agreement, dated as of December 11, 2017 ("New Credit Agreement"), which provides for a $150.0 million revolving line of credit with a five year maturity and a $785.0 million term loan with a seven year maturity which was funded at closing of the FH acquisition in full. We entered into the New Credit Agreement to fund acquisitions, such as the acquisition of FH, to support our operational growth initiatives and working capital needs, and for general corporate purposes. As of December 31, 2017, we had borrowings of $795.2 million outstanding under our credit facility and $77.7 million outstanding under letters of credit.
The New Credit Agreement contains covenants that require, among other items, maintenance of certain financial ratios and also limits our ability to: enter into secured and unsecured borrowing arrangements; issue dividends to shareholders; acquire and dispose of businesses; invest in capital equipment; transfer assets among domestic and international entities; participate in certain higher yielding long-term investment vehicles; and issue additional shares of our stock which limits our ability to borrow under the credit facility. The primary financial covenant is first lien net leverage, a ratio of total secured debt (less cash and cash equivalents) to total earnings before interest expense, taxes, depreciation, and amortization based on the 12 months ended at the testing period. We were in compliance with all financial covenants related to our existing debt obligations at December 31, 2017 and we believe it is likely that we will continue to meet such covenants for at least the next twelve months from date of issuance of the financial statements.
The ratio of current assets to current liabilities was 2.0:1 at December 31, 2017 compared to 3.1:1 at December 31, 2016. As of December 31, 2017, cash and cash equivalents totaled $110.4 million, of which $65.3 million is payable back to Colfax. These cash and cash equivalent balances are substantially all held in foreign bank accounts. This compares to $58.3 million of cash and cash equivalents as of December 31, 2016 substantially all of which was also held in foreign bank accounts. The cash and cash equivalents located at our foreign subsidiaries may not be repatriated to the United States or other jurisdictions without significant tax implications. On a provisional basis, the Company does not expect to owe the one-time Transition Tax liability, based on foreign tax pools that are in excess of U.S. tax rates. We believe that our U.S. based subsidiaries, in the aggregate, will generate positive operating cash flows and in addition we may utilize our New Credit Agreement for U.S. based cash needs.
In 2018, we expect to generate positive cash flow from operating activities sufficient to support our capital expenditures and service our debt. Based on our expected cash flows from operations and contractually available borrowings under our credit facility, we expect to have sufficient liquidity to fund working capital needs and future growth over at least the next twelve months from date of filing the 2017 financial statements. On February 28, 2018, we announced the suspension of our nominal dividend, as part of our capital deployment strategy.
Cash Flow Activities for the Year Ended December 31, 2016 Compared to the Year Ended December 31, 2015
During the year ended December 31, 2016, we generated $59.4 million in cash flow from operating activities compared to $27.1 million during the year ended December 31, 2015. The $32.3 million increase in operating cash was primarily driven by higher cash provided by working capital. Within working capital in 2016, approximately $1.9 million of cash came from increased collections and $50.5 million from improved inventory positions offset in part by a decrease in accounts payable of $13.6 million. The decrease in accounts payable was due to the timing of payments to our vendors for products and services and decrease in business volume, primarily in our large international projects business ($12.8 million).
During the year ended December 31, 2016, we used $210.5 million for investing activities as compared to $87.7 million during the year ended December 31, 2015. The $122.8 million year over year increase in cash used was primarily driven by $197.5 million used for the CFS acquisition in 2016 compared to $79.7 million used for the Schroedahl acquisition in 2015, as described in Note 3, Business Acquisitions.
During the year ended December 31, 2016, we generated $158.8 million for financing activities as compared to cash generated of $2.3 million during the year ended December 31, 2015. The $156.5 million year over year increase in cash generated from financing activities was primarily related to our net borrowing activity as we increased debt by $323.2 million, and made debt payments of $162.5 million. On October 13, 2016, to fund the acquisition of CFS, we borrowed $205.0 million under our existing credit facility. During the fourth quarter of 2016, we repatriated $32.0 million of foreign earnings and utilized the cash to repay borrowings under our credit agreement.
As of December 31, 2016, total debt was $251.2 million compared to $90.5 million at December 31, 2015 due to the draw down on our credit facility. Total debt as a percentage of total shareholders’ equity was 62% as of December 31, 2016 compared to 23% as of December 31, 2015.
31
As a result of a significant portion of our cash balances being denominated in Euros and Canadian Dollars, the strengthening of the U.S. Dollar resulted in a $3.9 million decrease in reported cash balances.
We had a five year unsecured credit agreement ("2014 Credit Agreement"), under which we could borrow funds up to $400 million (with an accordion feature that allowed us to borrow up to an additional $200 million if the existing or additional lenders agreed).
We entered into the 2014 Credit Agreement to fund potential acquisitions, such as our Schroedahl and CFS acquisitions, to support our operational growth initiatives and working capital needs, and for general corporate purposes. As of December 31, 2016, we had borrowings of $251.2 million outstanding under our credit facility and $53.6 million outstanding under letters of credit.
We were in compliance with all financial covenants related to our existing debt obligations at December 31, 2016.
The ratio of current assets to current liabilities was 3:1:1 at December 31, 2016 compared to 2.6:1 at December 31, 2015. As of December 31, 2016, cash and cash equivalents totaled $58.3 million, substantially all of which was held in foreign bank accounts. This compares to $54.5 million of cash and cash equivalents as of December 31, 2015 substantially all of which was also held in foreign bank accounts.
Significant Contractual Obligations and Commercial Commitments
The following table summarizes our significant contractual obligations and commercial commitments at December 31, 2017 that affect our liquidity:
Payments due by Period | |||||||||||||||||||
Total (1) | Less Than 1 Year | 1 – 3 Years | 3 – 5 Years | More than 5 years | |||||||||||||||
Contractual Cash Obligations: | (in thousands) | ||||||||||||||||||
Long-term debt, less current portion | $ | 787,343 | $ | 7,850 | $ | 15,700 | $ | 15,700 | $ | 748,093 | |||||||||
Interest payments on debt | 291,218 | 47,664 | 87,923 | 82,856 | 72,775 | ||||||||||||||
Operating leases | 42,538 | 12,272 | 14,280 | 7,533 | 8,453 | ||||||||||||||
Total contractual cash obligations | $ | 1,121,099 | $ | 67,786 | $ | 117,903 | $ | 106,089 | $ | 829,321 | |||||||||
Commercial Commitments: | |||||||||||||||||||
U.S. standby letters of credit | $ | 30,036 | $ | 23,216 | $ | 6,820 | $ | — | $ | — | |||||||||
International standby letters of credit | 54,471 | 27,128 | 25,746 | 1,030 | 567 | ||||||||||||||
Commercial contract commitments | 115,064 | 113,710 | 985 | 219 | 150 | ||||||||||||||
Total commercial commitments | $ | 199,571 | $ | 164,054 | $ | 33,551 | $ | 1,249 | $ | 717 | |||||||||
(1) Note the table above does not reflect $64.5 million of cash contractually owed back to Colfax, which we anticipate will occur within 1 year depending on various countries legal requirements. | |||||||||||||||||||
In accordance with the authoritative guidance for accounting for uncertainty in income taxes, as of December 31, 2017, we had unrecognized tax benefits of $3.0 million, including $0.4 million of accrued interest. The Company expects the unrecognized tax benefits to change over the next 12 months if certain tax matters ultimately settle with the applicable taxing jurisdiction during this timeframe, or if the applicable statute of limitations lapses. The impact of the amount of such changes to previously recorded uncertain tax positions could range from $0 to $1.5 million.
The interest on certain of our other debt balances, with scheduled repayment dates between 2018 and 2020 using interest rates of 4.93%, have been included in the "Interest payments on debt" line within the Contractual Cash Obligations schedule.
Our commercial contract commitments primarily relate to open purchase orders of $115.1 million, $3.2 million of which extend to 2018 and beyond.
In fiscal years 2017, 2016 and 2015, we contributed $0.8 million, $1.0 million and $1.6 million to our qualified defined benefit U.S. pension plan, respectively. In addition, we made $0.4 million in payments to our nonqualified supplemental plan for 2017, 2016 and 2015 and we made $0.2 million in payments to our non-U.S. plans in 2017. In connection with a lump sum cash payout option to terminated and vested pension plan participants, during Q4 2016 we incurred a $4.5 million pension
32
settlement charge included in net periodic benefit cost which has been recorded within the Special and restructuring charges, net line item. In addition, we made $1.6 million, $2.0 million and $1.5 million in payments to our 401(k) savings plan for 2017, 2016 and 2015, respectively.
In 2018, we expect to make defined benefit plan contributions based on the minimum required funding in accordance with statutory requirements. The estimates for plan funding for future periods may change as a result of the uncertainties concerning the return on plan assets, the number of plan participants, and other changes in actuarial assumptions. We anticipate fulfilling these commitments through our generation of cash flow from operations.
Off-Balance Sheet Arrangements
Through December 31, 2017, we have not entered into any off-balance sheet arrangements or material transactions with unconsolidated entities or other persons that have, or are reasonably likely to have, a current or future effect on our financial condition, changes in financial condition, revenues or expenses, results of operations, liquidity, capital expenditures, or capital resources that is material to investors.
Item 7A. Quantitative and Qualitative Disclosures About Market Risk
Market Risk
Business performance in the Oil & Gas refining sector is largely tied to refining margins, which are also driven by the market price of crude oil and gasoline demand. Seasonal factors such as hurricanes and peak gasoline demand in the summer months may also drive high crack spread margins. During periods when high crack spread margins exist, refineries prefer to operate continuously at full capacity. Refiners may decide to delay planned maintenance (commonly called “unit turnarounds”) during these periods to maximize their returns. Refining crack spread margins remained high for most of 2017, which resulted in delayed unit turnarounds, especially in the Gulf of Mexico region. As a result, the timing of major capital projects in our severe service refinery valves business were impacted. While planned maintenance and unit turnarounds are necessary for safe and efficient operation of the refineries, project timing driven by these factors may continue to create fluctuations in our performance.
The commercial marine market experienced a historically unprecedented decade-long increase in new ship builds beginning in 2004 to meet the increase in global trade demand. This created an over-supply of capacity that resulted in a slowdown of new ship contracts between 2015 to 2017. The pumps that we supply to the commercial marine market are first supplied during commissioning of a new vessel, with aftermarket business over the lifetime of that vessel. While we have experienced increased aftermarket business during the past decade as the global shipping fleet has expanded, the downturn in new ship builds starting in 2015 has negatively impacted our new equipment commercial marine business. Any extended downturn in the commercial marine market could have a material adverse effect on our business.
Foreign Currency Exchange Risk
The Company is exposed to certain risks relating to its ongoing business operations including foreign currency exchange rate risk and interest rate risk. For additional information regarding our foreign currency exchange risk refer to Note 16, "Fair Value", of the consolidated financial statements.
We performed a sensitivity analysis as of December 31, 2017 based on scenarios in which market spot rates are hypothetically changed in order to produce a potential net exposure loss. The hypothetical change was based on a 10 percent strengthening or weakening in the U.S. dollar, whereby all other variables are held constant. The sensitivity analysis indicates that a hypothetical 10 percent adverse movement in foreign currency exchange rates would result in a foreign exchange gain of approximately $0.6 million at December 31, 2017.
Interest Rate Risk
Loans under our credit facility bear interest at variable rates which reset every 30 to 180 days depending on the rate and period selected by the Company. These loans are subject to interest rate risk as interest rates will be adjusted at each rollover date to the extent such amounts are not repaid. As of December 31, 2017, the annual rates on the revolving loans were 4.9%. If there was a hypothetical 100 basis point change in interest rates, the annual net impact to earnings and cash flows would be $8.2 million. This hypothetical change in cash flows and earnings has been calculated based on the borrowings outstanding at December 31, 2017 and a 100 basis point per annum change in interest rate applied over a one-year period. We are evaluating entering into a potential fixed rate interest swap arrangement which would result in an increase in interest costs.
33
Item 8. Financial Statements and Supplementary Data
Our consolidated financial statements and the related notes thereto are listed in Item 15(a)(1) on the Index to Consolidated Financial Statements.
Item 9. Changes In and Disagreements With Accountants on Accounting and Financial Disclosure
None.
Item 9A. Controls and Procedures
Evaluation of Disclosure Controls and Procedures
Our management, with the participation of our Chief Executive Officer ("CEO") and Chief Financial Officer ("CFO") (our principal executive officer and principal financial officer, respectively), has evaluated the effectiveness of our disclosure controls and procedures (as defined in Rules 13a-15(e) and 15d-15(e) of the Securities Exchange Act of 1934) as of the end of the period covered by this Annual Report on Form 10-K. Based on that evaluation, our CEO and CFO concluded that, as of December 31, 2017, the Company’s disclosure controls and procedures were effective to provide reasonable assurance that information we disclose in reports that we file or submit under the Securities and Exchange Act of 1934 is accumulated and communicated to management, including our principal executive and financial officers, to allow timely decisions regarding disclosure and that such information is recorded, processed, summarized and reported, within the time periods specified in the Securities and Exchange Commission’s rules and forms.
Management’s Report on Internal Control over Financial Reporting
Our management is responsible for establishing and maintaining adequate internal control over financial reporting, as defined in the Exchange Act Rules 13a-15(f) and 15d-15(f). Under the supervision and with the participation of our management, including our principal executive officer and principal financial officer, we conducted an evaluation of the effectiveness of our internal control over financial reporting based on the framework titled "Internal Control - Integrated Framework" issued by the Committee of Sponsoring Organizations of the Treadway Commission in 2013. Based on our evaluation under this framework, our management concluded that our internal control over financial reporting was effective as of December 31, 2017.
Management excluded Fluid Handling from our assessment of internal control over financial reporting as of December 31, 2017 because it was acquired by the Company in a purchase business combination in December 2017. The total assets and total revenues of Fluid Handling, a wholly-owned subsidiary, represent approximately 21% and 6%, respectively, of the related consolidated financial statement amounts as of and for the year ended December 31, 2017.
Our internal control over financial reporting as of December 31, 2017 has been audited by PricewaterhouseCoopers LLP, an independent registered public accounting firm, as stated in their report which is included herein.
Changes in Internal Control over Financial Reporting
There were no changes in our internal control over financial reporting that occurred during the quarter ended December 31, 2017 that could materially affect, or are reasonably likely to materially affect, our internal control over financial reporting.
Item 9B. Other Information
None.
Part III
34
Item 10. Directors, Executive Officers and Corporate Governance
The information required under this item is incorporated by reference to the Company’s definitive proxy statement pursuant to Regulation 14A, which proxy statement will be filed with the Securities and Exchange Commission no later than 120 days after the close of the Company’s fiscal year ended December 31, 2017.
Code of Ethics
The Company has implemented and regularly monitors compliance with a comprehensive Code of Conduct & Business Ethics (the "Code of Conduct"), which applies uniformly to all directors, executive officers, and employees. Among other things, the Code of Conduct addresses conflicts of interest, confidentially, fair dealing, protection and proper use of Company assets, compliance with applicable law (including insider trading and anti-bribery laws), and reporting of illegal or unethical behavior. The Code of Conduct is available on the Company's website at www.CIRCOR.com under the "Investors" sub link and hardcopy will be provided by the Company to any stockholder who requests it by writing to the Company's Secretary at the Company's headquarters. In addition, we intend to post on our website all disclosures that are required by SEC regulations or NYSE listing standards with respect to amendments to, or waivers from, any provision of the Code of Conduct.
Item 11. Executive Compensation
The information required under this item is incorporated by reference to the Company’s definitive proxy statement pursuant to Regulation 14A, which proxy statement will be filed with the Securities and Exchange Commission no later than 120 days after the close of the Company’s fiscal year ended December 31, 2017.
Item 12. Security Ownership of Certain Beneficial Owners and Management and Related Stockholder Matters
Except for the information required by Section 201(d) of Regulation S-K which is set forth below, the information required under this item is incorporated by reference to the Company’s definitive proxy statement pursuant to Regulation 14A, which proxy statement will be filed with the Securities and Exchange Commission no later than 120 days after the close of the Company’s fiscal year ended December 31, 2017.
EQUITY COMPENSATION PLAN INFORMATION
Plan category | Number of securities to be issued upon exercise of outstanding options, warrants and rights | Weighted-average exercise price of outstanding options, warrants and rights | Number of securities remaining available for future issuance under equity compensation plans (excluding securities reflected in column (a)) | |||||||
(a) | (b) | (c) | ||||||||
Equity compensation plans approved by security holders | 807,784 | (1) | $ | 26.56 | (3) | 710,326 | ||||
Equity compensation plans not approved by security holders | 300,000 | (2) | 9.53 | (3) | — | |||||
Total | 1,107,784 | $ | 20.56 | 710,326 | ||||||
(1) | Reflects 148,111 stock options and 1,050 restricted stock units granted under the Company’s Amended and Restated 1999 Stock Option and Incentive Plan and 400,316 stock options and 258,307 restricted stock units granted under the Company's 2014 Stock Option and Incentive Plan. |
(2) | Reflects stock options issued as inducement equity awards to our President and CEO on April 9, 2013 and December 2, 2013. These awards were granted pursuant to the inducement award exemption under Section 303A.08 of the NYSE Listed Company Manual. Details of these grants, including vesting terms, are set forth in Note 11, "Share-Based Compensation", of the consolidated financial statements. Reflects 100,000 stock options issued to our Executive VP and CFO on December 2, 2013. These awards were granted pursuant to the inducement award exemption under Section 303A.08 of the NYSE Listed Company Manual. Details of these grants are set forth in Note 11, "Share-Based Compensation", of the consolidated financial statements. |
(3) | The weighted-average exercise price does not take into account the shares issuable upon vesting of outstanding restricted stock units, which have no exercise price. |
35
Item 13. Certain Relationships and Related Transactions, and Director Independence
The information required under this item is incorporated by reference to the Company’s definitive proxy statement pursuant to Regulation 14A, which proxy statement will be filed with the Securities and Exchange Commission no later than 120 days after the close of the Company’s fiscal year ended December 31, 2017.
Item 14. Principal Accounting Fees and Services
The information required under this item is incorporated by reference to the Company’s definitive proxy statement pursuant to Regulation 14A, which proxy statement will be filed with the Securities and Exchange Commission no later than 120 days after the close of the Company’s fiscal year ended December 31, 2017.
Part IV
Item 15. Exhibits, Financial Statement Schedules
(a)(1) Financial Statements
Topic | Page Number |
Report of PricewaterhouseCoopers LLP dated March 1, 2018 on the Company’s financial statements filed as a part hereof for the fiscal years ended December 31, 2017, 2016 and 2015 and on the Company’s internal control over financial reporting as of December 31, 2017 is included in this Annual Report on Form 10-K. The independent registered public accounting firm’s consent with respect to this report appears in Exhibit 23.1 of this Annual Report on Form 10-K.
(a)(2) Financial Statement Schedules
Other than our Allowance for Doubtful Accounts Rollforward included in Schedule II Valuation and Qualifying Accounts, all other schedules are omitted because they are not applicable or not required, or because the required information is included either in the consolidated financial statements or in the notes thereto.
(a)(3) Exhibits
Unless otherwise indicated, references to exhibits in the table below being incorporated by reference are made in each case with respect to filings of the Company, SEC File No. 001-14962.
Exhibit | ||
No. | Description and Location | |
Share Purchase Agreement, dated April 15, 2015, between the Company and affiliates and Schroedahl-ARAPP Spezialarmaturen GmbH & Co. KG and affiliates, incorporated herein by reference to Exhibit 2.1 to the Company’s Form 8-K filed with the SEC on April 15, 2015 | ||
Agreement and Plan of Merger dated October 12, 2016 by and among the Company, Downstream Holding, LLC, Downstream Acquisition LLC, and Sun Downstream, LP., incorporated herein by reference to Exhibit 2.1 to the Company’s Form 8-K filed with the SEC on October 14, 2016 | ||
36
Purchase Agreement, dated as of September 24, 2017, by and between Colfax Corporation and the Company, incorporated herein by reference to Exhibit 2.1 to the Company's Form 8-K filed with the SEC on September 25, 2017 | ||
3 | Articles of Incorporation and By-Laws: | |
Amended and Restated Certificate of Incorporation of the Company, incorporated herein by reference to Exhibit 3.1 to the Company’s Form 10-Q, filed with the SEC on October 29, 2009 | ||
Amended and Restated By-Laws, as amended, of the Company, incorporated herein by reference to Exhibit 3.1 to the Company’s Form 10-Q, filed with the SEC on October 31, 2013 | ||
10 | Material Contracts: | |
Credit Agreement among the Company, as borrower, certain subsidiaries of the Company as guarantors, the lenders from time to time parties thereto, Suntrust Bank as administrative agent, swing line lender and letter of credit issuer, Suntrust Robinson Humphrey, Inc. as joint-lead arranger and joint-bookrunner, Keybank Capital Markets Inc., as joint-lead arranger and joint-bookrunner, Keybank National Association as syndication agent, and Santander Bank, N.A., Branch Banking and Trust Company and HSBC Bank USA, N.A., as co-documentation agents, dated July 31, 2014, incorporated herein by reference to Exhibit 10.1 to the Company’s Form 10-Q, filed with the SEC on August 1, 2014 | ||
Credit Agreement, dated as of May 11, 2017, among the Company, as borrower, certain subsidiaries of the Company, as guarantors, the lenders from time to time party thereto and Sun Trust Bank, as administrative agent, swing line lender and a letter of credit issuer, incorporated herein by reference to Exhibit 10.01 to the Company's Form 8-K, filed with the SEC on May 17, 2017 | ||
Credit Agreement, dated as of December 11, 2017, by and among the Company, as borrower, certain subsidiaries of the Company, as guarantors, the lenders from time to time party thereto, Deutsche Bank AG New York Branch, as term loan administrative agent and collateral agent, SunTrust Bank, as revolver administrative agent, swing line lender and a letter of credit issuer, Deutsche Bank Securities Inc. and SunTrust Robinson Humphrey, Inc., as joint-lead arrangers and joint-bookrunners, and Citizens Bank, N.A. and HSBC Securities (USA) Inc. as co-managers incorporated herein by reference to Exhibit 10.2 to the Company's Form 8-K, filed with the SEC on December 12, 2017 | ||
CIRCOR International, Inc. Amended and Restated 1999 Stock Option and Incentive Plan (as amended, the “1999 Stock Option and Incentive Plan ”), incorporated herein by reference to Exhibit 4.4 to the Company’s Form S-8, File No. 333-125237, filed with the SEC on May 25, 2005 | ||
First Amendment to the 1999 Stock Option and Incentive Plan, dated as of December 1, 2005, incorporated herein by reference to Exhibit 10.1 to the Company’s Form 8-K, filed with the SEC on December 7, 2005 | ||
Second Amendment to the 1999 Stock Option and Incentive Plan, dated as of February 12, 2014 | ||
Form of Non-Qualified Stock Option Agreement for Employees (Three Year Cliff Vesting) under the 1999 Stock Option and Incentive Plan , incorporated herein by reference to Exhibit 10.1 to the Company’s Form 10-Q, filed with the SEC on May 10, 2010 | ||
CIRCOR International, Inc. Amended and Restated Management Stock Purchase Plan dated as of January 1, 2017 | ||
Form of Indemnification Agreement entered into by the Company and its directors and certain of its officers incorporated herein by reference to Exhibit 10.12 to the Company’s Form 10-K, filed with the SEC on March 12, 2003 | ||
Executive Change of Control Agreement between CIRCOR, Inc. and Arjun Sharma, dated September 1, 2009, incorporated herein by reference to Exhibit 10.2 to the Company’s Form 10-Q, filed with the SEC on October 29, 2009 | ||
Amendment to Executive Change of Control Agreement between CIRCOR, Inc. and Arjun Sharma, dated November 4, 2010, incorporated by reference to Exhibit 10.8 to the Company’s Form 8-K, filed with the SEC on November 5, 2010 | ||
Restricted Stock Unit Agreement, dated as of April 9, 2013, between the Company and Scott A Buckhout incorporated herein by reference to Exhibit 10.1 to the Company’s Form 8-K, filed with the SEC on April 15, 2013 | ||
Performance-Based Restricted Stock Unit Agreement, dated as of April 9, 2013, between the Company and Scott A Buckhout, incorporated herein by reference to Exhibit 10.2 to the Company’s Form 8-K, filed with the SEC on April 15, 2013 | ||
Stock Option Inducement Award Agreement, dated as of April 9, 2013, between the Company and Scott A Buckhout, incorporated herein by reference to Exhibit 10.3 to the Company’s Form 8-K, filed with the SEC on April 15, 2013 | ||
Severance Agreement, dated as of April 9, 2013, between the Company and Scott A Buckhout, incorporated herein by reference to Exhibit 10.4 to the Company’s Form 8-K, filed with the SEC on April 15, 2013 | ||
37
Amended Performance-Based Restricted Stock Unit Agreement, dated as of April 9, 2013, between the Company and Scott A. Buckhout, incorporated by reference to Exhibit 10.1 to the Company’s Form 10-Q, filed with the SEC on April 28, 2015 | ||
Executive Change of Control Agreement, dated as of April 9, 2013, between the Company and Scott A Buckhout, incorporated herein by reference to Exhibit 10.5 to the Company’s Form 8-K, filed with the SEC on April 15, 2013 | ||
Performance-Based Stock Option Award Agreement, dated as of March 5, 2014, between the Company and Scott A. Buckhout, incorporated herein by reference to Exhibit 10.1 to the Company’s Form 8-K, filed with the SEC on March 11, 2014 | ||
CIRCOR International, Inc. 2014 Stock Option and Incentive Plan incorporated herein by reference to Exhibit A to the Company’s Definitive Proxy Statement, filed with the SEC on March 21, 2014 (the "2014 Stock Option and Incentive Plan") | ||
First Amendment to 2014 Stock Option and Incentive Plan, dated December 31, 2014, incorporated herein by reference to Exhibit 10.36 to the Company’s Form 10-K, filed with the SEC on February 18, 2015 | ||
Executive Change of Control Agreement, dated as of March 5, 2015, between the Company and Erik Wiik, incorporated by reference to Exhibit 10.2 to the Company’s Form 10-Q, filed with the SEC on April 28, 2015 | ||
Executive Change of Control Agreement, dated as of June 10, 2015, between the Company and Andrew Farnsworth, incorporated herein by reference to the Company’s Form 10-Q filed with the SEC on July 29, 2015 | ||
Executive Change of Control Agreement, dated as of January 8, 2016, between the Company and David Mullen, incorporated herein by reference to the Company’s Form 10-K filed with the SEC on February 23, 2016 | ||
Inducement Restricted Stock Unit Agreement, dated as of December 2, 2013, between the Company and Rajeev Bhalla, incorporated herein by reference to Exhibit 10.35 to the Company’s Form 10-K, filed with the SEC on February 27, 2014 | ||
Stock Option Inducement Award Agreement, dated as of December 2, 2013, between the Company and Rajeev Bhalla, incorporated herein by reference to Exhibit 10.36 to the Company’s Form 10-K, filed with the SEC on February 27, 2014 | ||
Severance Agreement, dated as of December 2, 2013, between the Company and Rajeev Bhalla, incorporated herein by reference to Exhibit 10.37 to the Company’s Form 10-K, filed with the SEC on February 27, 2014 | ||
Executive Change of Control Agreement, dated as of December 2, 2013, between the Company and Rajeev Bhalla, incorporated herein by reference to Exhibit 10.38 to the Company’s Form 10-K, filed with the SEC on February 27, 2014 | ||
Form of Performance-Based Restricted Stock Unit Agreement For Employees and Directors under the 1999 Stock Option and Incentive Plan, incorporated herein by reference to Exhibit 10.29 of the Company's Form 10-K, filed with the SEC on February 21, 2017 | ||
Form of Restricted Stock Unit Agreement For Employees and Directors under the 1999 Stock Option and Incentive Plan, incorporate herein by reference to Exhibit 10.30 of the Company's Form 10-K, filed with the SEC on February 21, 2017 | ||
Form of Restricted Stock Unit Agreement For Directors under the 2014 Stock Option and Incentive Plan, incorporated herein by reference to Exhibit 10.31 of the Company's Form 10-K, filed with the SEC on February 21, 2017 | ||
Form of Performance-Based Restricted Stock Unit Agreement For Employees and Directors under the 2014 Stock Option and Incentive Plan, incorporated herein by reference to Exhibit 10.32 of the Company's Form 10-K, filed with the SEC on February 21, 2017 | ||
Form of Management Stock Purchase Plan Restricted Stock Unit Agreement For Employees and Directors under the 2014 Stock Option and Incentive Plan, incorporated herein by reference to Exhibit 10.33 of the Company's Form 10-K, filed with the SEC on February 21, 2017 | ||
Form of Non-Qualified Stock Option Agreement for Employees under the 2014 Stock Option and Incentive Plan, incorporated herein by reference to Exhibit 10.34 of the Company's Form 10-K, filed with the SEC on February 21, 2017 | ||
Form of Restricted Stock Unit Agreement For Employees under the 2014 Stock Option and Incentive Plan, incorporated herein by reference to Exhibit 10.35 of the Company's Form 10-K, filed with the SEC on February 21, 2017 | ||
Executive Change of Control Agreement, dated as of November 7, 2016, between the Company and Jennifer H. Allen, incorporated herein by reference to Exhibit 10.36 of the Company's Form 10-K, filed with the SEC on February 21, 2017 | ||
Executive Change of Control Agreement, dated as of 2016, between the Company and Sumit Mehrotra, incorporated herein by reference to Exhibit 10.37 of the Company's Form 10-K, filed with the SEC on February 21, 2017 | ||
38
Severance Agreement, dated as of December 9, 2016, between the Company and Jennifer H. Allen, incorporated herein by reference to Exhibit 10.38 of the Company's Form 10-K, filed with the SEC on February 21, 2017 | ||
Severance Agreement, dated as of December 9, 2016, between the Company and Sumit Mehrotra, incorporated herein by reference to Exhibit 10.39 of the Company's Form 10-K, filed with the SEC on February 21, 2017 | ||
Stock Option Inducement Award Agreement, dated as of April 9, 2013, between the Company and Scott A. Buckhout, incorporated herein by reference to Exhibit 10.3 to the Company’s Form 8-K, filed with the SEC on April 15, 2013 | ||
Stockholder Agreement, dated December 11, 2017, between the Company and Colfax Corporation, incorporated herein by reference to Exhibit 10.1 to the Company's Form 8-K, filed with the SEC on December 12, 2017 | ||
Severance Agreement, dated as of April 21, 2017, between the Company and Arjun Sharma, incorporated herein by reference to Exhibit 10.1 to the Company's Form 10-Q, filed with the SEC on April 28, 2017 | ||
Severance Agreement, dated as of April 25, 2017, between the Company and Erik Wiik, incorporated herein by reference to Exhibit 10.2 to the Company's Form 10-Q, filed with the SEC on April 28, 2017 | ||
Schedule of Subsidiaries of CIRCOR International, Inc. | ||
Consent of PricewaterhouseCoopers LLP, Independent Registered Public Accounting Firm | ||
Certification of Chief Executive Officer Pursuant to Section 302 of the Sarbanes-Oxley Act of 2002 | ||
Certification of Chief Financial Officer Pursuant to Section 302 of the Sarbanes-Oxley Act of 2002 | ||
Certification of Chief Executive Officer and Chief Financial Officer pursuant to 18 U.S.C. Section 1350, as adopted pursuant to Section 906 of the Sarbanes-Oxley Act of 2002 | ||
101 | The following financial statements from CIRCOR International, Inc.’s Annual Report on Form 10-K for the year ended December 31, 2017, as filed with the SEC on February 28, 2018, formatted in XBRL (eXtensible Business Reporting Language), as follows: | |
(i) | Consolidated Balance Sheets as of December 31, 2017 and 2016 | |
(ii) | Consolidated Statements of Income for the years ended December 31, 2017, 2016 and 2015 | |
(iii) | Consolidated Statements of Comprehensive (Loss) Income for the years ended December 31, 2017, 2016 and 2015 | |
(iv) | Consolidated Statements of Cash Flows for the years ended December 31, 2017, 2016 and 2015 | |
(v) | Consolidated Statements of Shareholders’ Equity for the years ended December 31, 2017, 2016 and 2015 | |
(vi) | Notes to the Consolidated Financial Statements | |
* | The Company hereby agrees to provide the Commission, upon request, copies of any omitted exhibits or schedules to this exhibit required by Item 601(b)(2) of Regulation S-K. |
** | Filed with this report. |
*** | Furnished with this report. |
§ | Indicates management contract or compensatory plan or arrangement. |
Item 16. Form 10-K Summary
Not applicable.
39
SIGNATURES
Pursuant to the requirements of Section 13 or 15(d) of the Securities Exchange Act of 1934, the registrant has duly caused this report to be signed on its behalf by the undersigned, thereunto duly authorized.
CIRCOR INTERNATIONAL, INC. | ||
By: | /s/ Scott A. Buckhout | |
Scott A. Buckhout President and Chief Executive Officer | ||
Date: | March 1, 2018 | |
Pursuant to the requirements of the Securities Exchange Act of 1934, this report has been signed below by the following persons on behalf of the registrant and in the capacities and on the dates indicated.
Signature | Title | Date |
/s/ Scott A. Buckhout | President and Chief Executive Officer (Principal Executive Officer) | March 1, 2018 |
Scott A. Buckhout | ||
/s/ Rajeev Bhalla | Executive Vice President, Chief Financial Officer (Principal Financial Officer) | March 1, 2018 |
Rajeev Bhalla | ||
/s/ David F. Mullen | Vice President and Corporate Controller (Principal Accounting Officer) | March 1, 2018 |
David F. Mullen | ||
/s/ David F. Dietz | Chairman of the Board of Directors | March 1, 2018 |
David F. Dietz | ||
/s/ Tina M. Donikowski | Director | March 1, 2018 |
Tina M. Donikowski | ||
/s/ Helmuth Ludwig | Director | March 1, 2018 |
Helmuth Ludwig | ||
/s/ Douglas M. Hayes | Director | March 1, 2018 |
Douglas M. Hayes | ||
Director | March 1, 2018 | |
John A. O’Donnell | ||
/s/ Peter M. Wilver | Director | March 1, 2018 |
Peter M. Wilver | ||
40
Report of Independent Registered Public Accounting Firm
To the Board of Directors and Shareholders of CIRCOR International, Inc.
Opinions on the Financial Statements and Internal Control over Financial Reporting
We have audited the accompanying consolidated balance sheets of CIRCOR International, Inc. and its subsidiaries as of December 31, 2017 and 2016, and the related consolidated statements of income, comprehensive (loss) income, shareholders’ equity and cash flows for each of the three years in the period ended December 31, 2017, including the related notes and financial statement schedule listed in the index appearing under Item 15(a)(2) (collectively referred to as the “consolidated financial statements”). We also have audited the Company's internal control over financial reporting as of December 31, 2017, based on criteria established in Internal Control - Integrated Framework (2013) issued by the Committee of Sponsoring Organizations of the Treadway Commission (COSO).
In our opinion, the consolidated financial statements referred to above present fairly, in all material respects, the financial position of the Company as of December 31, 2017 and 2016, and the results of their operations and their cash flows for each of the three years in the period ended December 31, 2017 in conformity with accounting principles generally accepted in the United States of America. Also in our opinion, the Company maintained, in all material respects, effective internal control over financial reporting as of December 31, 2017, based on criteria established in Internal Control - Integrated Framework (2013) issued by the COSO.
Basis for Opinions
The Company's management is responsible for these consolidated financial statements, for maintaining effective internal control over financial reporting, and for its assessment of the effectiveness of internal control over financial reporting, included in Management’s Report on Internal Control over Financial Reporting appearing under Item 9A. Our responsibility is to express opinions on the Company’s consolidated financial statements and on the Company's internal control over financial reporting based on our audits. We are a public accounting firm registered with the Public Company Accounting Oversight Board (United States) ("PCAOB") and are required to be independent with respect to the Company in accordance with the U.S. federal securities laws and the applicable rules and regulations of the Securities and Exchange Commission and the PCAOB.
We conducted our audits in accordance with the standards of the PCAOB. Those standards require that we plan and perform the audits to obtain reasonable assurance about whether the consolidated financial statements are free of material misstatement, whether due to error or fraud, and whether effective internal control over financial reporting was maintained in all material respects.
Our audits of the consolidated financial statements included performing procedures to assess the risks of material misstatement of the consolidated financial statements, whether due to error or fraud, and performing procedures that respond to those risks. Such procedures included examining, on a test basis, evidence regarding the amounts and disclosures in the consolidated financial statements. Our audits also included evaluating the accounting principles used and significant estimates made by management, as well as evaluating the overall presentation of the consolidated financial statements. Our audit of internal control over financial reporting included obtaining an understanding of internal control over financial reporting, assessing the risk that a material weakness exists, and testing and evaluating the design and operating effectiveness of internal control based on the assessed risk. Our audits also included performing such other procedures as we considered necessary in the circumstances. We believe that our audits provide a reasonable basis for our opinions.
As described in Management’s Report on Internal Control over Financial Reporting, management has excluded the Fluid Handling business from its assessment of internal control over financial reporting as of December 31, 2017 because it was acquired by the Company in a purchase business combination during 2017. We have also excluded the Fluid Handling business from our audit of internal control over financial reporting. The Fluid Handling business’ total assets and total revenues excluded from management’s assessment and our audit of internal control over financial reporting represent approximately 21% and 6%, respectively, of the related consolidated financial statement amounts as of and for the year ended December 31, 2017.
Definition and Limitations of Internal Control over Financial Reporting
A company’s internal control over financial reporting is a process designed to provide reasonable assurance regarding the reliability of financial reporting and the preparation of financial statements for external purposes in accordance with generally
41
accepted accounting principles. A company’s internal control over financial reporting includes those policies and procedures that (i) pertain to the maintenance of records that, in reasonable detail, accurately and fairly reflect the transactions and dispositions of the assets of the company; (ii) provide reasonable assurance that transactions are recorded as necessary to permit preparation of financial statements in accordance with generally accepted accounting principles, and that receipts and expenditures of the company are being made only in accordance with authorizations of management and directors of the company; and (iii) provide reasonable assurance regarding prevention or timely detection of unauthorized acquisition, use, or disposition of the company’s assets that could have a material effect on the financial statements.
Because of its inherent limitations, internal control over financial reporting may not prevent or detect misstatements. Also, projections of any evaluation of effectiveness to future periods are subject to the risk that controls may become inadequate because of changes in conditions, or that the degree of compliance with the policies or procedures may deteriorate.
/s/ PricewaterhouseCoopers LLP
Boston, Massachusetts
March 1, 2018
We have served as the Company’s auditor since 2015.
42
CIRCOR INTERNATIONAL, INC.
Consolidated Balance Sheets
(in thousands, except share and per share data)
December 31, | |||||||
2017 | 2016 | ||||||
ASSETS | |||||||
CURRENT ASSETS: | |||||||
Cash and cash equivalents | $ | 110,356 | $ | 58,279 | |||
Trade accounts receivable, less allowance for doubtful accounts of $4,791 and $5,056, respectively | 223,922 | 133,046 | |||||
Inventories | 244,896 | 149,584 | |||||
Prepaid expenses and other current assets | 59,219 | 29,557 | |||||
Total Current Assets | 638,393 | 370,466 | |||||
PROPERTY, PLANT AND EQUIPMENT, NET | 217,539 | 99,713 | |||||
OTHER ASSETS: | |||||||
Goodwill | 505,762 | 206,659 | |||||
Intangibles, net | 513,364 | 135,778 | |||||
Deferred income taxes | 22,334 | 4,824 | |||||
Other assets | 9,407 | 3,316 | |||||
TOTAL ASSETS | $ | 1,906,799 | $ | 820,756 | |||
LIABILITIES AND SHAREHOLDERS’ EQUITY | |||||||
CURRENT LIABILITIES: | |||||||
Accounts payable | $ | 117,329 | $ | 46,767 | |||
Accrued expenses and other current liabilities | 170,454 | 50,707 | |||||
Accrued compensation and benefits | 34,734 | 20,249 | |||||
Total Current Liabilities | 322,517 | 117,723 | |||||
LONG-TERM DEBT | 787,343 | 251,200 | |||||
DEFERRED INCOME TAXES | 26,122 | 13,657 | |||||
PENSION LIABILITY, NET | 150,719 | 13,131 | |||||
OTHER NON-CURRENT LIABILITIES | 18,124 | 20,635 | |||||
COMMITMENTS AND CONTINGENCIES (NOTE 14) | |||||||
SHAREHOLDERS’ EQUITY: | |||||||
Preferred stock, $0.01 par value; 1,000,000 shares authorized; no shares issued and outstanding | — | — | |||||
Common stock, $0.01 par value; 29,000,000 shares authorized; 19,785,298 and 16,445,363 shares issued and outstanding at December 31, 2017 and 2016, respectively | 212 | 178 | |||||
Additional paid-in capital | 438,721 | 289,423 | |||||
Retained earnings | 274,243 | 265,543 | |||||
Common treasury stock, at cost (1,372,488 shares at December 31, 2017 and 2016) | (74,472 | ) | (74,472 | ) | |||
Accumulated other comprehensive loss | (36,730 | ) | (76,262 | ) | |||
Total Shareholders’ Equity | 601,974 | 404,410 | |||||
TOTAL LIABILITIES AND SHAREHOLDERS’ EQUITY | $ | 1,906,799 | $ | 820,756 | |||
The accompanying notes are an integral part of these consolidated financial statements.
43
CIRCOR INTERNATIONAL, INC.
Consolidated Statements of Income
(in thousands, except per share data)
Year Ended December 31, | |||||||||||
2017 | 2016 | 2015 | |||||||||
Net revenues | $ | 661,710 | $ | 590,259 | $ | 656,267 | |||||
Cost of revenues | 460,890 | 407,144 | 456,935 | ||||||||
GROSS PROFIT | 200,820 | 183,115 | 199,332 | ||||||||
Selling, general and administrative expenses | 166,201 | 154,818 | 156,302 | ||||||||
Impairment charges | — | 208 | 2,502 | ||||||||
Special and restructuring charges, net | 14,051 | 17,171 | 14,354 | ||||||||
OPERATING INCOME | 20,568 | 10,918 | 26,174 | ||||||||
Other expense (income): | |||||||||||
Interest expense, net | 10,777 | 3,310 | 2,844 | ||||||||
Other (income) expense, net | 3,678 | (2,072 | ) | 902 | |||||||
TOTAL OTHER EXPENSE, NET | 14,455 | 1,238 | 3,746 | ||||||||
INCOME BEFORE INCOME TAXES | 6,113 | 9,680 | 22,428 | ||||||||
(Benefit from) Provision for income taxes | (5,676 | ) | (421 | ) | 12,565 | ||||||
NET INCOME | $ | 11,789 | $ | 10,101 | $ | 9,863 | |||||
Earnings per common share: | |||||||||||
Basic | $ | 0.71 | $ | 0.62 | $ | 0.59 | |||||
Diluted | $ | 0.70 | $ | 0.61 | $ | 0.58 | |||||
Weighted average common shares outstanding: | |||||||||||
Basic | 16,674 | 16,418 | 16,850 | ||||||||
Diluted | 16,849 | 16,536 | 16,913 | ||||||||
Dividends paid per common share | $ | 0.15 | $ | 0.15 | $ | 0.15 | |||||
The accompanying notes are an integral part of these consolidated financial statements.
44
CIRCOR INTERNATIONAL, INC.
Consolidated Statements of Comprehensive Income (Loss)
(in thousands)
Year Ended December 31, | |||||||||||
2017 | 2016 | 2015 | |||||||||
Net income | $ | 11,789 | $ | 10,101 | $ | 9,863 | |||||
Other comprehensive income (loss): | |||||||||||
Foreign currency translation adjustments | 34,119 | (14,866 | ) | (31,775 | ) | ||||||
Other net changes in post-retirement liabilities and assets - recognized actuarial gains (1) | 4,877 | 1,441 | 262 | ||||||||
Net periodic pension costs amortization (2) | 535 | 3,152 | (529 | ) | |||||||
Other comprehensive income (loss) | 39,531 | (10,273 | ) | (32,042 | ) | ||||||
COMPREHENSIVE (LOSS) INCOME | $ | 51,320 | $ | (172 | ) | $ | (22,179 | ) | |||
(1) | Net of an income tax effect of $1.8 million, $0.8 million, and $(4.2) million for the years ended December 31, 2017, 2016 and 2015, respectively. |
(2) | Net of an income tax effect of $0.5 million, $(0.2) million, and $(0.2) million for the years ended December 31, 2017, 2016 and 2015, respectively. |
The accompanying notes are an integral part of these consolidated financial statements.
45
CIRCOR INTERNATIONAL, INC. Consolidated Statements of Cash Flows | |||||||||||
(in thousands) | Year Ended December 31, | ||||||||||
2017 | 2016 | 2015 | |||||||||
OPERATING ACTIVITIES | |||||||||||
Net income | $ | 11,789 | $ | 10,101 | $ | 9,863 | |||||
Adjustments to reconcile net income to net cash provided by operating activities: | |||||||||||
Depreciation | 15,290 | 13,304 | 14,254 | ||||||||
Amortization | 14,747 | 12,316 | 9,681 | ||||||||
Provision for bad debt expense | 810 | 2,330 | 2,561 | ||||||||
Loss on write down of inventory and amortization of fair value step-up | 7,337 | 9,297 | 15,404 | ||||||||
Impairment charges | — | 208 | 2,502 | ||||||||
Compensation expense of share-based plans | 3,807 | 5,545 | 6,579 | ||||||||
Debt extinguishment | 1,810 | — | — | ||||||||
Change in fair value of contingent consideration | (12,200 | ) | — | — | |||||||
Amortization of debt issuance costs | 759 | — | — | ||||||||
Tax effect of share-based plan compensation | — | 145 | (134 | ) | |||||||
Pension settlement charge | — | 4,457 | — | ||||||||
Deferred income tax expense (benefit) | (8,434 | ) | (10,737 | ) | 781 | ||||||
Loss on disposal of property, plant and equipment | 360 | 3,708 | 305 | ||||||||
Loss (Gain) on sale of businesses | 5,300 | — | (1,044 | ) | |||||||
Changes in operating assets and liabilities, net of effects of acquisitions and divestitures: | |||||||||||
Trade accounts receivable | (5,734 | ) | 18,536 | 20,393 | |||||||
Inventories | (19,494 | ) | 36,092 | (14,446 | ) | ||||||
Prepaid expenses and other assets | (8,578 | ) | 2,454 | (4,786 | ) | ||||||
Accounts payable, accrued expenses and other liabilities | 2,068 | (48,357 | ) | (34,771 | ) | ||||||
Net cash provided by operating activities | 9,637 | 59,399 | 27,142 | ||||||||
INVESTING ACTIVITIES | |||||||||||
Purchases of property, plant and equipment | (14,541 | ) | (14,692 | ) | (12,711 | ) | |||||
Proceeds from the sale of property, plant and equipment | 934 | 1,700 | 2,209 | ||||||||
Proceeds from divestitures | — | — | 2,759 | ||||||||
Business acquisitions, net of cash acquired | (488,517 | ) | (197,489 | ) | (79,983 | ) | |||||
Net cash used in investing activities | (502,124 | ) | (210,481 | ) | (87,726 | ) | |||||
FINANCING ACTIVITIES | |||||||||||
Proceeds from long-term debt | 1,090,883 | 323,200 | 261,394 | ||||||||
Payments of long-term debt | (523,183 | ) | (162,540 | ) | (182,004 | ) | |||||
Debt issuance costs | (30,366 | ) | — | — | |||||||
Dividends paid | (2,506 | ) | (2,497 | ) | (2,559 | ) | |||||
Proceeds from the exercise of stock options | 740 | 246 | 258 | ||||||||
Tax effect of share-based plan compensation | — | (145 | ) | 134 | |||||||
Sales (purchases) of treasury stock | — | 500 | (74,972 | ) | |||||||
Net cash provided by financing activities | 535,568 | 158,764 | 2,251 | ||||||||
Effect of exchange rate changes on cash and cash equivalents | 8,996 | (3,944 | ) | (8,498 | ) | ||||||
INCREASE (DECREASE) IN CASH AND CASH EQUIVALENTS | 52,077 | 3,738 | (66,831 | ) | |||||||
Cash and cash equivalents at beginning of year | 58,279 | 54,541 | 121,372 | ||||||||
CASH AND CASH EQUIVALENTS AT END OF YEAR | $ | 110,356 | $ | 58,279 | $ | 54,541 | |||||
Cash paid during the year for: | |||||||||||
Income taxes | $ | 9,984 | $ | 10,650 | $ | 15,049 | |||||
Interest | $ | 6,778 | $ | 2,908 | $ | 1,992 | |||||
Non-cash supplemental information: | |||||||||||
Share issuance for business acquisition | $ | 143,767 | $ | — | $ | — | |||||
Accrued purchase price | $ | 4,824 | $ | — | $ | — | |||||
Payable to seller related to cash balances | $ | 65,314 | $ | — | $ | — | |||||
46
CIRCOR INTERNATIONAL, INC.
Consolidated Statements of Shareholders’ Equity
(in thousands)
Common Stock | Additional Paid-in Capital | Retained Earnings | Accumulated Other Comprehensive (Loss) Income | Treasury Stock | Total Shareholders’ Equity | ||||||||||||||||||||||
Shares | Amount | ||||||||||||||||||||||||||
BALANCE AT DECEMBER 31, 2014 | 17,682 | $ | 177 | $ | 277,227 | $ | 250,635 | $ | (33,946 | ) | $ | — | $ | 494,093 | |||||||||||||
Net income | 9,863 | 9,863 | |||||||||||||||||||||||||
Other comprehensive loss, net of tax | (32,042 | ) | (32,042 | ) | |||||||||||||||||||||||
Common stock dividends declared | (2,559 | ) | (2,559 | ) | |||||||||||||||||||||||
Stock options exercised | 8 | — | 258 | 258 | |||||||||||||||||||||||
Tax effect of share-based plan compensation | 134 | 134 | |||||||||||||||||||||||||
Conversion of restricted stock units | 56 | — | (577 | ) | (577 | ) | |||||||||||||||||||||
Share-based plan compensation | 6,579 | 6,579 | |||||||||||||||||||||||||
Repurchase of common stock | (1,382 | ) | (74,972 | ) | (74,972 | ) | |||||||||||||||||||||
BALANCE AT DECEMBER 31, 2015 | 16,364 | $ | 177 | $ | 283,621 | $ | 257,939 | $ | (65,988 | ) | $ | (74,972 | ) | $ | 400,777 | ||||||||||||
Net income | 10,101 | 10,101 | |||||||||||||||||||||||||
Other comprehensive loss, net of tax | (10,273 | ) | (10,273 | ) | |||||||||||||||||||||||
Common stock dividends declared | (2,497 | ) | (2,497 | ) | |||||||||||||||||||||||
Stock options exercised | 6 | 245 | 245 | ||||||||||||||||||||||||
Tax effect of share-based plan compensation | (145 | ) | (145 | ) | |||||||||||||||||||||||
Conversion of restricted stock units | 66 | 1 | 156 | 157 | |||||||||||||||||||||||
Share-based plan compensation | 5,545 | 5,545 | |||||||||||||||||||||||||
Sales of common stock | 9 | 500 | 500 | ||||||||||||||||||||||||
BALANCE AT DECEMBER 31, 2016 | 16,445 | $ | 178 | $ | 289,422 | $ | 265,543 | $ | (76,261 | ) | $ | (74,472 | ) | $ | 404,410 | ||||||||||||
Net income | 11,789 | 11,789 | |||||||||||||||||||||||||
Cumulative effect adjustment related to the adoption of share-based compensation standard (ASU 2016-09) | 755 | (582 | ) | 173 | |||||||||||||||||||||||
Other comprehensive income, net of tax | 39,531 | 39,531 | |||||||||||||||||||||||||
Common stock dividends declared | (2,507 | ) | (2,507 | ) | |||||||||||||||||||||||
Stock options exercised | 18 | 707 | 707 | ||||||||||||||||||||||||
Conversion of restricted stock units | 39 | 1 | 296 | 297 | |||||||||||||||||||||||
Share-based plan compensation | 3,807 | 3,807 | |||||||||||||||||||||||||
Issuance of common stock to acquire a business | 3,283 | 33 | 143,734 | — | 143,767 | ||||||||||||||||||||||
BALANCE AT DECEMBER 31, 2017 | 19,785 | 212 | $ | 438,721 | $ | 274,243 | $ | (36,730 | ) | $ | (74,472 | ) | $ | 601,974 | |||||||||||||
The accompanying notes are an integral part of these consolidated financial statements.
47
CIRCOR INTERNATIONAL, INC.
Notes to Consolidated Financial Statements
(1) Description of Business
CIRCOR International, Inc. (“CIRCOR” or the “Company” or “we”) designs, manufactures and distributes a broad array of flow and motion control products and certain services to a variety of end-markets for use in a wide range of applications to optimize the efficiency and/or ensure the safety of flow control systems. We have a global presence and operate major manufacturing facilities in North America, Western Europe, Morocco, and India.
As of December 31, 2017, we organized our business segment reporting structure into three segments: CIRCOR Energy ("Energy"), CIRCOR Advanced Flow Solutions ("Advanced Flow Solutions" or "AFS") and CIRCOR Fluid Handling ("Fluid Handling"). Refer to Note 17, Business Segment and Geographical Information, for further information about our segments.
(2) Summary of Significant Accounting Policies
Principles of Consolidation and Basis of Presentation
The consolidated financial statements include the accounts of CIRCOR and its subsidiaries. The results of companies acquired during the year are included in the consolidated financial statements from the date of acquisition. All significant intercompany balances and transactions have been eliminated in consolidation. Certain reclassifications have been made to prior period amounts to conform to the current period financial statement presentation. These reclassifications have no effect on the previously reported net income.
Use of Estimates
The preparation of these financial statements in conformity with generally accepted accounting principles ("GAAP") requires management to make estimates and assumptions that affect the amounts reported in the consolidated financial statements and accompanying disclosures. Some of the more significant estimates relate to acquisition accounting, estimated total costs for ongoing long-term contracts accounted for under the percentage of completion method, inventory valuation, share-based compensation, amortization and impairment of long-lived assets, pension benefits obligations, income taxes, penalty accruals for late shipments, asset valuations, and product warranties. While management believes that the estimates and assumptions used in the preparation of the financial statements are appropriate, actual results could differ materially from those estimates.
Revenue Recognition and Accounts Receivable Allowances
Revenue is primarily recognized when title and risk of loss have passed to the customer, persuasive evidence of an arrangement exists, no significant post delivery obligations remain, the price to the buyers is fixed or determinable and collection of the resulting receivable is reasonably assured. Revenues and costs on certain long-term capital contracts are recognized on the percentage-of-completion method measured on the basis of costs incurred to estimated total costs for each contract. This method is used because management considers it to be the best available measure of progress towards completion on these contracts. Revenues and costs on contracts are subject to change in estimate throughout the duration of the contracts, and any required adjustments are made in the period in which a change in estimate becomes known. Estimated losses on contracts in progress are recognized in the period in which a loss becomes known. Unbilled receivables for net revenues recognized in excess of the amounts billed for active projects are recognized within other current assets on the balance sheet.
The Company provides for the estimated costs to fulfill customer warranty obligations upon the recognition of the related revenue. Shipping and handling costs invoiced to customers are recorded as components of revenues and the associated costs are recorded as cost of revenues. We recognize revenue net of sales returns, rebates, penalties, and discounts. Accounts receivable allowances include sales returns and bad debt allowances. The Company monitors and tracks the amount of product returns and reduces revenue at the time of shipment for the estimated amount of such future returns, based on historical experience. The Company makes estimates evaluating its allowance for doubtful accounts. The Company continuously monitors collections and payments from its customers and maintains a provision for estimated credit losses based upon its historical experience and any specific customer collection issues that it has identified. Account balances are charged off against the allowance when the company believes it is probable the receivable will not be recovered.
48
Cost of Revenue
Cost of revenue primarily reflects the costs of manufacturing and preparing products for sale and, to a much lesser extent, the costs of performing services. Cost of revenue is primarily comprised of the cost of materials, outside processing, inbound freight, production, direct labor and overhead including indirect labor, which are expenses that directly result from the level of production activity at the manufacturing plant. Additional expenses that directly result from the level of production activity at the manufacturing plant include: purchasing and receiving costs, inspection costs, warehousing costs, internal transfer costs, utility expenses, property taxes, amortization of inventory step-up from revaluation at the date of acquisition, depreciation of production building and equipment assets, warranty costs, salaries and benefits paid to plant manufacturing management and maintenance supplies.
Inventories
Inventories are stated at the lower of cost or net realizable value. Cost is generally determined on the first-in, first-out (“FIFO”) basis. Where appropriate, standard cost systems are utilized for purposes of determining cost; the standards are adjusted as necessary to ensure they approximate actual cost. We typically analyze our inventory aging and projected future usage on a quarterly basis to assess the adequacy of our inventory allowance, which primarily consist of obsolescence and net realizable value estimates. These estimates are measured on an item-by-item basis determined based on the difference between the cost of the inventory and estimated market value. The provision for inventory allowance is a component of our cost of revenues. Assumptions about future demand are among the primary factors utilized to estimate market value. At the point of the loss recognition, a new, lower-cost basis for that inventory is established, and subsequent changes in facts and circumstances do not result in the restoration or increase in that newly established cost basis.
Our inventory balance was $245 million as of December 31, 2017, compared to $150 million as of December 31, 2016. Our inventory allowances, which include amounts primarily for obsolescence and net realizable value estimates was $24 million as of December 31, 2017, compared to $24 million as of December 31, 2016. Our inventory balance as of December 31, 2017 includes a $8.5 million inventory fair value step up related to the Fluid Handling acquisition.
If there were to be a sudden and significant decrease in demand for our products, significant price reductions, or if there were a higher incidence of inventory obsolescence for any reason, including a change in technology or customer requirements, we could be required to increase our inventory allowances and our gross profit could be adversely affected.
Penalty Accruals
Certain customer agreements, primarily in our long-cycle project related businesses and large aerospace programs, contain late shipment penalty clauses whereby we are contractually obligated to pay consideration to our customers if we do not meet specified shipment dates. The accrual for estimated penalties is shown as a reduction of revenue and is based on several factors including historical customer settlement experience and management’s assessment of specific shipment delay information. Accruals related to these potential late shipment penalties as of December 31, 2017 and 2016 were $2 million and $5 million, respectively. As we conclude performance under these agreements, the actual amount of consideration paid to our customers may vary from the amounts we currently have accrued.
Business Acquisitions
We account for business combinations under the acquisition method, and accordingly, the assets and liabilities of the acquired businesses are recorded at their estimated fair value on the acquisition date with the excess of the purchase price over their estimated fair value recorded as goodwill. We determine acquisition related asset and liability fair values through established valuation techniques for industrial manufacturing companies and utilize third party valuation firms to assist in the valuation of certain tangible and intangible assets.
The consideration for our acquisitions may include future payments that are contingent upon the occurrence of a particular event. For acquisitions that qualify as business combinations, we record an obligation for such contingent payments at fair value on the acquisition date. We estimate the fair value of contingent consideration obligations through valuation models that incorporate probability adjusted assumptions related to the achievement of the milestones and thus likelihood of making related payments or by using a Monte Carlo simulation model. We revalue these contingent consideration obligations each reporting period. Changes in the fair value of our contingent consideration obligations are recognized within general and administrative expense in our consolidated statements of income.
49
Accounting Standards Codification ("ASC") Topic 805, Business Combinations, provides guidance regarding business combinations and requires acquisition-date fair value measurement of identifiable assets acquired, liabilities assumed, and non-controlling interests in the acquiree. For additional information, refer to Note 3, Business Acquisitions.
Legal Contingencies
We are currently involved in various legal claims and legal proceedings, some of which may involve substantial dollar amounts. Periodically, we review the status of each significant matter and assess our potential financial exposure. If the potential loss from any claim or legal proceeding is considered probable and the amount can be estimated, we accrue a liability for the estimated loss. The determination of probability and the determination as to whether an exposure can be reasonably estimated requires management estimates. Because of uncertainties related to these matters, accruals are based on the best information available at the time. As additional information becomes available, we reassess the potential liability related to our pending claims and litigation and may revise our estimates. Such revisions in the estimates of the potential liabilities could have a material adverse effect on our business, results of operations and financial position.
For more information related to our outstanding legal proceedings, see Note 14, Contingencies, Commitments and Guarantees.
Goodwill
Goodwill is measured as the excess of the cost of acquisition over the sum of the amounts assigned to identifiable tangible and intangible assets acquired less liabilities assumed. For goodwill, we perform an impairment assessment at the reporting unit level on an annual basis as of the end of our October month end or more frequently if circumstances warrant. Our annual impairment assessment requires a comparison of the fair value of each of our reporting units to the respective carrying value. If the fair value of a reporting unit exceeds its carrying amount, goodwill of the reporting unit is considered not impaired. If the carrying value of a reporting unit is greater than its fair value, an impairment loss will be recognized in an amount equal to that excess, limited to the total amount of goodwill allocated to that reporting unit. Additionally, we will consider the income tax effect from any tax deductible goodwill on the carrying amount of the reporting unit when measuring the goodwill impairment loss.
Determining the fair value of a reporting unit is subjective and requires the use of significant estimates and assumptions. With the assistance of an independent third-party appraisal firm, we estimate the fair value of our reporting units using an income approach based on the present value of future cash flows. We believe this approach yields the most appropriate evidence of fair value. We also utilize the comparable company multiples method and market transaction fair value method to validate the fair value amount we obtain using the income approach. The key assumptions utilized in our discounted cash flow model include our estimates of future cash flows from operating activities offset by estimated capital expenditures of the reporting unit, the estimated terminal value for each reporting unit, a discount rate based on a weighted average cost of capital, and overall economic conditions. Any unfavorable material changes to these key assumptions could potentially impact our fair value determinations. As such, we may experience fluctuations in revenues and operating results resulting in the non-achievement of our estimated growth rates, operating performance and working capital estimates utilized in our discounted cash flow models.
For more information related to our Goodwill, see Note 7, Goodwill and Other Intangible Assets.
Indefinite-Lived Intangible Assets
For intangible assets with indefinite lives, we perform an impairment assessment at the asset level on an annual basis as of the end of our October month end or more frequently if circumstances warrant. Indefinite-lived intangible assets, such as trade names, are generally recorded and valued in connection with a business acquisition. These assets are reviewed at least annually for impairment, or more frequently if facts and circumstances warrant. We also utilized a fair value calculation to evaluate these intangibles. Determining the fair value is subjective and requires the use of significant estimates and assumptions. With the assistance of an independent third-party appraisal firm, we estimate the fair value using an income approach based on the present value of future cash flows. We note the fair value of each individual indefinite-lived asset exceeded the respective carrying amount, and no intangible impairments were recorded.
For more information related to our Intangible Assets, see Note 7, Goodwill and Other Intangible Assets.
50
Other Long-Lived Assets
In accordance with ASC 360, Plant, Property, and Equipment, we perform impairment analyses of our long-lived assets, such as property, plant and equipment, whenever events and circumstances indicate that they may be impaired. When the undiscounted future cash flows are expected to be less than the carrying value of identified asset groupings being reviewed for impairment, the asset groupings are written down to fair value.
See Note 6, Property, Plant and Equipment, for further information on impairment of other long-lived assets.
Post Retirement Benefits
Pensions and other post-retirement benefits obligations and net periodic benefit costs are actuarially determined and are affected by several assumptions including the discount rate, mortality, and the expected long-term return on plan assets. Changes in the assumptions and differences from actual results will affect the amounts of net periodic benefit cost recognized in future periods. These assumptions may also have an effect on the amount and timing of future cash contributions.
As required in the recognition and disclosure provisions of ASC Topic 715, Compensation - Retirement Benefits, the Company recognizes the over-funded or under-funded status of defined benefit post-retirement plans in its balance sheet, measured as the difference between the fair value of plan assets and the benefit obligations (the projected benefit obligation for pension plans and the accumulated post-retirement benefit obligation for other post-retirement plans). The change in the funded status is the net of the recognized net periodic benefit cost, cash contributions to the trust/benefits paid directly by CIRCOR and recognized changes in other comprehensive income. Other comprehensive income changes are due to new actuarial gains and losses and new plan amendments and the amortizations of amounts in the net periodic benefit cost.
Unrecognized actuarial gains and losses in excess of the 10% corridor (defined as the threshold above which gains or losses need to be amortized) are being recognized for all plans over the weighted average expected remaining life of the employee group. Unrecognized actuarial gains and losses arise from several factors including experience and assumption changes in the benefit obligations and from the difference between expected returns and actual returns on plan assets.
Income Taxes
Income taxes are accounted for under the asset and liability method. Deferred tax assets and liabilities are recognized for the future tax consequences attributable to differences between the financial statement carrying amounts of existing assets and liabilities and their respective tax bases and operating loss and tax credit carry-forwards. Deferred tax assets and liabilities are measured using enacted tax rates expected to apply to taxable income in the years in which those temporary differences are expected to be recovered or settled. The effect on deferred tax assets and liabilities of a change in tax rates is recognized in income in the period that includes the enactment date. A valuation allowance is recognized if we anticipate that it is more likely than not that we may not realize some or all of a deferred tax asset.
In accordance with the provisions of ASC Topic 740, Income Taxes, the Company initially recognizes the financial statement effect of a tax position when, based solely on its technical merits, it is more likely than not (a likelihood of greater than fifty percent) that the position will be sustained upon examination by the relevant taxing authority. Those tax positions failing to qualify for initial recognition are recognized in the first interim period in which they meet the more likely than not standard, are resolved through negotiation or litigation with the taxing authority, or upon expiration of the statute of limitations. De-recognition of a tax position that was previously recognized occurs when an entity subsequently determines that a tax position no longer meets the more likely than not threshold of being sustained.
If future results of operations exceed our current expectations, our existing tax valuation allowances may be adjusted, resulting in future tax benefits. Alternatively, if future results of operations are less than expected, future assessments may result in a determination that some or all of the deferred tax assets are not realizable. Consequently, we may need to establish additional tax valuation allowances for a portion or all of the gross deferred tax assets, which may have a material adverse effect on our results of operations.
Under ASC Topic 740, only the portion of the liability that is expected to be paid within one year is classified as a current liability. As a result, liabilities expected to be resolved without the payment of cash (e.g., due to the expiration of the statute of limitations) or are not expected to be paid within one year are classified as non-current. It is the Company’s policy to record estimated interest and penalties as income tax expense and tax credits as a reduction in income tax expense.
For more information related to our Income Taxes, see Note 8, Income Taxes.
51
Share-Based Compensation
Share-based compensation costs are based on the grant date fair value estimated in accordance with the provisions of ASC 718, Accounting for Share Based Payments, and these costs are recognized over the requisite vesting period. The Black-Scholes option pricing model is used to estimate the fair value of each stock option at the date of grant excluding the 2013 and 2014 CEO and CFO stock option awards which are valued using the Monte Carlo option pricing model as these are market condition awards. Black-Scholes utilizes assumptions related to volatility, the risk-free interest rate, the dividend yield and employee exercise behavior. Expected volatilities utilized in the model are based on the historic volatility of the Company’s stock price. The risk-free interest rate is derived from the U.S. Treasury Yield curve in effect at the time of the grant. The model incorporates exercise and post-vesting forfeiture assumptions based on an analysis of historical data.
Market condition stock option awards include both a service period and a market performance vesting condition. The stock options vest if certain stock price targets are met based on the stock price closing at or above the target for 60 consecutive trading days. Vested options may be exercised 25% at the time of vesting, 50% one year from the date of vesting and 100% two years from the date of vesting. These market condition stock option awards are being expensed utilizing a graded method and are subject to forfeiture in the event of employment termination (whether voluntary or involuntary) prior to vesting. To the extent that the market conditions above (stock price targets) are not met, those options will not vest and will forfeit 5 years from grant date. The Company used a Monte Carlo simulation option pricing model to value these option awards.
See Note 11, Share-Based Compensation, for further information on share-based compensation.
Environmental Compliance and Remediation
Environmental expenditures that relate to current operations are expensed or capitalized as appropriate. Expenditures that relate to existing conditions caused by past operations, which do not contribute to current or future revenue generation, are expensed. Expenditures that meet the criteria of "Regulated Operations" are capitalized. Liabilities are recorded when environmental assessments and/or remedial efforts are probable and the costs can be reasonably estimated. In accordance with ASC 450, Contingencies, estimated costs are based upon current laws and regulations, existing technology and the most probable method of remediation.
Foreign Currency
Our international subsidiaries operate and report their financial results using local functional currencies. Accordingly, all assets, liabilities, revenues and costs of these subsidiaries are translated into United States dollars using exchange rates in effect at the end of the relevant periods. The resulting translation adjustments are presented as a separate component of other comprehensive income. We do not provide for U.S. income taxes on foreign currency translation adjustments since we do not provide for such taxes on undistributed earnings of foreign subsidiaries.
Our net foreign exchange losses / (gains) recorded for the years ended December 31, 2017, 2016 and 2015 were $2.1 million, $2.1 million, and $0.8 million, respectively and are included in other (income) expense in the consolidated statements of income. See Note 16, Fair Value, for additional information on foreign currency exchange risk.
Earnings Per Common Share
Basic earnings per common share are calculated by dividing net income by the number of weighted average common shares outstanding. Diluted earnings per common share is calculated by dividing net income by the weighted average common shares outstanding and assumes the conversion of all dilutive securities when the effects of such conversion would not be anti-dilutive.
Earnings per common share and the weighted average number of shares used to compute net earnings per common share, basic and assuming full dilution, are reconciled below (in thousands, except per share data):
52
Year Ended December 31, | ||||||||||||||||||||||||||||||||
2017 | 2016 | 2015 | ||||||||||||||||||||||||||||||
Net Income | Shares | Per Share Amount | Net Income | Shares | Per Share Amount | Net Income | Shares | Per Share Amount | ||||||||||||||||||||||||
Basic EPS | $ | 11,789 | 16,674 | $ | 0.71 | $ | 10,101 | 16,418 | $ | 0.62 | $ | 9,863 | 16,850 | $ | 0.59 | |||||||||||||||||
Dilutive securities, principally common stock options | 175 | (0.01 | ) | 118 | (0.01 | ) | 63 | (0.01 | ) | |||||||||||||||||||||||
Diluted EPS | $ | 11,789 | 16,849 | $ | 0.70 | $ | 10,101 | 16,536 | $ | 0.61 | $ | 9,863 | 16,913 | $ | 0.58 | |||||||||||||||||
Certain stock options to purchase common shares and restricted stock units ("RSUs") were anti-dilutive. There were 252,001 anti-dilutive stock options and RSUs for the year ended December 31, 2017 with exercise prices ranging from $51.84 to $71.56. There were 36,281 anti-dilutive stock options and RSUs for the year ended December 31, 2016 with exercise prices ranging from $70.42 to $79.33. There were 297,915 anti-dilutive stock options and RSUs for the year ended December 31, 2015 with exercise prices ranging from $41.17 to $79.33.
As of December 31, 2017, there were 2,876 outstanding RSUs that contain rights to nonforfeitable dividend equivalents and are considered participating securities that are included in our computation of basic and fully diluted earnings per share.
Cash and Cash Equivalents
Our cash equivalents are invested in time deposits of financial institutions. We have established guidelines relative to credit ratings, diversification and maturities that are intended to maintain safety and liquidity. Cash equivalents include highly liquid investments with maturity periods of three months or less when purchased. We currently have $64.5 million of cash which is owed back to Colfax as part of the acquisition. This amount is included within our cash and cash equivalents and other current liabilities within the consolidated balance sheet.
Other Assets
Other assets in the accompanying consolidated balance sheets include deferred debt issuance costs associated with our revolving credit facility, tax receivable and other certain assets.
Fair Value
ASC Topic 820, Fair Value Measurement, defines fair value and includes a framework for measuring fair value and disclosing fair value measurements in financial statements. Fair value is a market-based measurement rather than an entity-specific measurement. The fair value hierarchy makes a distinction between assumptions developed based on market data obtained from independent sources (observable inputs) and the reporting entity’s own assumptions (unobservable inputs). This fair value hierarchy gives the highest priority to quoted prices in active markets for identical assets or liabilities (Level 1) and the lowest priority to unobservable inputs (Level 3). We utilize fair value measurements for forward currency contracts, guarantee and indemnification obligations, certain pension plan assets, and certain intangible assets. Certain pension plan asset investments are measured at fair value using the net asset value per share (or its equivalent) practical expedient (the “NAV”).
See Note 16, Fair Value, for additional information on fair value.
Derivative Financial Instruments
The Company is exposed to certain risks relating to its ongoing business operations including foreign currency exchange rate risk and interest rate risk. The Company currently uses derivative instruments to manage foreign currency risk on certain business transactions denominated in foreign currencies. To the extent the underlying transactions hedged are completed, these forward contracts do not subject us to significant risk from exchange rate movements because they offset gains and losses on the related foreign currency denominated transactions. These forward contracts do not qualify as hedging instruments and, therefore, do not qualify for fair value or cash flow hedge treatment. GAAP requires all derivatives, whether designated in a hedging relationship or not, to be recorded on the balance sheet at fair value. Any unrealized gains and losses on our contracts are recognized as a component of other expense in our consolidated statements of income.
See Note 16, Fair Value, for additional information on derivative financial instruments.
53
Property, Plant and Equipment
Property, plant and equipment are recorded at cost. Depreciation is generally provided on a straight-line basis over the estimated useful lives of the assets, which typically range from 3 to 40 years for buildings and improvements, 3 to 10 years for manufacturing machinery and equipment, computer equipment and software, and furniture and fixtures. Motor vehicles are depreciated over a range of 2 to 6 years. Leasehold improvements are amortized on a straight-line basis over the shorter of the lease term or estimated useful life of the asset. Repairs and maintenance costs are expensed as incurred.
The Company reports depreciation of property, plant and equipment in cost of revenue and selling, general and administrative expenses based on the nature of the underlying assets. Depreciation primarily related to equipment used in the production of inventory is recorded in cost of revenue. Depreciation related to selling and administrative functions is reported in selling, general and administrative expenses.
See Note 6, Property, Plant and Equipment for additional information.
Research and Development
Research and development expenditures, including certain engineering costs, are expensed when incurred and are included in selling, general and administrative expenses. Our research and development expenditures for the years ended December 31, 2017, 2016 and 2015 were $5.5 million, $5.9 million and $5.9 million, respectively.
New Accounting Standards
Adopted
In January 2017, the FASB issued ASU No. 2017-04, “Intangibles—Goodwill and Other (Topic 350)”. The ASU modifies the measurement of a goodwill impairment loss from the portion of the carrying amount of goodwill that exceeds its implied fair value to the excess of the carrying amount of a reporting unit that exceeds its fair value. This eliminates step 2 of the goodwill impairment test under current guidance. The ASU will be applied prospectively for annual or interim goodwill impairment tests in fiscal years beginning after December 15, 2019. Early adoption is permitted for interim or annual goodwill impairment tests performed after January 1, 2017. The Company early adopted this standard in connection with the 2017 goodwill impairment test.
Not yet Adopted
On May 10, 2017, the Financial Accounting Standards Board ("FASB") issued Accounting Standard Update ("ASU") 2017-09, Compensation—Stock Compensation (Topic 718): Scope of Modification Accounting, which clarifies when to account for a change to the terms or conditions of a share-based payment award as a modification. Under the new guidance, modification accounting is required only if the fair value, the vesting conditions, or the classification of the award changes as a result of the change in terms or conditions. The amendments in this ASU also clarify that no new measurement date will be required if an award is not probable of vesting at the time a change is made and there is no change to the fair value, vesting conditions, and classification. The amendments in this ASU are effective for public business entities for annual periods beginning after December 15, 2018, including interim periods within those annual periods. We intend to adopt the standard prospectively and have not yet determined its impact on our consolidated financial statements.
In March 2017, the FASB issued ASU 2017-07, Compensation—Retirement Benefits (Topic 715), which improves the consistency, transparency, and usefulness of the service cost and net benefit cost financial information components. The amendments in this ASU amend presentation requirements of service cost and other components of net benefit cost in the income statement. In addition, the ASU allows only the service cost component of net benefit cost to be eligible for capitalization. The amendments in this ASU are effective for public business entities for annual periods beginning after December 15, 2018, including interim periods within those annual periods. We have not yet determined its impact on our consolidated financial statements.
In January 2017, the FASB issued ASU 2017-01, Business Combinations (Topic 805): Clarifying the Definition of a Business. ASU 2017-01 provides further clarification of the definition of a business with the objective to assist entities with evaluating whether transactions should be accounted for as acquisitions (or disposals) of assets versus businesses. The amendments in ASU 2017-01 provide criteria to determine when a set of assets and activities is not a business. ASU 2017-01 is effective for fiscal years, and interim periods within those fiscal years, beginning after December 15, 2017. The adoption of ASU 2017-01 is not expected to have a material impact on our consolidated financial statements.
54
In March 2016, the FASB issued ASU 2016-02, Leases. ASU 2016-02 outlines a model for lessees by recognizing all lease-related assets and liabilities on the balance sheet. The amendments in this ASU are effective for fiscal years beginning after December 15, 2018 and interim periods within those fiscal years. Early application is permitted for all entities. ASU 2016-02 requires a modified retrospective approach for all leases existing at, or entered into after, the date of initial application, with an option to elect to use certain transition relief. We are still evaluating the requirements of ASU 2016-02 to determine the impact it will have on our consolidated financial statements but expect the standard to have a material impact on our assets and liabilities for the addition of right-of-use assets with corresponding lease liabilities. We intend to adopt this new standard on January 1, 2019.
In May 2014, the FASB issued ASU 2014-09, Revenue from Contracts with Customers. ASU 2014-09 provides for a single comprehensive model to use in accounting for revenue arising from contracts with customers and will replace most existing revenue recognition guidance in Generally Accepted Accounting Principles ("GAAP") when it becomes effective. ASU 2014-09 is effective for fiscal years and interim periods within those years, beginning after December 15, 2017. ASU 2014-09 allows for adoption either retrospectively to each prior reporting period presented or retrospectively with the cumulative effect of initially applying the ASU recognized as an adjustment to the opening balance of retained earnings at the date of initial application. Subsequent to the issuance of the ASU 2014-09, the FASB issued additional updates relating to reporting revenue on a gross versus net basis, identifying performance obligations and licensing arrangements, narrow-scope improvements and practical expedients, technical corrections and improvements, and service concession arrangements.
In the first quarter of 2017, we established a cross-functional implementation team including representatives from general management, sales, legal, and finance. We deployed a detailed approach to analyze the impact of the standard on our customer contract portfolio by comparing our current accounting policies and practices to identify potential differences that would result from applying the new standard. In addition, we identified potential changes to our business processes and controls to support recognition and disclosure under the new standard.
In the second and third quarters of 2017, we made progress toward completing our evaluation of the potential changes from adopting the new standard on our future financial reporting and disclosures. Activities performed during the second and third quarters included: reviewing and understanding our customer terms and conditions, drafting a new revenue recognition policy, and training our finance professionals in the new standard.
During the fourth quarter of 2017, we continued to analyze our existing CIRCOR customer contracts and customized product offerings to determine which customer arrangements would require revenue recognition over time, i.e., on a percentage of completion accounting basis. This would be a change to our current revenue recognition model for many of our businesses. Based on our preliminary evaluation, we believe a portion of our large projects business and certain other businesses that provide customized products to U.S. military customers, may require revenue recognition over time under the new standard. In addition, we believe a portion of our long-term capital contracts for refinery valves which are currently recognized on the percentage-of-completion method may require point-in-time revenue recognition under the new standard. We will adopt this new standard on January 1, 2018 using the modified retrospective method. Upon adoption we expect to record a net decrease to retained earnings in the range of $2 million and $8 million relating to historical CIRCOR (excluding FH).
On December 11, 2017, we acquired Fluid Handling (Refer to Note 3, Business Acquisitions, for further information about the Fluid Handling acquisition). We have begun the ASU 2014-09 revenue recognition standard transition assessment as of the date of acquisition, using a similar approach described above. We continue to analyze our contracts under the new standard, especially for those contracts that could require revenue recognition over time, which would be a change to our current revenue recognition model. Based on the status of our current evaluation, we are unable to determine the expected impact of the adoption of the new standard on the Fluid Handling segment at December 31, 2017.
(3) Business Acquisitions
Fluid Handling
On September 24, 2017, CIRCOR entered into a Purchase Agreement (the “Purchase Agreement”) with Colfax Corporation (“Colfax”). Pursuant to the Purchase Agreement, on December 11, 2017, the Company acquired the fluid handling business of Colfax ("FH") for consideration consisting of $542.0 million in cash, 3,283,424 unregistered shares of the Company's common stock, with a fair value of approximately $143.8 million at closing, and the assumption of net pension and post-retirement liabilities of FH. The cash consideration is subject to customary working capital adjustments. The Company financed the cash consideration through a combination of committed debt financing and cash on hand.
55
FH is a leader in the engineering, development‚ manufacturing‚ distribution‚ service and support of fluid handling systems. With a history dating back to 1860‚ FH is a leading supplier of screw pumps for high demand, severe service applications across a range of markets including general industry, commercial marine, defense, and oil & gas. FH leverages differentiated technology, and provides critical aftermarket customer support, to maintain leading positions in high demand niche markets.
The operating results of FH have been included in our consolidated financial statements from the date of acquisition, reported within the Fluid Handling segment. Acquisition-related costs of $13.1 million, which primarily consisted of legal, financial advisory and acquisition transitional services, were expensed as corporate expenses during the year-ended December 31, 2017.
The purchase price allocation is based upon a preliminary valuation of assets and liabilities that was prepared with assistance from a third party valuation specialist. The estimates and assumptions are subject to change as we obtain additional information during the measurement period (up to one year from the acquisition date). The purchase accounting is expected to be finalized in the third quarter of 2018. The assets and liabilities pending finalization include the valuation of acquired tangible and intangible assets, certain operating liabilities, and the evaluation of income taxes. Differences between the preliminary and final valuation could have a material impact on our future results of operations and financial position.
The following table summarizes the preliminary fair value of the assets acquired and the liabilities assumed, at the date of acquisition:
(in thousands) | |||
Cash and cash equivalents (a) | $ | 63,403 | |
Restricted cash (a) | 1,911 | ||
Accounts receivable | 77,970 | ||
Inventory | 79,329 | ||
Prepaid expenses and other current assets | 16,937 | ||
Deferred income taxes | 41,454 | ||
Property, plant and equipment | 115,891 | ||
Identifiable intangible assets | 388,000 | ||
Other assets | 338 | ||
Accounts payable | (46,045 | ) | |
Cash payable to seller (a) | (65,314 | ) | |
Accrued and other expenses | (63,115 | ) | |
Long-term post-retirement liabilities | (143,067 | ) | |
Other long-term liabilities | (11,215 | ) | |
Deferred tax liabilities | (45,933 | ) | |
Total identifiable net assets | $ | 410,544 | |
Goodwill | 293,344 | ||
Total purchase price | $ | 703,888 | |
Consideration | |||
Base purchase price | 542,000 | ||
Net working capital and other purchase accounting adjustments | 18,121 | ||
Common Stock | 143,767 | ||
Total | $ | 703,888 | |
(a) cash acquired to be returned to seller. | |||
The fair value of accounts receivable acquired approximates the contractual value of $78.0 million. The excess of purchase price paid over the fair value of FH's net assets was recorded to goodwill, which is primarily attributable to projected future profitable growth, market penetration, as well as an expanded customer base for the Fluid Handling segment. Approximately 50% of goodwill is projected to be deductible for income tax purposes.
56
The FH acquisition resulted in the preliminary identification of the following identifiable intangible assets:
Intangible assets acquired (in thousands) | Weighted average amortization period (in years) | ||||
Customer relationships | $ | 215,000 | 22 | ||
Existing technologies | 107,000 | 20 | |||
Trade names | 44,000 | Indefinite-life | |||
Backlog | 22,000 | 4 | |||
Total intangible assets | $ | 388,000 | |||
The fair value of the intangible assets was based on variations of the income approach, which estimates fair value based on the present value of cash flows that the assets are expected to generate. These approaches included the relief-from-royalty method and multi-period excess earnings method, depending on the intangible asset being valued. Customer relationships, aftermarket backlog, and existing technology are amortized on a cash flow basis which reflects the economic benefit consumed. The trade name was assigned an indefinite life based on the Company’s intention to keep the trade names for an indefinite period of time. Refer to Note 7, Goodwill and Other Intangible Assets, for future expected amortization to be recorded.
The results of operations of FH have been included in our consolidated financial statements beginning on the acquisition date and reported within the Fluid Handling segment. The results for the year ended December 31, 2017 include $36.5 million of net revenue and a $1.1 million operating loss.
The following unaudited pro forma information presents the combined results of operations as if the acquisition had been completed on January 1, 2016, the beginning of the comparable prior annual reporting period. The unaudited pro forma results include: (i) amortization associated with preliminary estimates for the acquired intangible assets; (ii) interest expense on borrowings in connection with the acquisition; (iii) the associated tax impact on these unaudited pro forma adjustments; and the transaction costs presented in the earliest period (2016).
The unaudited pro forma results do not reflect any cost saving synergies from operating efficiencies or the effect of the incremental costs incurred in integrating the two companies. Accordingly, these unaudited pro forma results are presented for informational purposes only and are not necessarily indicative of what the actual results of operations of the combined company would have been if the acquisition had occurred at the beginning of the period presented, nor are they indicative of future results of operations (in thousands):
(Unaudited) | Year ended December 31, | Year ended December 31, | |||||
2017 | 2016 | ||||||
Net Revenues | $ | 1,098,978 | $ | 1,052,277 | |||
Net Income | $ | (6,475 | ) | $ | (51,288 | ) | |
CFS Acquisition
On October 12, 2016, the Company entered into an Agreement and Plan of Merger (the “Merger Agreement”) by and among the Company, Downstream Holding, LLC, a Delaware limited liability company which does business as Critical Flow Solutions (“Downstream” or “CFS”), Downstream Acquisition LLC, a Delaware limited liability company and subsidiary of the Company, and Sun Downstream, LP, a Delaware limited partnership, to acquire all of the outstanding units of Downstream.
The consideration payable by the Company pursuant to the terms of the Merger Agreement was $195.0 million, subject to (i) up to an additional $15.0 million payable pursuant to an earn-out relating to achievement of a specified order bookings target by the acquired business in the twelve month period ending September 30, 2017, (ii) increase or decrease based on deviation, subject to certain limitations, from a working capital target, (iii) decrease for indebtedness and certain transaction expenses of CFS, (iv) increase for the amount of CFS cash as of the closing, and (v) a potential increase for certain transaction related tax benefits, net of certain adjustments, if and when realized by the Company. The total consideration paid at closing on October 13, 2016 was approximately $198.0 million in cash, net of cash acquired and including amounts paid at closing for estimated adjustments for CFS working capital, the repayment of CFS outstanding indebtedness and payment of certain transaction expenses. The Company funded the purchase price and payments at closing from borrowings under the Company’s existing credit agreement.
57
The estimated fair value of the earn-out, using the Monte Carlo simulation model, was $12.2 million as of the acquisition date and December 31, 2016. The Monte Carlo model calculates the probability of satisfying the target conditions stipulated in the earn-out. Based on actual performance through the earn-out period ending September 30, 2017, the specified order bookings target in the specified timeframe was not achieved, as project bookings shifted out to the future. Accordingly, the actual achievement resulted in an earn-out of zero as of October 1, 2017. The fair value of the earn-out decreased $12.2 million during the year ended December 31, 2017 and was recorded within Special and restructuring charges (recoveries), net as a gain.
The Company received $1.5 million as settlement for working capital adjustments during 2017. This reduction of purchase price was recorded as a reduction of goodwill.
The operating results of CFS have been included in our consolidated financial statements from the date of acquisition and reported within the Energy segment.
The purchase price allocation is based upon a valuation of assets and liabilities that was prepared with assistance from a third party valuation specialist. The assets and liabilities include the valuation of acquired intangible assets, certain operating liabilities, and the evaluation of deferred income taxes. The purchase accounting was finalized during the third quarter of 2017.
The following table summarizes the fair value of the assets acquired and the liabilities assumed, at the date of acquisition:
(in thousands) | |||
Cash and cash equivalents | $ | 6,603 | |
Accounts receivable | 28,128 | ||
Unbilled receivable | 10,786 | ||
Inventory | 18,701 | ||
Prepaid and other current assets | 5,671 | ||
Property, plant and equipment | 21,214 | ||
Identifiable intangible assets | 101,600 | ||
Accounts payable | (11,655 | ) | |
Accrued and other expenses | (8,866 | ) | |
Deferred revenue | (3,997 | ) | |
Deferred income taxes | (40,645 | ) | |
Long term income tax payable | (556 | ) | |
Total identifiable net assets | $ | 126,984 | |
Goodwill | 89,473 | ||
Total purchase price | $ | 216,457 | |
The fair value of accounts receivable acquired approximates the contractual value of $28.1 million. The excess of purchase price paid over the fair value of CFS' net assets was recorded to goodwill, which is primarily attributable to projected future profitable growth, market penetration, as well as an expanded customer base for the Energy segment. Goodwill is not deductible for income tax purposes.
The CFS acquisition resulted in the identification of the following identifiable intangible assets:
Intangible assets acquired (in thousands) | Weighted average amortization period (in years) | ||||
Customer relationships | $ | 49,600 | 14 | ||
Existing technologies | 25,800 | 10 | |||
Trade names | 24,100 | Indefinite | |||
Backlog | 2,100 | 1 | |||
Total intangible assets | $ | 101,600 | |||
The fair value of the intangible assets was based on variations of the income approach, which estimates fair value based on the present value of cash flows that the assets are expected to generate. These approaches included the relief-from-royalty method, incremental cash flow method, multi-period excess earnings method and direct cash flow method, depending on the intangible
58
asset being valued. Customer relationships, aftermarket backlog, and existing technology are amortized on a cash flow basis which reflects the economic benefit consumed. The trade name was assigned an indefinite life based on the Company’s intention to keep the DeltaValve and TapcoEnpro names for an indefinite period of time. Refer to Note 7, Goodwill and Other Intangible Assets, for future expected amortization to be recorded.
(4) Special and Restructuring charges, net
Special and Restructuring Charges, net
Special and restructuring charges, net consist of restructuring costs (including costs to exit a product line or program) as well as certain special charges such as significant litigation settlements and other transactions (charges or recoveries) that are described below. All items described below are recorded in Special and restructuring charges, net on our consolidated statements of income. Certain other special and restructuring charges such as inventory related items may be recorded in cost of revenues given the nature of the item.
The table below (in thousands) summarizes the amounts recorded within the special and restructuring charges, net line item on the consolidated statements of income for the periods ending December 31, 2017, 2016, and 2015:
Special & Restructuring Charges, net | |||||||||||
For the year ended December 31, | |||||||||||
2017 | 2016 | 2015 | |||||||||
Special charges, net | $ | 7,989 | $ | 8,196 | $ | 9,720 | |||||
Restructuring charges, net | 6,063 | 8,975 | 4,634 | ||||||||
Total special and restructuring charges, net | $ | 14,051 | $ | 17,171 | $ | 14,354 | |||||
Special Charges, net
The table below (in thousands) outlines the special charges, net recorded for the year ending December 31, 2017:
Special Charges, net | |||||||||||||||
For the year ended December 31, 2017 | |||||||||||||||
Energy | Advanced Flow Solutions | Corporate | Total | ||||||||||||
Acquisition-related charges | $ | 54 | $ | 12 | $ | 12,995 | $ | 13,061 | |||||||
Brazil closure | 879 | — | — | 879 | |||||||||||
Divestitures | — | 3,748 | 101 | 3,849 | |||||||||||
Contingent consideration revaluation | (12,200 | ) | — | (12,200 | ) | ||||||||||
California Legal Settlement | — | 2,400 | — | 2,400 | |||||||||||
Total special charges, net | $ | (11,267 | ) | $ | 6,160 | $ | 13,096 | $ | 7,989 | ||||||
Acquisition related charges:
• | On December 11, 2017, we acquired FH. In connection with our acquisition, we recorded $13.0 million of acquisition related professional fees and debt extinguishment fees during the twelve months ended December 31, 2017. |
• | On October 12, 2016, we acquired CFS. In connection with our acquisition, we recorded $0.1 million of acquisition related professional fees during the twelve months ended December 31, 2017. |
Brazil Closure: On November 3, 2015, our Board of Directors approved the closure and exit of our Brazil manufacturing operations due to the economic realities in Brazil and the ongoing challenges with our only significant end customer, Petrobras.
CIRCOR Brazil reported substantial operating losses every year since it was acquired in 2011 while the underlying market
conditions and outlook deteriorated. In connection with the closure, we recorded $0.9 million of charges within the Energy segment during the year ended December 31, 2017, which relates to losses incurred subsequent to our closure of manufacturing operations during the first quarter of 2016.
Divestiture: On July 7, 2017, we divested our French non-core aerospace build-to-print business within our Advanced Flow Solutions segment as part of our simplification strategy. We considered this business as non-core because the products or
59
services did not fit our strategy and the long-term profitable growth prospects were below our expectations. Divestiture of this non-core business enables us to focus resources on businesses where there is greater opportunity to achieve sales growth, higher margins, and market leadership. We measured the disposal group at its fair value less cost to sell, which was lower than its carrying value, and recorded a $3.8 million charge during the second quarter of 2017. Also, in connection with this disposition we recorded a $1.5 million of severance included as a restructuring charge.
Contingent Consideration Revaluation: The fair value of the earn-out decreased $12.2 million during the twelve months ended December 31, 2017. The change in fair value during the year ended December 31, 2017 was recorded as a recovery within the special and restructuring charges (recoveries) line on our condensed consolidated statement of income. The actual achievement of the earn-out was zero and the earn-out period expired on September 30, 2017.
California Legal Settlement: We recorded a special charge of $2.4 million during the fourth quarter of 2017 related to settlement of a wage and hour claim in our California Aerospace business. The claim was settled on February 21, 2018. Refer to Note 14, " Contingencies, Commitments and Guarantees" for additional disclosure.
The table below (in thousands) outlines the special charges, net recorded for the year ending December 31, 2016:
Special Charges, net | |||||||||||||||
For the year ended December 31, 2016 | |||||||||||||||
Energy | Advanced Flow Solutions | Corporate | Total | ||||||||||||
Acquisition related charges | — | (161 | ) | 978 | 817 | ||||||||||
Brazil closure | 2,920 | — | 2 | 2,922 | |||||||||||
Pension settlement | — | — | 4,457 | 4,457 | |||||||||||
Total special charges, net | $ | 2,920 | $ | (161 | ) | $ | 5,437 | $ | 8,196 | ||||||
Acquisition related charges (recoveries) are described below:
• | On October 12, 2016, we acquired CFS. In connection with our acquisition, we recorded $1.0 million of acquisition related professional fees for the year ended December 31, 2016. |
• | On April 15, 2015, we acquired Germany-based Schroedahl. In connection with our acquisition of Schroedahl, we recorded a $0.2 million acquisition related professional fees adjusted for the year ended December 31, 2016. |
Brazil Closure: On November 3, 2015 our Board of Directors approved the closure and exit of our Brazil manufacturing operations due to the economic realities in Brazil and the ongoing challenges with our only significant end customer, Petrobras. CIRCOR Brazil reported substantial operating losses every year since it was acquired in 2011 while the underlying market conditions and outlook deteriorated. In connection with the closure, we recorded $2.9 million of charges within the Energy segment during the twelve months ended December 31, 2016, which primarily related to employee termination costs and losses incurred subsequent to our closure of manufacturing operations during the first quarter of 2016.
Pension Settlement: During the third quarter of 2016, management offered a lump sum cash payout option to terminated and vested pension plan participants. In connection with this action, the window for participants who opt to avail themselves of this program closed in the fourth quarter of 2016. During the fourth quarter of 2016, we incurred a settlement charge of $4.5 million recorded within the special and restructuring charges, net line item. Refer to Note 13, Retirement Plans, for additional disclosure.
60
The table below (in thousands) outlines the special charges, net recorded for the year ending December 31, 2015:
Special Charges, net | |||||||||||||||
For the year ended December 31, 2015 | |||||||||||||||
Energy | Advanced Flow Solutions | Corporate | Total | ||||||||||||
Divestitures | (2 | ) | (1,042 | ) | — | (1,044 | ) | ||||||||
Acquisition related charges | — | 919 | — | 919 | |||||||||||
Brazil closure | 8,650 | — | 775 | 9,425 | |||||||||||
Executive retirement charges | — | — | 420 | 420 | |||||||||||
Total special charges, net | $ | 8,648 | $ | (123 | ) | $ | 1,195 | $ | 9,720 | ||||||
Divestiture recoveries: On January 6, 2015, we announced the divestiture of two of our non-core businesses as part of our simplification strategy. The Energy divestiture was substantially completed in the fourth quarter of 2014 with the related charge recorded in 2014. During the first quarter of 2015, the Advanced Flow Solutions divestiture was substantially completed and we recorded a gain of $1.0 million.
Acquisition related charges: In connection with our acquisition of Schroedahl, we recorded $0.9 million of acquisition related professional fees for the year ended December 31, 2015.
Brazil closure: In connection with the closure, we recorded $8.7 million in charges within our Energy segment during the year ended December 31, 2015. These charges related to: the realizability of the value added tax recoverable for $4.4 million as our exit would stop future sales which would be needed to recover these taxes paid, supplier cancellation penalties of $1.6 million as we had fixed purchase commitments which would be canceled, customer cancellation penalties of $1.1 million, litigation claims of $0.5 million that we deemed probable for risk of loss, professional fees of $0.3 million, and other charges of $0.8 million. In addition, during the fourth quarter of 2015, we recorded $0.8 million of professional fees associated with the Brazil matter at Corporate. As of December 31, 2015, our remaining Brazil assets were $7.1 million of which $4.2 million relates to inventory, $1.0 million to accounts receivable, and $1.0 million to cash.
Executive Retirement Charges: During the first quarter of 2015, we recorded charges of $0.4 million associated with the retirement of our Energy President. These charges primarily related to equity award modifications.
Restructuring Charges, net
The tables below (in thousands) outline the charges (or any recoveries) associated with restructuring actions recorded for the year ending December 31, 2017, 2016, and 2015. A description of the restructuring actions is provided in the section titled "Restructuring Programs Summary" below.
Restructuring Charges / (Recoveries) | |||||||||||||||
As of and for the year ended December 31, 2017 | |||||||||||||||
Energy | Advanced Flow Solutions | Corporate | Total | ||||||||||||
Facility related expenses | $ | 2,523 | $ | 443 | $ | — | $ | 2,966 | |||||||
Employee related expenses | 1,035 | 2,062 | — | 3,097 | |||||||||||
Total restructuring charges, net | $ | 3,558 | $ | 2,505 | $ | — | $ | 6,063 | |||||||
Accrued restructuring charges as of December 31, 2016 | $ | 1,618 | |||||||||||||
Total year to date charges, net (shown above) | 6,063 | ||||||||||||||
Charges paid / settled, net | (6,095 | ) | |||||||||||||
Accrued restructuring charges as of December 31, 2017 | $ | 1,586 | |||||||||||||
We expect to make payment or settle the majority of the restructuring charges accrued as of December 31, 2017 during the first first half of 2018.
61
Restructuring Charges / (Recoveries) | ||||||||||||||||
As of and for the year ended December 31, 2016 | ||||||||||||||||
Energy | Advanced Flow Solutions | Corporate | Total | |||||||||||||
Facility related expenses | $ | 792 | $ | 3,701 | $ | — | $ | 4,493 | ||||||||
Employee related expenses | 2,393 | 2,089 | — | 4,482 | ||||||||||||
Total restructuring charges, net | $ | 3,185 | $ | 5,790 | $ | — | $ | 8,975 | ||||||||
Accrued restructuring charges as of December 31, 2015 | $ | 663 | ||||||||||||||
Total year to date charges, net (shown above) | 8,975 | |||||||||||||||
Charges paid / settled, net | (8,020 | ) | ||||||||||||||
Accrued restructuring charges as of December 31, 2016 | 1,618 | $ | 1,618 | |||||||||||||
Restructuring Charges / (Recoveries) | |||||||||||||||
As of and for the year ended December 31, 2015 | |||||||||||||||
Energy | Advanced Flow Solutions | Corporate | Total | ||||||||||||
Facility related expenses | $ | (376 | ) | $ | 257 | $ | — | $ | (119 | ) | |||||
Employee related expenses | 3,279 | 1,474 | — | 4,753 | |||||||||||
Total restructuring charges, net | $ | 2,903 | $ | 1,731 | $ | — | $ | 4,634 | |||||||
Accrued restructuring charges as of December 31, 2014 | $ | 1,645 | |||||||||||||
Total year to date charges, net (shown above) | 4,634 | ||||||||||||||
Charges paid / settled, net | (5,616 | ) | |||||||||||||
Accrued restructuring charges as of December 31, 2015 | $ | 663 | |||||||||||||
Restructuring Programs Summary
As specific restructuring programs are announced, the amounts associated with that particular action may be recorded in periods other than when announced to comply with the applicable accounting rules. For example, total cost associated with 2017 Actions (as discussed below) will be recorded in 2017 and 2018. The amounts shown below reflect the total cost for that restructuring program.
During 2017, we initiated certain restructuring activities, under which we continued to simplify our business ("2017 Actions"). Under these restructurings, we reduced expenses, primarily through reductions in force and closing a number of smaller facilities. Charges with this action were finalized in 2017.
2017 Actions Restructuring Charges (Recoveries), net as of December 31, 2017 | |||||||||||
Energy | Advanced Flow Solutions | Total | |||||||||
Facility related expenses - incurred to date | $ | — | $ | 366 | $ | 366 | |||||
Employee related expenses - incurred to date | 598 | 1,892 | 2,490 | ||||||||
Total restructuring related special charges - incurred to date | $ | 598 | $ | 2,258 | $ | 2,856 | |||||
During 2016, we initiated certain restructuring activities, under which we continued to simplify our business ("2016 Actions").
Under these restructurings, we reduced expenses, primarily through reductions in force and closing a number of smaller
facilities. Charges with this action were finalized in 2017.
62
2016 Actions Restructuring Charges / (Recoveries), net as of December 31, 2017 | |||||||||||
Energy | Advanced Flow Solutions | Total | |||||||||
Facility related expenses - incurred to date | $ | 708 | $ | 94 | $ | 802 | |||||
Employee related expenses - incurred to date | 2,476 | 1,181 | 3,657 | ||||||||
Total restructuring related special charges - incurred to date | $ | 3,184 | $ | 1,275 | $ | 4,459 | |||||
In July 2015, we announced the closure of one of the two Corona, California manufacturing facilities ("California Restructuring"). Under this restructuring, we are reducing certain general, manufacturing and facility related expenses. Charges with this action were finalized in the fourth quarter of 2016.
California Restructuring Charges, net as of December 31, 2017 | |||
Advanced Flow Solutions | |||
Facility related expenses - incurred to date | $ | 3,700 | |
Employee related expenses - incurred to date | 800 | ||
Total restructuring related special charges - incurred to date | $ | 4,500 | |
On February 18, 2015, we announced a restructuring action ("2015 Announced Restructuring"), under which we continued to simplify our businesses. Under this action, we reduced certain general, administrative and manufacturing related expenses primarily personnel related. The following table (in thousands) summarizes the total program costs for the 2015 Announced Restructuring as of December 31, 2016. Charges with this action were finalized in the fourth quarter of 2015.
2015 Announced Restructuring Charges / (Recoveries), net as of December 31, 2017 | |||||||||||||||
Energy | Advanced Flow Solutions | Corporate | Total | ||||||||||||
Facility related expenses - incurred to date | $ | (382 | ) | $ | 257 | $ | — | $ | (125 | ) | |||||
Employee related expenses - incurred to date | 3,425 | 740 | — | 4,165 | |||||||||||
Total restructuring related charges - incurred to date | $ | 3,043 | $ | 997 | $ | — | $ | 4,040 | |||||||
On April 22, 2014, we announced additional restructuring actions ("2014 Announced Restructuring"), under which we continued to simplify our businesses. Under this action, we reduced certain general and administrative expenses, including the reduction of certain management layers, and closing a number of smaller facilities. The following table (in thousands) summarizes the total program costs for the 2014 Announced Restructuring as of December 31, 2016. Charges with this action were finalized in the second quarter of 2015. We do not anticipate any additional restructuring related charges associated with the 2014 Announced Restructuring action.
2014 Announced Restructuring Charges / (Recoveries), net as of December 31, 2017 | |||||||||||||||
Energy | Advanced Flow Solutions | Corporate | Total | ||||||||||||
Facility related expenses - incurred to date | $ | (64 | ) | $ | 95 | $ | — | $ | 31 | ||||||
Employee related expenses - incurred to date | 1,463 | 2,956 | 317 | 4,736 | |||||||||||
Total restructuring related charges - incurred to date | $ | 1,399 | $ | 3,051 | $ | 317 | $ | 4,767 | |||||||
Additional Restructuring Charges
In conjunction with the restructuring actions noted above, we incur certain costs, primarily related to inventory, that are recorded in cost of revenues instead of special and restructuring charges. Such restructuring-related amounts totaled $0.0
63
million, $2.8 million, and $9.4 million for the years ending December 31, 2017, 2016 and 2015, respectively, and are described further below.
During the first and fourth quarters of 2016, in connection with the restructuring of certain structural landing gear product lines, we recorded inventory related charges of less than $0.1 million, and $0.8 million respectively, within the Advanced
Flow Solutions segment.
During the first and second quarters of 2016, we recorded restructuring related inventory $1.9 million and $0.1 million respectively, associated with the closure of manufacturing operations and the exit of the gate, globe and check valves product line in Brazil. As of December 31, 2017, no inventory amounts remain on our balance sheet for the gate, globe, and check valves product line.
During the third and fourth quarters of 2015, we recorded restructuring related inventory charges of $6.4 million and $0.5 million, respectively, associated with the closure of manufacturing operations and the exit of the gate, globe and check valves product line in Brazil.
During the second quarter of 2015, we recorded restructuring related inventory charges of $0.2 million associated with the exit of our Energy segment cable protection product line.
During the second and fourth quarters of 2015, in connection with the restructuring of certain structural landing gear product lines, we recorded inventory related charges of $1.9 million, and $0.4 million, respectively, within the Advanced Flow Solutions segment.
(5) Inventories
Inventories consisted of the following (in thousands):
December 31, | |||||||
2017 | 2016 | ||||||
Raw materials | $ | 82,372 | $ | 54,359 | |||
Work in process | 121,709 | 68,718 | |||||
Finished goods | 40,815 | 26,507 | |||||
Inventories | $ | 244,896 | $ | 149,584 | |||
Inventory of $79.3 million (inclusive of the fair value step up adjustment) was acquired from FH. Refer to Note 3, Business Acquisitions, for further detail.
We regularly review inventory quantities on hand and record a provision to write-down excess and obsolete inventory to its estimated net realizable value, if less than cost, based primarily on our estimated forecast of product demand. Once our inventory value is written-down a new cost basis has been established. For 2017, 2016 and 2015 our charges for slow moving, acquisition inventory step-up amortization, and excess and obsolete inventory totaled $7.3 million, $9.3 million and $15.4 million respectively.
Our provision for inventory obsolescence allowances was $3.0 million, $4.1 million, and $5.2 million for the years ended December 31, 2017, 2016 and 2015, respectively.
64
(6) Property, Plant and Equipment
Property, plant and equipment consisted of the following (in thousands):
December 31, | |||||||
2017 | 2016 | ||||||
Land | $ | 33,428 | $ | 13,082 | |||
Buildings and improvements | 101,016 | 70,979 | |||||
Manufacturing machinery and equipment | 196,939 | 134,149 | |||||
Computer equipment and software | 31,204 | 23,982 | |||||
Furniture and fixtures | 12,526 | 9,930 | |||||
Vehicles | 1,118 | 1,027 | |||||
Construction in progress | 18,787 | 5,699 | |||||
Property, plant and equipment, at cost | 395,018 | 258,848 | |||||
Less: Accumulated depreciation | (177,479 | ) | (159,135 | ) | |||
Property, plant and equipment, at cost, net | $ | 217,539 | $ | 99,713 | |||
Property, plant and equipment, net of $115.9 million (inclusive of the fair value step up adjustment) was acquired from FH. Refer to Note 3, Business Acquisitions, for further detail.
Depreciation expense for the years ended December 31, 2017, 2016, and 2015 was $15.3 million, $13.3 million, and $14.3 million, respectively.
The Company recorded additions to property, plant and equipment of $1.3 million in each of the years ended December 31, 2017 and December 31, 2016, for which cash payments had not yet been made.
(7) Goodwill and Other Intangible Assets
The following table shows goodwill by segment as of December 31, 2017 and 2016 (in thousands):
Energy | Advanced Flow Solutions | Fluid Handling | Consolidated Total | ||||||||||||
Goodwill as of December 31, 2016 | $ | 144,405 | $ | 62,254 | $ | — | $ | 206,659 | |||||||
Business acquisition (1) | (3,756 | ) | — | 293,344 | 289,588 | ||||||||||
Transfers | — | — | — | — | |||||||||||
Currency translation adjustments | 2,709 | 6,224 | 582 | 9,515 | |||||||||||
Goodwill as of December 31, 2017 | $ | 143,358 | $ | 68,478 | $ | 293,926 | $ | 505,762 | |||||||
(1) The activity in the Energy segment relates to settlement of escrow amounts and tax amounts. | |||||||||||||||
Energy | Advanced Flow Solutions | Consolidated Total | |||||||||
Goodwill as of December 31, 2015 | $ | 43,687 | $ | 71,765 | $ | 115,452 | |||||
Business acquisition | 93,228 | 197 | 93,425 | ||||||||
Transfers (1) | 8,285 | (8,285 | ) | — | |||||||
Currency translation adjustments | (795 | ) | (1,423 | ) | (2,218 | ) | |||||
Goodwill as of December 31, 2016 | $ | 144,405 | $ | 62,254 | $ | 206,659 | |||||
(1) In connection with our organizational realignment during the fourth quarter of 2016, certain goodwill amounts transferred from Energy to Advanced Flow Solutions. | |||||||||||
65
No goodwill impairments were recorded during the twelve months ended December 31, 2017 or 2016. Historical accumulated impairments for Energy and Advance Flow Solutions segments were $0.4 million and $0.3 million, respectively for both periods ended December 31, 2017 and 2016.
The tables below present gross intangible assets and the related accumulated amortization (in thousands):
December 31, 2017 | |||||||||||||||
Gross Carrying Amount | Impairment Charges | Accumulated Amortization | Net Carrying Value | ||||||||||||
Patents | $ | 5,399 | $ | (5,399 | ) | $ | — | ||||||||
Non-amortized intangibles (primarily trademarks and tradenames) | 83,872 | — | — | 83,872 | |||||||||||
Customer relationships | 320,015 | — | (41,471 | ) | 278,544 | ||||||||||
Order backlog | 29,650 | — | (8,850 | ) | 20,800 | ||||||||||
Acquired technology | 135,360 | — | (5,687 | ) | 129,673 | ||||||||||
Other | 5,372 | — | (4,897 | ) | 475 | ||||||||||
Total | $ | 579,668 | $ | — | $ | (66,304 | ) | $ | 513,364 | ||||||
December 31, 2016 | |||||||||||||||
Gross Carrying Amount | Impairment Charges | Accumulated Amortization | Net Carrying Value | ||||||||||||
Patents | $ | 5,399 | $ | (208 | ) | $ | (5,176 | ) | $ | 15 | |||||
Non-amortized intangibles (primarily trademarks and tradenames) | 38,235 | — | — | 38,235 | |||||||||||
Customer relationships | 99,769 | — | (30,100 | ) | 69,669 | ||||||||||
Order backlog | 6,955 | — | (6,336 | ) | 619 | ||||||||||
Acquired technology | 28,044 | — | (1,512 | ) | 26,532 | ||||||||||
Other | 5,095 | — | (4,386 | ) | 709 | ||||||||||
Total | $ | 183,497 | $ | (208 | ) | $ | (47,510 | ) | $ | 135,779 | |||||
The table below presents estimated future amortization expense for intangible assets recorded as of December 31, 2017 (in thousands):
2018 | 2019 | 2020 | 2021 | 2022 | After 2023 | ||||||||||||||||||
Estimated amortization expense | $ | 50,246 | $ | 48,585 | $ | 45,254 | $ | 43,173 | $ | 38,214 | $ | 204,020 | |||||||||||
The annual impairment testing of our non-amortized intangible assets was completed as of October 31, 2017 and consisted of a comparison of the fair value of the intangible assets with carrying amounts. No impairments of our non-amortized intangible assets were recorded for the year ended December 31, 2017.
During the year ended December 31, 2016, we recorded a $0.2 million impairment charge for a China patent deemed to no longer have economic value. The impairment charge is included in the impairment charge line on our consolidated statement of income. During the third quarter of 2015, we discontinued use of our Brazil indefinite-lived trademark as it was determined to have no future economic life. As such, we recorded a $0.5 million impairment charge during the year ended December 31, 2015.
66
(8) Income Taxes
The significant components of our deferred income tax liabilities and assets were as follows (in thousands):
December 31, | |||||||
2017 | 2016 | ||||||
Deferred income tax liabilities: | |||||||
Excess tax over book depreciation | $ | 17,505 | $ | 11,210 | |||
Other | 8,507 | 4,650 | |||||
Intangible assets | 57,968 | 42,837 | |||||
Total deferred income tax liabilities | 83,980 | 58,697 | |||||
Deferred income tax assets: | |||||||
Accrued expenses | 6,956 | 8,146 | |||||
Equity compensation | 4,622 | 6,461 | |||||
Inventories | 8,405 | 9,323 | |||||
Net operating loss and state credit carry-forward | 16,698 | 3,974 | |||||
Foreign tax credit carryforward | 16,602 | 18,177 | |||||
Pension benefit obligation | 46,030 | 5,262 | |||||
Other | 2,946 | 1,549 | |||||
Total deferred income tax assets | 102,259 | 52,892 | |||||
Valuation allowance | (22,067 | ) | (3,028 | ) | |||
Deferred income tax asset, net of valuation allowance | 80,192 | 49,864 | |||||
Deferred income tax (liability)/asset, net | $ | (3,788 | ) | $ | (8,833 | ) | |
The deferred income taxes by classification were as follows:
December 31, | |||||||
2017 | 2016 | ||||||
Long-term deferred income tax asset, net | $ | 22,334 | $ | 4,824 | |||
Long-term deferred income tax liability, net | (26,122 | ) | (13,657 | ) | |||
Deferred income tax (liability)/asset, net | $ | (3,788 | ) | $ | (8,833 | ) | |
67
The (benefit from) provision for income taxes is based on the following pre-tax income (in thousands):
Year Ended December 31, | |||||||||||
2017 | 2016 | 2015 | |||||||||
Domestic | $ | 4,946 | $ | (16,766 | ) | $ | 12,965 | ||||
Foreign | 1,167 | 26,446 | 9,463 | ||||||||
Income before income taxes | $ | 6,113 | $ | 9,680 | $ | 22,428 | |||||
The provision for income taxes consisted of the following (in thousands):
Year Ended December 31, | |||||||||||
2017 | 2016 | 2015 | |||||||||
Current provision: | |||||||||||
Federal - U.S. | $ | (447 | ) | $ | (232 | ) | $ | 705 | |||
Foreign | 2,762 | 10,823 | 11,023 | ||||||||
State -U.S. | 442 | (275 | ) | 56 | |||||||
Total current | $ | 2,757 | $ | 10,316 | $ | 11,784 | |||||
Deferred provision (benefit): | |||||||||||
Federal - U.S. | $ | (3,406 | ) | $ | (8,992 | ) | $ | 2,618 | |||
Foreign | (4,640 | ) | (3,328 | ) | (887 | ) | |||||
State -U.S. | (388 | ) | 1,583 | (950 | ) | ||||||
Total (benefit) deferred | $ | (8,434 | ) | $ | (10,737 | ) | $ | 781 | |||
Total (benefit) provision for income taxes | $ | (5,676 | ) | $ | (421 | ) | $ | 12,565 | |||
Actual income taxes reported from operations were different from those that would have been computed by applying the federal statutory tax rate to income before income taxes. The expense for income taxes differed from the U.S. statutory rate due to the following:
Year Ended December 31, | ||||||||
2017 | 2016 | 2015 | ||||||
Expected federal income tax rate | 35.0 | % | 35.0 | % | 35.0 | % | ||
State income taxes, net of federal tax benefit | 0.3 | (4.8 | ) | (0.7 | ) | |||
Change in state tax rate | — | — | 3.5 | |||||
Change in valuation allowance on state net operating losses | — | 18.9 | (7.3 | ) | ||||
Foreign tax rate differential | (38.9 | ) | (38.4 | ) | (18.9 | ) | ||
Unbenefited foreign losses | 2.9 | 14.7 | 41.4 | |||||
Foreign tax credits | — | (26.6 | ) | — | ||||
Manufacturing deduction | (2.8 | ) | — | (1.6 | ) | |||
Research and development credit | (8.4 | ) | (6.6 | ) | (1.1 | ) | ||
Foreign audit settlement | — | — | 6.0 | |||||
Transaction costs | 8.5 | 3.1 | (0.5 | ) | ||||
Release of contingent consideration | (69.9 | ) | — | — | ||||
Provisional Impact of Tax Cuts and Jobs Act | (8.2 | ) | — | — | ||||
Change in tax reserves | (16.3 | ) | (0.5 | ) | 0.7 | |||
Other, net | 4.9 | 0.8 | (0.5 | ) | ||||
Effective tax rate | (92.9 | )% | (4.4 | )% | 56.0 | % | ||
As of December 31, 2017 and 2016, the Company maintained a total valuation allowance of $22.1 million and $3.0 million, respectively, which relates to foreign and state deferred tax assets as of December 31, 2017 and December 31, 2016. The valuation allowance is based on estimates of taxable income in each of the jurisdictions in which we operate and the period over which our deferred tax assets will be recoverable. The increase in the valuation allowance is primarily due to the preliminary valuation allowance on certain deferred tax assets in relation to the FH acquisition.
68
The following table provides a summary of the changes in the deferred tax valuation allowance for the years ended December 31, 2017, 2016, and 2015 (in thousands):
December 31, | |||||||||||
2017 | 2016 | 2015 | |||||||||
Deferred tax valuation allowance at January 1 | $ | 3,028 | $ | 892 | $ | 9,448 | |||||
Additions | 712 | 2,257 | 15 | ||||||||
Acquired | 18,494 | — | — | ||||||||
Deductions | (167 | ) | (121 | ) | (7,798 | ) | |||||
Translation adjustments | — | — | (773 | ) | |||||||
Deferred tax valuation allowance at December 31 | $ | 22,067 | $ | 3,028 | $ | 892 | |||||
As we closed the Brazil site in 2016, we do not believe that any of the deferred tax assets related to Brazil have any value. Accordingly, this portion of the valuation allowance was written off during 2015, along with the related deferred tax assets.
On December 18, 2015, legislation was enacted that permanently extended the U.S. research and development ("R&D") tax credit. Accordingly, the Company recorded the entire benefit of $0.3 million for the R&D tax credit attributable to 2015 in the fourth quarter.
The Company files income tax returns in the U.S. federal, state and local jurisdictions and in foreign jurisdictions. The Company is no longer subject to examination by the Internal Revenue Service ("IRS") for years prior to 2014 and is no longer subject to examination by the tax authorities in foreign and state jurisdictions prior to 2006, with the exception of net operating loss carryforwards. The Company is currently under examination for income tax filings in various foreign jurisdictions. During 2015, the Company settled a tax audit in Italy for $2.2 million, of which $0.9 million had been accrued in 2014.
During 2015, the Company restructured its multi-state activities, which resulted in a reduction of its state tax rate. In connection with this reduction, the Company recorded a one time tax expense of $0.8 million to reflect the effect of this tax rate reduction on its deferred tax assets. In addition, the Company recognized a tax benefit of $1.6 million on certain state net operating loss carryforwards, as it is more likely than not to utilize these losses within the carryforward period.
As of December 31, 2017, the Company had foreign tax credits of $16.4 million, foreign net operating losses of $45.6 million, state net operating losses of $56.3 million and state tax credits of $2.2 million. As of December 31, 2016, the Company had foreign tax credits of $17.7 million, foreign net operating losses of $1.5 million, state net operating losses of $57.2 million and state tax credits of $2.0 million. The foreign tax credits, if not utilized, will expire in 2026. A portion of the foreign net operating losses ($20.2 million) expire at various dates through 2029; the remainder have an unlimited carryforward period. The state net operating losses and state tax credits, if not utilized, will expire at various dates through 2037.
The Company repatriated $32 million of foreign earnings to the U.S. during the fourth quarter of 2016, resulting in a tax benefit of $2.6 million in the year ended December 31, 2016. The tax benefit is a result of foreign tax credits associated with the repatriation, in excess of the U.S. corporate tax rate.
During 2016, the Company recorded a valuation allowance and additional tax expense of $1.8 million on certain state net operating loss carryforwards, due to the uncertainty of the Company's ability to utilize these losses within the foreseeable future. The amount of net operating losses considered realizable, however, could be adjusted if objective evidence in the form of cumulative losses is no longer present and additional weight may be given to subjective evidence such as the Company’s projections for growth.
On December 22, 2017, the U.S. government enacted the Tax Cuts and Jobs Act (the “Tax Act”). The Tax Act includes significant changes to the U.S. corporate income tax system including: a federal corporate rate reduction from 35% to 21%; limitations on the deductibility of interest expense and executive compensation; creation of the base erosion anti-abuse tax (“BEAT”), a new minimum tax; and the transition of U.S. international taxation from a worldwide tax system to a modified territorial tax system. The change to a modified territorial tax system resulted in a one-time U.S. tax liability on those earnings which have not previously been repatriated to the U.S. (the “Transition Tax”), with future distributions not subject to U.S. federal income tax when repatriated. A majority of the provisions in the Tax Act are effective January 1, 2018.
69
In response to the Tax Act, the SEC staff issued guidance on accounting for the tax effects of the Tax Act. The guidance provides a one-year measurement period for companies to complete the accounting. We reflected the income tax effects of those aspects of the Tax Act for which the accounting is complete. To the extent our accounting for certain income tax effects of the Tax Act is incomplete but we are able to determine a reasonable estimate, we recorded a provisional estimate in the financial statements. For items that we cannot determine a provisional estimate to be included in the financial statements, we continued to apply the provisions of the tax laws that were in effect immediately before the enactment of the Tax Act. As the analysis is completed, the ultimate impact may differ from these provisional amounts.
In connection with our initial analysis of the impact of the Tax Act, we have recorded a provisional estimate of $0.5 million net tax benefit for the period ended December 31, 2017. This benefit consists of provisional estimates of zero net expense for the Transition Tax liability, and $0.5 million benefit from the remeasurement of our deferred tax assets/liabilities due to the corporate rate reduction. On a provisional basis, the Company does not expect to owe the one-time Transition Tax liability, based on foreign tax pools that are in excess of U.S. tax rates. We are in process of determining the impact of the Tax Act on our U.S. foreign tax credit carryforwards (deferred tax asset), and are unable to record a provisional estimate at this time. Any adjustment, when determined, could have an adverse impact to our net deferred tax asset.
We have not completed our accounting for the income tax effects of certain elements of the Tax Act. The Tax Act creates a new requirement that certain income, such as Global Intangible Low-Taxed Income (“GILTI”), earned by a controlled foreign corporation must be included in the gross income of its U.S. shareholder. Because of the complexity of the new GILTI and BEAT tax rules, we are continuing to evaluate the impact of these provisions and whether taxes due on future U.S. inclusions related to GILTI or BEAT should be recorded as a current period expense when incurred, or factored into the measurement of deferred taxes. As a result, we have not included an estimate of the tax expense or benefit related to these items for the period ended December 31, 2017.
As of December 31, 2017, the liability for uncertain income tax positions was approximately $3.0 million. Approximately $2.6 million as of December 31, 2017 represents the amount that if recognized would affect the Company’s effective income tax rate in future periods. The Company expects the unrecognized tax benefits to change over the next 12 months if certain tax matters ultimately settle with the applicable taxing jurisdiction during this timeframe, or if the applicable statute of limitations lapses. The impact of the amount of such changes to previously recorded uncertain tax positions could range from zero to $1.5 million. The impact of the lapse of statute of limitations below primarily represents the change in tax reserves disclosed in the reconciliation of the effective tax rate. The table below does not include interest and penalties of $0.4 million and $0.2 million as of December 31, 2017 and 2016, respectively. The following is a reconciliation of the Company’s liability for uncertain income tax positions for the years ended December 31, 2017 and 2016 (in thousands).
December 31, | |||||||||||
2017 | 2016 | 2015 | |||||||||
Balance beginning January 1 | $ | 3,000 | $ | 2,937 | $ | 1,978 | |||||
Additions/(reductions) for tax positions of prior years | (7 | ) | (102 | ) | 521 | ||||||
Additions/(reductions) based on tax positions related to current year | (65 | ) | 483 | 69 | |||||||
Acquired uncertain tax position balance | 1,221 | 1,326 | |||||||||
Settlements | (338 | ) | — | (544 | ) | ||||||
Lapse of statute of limitations | (978 | ) | (328 | ) | (612 | ) | |||||
Currency movement | 181 | 10 | 199 | ||||||||
Balance ending December 31 | $ | 3,014 | $ | 3,000 | $ | 2,937 | |||||
Undistributed earnings of our foreign subsidiaries amounted to $221.3 million at December 31, 2017 and $222.6 million at December 31, 2016. The undistributed earnings of our foreign subsidiaries are considered to be indefinitely reinvested and accordingly, no provision for U.S. federal and state income taxes has been recorded. Determination of the amount of unrecognized deferred tax liability on these undistributed earnings is not practicable because of the complexity of laws and regulations, the varying tax treatment of alternative repatriation scenarios, and the variation due to multiple potential assumptions relating to the timing of any future repatriation.
70
(9) Accrued Expenses and Other Current Liabilities
Accrued expenses and other current liabilities consisted of the following (in thousands):
December 31, | |||||||
2017 | 2016 | ||||||
Customer deposits and obligations | $ | 17,661 | $ | 5,673 | |||
Commissions and sales incentives payable | 8,891 | 6,376 | |||||
Penalty accruals | 2,395 | 4,834 | |||||
Warranty reserve | 4,623 | 4,559 | |||||
Professional fees | 3,498 | 2,202 | |||||
Taxes other than income tax | 4,059 | 1,512 | |||||
Deferred revenue | 16,057 | 7,073 | |||||
Current portion of long-term debt | 7,865 | — | |||||
Cash due to FH seller | 64,561 | — | |||||
Income tax payable | 1,785 | 2,560 | |||||
Other | 39,059 | 15,918 | |||||
Total accrued expenses and other current liabilities | $ | 170,454 | $ | 50,707 | |||
(10) Financing Arrangements
Long-term debt consisted of the following (in thousands):
December 31, | |||||||
2017 | 2016 | ||||||
Term Loan at interest rates of 4.93% | $ | 785,000 | $ | — | |||
Line of Credit at interest rates of 4.93% and 1.59%-4.00% in 2016 | 33,900 | 251,200 | |||||
Total Principal Debt Outstanding | $ | 818,900 | $ | 251,200 | |||
Less: Term Loan Debt Issuance Costs | 23,707 | — | |||||
Less: Current Portion | 7,850 | — | |||||
Total Long-Term Debt, net | $ | 787,343 | $ | 251,200 | |||
2018 | 2019 | 2020 | 2021 | 2022 | Thereafter | ||||||||||||||||||
Minimum principal payments | $ | 7,850 | $ | 7,850 | $ | 7,850 | $ | 7,850 | $ | 7,850 | $ | 745,750 | |||||||||||
On December 11, 2017, we entered into a new secured Credit Agreement (the "New Credit Agreement"), which provides for a $150.0 million revolving line of credit with a five year maturity and a $785.0 million term loan with a seven year maturity which was funded at closing of the FH acquisition in full. The New Credit Agreement replaced and terminated the Company’s prior Credit Agreement, dated as of May 11, 2017 (the "Prior Credit Agreement"). The Prior Credit Agreement, under which we had borrowings of $273.5 million outstanding, was terminated on December 11, 2017 and replaced by the New Credit Agreement.
The new term loan requires quarterly principal payments of 0.25% of initial aggregate principal amount beginning March 29, 2018 with the balance due at maturity. The Company has mandatory debt repayment obligations of $7.9 million per year ($2.0 million per quarter) until 2024 under the New Credit Agreement. Additional loans of up to $150.0 million (plus the amount of certain voluntary prepayments) and an unlimited amount subject to compliance with a first lien net leverage ratio of 4.50 to 1.00 may be made available under the New Credit Agreement upon request of the Company subject to specified terms and conditions. The Company may repay any borrowings under the New Credit Agreement at any time, subject to certain limited and customary restrictions stated in the New Credit Agreement; provided, however, that if the Company prepays all or any portion of the term loan in connection with a repricing transaction on or prior to the 6-month anniversary of the origination date, the Company must pay a prepayment premium of 1.0% of the aggregate principal amount of the term loan so prepaid.
71
The Company incurred $23.9 million of debt issuance costs associated with the term loan which have been recorded as a debt discount within long-term debt and $5.2 million of fees associated with the revolver were recorded as other assets. In connection with the Prior Credit Agreement, a portion of the term debt was extinguished and $0.2 million of deferred financing costs was written off as a debt extinguishment (included in special charges on the consolidated statements of income) and a portion was tested as a modification ($0.1 million) and rolled into the new debt discount. In connection with the Prior Credit Agreement revolving facility, $1.6 million of deferred financing fees was written off as debt extinguishment and $0.6 million was rolled into the New Credit Agreement (included in other assets) based on the borrowing capacity of the underlying banks.
As of December 31, 2017, we had borrowings of $818.9 million outstanding under the New Credit Agreement and $30.0 million in letters of credit issued under the New Credit Agreement. The Company recorded non-cash interest expense of $0.8 million, $0.4 million, and $0.4 million for December 31, 2017, 2016, and 2015 related to the amortization of its deferred financing costs described above. The New Credit Agreement revolving line of credit facility matures on December 11, 2022 whereas the term loan facility matures on December 11, 2024.
The outstanding principal amounts bear interest at a fluctuating rate (generally the 30 day LIBOR rate) per annum plus an applicable margin of 3.50% with respect to LIBOR loans and 2.50% with respect to base rate loans. As of December 31, 2017 and December 31, 2016, the outstanding balance of the Company’s debt approximated its fair value based on current rates available to the Company for debt of the same maturity and is a Level 2 financial instrument.
(11) Share-Based Compensation
We have two share-based compensation plans as of December 31, 2017: (1) the 2014 Stock Option and Incentive Plan (the "2014 Plan") and (2) the Amended and Restated 1999 Stock Option and Incentive Plan (the "1999 Plan"). The 2014 Plan was adopted by our Board of Directors on February 12, 2014 and approved by our shareholders at the Company's annual meeting held on April 30, 2014. As of April 30, 2014, no new awards will be granted under the 1999 Plan. As a result, any shares subject to outstanding awards under the 1999 Plan that expire, are canceled or otherwise terminate, or are withheld to satisfy tax withholding obligations, will not be available for award grant purposes under the 2014 Plan. Both plans permit the grant of the following types of awards to our officers, other employees and non-employee directors: incentive stock options; nonqualified stock options; deferred stock awards; restricted stock awards; unrestricted stock awards; performance share awards; cash-based awards; stock appreciation rights ("SARs") and dividend equivalent rights. The 2014 Plan provides for the issuance of up to 1,700,000 shares of common stock (subject to adjustment for stock splits and similar events). Under the 2014 Plan, shares issued for awards other than stock options or SARs count against the aggregate share limit as 1.9 shares for every share actually issued. New stock options granted under the 2014 Plan could have varying vesting provisions and exercise periods. All stock options and RSUs granted under the 1999 Plan are either 100% vested or have been terminated. RSUs granted under the 2014 Plan generally vest within three years. RSUs will be settled in shares of our common stock. As of December 31, 2017, there were 710,326 shares available for grant under the 2014 Plan.
As of December 31, 2017, there were 848,427 stock options (including the CEO and CFO stock option awards noted below) and 259,357 RSUs outstanding. As of December 31, 2017, there were 2,876 outstanding RSUs that contain rights to nonforfeitable dividend equivalents and are considered participating securities that are included in our computation of basic and fully diluted earnings per share. There is no difference in the earnings per share amounts between the two class method and the treasury stock method, which is why we continue to use the treasury stock method.
During the year ended December 31, 2017, we granted 142,428 stock option awards compared with 210,633 in 2016 and 118,992 in 2015. On April 9, 2013, we granted stock options to purchase 200,000 shares of common stock to our newly appointed President and Chief Executive Officer at an exercise price of $41.17 per share ("2013 CEO Option Award"). On December 2, 2013, we granted stock options to purchase 100,000 shares of common stock to our newly appointed Executive Vice President and Chief Financial Officer at an exercise price of $79.33 per share ("2013 CFO Option Award"). On March 5, 2014, we granted stock options to purchase 100,000 shares of common stock to our President and Chief Executive Officer at an exercise price of $70.42 per share ("2014 CEO Option Award"). The 2013 CEO Option Award, the 2013 CFO Option Award, and the 2014 CEO Award were considered inducement awards and were granted outside of the Company's 1999 Plan. All three of these option awards include a service period and a market performance vesting condition. The stock options will vest if the following stock price targets are met based on the stock price closing at or above these targets for 60 consecutive trading days:
72
2013 CEO Option Award: | |||
Stock Price Target | Cumulative Vested Portion of Stock Options (in Shares) | ||
$50.00 | 50,000 | ||
$60.00 | 100,000 | ||
$70.00 | 150,000 | ||
$80.00 | 200,000 | ||
2013 CFO and 2014 CEO Option Awards: | |||
Stock Price Target | Cumulative Vested Portion of Stock Options (in Shares) | ||
$87.50 | 25,000 | ||
$100.00 | 50,000 | ||
$112.50 | 75,000 | ||
$125.00 | 100,000 | ||
As the CEO Option Awards and the CFO Option Award vest, they may be exercised 25% at the time of vesting, 50% one year from the date of vesting and 100% two years from the date of vesting. On August 8, 2013, the $50.00 Stock Price Target for the 2013 CEO Option Award was achieved. On January 6, 2014 and January 28, 2014, the $60.00 and $70.00 Price targets for the 2013 CEO Option Award were achieved, respectively. Therefore, 150,000 options have vested and are exercisable under the 2013 CEO Option Award. As of December 31, 2017, none of the options awarded in connection with the 2013 CFO Option Award or the 2014 CEO Option Award have vested. These stock option awards are being expensed utilizing a graded method and are subject to forfeiture in the event of employment termination (whether voluntary or involuntary) prior to vesting. All three of these option awards have a 10 year term but to the extent that the market conditions above (Stock Price Targets) are not met within 5 years, these options will not vest and will forfeit 5 years from grant date. The Company used a Monte Carlo simulation option pricing model to value these option awards.
The average fair value of stock options granted during the year ended December 31, 2017, 2016, and 2015 of $19.36, $17.88, and $26.32, respectively, was estimated using the following weighted-average assumptions:
Year Ended December 31, | ||||||
2017 | 2016 | 2015 | ||||
Risk-free interest rate | 1.7 | % | 1.2 | % | 1.4 | % |
Expected life (years) | 4.5 | 4.5 | 4.5 | |||
Expected stock volatility | 35.1 | % | 36.2 | % | 40.4 | % |
Expected dividend yield | 0.2 | % | 0.4 | % | 0.3 | % |
We account for Restricted Stock Unit Awards (“RSU Awards”) by expensing the weighted average fair value to selling, general and administrative expenses ratably over vesting periods generally ranging up to three years. During the years ended December 31, 2017 and December 31, 2016 we granted 90,725 and 98,942 RSU Awards with approximate fair values of $55.28 and $41.09 per RSU Award, respectively. During 2017 and 2016, the Company granted performance-based RSUs as part of the overall mix of RSU Awards. These performance-based RSUs include metrics for achieving Return on Invested Capital and Adjusted Operating Margin with target payouts ranging from 0% to 200%. Of the 90,725 RSUs granted during 2017, 31,369 are performance-based RSU awards. This compares to 51,026 performance-based RSU awards granted in 2016.
The CIRCOR Management Stock Purchase Plan, which is a component of both the 2014 Plan and the 1999 Plan, provides that eligible employees may elect to receive RSUs in lieu of all or a portion of their pre-tax annual incentive bonus and, in some cases, make after-tax contributions in exchange for RSUs (“RSU MSPs”). In addition, non-employee directors may elect to receive RSUs in lieu of all or a portion of their annual directors’ retainer fees. Each RSU MSP represents a right to receive one share of our common stock after a three-year vesting period. RSU MSPs are granted at a discount of 33% from the fair market value of the shares of common stock on the date of grant. This discount is amortized as compensation expense, to selling, general and administrative expenses, over a four-year period. RSU MSPs totaling 26,726 and 20,130 with per unit discount amounts representing fair values of $20.13 and $12.83 were granted under the CIRCOR Management Stock Purchase Plan during the years ended December 31, 2017 and December 31, 2016, respectively.
Compensation expense related to our share-based plans for the year ended December 31, 2017, 2016, and 2015 was $3.8 million, $5.5 million, and $6.5 million respectively. Share-based compensation expense is recorded as selling, general, and
73
administrative expense. As of December 31, 2017, there was $7.8 million of total unrecognized compensation costs related to our outstanding share-based compensation arrangements. That cost is expected to be recognized over a weighted average period of 2.1 years. This compares to $6.8 million for 2016 and $7.0 million for 2015, respectively. The increase in total unrecognized compensation costs from 2017 and 2016 primarily relates to equity awards granted to participants from our newly acquired Fluid Handling reporting segment.
A summary of the status of all stock options granted to employees and non-employee directors as of December 31, 2017, 2016, and 2015 and changes during the years are presented in the table below:
December 31, | ||||||||||||||||||||
2017 | 2016 | 2015 | ||||||||||||||||||
Options | Weighted Average Exercise Price | Options | Weighted Average Exercise Price | Options | Weighted Average Exercise Price | |||||||||||||||
Options outstanding at beginning of period | 736,319 | $ | 52.30 | 570,737 | $ | 56.86 | 486,004 | $ | 57.85 | |||||||||||
Granted | 142,428 | 60.99 | 210,633 | 38.89 | 118,992 | 51.84 | ||||||||||||||
Exercised | (17,708 | ) | 39.91 | (5,982 | ) | 41.05 | (7,717 | ) | 33.44 | |||||||||||
Forfeited | (10,136 | ) | 51.99 | (33,014 | ) | 45.25 | (26,542 | ) | 59.25 | |||||||||||
Expired | (2,476 | ) | 61.38 | (6,055 | ) | 65.34 | — | — | ||||||||||||
Options outstanding at end of period | 848,427 | $ | 53.99 | 736,319 | $ | 52.30 | 570,737 | $ | 56.86 | |||||||||||
Options exercisable at end of period | 309,824 | $ | 45.66 | 226,386 | $ | 45.20 | 140,248 | $ | 43.08 | |||||||||||
The weighted average contractual term for stock options outstanding and exercisable as of December 31, 2017 was 5.3 years and 4.6 years, respectively. The aggregate intrinsic value of stock options exercised during the years ended December 31, 2017, 2016 and 2015 was $0.4 million, $0.1 million and $0.1 million, respectively. The aggregate fair value of stock-options vested during the years ended December 31, 2017, 2016 and 2015 was $1.6 million, $1.7 million and $1.2 million, respectively. The aggregate intrinsic value of stock options outstanding and exercisable as of December 31, 2017 was $3.5 million and $1.9 million, respectively. As of December 31, 2017, there was $2.9 million of total unrecognized compensation costs related to stock options that is expected to be recognized over a weighted average period of 1.8 years.
The following table summarizes information about stock options outstanding at December 31, 2017:
Options Outstanding | Options Exercisable | ||||||||||||||
Range of Exercise Prices | Options | Weighted Average Remaining Contractual Life (Years) | Weighted Average Exercise Price | Options | Weighted Average Exercise Price | ||||||||||
$30.91 - $40.09 | 196,660 | 4.9 | $ | 38.69 | 73,330 | $ | 38.36 | ||||||||
40.10 - 46.51 | 200,000 | 5.3 | 41.17 | 150,000 | 41.17 | ||||||||||
46.52 - 65.71 | 217,529 | 5.4 | 57.65 | 52,256 | 51.84 | ||||||||||
65.72 - 79.33 | 234,238 | 5.6 | 74.39 | 34,238 | 71.56 | ||||||||||
$30.91 - $79.33 | 848,427 | 5.3 | $ | 53.99 | 309,824 | $ | 45.66 | ||||||||
A summary of the status of all RSU Awards granted to employees and non-employee directors as of December 31, 2017, 2016, and 2015 and changes during the year are presented in the table below:
74
December 31, | ||||||||||||||||||||
2017 | 2016 | 2015 | ||||||||||||||||||
RSUs | Weighted Average Price | RSUs | Weighted Average Price | RSUs | Weighted Average Price | |||||||||||||||
RSU Awards outstanding at beginning of period | 138,761 | $ | 46.60 | 109,281 | $ | 52.90 | 115,949 | $ | 52.97 | |||||||||||
Granted | 90,725 | 55.28 | 98,942 | 41.09 | 62,322 | 51.53 | ||||||||||||||
Settled | (29,803 | ) | 46.15 | (54,034 | ) | 48.50 | (56,865 | ) | 48.34 | |||||||||||
Canceled | (12,778 | ) | 62.92 | (22,527 | ) | 46.86 | (19,088 | ) | 55.08 | |||||||||||
Added by Performance Factor | — | — | 7,099 | 41.55 | 6,963 | 32.76 | ||||||||||||||
RSU Awards outstanding at end of period | 186,905 | $ | 49.76 | 138,761 | $ | 46.60 | 109,281 | 52.90 | ||||||||||||
RSU Awards exercisable at end of period | 2,876 | $ | 59.17 | 3,040 | $ | 60.92 | 1,200 | $ | 59.29 | |||||||||||
The aggregate intrinsic value of RSU Awards settled during the 12 months ended December 31, 2017, 2016 and 2015 was $1.7 million, $2.5 million, and $3.0 million, respectively. The aggregate fair value of RSU Awards vested during the 12 months ended December 31, 2017, 2016 and 2015 was $1.4 million, $2.7 million and $2.4 million, respectively.
The aggregate intrinsic value of RSU Awards outstanding and exercisable as of December 31, 2017 was $9.1 million and $0.1 million, respectively. As of December 31, 2017, there was $4.5 million of total unrecognized compensation costs related to RSU awards that is expected to be recognized over a weighted average period of 1.2 years.
The following table summarizes information about RSU Awards outstanding at December 31, 2017:
RSU Awards Outstanding | ||||||||
Fair Values at Grant Date | RSUs | Weighted Average Remaining Contractual Life (Years) | Weighted Average Fair Value | |||||
$38.89 - $50.99 | 92,371 | 1.8 | $ | 41.79 | ||||
51.00 - 58.99 | 38,507 | 0.6 | 52.17 | |||||
59.00 - 71.56 | 56,027 | 0.6 | 61.25 | |||||
$38.89 - $71.56 | 186,905 | 1.2 | $ | 49.76 | ||||
A summary of the status of all RSU MSPs granted to employees and non-employee directors as of December 31, 2017, 2016, and 2015 and changes during the year are presented in the table below:
December 31, | ||||||||||||||||||||
2017 | 2016 | 2015 | ||||||||||||||||||
RSUs | Weighted Average Exercise Price | RSUs | Weighted Average Exercise Price | RSUs | Weighted Average Exercise Price | |||||||||||||||
RSU MSPs outstanding at beginning of period | 67,924 | $ | 36.50 | 78,732 | $ | 37.46 | 69,293 | $ | 35.81 | |||||||||||
Granted | 26,726 | 40.86 | 20,130 | 26.06 | 38,965 | 34.73 | ||||||||||||||
Settled | (19,843 | ) | 42.28 | (27,375 | ) | 29.94 | (22,403 | ) | 27.87 | |||||||||||
Canceled | (2,355 | ) | 37.48 | (3,563 | ) | 35.35 | (7,123 | ) | 36.65 | |||||||||||
RSU MSPs outstanding at end of period | 72,452 | $ | 35.01 | 67,924 | $ | 36.50 | 78,732 | $ | 37.46 | |||||||||||
There were no RSU MSPs exercisable at December 31, 2017, 2016, and 2015. The aggregate intrinsic value of RSU MSPs settled during the year ended December 31, 2017, 2016, and 2015 was $0.3 million, $0.4 million and $0.5 million, respectively. The aggregate fair value of RSU MSPs vested during the year ended December 31, 2017, 2016, and 2015 was $0.5 million, $0.4 million and $0.3 million, respectively. The aggregate intrinsic value of RSU MSPs outstanding as of December 31, 2017 was $1.0 million. As of December 31, 2017, there was $0.5 million of total unrecognized compensation costs related to RSU MSPs that is expected to be recognized over a weighted average period of 1.1 years.
75
The following table summarizes information about RSU MSPs outstanding at December 31, 2017:
RSU MSPs Outstanding | ||||||||
Range of Grant Prices | RSUs | Weighted Average Remaining Contractual Life (Years) | Weighted Average Exercise Price | |||||
$26.06 - 33.99 | 16,340 | 1.1 | $ | 26.06 | ||||
34.00 - 39.99 | 29,729 | 0.1 | 34.73 | |||||
40.00 - 47.95 | 26,383 | 2.2 | 40.86 | |||||
$26.06 - $47.95 | 72,452 | 1.1 | $ | 35.01 | ||||
We also grant Cash Settled Stock Unit Awards to our international employee participants. These Cash Settled Stock Unit Awards typically cliff-vest in three years and are settled in cash based on the closing price of our common stock at the time of vesting. As of December 31, 2017, there were 40,469 Cash Settled Stock Unit Awards outstanding compared with 33,320 Cash Settled Stock Unit Awards outstanding as of December 31, 2016. During 2017, the aggregate cash used to settle Cash Settled Stock Unit Awards was $0.4 million. As of December 31, 2017, the Company had $0.9 million in accrued expenses classified as current liabilities for Cash Settled Stock Unit Awards compared with $1.0 million as of December 31, 2016. Cash Settled Stock Unit Award related compensation costs for the twelve month periods ended December 31, 2017, 2016, and 2015 totaled $0.2 million, $0.9 million, and $0.2 million, respectively and was recorded as selling, general and administrative expense. The decrease in compensation costs in 2017 vs. 2016 is due primarily to a lower ending stock price.
(12) Concentrations of Risk
Financial instruments that potentially subject us to concentrations of credit risk consist primarily of cash, cash equivalents, short-term investments and trade receivables. A significant portion of our revenue and receivables are from customers who are either in or service the energy, aerospace, defense and industrial markets. We perform ongoing credit evaluations of our customers and maintain allowances for potential credit losses. For the years ended December 31, 2017, 2016 and 2015, we had no customers from which we derive revenues that exceed the threshold of 10% of the Company’s consolidated revenues.
(13) Retirement Plans
US Contribution Plan
We offer a savings plan to eligible U.S. employees. The plan is intended to qualify under Section 401(k) of the Internal Revenue Code. Substantially all of our U.S. employees are eligible to participate in the 401(k) savings plan. Participating employees may defer a portion of their pre-tax compensation, as defined, but not more than statutory limits. Under this plan, we match a specified percentage of employee contributions, and are able to make a discretionary core contribution, subject to certain limitations. During 2017, we contributed 50% of the amount contributed by the employee, up to a maximum of 5% of the employee’s earnings. Our matching contributions vest at a rate of 20% per year of service, with full vesting after 5 years of service.
The cost of our 401K plan is outlined below:
Year Ended December 31, | |||||||||||
2017 | 2016 | 2015 | |||||||||
Cost of 401(k) plan | $ | 1,978 | $ | 1,509 | $ | 2,886 | |||||
Pension & Other Post-Retirement Benefit Obligations
The Company also sponsors various defined benefit plans, and other post-retirement benefits plans, including health and life insurance, for former employees of an acquired business. These plans include significant benefit obligations which are calculated based on actuarial valuations. Key assumptions are made in determining these obligations and related net periodic benefit costs, including discount rates, mortality, and expected long-term return on plan assets.
On December 11, 2017, the Company acquired FH. The acquisition included all of the pension obligations outside of the U.S., and a significant portion of the post-retirement obligations in the U.S. In connection with the acquisition, all post-retirement obligations were measured at December 11, 2017.
76
In the U.S., the company maintains a qualified noncontributory defined benefit pension plan, a nonqualified, noncontributory defined benefit supplemental pension plan, and other post-retirement benefit plans, including health and life insurance. Our plans and FH plans are frozen. To date, the supplemental and the other post-retirement benefits plans remain unfunded.
Outside of the U.S., the company sponsors various funded and unfunded defined benefit plans as a result of the 2017 acquisition of the FH business. The obligations are primarily attributed to partially funded plans in Germany and the U.K.
During fiscal year 2017, we made $0.8 million in cash contributions to our qualified defined benefit pension plan, in addition to $0.4 million in payments for our nonqualified plan. In 2018, we expect to make defined benefit plan contributions based on the minimum required funding in accordance with statutory requirements (approximately $0 in the U.S. and approximately $6.0 million for our foreign plans) The estimates for plan funding for future periods may change as a result of the uncertainties concerning the return on plan assets, the number of plan participants, and other changes in actuarial assumptions. We anticipate fulfilling these commitments through our generation of cash flow from operations.
The U.S. pension obligations acquired in the acquisition are a carve-out from a prior plan, and a portion of the plan assets are expected to transfer to the existing CIRCOR plan in April, 2018. U.S. pension investments related to the carve-out are managed by Colfax Corporation as the Plan Administrator of the prior plan during the period from December 11, 2017 through the time that plan assets are transferred. We have recorded a receivable of $178.9 million ($2.3 million included in return on assets) related to this asset transfer, which has been netted against the pension obligation in the pension liability on the balance sheet.
The components of net periodic benefit cost for the postretirement plans were as follows (in thousands):
Pension Benefits | Other Post-retirement Benefits (1) | ||||||||||||||
Year Ended December 31, | Year Ended December 31, | ||||||||||||||
2017 | 2016 | 2015 | 2017 | ||||||||||||
Components of net periodic benefit cost: | |||||||||||||||
Service cost | $ | 181 | $ | — | $ | — | $ | — | |||||||
Interest cost | $ | 2,158 | $ | 2,185 | $ | 2,193 | $ | 20 | |||||||
Expected return on assets | (2,994 | ) | (2,562 | ) | (2,655 | ) | — | ||||||||
Amortization | — | ||||||||||||||
Net periodic benefit cost | (655 | ) | (377 | ) | (462 | ) | 20 | ||||||||
Net loss amortization | 735 | 893 | 843 | — | |||||||||||
Prior service cost amortization | — | — | — | — | |||||||||||
Total amortization | 735 | 893 | 843 | — | |||||||||||
Pension settlement charge | — | 4,457 | — | — | |||||||||||
Net periodic benefit cost | $ | 80 | $ | 4,973 | $ | 381 | $ | 20 | |||||||
Net periodic benefit cost | $ | 80 | $ | 9,430 | $ | 381 | $ | 20 | |||||||
(1) No Other Post-retirement Benefits in 2016 & 2015. | |||||||||||||||
The weighted average assumptions used in determining the net periodic benefit cost and benefit obligations for the post-retirement plans are shown below:
77
Pension Benefits | Other Post-retirement Benefits | ||||||
Year Ended December 31, | Year Ended December 31, | ||||||
2017 | 2016 | 2015 | 2017 | ||||
Net periodic benefit cost (1): | |||||||
Discount rate – U.S. | 3.86% | 4.11% | 3.82% | 3.63% | |||
Expected return on plan assets - U.S. (2) | 7.25% | 6.75% | 7.25% | N/A | |||
Rate of compensation increase - U.S. | N/A | NA | N/A | N/A | |||
Benefit obligations: | N/A | ||||||
Discount rate – U.S. | 3.27% | 3.86% | 4.11% | 3.48% | |||
Discount rate – Foreign | 1.97% | N/A | N/A | N/A | |||
Rate of compensation increase - U.S. | N/A | — | — | N/A | |||
Rate of compensation increase - Foreign | 3.11% | N/A | N/A | N/A | |||
(1) Assumption shown excludes those that would have been applicable for 21 days of CIRCOR's ownership of FH. | |||||||
(2) Excludes estimate of return on assets still held in the prior plan which had an expected long-term return on plan assets for the time since acquisition of 6.25% for 2017 for which CIRCOR is entitled to their portion of the return. | |||||||
The amounts reported for net periodic benefit cost and the respective benefit obligation amounts are dependent upon the actuarial assumptions used. The Company reviews historical trends, future expectations, current market conditions, and external data to determine the assumptions. The actuarial assumptions used to determine the net periodic pension cost are based upon the prior year’s assumptions used to determine the benefit obligation.
Effective with the acquisition of FH on December 11, 2017, the Company has changed the method used to estimate the service and interest cost components of the net periodic benefit costs. The new method uses the spot yield curve approach to estimate the service and interest costs by applying the specific spot rates along the yield curve used to determine the benefit obligations to relevant projected cash outflows. This approach was only used for the period between December 11, 2017 and December 31, 2017 for the FH plans in the U.S., UK, and Germany. The Company changed to the new method to provide a more precise measure of interest and service costs by more closely correlating the application of the discrete spot yield curve rates with the projected benefit cash flows. The Company will account for this change prospectively for the legacy CIRCOR plans as a change in estimate beginning in the first quarter of 2018. Prior to this date, the service and interest costs were determined using a single weighted-average discount rate based on the AA yield curves used to measure the benefit obligation at the measurement date.
Assumed health care cost trend rates have a significant effect on the amounts reported for the health care plan. A one-percentage point change in assumed health care cost trend rates would have the following pre-tax effects:
1 % Increase | 1% Decrease | |||||||
Effect on total service and interest cost components for the year ended December 31, 2017 | — | — | ||||||
Effect on post-retirement benefit obligation at December 31, 2017 | $ | 1,639 | $ | (1,308 | ) | |||
In selecting the expected long-term return on assets for the qualified and foreign plans, we considered the average rate of earnings expected on the funds invested or to be invested to provide for the benefits of these plans. We, with input from the plans’ professional investment managers and actuaries, also considered the average rate of earnings expected on the funds invested or to be invested to provide plan benefits. This process included determining expected returns for the various asset classes that comprise the plans’ target asset allocation. This basis for selecting the long-term return on assets is consistent with the prior year. Using generally accepted diversification techniques, the plans’ assets, in aggregate and at the individual portfolio level, are invested so that the total portfolio risk exposure and risk-adjusted returns best meet the plans’ long-term benefit obligations to employees. Plan asset allocations are reviewed periodically and rebalanced to achieve target allocation among the asset categories when necessary. This included considering the pension asset allocation and the expected returns likely to be earned over the life of the plans.
78
During the third quarter of 2016, management offered a lump sum cash payout option to terminated and vested participants in the U.S. Plan. In connection with this action, the participants who opt to avail themselves of this program closed during the fourth quarter 2016. During the fourth quarter of 2016, we incurred a $4.5 million pension settlement charge which has been recorded within the Special and restructuring charges, net line item.
The funded status of the defined benefit post-retirement plans and amounts recognized in the consolidated balance sheets, measured as of December 31, 2017 and December 31, 2016 were as follows (in thousands):
Pension Benefits | Other Post-retirement Benefits | |||||||||||||
December 31, | December 31, | |||||||||||||
2017 | 2016 | 2017 | 2016 | |||||||||||
Change in projected benefit obligation: | ||||||||||||||
Balance at beginning of year | $ | 45,300 | $ | 56,939 | $ | — | $ | — | ||||||
Service cost | 181 | — | — | |||||||||||
Interest cost | 2,158 | 2,185 | 20 | — | ||||||||||
Actuarial loss (gain) | 413 | (2,932 | ) | 263 | — | |||||||||
Exchange rate (gain) / loss | 5,759 | — | — | — | ||||||||||
Acquisitions | 348,542 | — | 11,445 | — | ||||||||||
Benefits paid | (2,715 | ) | (2,092 | ) | (43 | ) | — | |||||||
Settlement payments | — | (8,800 | ) | — | — | |||||||||
Balance at end of year | $ | 399,638 | $ | 45,300 | $ | 11,685 | $ | — | ||||||
Change in fair value of plan assets: | ||||||||||||||
Balance at beginning of year | $ | 31,776 | $ | 39,369 | $ | — | $ | — | ||||||
Actual return on assets (1) | 10,374 | 1,904 | — | — | ||||||||||
Exchange rate (gain) / loss | 1,256 | — | — | |||||||||||
Acquisitions - Transferred | 28,903 | — | — | |||||||||||
Acquisitions - Plan receivable from Colfax | 176,572 | — | — | — | ||||||||||
Benefits paid | (2,715 | ) | (2,092 | ) | (43 | ) | — | |||||||
Settlement payments | — | (8,800 | ) | — | — | |||||||||
Employer contributions | 1,417 | 1,395 | 43 | — | ||||||||||
Fair value of plan assets at end of year (2) | $ | 247,583 | $ | 31,776 | $ | — | $ | — | ||||||
Funded status: | ||||||||||||||
Excess of benefit obligation over the fair value of plan assets | $ | (152,055 | ) | $ | (13,524 | ) | $ | (11,685 | ) | $ | — | |||
Pension plan accumulated benefit obligation (“ABO”) | $ | 399,638 | $ | 45,300 | N/A | N/A | ||||||||
(1) Includes $2.3 million of plan assets still held in the prior plan at Colfax. | ||||||||||||||
(2) Refer to Note 16, Fair Value for further disclosure regarding our fair value hierarchy assessment. | ||||||||||||||
79
The following information is presented as of December 31, 2017 and 2016 (in thousands):
Pension Benefits | Other Post-retirement Benefits | |||||||||||||
2017 | 2016 | 2017 | 2016 | |||||||||||
Funded status, end of year: | ||||||||||||||
Fair value of plan assets | $ | 247,583 | $ | 31,776 | $ | — | ||||||||
Projected Benefit obligation | (399,638 | ) | (45,300 | ) | — | |||||||||
Net pension liability | $ | (152,055 | ) | $ | (13,524 | ) | $ | — | $ | — | ||||
Post-retirement amounts recognized in the balance sheet consists of: | ||||||||||||||
Non-current asset | $ | 1,517 | $ | — | $ | — | $ | — | ||||||
Current liability | (2,853 | ) | (393 | ) | (746 | ) | — | |||||||
Non-current liability | (150,719 | ) | (13,131 | ) | (10,939 | ) | — | |||||||
Total | $ | (152,055 | ) | $ | (13,524 | ) | $ | (11,685 | ) | $ | 0 | |||
Amounts recognized in accumulated other comprehensive income consist of: | ||||||||||||||
Net losses | $ | 13,937 | $ | 21,640 | $ | 263 | $ | 0 | ||||||
Estimated future benefit expense to be recognized in other comprehensive income (loss): | 2018 | |||||||||||||
Amortization of net losses | $ | 432 | ||||||||||||
As of December 31, 2017, the benefit payments expected to be paid in each of the next five years and the aggregate for the five fiscal years thereafter were as follows (in thousands):
2018 | 2019 | 2020 | 2021 | 2022 | 2024-2028 | ||||||||||||||||||
Pension Benefits - All Plans | $ | 24,197 | $ | 23,815 | $ | 23,673 | $ | 23,496 | $ | 23,294 | $ | 111,376 | |||||||||||
Other Post-retirement Benefits | 746 | 727 | 687 | 675 | 645 | 2,942 | |||||||||||||||||
Expected benefit payments | $ | 24,943 | $ | 24,542 | $ | 24,360 | $ | 24,171 | $ | 23,939 | $ | 114,318 | |||||||||||
(14) Contingencies, Commitments and Guarantees
Legal Proceedings
We are subject to various legal proceedings and claims pertaining to matters such as product liability or contract disputes, including issues that may arise under certain customer contracts with aerospace and defense customers. We are also subject to other proceedings and governmental inquiries, inspections, audits or investigations pertaining to issues such as tax matters, patents and trademarks, pricing, business practices, governmental regulations, employment and other matters. Although the results of litigation and claims cannot be predicted with certainty, we believe that the ultimate disposition of these matters, to the extent not previously provided for, will not have a material adverse effect, individually or in the aggregate, on our business, financial condition, results of operations or liquidity.
Asbestos-related product liability claims continue to be filed against two of our subsidiaries: Spence Engineering Company, Inc. (“Spence”), the stock of which we acquired in 1984; and CIRCOR Instrumentation Technologies, Inc. (f/k/a Hoke Incorporated) (“Hoke”), the stock of which we acquired in 1998. Due to the nature of the products supplied by these entities, the markets they serve and our historical experience in resolving these claims, we do not believe that these asbestos-related claims will have a material adverse effect on the financial condition, results of operations or liquidity of Spence or Hoke, or the financial condition, consolidated results of operations or liquidity of the Company.
On February 21, 2018, the Company entered into a mediated settlement regarding a wage and hour action in California by a former employee. In October 2016, the plaintiff alleged non-compliance with California State labor law, including missed or late meal breaks, for hourly employees of CIRCOR Aerospace, Inc. in Corona, California. The total settlement amount of $2.4 million has been recorded as a liability at December 31, 2017. This settlement resolves all wage/hour claims by all potentially affected employees through the settlement date and is expected to be approved by the California Superior Court within the next six to twelve months.
80
Standby Letters of Credit
We execute standby letters of credit, which include bank guarantees, bid bonds and performance bonds, in the normal course of business to ensure our performance or payments to third parties. The aggregate notional value of these instruments was $77.7 million at December 31, 2017 of which $30.0 million were syndicated under our New Credit Agreement. Our historical experience with these types of instruments has been good and no claims have been paid in the current or past several fiscal years. We believe that the likelihood of demand for payments relating to the outstanding instruments is remote. These instruments generally have expiration dates ranging from less than 1 month to 5 years from December 31, 2017.
The following table contains information related to standby letters of credit instruments outstanding as of December 31, 2017 (in thousands):
Term Remaining | Maximum Potential Future Payments | ||
0–12 months | $ | 50,344 | |
Greater than 12 months | 27,343 | ||
Total | $ | 77,687 | |
Operating Lease Commitments
Rental expense under operating lease commitments amounted to $6.4 million, $5.6 million and $5.9 million for the years ended December 31, 2017, 2016 and 2015, respectively. Minimum rental commitments due under non-cancelable operating leases, primarily for office and warehouse facilities, were as follows at December 31, 2017 (in thousands):
2018 | 2019 | 2020 | 2021 | 2022 | Thereafter | ||||||||||||||||||
Minimum lease commitments | $ | 12,272 | $ | 8,431 | $ | 5,850 | $ | 4,183 | $ | 3,350 | $ | 8,453 | |||||||||||
Commercial Contract Commitment
As of December 31, 2017, we had approximately $112.6 million of commercial contract commitments related to open purchase orders.
Insurance
We maintain insurance coverage of a type and with such limits as we believe are customary and reasonable for the risks we face and in the industries in which we operate. While many of our policies do contain a deductible, the amount of such deductible is typically not material, and is generally less than $0.4 million per occurrence. Our accruals for insured liabilities are not discounted and take into account these deductibles and are based on claims filed and reported as well as estimates of claims incurred but not yet reported.
(15) Guarantees and Indemnification obligations
As permitted under Delaware law, we have agreements whereby we indemnify certain of our officers and directors for certain events or occurrences while the officer or director is, or was, serving at our request in such capacity. The term of the indemnification period is for the officer’s or director’s lifetime. The maximum potential amount of future payments we could be required to make under these indemnification agreements is unlimited. However, we have directors and officers’ liability insurance policies that limit our exposure for events covered under the policies and should enable us to recover a portion of any future amounts paid. As a result of the coverage under these insurance policies, we believe the estimated fair value of these indemnification agreements is minimal and, therefore, have no liabilities recorded from those agreements as of December 31, 2017.
We record provisions for the estimated cost of product warranties, primarily from historical information, at the time product revenue is recognized. While we engage in extensive product quality programs and processes, our warranty obligation is affected by product failure rates, utilization levels, material usage, service delivery costs incurred in correcting a product failure, and supplier warranties on parts delivered to us. Should actual product failure rates, utilization levels, material usage, service delivery costs or supplier warranties on parts differ from our estimates, revisions to the estimated warranty liability would be required. Our warranty liabilities are included in accrued expenses and other current liabilities on our consolidated balance sheets.
81
The following table sets forth information related to our product warranty reserves for the years ended December 31, 2017 and 2016 (in thousands):
December 31, | |||||||
2017 | 2016 | ||||||
Balance beginning January 1 | $ | 4,559 | $ | 4,551 | |||
Provisions | 2,590 | 2,255 | |||||
Claims settled | (4,508 | ) | (3,304 | ) | |||
Acquired reserves/other | 1,759 | 1,125 | |||||
Currency translation adjustment | 223 | (68 | ) | ||||
Balance ending December 31 | $ | 4,623 | $ | 4,559 | |||
Warranty obligations of $4.6 million for the year ended December 31, 2017 were consistent with the prior year. Decreases in warranty obligations of $4.5 million were primarily driven by claims settled within certain Industrial businesses and CFS, were partially offset by $1.8 million of obligations from our 2017 FH acquisition.
(16) Fair Value
Financial Instruments
The company utilizes fair value measurement guidance prescribed by accounting standards to value its financial instruments. The guidance establishes a fair value hierarchy based on the inputs used to measure fair value. This hierarchy prioritizes the inputs into three broad levels as follows:
Level One: Inputs to the valuation methodology are unadjusted quoted prices for identical assets or liabilities in active markets.
Level Two: Inputs to the valuation methodology include quoted prices for similar assets and liabilities in active markets, quoted prices for identical or similar assets or liabilities in inactive markets, and inputs that are observable for the asset or liability, either directly or indirectly, for substantially the full term of the financial instrument.
Level Three: Inputs to the valuation methodology are unobservable and significant to the fair value measurement.
A financial instrument’s level within the fair value hierarchy is based on the lowest level of any input that is significant to the fair value measurement.
The carrying amounts of cash and cash equivalents, trade receivables and trade payables approximate fair value because of the short maturity of these financial instruments. Cash equivalents are carried at cost which approximates fair value at the balance sheet date and is a Level 1 financial instrument. As of December 31, 2017 and 2016, the outstanding balance of the Company’s debt approximated fair value based on current rates available to the Company for debt of the same maturity and is a Level 2 financial instrument.
Contingent consideration obligations are measured at fair value and are based on significant inputs not observable in the market, which represents a Level 3 measurement within the fair value hierarchy. The valuation of contingent consideration uses assumptions and estimates to forecast a range of outcomes and probabilities for the contingent consideration. Contingent consideration obligations are valued using a Monte Carlo simulation model. We assess these assumptions and estimates on a quarterly basis as additional data impacting the assumptions is obtained. Any changes in the fair value of contingent consideration related to updated assumptions and estimates will be recognized within general and administrative expenses in the consolidated statements of operations during the period in which the change occurs. At December 31, 2016 the fair value was $12.2 million, during the year ended December 31, 2017 the full balance was written off based on actual results and therefore no balance remains at December 31, 2017.
The fair values of the Company’s pension plan assets at December 31, 2017 and 2016, utilizing the fair value hierarchy were as follows (in thousands):
82
December 31, 2017 | December 31, 2016 | ||||||||||||||||
Measured at Net Asset Value (1) | Level 1 | Level 2 | Total | Measured at Net Asset Value (1) | |||||||||||||
U.S. Plans: | |||||||||||||||||
Cash Equivalents: | |||||||||||||||||
Money Market Funds | $ | — | $ | 237 | $ | — | $ | 237 | $ | — | |||||||
Mutual Funds: | |||||||||||||||||
Bond Funds | — | — | — | — | 1,721 | ||||||||||||
Large Cap Funds | — | — | — | — | 15,117 | ||||||||||||
International Funds | 4,838 | — | — | 4,838 | 5,967 | ||||||||||||
Small Cap Funds | — | — | — | — | 2,960 | ||||||||||||
Blended Funds | — | — | — | — | 2,185 | ||||||||||||
Mid Cap Funds | — | — | — | — | 3,826 | ||||||||||||
Comingled Pools: | |||||||||||||||||
Opportunistic | 3,106 | — | — | 3,106 | — | ||||||||||||
Investment Grade | 10,664 | — | — | 10,664 | — | ||||||||||||
Non-U.S. Equity | 4,730 | — | — | 4,730 | — | ||||||||||||
U.S. Equity | 14,773 | — | — | 14,773 | — | ||||||||||||
Foreign Plans: | |||||||||||||||||
Cash | — | 518 | — | 518 | — | ||||||||||||
Equity | 10,499 | — | 184 | 10,683 | — | ||||||||||||
Non-U.S. government and corporate bonds | 15,146 | — | 669 | 15,815 | — | ||||||||||||
Insurance Contracts | 306 | — | 2,932 | 3,238 | — | ||||||||||||
Other | — | 38 | — | 38 | — | ||||||||||||
Total Fair Value | $ | 64,062 | $ | 793 | $ | 3,785 | $ | 68,640 | $ | 31,776 | |||||||
(1) Certain investments that are measured at fair value using the net asset value per share (or its equivalent) practical expedient (the “NAV”) have not been classified in the fair value hierarchy. These investments, consisting of common/collective trusts, are valued using the NAV provided by the Trustee. The NAV is based on the underlying investments held by the fund, that are traded in an active market, less its liabilities. These investments are able to be redeemed in the near-term. | |||||||||||||||||
(2) $179 million of pension plan asset receivable has been excluded from the leveling table above as CIRCOR does not yet control the assets the fair value has been determined based on CIRCOR's percent of Colfax U.S. pension plan assets which were valued by Colfax using NAV as described in (1). | |||||||||||||||||
Contingent consideration obligations are measured at fair value and are based on significant inputs not observable in the market, which represents a Level 3 measurement within the fair value hierarchy. The valuation of contingent consideration uses assumptions and estimates to forecast a range of outcomes and probabilities for the contingent consideration. Contingent consideration obligations are valued using a Monte Carlo simulation model. We assess these assumptions and estimates on a quarterly basis as additional data impacting the assumptions is obtained. Any changes in the fair value of contingent consideration related to updated assumptions and estimates will be recognized within general and administrative expenses in the consolidated statements of operations during the period in which the change occurs.
Foreign Currency Contracts
The Company is exposed to certain risks relating to its ongoing business operations including foreign currency exchange rate risk and interest rate risk. The Company currently uses derivative instruments to manage foreign currency risk on certain business transactions denominated in foreign currencies. To the extent the underlying transactions hedged are completed, these forward contracts do not subject us to significant risk from exchange rate movements because they offset gains and losses on the related foreign currency denominated transactions. These forward contracts do not qualify as hedging instruments and, therefore, do not qualify for fair value or cash flow hedge treatment. Any gains and losses on our contracts are recognized as a component of other expense in our consolidated statements of income.
83
As of December 31, 2017, we had no forward contracts. This compares to four forward contracts with a fair value liability of $0.1 million as of December 31, 2016. Our foreign currency forward contracts fall within Level 2 of the fair value hierarchy, in accordance with ASC Topic 820. The foreign exchange (gains)/losses for the year ended December 31, 2017, 2016 and 2015 were $0.1 million, $(0.6) million, and $0.5 million, respectively, and are included in other (income) expense in our consolidated statements of income.
(17) Business Segment and Geographical Information
At December 31, 2017, the Company’s financial performance is managed and reported in three segments. A description of each segment follows.
Our reportable segments have been identified in accordance with ASC 280-10-50 through our evaluation of how the Company engages in business activities to earn revenues and incur expenses, which operating results are regularly reviewed by our chief operating decision maker (“CODM”) to assess performance and make decisions about resources to be allocated, and the availability of discrete financial information. CIRCOR’s reportable segments are generally organized based upon the end markets we sell our product and services into. No individual operating segments have been aggregated for purposes of determining our reportable segments.
Advanced Flow Solutions ("AFS") is a diversified flow control technology platform. Our primary product focus areas are valves, actuation, motors, switches, high pressure pneumatic systems, steam and process loop flow management solutions. AFS products are used in aerospace, defense, power and process, and general industrial markets. These products are primarily focused on the following end markets: Aerospace and Defense, Power and Process, HVAC, Maritime and Industrial Gas.
Energy is a global provider of highly engineered integrated flow control solutions, valves and services primarily in the Oil & Gas end market. We are focused on satisfying our customers’ mission-critical application needs by utilizing advanced technologies. Our flow control solutions can withstand extreme temperatures and pressures, including land-based, topside, and sub-sea applications.
Fluid Handling is a global portfolio of highly engineered and differentiated fluid handling products, systems and services. Our primary products are positive displacement pumps, specialty centrifugal pumps, and lubrication management systems and services. Segment revenues and income presented below reflect the period from December 11, 2017 to December 31, 2017.
Each reporting segment is individually managed, as each requires different technology and marketing strategies, and has separate financial results that are reviewed by our CODM. Our CODM evaluates segment performance and determines how to allocate resources utilizing, among other data, segment operating income. Segment operating income excludes special and restructuring charges, net. In addition, certain administrative expenses incurred at the corporate level for the benefit of the reporting segments are allocated to the segments based upon specific identification of costs, employment related information or net revenues. Each segment contains related products and services particular to that segment. For 2018, we expect to reorganize our segments by end market: Energy, Aerospace & Defense and Industrial. Prior year financial statements will be adjusted to reflect this new organization basis beginning in the first quarter of 2018.
Corporate is reported on a net “after allocations” basis. Inter-segment intercompany transactions affecting net operating profit have been eliminated within the respective reportable segments.
The amounts reported in the Corporate expenses line item in the following table consists primarily of the following: compensation and fringe benefit costs for executive management and other corporate staff; Board of Director compensation; corporate development costs (relating to mergers and acquisitions); human resource development and benefit plan administration expenses; legal, accounting and other professional and consulting costs; facilities, equipment and maintenance costs; and travel and various other administrative costs. The above costs are incurred in the course of furthering the business prospects of the Company and relate to activities such as: implementing strategic business growth opportunities; corporate governance; risk management; tax; treasury; investor relations and shareholder services; regulatory compliance; strategic tax planning; and stock transfer agent costs.
Our CODM evaluates segment operating performance using segment operating income. Segment operating income is defined as GAAP operating income excluding intangible amortization and amortization of fair value step-ups of inventory and fixed assets from acquisitions completed subsequent to December 31, 2011, the impact of restructuring related inventory write-offs, impairment charges and special charges or gains. The Company also refers to this measure as adjusted operating income. The Company uses this measure because it helps management understand and evaluate the segments’ core operating results and facilitate comparison of performance for determining incentive compensation achievement.
84
The following table presents certain reportable segment information (in thousands):
2017 | 2016 | 2015 | |||||||||
Net revenues | |||||||||||
Energy | $ | 347,578 | $ | 322,046 | $ | 383,655 | |||||
Advanced Flow Solutions | 277,637 | 268,213 | 272,612 | ||||||||
Fluid Handling | 36,495 | — | — | ||||||||
Inter-segment revenues | — | 994 | 1,124 | ||||||||
Corporate | — | (994 | ) | (1,124 | ) | ||||||
Consolidated revenues | $ | 661,710 | $ | 590,259 | $ | 656,267 | |||||
Segment Income | |||||||||||
Energy - Segment Operating Income | $ | 30,748 | $ | 34,619 | $ | 50,386 | |||||
Advanced Flow Solutions - Segment Operating Income | 37,230 | 33,463 | 33,811 | ||||||||
Fluid Handling - Segment Operating Income | 5,460 | — | — | ||||||||
Corporate expenses | (21,744 | ) | (25,672 | ) | (21,710 | ) | |||||
Subtotal | 51,694 | 42,410 | 62,487 | ||||||||
Special restructuring charges, net | 7,989 | 8,975 | 4,634 | ||||||||
Special other charges, net | 6,063 | 8,196 | 9,720 | ||||||||
Special and restructuring charges, net | 14,052 | 17,171 | 14,354 | ||||||||
Restructuring related inventory charges | — | 2,846 | 9,391 | ||||||||
Amortization of inventory step-up | 4,300 | 1,366 | |||||||||
Impairment charges | — | 208 | 2,502 | ||||||||
Acquisition amortization | 12,542 | 9,901 | 6,838 | ||||||||
Acquisition depreciation | 233 | — | — | ||||||||
Brazil restatement impact | — | — | 3,228 | ||||||||
Restructuring and other cost, net | 17,075 | 14,321 | 21,959 | ||||||||
Consolidated Operating Income | 20,568 | 10,918 | 26,174 | ||||||||
Interest Expense, net (a) | 10,777 | 3,310 | 2,844 | ||||||||
Other Expense (Income), net (a) | 3,678 | (2,072 | ) | 902 | |||||||
Income from continuing operations before income taxes | $ | 6,113 | $ | 9,680 | $ | 22,428 | |||||
Identifiable assets | |||||||||||
Energy | $ | 729,087 | $ | 658,749 | $ | 463,359 | |||||
Advanced Flow Solutions | 560,726 | 407,035 | 486,369 | ||||||||
Fluid Handling | 1,079,396 | — | — | ||||||||
Corporate | $ | (462,410 | ) | (245,028 | ) | (279,813 | ) | ||||
Consolidated Identifiable assets | $ | 1,906,799 | $ | 820,756 | $ | 669,915 | |||||
Capital expenditures | |||||||||||
Energy | $ | 3,763 | $ | 3,902 | $ | 6,176 | |||||
Advanced Flow Solutions | 7,258 | 8,535 | 6,324 | ||||||||
Fluid Handling | 2,147 | — | — | ||||||||
Corporate | 1,378 | 1,775 | 814 | ||||||||
Consolidated Capital expenditures | $ | 14,546 | $ | 14,212 | $ | 13,314 | |||||
Depreciation and amortization | |||||||||||
85
Energy | $ | 12,537 | $ | 8,755 | $ | 7,102 | |||||
Advanced Flow Solutions | 13,481 | 15,555 | 15,624 | ||||||||
Fluid Handling | 2,706 | — | — | ||||||||
Corporate | 1,313 | 1,309 | 1,209 | ||||||||
Consolidated Depreciation and amortization | $ | 30,037 | $ | 25,619 | $ | 23,935 | |||||
The total assets for each reportable segment have been reported as the Identifiable Assets for that segment, including inter-segment intercompany receivables, payables and investments in other CIRCOR companies. Identifiable assets reported in Corporate include both corporate assets, such as cash, deferred taxes, prepaid and other assets, fixed assets, as well as the elimination of all inter-segment intercompany assets. The elimination of intercompany assets results in negative amounts reported in Corporate for Identifiable Assets. Corporate Identifiable Assets after elimination of intercompany assets were $15.6 million, $50.5 million, and $46.7 million as of December 31, 2017, 2016 and 2015, respectively.
The following tables present net revenue and long-lived assets by geographic area. The net revenue amounts are based on shipments to each of the respective areas.
Year Ended December 31, | |||||||||||
Net revenues by geographic area (in thousands) | 2017 | 2016 | 2015 | ||||||||
United States | $ | 324,204 | $ | 232,650 | $ | 284,227 | |||||
France | 41,584 | 42,908 | 34,839 | ||||||||
Germany | 32,480 | 26,451 | 26,889 | ||||||||
Canada | 28,703 | 32,750 | 46,575 | ||||||||
Saudi Arabia | 28,626 | 68,693 | 33,155 | ||||||||
United Kingdom | 26,872 | 27,579 | 36,005 | ||||||||
China | 16,875 | 11,157 | 13,255 | ||||||||
Norway | 13,462 | 21,668 | 43,502 | ||||||||
Rest of Europe | 56,638 | 32,460 | 24,508 | ||||||||
Rest of Asia-Pacific | 55,265 | 39,808 | 36,247 | ||||||||
Other | 37,001 | 54,135 | 77,065 | ||||||||
Total net revenues | $ | 661,710 | $ | 590,259 | $ | 656,267 | |||||
December 31, | |||||||
Long-lived assets by geographic area (in thousands) | 2017 | 2016 | |||||
United States | $ | 130,587 | $ | 55,577 | |||
Germany | 42,651 | 10,242 | |||||
UK | 12,592 | 10,584 | |||||
India | 7,618 | 3,949 | |||||
Italy | 5,213 | 5,258 | |||||
China | 4,828 | 4,779 | |||||
France | 3,851 | 5,209 | |||||
Mexico | 2,853 | 245 | |||||
Other | 7,346 | 3,870 | |||||
Total long-lived assets | $ | 217,539 | $ | 99,713 | |||
86
(18) Subsequent Event
During the first quarter of 2018, management approved certain restructuring actions to reduce structural costs in our manufacturing operations in Europe and to rationalize the service center network in our global Reliability Services business.
(19) Quarterly Financial Information
Summary Quarterly Data — Unaudited
(in thousands, except per share information)
First Quarter | Second Quarter | Third Quarter | Fourth Quarter | |||||||||||||
Year Ended December 31, 2017 | ||||||||||||||||
Net revenues | $ | 145,208 | $ | 151,231 | $ | 159,693 | $ | 205,578 | ||||||||
Gross profit | 46,633 | 47,668 | 47,303 | 59,216 | ||||||||||||
Net income (loss) | 4,773 | 8,970 | 3,617 | (5,571 | ) | |||||||||||
Earnings (loss) per common share: | ||||||||||||||||
Basic | $ | 0.29 | $ | 0.54 | $ | 0.22 | $ | (0.32 | ) | |||||||
Diluted | 0.29 | 0.54 | 0.22 | (0.32 | ) | |||||||||||
Dividends per common share | 0.0375 | 0.0375 | 0.0375 | 0.0375 | ||||||||||||
Year Ended December 31, 2016 | ||||||||||||||||
Net revenues | $ | 150,798 | $ | 146,392 | $ | 134,833 | $ | 158,236 | ||||||||
Gross profit | 45,233 | 46,431 | 42,354 | 49,097 | ||||||||||||
Net income (loss) | 3,872 | 3,813 | 4,418 | (2,002 | ) | |||||||||||
Earnings per common share: | ||||||||||||||||
Basic | $ | 0.24 | $ | 0.23 | $ | 0.27 | $ | (0.12 | ) | |||||||
Diluted | 0.23 | 0.23 | 0.27 | (0.12 | ) | |||||||||||
Dividends per common share | 0.0375 | 0.0375 | 0.0375 | 0.0375 | ||||||||||||
We had a net loss in Q4 primarily due to transition costs associated with the acquisition of FH and the related debt refinancing. We do not anticipate this trend to continue. | ||||||||||||||||
87
Schedule II — Valuation and Qualifying Accounts
CIRCOR INTERNATIONAL, INC.
Allowance for Doubtful Accounts
Additions (Reductions) | |||||||||||||||||||
Description | Balance at Beginning of Period | Charged to Costs and Expenses | Charged to Other Accounts | Deductions (1) | Balance at End of Period | ||||||||||||||
(in thousands) | |||||||||||||||||||
Year ended | |||||||||||||||||||
December 31, 2017 | |||||||||||||||||||
Deducted from asset account: | |||||||||||||||||||
Allowance for doubtful accounts | $ | 5,056 | $ | (87 | ) | $ | 378 | $ | (556 | ) | $ | 4,791 | |||||||
Year ended | |||||||||||||||||||
December 31, 2016 | |||||||||||||||||||
Deducted from asset account: | |||||||||||||||||||
Allowance for doubtful accounts (2) | $ | 8,290 | $ | 613 | $ | 425 | $ | (4,272 | ) | $ | 5,056 | ||||||||
Year ended | |||||||||||||||||||
December 31, 2015 | |||||||||||||||||||
Deducted from asset account: | |||||||||||||||||||
Allowance for doubtful accounts | $ | 9,536 | $ | 2,561 | $ | (1,748 | ) | $ | (2,059 | ) | $ | 8,290 | |||||||
(1) | Uncollectible accounts written off, net of recoveries. |
(2) | Balance at end of period excludes the engineered valves accounts receivable allowances of $2.4 million, which are classified as long-term as of December 31, 2015. |
88