Attached files
| file | filename |
|---|---|
| EX-99.2 - EX-99.2 - SPIRIT REALTY CAPITAL, INC. | src-ex992_6.htm |
| EX-99.1 - EX-99.1 PRESS RELEASE - SPIRIT REALTY CAPITAL, INC. | src-ex991_7.htm |
| 8-K - 8-K - SPIRIT REALTY CAPITAL, INC. | src-8k_20210219.htm |
Q4 2020 Investor Presentation February 2021 Exhibit 99.3
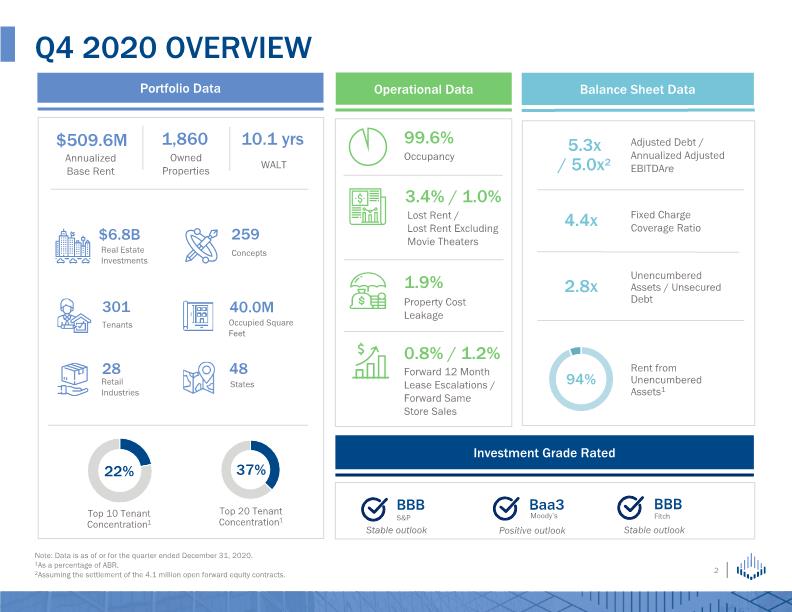
Q4 2020 Overview Portfolio Data Operational Data Balance Sheet Data $509.6M 37% Top 10 Tenant Concentration1 22% Investment Grade Rated Baa3 Moody’s 0.8% / 1.2% Forward 12 Month Lease Escalations / Forward Same Store Sales Annualized Base Rent Top 20 Tenant Concentration1 5.3x / 5.0x2 Adjusted Debt / Annualized Adjusted EBITDAre 4.4x Fixed Charge Coverage Ratio Concepts 259 10.1 yrs WALT 99.6% Occupancy 1.9% Property Cost Leakage 94% Rent from Unencumbered Assets1 Unencumbered Assets / Unsecured Debt 2.8x 3.4% / 1.0% Lost Rent / Lost Rent Excluding Movie Theaters Note: Data is as of or for the quarter ended December 31, 2020. 1As a percentage of ABR. 2Assuming the settlement of the 4.1 million open forward equity contracts. Stable outlook Positive outlook Stable outlook
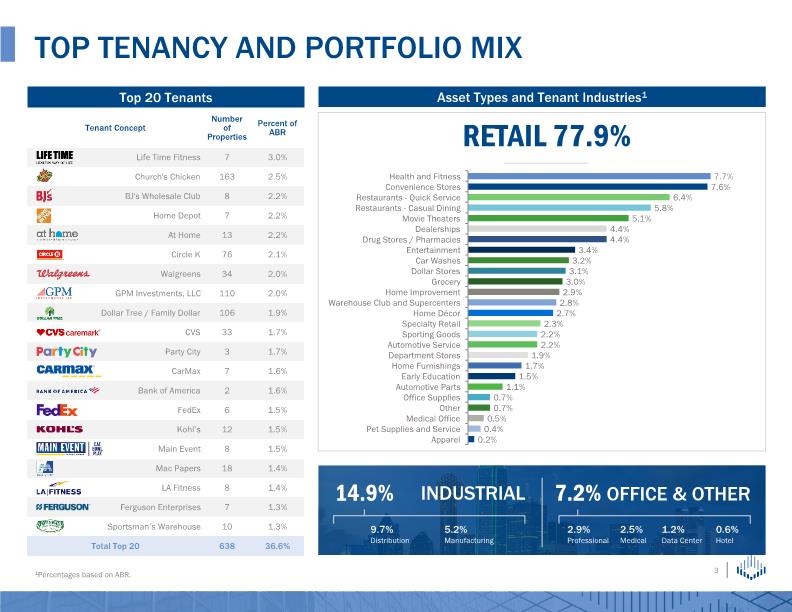
Top 20 Tenants Asset Types and Tenant Industries1 RETAIL 77.9% INDUSTRIAL Top Tenancy and Portfolio Mix 14.9% 9.7% Distribution 5.2% Manufacturing OFFICE & OTHER 7.2% 2.9% Professional 2.5% Medical 1.2% Data Center 0.6% Hotel 1Percentages based on ABR.
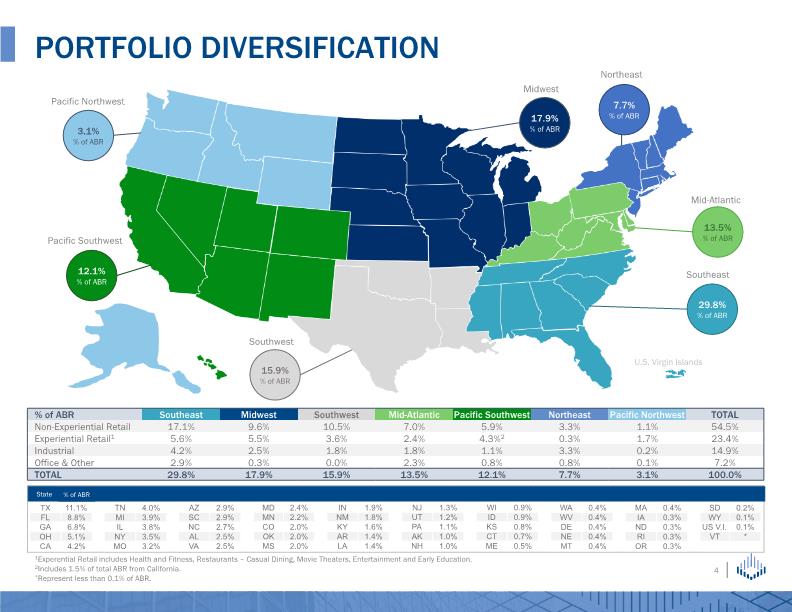
PORTFOLIO DIVERSIFICATION 1Experential Retail includes Health and Fitness, Restaurants – Casual Dining, Movie Theaters, Entertainment and Early Education. 2Includes 1.5% of total ABR from California. *Represent less than 0.1% of ABR. Southeast Mid-Atlantic Pacific Southwest Pacific Northwest 15.9% % of ABR Southwest Midwest Northeast 7.7% % of ABR 29.8% % of ABR 13.5% % of ABR 12.1% % of ABR 3.1% % of ABR 17.9% % of ABR U.S. Virgin Islands % of ABR State
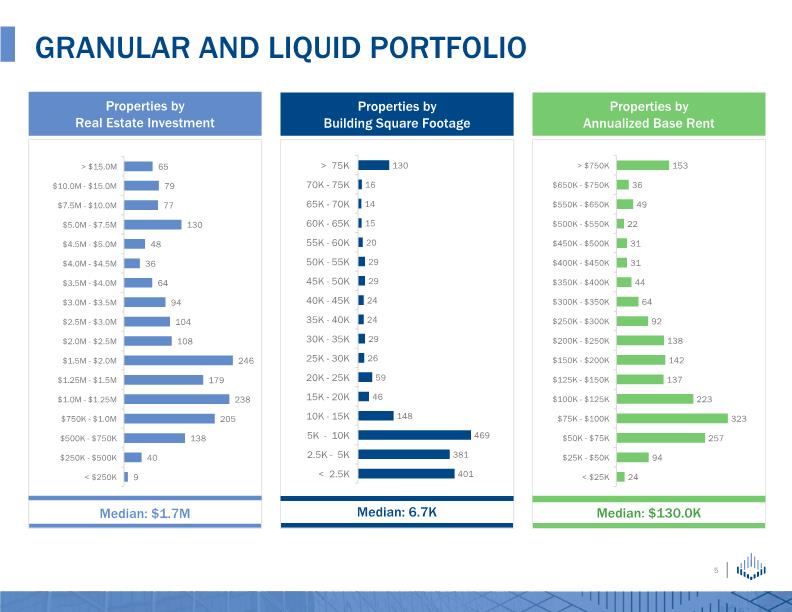
Granular and Liquid Portfolio
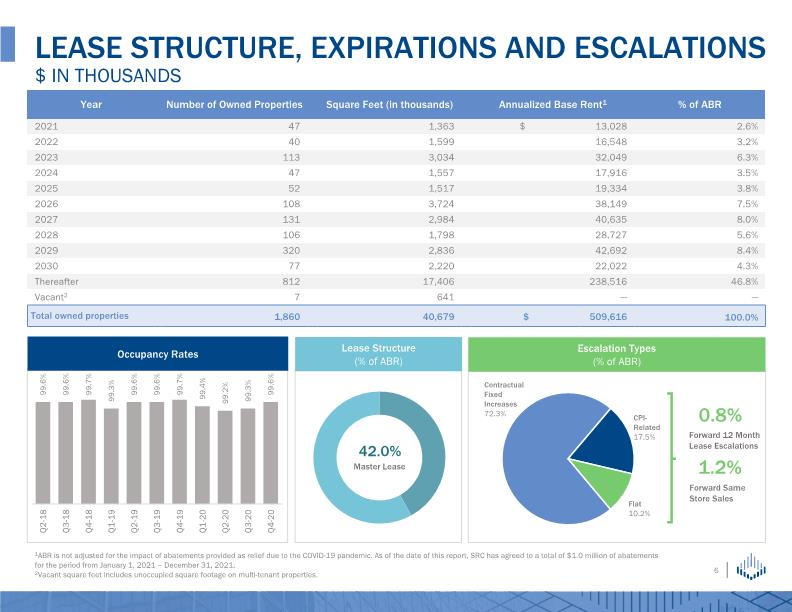
LEASE STRUCTURE, EXPIRATIONS AND ESCALATIONS $ in thousands 1.2% Forward Same Store Sales Occupancy Rates Forward 12 Month Lease Escalations 0.8% Lease Structure (% of ABR) 42.0% Master Lease Escalation Types (% of ABR) 1ABR is not adjusted for the impact of abatements provided as relief due to the COVID-19 pandemic. As of the date of this report, SRC has agreed to a total of $1.0 million of abatements for the period from January 1, 2021 – December 31, 2021. 2Vacant square feet includes unoccupied square footage on multi-tenant properties.
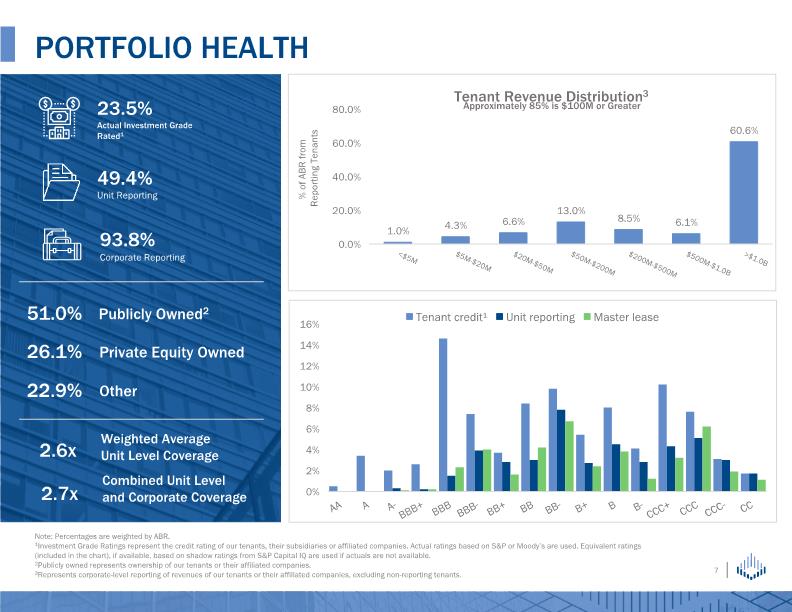
Portfolio Health % of ABR from Reporting Tenants Note: Percentages are weighted by ABR. 1Investment Grade Ratings represent the credit rating of our tenants, their subsidiaries or affiliated companies. Actual ratings based on S&P or Moody’s are used. Equivalent ratings (included in the chart), if available, based on shadow ratings from S&P Capital IQ are used if actuals are not available. 2Publicly owned represents ownership of our tenants or their affiliated companies. 3Represents corporate-level reporting of revenues of our tenants or their affiliated companies, excluding non-reporting tenants.
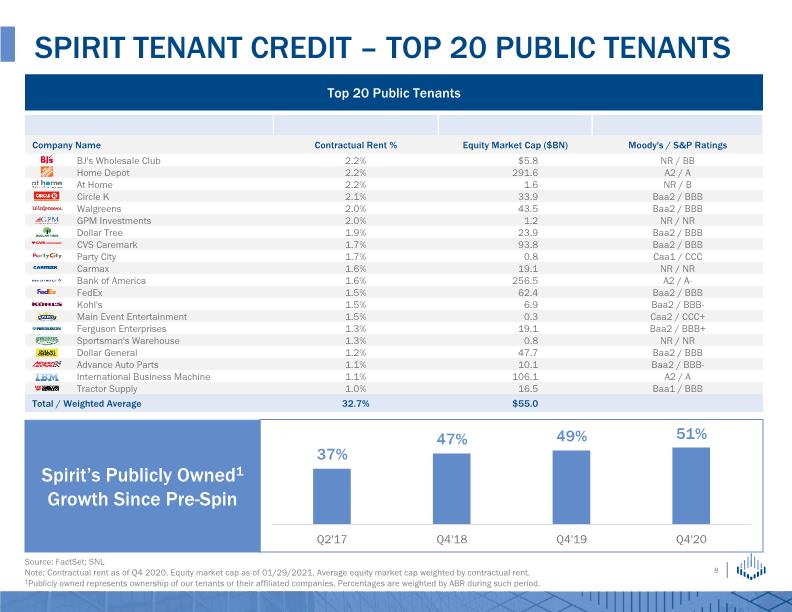
Spirit tenant credit – top 20 public Tenants Source: FactSet; SNL Note: Contractual rent as of Q4 2020. Equity market cap as of 01/29/2021. Average equity market cap weighted by contractual rent. 1Publicly owned represents ownership of our tenants or their affiliated companies. Percentages are weighted by ABR during such period. Top 20 Public Tenants Spirit’s Publicly Owned1 Growth Since Pre-Spin
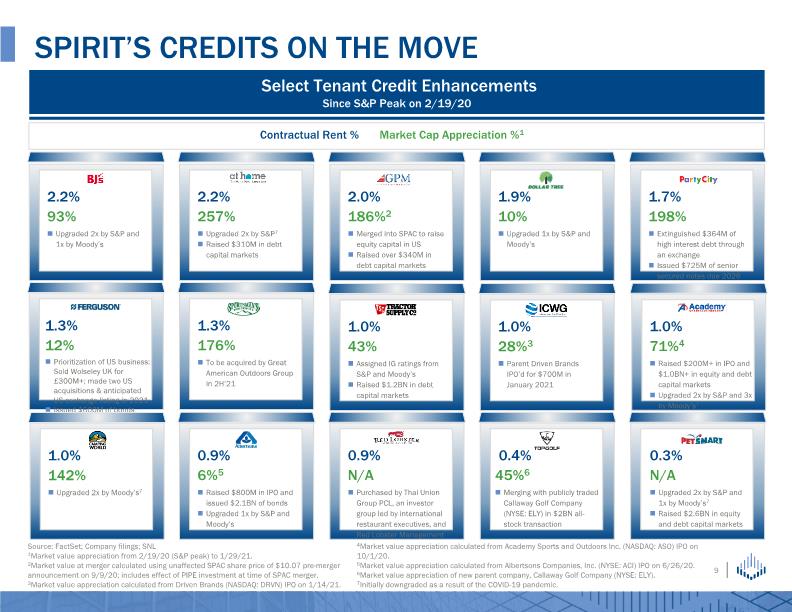
Spirit’s credits on the move Select Tenant Credit Enhancements Since S&P Peak on 2/19/20 Source: FactSet; Company filings; SNL 1Market value appreciation from 2/19/20 (S&P peak) to 1/29/21. 2Market value at merger calculated using unaffected SPAC share price of $10.07 pre-merger announcement on 9/9/20; includes effect of PIPE investment at time of SPAC merger. 3Market value appreciation calculated from Driven Brands (NASDAQ: DRVN) IPO on 1/14/21. 0.9% N/A Purchased by Thai Union Group PCL, an investor group led by international restaurant executives, and Red Lobster Management 2.2% 93% Upgraded 2x by S&P and 1x by Moody’s 4Market value appreciation calculated from Academy Sports and Outdoors Inc. (NASDAQ: ASO) IPO on 10/1/20. 5Market value appreciation calculated from Albertsons Companies, Inc. (NYSE: ACI) IPO on 6/26/20. 6Market value appreciation of new parent company, Callaway Golf Company (NYSE: ELY). 7Initially downgraded as a result of the COVID-19 pandemic.
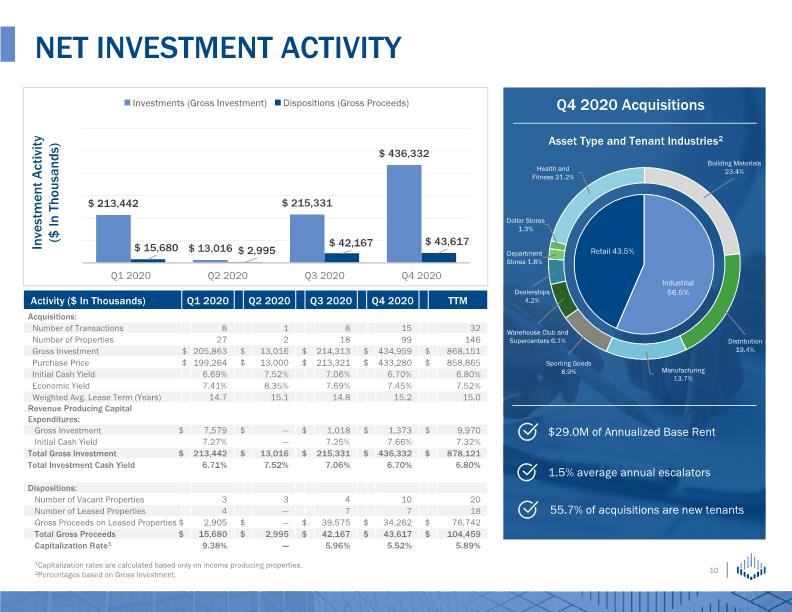
NET INVESTMENT ACTIVITY Asset Type and Tenant Industries2 1Capitalization rates are calculated based only on income producing properties. 2Percentages based on Gross Investment.
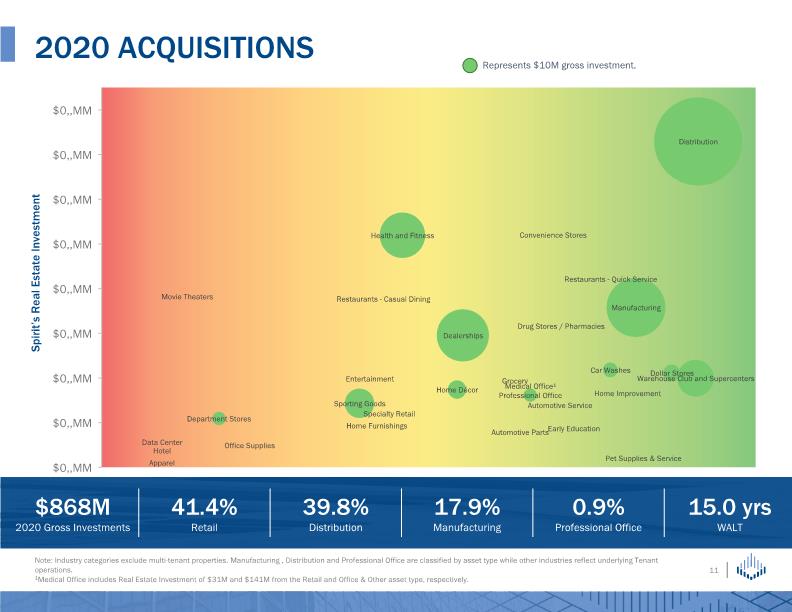
2020 Acquisitions Note: Industry categories exclude multi-tenant properties. Manufacturing , Distribution and Professional Office are classified by asset type while other industries reflect underlying Tenant operations. 1Medical Office includes Real Estate Investment of $31M and $141M from the Retail and Office & Other asset type, respectively. Spirit’s Real Estate Investment Represents $10M gross investment. $868M 2020 Gross Investments 0.9% Professional Office 41.4% Retail 17.9% Manufacturing 15.0 yrs WALT 39.8% Distribution
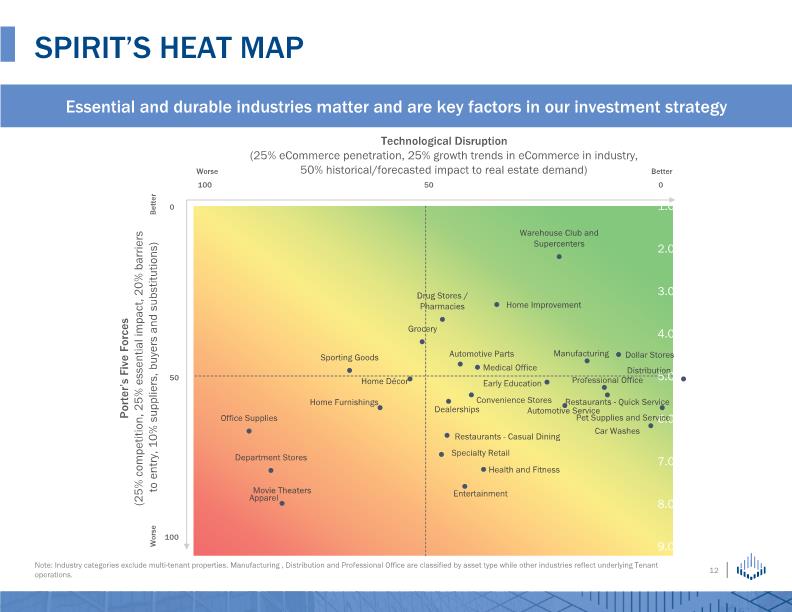
Spirit’s heat map Note: Industry categories exclude multi-tenant properties. Manufacturing , Distribution and Professional Office are classified by asset type while other industries reflect underlying Tenant operations. Essential and durable industries matter and are key factors in our investment strategy 100 100 50 0 0 Worse Better Technological Disruption (25% eCommerce penetration, 25% growth trends in eCommerce in industry, 50% historical/forecasted impact to real estate demand) Porter’s Five Forces (25% competition, 25% essential impact, 20% barriers to entry, 10% suppliers, buyers and substitutions) Better Worse 50
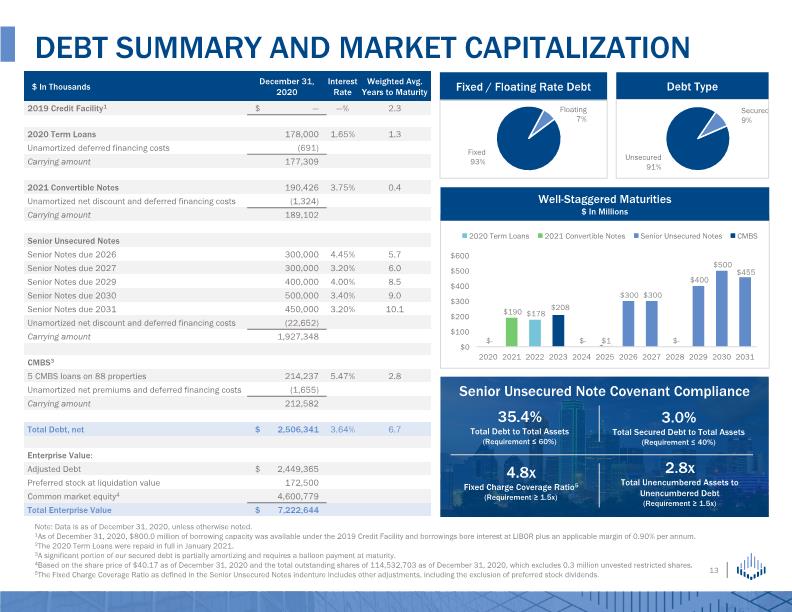
Debt Summary and Market Capitalization Note: Data is as of December 31, 2020, unless otherwise noted. 1As of December 31, 2020, $800.0 million of borrowing capacity was available under the 2019 Credit Facility and borrowings bore interest at LIBOR plus an applicable margin of 0.90% per annum. 2The 2020 Term Loans were repaid in full in January 2021. 3A significant portion of our secured debt is partially amortizing and requires a balloon payment at maturity. 4Based on the share price of $40.17 as of December 31, 2020 and the total outstanding shares of 114,532,703 as of December 31, 2020, which excludes 0.3 million unvested restricted shares. 5The Fixed Charge Coverage Ratio as defined in the Senior Unsecured Notes indenture includes other adjustments, including the exclusion of preferred stock dividends. Debt Type Fixed / Floating Rate Debt 35.4% Total Debt to Total Assets (Requirement ≤ 60%) Senior Unsecured Note Covenant Compliance 3.0% Total Secured Debt to Total Assets (Requirement ≤ 40%) 4.8x Fixed Charge Coverage Ratio5 (Requirement ≥ 1.5x) 2.8x Total Unencumbered Assets to Unencumbered Debt (Requirement ≥ 1.5x) Well-Staggered Maturities $ In Millions
Spirit’s Platform
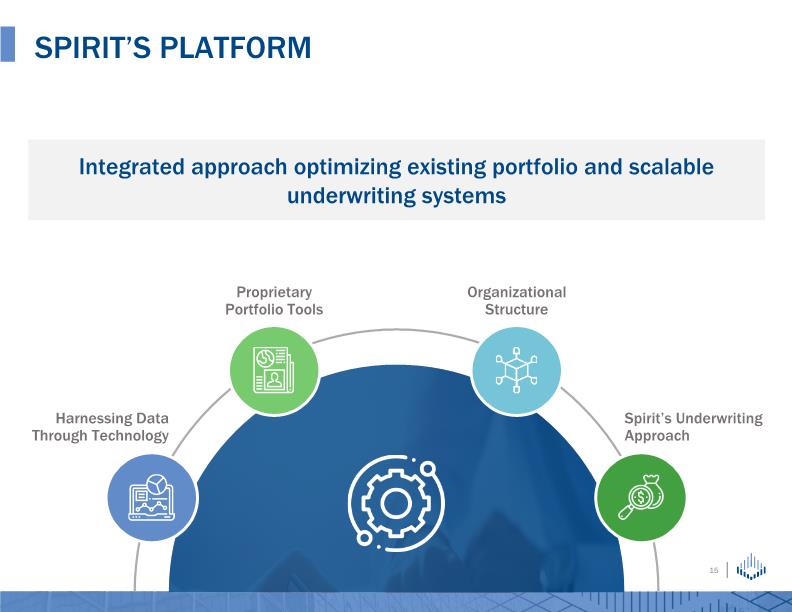
Spirit’s platform Integrated approach optimizing existing portfolio and scalable underwriting systems Harnessing Data Through Technology Proprietary Portfolio Tools Organizational Structure Spirit’s Underwriting Approach
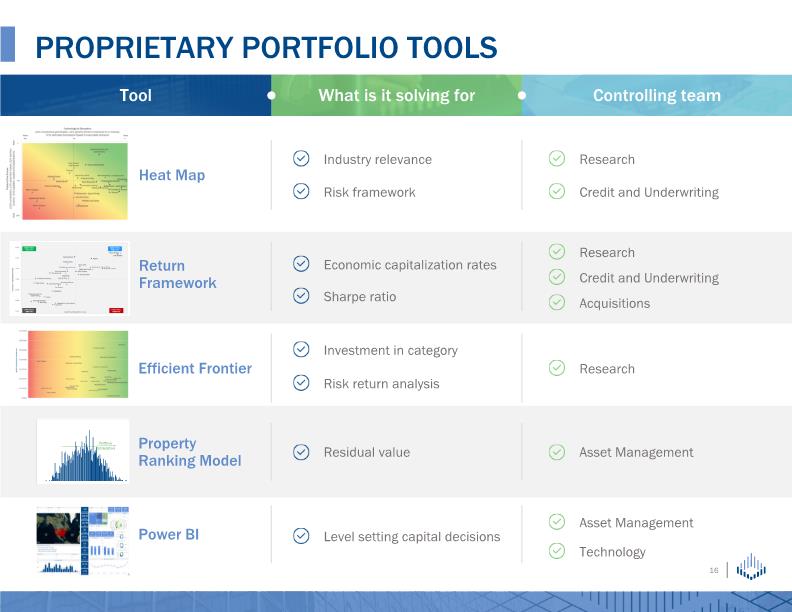
Proprietary portfolio tools Power BI Heat Map Efficient Frontier Return Framework Property Ranking Model Industry relevance Risk framework Economic capitalization rates Sharpe ratio Investment in category Risk return analysis Residual value Level setting capital decisions Research Credit and Underwriting Research Asset Management Asset Management Technology Research Acquisitions Credit and Underwriting What is it solving for Controlling team Tool
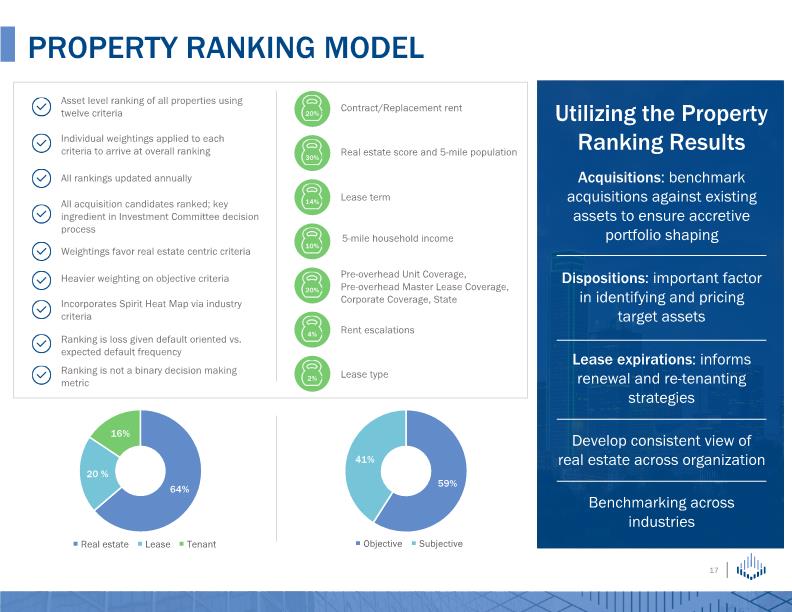
property ranking model Asset level ranking of all properties using twelve criteria Contract/Replacement rent Real estate score and 5-mile population Lease term 5-mile household income Pre-overhead Unit Coverage, Pre-overhead Master Lease Coverage, Corporate Coverage, State Rent escalations Lease type Individual weightings applied to each criteria to arrive at overall ranking All rankings updated annually All acquisition candidates ranked; key ingredient in Investment Committee decision process Weightings favor real estate centric criteria Heavier weighting on objective criteria Incorporates Spirit Heat Map via industry criteria Ranking is loss given default oriented vs. expected default frequency Ranking is not a binary decision making metric Lease expirations: informs renewal and re-tenanting strategies Develop consistent view of real estate across organization Benchmarking across industries Acquisitions: benchmark acquisitions against existing assets to ensure accretive portfolio shaping Dispositions: important factor in identifying and pricing target assets Utilizing the Property Ranking Results
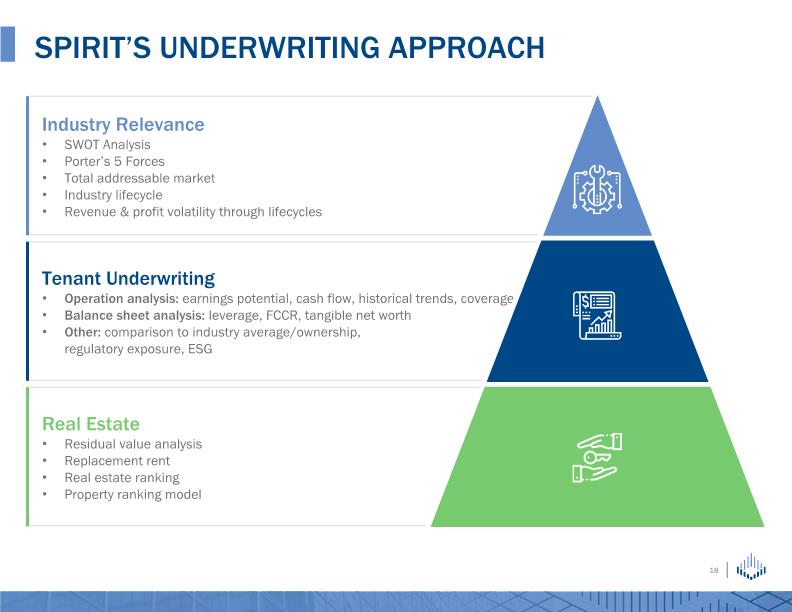
Spirit’s underwriting approach Industry Relevance SWOT Analysis Porter’s 5 Forces Total addressable market Industry lifecycle Revenue & profit volatility through lifecycles Tenant Underwriting Operation analysis: earnings potential, cash flow, historical trends, coverage Balance sheet analysis: leverage, FCCR, tangible net worth Other: comparison to industry average/ownership, regulatory exposure, ESG Real Estate Residual value analysis Replacement rent Real estate ranking Property ranking model
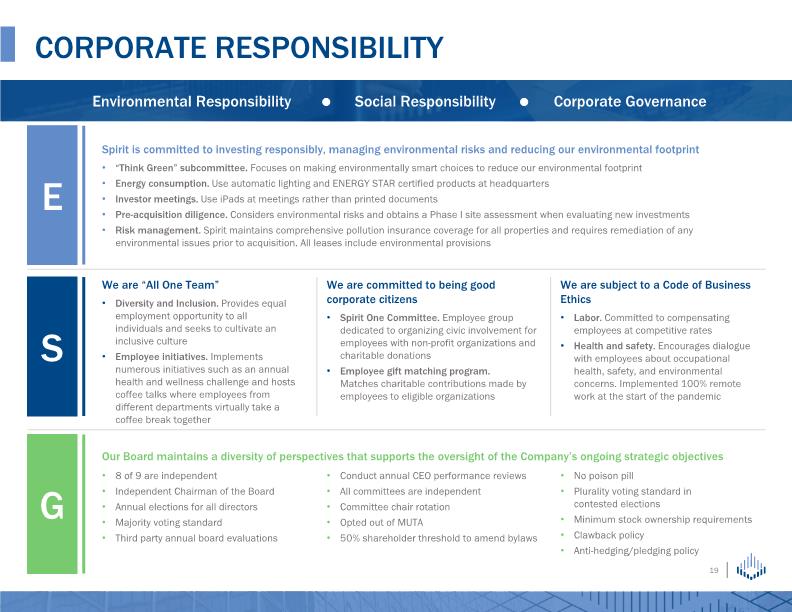
CORPORATE RESPONSIBILITY E Spirit is committed to investing responsibly, managing environmental risks and reducing our environmental footprint “Think Green” subcommittee. Focuses on making environmentally smart choices to reduce our environmental footprint Energy consumption. Use automatic lighting and ENERGY STAR certified products at headquarters Investor meetings. Use iPads at meetings rather than printed documents Pre-acquisition diligence. Considers environmental risks and obtains a Phase I site assessment when evaluating new investments Risk management. Spirit maintains comprehensive pollution insurance coverage for all properties and requires remediation of any environmental issues prior to acquisition. All leases include environmental provisions We are “All One Team” Diversity and Inclusion. Provides equal employment opportunity to all individuals and seeks to cultivate an inclusive culture Employee initiatives. Implements numerous initiatives such as an annual health and wellness challenge and hosts coffee talks where employees from different departments virtually take a coffee break together We are committed to being good corporate citizens Spirit One Committee. Employee group dedicated to organizing civic involvement for employees with non-profit organizations and charitable donations Employee gift matching program. Matches charitable contributions made by employees to eligible organizations We are subject to a Code of Business Ethics Labor. Committed to compensating employees at competitive rates Health and safety. Encourages dialogue with employees about occupational health, safety, and environmental concerns. Implemented 100% remote work at the start of the pandemic S G Our Board maintains a diversity of perspectives that supports the oversight of the Company’s ongoing strategic objectives
Financial Presentation and Non-GAAP Reconciliations
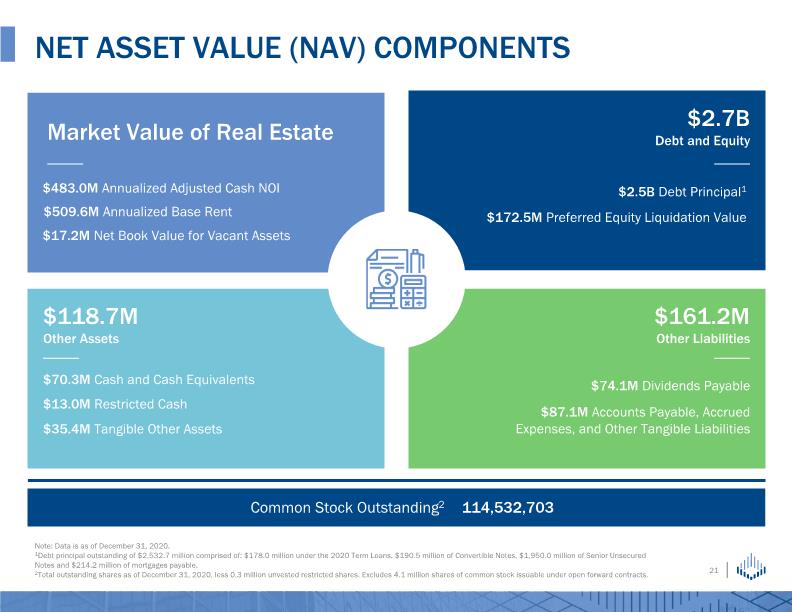
Net Asset Value (NAV) Components Market Value of Real Estate $2.7B Debt and Equity $118.7M Other Assets $161.2M Other Liabilities $509.6M Annualized Base Rent $17.2M Net Book Value for Vacant Assets $2.5B Debt Principal1 $172.5M Preferred Equity Liquidation Value $70.3M Cash and Cash Equivalents $13.0M Restricted Cash $35.4M Tangible Other Assets $74.1M Dividends Payable $87.1M Accounts Payable, Accrued Expenses, and Other Tangible Liabilities $483.0M Annualized Adjusted Cash NOI Note: Data is as of December 31, 2020. 1Debt principal outstanding of $2,532.7 million comprised of: $178.0 million under the 2020 Term Loans, $190.5 million of Convertible Notes, $1,950.0 million of Senior Unsecured Notes and $214.2 million of mortgages payable. 2Total outstanding shares as of December 31, 2020, less 0.3 million unvested restricted shares. Excludes 4.1 million shares of common stock issuable under open forward contracts.
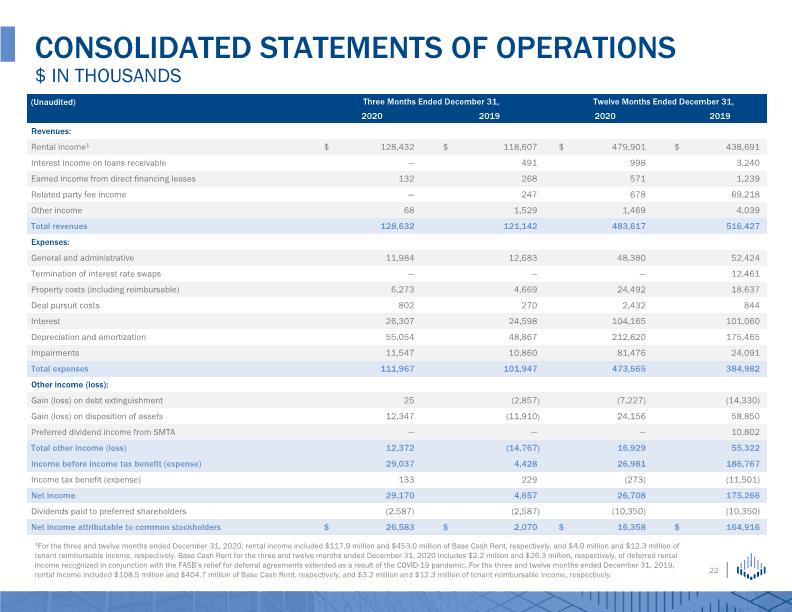
CONSOLIDATED STATEMENTS OF OPERATIONS $ IN THOUSANDS 1For the three and twelve months ended December 31, 2020, rental income included $117.9 million and $453.0 million of Base Cash Rent, respectively, and $4.0 million and $12.3 million of tenant reimbursable income, respectively. Base Cash Rent for the three and twelve months ended December 31, 2020 includes $2.2 million and $26.3 million, respectively, of deferred rental income recognized in conjunction with the FASB’s relief for deferral agreements extended as a result of the COVID-19 pandemic. For the three and twelve months ended December 31, 2019, rental income included $108.5 million and $404.7 million of Base Cash Rent, respectively, and $3.2 million and $12.3 million of tenant reimbursable income, respectively.
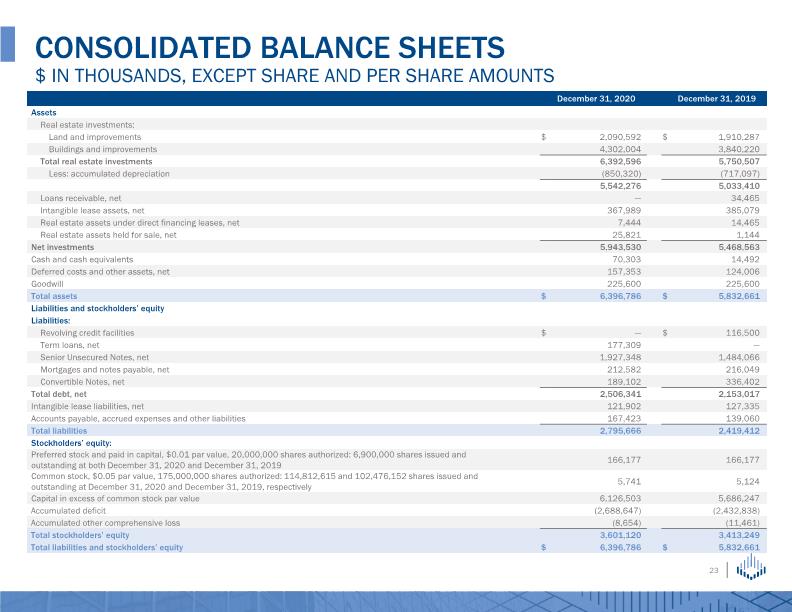
CONSOLIDATED BALANCE SHEETS $ IN THOUSANDS, EXCEPT SHARE AND PER SHARE AMOUNTS
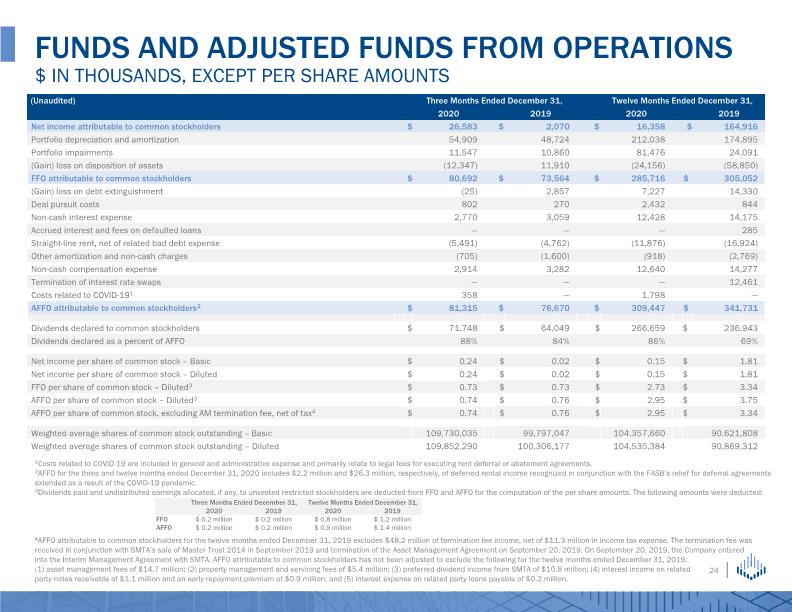
FUNDS AND ADJUSTED FUNDS FROM OPERATIONS $ IN THOUSANDS, EXCEPT PER SHARE AMOUNTS 1Costs related to COVID-19 are included in general and administrative expense and primarily relate to legal fees for executing rent deferral or abatement agreements. 2AFFO for the three and twelve months ended December 31, 2020 includes $2.2 million and $26.3 million, respectively, of deferred rental income recognized in conjunction with the FASB’s relief for deferral agreements extended as a result of the COVID-19 pandemic. 3Dividends paid and undistributed earnings allocated, if any, to unvested restricted stockholders are deducted from FFO and AFFO for the computation of the per share amounts. The following amounts were deducted: 4AFFO attributable to common stockholders for the twelve months ended December 31, 2019 excludes $48.2 million of termination fee income, net of $11.3 million in income tax expense. The termination fee was received in conjunction with SMTA’s sale of Master Trust 2014 in September 2019 and termination of the Asset Management Agreement on September 20, 2019. On September 20, 2019, the Company entered into the Interim Management Agreement with SMTA. AFFO attributable to common stockholders has not been adjusted to exclude the following for the twelve months ended December 31, 2019: (1) asset management fees of $14.7 million; (2) property management and servicing fees of $5.4 million; (3) preferred dividend income from SMTA of $10.8 million; (4) interest income on related party notes receivable of $1.1 million and an early repayment premium of $0.9 million; and (5) interest expense on related party loans payable of $0.2 million.
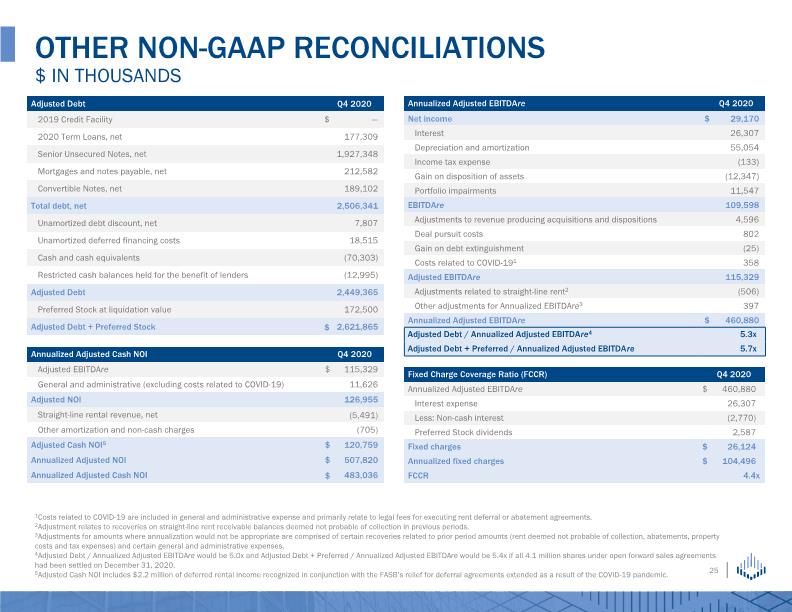
Other NON-GAAP RECONCILIATIONS $ in thousands 1Costs related to COVID-19 are included in general and administrative expense and primarily relate to legal fees for executing rent deferral or abatement agreements. 2Adjustment relates to recoveries on straight-line rent receivable balances deemed not probable of collection in previous periods. 3Adjustments for amounts where annualization would not be appropriate are comprised of certain recoveries related to prior period amounts (rent deemed not probable of collection, abatements, property costs and tax expenses) and certain general and administrative expenses. 4Adjusted Debt / Annualized Adjusted EBITDAre would be 5.0x and Adjusted Debt + Preferred / Annualized Adjusted EBITDAre would be 5.4x if all 4.1 million shares under open forward sales agreements had been settled on December 31, 2020. 5Adjusted Cash NOI includes $2.2 million of deferred rental income recognized in conjunction with the FASB’s relief for deferral agreements extended as a result of the COVID-19 pandemic.
Appendix
NON-GAAP DEFINITIONS AND EXPLANATIONS
OTHER DEFINITIONS AND EXPLANATIONS
FORWARD-LOOKING STATEMENTS AND RISK FACTORS The information in this presentation report should be read in conjunction with the accompanying earnings press release, as well as the Company's Annual Report on Form 10-K and other information filed with the Securities and Exchange Commission. This presentation report is not incorporated into such filings. This document is not an offer to sell or a solicitation to buy securities of Spirit Realty Capital, Inc. Any offer or solicitation shall be made only by means of a prospectus approved for that purpose. This presentation report contains forward-looking statements within the meaning of Section 27A of the Securities Act of 1933, as amended, and Section 21E of the Exchange Act of 1934, as amended. When used in this presentation report, the words “estimate,” “anticipate,” “expect,” “believe,” “intend,” “may,” “will,” “should,” “seek,” “approximately” or “plan,” or the negative of these words or similar words or phrases that are predictions of or indicate future events or trends and which do not relate solely to historical matters are intended to identify forward-looking statements. You can also identify forward-looking statements by discussions of strategy, plans or intentions of management. Forward-looking statements involve numerous risks and uncertainties and you should not rely on them as predictions of future events. Forward-looking statements depend on assumptions, data or methods that may be incorrect or imprecise, and Spirit may not be able to realize them. Spirit does not guarantee that the transactions and events described will happen as described (or that they will happen at all). The following risks and uncertainties, among others, could cause actual results and future events to differ materially from those set forth or contemplated in the forward-looking statements: industry and economic conditions; volatility and uncertainty in the financial markets, including potential fluctuations in the CPI; Spirit's success in implementing its business strategy and its ability to identify, underwrite, finance, consummate, integrate and manage diversifying acquisitions or investments; the financial performance of Spirit's retail tenants and the demand for retail space; Spirit's ability to diversify its tenant base; the nature and extent of future competition; increases in Spirit's costs of borrowing as a result of changes in interest rates and other factors; Spirit's ability to access debt and equity capital markets; Spirit's ability to pay down, refinance, restructure and/or extend its indebtedness as it becomes due; Spirit's ability and willingness to renew its leases upon expiration and to reposition its properties on the same or better terms upon expiration in the event such properties are not renewed by tenants or Spirit exercises its rights to replace existing tenants upon default; the impact of any financial, accounting, legal or regulatory issues or litigation that may affect Spirit or its major tenants; Spirit's ability to manage its expanded operations; Spirit's ability and willingness to maintain its qualification as a REIT under the Internal Revenue Code of 1986, as amended; the impact on Spirit’s business and those of its tenants from epidemics, pandemics or other outbreaks of illness, disease or virus (such as the strain of coronavirus known as COVID-19); and other risks inherent in the real estate business, including tenant defaults, potential liability relating to environmental matters, illiquidity of real estate investments and potential damages from natural disasters discussed in Spirit's most recent filings with the Securities and Exchange Commission, including its Annual Report on Form 10-K and subsequent Quarterly Reports on Form 10-Q. You are cautioned not to place undue reliance on forward-looking statements, which speak only as of the date of this presentation report. While forward-looking statements reflect Spirit's good faith beliefs, they are not guarantees of future performance. Spirit disclaims any obligation to publicly update or revise any forward-looking statement to reflect changes in underlying assumptions or factors, new information, data or methods, future events or other changes, except as required by law. In addition to U.S. GAAP financial measures, this presentation contains and may refer to certain non-GAAP financial measures. These non-GAAP financial measures are in addition to, not a substitute for or superior to, measures of financial performance prepared in accordance with GAAP. These non-GAAP financial measures should not be considered replacements for, and should be read together with, the most comparable GAAP financial measures. Reconciliations to the most directly comparable GAAP financial measures and statements of why management believes these measures are useful to investors are included in this Appendix if the reconciliation is not presented on the page in which the measure is published.
