Attached files
| file | filename |
|---|---|
| EX-99.1 - EX-99.1 - Customers Bancorp, Inc. | q420pressrelease.htm |
| 8-K - 8-K - Customers Bancorp, Inc. | cubi-20210127.htm |

Fourth Quarter & Full Year 2020 Earnings Conference Call January 28, 2021 NYSE: CUBI “High Tech Forward-Thinking Bank Supported by High Touch”

2 In addition to historical information, this presentation may contain ”forward-looking statements” within the meaning of the ”safe harbor” provisions of the Private Securities Litigation Reform Act of 1995. These forward-looking statements include statements with respect to Customers Bancorp, Inc.’s strategies, goals, beliefs, expectations, estimates, intentions, capital raising efforts, financial condition and results of operations, future performance and business. Statements preceded by, followed by, or that include the words “may,” “could,” “should,” “pro forma,” “looking forward,” “would,” “believe,” “expect,” “anticipate,” “estimate,” “intend,” “plan,” or similar expressions generally indicate a forward-looking statement. These forward-looking statements involve risks and uncertainties that are subject to change based on various important factors (some of which, in whole or in part, are beyond Customers Bancorp, Inc.’s control). Numerous competitive, economic, regulatory, legal and technological events and factors, among others, could cause Customers Bancorp, Inc.’s financial performance to differ materially from the goals, plans, objectives, intentions and expectations expressed in such forward-looking statements, including: the adverse impact on the U.S. economy, including the markets in which we operate, of the coronavirus outbreak, and the impact of a slowing U.S. economy and increased unemployment on the performance of our loan and lease portfolio, the market value of our investment securities, the demand for our products and services and the availability of sources of funding; the effects of actions by the federal government, including the Board of Governors of the Federal Reserve System and other government agencies, that effect market interest rates and the money supply; the actions that we and our customers take in response to these developments and the effects such actions have on our operations, products, services and customer relationships; and the effects of changes in accounting standards or policies, including Accounting Standards Update (ASU) 2016-13, Financial Instruments—Credit Losses (CECL). Customers Bancorp, Inc. cautions that the foregoing factors are not exclusive, and neither such factors nor any such forward-looking statement takes into account the impact of any future events. All forward-looking statements and information set forth herein are based on management’s current beliefs and assumptions as of the date hereof and speak only as of the date they are made. For a more complete discussion of the assumptions, risks and uncertainties related to our business, you are encouraged to review Customers Bancorp, Inc.’s filings with the Securities and Exchange Commission, including its most recent annual report on Form 10-K for the year ended December 31, 2019, subsequently filed quarterly reports on Form 10-Q and current reports on Form 8-K, including any amendments thereto, that update or provide information in addition to the information included in the Form 10-K and Form 10-Q filings, if any. Customers Bancorp, Inc. does not undertake to update any forward-looking statement whether written or oral, that may be made from time to time by Customers Bancorp, Inc. or by or on behalf of Customers Bank, except as may be required under applicable law. This does not constitute an offer to sell, or a solicitation of an offer to buy, any security in any state or jurisdiction in which such offer, solicitation or sale would be unlawful. Forward-Looking Statements

3 Q4 2020 Investor Presentation I. Overview A. Franchise B. Key Features II. Financial Highlights A. Capital Trends B. Credit Quality C. Deposit Mix Shift III. Outlook A. Strategic Priorities B. Guidance IV. Appendix

I. Overview
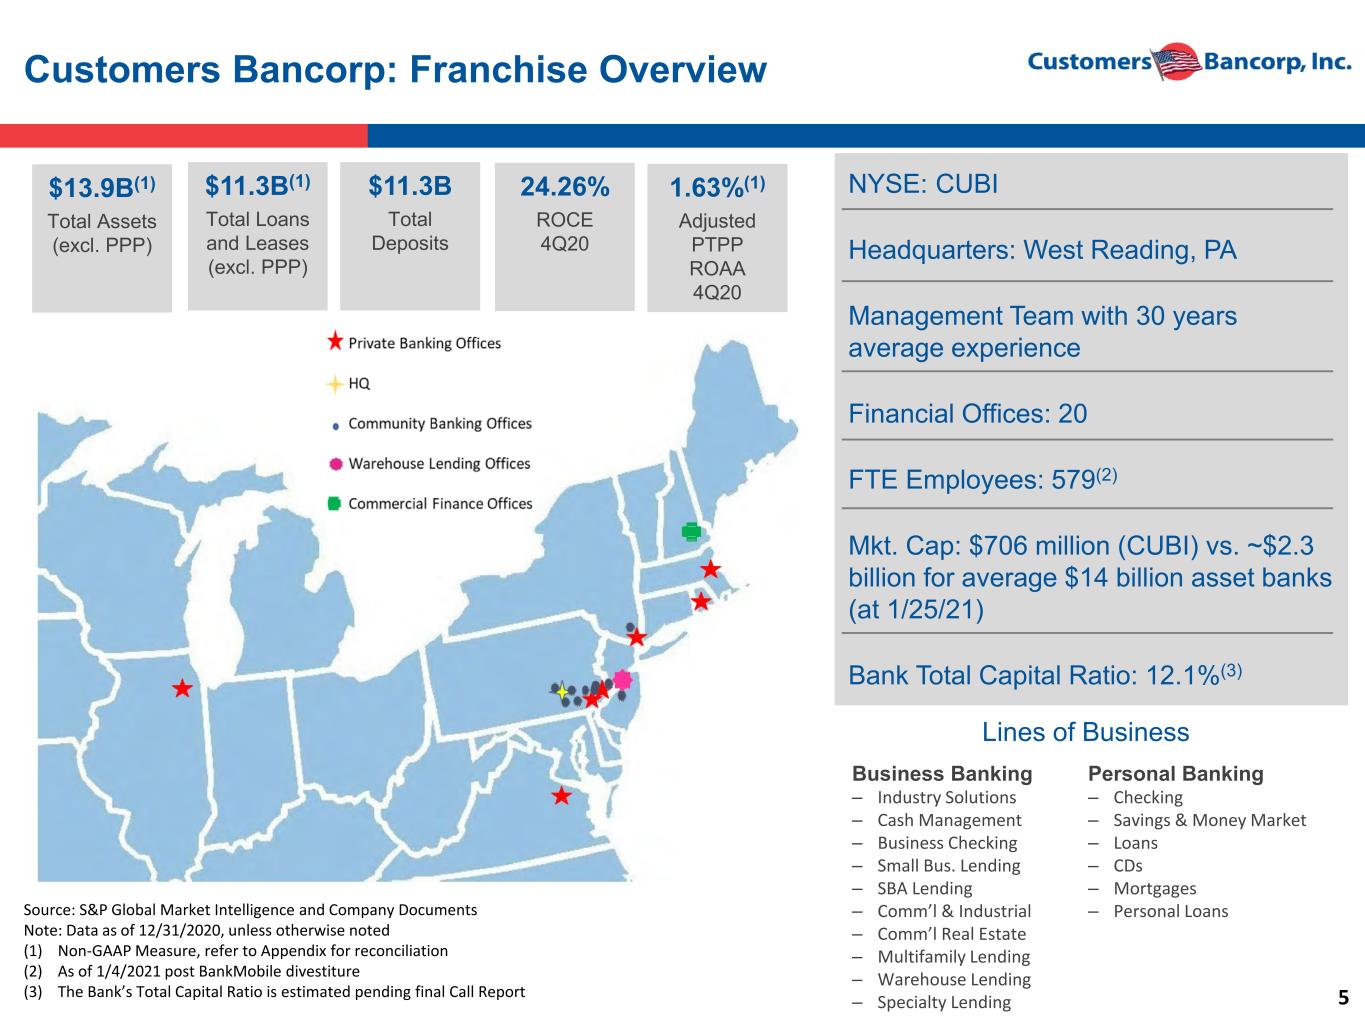
5 Customers Bancorp: Franchise Overview Source: S&P Global Market Intelligence and Company Documents Note: Data as of 12/31/2020, unless otherwise noted (1) Non-GAAP Measure, refer to Appendix for reconciliation (2) As of 1/4/2021 post BankMobile divestiture (3) The Bank’s Total Capital Ratio is estimated pending final Call Report NYSE: CUBI Headquarters: West Reading, PA Management Team with 30 years average experience Financial Offices: 20 FTE Employees: 579(2) Mkt. Cap: $706 million (CUBI) vs. ~$2.3 billion for average $14 billion asset banks (at 1/25/21) Bank Total Capital Ratio: 12.1%(3) Business Banking ‒ Industry Solutions ‒ Cash Management ‒ Business Checking ‒ Small Bus. Lending ‒ SBA Lending ‒ Comm’l & Industrial ‒ Comm’l Real Estate ‒ Multifamily Lending ‒ Warehouse Lending ‒ Specialty Lending Personal Banking ‒ Checking ‒ Savings & Money Market ‒ Loans ‒ CDs ‒ Mortgages ‒ Personal Loans Lines of Business $11.3B(1) Total Loans and Leases (excl. PPP) $13.9B(1) Total Assets (excl. PPP) $11.3B Total Deposits 24.26% ROCE 4Q20 1.63%(1) Adjusted PTPP ROAA 4Q20

6 Customers Bancorp: Key Features Customers is a high performing technology and relationship-driven commercial bank primarily servicing the Mid-Atlantic and New England regions. From Startup to ~$14 Billion in Total Assets (excl. PPP)(1) in ~11 Years • The Bank was effectively launched in 2010 by the current management team to clean up a $250 million-in-assets failing bank • Growth was paused for two years to build capital, take advantage of the Durbin exemption and position the Bank to divest BankMobile Technologies, Inc. (“BMT”). The BMT divestiture closed on January 4, 2021. Highly Experienced Management Team • The team averages 30+ years in banking and financial services and has significant financial technology expertise Outstanding Credit and Risk Culture with Strong Core Deposit Growth • Asset quality has historically performed in line with or better than peers and is expected to continue to do so during the current economic downturn for the following reasons: • Focus on low-risk niches • Comprehensive underwriting standards and processes and a conservative credit culture • Core deposit growth has been strong. Noninterest bearing DDAs are 21% and non-time deposits are 94% of total deposits. Very Focused with Stated Long-Term Goals • The Bank’s strategy is built on a single point of contact model, principally “Private Banking for Privately held Businesses,” a differentiating approach • We will continue to develop an industry leading in-house digital bank supported by a digital lending platform primarily supporting small businesses and consumers • We seek to continuously improve the quality of the balance sheet and franchise • Capital allocation and strong risk management are key components of our asset and earnings generation decision-making process • We are well positioned to execute on our goals, seeking to earn above $4.00 in core EPS in 2021, $4.50 in core EPS in 2023 and $6.00 in core EPS in 2026 (1) Non-GAAP Measure, refer to Appendix for reconciliation
7 Customers Bancorp: Digital Bank Transformation Branch Light Strategy Supported by Private Banking Teams • Customers Bank is among the least branch-reliant banks in the U.S. Private Banking Teams work out of Private Banking Offices. • The Bank maintains 12 branches, yielding an average of $942 million in deposits per branch at year-end 2020 • Customers Bank ranked among the top 10 best digital banks of 2021 according to Bankrate.com Superior Digital Capabilities • Among top tech focused PPP lenders in the United States generating over $150 million in revenues for the Bank over the next two years • We offer a fully automated commercial deposit onboarding platform • Created an online deposit product in November 2020 targeted at High-Net-Worth clients; since then we have brought- in over $114 million in deposits across 800 accounts • We utilize top-tier technology platforms including Salesforce, Docusign, ServiceNow, and Snowflake to digitize processes from the front office to the back office • To date, we have digitized and automated 140+ processes, saving over 62,000 in team member hours Digital Lending and Deposits • Digitally originate consumer installment loans directly as well as through Marketplace Lenders (MPLs) originating on our behalf, subject to our credit box • Our technology platform allows us to partner and engage with fintechs in a manner not possible for most commercial banks • Consumer installment loans, mostly sourced digitally, totaled $1.2 billion at year-end 2020 • 2021 roadmap includes launching small business and SBA lending digital programs • Digitally generated deposits totaled $1.3 billion at December 31, 2020, up $424 million year-over-year • We offer proprietary online deposit products including Ascent Money Market Savings, High Yield Savings, and Commercial Interest Checking targeted at small and medium sized businesses, High Net Worth, and Highly Liquid customers

II. Financial Highlights
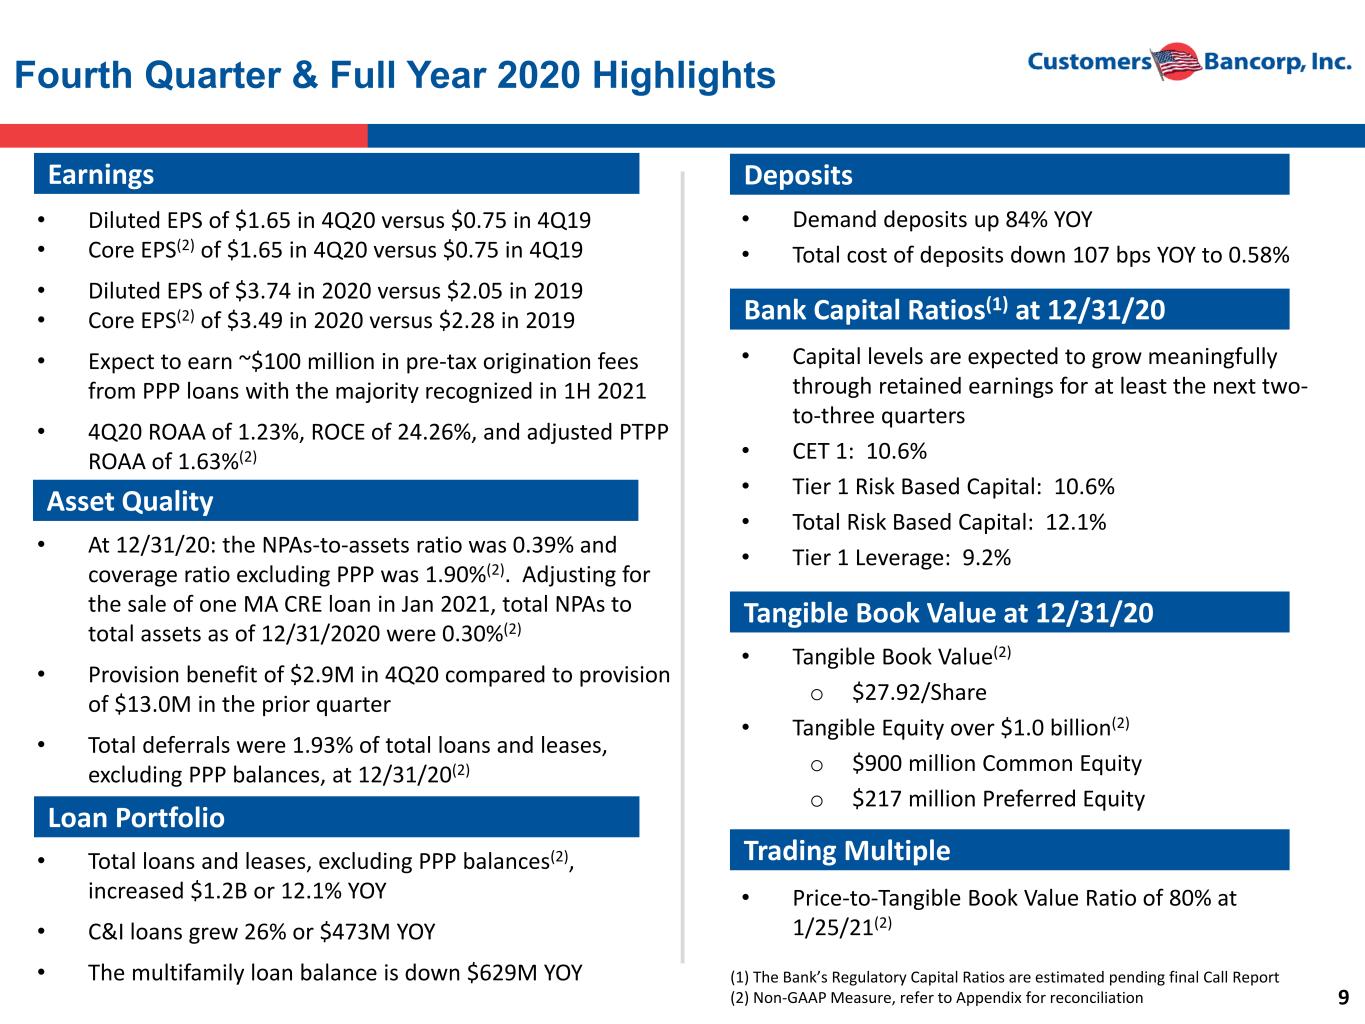
9 Fourth Quarter & Full Year 2020 Highlights • Diluted EPS of $1.65 in 4Q20 versus $0.75 in 4Q19 • Core EPS(2) of $1.65 in 4Q20 versus $0.75 in 4Q19 • Diluted EPS of $3.74 in 2020 versus $2.05 in 2019 • Core EPS(2) of $3.49 in 2020 versus $2.28 in 2019 • Expect to earn ~$100 million in pre-tax origination fees from PPP loans with the majority recognized in 1H 2021 • 4Q20 ROAA of 1.23%, ROCE of 24.26%, and adjusted PTPP ROAA of 1.63%(2) • At 12/31/20: the NPAs-to-assets ratio was 0.39% and coverage ratio excluding PPP was 1.90%(2). Adjusting for the sale of one MA CRE loan in Jan 2021, total NPAs to total assets as of 12/31/2020 were 0.30%(2) • Provision benefit of $2.9M in 4Q20 compared to provision of $13.0M in the prior quarter • Total deferrals were 1.93% of total loans and leases, excluding PPP balances, at 12/31/20(2) • Total loans and leases, excluding PPP balances(2), increased $1.2B or 12.1% YOY • C&I loans grew 26% or $473M YOY • The multifamily loan balance is down $629M YOY Deposits • Demand deposits up 84% YOY • Total cost of deposits down 107 bps YOY to 0.58% Capital Ratios* • Capital levels are expected to grow meaningfully through retained earnings for at least the next two- to-three quarters • CET 1: 10.6% • Tier 1 Risk Based Capital: 10.6% • Total Risk Based Capital: 12.1% • Tier 1 Leverage: 9.2% • Tangible Book Value(2) o $27.92/Share • Tangible Equity over $1.0 billion(2) o $900 million Common Equity o $217 million Preferred Equity • Price-to-Tangible Book Value Ratio of 80% at 1/25/21(2) (1) The Bank’s Regulatory Capital Ratios are estimated pending final Call Report (2) Non-GAAP Measure, refer to Appendix for reconciliation Earnings Asset Quality Loan Portfolio posits Tangible Book Value at 12/31/20 Bank Capital Ratios(1) at 12/31/20 Trading Multiple

10 Sling Shot – Increase in Tangible Common Equity Customers Bancorp: Actual & Projected Capital Metrics Highlights: • Added $118 million in retained earnings in 2020 (Excl. day 1 CECL impact) • Our participation in the Paycheck Protection Program, as well as strong core earnings, will have a “sling shot” effect on tangible common equity. • Tangible Common Equity (TCE) to Total Assets (TA) Ratios are currently deflated primarily due to a temporarily larger balance sheet tied to PPP loans and elevated mortgage warehouse balances. • We project the recognition of PPP deferred origination fees and interest income to drive the Company’s TCE/TA Ratio(1) excluding PPP loans to 7.5%-8.0% and Total Capital Ratio to greater than 13.0% by year-end 2021. • Customers Bancorp has another $217 million in preferred equity boosting its tangible equity to tangible assets by another ~150bps (1) Refers to tangible common equity-to-tangible assets excluding PPP loans. This is a non- GAAP measure; please refer to the Appendix for reconciliation. (2) 4Q20 Total Capital Ratio estimated pending Final Call Report Note: The “Actual & Projected Capital Metrics” chart includes our estimates of future performance. Please refer to the Forward-Looking Statements slide for more information. 5.0% 6.0% 7.0% 8.0% 9.0% 9.0% 9.5% 10.0% 10.5% 11.0% 11.5% 12.0% 12.5% 13.0% 13.5% TC E / TA R ai o Ex -P PP (1 ) To ta l C ap ita l R at io Total Capital Ratio TCE / TA Ratio ex-PPP (2) (1)
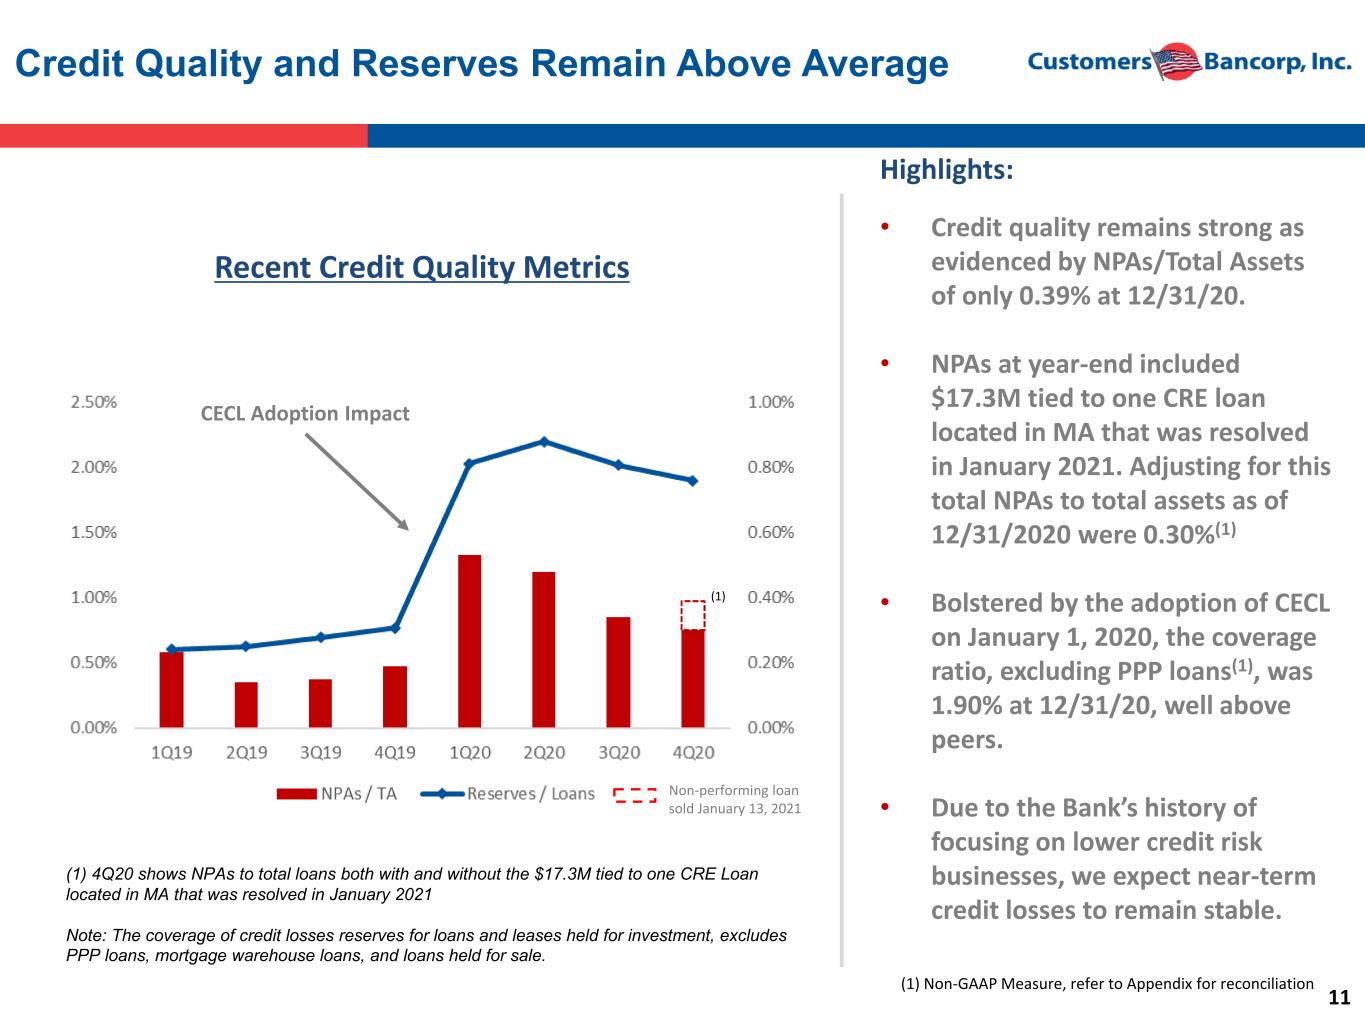
11 Credit Quality and Reserves Remain Above Average Recent Credit Quality Metrics Highlights: • Credit quality remains strong as evidenced by NPAs/Total Assets of only 0.39% at 12/31/20. • NPAs at year-end included $17.3M tied to one CRE loan located in MA that was resolved in January 2021. Adjusting for this total NPAs to total assets as of 12/31/2020 were 0.30%(1) • Bolstered by the adoption of CECL on January 1, 2020, the coverage ratio, excluding PPP loans(1), was 1.90% at 12/31/20, well above peers. • Due to the Bank’s history of focusing on lower credit risk businesses, we expect near-term credit losses to remain stable. (1) 4Q20 shows NPAs to total loans both with and without the $17.3M tied to one CRE Loan located in MA that was resolved in January 2021 Note: The coverage of credit losses reserves for loans and leases held for investment, excludes PPP loans, mortgage warehouse loans, and loans held for sale. (1) Non-GAAP Measure, refer to Appendix for reconciliation CECL Adoption Impact Non-performing loan sold January 13, 2021 (1)

12 Loan Portfolio & Mix Shift 12/31/20(1) (1). Excludes PPP loan balances, Non-GAAP Measure, refer to Appendix for reconciliation 12/31/19 Total Loans (excl. PPP) - $11.3BTotal Loans (excl. PPP) - $10.1B
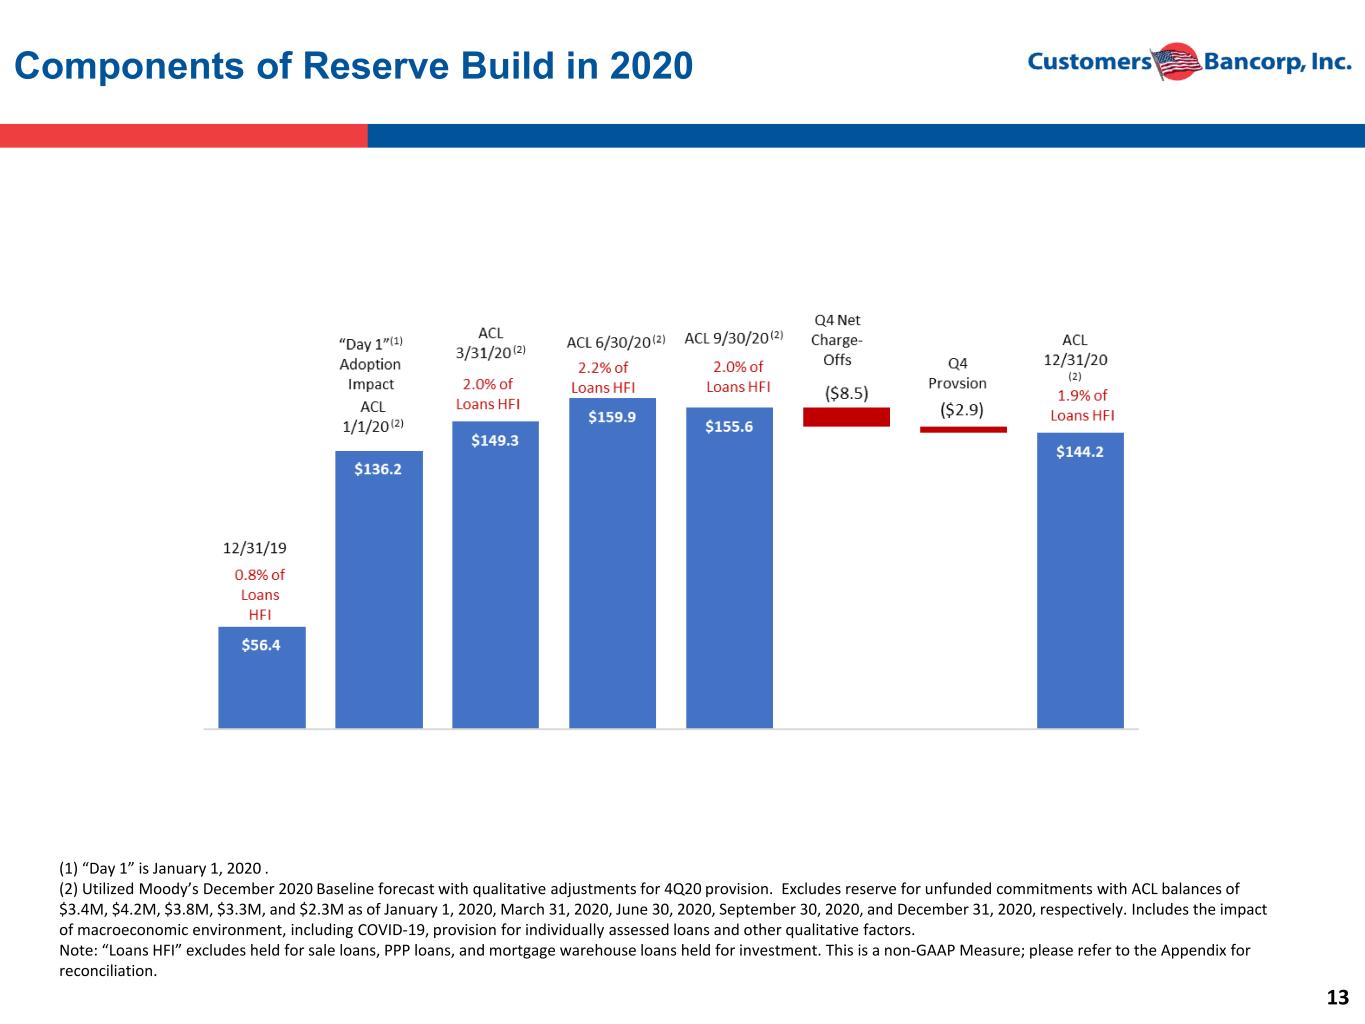
13 Components of Reserve Build in 2020 (1) “Day 1” is January 1, 2020 . (2) Utilized Moody’s December 2020 Baseline forecast with qualitative adjustments for 4Q20 provision. Excludes reserve for unfunded commitments with ACL balances of $3.4M, $4.2M, $3.8M, $3.3M, and $2.3M as of January 1, 2020, March 31, 2020, June 30, 2020, September 30, 2020, and December 31, 2020, respectively. Includes the impact of macroeconomic environment, including COVID-19, provision for individually assessed loans and other qualitative factors. Note: “Loans HFI” excludes held for sale loans, PPP loans, and mortgage warehouse loans held for investment. This is a non-GAAP Measure; please refer to the Appendix for reconciliation.
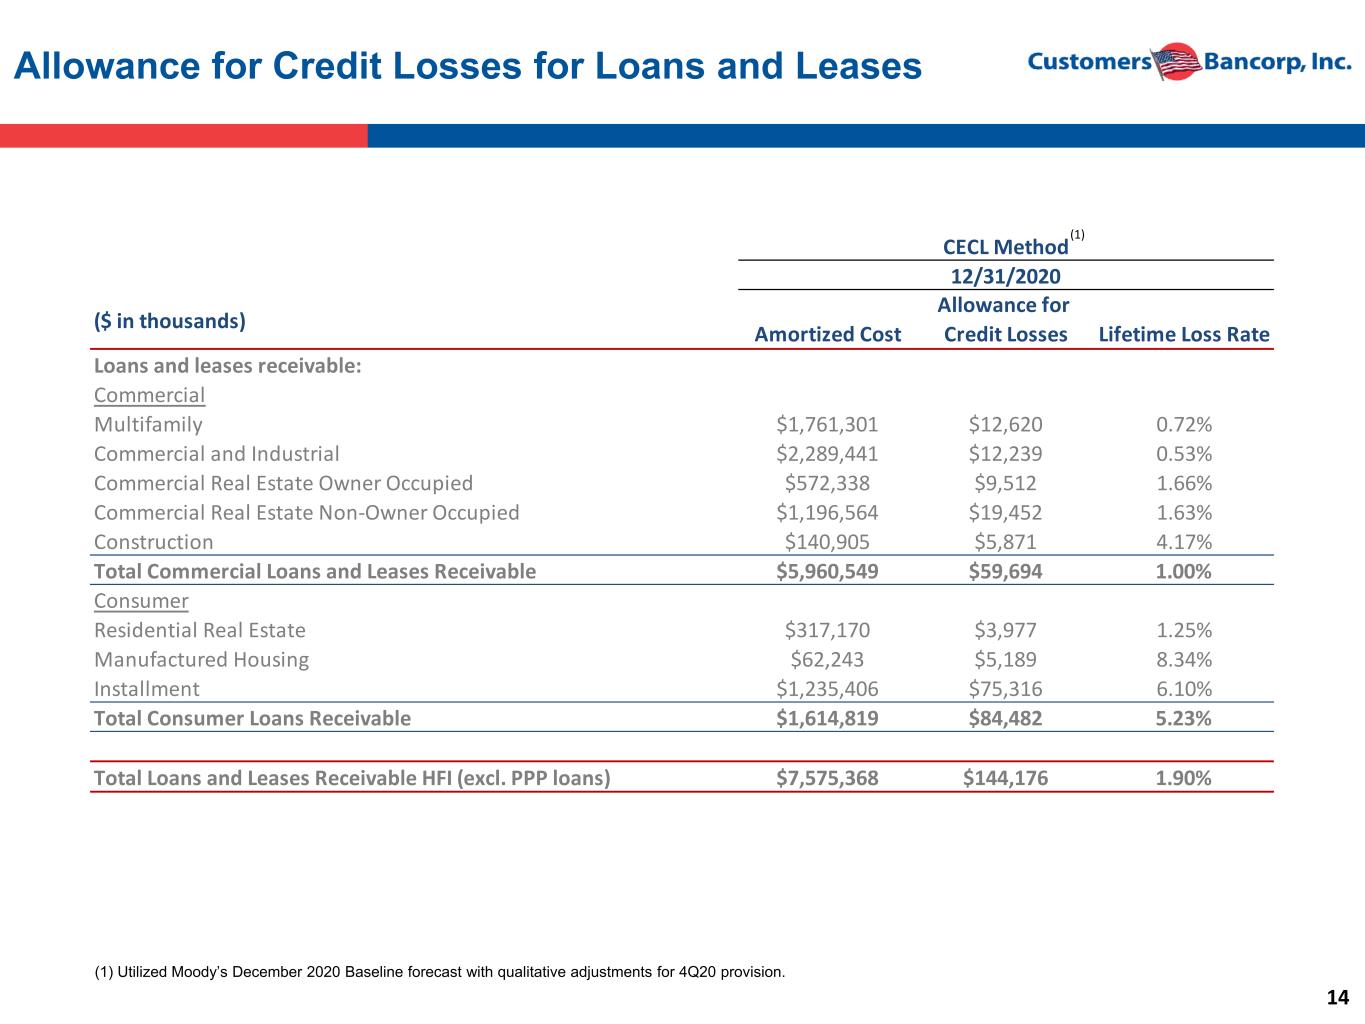
14 Allowance for Credit Losses for Loans and Leases (1) Utilized Moody’s December 2020 Baseline forecast with qualitative adjustments for 4Q20 provision. (1) CECL Method 12/31/2020 ($ in thousands) Amortized Cost Allowance for Credit Losses Lifetime Loss Rate Loans and leases receivable: Commercial Multifamily $1,761,301 $12,620 0.72% Commercial and Industrial $2,289,441 $12,239 0.53% Commercial Real Estate Owner Occupied $572,338 $9,512 1.66% Commercial Real Estate Non-Owner Occupied $1,196,564 $19,452 1.63% Construction $140,905 $5,871 4.17% Total Commercial Loans and Leases Receivable $5,960,549 $59,694 1.00% Consumer Residential Real Estate $317,170 $3,977 1.25% Manufactured Housing $62,243 $5,189 8.34% Installment $1,235,406 $75,316 6.10% Total Consumer Loans Receivable $1,614,819 $84,482 5.23% Total Loans and Leases Receivable HFI (excl. PPP loans) $7,575,368 $144,176 1.90%
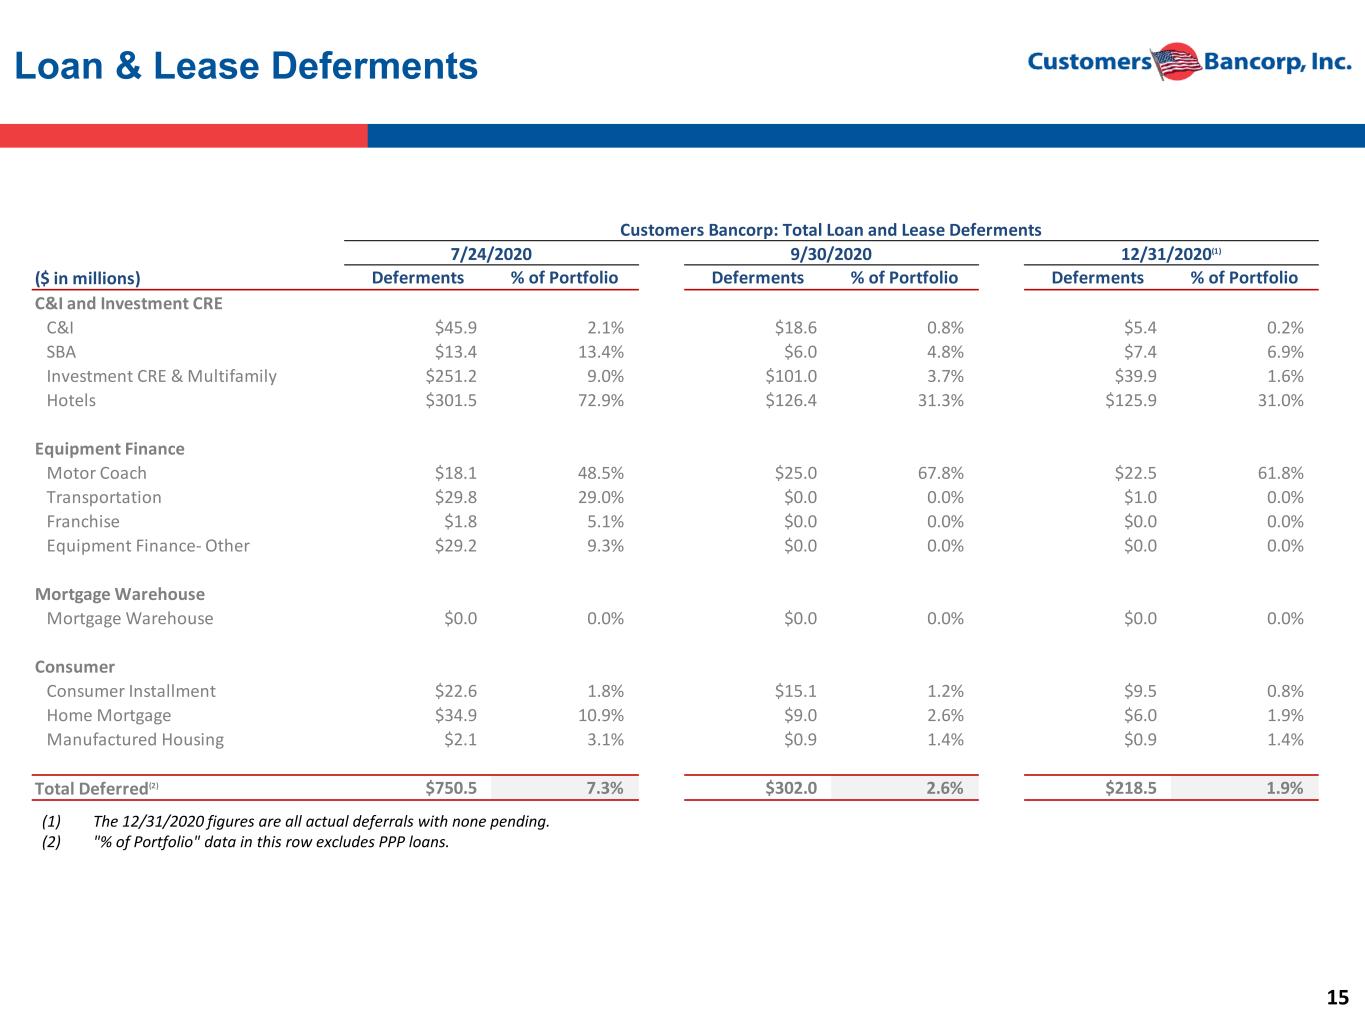
15 Loan & Lease Deferments Customers Bancorp: Total Loan and Lease Deferments 7/24/2020 9/30/2020 12/31/2020(1) ($ in millions) Deferments % of Portfolio Deferments % of Portfolio Deferments % of Portfolio C&I and Investment CRE C&I $45.9 2.1% $18.6 0.8% $5.4 0.2% SBA $13.4 13.4% $6.0 4.8% $7.4 6.9% Investment CRE & Multifamily $251.2 9.0% $101.0 3.7% $39.9 1.6% Hotels $301.5 72.9% $126.4 31.3% $125.9 31.0% Equipment Finance Motor Coach $18.1 48.5% $25.0 67.8% $22.5 61.8% Transportation $29.8 29.0% $0.0 0.0% $1.0 0.0% Franchise $1.8 5.1% $0.0 0.0% $0.0 0.0% Equipment Finance- Other $29.2 9.3% $0.0 0.0% $0.0 0.0% Mortgage Warehouse Mortgage Warehouse $0.0 0.0% $0.0 0.0% $0.0 0.0% Consumer Consumer Installment $22.6 1.8% $15.1 1.2% $9.5 0.8% Home Mortgage $34.9 10.9% $9.0 2.6% $6.0 1.9% Manufactured Housing $2.1 3.1% $0.9 1.4% $0.9 1.4% Total Deferred(2) $750.5 7.3% $302.0 2.6% $218.5 1.9% (1) The 12/31/2020 figures are all actual deferrals with none pending. (2) "% of Portfolio" data in this row excludes PPP loans.

16 Majority Deferments - Principal Only 12/31/2020 Commercial Loan Deferments ($ in millions) Total Deferments Principal Only % of Portfolio Principal & Interest % of Portfolio C&I $5.4 $0.0 0% $5.4 100.0% SBA $7.4 $0.0 0% $7.4 100.0% Investment CRE & Multifamily $39.9 $38.0 95% $1.9 4.8% Hotels $125.9 $66.7 53% $59.2 47.0% Motor Coach $22.5 $2.7 12% $19.8 88.0% Transportation $1.0 $0.0 0% $1.0 100.0% Franchise $0.0 $0.0 0% $0.0 0.0% Other $0.0 $0.0 0% $0.0 0.0% Total Deferred(2) $202.1 $107.4 53.1% $94.7 46.9%

17 COVID-19 At-Risk Industries (1) Total Loans excluding PPP loans, Non-GAAP Measure, refer to Appendix for reconciliation COVID-19 At-Risk Industries as identified by Customers totaled only 6.1% of loans at 12/31/20, excluding PPP loans(1) Remaining Portfolio Hospitality Energy/Utilities Colleges and Universities CRE Retail Sales Dining Entertainment -only Total Loans1 at 12/31/20: $11.3B Loan % of Loan Balance Total Deferrals Industry (M) Loans (M) Hospitality $406 3.6% $126 Energy/Utilities $87 0.8% $0 Colleges and Universities $62 0.5% $0 Retail Sales $72 0.6% $0 Dining $30 0.3% $0 Entertainment-only $27 0.2% $0 Remaining Portfolio $10,588 93.9% $76 Total Loans1 $11,271 100.0% $202 COVID-19 At-Risk Industries (12/31/20)

18 Hospitality Loans Portfolio as of 12/31/2020 • Total portfolio of approximately $406M, which represents approximately 3.6% of the Bank’s total loans excluding PPP balances Portfolio Composition • Nearly 20.0% ($81.0M) is currently operating under government contracts for transitional housing • Approximately 4.0% ($15.8M) is comprised of SBA Guaranteed Loans • Nearly 19.0% ($76.1M) represents high-end destination hotels (Cape May/Avalon, NJ; Long Island, NY) that operated near capacity last summer and possess ample access to liquidity to sustain operations • Approximately 43.2% ($172.9M) possessed one of these risk mitigating factors Portfolio Support • Approximately 77.0% ($308.1M) is currently supported by some form of additional support or guarantees • Nearly 79.3% ($317.5M) represents “flagged” facilities, with the majority of the non-flagged being the Cape May/Avalon NJ and Long Island, NY high-end destination hotels Positive Portfolio Trends • Deferments decreased from $301.5M or approximately 72.9% of the hospitality portfolio at 7/24/20 to $125.9M or approximately 31.4% of the hospitality portfolio as of 12/31/2020 • Of the $125.9M in deferments as of 12/31/2020, approximately 53.0% ($66.7M) consisted of principal payment only deferrals • Overall, occupancy trends have been gradually improving. No hospitality loans transitioned into non- performing status in 3Q20 or 4Q20 • We do not expect any hospitality loans to migrate to non-performing status over the next few quarters

19 Healthcare Loans Portfolio as of 12/31/2020: • Total portfolio of approximately $359M • Total number of clients 24 • Average loan size ~$15M Portfolio Composition: • Portfolio consist of Senior Living credit facilities with the majority (95%) in the Skilled Nursing sector • Total number of beds 5500 • Geographic diversity • 34% New York, New Jersey Pennsylvania • 17% New England • 30% Midwest • 17% Southeast Portfolio Support: • Approximately 95.0% ($361M) is currently supported by recourse • Majority of revenue derived from government receivables with excellent collectability Positive Portfolio Trends: • No deferrals requested as of 12/30/2020 • No loans transitioned into Non-Performing Status
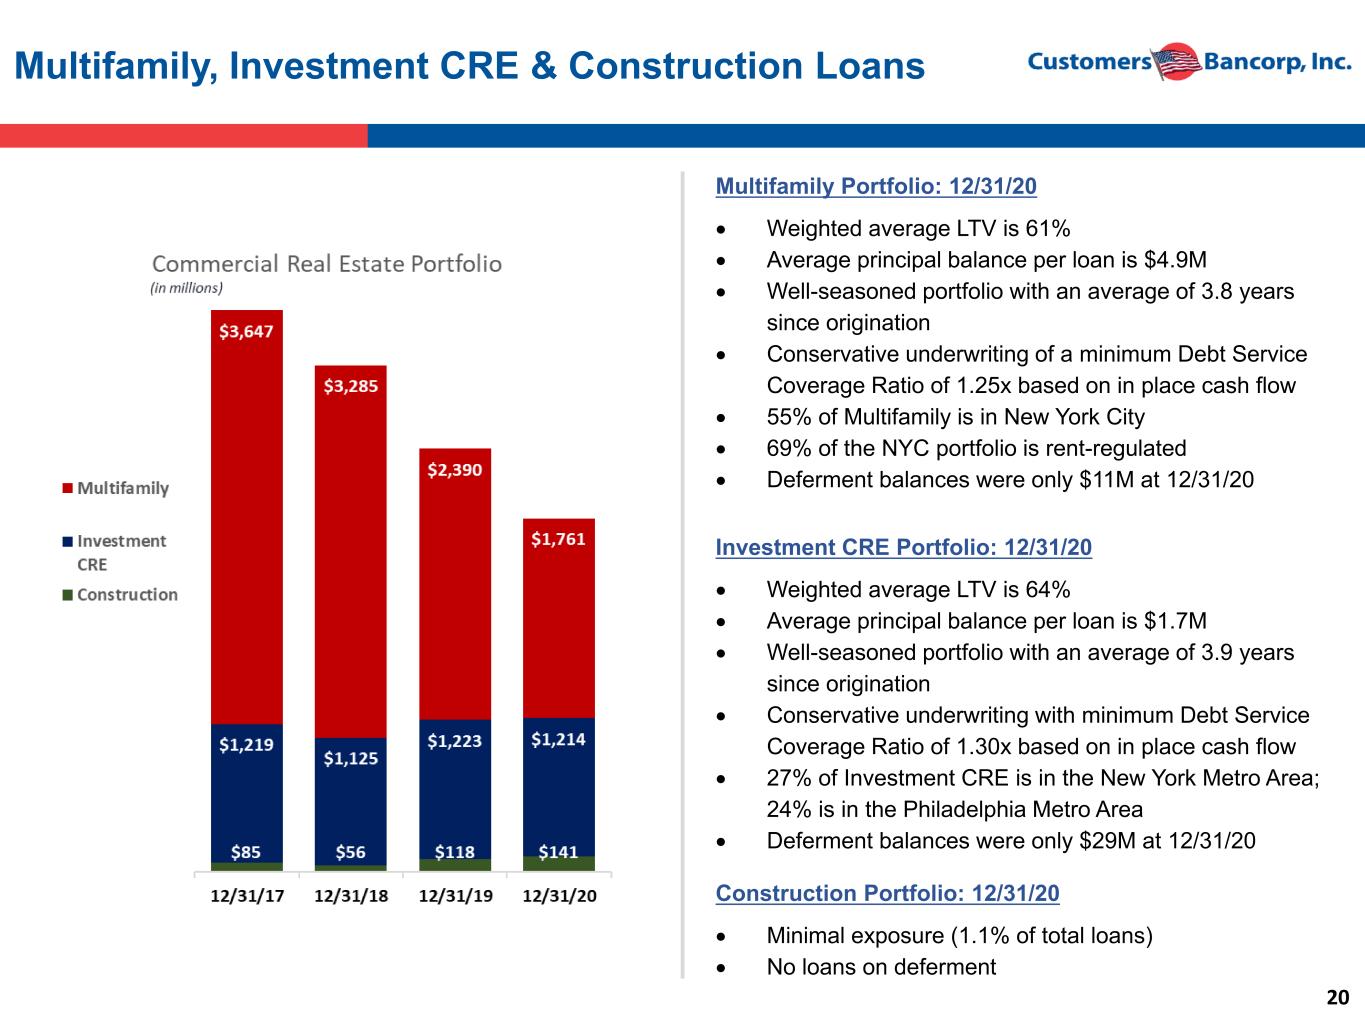
20 Multifamily, Investment CRE & Construction Loans Multifamily Portfolio: 12/31/20 • Weighted average LTV is 61% • Average principal balance per loan is $4.9M • Well-seasoned portfolio with an average of 3.8 years since origination • Conservative underwriting of a minimum Debt Service Coverage Ratio of 1.25x based on in place cash flow • 55% of Multifamily is in New York City • 69% of the NYC portfolio is rent-regulated • Deferment balances were only $11M at 12/31/20 Investment CRE Portfolio: 12/31/20 • Weighted average LTV is 64% • Average principal balance per loan is $1.7M • Well-seasoned portfolio with an average of 3.9 years since origination • Conservative underwriting with minimum Debt Service Coverage Ratio of 1.30x based on in place cash flow • 27% of Investment CRE is in the New York Metro Area; 24% is in the Philadelphia Metro Area • Deferment balances were only $29M at 12/31/20 Construction Portfolio: 12/31/20 • Minimal exposure (1.1% of total loans) • No loans on deferment
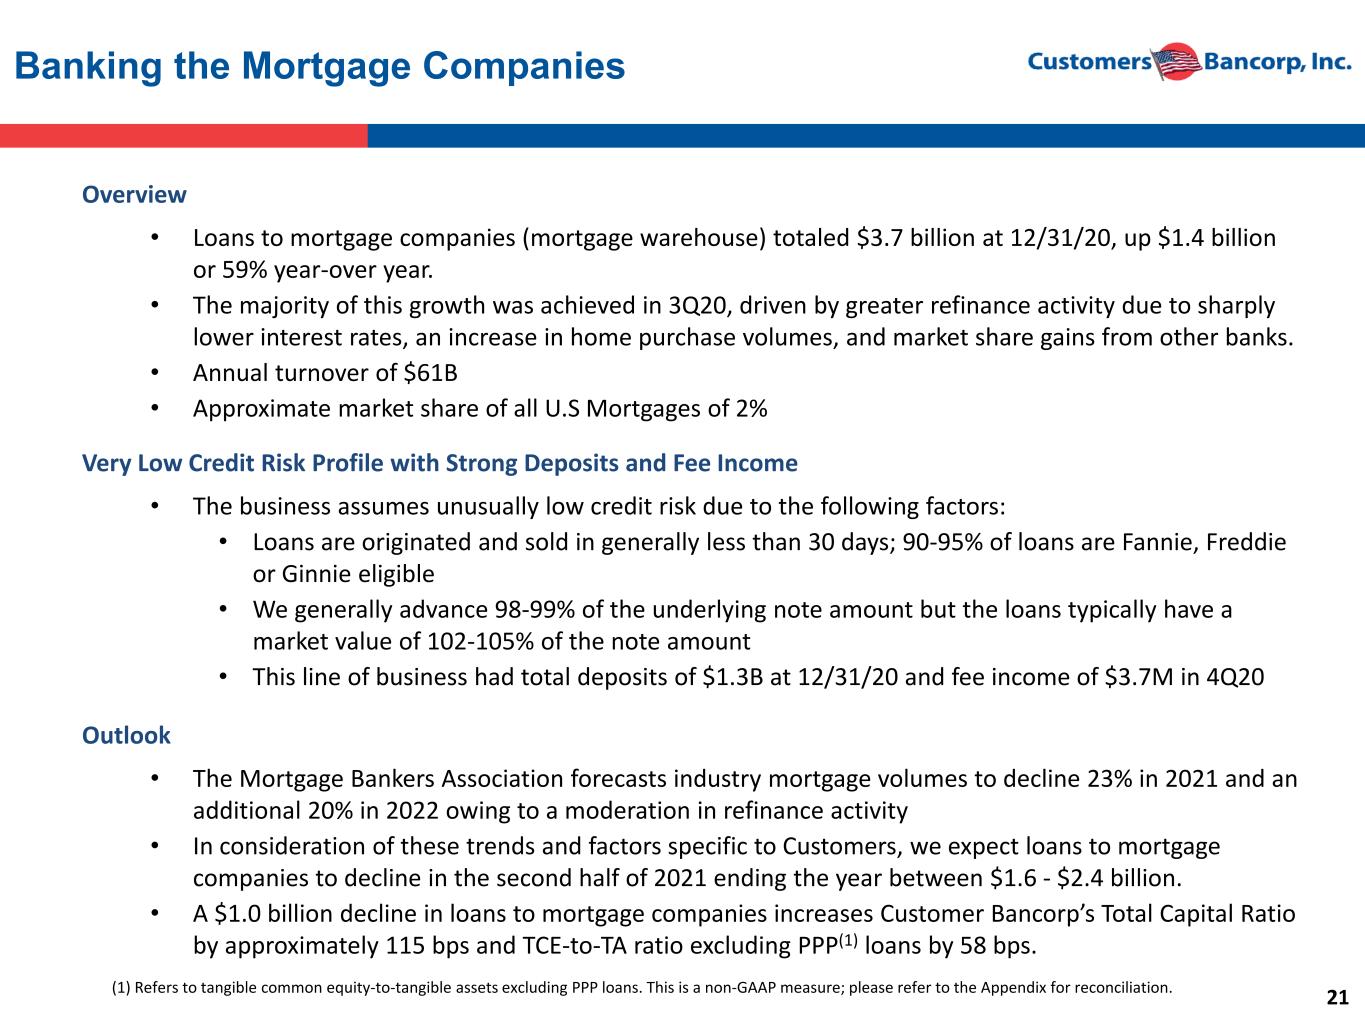
21 Banking the Mortgage Companies Overview • Loans to mortgage companies (mortgage warehouse) totaled $3.7 billion at 12/31/20, up $1.4 billion or 59% year-over year. • The majority of this growth was achieved in 3Q20, driven by greater refinance activity due to sharply lower interest rates, an increase in home purchase volumes, and market share gains from other banks. • Annual turnover of $61B • Approximate market share of all U.S Mortgages of 2% Very Low Credit Risk Profile with Strong Deposits and Fee Income • The business assumes unusually low credit risk due to the following factors: • Loans are originated and sold in generally less than 30 days; 90-95% of loans are Fannie, Freddie or Ginnie eligible • We generally advance 98-99% of the underlying note amount but the loans typically have a market value of 102-105% of the note amount • This line of business had total deposits of $1.3B at 12/31/20 and fee income of $3.7M in 4Q20 Outlook • The Mortgage Bankers Association forecasts industry mortgage volumes to decline 23% in 2021 and an additional 20% in 2022 owing to a moderation in refinance activity • In consideration of these trends and factors specific to Customers, we expect loans to mortgage companies to decline in the second half of 2021 ending the year between $1.6 - $2.4 billion. • A $1.0 billion decline in loans to mortgage companies increases Customer Bancorp’s Total Capital Ratio by approximately 115 bps and TCE-to-TA ratio excluding PPP(1) loans by 58 bps. (1) Refers to tangible common equity-to-tangible assets excluding PPP loans. This is a non-GAAP measure; please refer to the Appendix for reconciliation.
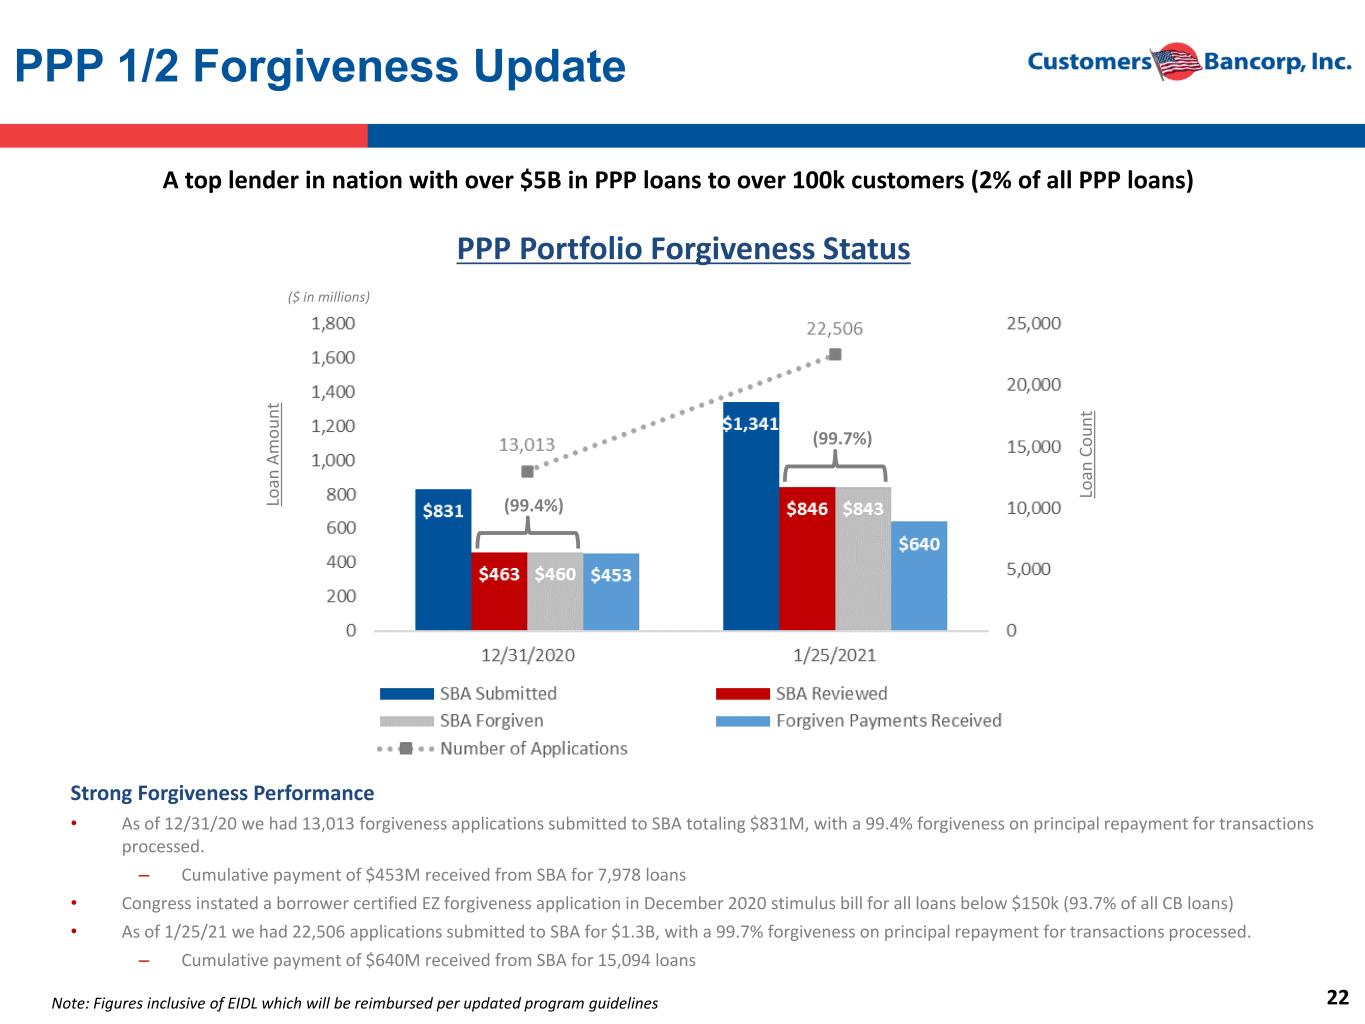
22 PPP 1/2 Forgiveness Update Strong Forgiveness Performance • As of 12/31/20 we had 13,013 forgiveness applications submitted to SBA totaling $831M, with a 99.4% forgiveness on principal repayment for transactions processed. – Cumulative payment of $453M received from SBA for 7,978 loans • Congress instated a borrower certified EZ forgiveness application in December 2020 stimulus bill for all loans below $150k (93.7% of all CB loans) • As of 1/25/21 we had 22,506 applications submitted to SBA for $1.3B, with a 99.7% forgiveness on principal repayment for transactions processed. – Cumulative payment of $640M received from SBA for 15,094 loans Note: Figures inclusive of EIDL which will be reimbursed per updated program guidelines A top lender in nation with over $5B in PPP loans to over 100k customers (2% of all PPP loans) PPP Portfolio Forgiveness Status ($ in millions) Lo an A m ou nt Lo an C ou nt (99.4%) (99.7%)

23 • Opened up application portal on Monday January 11th • Established an end-to-end white label “PPP-as-a-Service” technology platform for banks, lenders and referral partners that includes loan processing, origination, funding, servicing and forgiveness • Revised fee structure of a minimum fee of $2,500 for loans between $5,000 and $50,000; would have resulted in over $70M of origination fee to the Bank in PPP 1/2. • As of January 22nd we had well over 50,000 applications in process with an average loan size of under $50k and trending lower • Over 70% of pipeline represents First Draw PPP applicants with <$40,000 average loan size with Second Draw PPP applicants with ~$72,000 average loan size • Funding began last Friday January 22nd; ~3,000 SBA loan numbers received on Monday January 25th PPP 3 Program Update
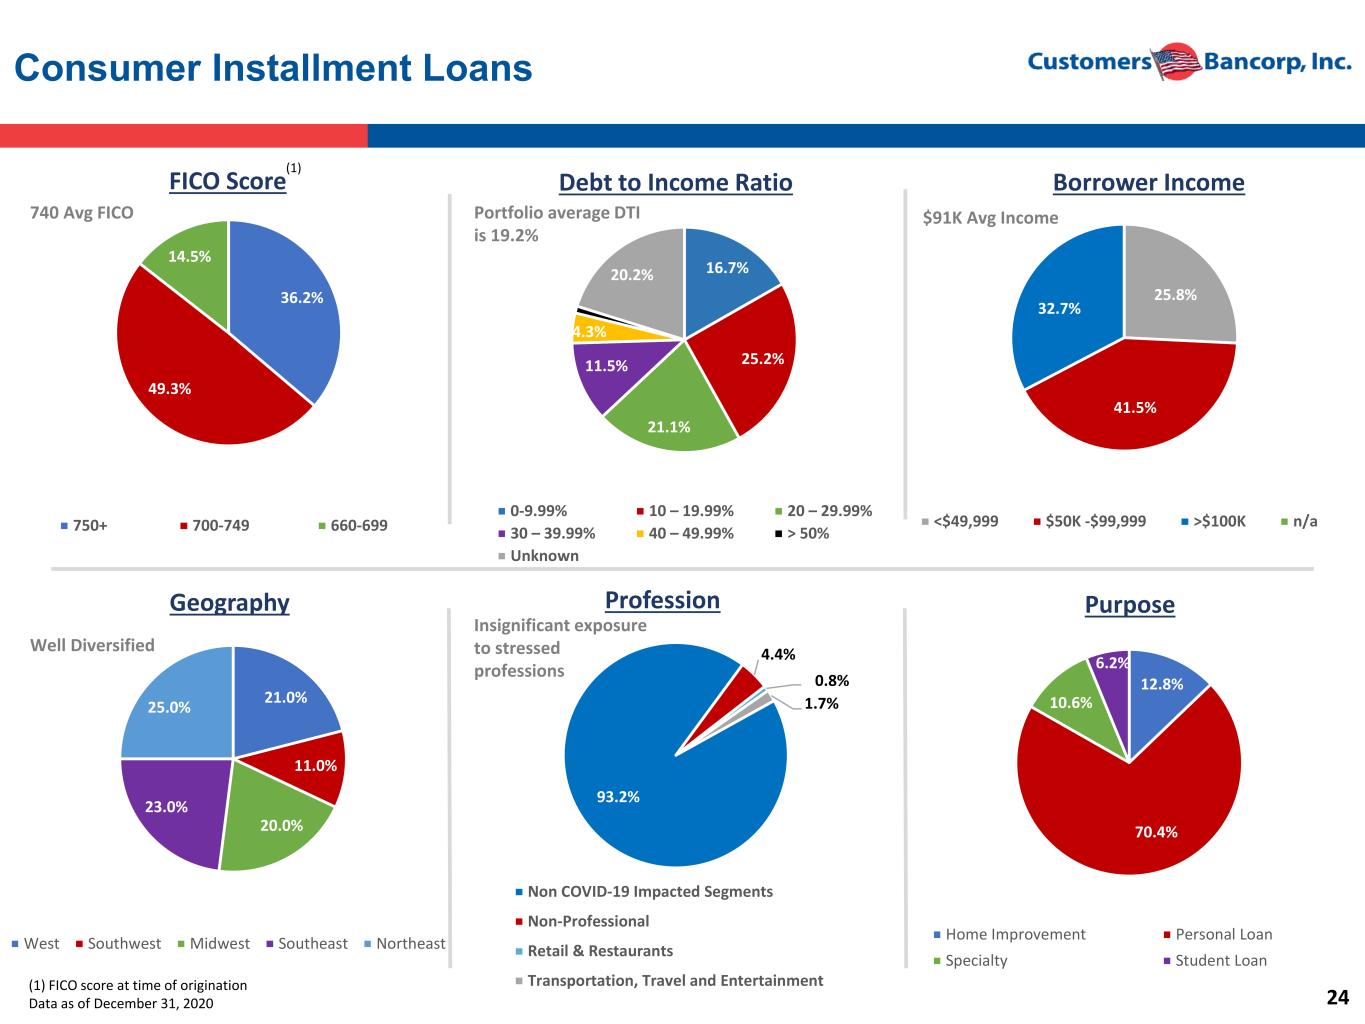
24 Consumer Installment Loans Well Diversified Insignificant exposure to stressed professions $91K Avg Income740 Avg FICO Portfolio average DTI is 19.2% (1) FICO score at time of origination Data as of December 31, 2020 (1) 36.2% 49.3% 14.5% FICO Score 750+ 700-749 660-699 16.7% 25.2% 21.1% 11.5% 4.3% 20.2% Debt to Income Ratio 0-9.99% 10 – 19.99% 20 – 29.99% 30 – 39.99% 40 – 49.99% > 50% Unknown 25.8% 41.5% 32.7% 0.0% Borrower Income <$49,999 $50K -$99,999 >$100K n/a 21.0% 11.0% 20.0% 23.0% 25.0% Geography West Southwest Midwest Southeast Northeast 93.2% 4.4% 0.8% 1.7% Profession Non COVID-19 Impacted Segments Non-Professional Retail & Restaurants Transportation, Travel and Entertainment 12.8% 70.4% 10.6% 6.2% Purpose Home Improvement Personal Loan Specialty Student Loan

25 Consumer Installment Loans Performance Remains Strong Note: Customers Bancorp’s impairment percentages are considered 1 day+ delinquent or in forbearance. Industry chart is from DV01 Insights COVID-19 Performance Report dated January 6, 2021. Continued Outperformance • At industry peak for consumer forbearance, CB overall remained less than half the industry average • Further, CB Direct was approximately 70% below industry average

26 Deposit Growth and Mix Shift 12/31/2012/31/19 Significant Funding Mix Improvement Achieved Due to PPP Participation and Core Trends • Total deposit growth of $2.7B (30.8%) YoY, which included $2.2B (83.9%) increase in demand deposits. • The non-time deposits-to-total deposits ratio climbed to 94.2% at 12/31/20 from 80.7% at 12/31/19 • Cost of deposits dropped to 0.58% in 4Q20 from 1.65% in the year-ago quarter and are expected to decline further 15.5% 14.3% 40.3% 10.6% 19.3% Noninterest Bearing DDAs Interest Bearing DDAs Money Market Accounts Savings Accounts Certificates of Deposit 20.8% 21.1% 40.7% 11.6% 5.8% Noninterest Bearing DDAs Interest Bearing DDAs Money Market Accounts Savings Accounts Certificates of Deposit Total Deposits - $11.3BTotal Deposits - $8.6B

III. Outlook

28 Continuing to Execute on Community Bank & Niche Business Strategies C&I Lending • Continue to focus on building franchise value by expanding our community banking strategy, lending to small-to-mid sized businesses and deposit gathering • Loans expected to grow about 7% to 10% over the next year • Our commercial finance business is expected to grow 10% to 15% in 2021 Niche Businesses • Certain specialty lending and healthcare businesses offer significant growth opportunities in very low credit risk niches • We expect all niche business to grow 10%+ in 2021 Digital Lending • Consumer Installment: expect to originate majority of loans direct in 2021 while growing to 15%+ of total assets • SBA Lending: seek to grow this low-risk line of business significantly in 2021, especially given increase in guarantee to 90% with recent legislation • Small Business Lending: launching end-to-end automated small business lending in 2021 initially targeted to PPP Customers Market Expansion and Other Strategies • Continuing to be very selective in CRE markets • Manage to about $1.5 billion exposure in multifamily • The balance of commercial loans to mortgage companies is expected to decline to $2.8 - $3.2 billion at March 31, 2021 and $1.6 - $2.4 billion at December 31, 2021 • Evaluate contiguous and select regional markets for community banking expansion

29 Financial Guidance • Our updated financial guidance is as follows: • Loan growth, excluding PPP and mortgage warehouse balances, is expected to average in the mid-to-high single digits over the next several quarters. • The balance of commercial loans to mortgage companies is expected to decline to $2.8-$3.2 billion at March 31, 2021 and $1.6-$2.4 billion at December 31, 2021. • The Total Capital Ratio is expected to exceed 13.0% by year-end 2021. The TCE-to-TA ratio excluding PPP loans is expected to be 7.5-8.0% by year-end 2021. • We project the NIM excluding PPP loans to expand into the 3.10%-3.30% range in 4Q21. • Impacted by the divestiture of BankMobile, we project noninterest income of $9.0-$11.0 million and operating expenses of $59.0-$61.0 million in 1Q21 (excluding BankMobile related severance expense). • We project an effective tax rate for 2021 of 21.0%-22.0%. • Our earnings trend is likely to be volatile over the next several quarters owing to our participation in PPP. We expect to earn at least $4.50 in core EPS in 2023 and remain on track to earn $6.00 in core EPS in 2026. • 2021 NIM expansion is expected to be achieved by: • Remixing the loan portfolio away from commercial loans to mortgage companies toward other C&I categories and consumer loans • Bringing our cost of deposits down to less than 40 bps in the near future 1. Non-GAAP Measure, refer to Appendix for reconciliation

30 2026 Core EPS Target Path to Core EPS of $6.00 in 2026 Position at year-end 2020 • $13.9 billion in core assets1 • 31.7 million diluted shares outstanding Growth Assumptions • Asset growth of 7.0%-10.0% per year on average in the 2021-2026 period • Diluted shares outstanding growth of 1.0% per annum Where we expect to end up at year-end 2026 • $18-$20 billion in assets with about $1.7 billion in common equity • ~33.7 million diluted shares outstanding • At a Return on Assets of 1.00%-1.10%: • ~$200 million in core net income • ~$6.00 in Core EPS annualized Note: The “Path to Core EPS of $6.00 by 2026” includes our estimates of future performance. Please refer to the Forward-Looking Statements slide for more information. (1) Excludes PPP loan balances, a non-GAAP measure. Please refer to the Appendix for reconciliation.

IV. Appendix
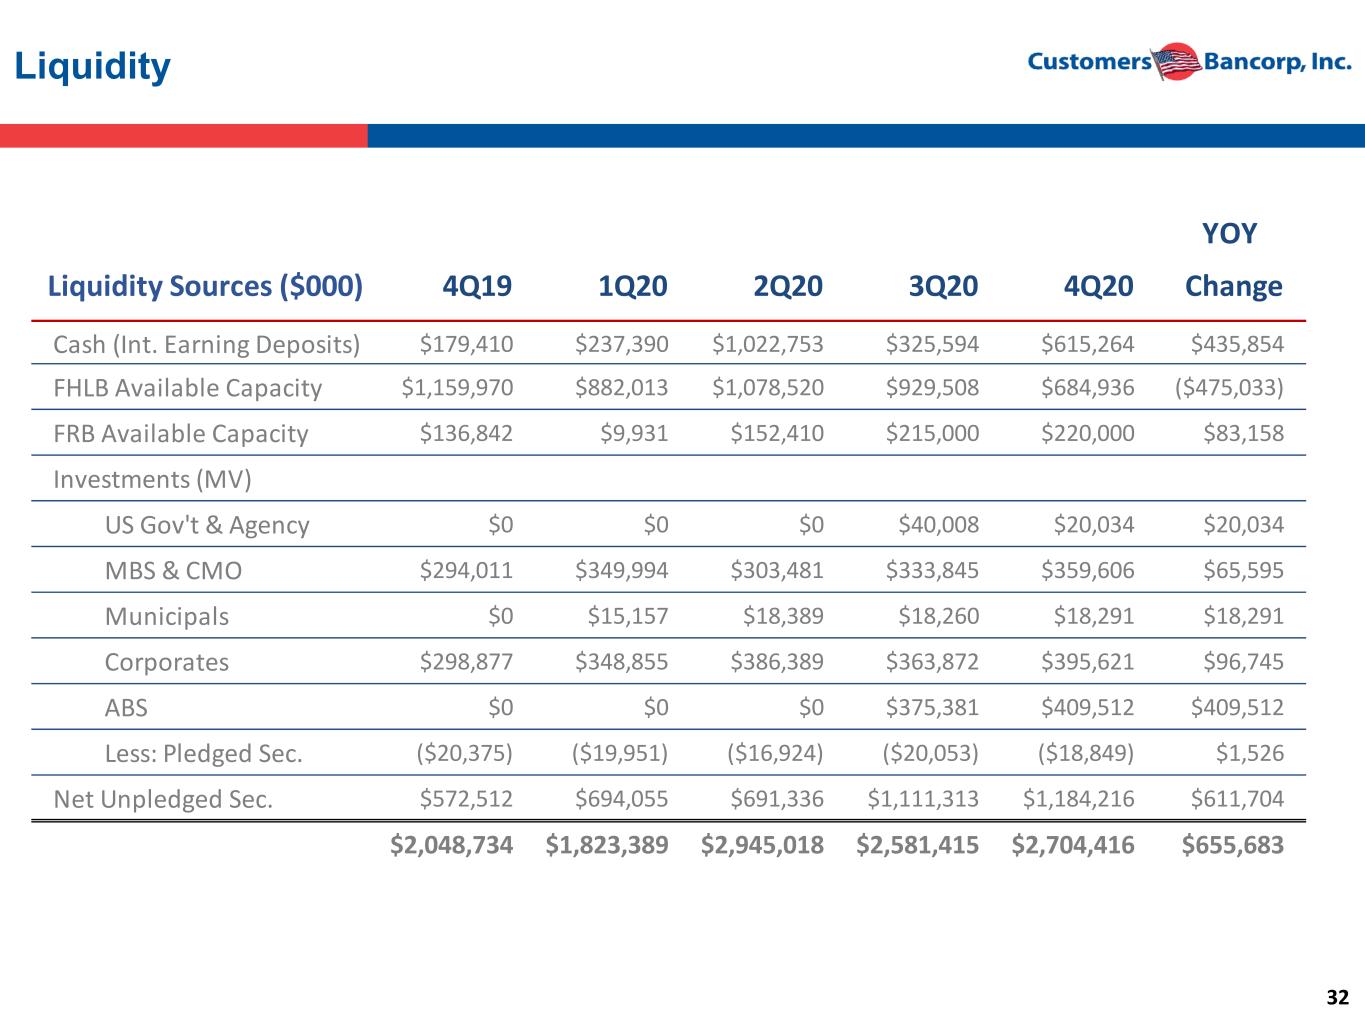
32 Liquidity YOY Liquidity Sources ($000) 4Q19 1Q20 2Q20 3Q20 4Q20 Change Cash (Int. Earning Deposits) $179,410 $237,390 $1,022,753 $325,594 $615,264 $435,854 FHLB Available Capacity $1,159,970 $882,013 $1,078,520 $929,508 $684,936 ($475,033) FRB Available Capacity $136,842 $9,931 $152,410 $215,000 $220,000 $83,158 Investments (MV) US Gov't & Agency $0 $0 $0 $40,008 $20,034 $20,034 MBS & CMO $294,011 $349,994 $303,481 $333,845 $359,606 $65,595 Municipals $0 $15,157 $18,389 $18,260 $18,291 $18,291 Corporates $298,877 $348,855 $386,389 $363,872 $395,621 $96,745 ABS $0 $0 $0 $375,381 $409,512 $409,512 Less: Pledged Sec. ($20,375) ($19,951) ($16,924) ($20,053) ($18,849) $1,526 Net Unpledged Sec. $572,512 $694,055 $691,336 $1,111,313 $1,184,216 $611,704 $2,048,734 $1,823,389 $2,945,018 $2,581,415 $2,704,416 $655,683

33 Paycheck Protection Program $100M+ in Anticipated Origination Fee Growth • Customers Bank rose to the challenge of helping American small business preserve employment by quickly and effectively launching a nationwide SBA Paycheck Protection Program (“PPP”) lending program in just days. • Customers Bank partnered with leading fintechs as a force multiplier for PPP application intake and processing, handling more than 136,325 PPP loan applications (including those cancelled and/or duplicated by other lenders). • Customers Bank provided 102,799 PPP loans totaling $5,112,374,125. • The bank will realize over $100m of loan origination fees over the life of the loans. • Digital marketing campaigns drove thousands of applicants to the Customers Bank online application. • Rapid digitization of back office processes created speed and efficiency in the processing and booking of PPP loans. • Thousands of PPP borrowers have been contacted as part of outreach campaigns to create a deep and permeant banking relationship. Content marketing to thousands of borrowers continues. • An active PPP Loan forgiveness program is underway. Data for comparisons, SBA as of August 8, 2020 Customers Bank includes originations with fintech partners as of January 25, 2021 Select Fintech Partners PPP Lenders Ranked by Number of Loans, Aggregate Value & Average Loan Customers Bank leveraged its technology platform to partner with leading fintechs becoming a top PPP Loan originator in the country Financial Institution Ranked by # Loans # Loans Ranked by Loan Value Total Loan Value (millions) Ranked by Ave. Loan Average Loan Bank of America 1 334,761 2 $25,203,076,316 5 $75,287 JPMorgan Chase Bank 2 269,424 1 $29,066,127,405 8 $107,882 Wells Fargo Bank 3 185,598 5 $10,470,396,296 3 $56,414 Cross River Bank 4 134,472 13 $5,361,597,126 1 $39,871 Customers Bank 5 102,799 14 $5,112,374,125 2 $49,735 U.S. Bank 6 101,377 8 $7,444,906,047 4 $73,438 TD Bank 7 82,773 6 $8,468,624,019 7 $102,311 Truist Bank 8 78,669 3 $13,075,965,877 11 $166,215 PNC Bank 9 72,908 4 $13,038,347,212 13 $178,833 Citizens Bank 10 49,670 15 $5,007,022,864 6 $100,806 Zions Bank 11 46,707 9 $6,941,735,934 10 $148,623 KeyBank 12 41,487 7 $8,138,794,697 15 $196,177 Fifth Third Bank 13 38,197 12 $5,434,319,532 9 $142,271 Huntington Bank 14 37,122 11 $6,528,043,675 12 $175,854 M&T Bank 15 34,680 10 $6,791,223,167 14 $195,825

34 Detailed Financial Ratios

35 Customers believes that the non-GAAP measurements disclosed within this document are useful for investors, regulators, management and others to evaluate our core results of operations and financial condition relative to other financial institutions. These non-GAAP financial measures are frequently used by securities analysts, investors, and other interested parties in the evaluation of companies in Customers' industry. These non-GAAP financial measures exclude from corresponding GAAP measures the impact of certain elements that we do not believe are representative of our ongoing financial results, which we believe enhance an overall understanding of our performance and increases comparability of our period to period results. Investors should consider our performance and financial condition as reported under GAAP and all other relevant information when assessing our performance or financial condition. Although non-GAAP financial measures are frequently used in the evaluation of a company, they have limitations as analytical tools and should not be considered in isolation or as a substitute for analysis of our results of operations or financial condition as reported under GAAP. The following tables present reconciliations of GAAP to non-GAAP measures disclosed within this document. Reconciliation of Non-GAAP Measures - Unaudited

36 Reconciliation of Non-GAAP Measures – Unaudited (Cont.) ($ in thousands, not including per share amounts) Q4 2020 Q3 2020 Q2 2020 Q1 2020 Q4 2019 USD Per Share USD Per Share USD Per Share USD Per Share USD Per Share GAAP net income to common shareholders $ 52,831 $ 1.65 $ 47,085 $ 1.48 $ 19,137 $ 0.61 $ (515) $ (0.02) $ 23,911 $ 0.75 Reconciling items (after tax): Severance expense 171 0.01 - - - - - - - - Loss upon acquisition of interest-only GNMA securities - - - - - - - - - - Merger and acquisition related expenses 714 0.02 833 0.03 19 - 40 - 76 - Legal reserves - - 258 0.01 - - 830 0.03 - - (Gains) losses on investment securities (1,419) (0.04) (9,662) (0.30) (4,543) (0.14) (1,788) (0.06) (310) (0.01) Derivative credit valuation adjustment (448) (0.01) (304) (0.01) 4,527 0.14 2,036 0.06 (429) (0.01) Risk participation agreement mark-to-market adjustment - - - - (1,080) (0.03) - - - - Losses on sale of non-QM residential mortgage loans - - - - - - - - 595 0.02 Unrealized losses on loans held for sale 799 0.03 - - 1,114 0.04 - - - - Core earnings $ 52,648 $ 1.65 $ 38,210 $ 1.20 $ 19,174 $ 0.61 $ 603 $ 0.02 $ 23,843 $ 0.75 Core Earnings - Customers Bancorp ($ in thousands, not including per share amounts) 2020 2019 USD Per Share USD Per Share GAAP net income to common shareholders $ 118,537 $ 3.74 $ 64,868 $ 2.05 Reconciling items (after tax): Severance expense 171 0.01 373 0.01 Loss upon acquisition of interest-only GNMA securities - - 5,682 0.18 Merger and acquisition related expenses 1,606 0.05 76 - Legal reserves 1,088 0.03 1,520 0.05 (Gains) losses on investment securities (17,412) (0.55) (1,912) (0.06) Derivative credit valuation adjustment 5,811 0.18 811 0.03 Risk participation agreement mark-to-market adjustment (1,080) (0.03) - - Losses on sale of non-QM residential mortgage loans - - 595 0.02 Unrealized losses on loans held for sale 1,913 0.06 - - Core earnings $ 110,634 $ 3.49 $ 72,013 $ 2.28 Core Earnings - Customers Bancorp Twelve Months Ended December 31,

37 Reconciliation of Non-GAAP Measures – Unaudited (Cont.) Adjusted Net Income and Adjusted ROAA - Pre-Tax Pre-Provision - Customers Bancorp ($ in thousands) Q4 2020 Q3 2020 Q2 2020 Q1 2020 Q4 2019 2020 2019 GAAP net income $ 56,245 $ 50,515 $ 22,718 $ 3,100 $ 27,526 $ 132,578 $ 79,327 Reconciling items (after tax): Income tax expense 22,225 12,201 7,048 1,906 7,451 43,380 22,793 Provision for credit losses on loans and leases (2,913) 12,955 20,946 31,786 9,689 62,774 24,227 Provision for credit losses on unfunded commitments (968) (527) (356) 751 3 (1,100) (403) Severance expense 239 - - - - 239 490 Loss upon acquisition of interest-only GNMA securities - - - - - - 7,476 Merger and acquisition related expenses 996 1,035 25 50 100 2,106 100 Legal reserves - 320 - 1,042 - 1,362 2,000 (Gains) losses on investment securities (1,431) (11,945) (5,553) (2,596) (310) (21,525) (2,300) Derivative credit valuation adjustment (625) (378) 5,895 2,556 (565) 7,448 1,066 Risk participation agreement mark-to-market adjustment - - (1,407) - - (1,407) - Losses on sale of non-QM residential mortgage loans - - - - 782 - 782 Unrealized losses on loans held for sale 1,115 - 1,450 - - 2,565 - Adjusted net income - pre-tax pre-provision $ 74,883 $ 64,176 $ 50,766 $ 38,595 $ 44,676 $ 228,420 $ 135,558 Average total assets $ 18,250,719 $ 17,865,574 $ 14,675,584 $ 11,573,406 $ 11,257,207 $ 15,604,801 $ 10,667,670 Adjusted ROAA - pre-tax pre-provision 1.63% 1.43% 1.39% 1.34% 1.57% 1.46% 1.27% Twelve Months Ended December 31,

38 Reconciliation of Non-GAAP Measures – Unaudited (Cont.) Coverage of credit loss reserves for loans and leases held for investment, excluding PPP ($ in thousands) Q4 2020 Q3 2020 Q2 2020 Q1 2020 Q4 2019 Loans and leases receivable 12,136,733$ 12,664,997$ 12,032,874$ 7,353,262$ 7,318,988$ Loans receivable, PPP (4,561,365) (4,964,105) (4,760,427) - - Loans and leases held for investment, excluding PPP 7,575,368$ 7,700,892$ 7,272,447$ 7,353,262$ 7,318,988$ Allowance for credit losses on loans and leases 144,176$ 155,561$ 159,905$ 149,283$ 56,379$ Coverage of credit loss reserves for loans and leases held for investment, excluding PPP 1.90% 2.02% 2.20% 2.03% 0.77% Core Assets ($ in thousands) Q4 2020 GAAP - Total assets 18,439,248$ Reconciling items: Loans receivable, PPP (4,561,365) Goodwill and other intangibles (14,298) Core assets 13,863,585$
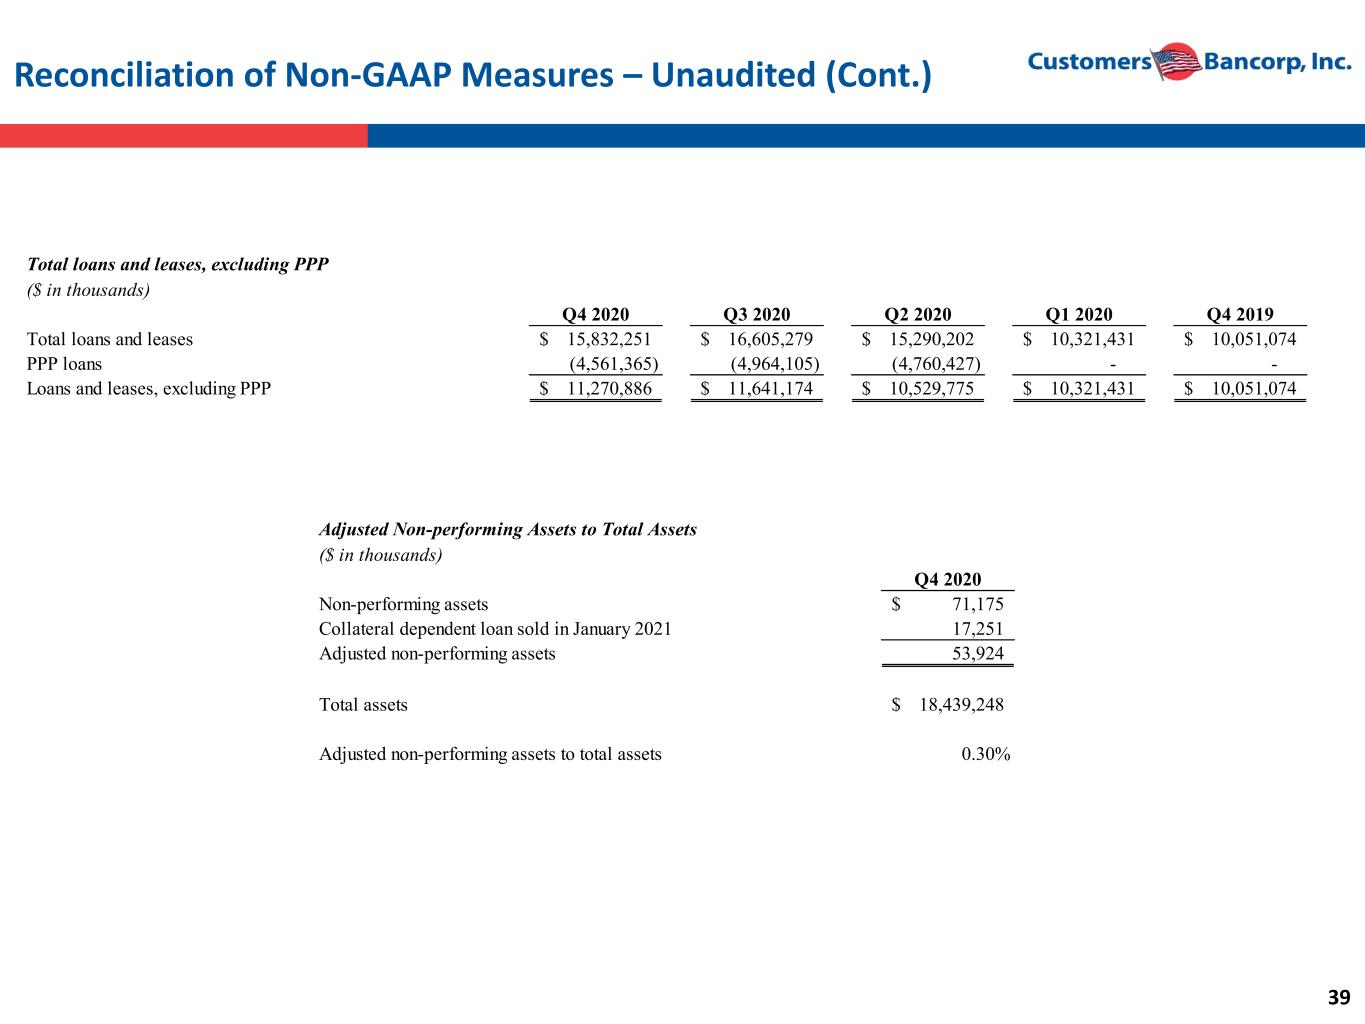
39 Reconciliation of Non-GAAP Measures – Unaudited (Cont.) Total loans and leases, excluding PPP ($ in thousands) Q4 2020 Q3 2020 Q2 2020 Q1 2020 Q4 2019 Total loans and leases 15,832,251$ 16,605,279$ 15,290,202$ 10,321,431$ 10,051,074$ PPP loans (4,561,365) (4,964,105) (4,760,427) - - Loans and leases, excluding PPP 11,270,886$ 11,641,174$ 10,529,775$ 10,321,431$ 10,051,074$ Adjusted Non-performing Assets to Total Assets ($ in thousands) Q4 2020 Non-performing assets 71,175$ Collateral dependent loan sold in January 2021 17,251 Adjusted non-performing assets 53,924 Total assets 18,439,248$ Adjusted non-performing assets to total assets 0.30%

40 Reconciliation of Non-GAAP Measures – Unaudited (Cont.) Tangible Book Value per Common Share - Customers Bancorp ($ in thousands, except per share data) Q4 2020 Q3 2020 Q2 2020 Q1 2020 Q4 2019 GAAP -Total shareholders' equity 1,117,086$ 1,051,491$ 1,007,847$ 964,636$ 1,052,795$ Reconciling items: Preferred stock (217,471) (217,471) (217,471) (217,471) (217,471) Goodwill and other intangibles (14,298) (14,437) (14,575) (14,870) (15,195) Tangible common equity 885,317$ 819,583$ 775,801$ 732,295$ 820,129$ Common shares outstanding 31,705,088 31,555,124 31,510,287 31,470,026 31,336,791 Tangible book value per common share 27.92$ 25.97$ 24.62$ 23.27$ 26.17$

41 Reconciliation of Non-GAAP Measures – Unaudited (Cont.) Tangible Common Equity to Tangible Assets, Excluding PPP - Customers Bancorp ($ in thousands) Q4 2020 Q3 2020 Q2 2020 Q1 2020 Q4 2019 GAAP - Total shareholders' equity 1,117,086$ 1,051,491$ 1,007,847$ 964,636$ 1,052,795$ Reconciling items: Preferred stock (217,471) (217,471) (217,471) (217,471) (217,471) Goodwill and other intangibles (14,298) (14,437) (14,575) (14,870) (15,195) Tangible common equity 885,317$ 819,583$ 775,801$ 732,295$ 820,129$ GAAP - Total assets 18,439,248$ 18,778,727$ 17,903,118$ 12,018,799$ 11,520,717$ Reconciling items: Goodwill and other intangibles (14,298) (14,437) (14,575) (14,870) (15,195) PPP loans (4,561,365) (4,964,105) (4,760,427) - - Tangible assets 13,863,585$ 13,800,185$ 13,128,116$ 12,003,929$ 11,505,522$ Tangible common equity to tangible assets 6.39% 5.94% 5.91% 6.10% 7.13% Tangible Equity ($ in thousands) Q4 2020 GAAP - Total shareholders' equity 1,117,086$ Reconciling items: Goodwill and other intangibles (14,298) Tangible equity 1,102,788$ Tangible Equity to Tangible Assets, excluding PPP loans ($ in thousands) Q4 2020 Q4 2019 GAAP - Total assets 18,439,248$ 11,520,717$ Reconciling items: Goodwill and other intangbles 14,298 15,196 PPP loans 4,561,365 - Total tangible assets, excluding PPP 13,863,585$ 11,505,521$ GAAP - Total shareholders' equity 1,117,085$ 1,052,794$ Reconciling items: Goodwill and other intangbles 14,298 15,196 Total tangible equity 1,102,787$ 1,037,598$ Tangible equity to tangible assets, excluding PPP loans 7.95% 9.02%
42 Contacts Leadership: Carla Leibold CFO of Customers Bancorp, Inc and Customers Bank Tel: 484-923-8802 cleibold@customersbank.com Jay Sidhu Chairman & CEO of Customers Bancorp, Inc. and Executive Chairman of Customers Bank Tel: 610-935-8693 jsidhu@customersbank.com Richard Ehst President & COO of Customers Bancorp, Inc. and CEO of Customers Bank Tel: 610-917-3263 rehst@customersbank.com Sam Sidhu COO of Customers Bank & Head of Corporate Development of Customers Bancorp, Inc. Tel: 212-843-2485 ssidhu@customersbank.com Analysts: B. Riley Financial Steve Moss D.A. Davidson Company Russell Gunther Hovde Group Will Curtiss Jefferies LLC Casey Haire Keefe, Bruyette & Woods Michael Perito Maxim Group Michael Diana Piper Sandler Companies Frank Schiraldi Wedbush Peter Winter
