Attached files
| file | filename |
|---|---|
| EX-99.2 - EXHIBIT 99.2 - MORGAN STANLEY | a52363086_ex992.htm |
| EX-99.1 - EXHIBIT 99.1 - MORGAN STANLEY | a52363086_ex991.htm |
| 8-K - MORGAN STANLEY 8-K - MORGAN STANLEY | a52363086.htm |
Exhibit 99.3
Morgan Stanley at an Inflection Point:The Next Decade of Growth James P. Gorman, Chairman and Chief
Executive Officer January 20, 2021
Notice 2 This presentation by Morgan Stanley is copyrighted and proprietary, and all rights are
reserved. Any recording, rebroadcast or other use of this presentation, in whole or in part, without the prior written consent of Morgan Stanley is strictly prohibited. The presentation has been prepared solely for information purposes; it is
not a solicitation of any offer to buy or sell any security or instrument, and has not been updated since it was originally presented.This presentation may contain forward-looking statements including the attainment of certain financial and
other targets, objectives and goals. You are cautioned not to place undue reliance on forward-looking statements, which speak only as of the date on which they are made, which reflect management's current estimates, projections, expectations,
assumptions, interpretations or beliefs and which are subject to risks and uncertainties that may cause actual results to differ materially. Morgan Stanley does not undertake any obligation to update any forward-looking statements.For a
discussion of additional risks and uncertainties that may affect the future results of Morgan Stanley, please see Morgan Stanley's most recent Annual Report on Form 10-K, Quarterly Reports on Form 10-Q, Current Reports on Form 8-K, and the
additional risk factors in Morgan Stanley’s Form 8-Ks filed on April 16, 2020 and October 2, 2020, respectively, which are available on Morgan Stanley's website www.morganstanley.com.The presentation may also include certain non-GAAP
financial measures. The reconciliation of such measures to the comparable GAAP figures is included in this presentation and in Morgan Stanley's most recent Annual Report on Form 10-K, Definitive Proxy Statement, Quarterly Reports on Form 10-Q
and / or Current Reports on Form 8-K, as applicable, which are available on Morgan Stanley's website www.morganstanley.com.The End Notes are an integral part of this presentation. See slides 19-26 at the back of this presentation for
information related to the financial metrics and defined terms in this presentation.See also slide 27 for “Important Information about the Proposed Transaction with Eaton Vance and Where to Find It”.
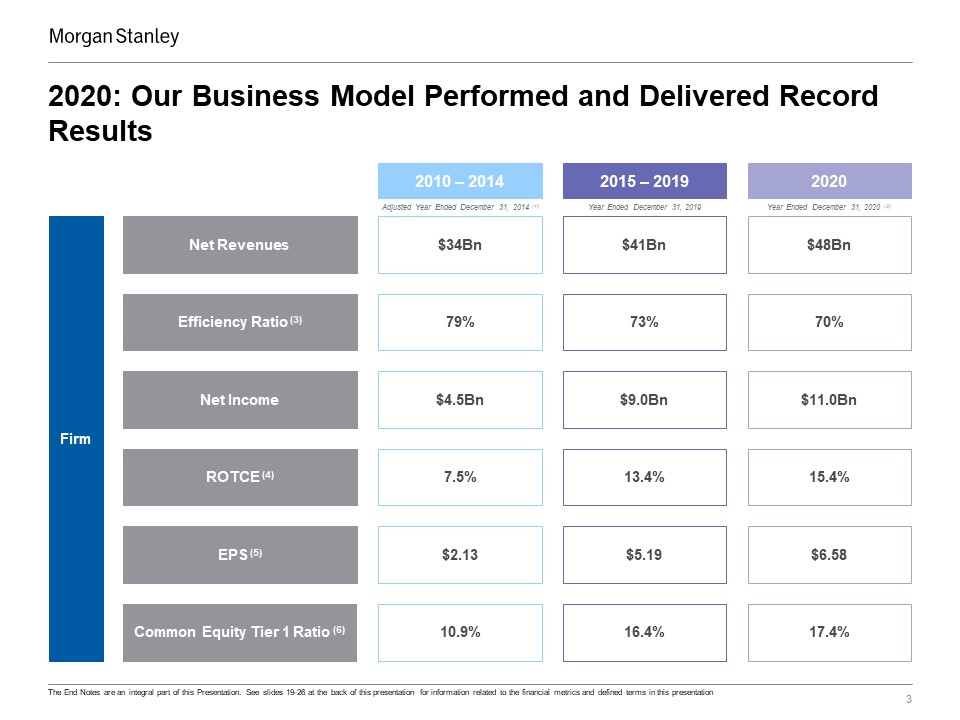
3 Firm Net Revenues Efficiency Ratio (3) Net Income ROTCE (4) EPS (5) Common Equity Tier 1
Ratio (6) 2015 – 2019 Year Ended December 31, 2019 $41Bn 73% $9.0Bn 13.4% $5.19 16.4% 2010 – 2014 Adjusted Year Ended December 31, 2014 (1) $34Bn 79% $4.5Bn 7.5% $2.13 10.9% The End Notes are an integral part of this
Presentation. See slides 19-26 at the back of this presentation for information related to the financial metrics and defined terms in this presentation 2020 $48Bn 70% $11.0Bn 15.4% $6.58 17.4% Year Ended December 31, 2020 (2) 2020:
Our Business Model Performed and Delivered Record Results
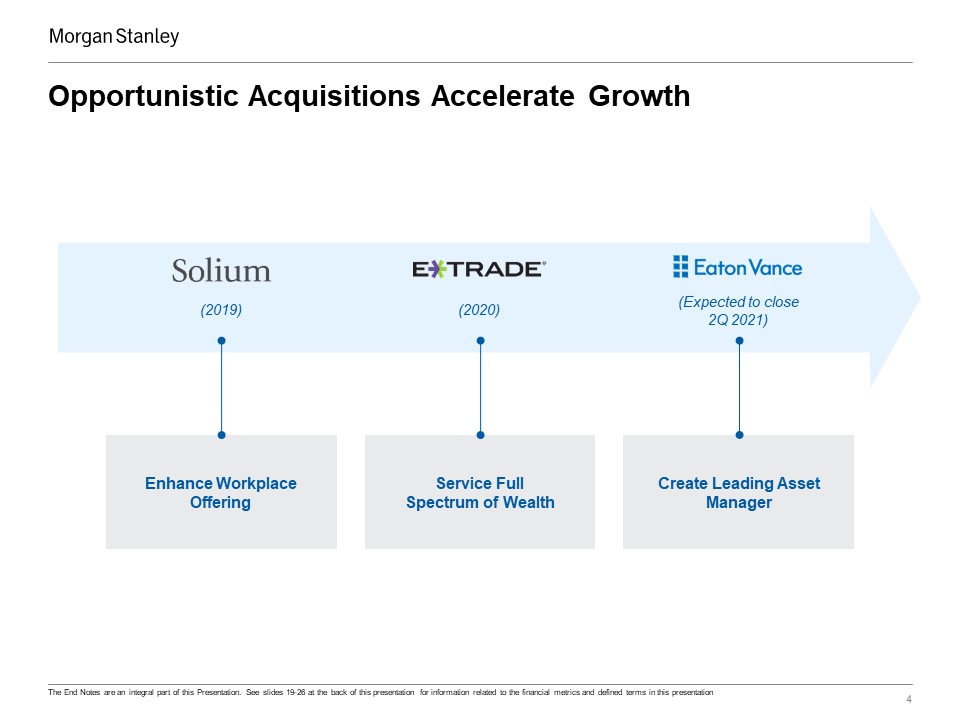
4 (2019) Enhance Workplace Offering (2020) Service FullSpectrum of Wealth (Expected to close2Q
2021) Create Leading Asset Manager Opportunistic Acquisitions Accelerate Growth The End Notes are an integral part of this Presentation. See slides 19-26 at the back of this presentation for information related to the financial metrics and
defined terms in this presentation
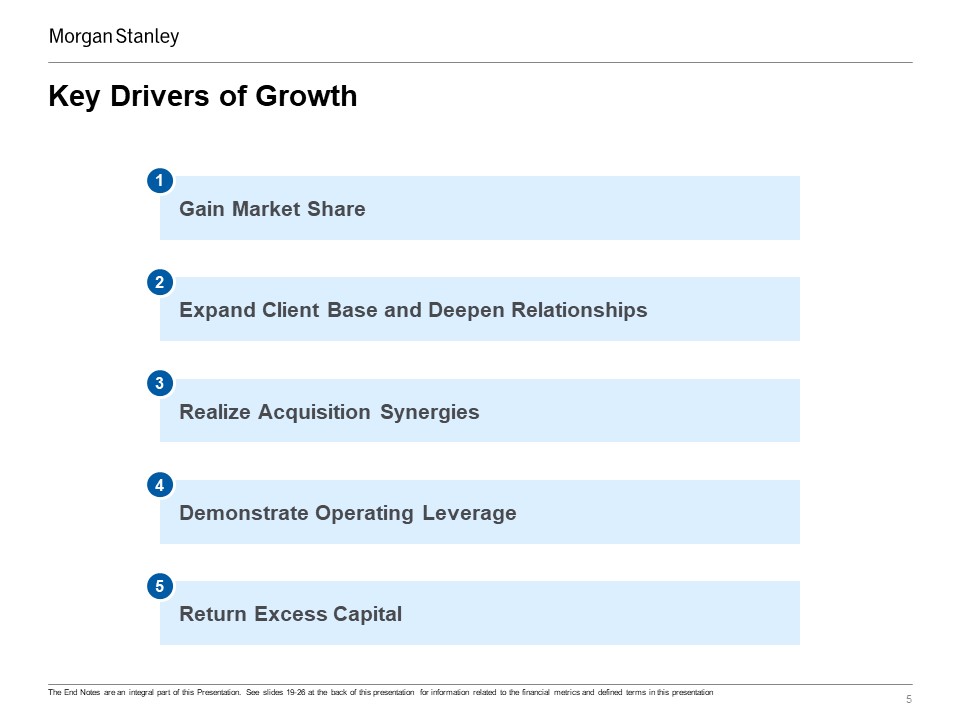
Key Drivers of Growth 5 Realize Acquisition Synergies 3 Expand Client Base and Deepen
Relationships 2 Return Excess Capital 5 Demonstrate Operating Leverage 4 Gain Market Share 1 The End Notes are an integral part of this Presentation. See slides 19-26 at the back of this presentation for information related to the
financial metrics and defined terms in this presentation
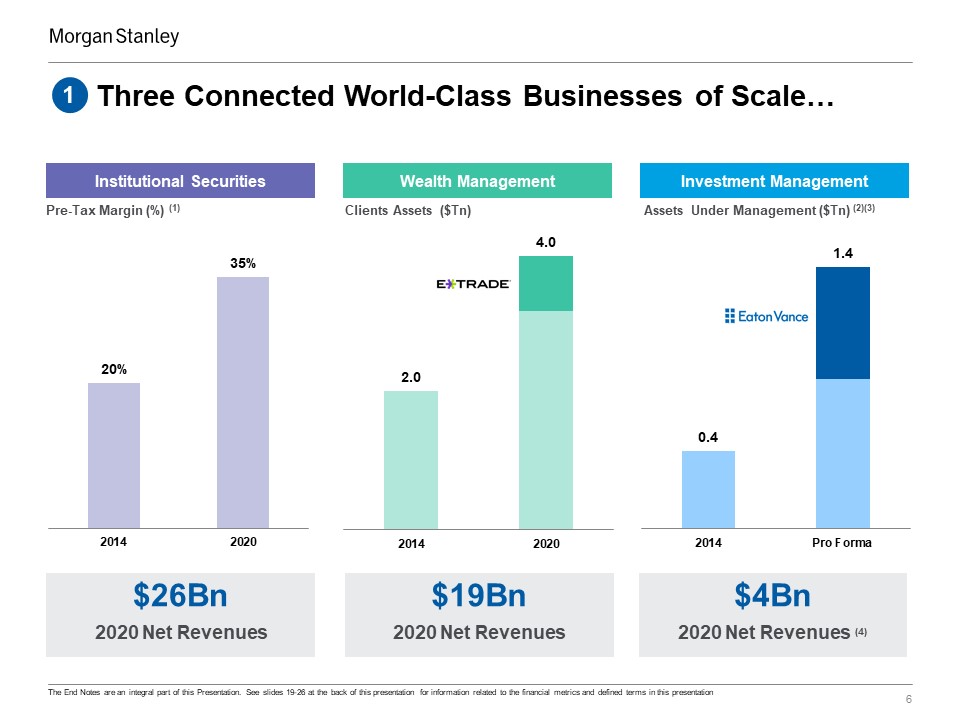
Three Connected World-Class Businesses of Scale… 6 Pre-Tax Margin (%) (1) Clients Assets
($Tn) Assets Under Management ($Tn) (2)(3) Institutional Securities Wealth Management Investment Management $26Bn 2020 Net Revenues $19Bn 2020 Net Revenues $4Bn 2020 Net Revenues (4) 1 The End Notes are an integral part of
this Presentation. See slides 19-26 at the back of this presentation for information related to the financial metrics and defined terms in this presentation
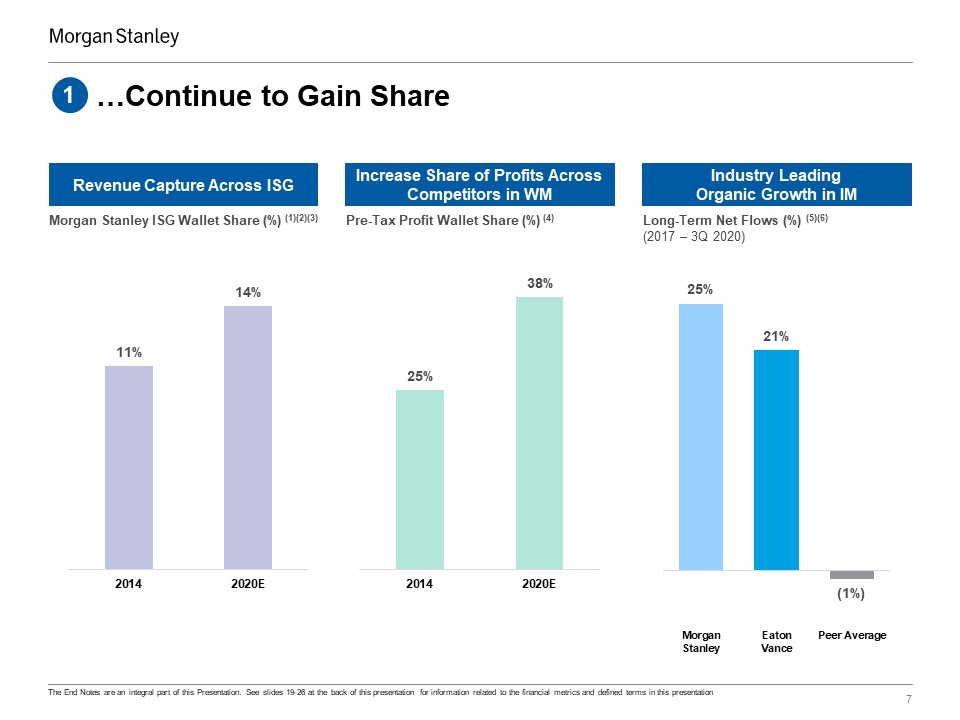
…Continue to Gain Share 7 1 Increase Share of Profits Across Competitors in WM Revenue Capture
Across ISG Industry LeadingOrganic Growth in IM Morgan Stanley ISG Wallet Share (%) (1)(2)(3) Long-Term Net Flows (%) (5)(6)(2017 – 3Q 2020) Pre-Tax Profit Wallet Share (%) (4) The End Notes are an integral part of this Presentation. See
slides 19-26 at the back of this presentation for information related to the financial metrics and defined terms in this presentation
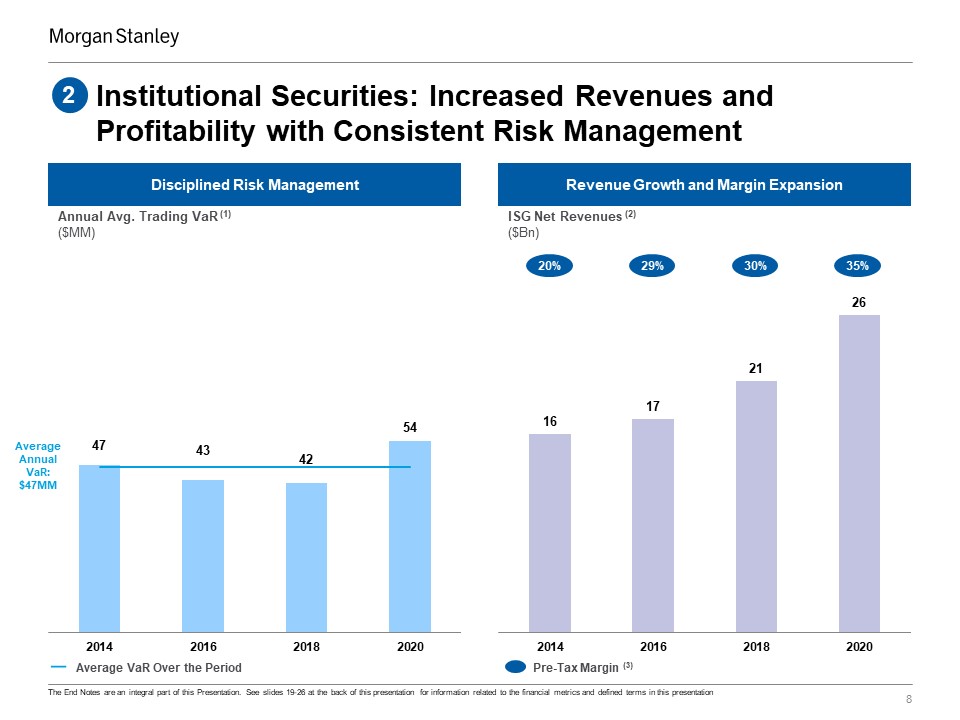
Annual Avg. Trading VaR (1)($MM) Institutional Securities: Increased Revenues and Profitability with
Consistent Risk Management 8 2 Revenue Growth and Margin Expansion Disciplined Risk Management Pre-Tax Margin (3) 20% 29% 30% 35% ISG Net Revenues (2)($Bn) Average VaR Over the Period AverageAnnual VaR:$47MM The End Notes are an
integral part of this Presentation. See slides 19-26 at the back of this presentation for information related to the financial metrics and defined terms in this presentation
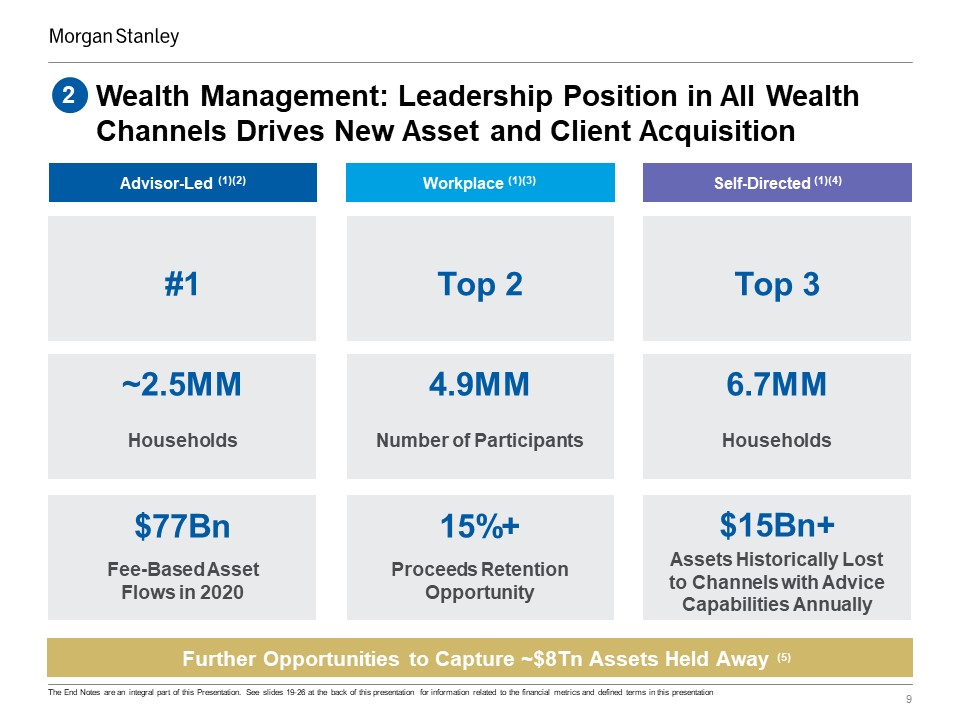
Advisor-Led (1)(2) Workplace (1)(3) Self-Directed (1)(4) Top 2 Top
3 #1 9 15%+ Proceeds Retention Opportunity $15Bn+ Assets Historically Lost to Channels with Advice Capabilities Annually $77Bn Fee-Based AssetFlows in 2020 4.9MM Number of
Participants 6.7MM Households ~2.5MM Households Further Opportunities to Capture ~$8Tn Assets Held Away (5) Wealth Management: Leadership Position in All Wealth Channels Drives New Asset and Client Acquisition 2 The End Notes are an
integral part of this Presentation. See slides 19-26 at the back of this presentation for information related to the financial metrics and defined terms in this presentation
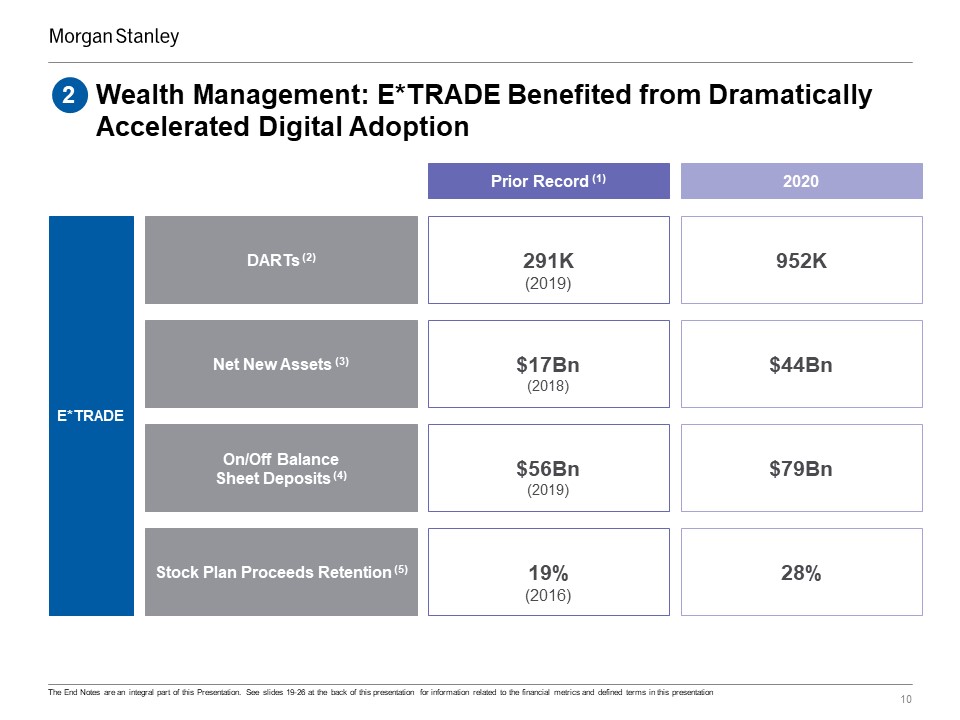
10 2 Stock Plan Proceeds Retention (5) DARTs (2) Net New Assets (3) On/Off BalanceSheet Deposits
(4) Prior Record (1) 19%(2016) 291K(2019) $17Bn(2018) $56Bn(2019) 2020 28% 952K $44Bn $79Bn Wealth Management: E*TRADE Benefited from Dramatically Accelerated Digital Adoption E*TRADE The End Notes are an integral part of this
Presentation. See slides 19-26 at the back of this presentation for information related to the financial metrics and defined terms in this presentation
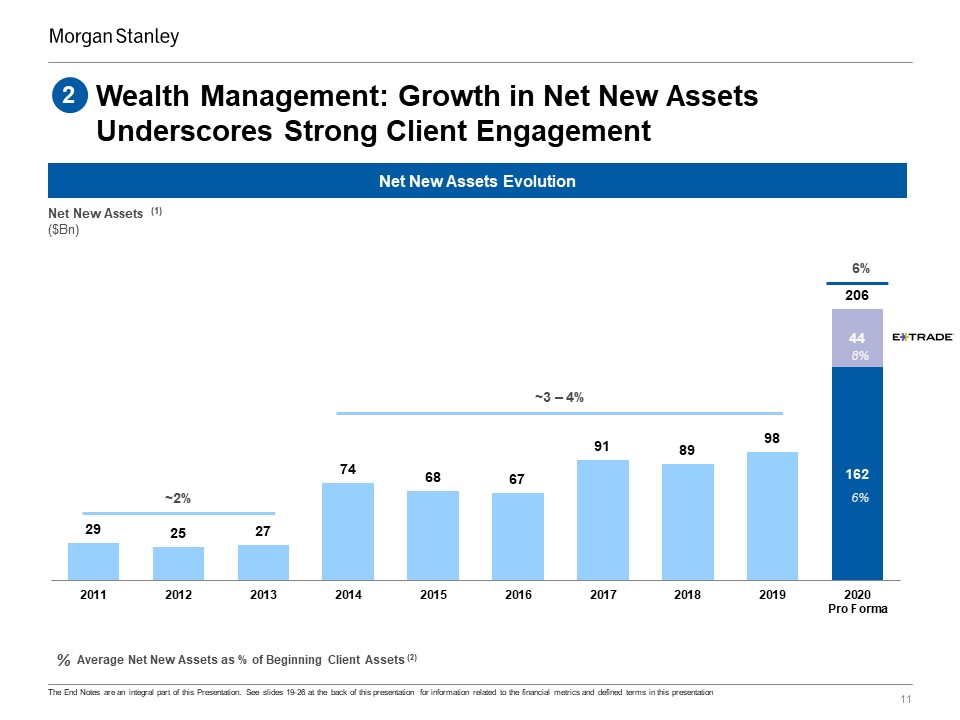
Wealth Management: Growth in Net New Assets Underscores Strong Client Engagement 11 2 Net New Assets
Evolution ~2% Net New Assets (1)($Bn) Average Net New Assets as % of Beginning Client Assets (2) % 8% 6% ~3 – 4% 6% The End Notes are an integral part of this Presentation. See slides 19-26 at the back of this presentation for
information related to the financial metrics and defined terms in this presentation
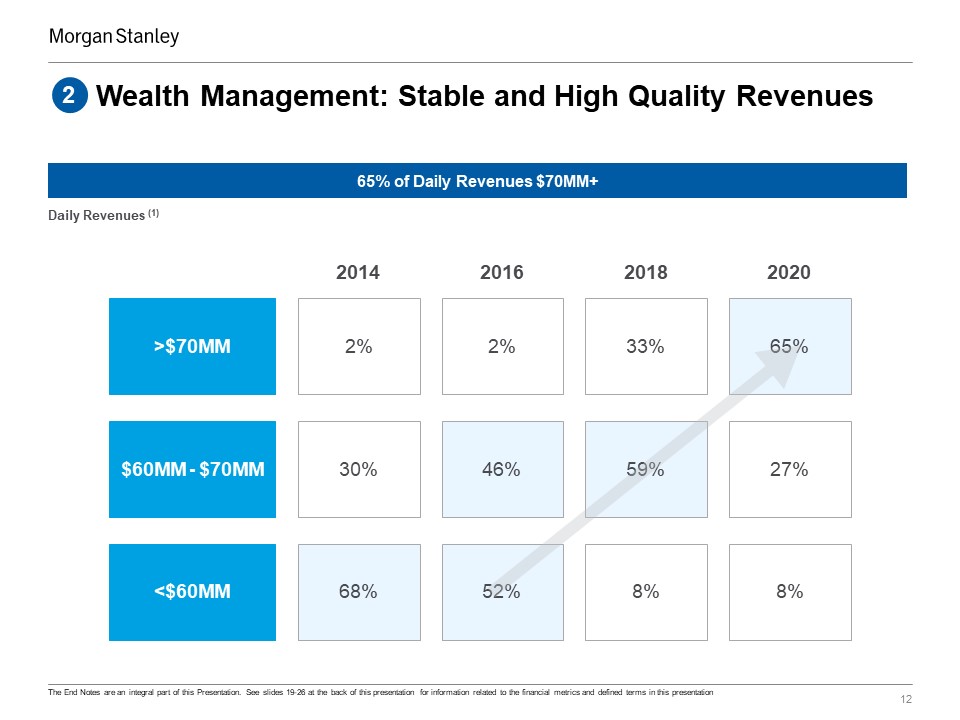
Wealth Management: Stable and High Quality Revenues 12 2 Daily Revenues
(1) 2020 2014 2016 2018 <$60MM 68% $60MM - $70MM 30% >$70MM 2% 8% 52% 8% 27% 46% 59% 65% 2% 33% 65% of Daily Revenues $70MM+ The End Notes are an integral part of this Presentation. See slides 19-26 at the back of
this presentation for information related to the financial metrics and defined terms in this presentation
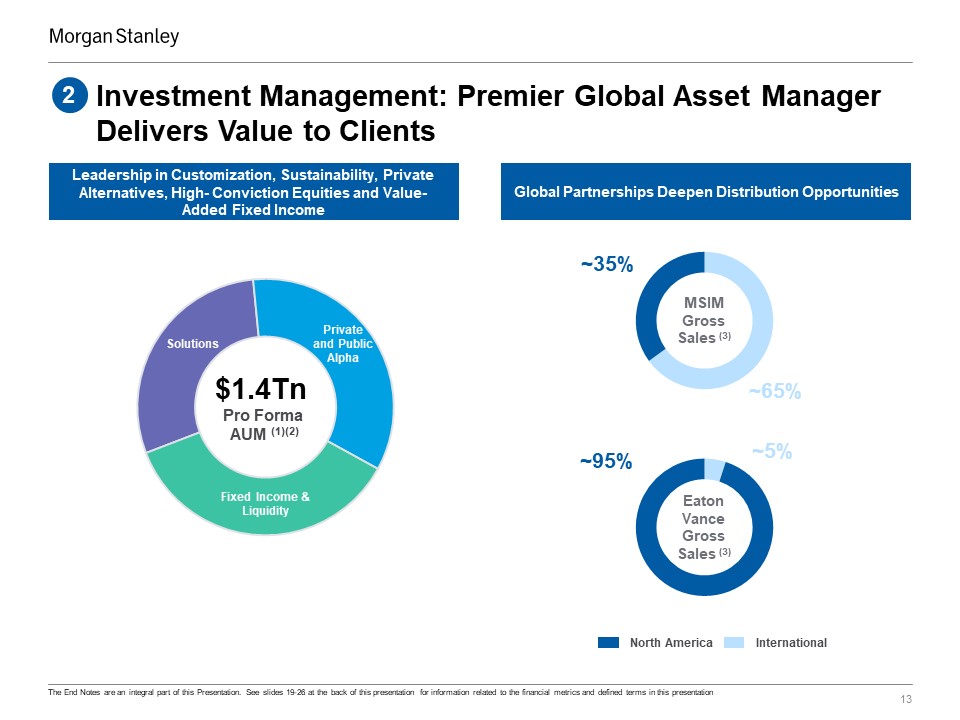
Investment Management: Premier Global Asset Manager Delivers Value to Clients 13 2 $1.4Tn Pro Forma
AUM (1)(2) Private and Public Alpha Solutions Fixed Income & Liquidity ~65% ~35% MSIMGross Sales (3) ~95% ~5% EatonVanceGross Sales (3) North America International Leadership in Customization, Sustainability, Private
Alternatives, High- Conviction Equities and Value- Added Fixed Income Global Partnerships Deepen Distribution Opportunities The End Notes are an integral part of this Presentation. See slides 19-26 at the back of this presentation for
information related to the financial metrics and defined terms in this presentation
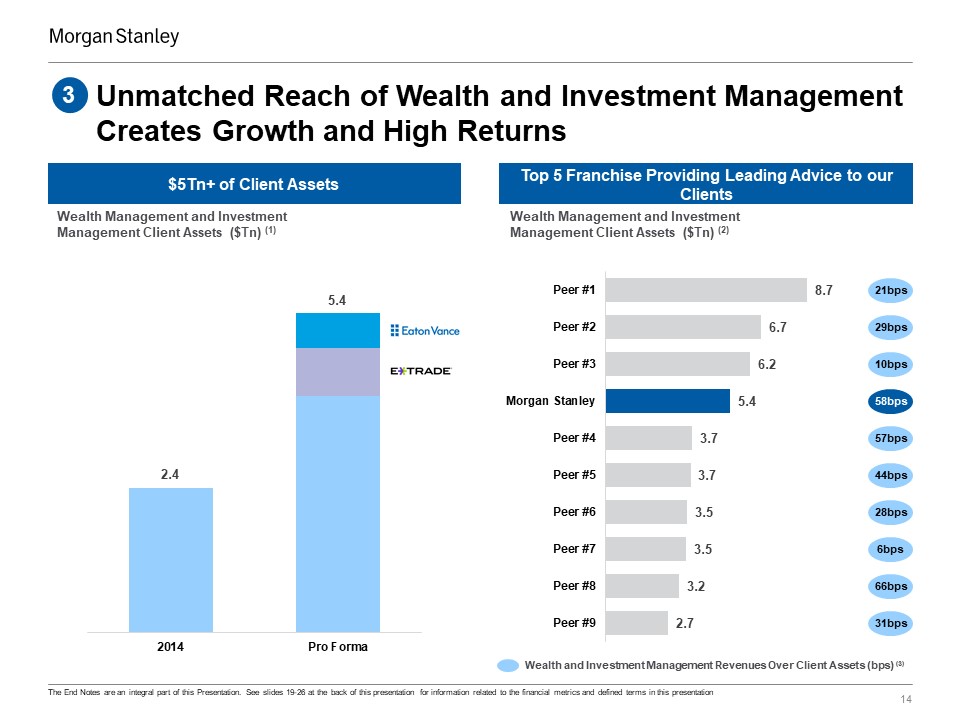
Unmatched Reach of Wealth and Investment Management Creates Growth and High Returns 14 3 Top 5
Franchise Providing Leading Advice to our Clients $5Tn+ of Client Assets Wealth Management and Investment Management Client Assets ($Tn) (1) Wealth and Investment Management Revenues Over Client Assets (bps) (3) Wealth Management and
Investment Management Client Assets ($Tn) (2) 21bps 29bps 10bps 58bps 57bps 44bps 28bps 6bps 66bps 31bps The End Notes are an integral part of this Presentation. See slides 19-26 at the back of this presentation for information
related to the financial metrics and defined terms in this presentation
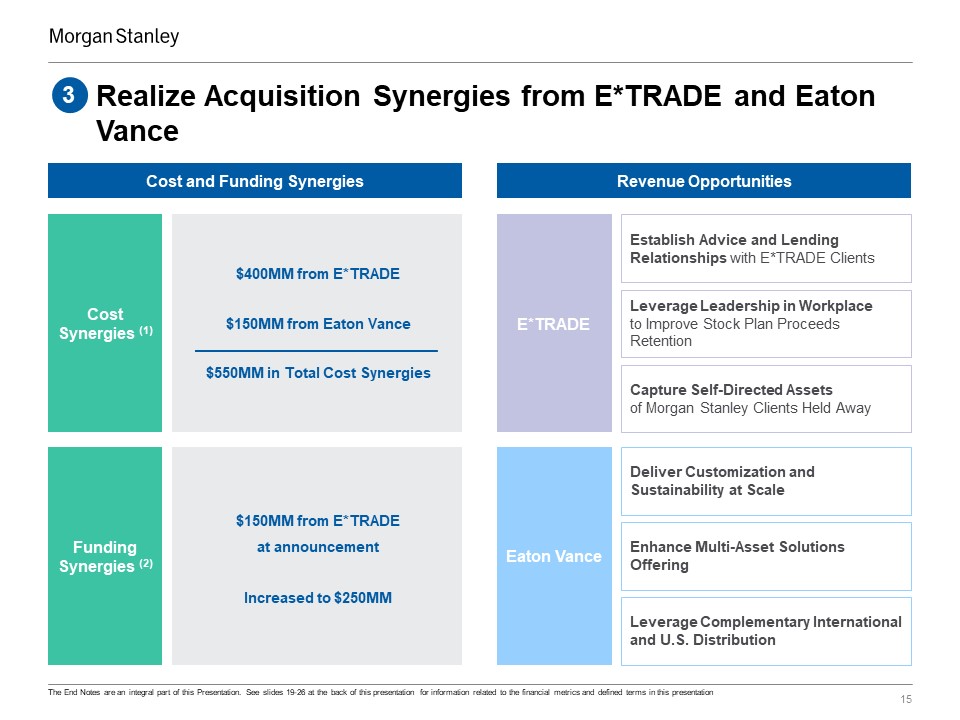
15 Realize Acquisition Synergies from E*TRADE and Eaton Vance 3 Funding Synergies (2) Cost
Synergies (1) $150MM from E*TRADEat announcementIncreased to $250MM $400MM from E*TRADE$150MM from Eaton Vance$550MM in Total Cost Synergies Cost and Funding Synergies Revenue Opportunities E*TRADE Eaton Vance Deliver Customization and
Sustainability at Scale Establish Advice and Lending Relationships with E*TRADE Clients Leverage Leadership in Workplaceto Improve Stock Plan Proceeds Retention Capture Self-Directed Assetsof Morgan Stanley Clients Held Away Enhance
Multi-Asset Solutions Offering Leverage Complementary International and U.S. Distribution The End Notes are an integral part of this Presentation. See slides 19-26 at the back of this presentation for information related to the financial
metrics and defined terms in this presentation
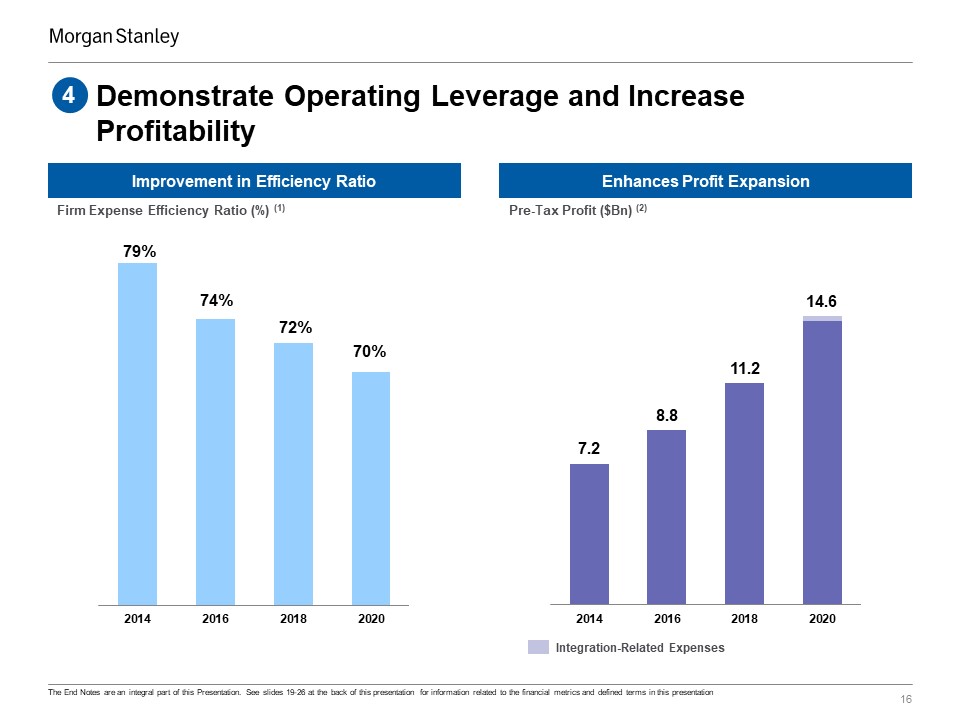
Demonstrate Operating Leverage and Increase Profitability 16 4 Firm Expense Efficiency Ratio (%)
(1) Pre-Tax Profit ($Bn) (2) Enhances Profit Expansion Improvement in Efficiency Ratio Integration-Related Expenses The End Notes are an integral part of this Presentation. See slides 19-26 at the back of this presentation for
information related to the financial metrics and defined terms in this presentation
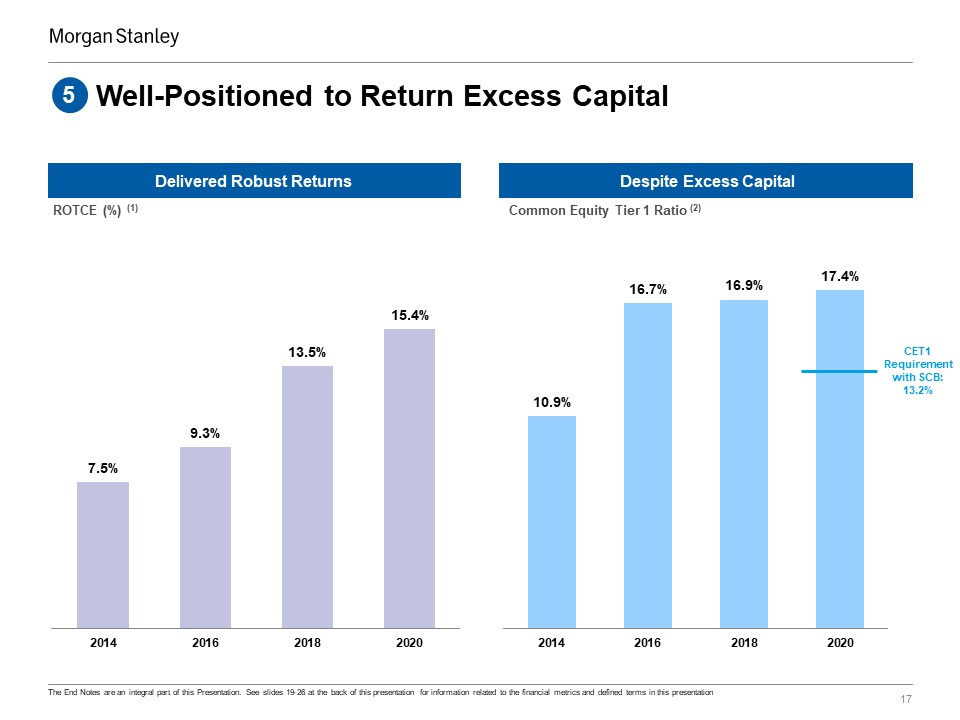
Well-Positioned to Return Excess Capital ROTCE (%) (1) 17 5 Despite Excess Capital Delivered
Robust Returns Common Equity Tier 1 Ratio (2) CET1 Requirement with SCB: 13.2% The End Notes are an integral part of this Presentation. See slides 19-26 at the back of this presentation for information related to the financial metrics and
defined terms in this presentation
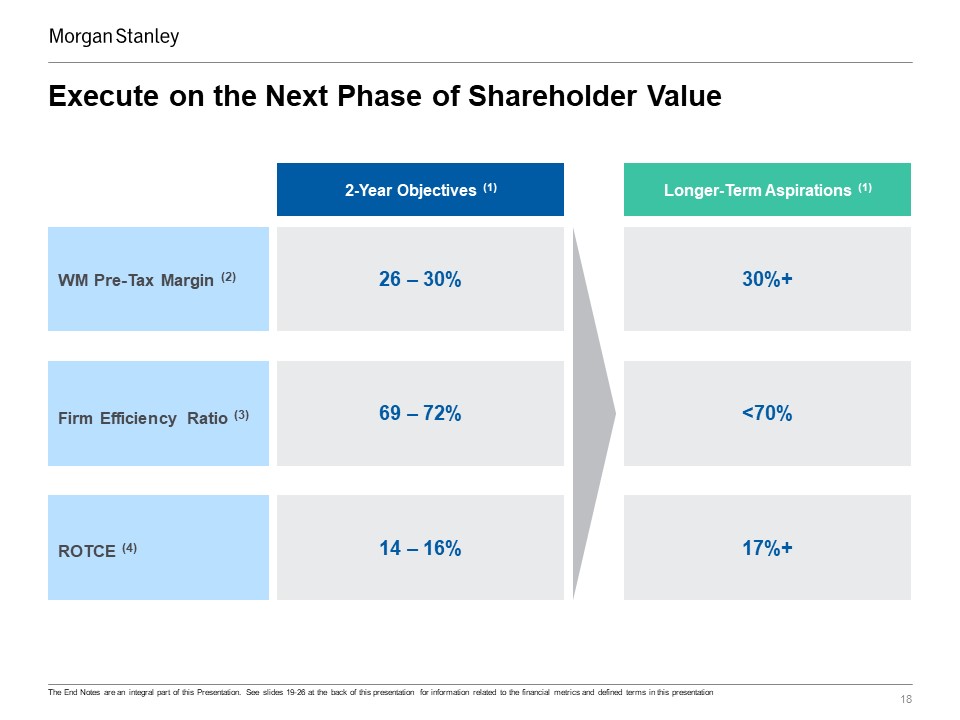
Execute on the Next Phase of Shareholder Value 2-Year Objectives (1) 18 WM Pre-Tax Margin (2) Firm
Efficiency Ratio (3) ROTCE (4) Longer-Term Aspirations (1) 26 – 30% 69 – 72% 14 ‒ 16% 30%+ <70% 17%+ The End Notes are an integral part of this Presentation. See slides 19-26 at the back of this presentation for information
related to the financial metrics and defined terms in this presentation
End Notes 19 The Firm’s financial presentations, earnings releases, earnings conference calls, and
other communications may include certain metrics, including non-GAAP financial measures, which we believe to be useful to us, investors, analysts and other stakeholders by providing further transparency about, or an additional means of
assessing, our financial condition and operating results. The End Notes are an integral part of our presentations and other communications. For additional information refer to the Definition of U.S. GAAP to Non-GAAP Measures, Definitions of
Performance Metrics and Terms, Supplemental Quantitative Details and Calculations (includes reconciliation of GAAP to non-GAAP), and Legal Notice in the Morgan Stanley Fourth Quarter 2020 Financial Supplement included in the Current Report on
Form 8-K dated January 20, 2021 (‘Morgan Stanley Fourth Quarter 2020 Financial Supplement’).
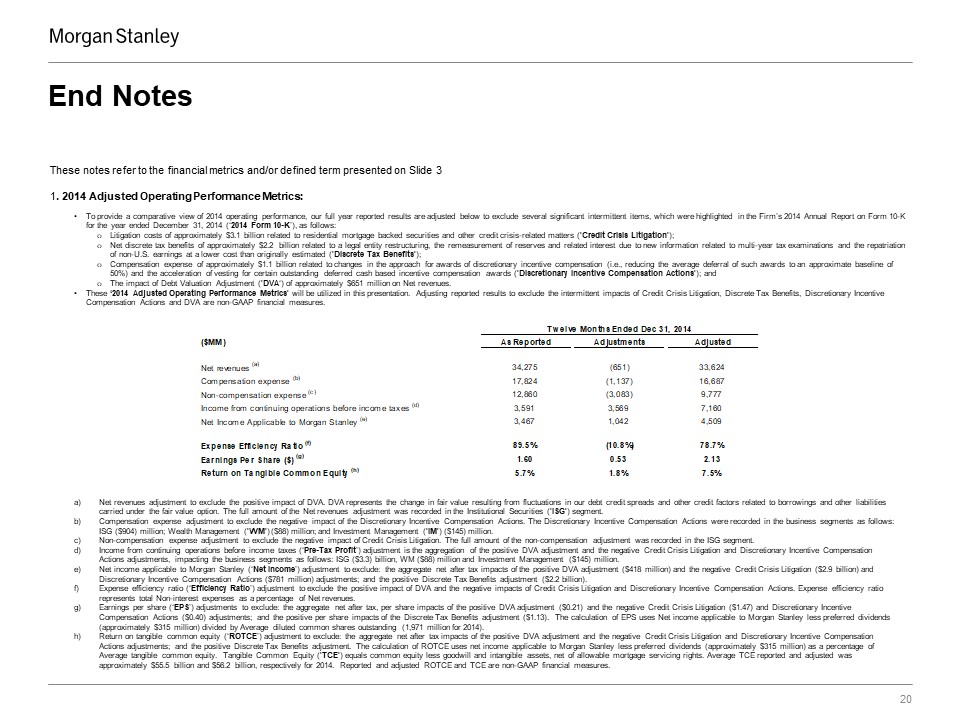
These notes refer to the financial metrics and/or defined term presented on Slide 31. 2014 Adjusted
Operating Performance Metrics: Net revenues adjustment to exclude the positive impact of DVA. DVA represents the change in fair value resulting from fluctuations in our debt credit spreads and other credit factors related to borrowings and
other liabilities carried under the fair value option. The full amount of the Net revenues adjustment was recorded in the Institutional Securities ('ISG') segment.Compensation expense adjustment to exclude the negative impact of the
Discretionary Incentive Compensation Actions. The Discretionary Incentive Compensation Actions were recorded in the business segments as follows: ISG ($904) million; Wealth Management ('WM') ($88) million; and Investment Management ('IM')
($145) million.Non-compensation expense adjustment to exclude the negative impact of Credit Crisis Litigation. The full amount of the non-compensation adjustment was recorded in the ISG segment.Income from continuing operations before income
taxes (‘Pre-Tax Profit’) adjustment is the aggregation of the positive DVA adjustment and the negative Credit Crisis Litigation and Discretionary Incentive Compensation Actions adjustments, impacting the business segments as follows: ISG
($3.3) billion, WM ($88) million and Investment Management ($145) million.Net income applicable to Morgan Stanley (‘Net Income’) adjustment to exclude: the aggregate net after tax impacts of the positive DVA adjustment ($418 million) and the
negative Credit Crisis Litigation ($2.9 billion) and Discretionary Incentive Compensation Actions ($781 million) adjustments; and the positive Discrete Tax Benefits adjustment ($2.2 billion).Expense efficiency ratio (‘Efficiency Ratio’)
adjustment to exclude the positive impact of DVA and the negative impacts of Credit Crisis Litigation and Discretionary Incentive Compensation Actions. Expense efficiency ratio represents total Non-interest expenses as a percentage of Net
revenues.Earnings per share (‘EPS’) adjustments to exclude: the aggregate net after tax, per share impacts of the positive DVA adjustment ($0.21) and the negative Credit Crisis Litigation ($1.47) and Discretionary Incentive Compensation
Actions ($0.40) adjustments; and the positive per share impacts of the Discrete Tax Benefits adjustment ($1.13). The calculation of EPS uses Net income applicable to Morgan Stanley less preferred dividends (approximately $315 million) divided
by Average diluted common shares outstanding (1,971 million for 2014).Return on tangible common equity (‘ROTCE’) adjustment to exclude: the aggregate net after tax impacts of the positive DVA adjustment and the negative Credit Crisis
Litigation and Discretionary Incentive Compensation Actions adjustments; and the positive Discrete Tax Benefits adjustment. The calculation of ROTCE uses net income applicable to Morgan Stanley less preferred dividends (approximately $315
million) as a percentage of Average tangible common equity. Tangible Common Equity ('TCE') equals common equity less goodwill and intangible assets, net of allowable mortgage servicing rights. Average TCE reported and adjusted was
approximately $55.5 billion and $56.2 billion, respectively for 2014. Reported and adjusted ROTCE and TCE are non-GAAP financial measures. 20 To provide a comparative view of 2014 operating performance, our full year reported results are
adjusted below to exclude several significant intermittent items, which were highlighted in the Firm’s 2014 Annual Report on Form 10-K for the year ended December 31, 2014 (‘2014 Form 10-K’), as follows: Litigation costs of approximately $3.1
billion related to residential mortgage backed securities and other credit crisis-related matters ('Credit Crisis Litigation'); Net discrete tax benefits of approximately $2.2 billion related to a legal entity restructuring, the remeasurement
of reserves and related interest due to new information related to multi-year tax examinations and the repatriation of non-U.S. earnings at a lower cost than originally estimated ('Discrete Tax Benefits'); Compensation expense of
approximately $1.1 billion related to changes in the approach for awards of discretionary incentive compensation (i.e., reducing the average deferral of such awards to an approximate baseline of 50%) and the acceleration of vesting for
certain outstanding deferred cash based incentive compensation awards ('Discretionary Incentive Compensation Actions'); andThe impact of Debt Valuation Adjustment ('DVA‘) of approximately $651 million on Net revenues.These ‘2014 Adjusted
Operating Performance Metrics' will be utilized in this presentation. Adjusting reported results to exclude the intermittent impacts of Credit Crisis Litigation, Discrete Tax Benefits, Discretionary Incentive Compensation Actions and DVA are
non-GAAP financial measures. End Notes
End Notes 21 These notes refer to the financial metrics and/or defined term presented on Slide 3The
comparisons of current and prior periods are impacted by the financial results of E*TRADE reported in the Wealth Management Segment. The Firm's fourth quarter earnings results reflect the completed acquisition of E*TRADE Financial Corporation
(‘E*TRADE’), which closed on October 2, 2020. Expense efficiency ratio (‘Efficiency Ratio’) represents total non-interest expenses as a percentage of net revenues. The 2020 Efficiency Ratio was adjusted to exclude the impact of
integration‐related expenses of $231 million on a pre-tax basis. The adjusted Efficiency Ratio is a non-GAAP financial measure.Return on average tangible common equity (‘ROTCE’) represents earnings applicable to Morgan Stanley common
shareholders as a percentage of average tangible common equity. The 2020 ROTCE was adjusted to exclude the impact of integration‐related expenses of $231 million on a pre-tax basis or $189 million on an after-tax basis. The adjusted ROTCE is
a non-GAAP financial measure. Earnings Per Share (‘EPS’) represents earnings applicable to Morgan Stanley common shareholders divided by diluted common shares outstanding. The 2020 EPS was adjusted to exclude the impact of integration‐related
expenses of $231 million on a pre-tax basis or $189 million on an after-tax basis. The adjusted EPS is a non-GAAP financial measure.Common Equity Tier 1 capital ratio is based on the Basel III Standardized Approach Fully Phased-in rules for
all periods.These notes refer to the financial metrics and/or defined term presented on Slide 6Pre-Tax Margin for 2014 is adjusted to exclude the aggregation of the positive DVA adjustment and the negative Credit Crisis Litigation and
Discretionary Incentive Compensation Actions adjustments, ($3.3 billion) (refer to note (1) for Slide 3). Pre-Tax Margin represents Pre-Tax Profit as a percentage of net revenues. The adjusted Pre-Tax Margin is a non-GAAP financial measure.
Assets Under Management (AUM) represents Morgan Stanley’s Investment Management AUM. Pro Forma Assets Under Management represents the addition of Morgan Stanley’s Investment Management and Eaton Vance’s assets under management. Morgan
Stanley’s Investment Management assets under management based on Morgan Stanley Fourth Quarter 2020 Financial Supplement. Eaton Vance’s assets under management as of December 31, 2020 based on Eaton Vance’s Press Release dated January 15,
2021 available on Eaton Vance’s website (‘Eaton Vance’s January 2021 Press Release’). The Eaton Vance acquisition is still pending and subject to customary closing conditions.2020 Net Revenues represents Morgan Stanley’s Investment Management
net revenues.These notes refer to the financial metrics and/or defined term presented on Slide 7Wallet represents aggregated reported net revenues of Morgan Stanley and the following peers: Bank of America, Barclays, Citigroup, Credit Suisse,
Deutsche Bank, Goldman Sachs, JP Morgan, and UBS. Morgan Stanley’s ISG wallet share represents total ISG segment net revenues. Peer wallet includes revenues that represent Investment Banking, Equity Sales & Trading and Fixed Income Sales
& Trading, where applicable. For firms that disclose results between multiple segments, assumptions have been made based on company disclosures. Morgan Stanley’s 2014 Wallet Share is calculated as the percentage of Morgan Stanley’s net
revenues, excluding DVA to the Wallet and has been restated to conform with current reporting methodology. Peer data for 2014 has been adjusted for DVA, where it is reported and where applicable.European peer results were translated to USD
using average exchange rates for the appropriate period; sourced from Bloomberg.The 2020 Wallet estimates utilize results for peers that have reported full-year 2020 results as of January 19, 2021. For the European peers that have not yet
reported, a 2020 full year results estimate is derived assuming the aggregate share of the Wallet for European peers for the first nine months remains constant in the fourth quarter of 2020.Pre-Tax Profit Wallet represents Pre-Tax Profit of
Morgan Stanley Wealth Management and the following peers: Bank of America Global Wealth and Investment Management, UBS Wealth Management Americas and Wells Fargo Wealth and Investment Management. Morgan Stanley’s Wallet Share is calculated as
the percentage of Morgan Stanley’s Pre-Tax Profit to the Wallet. Morgan Stanley’s Pre-Tax Profit for 2020 was adjusted to exclude the impact of integration‐related expenses of $231 million on a pre-tax basis. The 2020 Wallet estimates utilize
results for peers that have reported full-year 2020 results as of January 19, 2021. For the peers that have not yet reported, a 2020 full year results estimate is derived assuming the aggregate share of their Wallet for the first nine months
remains constant in the fourth quarter of 2020.
End Notes 22 These notes refer to the financial metrics and/or defined term presented on Slide
7Long-Term Net Flows represents cumulative long-term net flows over 15 quarters from calendar 1Q 2017 to 3Q 2020 as a percentage of beginning Assets Under Management for 2017 (as of calendar 4Q 2016) for Morgan Stanley and Peers, to reflect
most recently available data for Peers over a consistent timeframe. For Eaton Vance, this represents cumulative long-term net flows over 15 fiscal quarters from fiscal 2Q 2017 to 4Q 2020 as a percentage of beginning Assets Under Management as
of fiscal 1Q 2017. Cumulative long-term net flows as a percentage of beginning Assets Under Management for Morgan Stanley over 16 quarters through 4Q 2020 is 29%.Peer Average includes AllianceBernstein, BlackRock (Active Only), DWS (Active
Only), Franklin Templeton, Goldman Sachs Asset Management, Invesco (Active Only), Janus Henderson Group, JP Morgan Asset Management and T. Rowe Price. These represent Morgan Stanley Investment Management and Eaton Vance’s peers based on
similarity of business models and Assets Under Management. In addition, all notable acquisitions have been removed from net flows. These notes refer to the financial metrics and/or defined term presented on Slide 8VaR estimates a portfolio’s
aggregate market risk exposure, representing the unrealized loss in portfolio value that one would not expect to exceed, on average, more than five times every one hundred trading days if the portfolio was held constant for a one-day period.
Since reported VaR statistics are estimates based on historical data, VaR should not be viewed as predictive of our future revenues or financial performance or our ability to monitor and manage risk. There can be no assurance that our actual
losses on a particular day will not exceed the VaR amounts indicated. VaR statistics are not readily comparable across firms because of differences in the firm’s portfolios, modeling assumptions and methodologies. These differences can result
in materially different estimates across firms for similar products. For a discussion of our primary risk exposures and market risk management, VaR methodology, assumptions and limitations, see “Quantitative and Qualitative Disclosure about
Risk – Market Risk – Trading Risks in Firm’s 2019 Annual Report on Form 10-K for the year ended December 31, 2019.ISG Net Revenues for 2014 exclude the positive impact of approximately $651 million from DVA. (refer to note (1) for Slide 3).
The adjusted Net Revenues is a non-GAAP financial measure. Pre-Tax Margin for 2014 exclude the aggregation of the positive DVA adjustment and the negative Credit Crisis Litigation and Discretionary Incentive Compensation Actions adjustments,
($3.3 billion) (refer to note (1) for Slide 3). The adjusted Pre-Tax Margin is a non-GAAP financial measure.
End Notes 23 These notes refer to the financial metrics and/or defined term presented on Slide 9
Individual households or participants that are engaged in one or more of our Wealth Management channels (Advisor-Led, Self-Directed, Workplace) will be included in each of the respective channel counts. Position in Advisor-Led represents
client assets based on internal analysis aggregated for Bank of America Merrill Lynch Global Wealth Management, UBS Wealth Management Americas and Wells Fargo Wealth and Investment Management per company filings as of most recently reported
results. For Morgan Stanley, Advisor-Led Client Assets represents client assets in accounts that have a Wealth Management representative assigned.Advisor-Led Households represents the total number of households that include at least one
account with Advisor-Led Clients Assets and is based on Morgan Stanley internal data as of December 31, 2020. Figures are adjusted for overlapping Advisor-Led Households between Morgan Stanley subsidiaries.Fee‐Based Asset Flows includes net
new fee‐based assets, net account transfers, dividends, interest, and client fees and excludes institutional cash management related activity. 3. Workplace Rank Position derived from Morgan Stanley internal analysis based on number of stock
plan participants informed by latest available data for Bank of America, Carta, Certent, Charles Schwab, Computershare, Fidelity, and UBS.Workplace Participants represents total accounts with vested or unvested assets >$0 in the Workplace
channel. Individuals with accounts in multiple plans are counted as participants in each plan.Proceeds Retention Opportunity represents the potential percentage of domestic proceeds that could be retained 12 months post exercise. 4. Position
in Self-Directed derived from Aite Group “New Realities in Wealth Management: Growth Amplifies Prior to the Storm” report (December 2020). Peers include Fidelity, Charles Schwab / TD Ameritrade, Merrill Edge and others. Self-Directed
Households represents the total number of households that include at least one account with Self-Directed Assets. Self-Directed Assets represents active accounts which are not Advisor-Led. Active accounts are defined as having $25 or more in
assets. Assets Lost to Channels with Advice represent assets lost to channels with advice capabilities based on data from Automated Customer Account Transfer Services.Assets Held Away is estimated using data from IXI as of June 2020 for
retail clients and stock plan participants.These notes refer to the financial metrics and/or defined term presented on Slide 10Prior Record represents the previous record for a full year or at year-end.Daily Average Revenue Trades (DARTs)
represents the total client-directed trades in a period divided by the number of trading days during that period. Net New Assets (NNA) represents client inflows (including dividend and interest) less client outflows (excluding activity from
business combinations/divestitures and impact of fees and commissions), and has been adjusted to conform to Morgan Stanley’s methodology.On/Off Balance Sheet Deposits represents E*TRADE’s deposit liabilities including both client deposits
(brokerage sweep and other) and off-balance sheet deposits held by third parties outside of Morgan Stanley.Stock Plan Proceeds Retention represents the percentage of domestic proceeds retained 12 months post exercise. Prior record based on
proceeds retention at year-end.
End Notes 24 These notes refer to the financial metrics and/or defined term presented on Slide 11 Net
New Assets represents client inflows (including dividend and interest) less client outflows (excluding activity from business combinations/divestitures and impact of fees and commissions). Average Net New Assets as % of Beginning Client
Assets represents an average of Morgan Stanley’s Net New Assets divided by beginning client assets for each period. 2020 Pro Forma represents the addition of Net New Assets for Morgan Stanley and E*TRADE for Full Year 2020 divided by the
addition of beginning client assets for Morgan Stanley and E*TRADE for Full Year 2020. E*TRADE’s beginning client assets represents total customer assets, excluding corporate services unvested holdings based on E*TRADE’s Annual Report on Form
10-K for the year ended December 31, 2019.These notes refer to the financial metrics and/or defined term presented on Slide 12 The daily revenue distribution reflects net revenues for the WM segment attributed as follows: Transactional
revenues on the day the revenue was recorded; and Asset Management, Net Interest and Other revenues based on the a daily average, where the reported revenue for the period is divided by the number of business days in the period. These notes
refer to the financial metrics and/or defined term presented on Slide 13Pro Forma Assets Under Management represents the addition of Morgan Stanley’s Investment Management and Eaton Vance’s assets under management. Morgan Stanley’s Investment
Management assets under management based on Morgan Stanley Fourth Quarter 2020 Financial Supplement. Eaton Vance’s assets under management based on Eaton Vance’s January 2021 Press Release. The Eaton Vance acquisition is still pending and
subject to customary closing conditions.For Morgan Stanley “Private and Public Alpha” includes public equity strategies reported under the "Equity" category and real assets, private equity, private credit and private equity fund of funds
reported under the "Alternative/Other" category as of December 31, 2020 in the Morgan Stanley Fourth Quarter 2020 Financial Supplement. For Eaton Vance “Private and Public Alpha” includes strategies reported under the "Equity" category and
the "Alternative" category as of December 31, 2020 in Eaton Vance’s January 2021 Press Release. For Morgan Stanley “Solutions” includes multi-asset portfolio strategies and hedge fund of funds reported under the "Alternative/Other" category
as of December 31, 2020 in the Morgan Stanley Fourth Quarter 2020 Financial Supplement. For Eaton Vance “Solutions” includes strategies reported under the “Parametric custom portfolios” and “Parametric overlay services” categories as of
December 31, 2020 in Eaton Vance’s January 2021 Press Release. For Morgan Stanley “Fixed Income & Liquidity” includes strategies reported under the "Fixed income" and "Liquidity" categories as of December 31, 2020 in the Morgan Stanley
Fourth Quarter 2020 Financial Supplement. For Eaton Vance “Fixed Income & Liquidity” includes strategies reported under the "Fixed income" and "Floating-rate income" categories as of December 31, 2020 in Eaton Vance’s January 2021 Press
Release.Gross Sales represents gross sales from long-term asset classes for full year 2020 period from January 1 through December 31, 2020 for Morgan Stanley and full year 2020 fiscal period from November 1, 2019 through October 31, 2020 for
Eaton Vance.
End Notes 25 These notes refer to the financial metrics and/or defined term presented on Slide 14
Wealth Management and Investment Management Client Assets represents Wealth Management client assets and Investment Management assets under management based on the 2014 Form 10-K and the Morgan Stanley Fourth Quarter 2020 Financial
Supplement.Pro Forma Client Assets represents the addition of Morgan Stanley’s client assets and Eaton Vance’s client assets. Eaton Vance’s client assets based on Eaton Vance’s January 2021 Press Release and represent total assets under
management. Client Assets Ranking based on internal analysis of combined Investment and Wealth Management client assets and assets under management with data aggregated from public filings for Allianz, Bank of America, BlackRock, Charles
Schwab / Ameritrade, Fidelity, JP Morgan, State Street, UBS and Vanguard. Rankings based on the most recently available data for combined Investment Management and Wealth Management client assets and assets under management. Most recently
available data represents 4Q 2020 for peers that have reported results as of January 19, 2021 (Bank of America, BlackRock, Charles Schwab / Ameritrade, JP Morgan and State Street), 3Q 2020 for peers that have not reported yet (Allianz,
Fidelity and UBS) and data as of January 2020 for Vanguard. Rankings exclude assets under custody and assets under administration. Morgan Stanley’s position in the rankings based on Pro Forma Client Assets. Wealth and Investment Management
Revenues Over Client Assets based on internal analysis and represents Net Revenues divided by average client assets. For peers that have reported results as of January 19, 2021, Net Revenues represent full-year 2020 results for the
combination of Wealth Management and Investment Management and average client assets represents an average of five most recent quarters. For peers that have not reported yet, except for Fidelity and Vanguard, Net Revenues are based on 2020
revenue estimates derived by annualizing revenues for the first nine months of 2020, divided by average client assets for an average of four most recent quarters. For Fidelity, Net Revenues represent 2019 total company revenues and average
client assets represent an average of 2018 and 2019 total assets under administration. For Vanguard, Revenues Over Client Assets represents the average expense ratio (U.S. asset-weighted fund expenses as a percentage of 2019 average net
assets) available on its website. Net Revenues for Morgan Stanley represent the addition of Morgan Stanley’s Wealth Management and Investment Management Net Revenues for full-year 2020, E*TRADE’s Net Revenues for first nine months of 2020 and
Eaton Vance’s fiscal 2020 Net Revenues. Morgan Stanley’s Wealth Management and Investment Management Net Revenues represent the aggregation of both segments’ net revenues and exclude intersegment activity. Morgan Stanley net revenues based on
the Morgan Stanley Fourth Quarter 2020 Financial Supplement. Eaton Vance’s Net Revenues represent total revenue and total non-operating income based on Eaton Vance’s Annual Report on Form 10-K for the fiscal year ended October 31, 2020.
E*TRADE’s 1Q and 2Q 2020 Net revenues represent Total Net Revenues based on E*TRADE’s Quarterly Report on Form10-Q for the quarter ended June 30, 2020. Client assets used in the calculation for Morgan Stanley include E*TRADE and Eaton Vance
for 2019 and 2020 fiscal quarters based on relevant Form 10-Q and Form 10-K filings.These notes refer to the financial metrics and/or defined term presented on Slide 15Cost Synergies are Morgan Stanley estimates and are expected to be phased
in from the closing dates of the E*TRADE and Eaton Vance acquisitions.Funding Synergies are Morgan Stanley estimates and are expected to be phased in from the closing date of the E*TRADE acquisition.These notes refer to the financial metrics
and/or defined term presented on Slide 16 Expense efficiency ratio (‘Efficiency Ratio’) represents total non-interest expenses as a percentage of net revenues. The 2020 Efficiency Ratio was adjusted to exclude the impact of
integration‐related expenses of $231 million on a pre-tax basis. The 2014 Efficiency Ratio was adjusted to exclude the positive impact of DVA and the negative impacts of Credit Crisis Litigation and Discretionary Incentive Compensation
Actions (refer to note (1) for Slide 3). The adjusted Efficiency Ratio is a non-GAAP financial measure. Pre-Tax Profit for 2020 was adjusted to exclude the impact of integration‐related expenses of $231 million on a pre-tax basis. Pre-Tax
Profit for 2020 including integration-related expenses was $14.4Bn. 2014 is adjusted to exclude the positive impact of DVA and the negative impacts of Credit Crisis Litigation and Discretionary Incentive Compensation Actions (refer to note
(1) for Slide 3). The adjusted Pre-Tax Profit is a non-GAAP financial measure.
End Notes 26 These notes refer to the financial metrics and/or defined term presented on Slide 17The
calculation of ROTCE for each year utilizes net income applicable to Morgan Stanley less preferred dividends as a percentage of average tangible common equity, respectively. Average tangible common equity represents average common equity
adjusted to exclude goodwill and intangible assets net of allowable mortgage servicing rights deduction. The calculation for 2020 ROTCE was adjusted to exclude the impact of integration‐related expenses of $231 million on a pre-tax basis or
$189 million on an after-tax basis. The 2014 ROTCE was adjusted to exclude the positive impact of DVA and the negative impacts of Credit Crisis Litigation and Discretionary Incentive Compensation Actions (refer to note (1) for Slide 3).The
adjusted ROTCE is a non-GAAP financial measure.Common Equity Tier 1 capital ratio is based on the Basel III Standardized Approach Fully Phased-in rules for all periods.These notes refer to the financial metrics and/or defined term presented
on Slide 18 Firm’s 2-Year Objectives and Longer-Term Aspirations include Eaton Vance. The Eaton Vance acquisition is still pending and subject to customary closing conditions. Pre-Tax Margin represents income (loss) from continuing operations
before taxes divided by net revenues. The Pre-Tax Margin 2-Year Objective of 26% to 30% and Longer-Term Aspiration of 30%+ exclude integration-related expenses. The adjusted Pre-Tax Margin is a non-GAAP financial measure.Efficiency Ratio
represents total non-interest expenses as a percentage of net revenues. The Efficiency Ratio 2-Year Objective of 69% to 72% and Longer-Term Aspiration of <70% exclude integration-related expenses. The adjusted Efficiency Ratio is a
non-GAAP financial measure.The calculation of ROTCE uses net income applicable to Morgan Stanley less preferred dividends as a percentage of average tangible common equity. Tangible common equity (‘TCE’) represents common equity less goodwill
and intangible assets net of allowable mortgage servicing rights. The ROTCE 2-Year Objective of 14% to 16% and Longer-Term Aspiration of 17%+ exclude integration-related expenses. The adjusted ROTCE is a non-GAAP financial measure.
Notice 27 Important Information about the Proposed Transaction with Eaton Vance and Where to Find
ItIn connection with the proposed transaction between Morgan Stanley and Eaton Vance Corp. (“Eaton Vance”), Morgan Stanley and Eaton Vance will file relevant materials with the Securities and Exchange Commission (the “SEC”), including the
Morgan Stanley registration statement on Form S-4 filed on December 4, 2020, including amendments thereto, that includes a prospectus of Morgan Stanley. BEFORE MAKING ANY VOTING OR INVESTMENT DECISION, INVESTORS AND SECURITY HOLDERS OF MORGAN
STANLEY AND EATON VANCE ARE URGED TO READ THE REGISTRATION STATEMENT AND ANY OTHER RELEVANT DOCUMENTS THAT ARE FILED OR WILL BE FILED WITH THE SEC, AS WELL AS ANY AMENDMENTS OR SUPPLEMENTS TO THESE DOCUMENTS, CAREFULLY AND IN THEIR ENTIRETY
WHEN THEY BECOME AVAILABLE BECAUSE THEY CONTAIN OR WILL CONTAIN IMPORTANT INFORMATION ABOUT THE PROPOSED TRANSACTION AND RELATED MATTERS. Investors and security holders may obtain free copies of the registration statement, as well as other
filings containing information about Morgan Stanley or Eaton Vance, without charge at the SEC’s Internet website (http://www.sec.gov) or by contacting the investor relations department of Morgan Stanley or Eaton Vance at the following: Morgan
Stanley Eaton Vance1585 Broadway Two International PlaceNew York, NY 10036 Boston, MA 02110Media Relations: 212-761-2448 Media Relations: 617-672-8940mediainquiries@morganstanley.com rtice@eatonvance.comInvestor Relations: 1-212-762-8131
Investor Relations: 617-672-6744investorrelations@morganstanley.com esenay@eatonvance.com No Offer or Solicitation This presentation is for informational purposes and is not intended to, and shall not, constitute an offer to sell or the
solicitation of an offer to sell or the solicitation of an offer to buy any securities or a solicitation of any vote of approval, nor shall there be any sale of securities in any jurisdiction in which such offer, solicitation or sale would be
unlawful prior to registration or qualification under the securities laws of any such jurisdiction
Notice 28 Forward-Looking StatementsThis presentation contains “forward-looking statements” within
the meaning of the federal securities laws, including Section 27A of the Securities Act of 1933, as amended, and Section 21E of the Securities Exchange Act of 1934, as amended. In this context, forward-looking statements often address
expected future business and financial performance and financial condition, and often contain words such as “expect,” “anticipate,” “intend,” “plan,” “believe,” “seek,” “see,” “will,” “would,” “target,” similar expressions, and variations or
negatives of these words. Forward-looking statements by their nature address matters that are, to different degrees, uncertain, such as statements about the consummation of the proposed transaction and the anticipated benefits thereof. All
such forward-looking statements are subject to risks, uncertainties and assumptions that could cause actual results to differ materially from those expressed in such forward-looking statements. Important risk factors that may cause such a
difference include, but are not limited to, (i) the completion of the proposed transaction on anticipated terms and timing, including obtaining required regulatory approvals, anticipated tax treatment, unforeseen liabilities, future capital
expenditures, revenues, expenses, earnings, synergies, economic performance, indebtedness, financial condition, losses, future prospects, business and management strategies for the management, expansion and growth of the combined company’s
operations and other conditions to the completion of the acquisition, including the possibility that any of the anticipated benefits of the proposed transaction will not be realized or will not be realized within the expected time period,
(ii) the ability of Morgan Stanley and Eaton Vance to integrate the business successfully and to achieve anticipated synergies, risks and costs, (iii) potential litigation relating to the proposed transaction that could be instituted against
Morgan Stanley, Eaton Vance or their respective directors, (iv) the risk that disruptions from the proposed transaction will harm Morgan Stanley’s and Eaton Vance’s business, including current plans and operations, (v) the ability of Morgan
Stanley or Eaton Vance to retain and hire key personnel, (vi) potential adverse reactions or changes to business relationships resulting from the announcement or completion of the acquisition, (vii) continued availability of capital and
financing and rating agency actions, (viii) legislative, regulatory and economic developments, (ix) potential business uncertainty, including changes to existing business relationships, during the pendency of the acquisition that could affect
Morgan Stanley’s and/or Eaton Vance’s financial performance, (x) certain restrictions during the pendency of the acquisition that may impact Morgan Stanley’s or Eaton Vance’s ability to pursue certain business opportunities or strategic
transactions, (xi) unpredictability and severity of catastrophic events, including, but not limited to, acts of terrorism or outbreak of war or hostilities, as well as Morgan Stanley’s or Eaton Vance’s management’s response to any of the
aforementioned factors, (xii) dilution caused by Morgan Stanley’s issuance of additional shares of its common stock in connection with the proposed transaction, (xiii) the possibility that the transaction may be more expensive to complete
than anticipated, including as a result of unexpected factors or events, (xiv) those risks described in Item 1A of Morgan Stanley’s most recently filed Annual Report on Form 10-K and subsequent reports on Forms 10-Q and 8-K, (xv) those risks
described in Item 1A of Eaton Vance’s most recently filed Annual Report on Form 10-K and subsequent reports on Forms 10-Q and 8-K and (xvi) the additional risk factors described in the registration statement on Form S-4 filed on December 4,
2020, including amendments thereto (“Form S-4”), available from the sources indicated above. These risks, as well as other risks associated with the proposed acquisition, are more fully discussed in the registration statement on Form S-4
filed with the SEC in connection with the proposed acquisition. While the list of factors presented here is, and the list of factors presented in the registration statement on Form S-4 are, considered representative, no such list should be
considered to be a complete statement of all potential risks and uncertainties. Unlisted factors may present significant additional obstacles to the realization of forward-looking statements. Consequences of material differences in results as
compared with those anticipated in the forward-looking statements could include, among other things, business disruption, operational problems, financial loss, legal liability to third parties and similar risks, any of which could have a
material adverse effect on Morgan Stanley’s or Eaton Vance’s consolidated financial condition, results of operations, credit rating or liquidity. Neither Morgan Stanley nor Eaton Vance assumes any obligation to publicly provide revisions or
updates to any forward-looking statements, whether as a result of new information, future developments or otherwise, should circumstances change, except as otherwise required by securities and other applicable laws.