Attached files
| file | filename |
|---|---|
| EX-32.1 - EXHIBIT 32.1 - Digital Brand Media & Marketing Group, Inc. | ex_217467.htm |
| EX-31.1 - EXHIBIT 31.1 - Digital Brand Media & Marketing Group, Inc. | ex_217466.htm |
UNITED STATES
SECURITIES AND EXCHANGE COMMISSION
Washington, D.C. 20549
FORM 10-K
☒ ANNUAL REPORT UNDER SECTION 13 OR 15(D) OF THE SECURITIES EXCHANGE ACT OF 1934
FOR FISCAL YEAR ENDED: August 31, 2020
OR
☐ TRANSITION REPORT UNDER SECTION 13 OR 15(D) OF THE SECURITIES EXCHANGE ACT OF 1934
For the transition period from
Commission file number: 333-85072
DBMM GROUP
DIGITAL BRAND MEDIA & MARKETING GROUP, INC.
WWW.DBMMGROUP.COM
(Name of small business issuer in its charter)
|
Florida |
59-3666743 |
|
(State or other jurisdiction of incorporation or organization) |
(IRS Employer Identification No.) |
845 Third Avenue, 6th Floor, New York, NY 10022
(Address of principal executive offices)
(646) 722-2706
(Issuer’s telephone number)
Securities registered pursuant to Section 12(b) of the Act
|
Title of each class |
Trading Symbol(s) |
Name of each exchange on which registered |
|
Common Stock, $0.001 par value |
DBMM |
OTC Markets |
Indicate by check mark if the Registrant is a well-known seasoned issuer, as defined in Rule 405 of the Securities Act. Yes ☐ No ☒
Indicate by check mark if the Registrant is not required to file reports pursuant to Section 13 or 15(d) of the Act. Yes ☐ No ☒
Indicate by check mark whether the Registrant (1) has filed all reports required to be filed by Section 13 or 15(d) of the Securities Exchange Act of 1934 during the preceding 12 months (or for such shorter period that the registrant was required to file such reports), and (2) has been subject to such filing requirements for the past 90 days. Yes ☒ No ☐
Indicate by check mark if disclosure of delinquent filers pursuant to Item 405 of Regulation S-K (§229.405 of this chapter) is not contained herein, and will not be contained, to the best of the Registrant’s knowledge, in definitive proxy or information statements incorporated by reference in Part III of this Form 10-K or any amendment to this Form 10-K. ☐
Indicate by check mark whether the registrant has submitted electronically every Interactive Data File required to be submitted pursuant to Rule 405 of Regulation S-T (§232.405 of this chapter) during the preceding 12 months (or for such shorter period that the registrant was required to submit such files). Yes ☒ No ☐
Indicate by check mark whether the Registrant is a large accelerated filer, an accelerated filer, a non-accelerated filer or a smaller reporting company. See definitions of “large accelerated filer,” “accelerated filer” , “smaller reporting company” and “emerging growth company” in Rule 12b-2 of the Exchange Act.
|
Large accelerated filer |
☐ |
|
Accelerated filer |
☐ |
|
Non-accelerated filer |
☐ |
|
Smaller reporting company |
☒ |
|
Emerging growth company |
☐ |
|
|
|
If an emerging growth company, indicate by check mark if the registrant has elected not to use the extended transition period for complying with any new or revised financial accounting standards provided pursuant to Section 13(a) of the Exchange Act. ☐
Indicate by check mark whether the Registrant is a shell company (as defined in Rule 12b-2 of the Exchange Act). Yes ☐ No ☒
State the aggregate market value of the voting and non-voting common equity held by non-affiliates computed by reference to the price at which the common equity was sold, or the average bid and asked prices of such common equity, as of the last business day of the registrants most recently completed third fiscal quarter: on May 29, 2020: $1,439,665
State the number of shares outstanding of each of the issuer’s classes of common equity, as of the latest practicable date:
Common Stock, par value $.001 per share: 757,718,631 Outstanding as of December 14, 2020
DOCUMENTS INCORPORATED BY REFERENCE
If the following documents are incorporated by reference, briefly describe them and identify the part of the Form 10-K (e.g., Part I, Part II, etc.) into which the document is incorporated: (i) any annual report to security holders; (ii) any proxy or information statement; and (iii) any prospectus filed pursuant to Rule 424(b) or (c) of the Securities Act of 1933 (the “Securities Act”). The listed documents should be clearly described for identification purposes (e.g. annual reports to security holders for fiscal year ended December 24, 1980).
None
Transitional Small Business Disclosure Format (Check one): Yes ☐ No ☒
|
FORM 10-K |
||
|
For the Fiscal Years Ended August 31, 2020, and 2019 |
||
|
TABLE OF CONTENTS |
||
|
|
|
Page |
|
PART I |
|
|
|
|
|
|
|
Item 1. |
4 |
|
|
Item 1A. |
4 |
|
|
Item 1B. |
4 |
|
|
Item 2. |
5 |
|
|
Item 3. |
5 |
|
|
Item 4. |
5 |
|
|
|
|
|
|
PART II |
|
|
|
|
|
|
|
Item 5. |
6 |
|
|
Item 6. |
6 |
|
|
Item 7. |
Management’s Discussion and Analysis of Financial Condition and Results of Operation |
7 |
|
Item 8. |
25 |
|
|
Item 9. |
Changes in and Disagreements with Accountants on Accounting and Financial Disclosure |
26 |
|
Item 9A (T). |
26 |
|
|
Item 9B. |
Other Information |
|
|
|
|
|
|
PART III |
|
|
|
|
|
|
|
Item 10. |
27 |
|
|
Item 11. |
29 |
|
|
Item 12. |
Security Ownership of Certain Beneficial Owners and Management and Related Stockholder Matters |
30 |
|
Item 13. |
30 |
|
|
Item 14. |
30 |
|
|
|
|
|
|
PART IV |
|
|
|
|
|
|
|
Item 15. |
31 |
|
|
|
|
|
|
32 |
||
PART I
SPECIAL NOTE REGARDING FORWARD-LOOKING STATEMENTS
This Annual Report contains forward-looking statements. These forward-looking statements are based largely on our expectations and are subject to a number of risks and uncertainties, many of which are beyond our control. Actual results could differ materially from these forward-looking statements as a result of, among other factors, risks related to the large amount of our outstanding term loans; history of net losses and accumulated deficits; reliance on third parties to market, sell and distribute our products; future capital requirements; competition and technical advances; reliance on a small number of customers for a significant percentage of our revenues; and other risks. In light of these risks and uncertainties, there can be no assurance that the forward-looking information contained in this Annual Report will in fact occur.
Item 1. Description of Business
ABOUT OUR BRAND DIGITAL CLARITY
Digital Clarity is the trading brand for Stylar Limited, a wholly owned subsidiary of Digital Brand Media & Marketing Group, Inc (DBMM), through its office in London, England. The Company is a multi-service digital marketing agency which specializes in creating effective strategies and campaigns for clients across a range of vertical markets, working in four key areas:
|
|
● |
SearchEngine Marketing – for search engines like Google, Yahoo etc. |
|
|
● |
WebDesign – building sites for web, mobile and tablet devices. |
|
|
● |
Analytics – measuring and analyzing web traffic to optimize performance. |
|
|
● |
SocialMedia – planning and measuring social metrics digitally in order to diagnose strategy. |
DBMM Group can leverage its team’s experience in digital media and provide leading strategy, deployment and measurement to its core markets in many industry sectors, from creative to traditional corporate. Entertainment, Fashion and Sports industries, as well as Automotive, eCommerce, and Investment Bankings proven markets.
The Company is rolling out the services of both the technology and marketing services offerings from its operating base in the UK with a plan to increase its presence into the larger markets in the US. namely Los Angeles and New York. The intent in fiscal year 2020 was to continue this strategy as cash infusion will immediately correlate to increased revenues. Growth is clearly a function of available capital. Fiscal year 2020 reflected the Company's continued progress by being awarded contracts for a number of new clients, in the mist of a very challenging year because of external factors beyond the Company’s control, specifically the pandemic and the SEC Matter awaiting the Commission’s final affirmation of the dismissal. The contract model strategy results in a full digital technology and marketing consultancy from design following an analysis of the client's analytics, then executing and stewarding the evolution of the model. The Company's mantra is "ROI is our DNA," the underlying focus for business development.
Employees
As of August 31, 2020, the Company had seven full-time employees.
Competition
There is strong competition in the digital marketing arena, though with the right level of investment and marketing, Digital Clarity has a confident outlook in using its experience to win new business in both local and international markets. DBMM has significant business relationships in place because it has a differentiating model.
Smaller reporting companies are not required to provide the information required by this item.
ITEM 1B. UNRESOLVED STAFF COMMENTS
None.
ITEM 2. DESCRIPTION OF PROPERTY
DBMM's Corporate address is 845 Third Avenue, 6th Floor, New York, NY 10022. The operating headquarters is located in the UK as Stylar Ltd., trading as Digital Clarity. is on a month-to-month lease at $1,416, as it is evaluating larger quarters.
The U.S. Securities & Exchange Commission instituted an Administrative Proceeding, File No. 3-17990, on May 16, 2017 to revoke the Company's registration statement because of delinquent filings. A hearing was held on August 9, 2017 and the Initial Decision to revoke the registration was dated November 16, 2017. The order was subsequently remanded by order of the U.S. Supreme Court in December 2017. The Company responded to the Remand with evidence of mitigating circumstances under a Protective Order and filed all its delinquent filings: a Super 10-K for 2015-2016-2017 on May 31, 2018 and 10-Q's for 2018 1Q, 2Q on June 22, 2018 and 3Q on July 15, 2018, its due date.
The Hearing for January 15, 2019 was re-scheduled because of government shutdown. Digital Brand entered a Motion to Dismiss the Proceedings on March 19, 2019 based on being current as of July 2018, and all filings to date have been filed on time for the 2019 fiscal year. The facts were presented at the hearing. The Division did not support the dismissal in a response to which Digital Brand filed two Amendments to the Consolidated 10-K for 2015-2016-2017 and the 10-K for 2018 on April 23 and 24, 2019 respectively, and Amendments No. 2 on October 1, 2019 to supersede language in Part II, Item 9A. On November 12, 2019, Carol Fox Foelak, Administrative Law Judge, Securities & Exchange Commission ordered an Initial Decision/Dismissal of the Proceeding. The Dismissal becomes effective under Rule 360 of the Commission's Rules of Practice, 17 C.F.R., Section 201.360, following the Commission’s Order of Finality. On December 3, 2019 The Division of Enforcement Submitted a Petition for Review of Judge Carol Fox Foelak’s Initial Decision dismissing the Administrative Proceedings rendered on November 12, 2019. The Company filed a Motion for summary affirmance of the Initial Decision on December 20, 2019. The Motion for Summary Affirmance was not opposed by Enforcement.
From time to time, the Company has become or may become involved in certain lawsuits and legal proceedings which arise in the ordinary course of business. The Company intends to vigorously defend its positions. However, litigation is subject to inherent uncertainties and an adverse result in those or other matters may arise from time to time that may harm its financial position, or our business and the outcome of these matters cannot be ultimately predicted.
ITEM 4. MINE SAFETY DISCLOSURES
N/A
PART II
ITEM 5. MARKET FOR COMMON EQUITY, RELATED STOCKHOLDER MATTERS AND ISSUER PURCHASES OF EQUITY SECURITIES
Market Information
Our common stock is currently listed for quotation on the OTC under the symbol “DBMM”.
Per Share Market Price Data
The following table sets forth, for the fiscal quarters indicated, the high and low closing bid prices per share for our common stock, as reported by on PinkSheets.com. Such quotations reflect inter-dealer prices, without retail markup, markdown or commission and may not represent actual transactions.
|
Year Ended August 31, 2020: |
High |
Low |
||||||
|
First Quarter |
$ | 0.007 | $ | 0.0002 | ||||
|
Second Quarter |
$ | 0.007 | $ | 0.0017 | ||||
|
Third Quarter |
$ | 0.0032 | $ | 0.0015 | ||||
|
Fourth Quarter |
$ | 0.0076 | $ | 0.0015 | ||||
|
Year Ended August 31, 2019: |
High |
Low |
||||||
|
First Quarter |
$ | 0.0014 | $ | 0.0005 | ||||
|
Second Quarter |
$ | 0.0001 | $ | 0.0001 | ||||
|
Third Quarter |
$ | 0.0012 | $ | 0.0002 | ||||
|
Fourth Quarter |
$ | 0.0008 | $ | 0.0002 | ||||
The last reported sale price of the common stock on the OTC Electronic Bulletin Board on August 31, 2020 and August 31, 2019 were $0.0076 and $0.0006 per share respectively. As of August 31, 2020, and August 31, 2019, there were 120 holders of record of our common stock respectively.
Dividends
We have never declared any cash dividends with respect to our common stock. Future payment of dividends is within the discretion of our board of directors and will depend on our earnings, capital requirements, financial condition and other relevant factors. Although there are no material restrictions limiting, or that are likely to limit our ability to pay dividends on our common stock, we presently intend to retain future earnings, if any, for use in our business and have no present intention to pay cash dividends on our common stock.
ITEM 6. SELECTED FINANCIAL DATA
As a “smaller reporting company”, as defined by Rule 10(f)(1) of Regulation S-K, the Company is not required to provide this information.
ITEM 7. MANAGEMENT’S DISCUSSION AND ANALYSIS OF FINANCIAL CONDITION AND RESULTS OF OPERATIONS
Readers are cautioned that certain statements contained herein are forward-looking statements and should be read in conjunction with our disclosures under the heading "Forward-Looking Statements" above. These statements are based on current expectations and assumptions that are subject to risks and uncertainties. This discussion also should be read in conjunction with the notes to our consolidated financial statements contained in Item 8. "Financial Statements and Supplementary Data" of this Report.
Operations Overview/Outlook
The Company developed a document called the Creds Deck which provides a description to prospective clients of Digital Clarity’s value proposition http://www.dbmmgroup.com/wp-content/uploads/2020/11/Digital-Clarity-Creds-Deck_DB64F.pdf.
Coronavirus lockdown has halted many business processes starting from manufacturing, supply chain to logistics, and marketing. Digital Clarity is no exception, and the negative impact is measurable.
Some businesses have closed or paused their digital marketing activities temporarily, because of this uncertainty. That mindset results in drastically decreased online traffic, sales, engagement, conversation, and pushed down search ranking.
Digital marketing is not a quick-fix solution to gain momentum. Therefore, it does not give companies visibility overnight. Many companies using digital marketing techniques such as search engine optimization (SEO) or social media marketing, are already aware that implementations take three to four months’ time to achieve positive results. Our company mantra remains, “ROI is our DNA.”
This means that although there has been a slowdown in existing business and new business development has also slowed considerably there is a need for reinforcement of the digital values proposition to bring or maintain a company’s brand front and center.
Operationally, fiscal year 2020 has been important in continuing the direction of the Company and steering it toward a scaled growth plan which has been in neutral while the Company addressed certain external challenges beyond its control. This has also been impacted by the worldwide pandemic of Covid-19. Nevertheless, The Company continued to focus on the positive, proven operating model and used that model to a certain maintain of existing clients and through its digital infrastructure, is perfectly placed to expand geographic reach to new clients in 2021.
Through a turbulent 2020 to date, DBMM continues to build on its strengths. Like the rest of the world, the effect of Covid-19 and the Pandemic that still persists are a paramount concern, the Company has strong relationships within the market will continue to extend its business focus to a wide variety of industry verticals.
The heart of the business is its marketing consultancy. DBMM Group’s main business Digital Clarity works in the area of Digital Marketing. Understanding each client and developing the model to individualize the outlook has been essential and is differentiating and is its competitive advantage. This kind of close relationship with its clients resulted in Digital Clarity being considered a close professional and trusted advisor.
Why Digital Experts are in demand
The world is changing, and technology is taking the lead. Today, everything is going digital -- entertainment, health, real estate, banking and even currencies. This is, however, understandable. In North America alone, 95% of the population are online (statista).
With everything turning to digital, it means companies are also jumping online to market their businesses. And to survive the challenges of digital marketing, brands need to keep up with the latest trends. Successfully reaching one’s target audience is no longer just putting out TV and print ads. These days, social media is the new arena of digital marketers, with Statista claiming 4.6 billion people are active social media users as of October 2020.
To keep up with the ever-changing scene, digital marketing experts need to stay in step with the evolving tech trends. Social media marketing companies like ours work tirelessly to research consumers and what makes them engage with brands. We try to find the best online solutions that will cater to our clients’ end-users’ queries in the easiest and most cost-efficient way possible -- be it by developing new technology or adapting to trends.
Relentless Digital Growth Positions Digital Clarity as a Leader
The need for seasoned expertise and insight is in huge demand. Digital Clarity’s strength, heritage and reach in the digital marketing puts the DBMM brand in an excellent position for investment and growth. Digital Clarity’s strength in Search Engine Marketing, Analytics and Social Media means that the Company is ready to feed on that demand and leapfrog into a powerful revenue focused vehicle.
Shoppers STILL Use a Mix of Digital Touchpoints DURING COVID-19 along the Buying Journey
|
● |
In the discovery and evaluation part of the journey, search engines, social media feeds, and influencers are popular ways for shoppers to get product inspiration outside a brand’s properties. |
|
● |
In the buying part of the journey, there are new types of purchase points emerge. Mobile wallets are behind e-mail as a place to make purchases. And 14% of shoppers are making purchases through social media |
Customers Still Face Silos Across Channels – THE DIGITAL LANDCAPE THROUGH THE PANDEMIC
|
● |
Customers are accessing multiple touchpoints during a purchase but there is a significant disconnect within companies. |
|
● |
75% of consumers expect consistent interactions across all departments. |
|
● |
However, 58% say that they feel like they’re communicating with separate departments and not one company. |
|
● |
And when it comes to service issues, 70% of customers expect all of the reps to have the same information about them, but 64% say that they have to re-explain issues. |
Digital Sales Are Becoming More Active Than Holiday Period
|
● |
In today’s environment, unified channels and customer service are more important than ever, as non-essential businesses closed their doors to help slow the spread of Covid-19. This meant that retailers and shoppers alike had to pivot overnight to a digital-only reality. |
|
● |
Digital sales growth by 18% in Q1 2020 compared to Q1 2019 |
|
● |
We see traffic growth by 13% in Q1 2020 compared to Q1 2019. - Desktop and Social Surge in Traffic - In addition to the rise in digital commerce and traffic, there are two more unusual trends. |
|
● |
The first relates to desktop traffic. In Q1 2019, desktop traffic declined by 9%, but grew by 9% in Q1 2020. With people stuck inside and not on the move, there’s a pronounced switch to desktop traffic and purchases. |
|
● |
Another trend is that traffic from social media has grown quickly. In Q1 2019, the share of traffic coming from social media was 6%. This jumped to 8% for Q1 2020. |
Verticals Experience Different Order Growth - the surge in digital commerce is not evenly distributed
|
● |
Home related goods clearly saw astonishing growth, up 70% in Q1 2020. |
|
● |
Learning and active apparel experienced growth over 35% in digital orders in Q1 2020. |
|
● |
However, luxury and general apparel only grew around 10% in Q1 2020, which is lower than their Q1 2019 performances. |
Areas that Digital Clarity excel are areas that need to be considered today
|
● |
Market from Home - Deploy campaigns quickly from home, collaborate across teams and keep marketers engaged with apps |
|
● |
Engage Customers with Empathy - Listening to customers, use real-time data to better understand their current situation and needs |
|
● |
Personalize Digital Communications - Accelerate digital channel adoptions, deliver the right message, to the right person, at the right time |
|
● |
Optimize Budget Spends – Digital Clarity unify marketing performance and make real-time decisions to minimize the negative impact |
Sources From: Deloitte Digital and Salesforce 2020
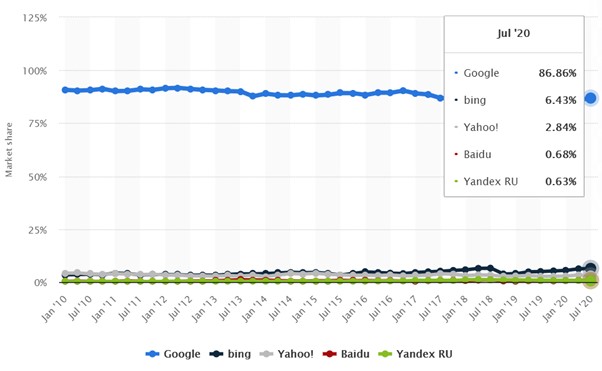
Among, its range of services, Digital Clarity help companies ‘get found’ on search engines like Google. The Market Share chart from Statista, we can see that Google has the lion’s share of the search market worldwide. As a Google Premier Partner, Digital Clarity are well placed to advise, consult and grow companies, in 2021 and beyond.
From Google’s parent Alphabet’s latest results, In the third quarter of 2020, Google's revenue amounted to 46.02 billion U.S. dollars, up from 37.99 billion U.S. dollars in the preceding quarter. Google's main revenue source is advertising through Google sites and its network.
How machine learning is enhancing digital marketing strategy
Digital Clarity applies strategy to algorithmic based machine learning tools. The launch of Google’s new machine learning tool, RankBrain which contributes to search engine results, left many people wondering what impact machine learning would have in the realm of Search Engine Optimization (SEO).
With the tech industry going crazy for all things Artificial Intelligence (AI), Natural Language Processing (NLP), machine learning, and chatbots – companies like Digital Clarity help brands make sense of this ever-changing landscape.
Machine learning and Digital Marketing
Because machine learning is being used to solve a huge set of diverse problems with the help of data, channels, content, and context, as marketers, Digital Clarity stands to benefit from this information and phenomenon as a whole. But, as the information we gather grows, digital marketing as we know it is set to change. Digital Clarity will be at the forefront of this change.
Search Engine Optimization
From an SEO point of view, keywords could become less important. Search engines receive more revenue for ads when they provide users with higher quality content. As a result, the algorithm they use needs to be more focused on providing each user with content that will serve a specific purpose, rather than be packed with the right keyword density. Therefore, the need to start thinking about the quality of your content as a ranking factor on search engines. This is where Digital Clarity come and help shape content ‘in the right way’ to help it get found.
Pay Per Click (PPC) Campaigns
With Google launching new “smart” features such as Google Smart Bidding, Smart Display Campaigns, and In-Market Audience to help businesses maximize conversions, it is clear that the future of PPC lies in machine learning.
To become more strategic and take PPC campaigns to the next level for its clients, Digital Clarity:
|
● |
Get to grips with the metrics that are most valuable to your business |
|
● |
Understand obstacles that could get in the way of meeting your goals |
|
● |
Know the underlying performance drivers to make more strategic decisions |
Search - overall
Search makes up half (52%) of this, increasing on par at 15% to £3.3bn, next is non-video display at £1.33bn (+9%), then video display £967m (40%). Classifieds remains at £726m and other remained at £41m.
Digital Clarity embrace Google’s Machine Learning marketing suite
Machine learning and AI have grown at a rapid pace and are an integral part of day to day search advertising management and planning. Though machine learning has been an integral part of the ad world, what has been more significant has been the addition of Artificial Intelligence or AI. According to a recent report in The Harvard Business Review by Deloitte, AI in Digital Marketing is not just getting bigger, it’s getting far more persuasive
MIT researchers recently unveiled a chip that can perform inference using neural network computations three to seven times faster than previous chips, and with up to 95 percent less power consumption. Dozens of companies working on new generations of AI chips—for use both in and outside of data centers—are attracting significant investment. These companies raised more than $1.5 billion in funding last year, nearly twice the amount they raised the year before.
According to Gartner, 80% of emerging technologies will have AI foundations by 2021 and beyond.
Digital Clarity perfectly positioned for the future
According to Gartner's Digital Business Acceleration report: Where to Focus Now, Enterprises have the intention of becoming more digital due to COVID-19.
Content Marketing
Although still extremely important, the internet has become inundated with too much content. There is consensus among companies that in order to succeed, brands need to be creating content that is valuable to readers. To do this, you need to understand consumer trends, data and engagement. Machine learning tools alongside Digital Clarity’s strategic approach allows its clients to reduce the amount of time spent tracking data, as well as better decipher that data to create actionable tasks that will lead to success.
The Growth of Digital Marketing & Consultancy Services
The skill set historically owned by agencies offering disciplines such as UX, design, creativity, customer-centric data analytics and customer engagement is now being immersed with large consultancy businesses whose traditional bread and butter was Digital Transformation.
Accenture, Deloitte, IBM, KPMG, McKinsey and PricewaterhouseCoopers rank among the most aggressive players in acquiring and partnering with agencies such as Digital Clarity. They present not only an opportunity for Digital Clarity but also a prospective exit and investment opportunity.
Digital Clarity have continued to develop their Digital Consulting and Strategy Planning offering. The forward looking program is to be a recognized leader in this field and fulfill companies seeking Digital Transformation for their originations.
Digital Marketing Services
There is no denying that 2020 has proved challenging for Digital Marketing Services. When the pandemic hit in March, many companies’ long-term plans and strategies were thrown out the window, as everyone from the frontlines to the C-suite shifted into fire-fighting mode. Many worked around the clock by leveraging remote technology.
Most businesses, except for those engaged in essentials, have been at a standstill and enterprises are cutting back on costs. The axe falls on marketing. The virus has brought most scheduled digital marketing plans to a grinding halt or slowed them down. The impact is felt in digital marketing, with predicted patterns now appearing skewed.
During the main part of the lock-down., Google announced $800 million in funding and grants for businesses advertisers. It has on offer $ 340 million in credits for active advertisers. The clear opportunity is at the foundation of the Company, namely the need to expedite and continue to encourage development in the digital marketing services sector. The marketing services product is labour intensive and thus the Company must jumpstart the growth by significant capital to grow simultaneously in multiple geographies.
The Company’s outlook remains robust for 2021 and the foreseeable future, particularly as businesses adjust and redirect their retail business to online digital marketing in the COVID Post COVID world.
Key Milestones
2020 revenues decreased due to external circumstances out of the company’s control which placed enormous pressure on the operating business.
Despite these circumstances, the client base is expanding in base number and the size of client serviced. At any point in time, our clients represent a variety of industries. Many of these clients choose to operate under an NDA as our clients see DBMM as a competitive advantage. Under that disclaimer, we cannot share all clients’ names, but here are a few key clients representing diverse verticals, as follows:
|
1. |
Digital Clarity shortlisted for prestigious UK Search Awards in the hotly contested ‘Best Use of Search’ along with client Bentley SYNCHRO, a global construction project management software company that supports the professional needs of those responsible for creating and managing the world’s infrastructure. |
|
2. |
Synergy SKY, a Norwegian based company that develops and markets software platforms to manage all meetings and video conferences, announce online marketing partnership with Digital Clarity. |
|
3. |
Digital Clarity release SEO Guides for business during Covid-19 Pandemic. The company has a long history with Google search both paid and organic, with these guides specifically focusing on three core areas: |
|
● |
The Importance of a Strong Internal Linking Strategy |
|
● |
How to Get to the Top of Google |
|
● |
How Much Does SEO Cost? |
|
4. |
The Luxury Property Show partners with Digital Clarity. The Luxury Property Show at Olympia London and is the only event in Europe dedicated to luxury and high-value property aimed at High net Worth Individuals. |
|
5. |
Ad World Masters, a worldwide ranking of agencies based on state-of-the-art scoring algorithms, has named its top agencies for 2019 – worldwide. Digital Clarity has won a Silver award for the United Kingdom. Ad World Masters Agency of the Year highlights the best agencies around the world, based on its underlying technology and unique data. |
Other examples are representative of the diversity of client base. DBMM's approach using a client's analytics and executing an individualized model to increase ROI as the prime objective, spans a wide range of industries.
Digital Clarity’s services are in demand and the company is pursuing opportunities in Formula 1, Aviation and high-end marketing for Luxury Brands.
Core industry verticals for Digital Clarity include: Managed Service Providers, Unified Communication Companies and discretionary advice for professional service providers.
SEARCH REMAINS KEY IN UK AS GROWTH CONTINUES INTO 2020 AND BEYOND
Total UK digital ad spend was up 13% year on year in the first six months of 2019, according to IAB UK’s half year Adspend update.
Conducted with PwC, the analysis shows that Display (video) and Search were the biggest drivers of growth between January and June 2019 – up 27% and 13% respectively.
Search now accounts for £3.7 billion of total H1 digital ad spend, while combined Display (video and non-video) is worth £2.8 billion, a 17% annual uplift. Non-video remains the largest Display format (up 8% YoY to £1.45 billion), but video formats are growing fast (up 27% to £1.32 billion).
THE NEED FOR PROFESSIONAL CONSULTANCY & OPPORTUNITY FOR MASSIVE GROWTH
Four consultancies lead Ad Age's ranking of the 10 largest agency companies in the world. With combined revenue of $13.2 billion, the marketing services units of Accenture, PwC, IBM and Deloitte sit just below WPP, Omnicom, Publicis Groupe, Interpublic and Dentsu. Last year, only two consultancies—Accenture Interactive and IBM iX—made the top 10. IBM iX was the first to break into the top 10.
Given the experience of the team, Digital Clarity’s advisory and consultancy is in demand. With the recent growth in these business areas, and the rise of consultancies, it is confirmation that Digital Clarity is headed in the right direction for growth.
THE GROWTH OF DIGITAL TRANSFORMATION WORLDWIDE
The global digital transformation market size was valued at USD 284.38 billion in 2019 and is expected to expand at a compound annual growth rate (CAGR) of 22.5% from 2020 to 2027. Digital Clarity have over 2020, developed a consulting process to take advantage of the demand by corporations to digital transform their organization for 2021 and beyond.
Growing demand for the adoption of the Internet of Things (IoT) across industries is promoting the introduction of connected and data-rich solutions. These solutions are capable of embedding intelligence into business operations to facilitate better and more effective customer engagements. Growing usage of smartphones, mobile devices, and applications is promoting digitization.
Digital transformation supports organizations in mitigating risks and handling disruption such as marketplace fluctuation, corporate restructuring, and geopolitical environment that are unanticipated, and can lead to unpredictable results.
The importance of Strategic Consultancy in 2021 and beyond
Digital Clarity is dedicated to helping its clients align their business objectives and utilise digital marketing to acquire and retain customers.
The company's marketing consultancy process is centred around a brands business objective. The approach is consultative and leverage's years of expertise within the digital marketplace and across a wide range of industry sectors.
Alongside helping companies understand their ‘why’, the company also helps shape a robust and measured strategy to achieve business objectives.
Over the years, Digital Clarity has identified that all too often clients are unclear why, how and where to invest their budgets to get the best return. In response, the company has developed a Strategic Consultancy service helps prioritise investment and resources to achieve the given goals.
Digital Clarity has created a unique Diagnosis Workshop that helps brands identify needs as well as assess the opportunity available. The core focus is to help reduce wastage and increase results.
Areas of focus include:
|
● |
Cost analysis |
|
● |
Audit current channels |
|
● |
Digital strategy planning |
|
● |
ROI projection planning |
|
● |
Digital consulting & training |
GLOBAL AD SPEND CONTINUES
Competitive landscape
Digital advertising is the fastest-growing segment of the global market for advertising spending. The increasing use of smartphones and the availability of cheap internet services are the two major factors propelling the growth prospects for this market. More than 30% of the companies are planning to spend around 75% of their advertising expenditures on digital marketing within the next five years.
“U. S. Marketers are expected to spend $110.1 billion on digital ads this year, or 51% of the $214.6 billion total U.S. advertising spending forecast, excluding political ads. Newspapers, radio, magazines, and local television now account for just 21% of the U.S. ad market.” From The Wall Street Journal
DIGITAL CLARITY HAS A COMPETITIVE ADVANTAGE
Digital Clarity operate in a highly commoditized market but have over the years build a stellar reputation that makes it different from its competitors. Some of these areas include:
|
1. |
Our DNA is Strategically Driven |
We believe the path to successful customer acquisition lies in understanding a client’s business – not just running a campaign. We seek to help clients understand that success has to be objective and measurable.
|
2. |
We are Business Led |
Digital marketing is not a cost but an asset. Not a line in a spreadsheet but an emotive force that if done right, will bring real business change and growth.
|
3. |
We are Digital Thinkers |
Marketing has to be at the heart of the business. Delivering real innovation in digital marketing requires not just knowledge but authority and bravery. We think digital. We drive results.
|
4. |
Our goal is to deliver Digital Performance |
We help our clients to understand their goals and objectives, using digital marketing to drive new business opportunities and retain their current customers.
In April 2020, HIS Markit, research firm, reported: “Each dollar that companies spent on advertising in the United States last year, led to $9 in sales.
THE GROWTH OF SOCIAL MEDIA E-COMMERCE
Enabling consumers to finalize a purchase while remaining within social apps has been a goal for social platforms for some time now. Social commerce is seen to have the potential to be a major revenue generator and an important way to diversify revenue streams beyond advertising. Across Asia, networks like WeChat and Line have successfully facilitated commerce via their platforms, allowing consumers to carry out a range of commerce activities from booking taxis to paying for restaurant bills or items in-store.
But social commerce has been a tough sell in many Western markets. Online consumer habits here can be difficult to change, especially when it comes to the potentially sensitive information involved in financial transactions. Social media can play a big role in the purchase journey right up to the point of purchase, but the appetite to complete a final purchase within the platform remains low. Most will move to retail sites. These benefits must be intrinsically social or deeply embedded with payment systems, and must be grounded in consumer-engagement strategies, in order for social commerce to achieve the roaring success seen in APAC.
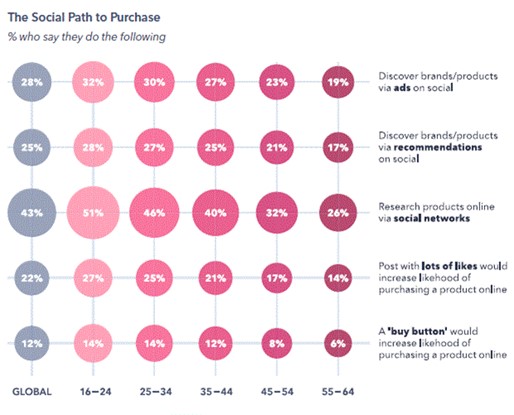
The prospect of using “buy” buttons on social media in the U.S. has not quite gained traction. The growing role of social networks as a way of researching products does, however, provide social video with a strong value-proposition in The Social Path to Purchase % who say they do the following furthering the social commerce agenda in this market. In the U.S.
The expectation is that US ecommerce sales will surge 35.8% to $190.47 billion, offsetting brick and mortar declines in 2020 holiday season.
Source: emarketer.com
WORLDWIDE E-COMMERCE GROWTH OPPORTUNITIES
Retail e-commerce sales worldwide continue to grow exponentially year on year and projected to grow to $4.5 trillion by 2021. Online shopping is one of the most popular online activities worldwide, Goldman Sachs expects on-line shopping retail sales in China to grow to $1.7 trillion by 2020. Usage varies by region.
Global Retail Ecommerce Sales Will Reach $4.5 Trillion by 2021
Cumulative data from Statista anticipates a 246.15% increase in worldwide ecommerce sales, from $1.3 trillion in 2014 to $4.5 trillion in 2021. That’s a nearly threefold lift in online revenue
Global eCommerce retail sales to hit $4.9 trillion by 2021
New studies projected that the worldwide retail eCommerce sales will reach a new high by 2021. Ecommerce businesses should anticipate a 265% growth rate, from $1.3 trillion in 2014 to $4.9 trillion in 2021. This shows a future of steady upward trend with no signs of decline

But, what’s even more significant is that global eCommerce sales have been steadily eroding the worldwide retail market. In fact, by 2021, it will account for 17.5% of the total global retail sales.
Omnichannel shopping will become more prevalent
As the lines blur between the physical and digital environment, multiple channels will become more prevalent in customers’ path to purchase. This is evidenced by 73% of customers using multiple channels during their shopping journey. What it means for eCommerce is to understand how their customers buy, which marketing channels do they engage with, and their motivations and main drivers to purchase. In the simplest sense, omnichannel shopping means decoding what, where, when, why, and how people are purchasing the products you sell on a particular channel.

Every single touchpoint is important because it puts every single piece of the puzzle into a whole story. Knowing your customers’ touch points before they purchase will better inform your brand of how to promote your products and allocate your marketing budget. More and more people are doing their shopping on social media platforms. With the improvement of social media’s selling capabilities, social media platforms are more than just advertising channels. People can now conveniently and quickly purchase products on their chosen social media platform.
B2B eCommerce is a bigger giant
B2B (business-to-business) eCommerce is the online selling and marketing of products from one business to another. And when compared to the B2C (business-to-consumer) eCommerce industry, B2B eCommerce is projected to be two times higher than B2C by 2020.
In the US alone, B2B eCommerce sales will hit 1.184 trillion dollars by 2021.
The predominance of B2B ecommerce means that B2B businesses must improve and simplify their shopping journey, channeling the B2C ordering experience. The B2B shopping experience is a lot more complicated than that of a B2C buyer.
Because of the nature of the transaction, B2B buyers usually need to go through various steps, including sales representative interaction, negotiations, and approvals before they can make a successful purchase. In short, B2B eCommerce businesses must adapt to a more seamless transaction building advanced functionality quote management, price negotiation, easy ordering, order and inventory management for the B2B market.
According to Forbes Magazine in 2020 the largest ecommerce markets are:
|
1 |
China: |
$672 billion |
|
2 |
United States: |
$340 billion |
|
3 |
United Kingdom: |
$99 billion |
|
4 |
Japan: |
$79 billion |
|
5 |
Germany: |
$73 billion |
|
6 |
France: |
$43 billion |
|
7 |
South Korea: |
$37 billion |
|
8 |
Canada: |
$30 billion |
|
9 |
Russia |
$20 billion |
|
10 |
Brazil |
$19 billion |
GROWTH IN INVESTOR AWARENESS AND OUTREACH.
During 2021, Digital Brand Media & Marketing Group, Inc. will initiate a significant effort to raise positive awareness of DBMM's growth potential on a global basis. The Company had to defer its 2020 plans until certain SEC Matters regarding the delinquent filings brought current in July 2018, remain open. The global pandemic made it impossible to initiate any Investor Awareness Programme.
Hopefully in 2021 the strategic outreach will be directed at investors around the world who understand the digital marketplace and its expanding influence on consumer decisions. DBMM will target new investors through a global digital and traditional integrated investor outreach campaign which will be run by Digital Clarity, with third parties, as required, for distribution. In all areas, the Company will act in the interests of all stakeholders.
In the full industry context of dramatic expansion of digital footprints, there has been no direct correlation between DBMM's revenues and its share price. Economic and industry analysts have opined that the industry multiple continues to grow to, in some cases, 25-30 times revenues. DBMM will expand its client and geographic scale, thus increasing revenues. There were matters outside of DBMM's control which caused growth to be in neutral, and in 2020 the pandemic threw all planning into disarray. With capital infusion, 2021 will follow the model of a growing client base and geographic reach until it achieves a TBD level of profitability. This benchmark will replicate successful industry models in digital technology and marketing.
FINANCIAL OVERVIEW/OUTLOOK
DBMM has been honing its commercial model since the acquisition of Digital Clarity (“DC”) in 2011 which has been cash-flow positive as an operating company since its acquisition. External events outside of DBMM's control has precluded the growth expected to this point, however, its margins will continue to be strong on an annual basis, and once the business reaches appropriate scale with assumed profitability and cross-over point, DBMM trajectory suggests a resultant very successful business for all of its stakeholders.
The growth trajectory anticipated is expected during 2020. Once that occurs, the clients benefit immediately due to a wider range of resources; the shareholders will benefit as the market cap grows. The media market multiple far exceeds the “old” manufacturing multiples, as digital technology and marketing has become one of the fastest growing industries in the world today.
DBMM's place in the sector is strong. The industry environment continues to grow exponentially and the future of digital marketing as an essential strategy for any consumer-facing business has been proven over-and-over as certain retail businesses are forced to close their doors for lack of or an ineffective digital presence. DBMM's brand, Digital Clarity, increases its valuation with client case studies and industry awards resulting in its being considered a leader in the sector for its size. DBMM's increasing client base, coupled with decreasing certain kind of debt and expenses, positions the Company to attract mezzanine financing, something sought after by many and achieved by few.
Coincidently, 2020 results have slowed down temporarily due to Brexit unease in the UK and clients concern about trade issues with or without the European Union. So in the midst of the uncertainty caused by the Brexit slowdown, the COVID -19 global outbreak has caused further slowdown as clients paused and business development much different during an initial lockdown , then lifted only to be reinstated on November 5, 2020. That only made the uncertainty further exacerbated, while clients need to extend or double down on their digital footprint as the industry has become essential during the pandemic. Nevertheless, Digital Clarity is revising its model to adjust to changing circumstances, when client revenues are paused or delayed.
The Company received a commitment for future working capital in order to grow the Company in key markets, with the intent to move to DBMM profitability following a return to normal trading. At that point, DBMM would not require future financing until it was ready to acquire 1-2 additional companies to complement and further develop the digital marketing business. Growth capital will increase as the client base re-balanced and expands in size and scope.
Going forward, there will be an emphasis on investor awareness as soon as the SEC dismissal has been affirmed by the full commission. DBMM has been current in its filings since July 2018 and is encouraged by the outlook after normal trading has recommenced. DBMM intends to make significant strides in aggressively widening its brand exposure using a variety of digital and social channels. There are investors around the globe who understand the digital marketplace and its increasing influence on consumer decisions. DBMM will be targeting these new investors in the public market through a global digital and traditional, integrated campaign which will be run by Digital Clarity, with third parties, as required for distribution.
The expectations for fiscal year 2021 remains to return to normal trading following affirmance of the dismissal by the full commission. The Company intends to move ahead thereafter to the scaled, growth plan in multiple geographies to benefit all stakeholders, being mindful of the impact of the global pandemic.
Fiscal Year 2020
We had approximately $34,000 in cash and our working capital deficiency amounted to approximately $5.1 million at August 31, 2020.
During the year ended August 31, 2020, we used cash in our operating activities amounting to approximately $276,000. Our cash used in operating activities was comprised of our net loss of approximately $656,000 adjusted primarily for the following:
Additionally, the following variations in operating assets and liabilities during the year ended August 31, 2020 impacted our cash used in operating activity:
Accounts payable, accrued expenses, accrued interest, and accrued compensation, of approximately $342,000, resulting from a short fall in liquidity and capital resources, offset by a non-recurring gain on extinguishment of debt.
During the year ended August 31, 2020, we generated cash from financing activities of $280,638 which primarily consists of the proceeds from demand notes payable of $347,728, offset by repayments and officer loans of $ 67,090.
Fiscal Year 2019
We had approximately $17,000 in cash and our working capital deficiency amounted to approximately $4.4 million at August 31, 2019.
During the year ended August 31, 2019, we used cash in our operating activities amounting to approximately $247,000. Our cash used in operating activities was comprised of our net loss of approximately $676,000 adjusted primarily for the following:
Change in fair value of derivative liability of $48,419.
Additionally, the following variations in operating assets and liabilities during the year ended August 31, 2019 impacted our cash used in operating activity:
In our accounts payable and accrued expenses, including accrued compensation, of approximately $334,000, resulting from a short fall in liquidity and capital resources.
During the year ended August 31, 2019, we generated cash from financing activities of $232,958 which primarily consists of the proceeds from demand notes payable of $231,424.
Going Concern
The accompanying consolidated financial statements have been prepared on a going concern basis. The financial statements do not reflect any adjustments that might result if The Company is unable to continue as a going concern.
The Company has outstanding loans and convertible notes payable aggregating $1.9 million at August 31, 2020 and doesn’t have sufficient cash on hand to satisfy such obligations. The preceding raise substantial doubt about the ability of the Company to continue as a going concern. However, during fiscal year 2020, loans of $282,342. were raised from the new loan arrangements. The Company also has a non-binding Commitment Letter from an investor of $250,000 which also includes a right of first refusal on additional capital raise up to $3 million which will contribute to satisfying such obligations and fund any potential cash flow deficiencies from operations for the foreseeable future.
Accordingly, the accompanying consolidated financial statements have been prepared in conformity with U.S. GAAP, which contemplates continuation of the Company as a going concern and the realization of assets and satisfaction of liabilities in the normal course of business. The carrying amounts of assets and liabilities presented in the financial statements do not necessarily purport to represent realizable or settlement values. The financial statements do not include any adjustment that might result from the outcome of this uncertainty.
RESULTS OF OPERATIONS
Comparison of Results for the Years Ended August 31, 2020, and August 31, 2019
|
Consolidated Operating Results |
||||||||||||||||
|
For the Years Ended August 31, |
||||||||||||||||
|
Increase/ |
Increase/ |
|||||||||||||||
|
(Decrease) |
(Decrease) |
|||||||||||||||
|
2020 |
2019 |
$ 2020 vs 2019 |
% 2020 vs 2019 |
|||||||||||||
|
SALES |
$ | 268,957 | $ | 415,662 | $ | (146,705 | ) | -35 | % | |||||||
|
COST OF SALES |
241,665 | 382,792 | (141,127 | ) | -37 | % | ||||||||||
|
GROSS PROFIT |
27,292 | 32,870 | (5,578 | ) | -17 | % | ||||||||||
|
COSTS AND EXPENSES |
||||||||||||||||
|
Sales, general and administrative |
434,164 | 516,942 | (82,778 | ) | -16 | % | ||||||||||
|
TOTAL OPERATING EXPENSES |
434,164 | 516,942 | (82,778 | ) | -16 | % | ||||||||||
|
OPERATING LOSS |
(406,872 | ) | (484,072 | ) | 77,200 | -16 | % | |||||||||
|
OTHER (INCOME) EXPENSE |
||||||||||||||||
|
Interest expense |
270,698 | 143,971 | 126,727 | 88 | % | |||||||||||
|
Other income |
(12,728 | ) | - | (12,728 | ) | NM | ||||||||||
|
Gain on extinguishment of debt |
(10,000 | ) | - | (10,000 | ) | NM | ||||||||||
|
Change in fair value of derivative liability |
944 | 48,419 | (47,475 | ) | -98 | % | ||||||||||
|
TOTAL OTHER EXPENSE |
248,914 | 192,390 | 56,524 | 29 | % | |||||||||||
|
NET LOSS |
$ | (655,786 | ) | $ | (676,462 | ) | $ | (20,676 | ) | -3 | % | |||||
NM: not meaningful
We currently generate revenue through our Pay-Per-Click Advertising, Search Engine Marketing, Search Engine Optimization Services, Web Design, Social Media, Digital analytics and Advisory Services.
For the year ended August 31, 2020 our primary sources of revenue are the Per-Click Advertising, Web Design, and Social Media. These primary sources amounted to 72.24%, 6.86% and 10.12% of our revenues during the year ended August 31, 2020.
Revenue is recognized upon transfer of control of promised or services to customers in an amount that reflects the consideration the Company expect to receive in exchange for those services. The Company enter into contracts that can include various combinations of services, which are generally capable of being distinct and accounted for as separate performance obligations. Revenue is recognized net of any taxes collected from customers, which are subsequently remitted to governmental authorities.
The decrease in our revenues during fiscal 2020, when compared to the prior year, is due to Brexit unease in the UK and clients concern about trade issues with or without the European Union, and the uncertainty associated with COVID-19 and its impact on Digital Clarity’s clients.
Cost of sales during fiscal 2020 decreased primarily from the receipt of an UK tax credit, and to a lesser extent, reduction in personal payroll.is correlated to our revenues for the respective period.
The decrease in general and administrative costs during fiscal 2020, when compared to the prior year, primarily as a result of decreased in professional fees and travel expenses due to COVID-19.
Interest expense, which include interest accrued on certain notes and loans, increased during fiscal 2020, due to an additional consideration to satisfy its obligations under certain unsecured loans payable when compared to the prior year.
Other income, which include a non-recurring COVID-19 grant from the UK Government to support small businesses during the fiscal 2020. Which did not occur in 2019
Gain on extinguishment of debt increased during fiscal 2020, when compared to the prior year. The increase is attributable to a non-recurring analysis of certain liabilities performed by the Company during such period which deemed them extinguished pursuant to statute of limitations.
The decrease on derivative liabilities is primarily attributable to an increase in the Company’s estimated volatility used in the assumptions to compute its fair value at August 31, 2019 when compared to prior year, while the main assumptions in computing the derivative liabilities did not vary significantly between fiscal 2020 and 2019.
ITEM 7A. QUANTITATIVE AND QUALITATIVE DISCLOSURES ABOUT MARKET RISK.
As a “smaller reporting company”, as defined by Rule 10(f)(1) of Regulation S-K, the Company is not required to provide this information.
ITEM 8. CONSOLIDATED FINANCIAL STATEMENTS
|
INDEX TO CONSOLIDATED FINANCIAL STATEMENTS |
|
|
|
Page |
|
|
|
|
F-1 |
|
|
|
|
|
F-2 |
|
|
|
|
|
F-3 |
|
|
|
|
|
F-4 |
|
|
|
|
|
F-5 |
|
|
|
|
|
Consolidated Statements of Cash Flows for the years ended August 31, 2020 and 2019 |
F-6 |
|
|
|
|
F-7 |
|

REPORT OF INDEPENDENT REGISTERED PUBLIC ACCOUNTING FIRM
To the Board of Directors and
Stockholders of Digital Brand Media & Marketing Group, Inc.
Opinion on the Financial Statements
We have audited the accompanying consolidated balance sheets of Digital Brand Media & Marketing Group, Inc. (the Company) as of August 31, 2020, and the related statements of operations and comprehensive loss, stockholders’ deficit, and cash flows for each of the years in the period ended August 31, 2020, and the related notes (collectively referred to as the financial statements). In our opinion, the financial statements present fairly, in all material respects, the financial position of the Company as of August 31, 2020, and the results of its operations and its cash flows for each of the years in the period ended August 31, 2020, in conformity with accounting principles generally accepted in the United States of America. The financial statements of Digital Brand Media & Marketing Group, Inc., as of August 31, 2019, were audited by other auditors whose report dated November 27, 2019, expressed an unqualified opinion on those financial statements.
Basis for Opinion
These financial statements are the responsibility of the Company’s management. Our responsibility is to express an opinion on the Company’s financial statements based on our audits. We are a public accounting firm registered with the Public Company Accounting Oversight Board (United States) (PCAOB) and are required to be independent with respect to the Company in accordance with the U.S. federal securities laws and the applicable rules and regulations of the Securities and Exchange Commission and the PCAOB.
We conducted our audits in accordance with the standards of the PCAOB. Those standards require that we plan and perform the audit to obtain reasonable assurance about whether the financial statements are free of material misstatement, whether due to error or fraud. The Company is not required to have, nor were we engaged to perform, an audit of its internal control over financial reporting. As part of our audits, we are required to obtain an understanding of internal control over financial reporting, but not for the purpose of expressing an opinion on the effectiveness of the Company’s internal control over financial reporting. Accordingly, we express no such opinion.
Our audits included performing procedures to assess the risks of material misstatement of the financial statements, whether due to error or fraud, and performing procedures that respond to those risks. Such procedures included examining, on a test basis, evidence regarding the amounts and disclosures in the financial statements. Our audits also included evaluating the accounting principles used and significant estimates made by management, as well as evaluating the overall presentation of the financial statements. We believe that our audits provide a reasonable basis for our opinion.
Going Concern
The accompanying financial statements have been prepared assuming that the Company will continue as a going concern. As discussed in Note 1 to the financial statements the Company has accumulated deficits and has a net capital deficiency. These factors raise substantial doubt about the Company’s ability to continue as a going concern. Management’s plans regarding those matters are discussed in Note 1. The financial statements do not include any adjustments that might result from the outcome of this uncertainty.
/s/ M&K CPAS, PLLC.
We have served as the Company’s auditor since 2020.
Houston, TX
December 15, 2020
REPORT OF INDEPENDENT REGISTERED PUBLIC ACCOUNTING FIRM
To the Board of Directors and Shareholders of
Digital Brand Media & Marketing Group, Inc. and Subsidiaries
Opinion on the Financial Statements
We have audited the accompanying consolidated balance sheet of Digital Brand Media & Marketing Group, Inc. and subsidiaries (the "Company") as of August 31, 2019, the related statement of operations and comprehensive loss, changes in stockholders’ deficit, and cash flows for the year then ended, and the related notes (collectively referred to as the "financial statements"). In our opinion, the financial statements present fairly, in all material respects, the financial position of the Company as of August 31, 2019 and the results of its operations and its cash flows for the year then ended, in conformity with accounting principles generally accepted in the United States of America.
The Company’s Ability to Continue as a Going Concern
The accompanying financial statements have been prepared assuming that the Company will continue as a going concern. As discussed in Note 1 to the financial statements, the Company has accumulated deficits and negative working capital. This raises substantial doubt about the Company’s ability to continue as a going concern. Management’s plans in regard to these matters are also described in Note 1. The financial statements do not include any adjustments that might result from the outcome of this uncertainty.
Basis for Opinion
These financial statements are the responsibility of the Company's management. Our responsibility is to express an opinion on the Company's financial statements based on our audits. We are a public accounting firm registered with the Public Company Accounting Oversight Board (United States) ("PCAOB") and are required to be independent with respect to the Company in accordance with the U.S. federal securities laws and the applicable rules and regulations of the Securities and Exchange Commission and the PCAOB.
We conducted our audit in accordance with the standards of the PCAOB. Those standards require that we plan and perform the audit to obtain reasonable assurance about whether the financial statements are free of material misstatement, whether due to error or fraud. The Company is not required to have, nor were we engaged to perform, an audit of its internal control over financial reporting in accordance with the standards of the PCAOB. As part of our audits we are required to obtain an understanding of internal control over financial reporting but not for the purpose of expressing an opinion on the effectiveness of the Company's internal control over financial reporting. Accordingly, we express no such opinion in accordance with the standards of the PCAOB.
Our audit included performing procedures to assess the risks of material misstatement of the financial statements, whether due to error or fraud, and performing procedures that respond to those risks. Such procedures included examining, on a test basis, evidence regarding the amounts and disclosures in the financial statements. Our audits also included evaluating the accounting principles used and significant estimates made by management, as well as evaluating the overall presentation of the financial statements. We believe that our audits provide a reasonable basis for our opinion.
/s/ Liggett & Webb P.A.
We have served as the Company’s auditor since 2017.
New York, NY
November 27, 2019
See Notes to Consolidated Financial Statements
See Notes to Consolidated Financial Statements
See Notes to Consolidated Financial Statements
See Notes to Consolidated Financial Statements
DIGITAL BRAND MEDIA & MARKETING GROUP, INC.
NOTES TO CONSOLIDATED FINANCIAL STATEMENTS
NOTE 1 – ORGANIZATION, BASIS OF PRESENTATION AND GOING CONCERN
Nature of Business and History of the Company
Digital Brand Media & Marketing Group, Inc. (“The Company”) is an OTC:PK listed company. The Company was organized under the laws of the State of Florida on September 29, 1998.
The Company strategically focuses on developing the business of its wholly owned and revenue generating online marketing services company, Digital Clarity. With deep DNA in its operating market, blending the services of an experienced professional workforce leveraging a technology offering positions the Company in a strong, forward looking structure. Digital Clarity operates in the growing area of digital marketing that helps companies make the most of the digital economy focusing on areas such as Search Engine Marketing (Google, Yahoo! & Bing), Social Media (Twitter, Facebook & LinkedIn) and Internet Strategy Planning including Design, Analytics and Mobile Marketing.
Following the acquisition of Digital Clarity in 2011 the Company has been honing its business model to be the differentiating service provider in digital marketing space to its clients and prospective business as DBMM grows into one of the leaders in the industry going forward.
Today, DBMM Group crafts, designs and executes digital marketing strategies across multiple ad platforms and social media networks for a broad array of clients to help each of them establish a uniform brand identity across the digital universe. The product offering is a unique value proposition of intelligent analytics provided by an experienced digital marketing and technology team. Therefore, DBMM Group is a blend of data, strategy and creative execution.
Going Concern
The accompanying consolidated financial statements have been prepared on a going concern basis. The financial statements do not reflect any adjustments that might result if the Company is unable to continue as a going concern.
The Company has outstanding loans and convertible notes payable aggregating $1.9 million at August 31, 2020 and doesn’t have sufficient cash on hand to satisfy such obligations. The preceding raise substantial doubt about the ability of the Company to continue as a going concern. However, the Company generated proceeds of $280,638 from financing activities during fiscal 2020. The Company also has a non-binding Commitment Letter from an investor of $250,000 which also includes a right of first refusal on additional capital raise up to $3 million which will contribute to satisfying such obligations and fund any potential cash flow deficiencies from operations for the foreseeable future.
Accordingly, the accompanying consolidated financial statements have been prepared in conformity with U.S. GAAP, which contemplates continuation of the Company as a going concern and the realization of assets and satisfaction of liabilities in the normal course of business. The carrying amounts of assets and liabilities presented in the financial statements do not necessarily purport to represent realizable or settlement values. The financial statements do not include any adjustment that might result from the outcome of this uncertainty.
NOTE 2 – SIGNIFICANT ACCOUNTING POLICIES
Basis of Consolidation
The consolidated financial statements include the accounts of the Company and its wholly owned subsidiary Stylar Ltd (DBA Digital Clarity). All significant inter-company transactions are eliminated.
Cash and Cash Equivalents
Cash and cash equivalents consist primarily of cash in banks. The Company considers cash equivalents to include all highly liquid investments with original maturities of three months or less to be cash equivalents. The Company had no cash equivalents as of August 31, 2020 or 2019.
Accounts Receivable and Allowance for Doubtful Accounts
Accounts receivable are recorded at the invoiced amount and do not bear interest. Accounts receivable are presented net of allowance for doubtful accounts.
The Company has a policy of reserving for uncollectible accounts based on its best estimate of the amount of probable credit losses in its existing accounts receivable. The Company periodically reviews its accounts receivable to determine whether an allowance is necessary based on an analysis of past due accounts and other factors that may indicate that the realization of an account may be in doubt. Account balances deemed to be uncollectible are charged to the bad debt expense after all means of collection have been exhausted and the potential for recovery is considered remote. At August 31, 2020 and 2019, the Company recognized $0 and $23,930, respectively, as the allowance for doubtful accounts.
Property and Equipment
Property and equipment are stated at cost, less accumulated depreciation. Depreciation is provided using the straight-line method over the estimated useful lives of the related assets (primarily three to five years).
Revenue Recognition
Revenue is recognized upon transfer of control of promised or services to customers in an amount that reflects the consideration the Company expect to receive in exchange for those services. The Company enter into contracts that can include various combinations of services, which are generally capable of being distinct and accounted for as separate performance obligations. Revenue is recognized net of any taxes collected from customers, which are subsequently remitted to governmental authorities.
Nature of Services
The Company generally provides its services to companies with international exposure, primarily located in Europe but with international exposure. The Company generally provides its services ratably over the terms of the contract and bills such services at a monthly fixed rate. Some of the services are billed quarterly. The Company’s services are sold without guarantees.
Significant Judgments
Our contracts with customers sometimes often include promises to provide multiple services to a customer. Determining whether services are considered distinct performance obligations that should be accounted for separately versus together may require significant judgment.
Judgment is required to determine Standalone Selling Price (SSP) for each distinct performance obligation. The Company uses a single amount to estimate SSP for items that are not sold separately, including set-up services, monthly search advertising services, and monthly optimization and management.
Contract Balances
Timing of revenue recognition may differ from the timing of invoicing to customers. The Company records a receivable when revenue is recognized prior to invoicing, or unearned revenue when revenue is recognized subsequent to invoicing.
The allowance for doubtful accounts reflects our best estimate of probable losses inherent in the accounts receivable balance. We determine the allowance based on known troubled accounts, historical experience, and other currently available evidence.
Advertising Costs
Advertising costs, which are included in cost of sales and general and administrative expenses in the accompanying statements of operations, are expensed when incurred. Total advertising expenses for fiscal years 2020 and 2019 amounted to $466 and $2,927, respectively.
Use of Estimates
The preparation of financial statements in conformity with accounting principles generally accepted in the United States of America requires management to make estimates and assumptions that affect the reported amounts of assets and liabilities, and disclosure of contingent assets and liabilities, at the date of the financial statements and the reported amounts of revenues and expenses during the reporting period. Included in these estimates are assumptions about the collection of its accounts receivable, converted amount of cash denominated in a foreign currency, and estimated amounts of cash, the derivative liability could settle, if not in common shares. Actual results could differ from those estimates.
Income Taxes
The Company follows the provisions of the ASC 740 -10 related to, Accounting for Uncertain Income Tax Positions. When tax returns are filed, it is highly certain that some positions taken would be sustained upon examination by the taxing authorities, while others are subject to uncertainty about the merits of the position taken or the amount of the position that would be ultimately sustained. In accordance with the guidance of ASC 740-10, the benefit of a tax position is recognized in the financial statements in the period during which, based on all available evidence, management believes it is more likely than not that the position will be sustained upon examination, including the resolution of appeals or litigation processes, if any. Tax positions taken are not offset or aggregated with other positions. Tax positions that meet the more-likely-than-not recognition threshold are measured as the largest amount of tax benefit that is more than 50 percent likely of being realized upon settlement with the applicable taxing authority. The portion of the benefits associated with tax positions taken that exceeds the amount measured as described above should be reflected as a liability for uncertain tax benefits in the accompanying balance sheet along with any associated interest and penalties that would be payable to the taxing authorities upon examination. The Company believes its tax positions are all highly certain of being upheld upon examination. As such, the Company has not recorded a liability for uncertain tax benefits.
The Company has adopted ASC 740-10-25 Definition of Settlement, which provides guidance on how an entity should determine whether a tax position is effectively settled for the purpose of recognizing previously unrecognized tax benefits and provides that a tax position can be effectively settled upon the completion of an examination by a taxing authority without being legally extinguished. For tax positions considered effectively settled, an entity would recognize the full amount of tax benefit, even if the tax position is not considered more likely than not to be sustained based solely on the basis of its technical merits and the statute of limitations remains open.
Earnings (loss) per common share
The Company utilizes the guidance per FASB Codification “ASC 260 "Earnings Per Share". Basic earnings per share is calculated on the weighted effect of all common shares issued and outstanding and is calculated by dividing net income available to common stockholders by the weighted average shares outstanding during the period. Diluted earnings per share, which is calculated by dividing net income available to common stockholders by the weighted average number of common shares used in the basic earnings per share calculation, plus the number of common shares that would be issued assuming conversion of all potentially dilutive securities outstanding, is not presented separately as it is anti- dilutive. Such securities have been excluded from the per share computations as of August 31, 2020 and 2019.
Derivative Liabilities
The Company assessed the classification of its derivative financial instruments as of August 31, 2020, which consist of convertible instruments and rights to shares of the Company’s common stock and determined that such derivatives meet the criteria for liability classification under ASC 815.
ASC 815 generally provides three criteria that, if met, require companies to bifurcate conversion options from their host instruments and account for them as free-standing derivative financial instruments. These three criteria include circumstances in which (a) the economic characteristics and risks of the embedded derivative instrument are not clearly and closely related to the economic characteristics and risks of the host contract, (b) the hybrid instrument that embodies both the embedded derivative instrument and the host contract is not re-measured at fair value under otherwise applicable generally accepted accounting principles with changes in fair value reported in earnings as they occur and (c) a separate instrument with the same terms as the embedded derivative instrument would be considered a derivative instrument subject to the requirements of ASC 815. ASC 815 also provides an exception to this rule when the host instrument is deemed to be conventional, as described.
During fiscal 2020 and 2019, the Company had notes payable outstanding in which the conversion rate was variable and undeterminable. Accordingly, the Company has recognized a derivative liability in connection with such instruments. The Company uses judgment in determining the fair value of derivative liabilities at the date of issuance at every balance sheet thereafter and in determining which valuation is most appropriate for the instrument (e.g., Binomial method), the expected volatility, the implied risk-free interest rate, as well as the expected dividend rate.
Fair Value of Financial Instruments
Effective January 1, 2008, the Company adopted FASB ASC 820-Fair Value Measurements and Disclosures, or ASC 820, for assets and liabilities measured at fair value on a recurring basis. ASC 820 establishes a common definition for fair value to be applied to existing generally accepted accounting principles that require the use of fair value measurements establishes a framework for measuring fair value and expands disclosure about such fair value measurements. The adoption of ASC 820 did not have an impact on the Company’s financial position or operating results but did expand certain disclosures.
ASC 820 defines fair value as the price that would be received to sell an asset or paid to transfer a liability in an orderly transaction between market participants at the measurement date. Additionally, ASC 820 requires the use of valuation techniques that maximize the use of observable inputs and minimize the use of unobservable inputs. These inputs are prioritized below.
|
Level 1 |
Observable inputs such as quoted market prices in active markets for identical assets or liabilities. |
|
Level 2 |
Observable market-based inputs or unobservable inputs that are corroborated by market data. |
|
Level 3 |
Unobservable inputs for which there is little or no market data, which require the use of the reporting entity’s own assumptions. |
The Company did not have any Level 2 or Level 3 assets or liabilities as of August 31, 2020, and 2019, with the exception of its derivative liability which are valued based on Level 3 inputs.
Cash is considered to be highly liquid and easily tradable as of August 31, 2020 and 2019 and therefore classified as Level 1 within our fair value hierarchy.
In addition, FASB ASC 825-10-25 Fair Value Option, or ASC 825-10-25, was effective January 1, 2008. ASC 825-10-25 expands opportunities to use fair value measurements in financial reporting and permits entities to choose to measure many financial instruments and certain other items at fair value. The Company did not elect the fair value options for any of its qualifying financial instruments.
Convertible Instruments
The Company evaluates and accounts for conversion options embedded in its convertible instruments in accordance with professional standards for “Accounting for Derivative Instruments and Hedging Activities”.
Professional standards generally provide three criteria that, if met, require companies to bifurcate conversion options from their host instruments and account for them as free-standing derivative financial instruments. These three criteria include circumstances in which (a) the economic characteristics and risks of the embedded derivative instrument are not clearly and closely related to the economic characteristics and risks of the host contract, (b) the hybrid instrument that embodies both the embedded derivative instrument and the host contract is not re-measured at fair value under otherwise applicable generally accepted accounting principles with changes in fair value reported in earnings as they occur and (c) a separate instrument with the same terms as the embedded derivative instrument would be considered a derivative instrument. Professional standards also provide an exception to this rule when the host instrument is deemed to be conventional as defined under professional standards as “The Meaning of “Conventional Convertible Debt Instrument”.
The Company accounts for convertible instruments (when it has determined that the embedded conversion options should not be bifurcated from their host instruments) in accordance with professional standards when “Accounting for Convertible Securities with Beneficial Conversion Features,” as those professional standards pertain to “Certain Convertible Instruments.” Accordingly, the Company records, when necessary, discounts to convertible notes for the intrinsic value of conversion options embedded in debt instruments based upon the differences between the fair value of the underlying common stock at the commitment date of the note transaction and the effective conversion price embedded in the note. Debt discounts under these arrangements are amortized over the term of the related debt to their earliest date of redemption. The Company also records when necessary deemed dividends for the intrinsic value of conversion options embedded in preferred shares based upon the differences between the fair value of the underlying common stock at the commitment date of the note transaction and the effective conversion price embedded in the note.
ASC 815-40 provides that, among other things, generally, if an event is not within the entity’s control could or require net cash settlement, then the contract shall be classified as an asset or a liability.
Stock Based Compensation
We account for the grant of stock options and restricted stock awards in accordance with ASC 718, “Compensation-Stock Compensation.” ASC 718 requires companies to recognize in the statement of operations the grant-date fair value of stock options and other equity-based compensation.
Reclassification
Certain amounts in the prior period financial statements have been reclassified to conform to the presentation of the current period financial statements) common stock and additional paid-in capital). This reclassification has no effect on the reported results of operations.
Foreign Currency Translation
Assets and liabilities of subsidiaries operating in foreign countries are translated into U.S. dollars using either the exchange rate in effect at the balance sheet date or historical rate, as applicable. Results of operations are translated using the average exchange rates prevailing throughout the year. The effects of exchange rate fluctuations on translating foreign currency assets and liabilities into U.S. dollars are included in a separate component of stockholders’ equity (accumulated other comprehensive loss), while gains and losses resulting from foreign currency transactions are included in operations.
Business Combinations
In accordance with Accounting Standards Codification 805, "Business Combinations" ("ASC 805") the Company records acquisitions under the purchase method of accounting, under which the acquisition purchase price is allocated to the assets acquired and liabilities assumed based upon their respective fair values. The Company utilizes management estimates and, in some instances, may require an independent third-party valuation firm to assist in determining the fair values of assets acquired, liabilities assumed, and contingent consideration granted. Such estimates and valuations require us to make significant assumptions, including projections of future events and operating performance.
Customer Concentration
Three of the Company's customers accounted for approximately 92% and 88% of its revenues during fiscal 2020 and 2019, respectively.
Recently Issued Accounting Pronouncements
Management does not believe that any other recently issued, but not yet effective, accounting standards if currently adopted would have a material effect on the accompanying consolidated financial statements.
NOTE 3 – PROPERTY AND EQUIPMENT
Property and equipment consisted of the following:
|
Estimated Life |
2020 |
2019 |
|||||||
|
Computer and office equipment |
3 to 5 years |
$ | 23,920 | $ | 23,399 | ||||
|
Less: Accumulated depreciation |
(21,942 |
) |
(21,897 |
) |
|||||
| $ | 1,978 | $ | 1,502 | ||||||
Depreciation expense amounted to $45 and $1,583, for the years ended August 31, 2020 and 2019, respectively.
NOTE 4 – LOANS PAYABLE
|
August 31, |
||||||||
|
2020 |
2019 |
|||||||
|
Loans payable |
$ | 1,029,765 | $ | 671,424 | ||||
During fiscal 2020 and 2019, the Company generated loan proceeds of $347,728 and $231,424, respectively.
|
August 31, |
||||||||
|
2020 |
2019 |
|||||||
|
Loans payable short-term |
$ | 980,109 | $ | 671,424 | ||||
|
Loans payable long-term |
49,656 | - | ||||||
| $ | 1,029,765 | $ | 671,424 | |||||
The loans payables are generally due on demand, are unsecured, and are bearing interest at a range of 2-12%., with the exception of one loan payable to a financial institution. Such loan, which amounted to $53,515 at August 31, 2020 bears interest rate at 2.5%, is unsecured, matures in May 2026 with principal and interest payable monthly starting in May 2021. This loan is part of a Bounce Back Loan Scheme from the UK Government.
There are shares which are to be issued but have not been issued yet. Those shares are included in the accrued expenses and interest expense and were valued based on current market price at the time of the agreement.
During 2020, the Company recorded a gain on extinguishment for loans payable pursuant to a settlement with a lender which amounted to the difference between the carrying value and the settlement amount. The gain on carrying value of principal amounted to $10,000. The gain on extinguishment of accrued interest amounted to approximately $47,802 and was recorded as an offset to interest expense.
The company may have to provide additional consideration (which may be in cash, shares or other financial instruments) up to amounts accrued to satisfy its obligations under certain unsecured loans payable.
The aggregate schedule maturities of the Company’s loans payable outstanding as of August 31, 2020 are as follows:
| Year ended August 31, | ||||
|
2021 |
$ | 980,109 | ||
|
2022 |
11,578 | |||
|
2023 |
11,578 | |||
|
2024 |
11,578 | |||
|
2025 |
11,578 | |||
|
Thereafter |
3,344 | |||
| $ | 1,029,765 |
NOTE 5 – CONVERTIBLE DEBENTURES
At August 31, 2020, and August 31, 2019 convertible debentures consisted of the following:
|
August 31, |
||||||||
|
2020 |
2019 |
|||||||
|
Convertible notes payable |
$ | 840,791 | $ | 840,791 | ||||
The convertible notes payable matured through August 2020, and bear interest at ranges between 6% and 15%. The convertible notes are convertible at ratios varying between 45% and 50% of the closing price at the date of conversion through, at its most favorable terms for the holders, the average of the three lowest closing bids for a period of 5-30 days prior to conversion.
NOTE 6 – OFFICERS LOANS PAYABLE
|
August 31, |
||||||||
|
2020 |
2019 |
|||||||
|
Officers loans payable |
$ | 77,044 | $ | 142,430 | ||||
The loans payables are due on demand, are unsecured, and are non-interest bearing.
NOTE 7 – DERIVATIVE LIABILITIES
The Company accounts for the embedded conversion features included in its convertible instruments as derivative liabilities. The aggregate fair value of derivative liabilities at August 31, 2020 and 2019 amounted to $ 773,676 and $772,732 respectively. At each measurement date, the fair value of the embedded conversion features was based on the lattice binomial method using the following assumptions:
|
Years Ended August 31 |
||||||||
|
2020 |
2019 |
|||||||
|
Effective Exercise price |
0.0010 - 0.0076 | 0.0003 - 0.0010 | ||||||
|
Effective Market price |
0.0076 | 0.0006 | ||||||
|
Volatility |
82.15 | % | 78.95 | % | ||||
|
Risk-free interest |
0.12 | % | 1.76 | % | ||||
|
Terms |
365 days |
365 days |
||||||
|
Expected dividend rate |
0 | % | 0 | % | ||||
The expected volatility is based on the historical volatility of comparable companies.
Changes in the derivative liabilities during the years ended August 31, 2020 and 2019 are as follows:
|
Balance at September 1, 2018 |
$ | 724,313 | ||
|
Embedded conversion features at issuance |
- | |||
|
Changes in fair value of derivative liabilities |
48,419 | |||
|
Balance, August 31, 2019 |
$ | 772,732 | ||
|
Embedded conversion features at issuance |
- | |||
|
Changes in fair value of derivative liabilities |
944 | |||
|
Balance, August 31, 2020 |
$ | 773,676 |
NOTE 8 – ACCRUED COMPENSATION
As of August 31, 2020, and 2019 the Company owes $1,436,686 and $1,268,289, respectively, in accrued compensation and expenses to certain directors and consultants. The amounts are non-interest bearing.
NOTE 9 – COMMON STOCK AND PREFERRED STOCK
Preferred Stock- Series 1 and 2
The designation of the Preferred Stock- Series 1 is as follows: Authorized 2,000,000 shares, par value of $0.001. One share of the Company’s Preferred Stock- Series is convertible into 53.04 shares of the Company’s common stock, at the holder’s option and with the Company’s acquiescence, and has three votes per share.
The designation of the Preferred Stock- Series 2 is as follows: Authorized 2,000,000 shares, par value of $0.001. One share of the Company’s Preferred Stock- Series is convertible into one share of the Company’s common stock, at the holder’s option and with the Company’s acquiescence, and has no voting rights.
Common Stock
The Authorized Shares increased to 2,000,000,000 in April 4, 2016.
During the fiscal year ended August 31, 2019, the Company issued 12,000,000 shares in connection with the issuance of a note payable, the fair value of the shares amounted to $8,400 (see note 4).
NOTE 10 – OTHER INCOME
The Company received a grant of approximately $13,000 from a United Kingdom local governmental entity.
NOTE 11 – COMMITMENTS AND CONTINGENCIES
Leases
The Company leases its facilities under non-cancellable operating leases which are renewable monthly as it is evaluating larger quarters. The leases have monthly base rents. The latest monthly base rent for the Company’s facilities ranges between $255 and $1,025.
Total rental expense amounted to $17,203, and $15,439 during fiscal year 2020 and 2019, respectively.
Consulting Agreement
The annual compensation of Linda Perry amounts to $150,000 for her role as a consultant and as Executive Director for US interface to provide oversight regarding external regulatory reporting requirements. In addition, Ms. Perry is the lead executive for capital funding requirements and business development. The agreement has a rolling three-year term through September 2022.
Legal Matters
From time to time, the Company has become or may become involved in certain lawsuits and legal proceedings which arise in the ordinary course of business. The Company intends to vigorously defend its positions. However, litigation is subject to inherent uncertainties and an adverse result in those or other matters may arise from time to time that may harm its financial position, or our business and the outcome of these matters cannot be ultimately predicted.
NOTE 12 – INCOME TAXES
For the years ended August 31, 2020, and 2019, the benefit for income taxes differed from the amounts computed by applying the statutory federal income tax rate at which rate the tax benefits is expected to occur. The reconciliation is as follows:
|
Years Ended August 31 |
||||||||
|
2020 |
2019 |
|||||||
|
Benefit computed at statutory rate |
$ | 138,000 | $ | 142,000 | ||||
|
State tax (benefit), net of federal affect |
28,000 | 30,000 | ||||||
|
Permanent differences (primarily change in fair value of derivative liability) |
(3,000 | ) | (12,000 | ) | ||||
|
Increase in valuation allowance |
(163,000 | ) | (160,000 | ) | ||||
|
Net income tax benefit |
$ | - | $ | - | ||||
The Company has net operating loss carry-forward for income tax totaling purposes approximately $5.2 million at August 31, 2020. A significant portion of these carryforwards is subject to annual limitations due to “equity structure shifts” or “owner shifts” involving “five percent shareholders” (as defined in the Internal Revenue Code) which results in a more than fifty percent change in ownership.
The net deferral tax asset is as follows:
|
Years Ended August 31 |
||||||||
|
2020 |
2019 |
|||||||
|
Net operating loss carry-forward |
$ | 1,335,000 | $ | 1,215,000 | ||||
|
Accrued compensation |
364,000 | 321,000 | ||||||
|
Valuation allowance |
(1,699,000 | ) | (1,536,000 | ) | ||||
|
Net deferred tax asset |
$ | - | $ | - | ||||
The valuation allowance increased by $114,000 during fiscal year 2020.
NOTE 13 – FOREIGN OPERATIONS
As of August 31, 2020, all of our revenues and a majority of our assets are associated with subsidiaries located in the United Kingdom. Assets at August 31, 2020 and revenues for fiscal 2019 were as follows:
|
United States |
Great Britain |
Total |
||||||||||
|
Revenues |
$ | - | $ | 268,957 | $ | 268,957 | ||||||
|
Total revenues |
- | 268,957 | 268,957 | |||||||||
|
Identifiable assets at August 31, 2020 |
8,065 | 44,177 | 52,242 | |||||||||
As of August 31, 2019, a majority of revenues and assets are associated with subsidiaries located in the United Kingdom. Assets and revenues for the year ended August 31, 2019, were as follows:
|
United States |
Great Britain |
Total |
||||||||||
|
Revenues |
$ | - | $ | 415,662 | $ | 415,662 | ||||||
|
Total revenues |
- | 415,662 | 415,662 | |||||||||
|
Identifiable assets at August 31, 2019 |
10,322 | 67,385 | 77,707 | |||||||||
NOTE 14 - SUBSEQUENT EVENTS
The Company has analyzed its operations subsequent to August 31, 2020 through the date these financial statements were issued, and has determined that it does not have any material subsequent events to disclose.
ITEM 9. CHANGES IN AND DISAGREEMENTS WITH ACCOUNTANTS ON ACCOUNTING AND FINANCIAL DISCLOSURE.
There are not currently and have not been any disagreements between us and our accountants on any matter of accounting principles, practices or financial statement disclosure.
ITEM 9A. CONTROLS AND PROCEDURES
Our management is responsible for establishing and maintaining a system of disclosure controls and procedures (as defined in Rule 13a-15(e) and 15d-15(e) under the Exchange Act) that is designed to ensure that information required to be disclosed by us in the reports that we file or submit under the Exchange Act is recorded, processed, summarized and reported, within the time periods specified in the Commission’s rules and forms. Disclosure controls and procedures include, without limitation, controls and procedures designed to ensure that information required to be disclosed by an issuer in the reports that it files or submits under the Exchange Act is accumulated and communicated to the issuer’s management, including its principal executive officer or officers and principal financial officer or officers, or persons performing similar functions, as appropriate to allow timely decisions regarding required disclosure.
As of the end of the period covered by this report, management, including our Principal Executive Officer and Principal Financial Officer, evaluated the effectiveness of our disclosure controls and procedures pursuant to Rules 13a-15(e) and 15d-15(e) under the Act.
Based upon the evaluation, our Principal Executive Officer and Principal Financial Officer concluded that our disclosure controls and procedures were effective as of August 31, 2020. Our management concluded that the consolidated financial statements included in this report fairly present, in all material respects, our financial position, results of operations and cash flows for the periods presented in accordance with GAAP.
Management’s Annual Report on Internal Control Over Financial Reporting:
Our management is responsible for establishing and maintaining adequate internal controls over financial reporting as defined in Rules 13 a-15(f) of the Exchange Act.
Our management conducted an evaluation of the effectiveness of its internal controls over financial reporting, as of August 31, 2020, based on the framework and criteria established in “Internal Control - Integrated Framework”, issued by the Committee of Sponsoring Organizations of the Treadway Commission (“COSO”) in the Internal Control-Integrated Framework (2013). This evaluation included review of the documentation of controls, evaluation of the design effectiveness of controls, testing of the operating effectiveness of controls and a conclusion on this evaluation. Based on this evaluation, management concluded that our internal control over financial reporting was effective as of August 31, 2020.
Management believes that a controls system, no matter how well designed and operated, cannot provide absolute assurance that the objectives of the controls system are met, and no evaluation of controls can provide absolute assurance that all control issues and instances of fraud, if any, within a company have been detected.
This Annual Report on Form 10-K does not include an attestation report from our registered public accounting firm regarding internal control over financial reporting. Management’s report was not subject to attestation by our registered public accounting firm pursuant to SEC rules that permit us to provide only management’s report in this Annual Report on Form 10-K.
Changes in Internal Controls Over Financial Reporting:
There were no changes in our internal control over financial reporting during the quarter ended August 31, 2020 identified in connection with the evaluation thereof by our management, including our Principal Executive Officer and Principal Financial Officer, that have materially affected, or are reasonably likely to materially affect, our internal control over financial reporting.
PART III MANAGEMENT
ITEM 10. DIRECTORS, EXECUTIVE OFFICERS AND CORPORATE GOVERNANCE
Executive Officers and Directors
The following table sets forth certain information, as of August 31, 2020, with respect to our directors and executive officers.
Directors serve until the next annual meeting of the stockholders; until their successors are elected or appointed and qualified, or until their prior resignation or removal. Officers serve for such terms as determined by our board of directors. Each officer holds office until such officer’s successor is elected or appointed and qualified or until such officer’s earlier resignation or removal. No family relationships exist between any of our present directors and officers.
|
Name |
Position |
|
Neil Gray |
Chairman and Executive Director |
|
Reggie James |
Co-Chief Operating Officer, Senior Vice President and Executive Director |
|
Linda Perry |
Executive Director, Chair Nomination/Compensation and Audit Committees |
The following is a brief account of the business experience of each of our Directors and Executive Officers:
Neil Gray Mr. Gray has served as Chairman and Executive Director of DBMM as of April 1, 2010. He is a career entrepreneur in various industries from real estate to commodities. He was a principal in a privately held UK-based Healthcare group in the UK and EU. Other projects were developed in engineering, textiles and import/export in Africa, South America, Spain and the Black Sea. Early experience included participation on a think tank team assessing risk management for a UK insurance company.
Reggie James, As of April 1, 2011, Mr. Reggie James has served as Senior Vice President of Marketing and Communications and Executive Director. Mr. James also is the Managing Director of Digital Clarity. In 2013, he was appointed Co-Chief Operating Officer. Mr. James has been involved in the commercial element of the internet since its inception and has been instrumental in driving forward business models that are common place today.
Mr. James is the founder of Digital Clarity, a leading Digital Advertising Agency and a wholly owned business of DBMM. The Company helps major brands and medium sized companies take advantage of the digital economy focusing on areas such as Search Engine Marketing (Google, Yahoo! & Bing), Social Media (Twitter, Facebook & LinkedIn) and Internet Strategy Planning including Design, Analytics and Mobile Marketing. Mr. James launched the European division of a later VoIP technology company that became the first dot com to list on the Singapore Stock Exchange later acquired by Spice Communications. Subsequently, Spice was acquired by Idea Cellular, the 3rd largest mobile services operator in India. Mr. James is also the co-founder of an internet analytics technology software house as well as shareholder in an AIM listed marketing services company. AIM is the London Stock Exchange’s international market for smaller growing companies. Previously, Mr. James was involved with publishing groups VNU & Ziff-Davis where he launched titles such as Management Consultancy and IT Week. Prior to launching Digital Clarity, Mr. James was part of the global sales team at leading search company AltaVista where he managed global brands such as Compaq and Hewlett Packard (HP). AltaVista was acquired by Yahoo! Inc.
Linda Perry, Ms. Perry has served as Executive Director and Chair Nomination/Compensation and Audit Committees since April 1, 2010. She had served as our President, Chief Executive Officer, and a Director until March 31, 2010 (excepting the period from April 19, 2005 to April 24, 2006). She has had an extensive career in global and entrepreneurial businesses. Ms. Perry consults to several companies globally and is industry agnostic. While living in Europe, she was the senior advisor to the Board of Directors of The Balli Group, where her role was to integrate the acquisition of Klockner & Co. The acquisition resulted in the creation of the world’s largest steel, multi-metal, distribution, and trading company. Prior to that, she was appointed a director and a member of the Executive Committee of Churchill Insurance Group, Plc., a division of the Credit Suisse Group. The Company was re-organized and sold within the industry for £2.3 billion GBP. She was a senior executive at ExxonMobil Corporation holding general management positions with global responsibility in finance, marketing, and organization (described as corporate governance, management succession and executive compensation.) The latter role was under the aegis of the Board of Directors, entitled Compensation, Organization and Executive Development Committee/COED, of which she was a member. Ms. Perry holds an MBA from Harvard University. She has been a visiting lecturer/professor at IMD, Lausanne, Switzerland, INSEAD, Fontainebleau, France and the Stern School of Business at New York University throughout her career.
We believe that all our directors are qualified to serve on our board of directors based on their experience and the diversity of background.
Board Committees
We currently have standing committees on our Board of Directors. The audit committee and nomination /compensation committee are listed below.
Audit Committee
We have established an Audit Committee of the Board of Directors. The Audit Committee duties include a recommendation to our Board of Directors the engagement of independent auditors to audit our financial statements and to review our accounting and auditing principles. The audit committee will review the scope, timing and fees for the annual audit and the results of audit examinations performed by the internal auditors and independent public accountants, including their recommendations to improve the system of accounting and internal controls.
Nomination/Compensation Committee
We have established a Nomination/Compensation Committee of the Board of Directors. The Nomination/Compensation Committee reviews and approves our total remuneration, including compensation of executive officers. The Nomination/Compensation Committee will also administer our stock option plans and recommend and approve grants of stock options under such plans.
Compensation of Directors
All directors are officers and their compensation are included on the summary compensation table (Item 11).
Compliance with Section 16(A) of the Exchange Act
Our common stock was registered pursuant to Section 12 of the Exchange Act during the fiscal years ended August 31, 2020 and 2019. Accordingly, our officers, directors and principal shareholders were subject to the beneficial ownership reporting requirements of Section 16(a) of the Exchange Act during each year.
Code of Ethics
On December 1, 2004 we adopted a Code of Ethics that applies to our Principal Executive Officer, Principal Financial Officer, Principal Accounting Officer and Controller and to persons performing similar functions. A copy of our Code of Ethics was previously filed as an Exhibit to our annual report on Form 10-KSB for the year ended August 31, 2004. A copy of our Code of Ethics will be provided to any person requesting same without charge. To request a copy of our Code of Ethics please make written request to DBMM.
ITEM 11. EXECUTIVE COMPENSATION
SUMMARY COMPENSATION TABLE
None of our executive officers or employees received compensation in excess of $100,000 during the years ended August 31, 2020 or 2019, except as follows:
|
Name Principal Position |
Fiscal Year Ended August 31, |
($) Salary |
($) Bonus |
($) Stock awards |
($) Option awards |
($) Nonequity incentive plan compensation |
($) Nonqualified deferred compensation earnings |
($) All other Compensation |
($) Total |
|||||||||||||||||||||||||
|
Reggie James |
2020 |
$ | 184,963 | (1) | - | - | - | - | - | - | $ | 184,963 | ||||||||||||||||||||||
|
Executive Director |
2019 |
$ | 192,853 | (2) | - | - | - | - | - | - | $ | 192,853 | ||||||||||||||||||||||
|
Linda Perry |
2020 |
$ | 150,000 | (3) | - | - | - | - | - | - | $ | 150,000 | ||||||||||||||||||||||
|
Executive Director |
2019 |
$ | 150,000 | (3) | - | - | - | - | - | - | $ | 150,000 | ||||||||||||||||||||||
|
(1) |
For the fiscal year ending August 31, 2020, Mr. James earned $184,963 of which $130,963 has been paid to Reggie James. $54,000 remains unpaid. |
|
|
|
|
(2) |
For the fiscal year ending August 31, 2019, Mr. James earned $192,853 of which $138,853 has been paid to Reggie James. $54,000 remains unpaid. |
|
|
|
|
(3) |
For the fiscal years ended August 31, 2020, and 2019, Ms. Perry earned $150,000 each year of which $0 has been paid, $300,000 remains unpaid. |
OPTION/SAR GRANTS IN LAST FISCAL YEAR
No stock appreciation rights were granted to the named executives during the fiscal years ended August 31, 2020 and 2019.
Long Term Incentive Plan Awards
No long-term incentive plan awards to the named executive officers during the fiscal years ended August 31, 2020 and 2019.
Employment Contracts, Termination of Employment, and Change-in-Control Arrangements
In April 2010 the Company appointed Neil Gray as Chairman and Executive Director of the Company. The term was an initial three years, renewable annually beginning on September 1st, the beginning of the fiscal year.
In April 2011 the Company agreed to compensate a Company Officer, Reggie James, for monthly remuneration of $4,500 for his duties as Senior Vice President and Executive Director of DBMM and Digital Clarity. Mr. James was appointed Co-Chief Operating Officer during fiscal year 2013.
In September 2010 the Company agreed to compensate a Company Officer, Linda Perry, for annual remuneration of $150,000 for her role as a consultant and as Executive Director for US interface to provide oversight for external regulatory reporting requirements. In addition, Ms. Perry is lead executive for capital funding requirements and business development.
In June 2012 a Company agreed to compensate a Company Officer, Steve Baughman, as Head, US Operations with a sign on bonus of 50,000 preferred shares, compensation is performance-based, reflecting multiple projects and business development activities. Mr. Baughman was appointed Co-Chief Operating Officer during fiscal year 2013.
Report on Repricing of Options/SARs
During the fiscal years ended August 31, 2020, and 2019 we did not adjust or amend the exercise price of any stock options or SARs.
ITEM 12. Security Ownership of Certain Beneficial Owners and Management and Related Stockholder Matters.
The following table sets forth information with respect to the beneficial ownership of our common stock known by us as of August 31, 2020 by, (i) each of our directors, (ii) each of our executive officers, and (iii) all of our directors and executive officers as a group. The percentages in the table have been calculated on the basis of treating as outstanding for a particular person, all shares of our common stock outstanding on such date and all shares of our common stock issuable to such holder in the event of exercise of outstanding options, warrants, rights or conversion privileges owned by such person at said date which are exercisable within 60 days of such date. Except as otherwise indicated, the persons listed below have sole voting and investment power with respect to all shares of our common stock owned by them, except to the extent such power may be shared with a spouse.
Name of Beneficial Owner and/or Beneficially Own Shares of Restricted Common Stock percentage owned:
|
(1) Neil Gray* |
30 | 0.00 |
% |
|||||
|
(2) Reggie James* |
7,982,328 | 1.07 |
% |
|||||
|
(3) Steve Baughman* |
10,457 | 0.10 |
% |
|||||
|
(4) Linda Perry* |
7,972,579 | 1.07 |
% |
|||||
|
All Directors and Executive Officers as a Group (4 persons) |
15,965,394 |
The officers as a group hold 1,970,185 Restricted Preferred Shares, under the designation terms of Preferred Stock-Series 1.
ITEM 13. CERTAIN RELATIONSHIPS AND RELATED TRANSACTIONS
None.
ITEM 14. PRINCIPAL ACCOUNTANT FEES AND SERVICES.
Audit Fees
The aggregate fees billed to us by our principal accountants for services rendered during the fiscal years ended August 31, 2020, and 2019 are set forth in the table below:
|
2020 |
2019 |
|||||||
|
Audit Fees (1) |
$ | 35,000 | $ | 40,000 | ||||
|
|
(1) |
Audit fees represent fees for professional services provided in connection with the audit of our annual financial statements and review of our quarterly financial statements and audit services provided in connection with other statutory or regulatory filings. |
Audit Related Fees. We incurred fees to our independent auditors of $-0- for audit related fees during fiscal years ended August 31, 2020, and 2019.
Tax and Other Fees. We incurred fees to our independent auditors of $-0- for tax and other fees during the fiscal years ended August 31, 2020, and 2019.
Audit Committee’s Pre-Approval Practice.
For fiscal years ended August 31, 2020 and 2019, the Audit Committee pre-approved all audit and permissible non-audit services provided by our independent auditors.
PART IV
The following Exhibits are being filed with this Annual Report on Form 10-K:
|
Exhibit Number |
Description |
|
3.1(1) |
|
|
3.2(8) |
|
|
10.3(4) |
|
|
10.1(5) |
|
|
10.2(5) |
|
|
10.3(5) |
Share purchase Agreement between Cloud Channel Limited and Bitemark MC Limited. |
|
10.4(5) |
Share purchase Agreement between Cloud Channel Limited and Stylar Limited. |
|
10.4(6) |
|
|
10.5(6) |
Amendment to Share Purchase Agreement between Cloud Channel Limited and Bitemark MC Limited. |
|
10.6(6) |
Amendment to Share Purchase Agreement between Cloud Channel Limited and Stylar Limited. |
|
10.7(8) |
|
|
10.8(9) |
|
|
10.9(10) |
|
|
10.10(11) |
|
|
14.1(3) |
|
|
31.1* |
|
|
32.1* |
|
|
101.INS** |
XBRL Instance Document |
|
101.SCH** |
XBRL Taxonomy Extension Schema Document |
|
101.CAL** |
XBRL Taxonomy Extension Calculation Linkbase Document |
|
101.DEF** |
XBRL Taxonomy Extension Definition Linkbase Document |
|
101.LAB** |
XBRL Taxonomy Extension Label Linkbase Document |
|
101.PRE** |
XBRL Taxonomy Extension Presentation Linkbase Document |
(1) Previously filed as an exhibit to the Company’s Registration Statement on Form SB-2 filed with the Commission on March 27, 2002.
(3) Previously filed as an exhibit to the Company’s Annual Report on Form 10-KSB for the year ended August 31, 2004.
(4) Previously filed as an exhibit to the Company’s Current Report on Form 8-K filed with the Commission on March 21, 2007.
(5) Previously filed as an exhibit to the Company’s Current Report on Form 8-KA filed with the Commission on April 9, 2010.
(6) Previously filed as an exhibit to the Company’s Current Report on Form 8-KA filed with the Commission on July 15, 2010.
(8) Previously filed as an exhibit to the Company’s Annual Report on Form 10-K for the year ended August 31, 2011.
(9) Previously filed as an exhibit to the Company’s Current Report on Form 8-K Filed with the Commission on June 12, 2012.
(10) Previously filed as an exhibit to the Company’s Annual Report on Form 10-K for the year ended August 31, 2012.
(11) Previously filed as an exhibit to the Company’s Quarterly Report on Form 10-Q for the quarter ended May 31, 2013.
* Filed herewith
** Previously filed
Pursuant to the requirements of Section 13 or 15(d) of the Securities Exchange Act of 1934, as amended, the registrant has duly caused this report to be signed on its behalf by the undersigned, thereunto duly authorized.
|
|
DIGITAL BRAND MEDIA & MARKETING GROUP, INC. |
||
|
|
|
|
|
|
Date: December 15, 2020 |
By: |
/s/ Linda Perry |
|
|
|
|
Principal Executive Officer Principal Financial Officer Executive Director |
|
In accordance with the Exchange Act, this report has been signed below by the following persons on behalf of the registrant and in the capacities and on the dates indicated.
|
|
|
|
|
|
Date: December 15, 2020 |
By: |
/s/ Linda Perry |
|
|
|
|
Principal Executive Officer Principal Financial Officer Executive Director |
|