Attached files
| file | filename |
|---|---|
| 8-K - 8-K - Matson, Inc. | matx-20201118x8k.htm |
Exhibit 99.1
| 1 Investor Presentation │November 18, 2020 Investor Presentation November 18, 2020 |
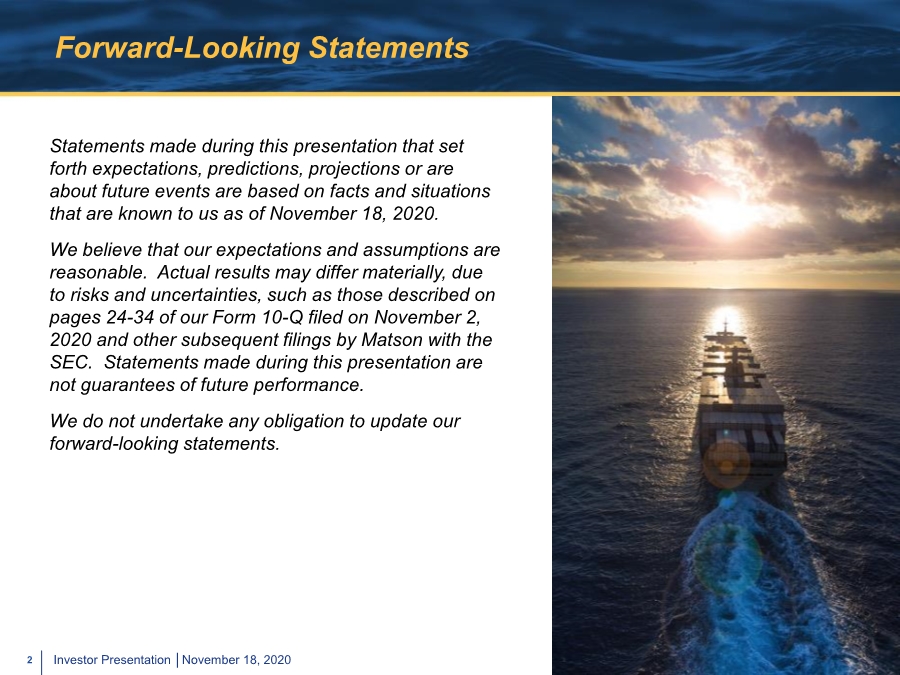
| 2 Investor Presentation │November 18, 2020 Forward-Looking Statements Statements made during this presentation that set forth expectations, predictions, projections or are about future events are based on facts and situations that are known to us as of November 18, 2020. We believe that our expectations and assumptions are reasonable. Actual results may differ materially, due to risks and uncertainties, such as those described on pages 24-34 of our Form 10-Q filed on November 2, 2020 and other subsequent filings by Matson with the SEC. Statements made during this presentation are not guarantees of future performance. We do not undertake any obligation to update our forward-looking statements. |
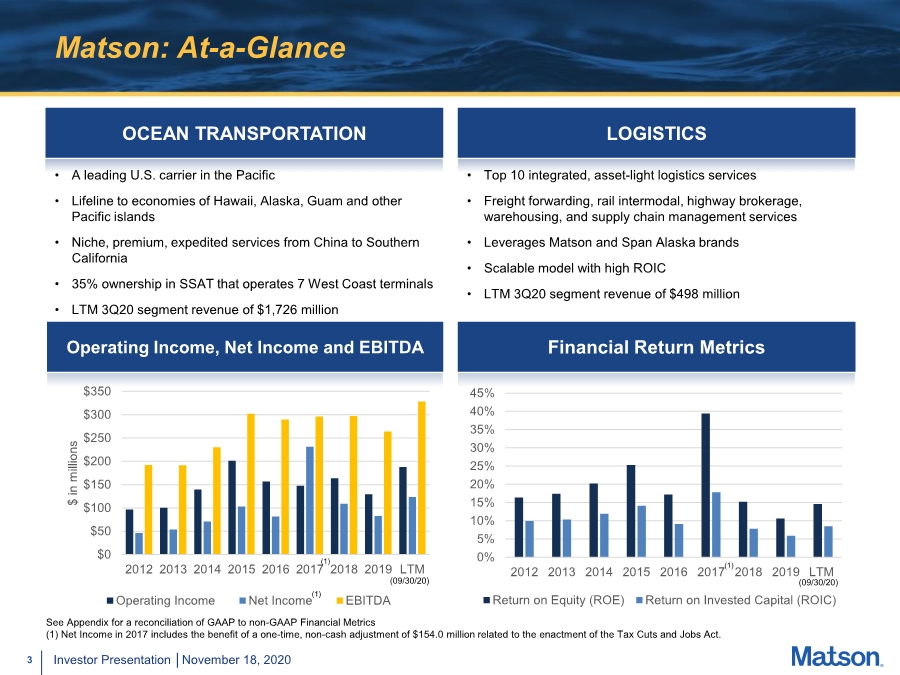
| 3 Investor Presentation │November 18, 2020 Matson: At-a-Glance OCEAN TRANSPORTATION • A leading U.S. carrier in the Pacific • Lifeline to economies of Hawaii, Alaska, Guam and other Pacific islands • Niche, premium, expedited services from China to Southern California • 35% ownership in SSAT that operates 7 West Coast terminals • LTM 3Q20 segment revenue of $1,726 million LOGISTICS • Top 10 integrated, asset-light logistics services • Freight forwarding, rail intermodal, highway brokerage, warehousing, and supply chain management services • Leverages Matson and Span Alaska brands • Scalable model with high ROIC • LTM 3Q20 segment revenue of $498 million See Appendix for a reconciliation of GAAP to non-GAAP Financial Metrics (1) Net Income in 2017 includes the benefit of a one-time, non-cash adjustment of $154.0 million related to the enactment of the Tax Cuts and Jobs Act. $0 $50 $100 $150 $200 $250 $300 $350 2012 2013 2014 2015 2016 2017 2018 2019 LTM $ in millions Operating Income Net Income EBITDA (1) Operating Income, Net Income and EBITDA Financial Return Metrics 0% 5% 10% 15% 20% 25% 30% 35% 40% 45% 2012 2013 2014 2015 2016 2017 2018 2019 LTM Return on Equity (ROE) Return on Invested Capital (ROIC) (1) (1) (09/30/20) (09/30/20) |
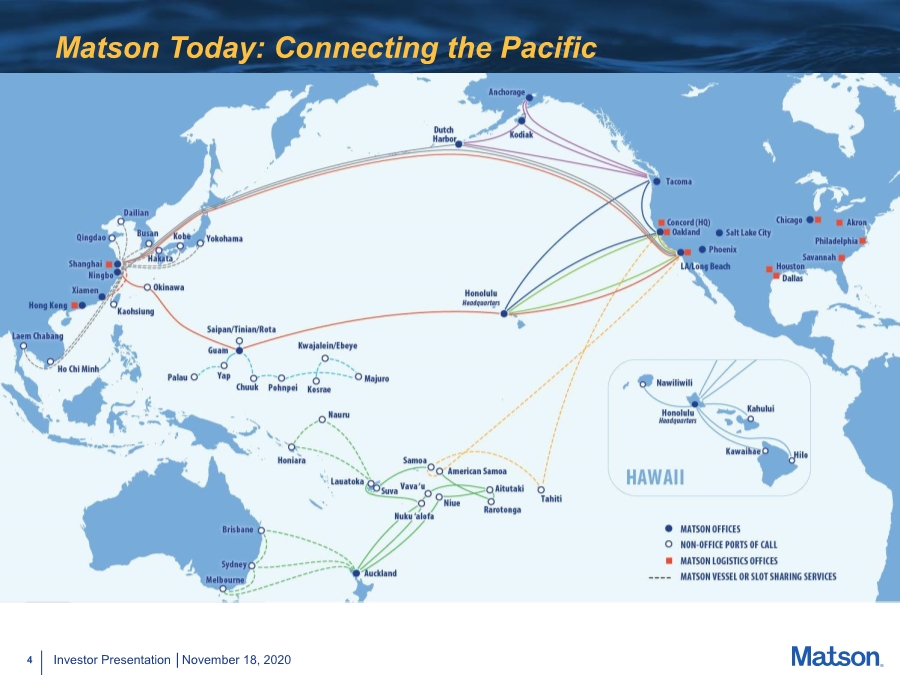
| 4 Investor Presentation │November 18, 2020 Matson Today: Connecting the Pacific |
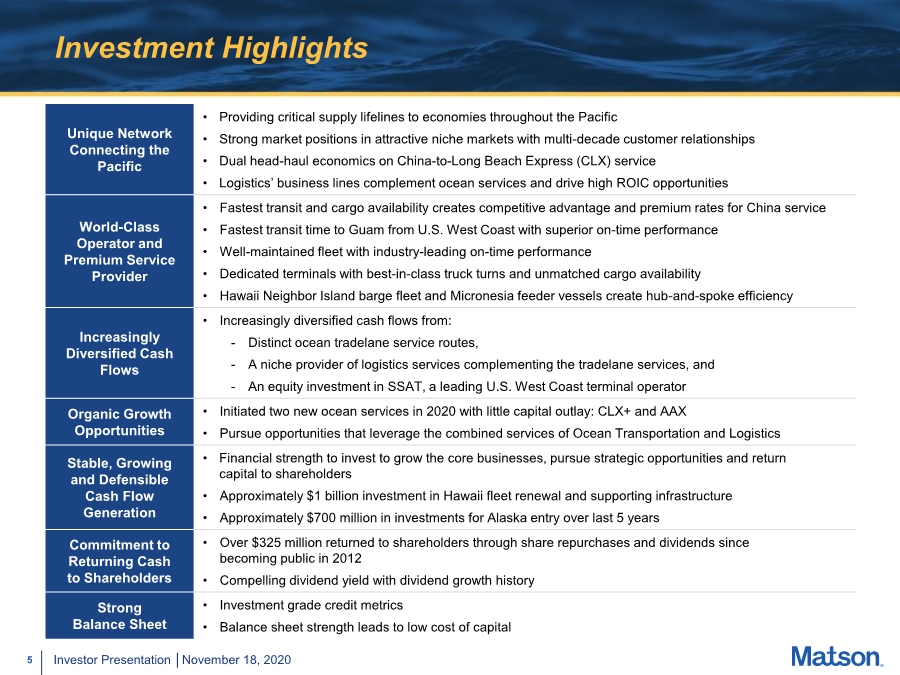
| 5 Investor Presentation │November 18, 2020 Investment Highlights Unique Network Connecting the Pacific • Providing critical supply lifelines to economies throughout the Pacific • Strong market positions in attractive niche markets with multi-decade customer relationships • Dual head-haul economics on China-to-Long Beach Express (CLX) service • Logistics’ business lines complement ocean services and drive high ROIC opportunities World-Class Operator and Premium Service Provider • Fastest transit and cargo availability creates competitive advantage and premium rates for China service • Fastest transit time to Guam from U.S. West Coast with superior on-time performance • Well-maintained fleet with industry-leading on-time performance • Dedicated terminals with best-in-class truck turns and unmatched cargo availability • Hawaii Neighbor Island barge fleet and Micronesia feeder vessels create hub-and-spoke efficiency Increasingly Diversified Cash Flows • Increasingly diversified cash flows from: - Distinct ocean tradelane service routes, -A niche provider of logistics services complementing the tradelane services, and - An equity investment in SSAT, a leading U.S. West Coast terminal operator Organic Growth Opportunities • Initiated two new ocean services in 2020 with little capital outlay: CLX+ and AAX • Pursue opportunities that leverage the combined services of Ocean Transportation and Logistics Stable, Growing and Defensible Cash Flow Generation • Financial strength to invest to grow the core businesses, pursue strategic opportunities and return capital to shareholders • Approximately $1 billion investment in Hawaii fleet renewal and supporting infrastructure • Approximately $700 million in investments for Alaska entry over last 5 years Commitment to Returning Cash to Shareholders • Over $325 million returned to shareholders through share repurchases and dividends since becoming public in 2012 • Compelling dividend yield with dividend growth history Strong Balance Sheet • Investment grade credit metrics • Balance sheet strength leads to low cost of capital |
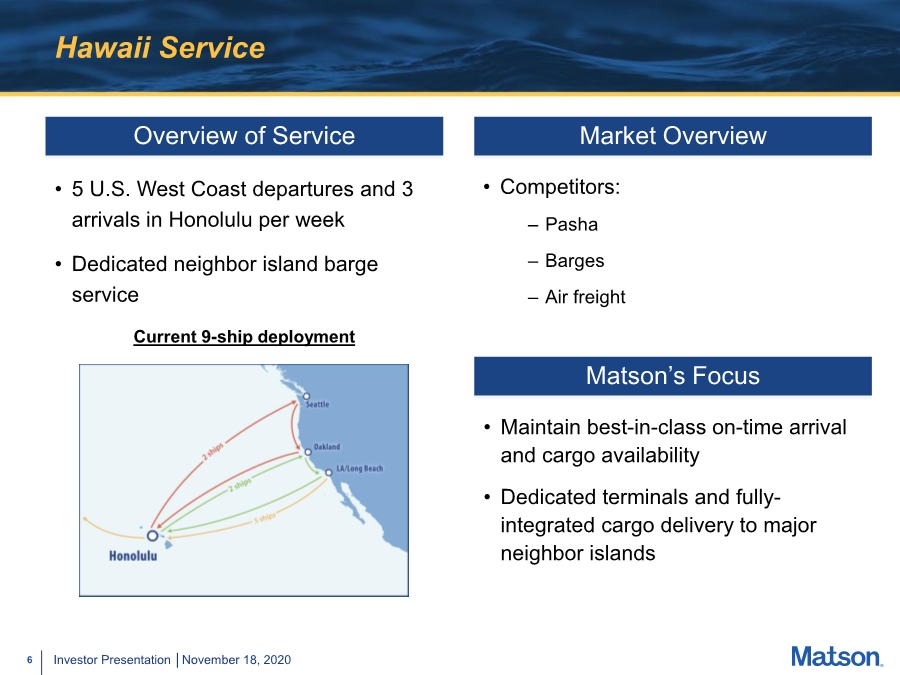
| 6 Investor Presentation │November 18, 2020 Hawaii Service • 5 U.S. West Coast departures and 3 arrivals in Honolulu per week • Dedicated neighbor island barge service Overview of Service Matson’s Focus • Maintain best-in-class on-time arrival and cargo availability • Dedicated terminals and fully- integrated cargo delivery to major neighbor islands Market Overview • Competitors: – Pasha – Barges – Air freight Current 9-ship deployment |
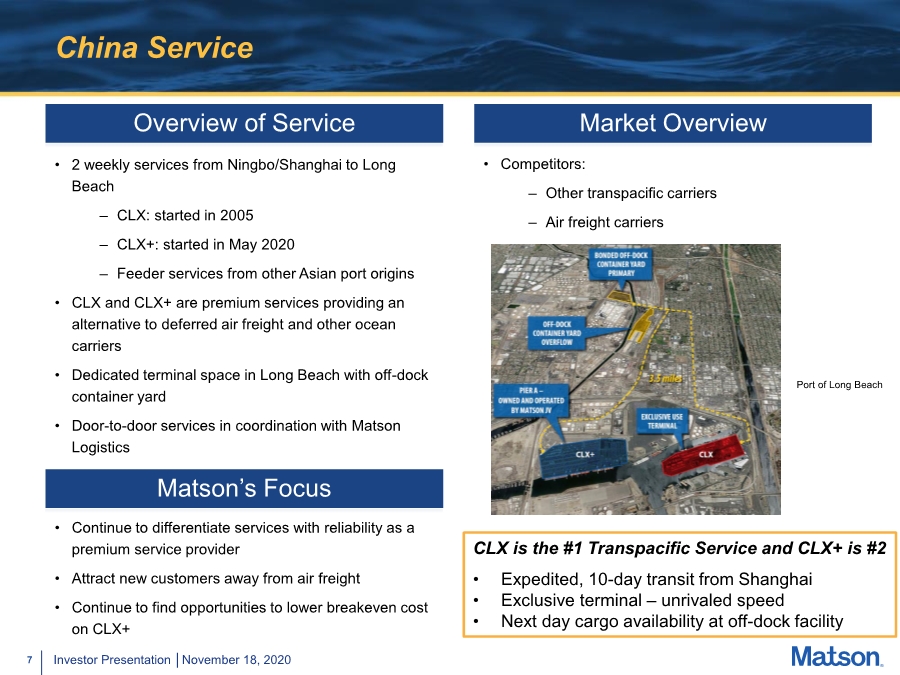
| 7 Investor Presentation │November 18, 2020 China Service • 2 weekly services from Ningbo/Shanghai to Long Beach – CLX: started in 2005 – CLX+: started in May 2020 – Feeder services from other Asian port origins • CLX and CLX+ are premium services providing an alternative to deferred air freight and other ocean carriers • Dedicated terminal space in Long Beach with off-dock container yard • Door-to-door services in coordination with Matson Logistics Overview of Service Matson’s Focus • Continue to differentiate services with reliability as a premium service provider • Attract new customers away from air freight • Continue to find opportunities to lower breakeven cost on CLX+ Market Overview • Competitors: – Other transpacific carriers – Air freight carriers CLX is the #1 Transpacific Service and CLX+ is #2 • Expedited, 10-day transit from Shanghai • Exclusive terminal – unrivaled speed • Next day cargo availability at off-dock facility Port of Long Beach |
| 8 Investor Presentation │November 18, 2020 CLX+ Service Matson is confident it can make the CLX+ service permanent. • 15-year track record of operating the industry leading expedited CLX service • Introduction of Alaska-to-Asia Express (AAX) helps lower the long-term breakeven economics • Demand and supply dynamics have been favorable and we expect them to continue: Demand Dynamics Supply Dynamics • Increasing demand for e-commerce goods • Shift in consumer spending from services to home improvement, electronics and other • Inventory restocking • End of pandemic may be gradual as distribution of billions of doses could potentially take years • Continued dislocation in transpacific air freight markets • Constraints in transpacific ocean capacity • Significant equipment demand and West Coast port congestion Our competitive advantages in the CLX service are also in the CLX+ service. • Own our chassis • Combination of SSAT terminal operations and Shippers Transport off-dock facility lead to industry low turn times and next day container availability – Allows us to avoid the congestion issues during peak periods |
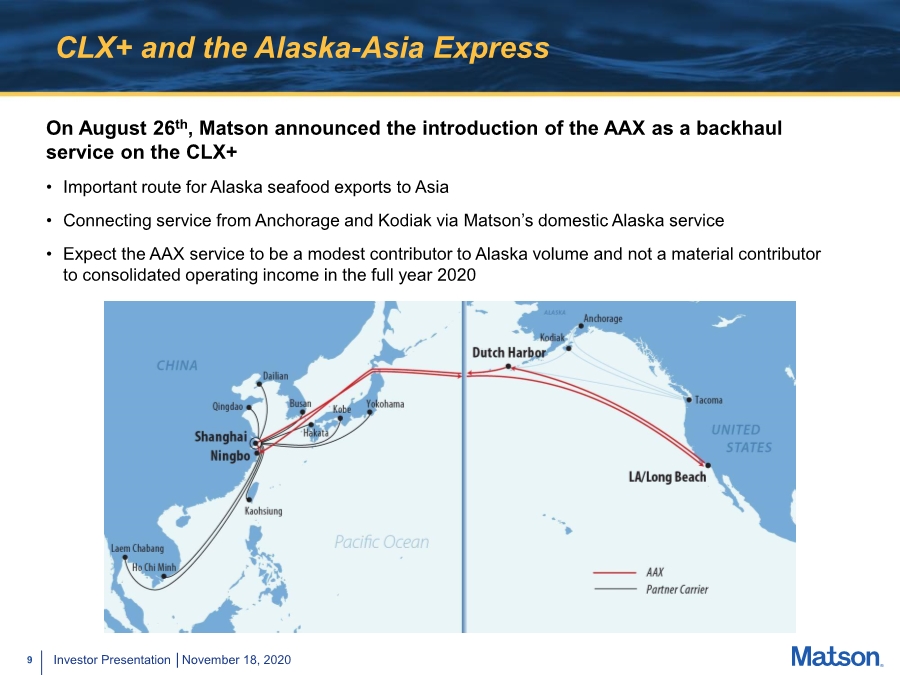
| 9 Investor Presentation │November 18, 2020 CLX+ and the Alaska-Asia Express On August 26th, Matson announced the introduction of the AAX as a backhaul service on the CLX+ • Important route for Alaska seafood exports to Asia • Connecting service from Anchorage and Kodiak via Matson’s domestic Alaska service • Expect the AAX service to be a modest contributor to Alaska volume and not a material contributor to consolidated operating income in the full year 2020 |
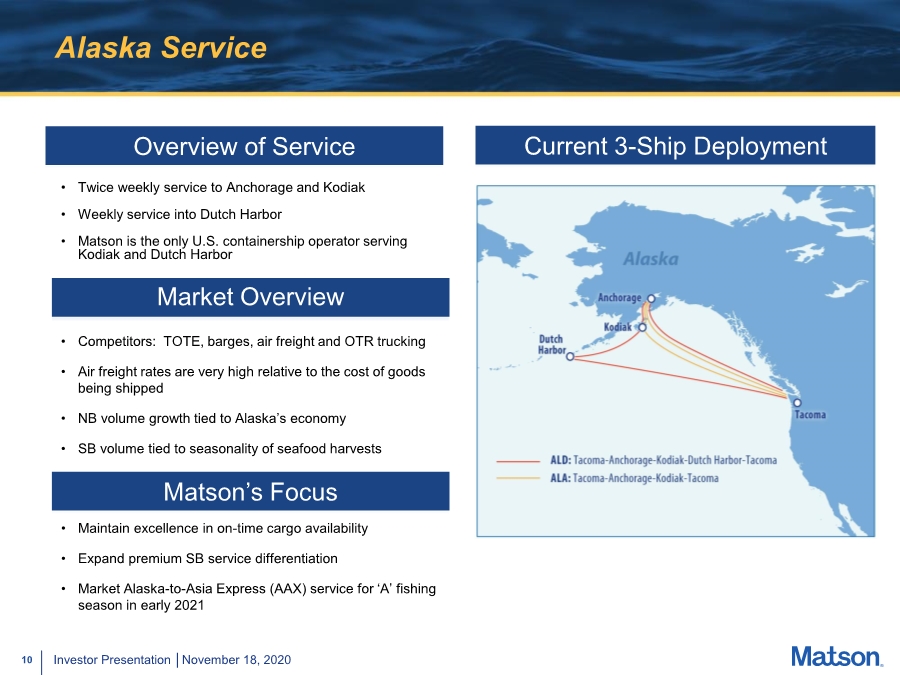
| 10 Investor Presentation │November 18, 2020 Alaska Service • Twice weekly service to Anchorage and Kodiak • Weekly service into Dutch Harbor • Matson is the only U.S. containership operator serving Kodiak and Dutch Harbor Overview of Service Matson’s Focus Current 3-Ship Deployment • Maintain excellence in on-time cargo availability • Expand premium SB service differentiation • Market Alaska-to-Asia Express (AAX) service for ‘A’ fishing season in early 2021 Market Overview • Competitors: TOTE, barges, air freight and OTR trucking • Air freight rates are very high relative to the cost of goods being shipped • NB volume growth tied to Alaska’s economy • SB volume tied to seasonality of seafood harvests |
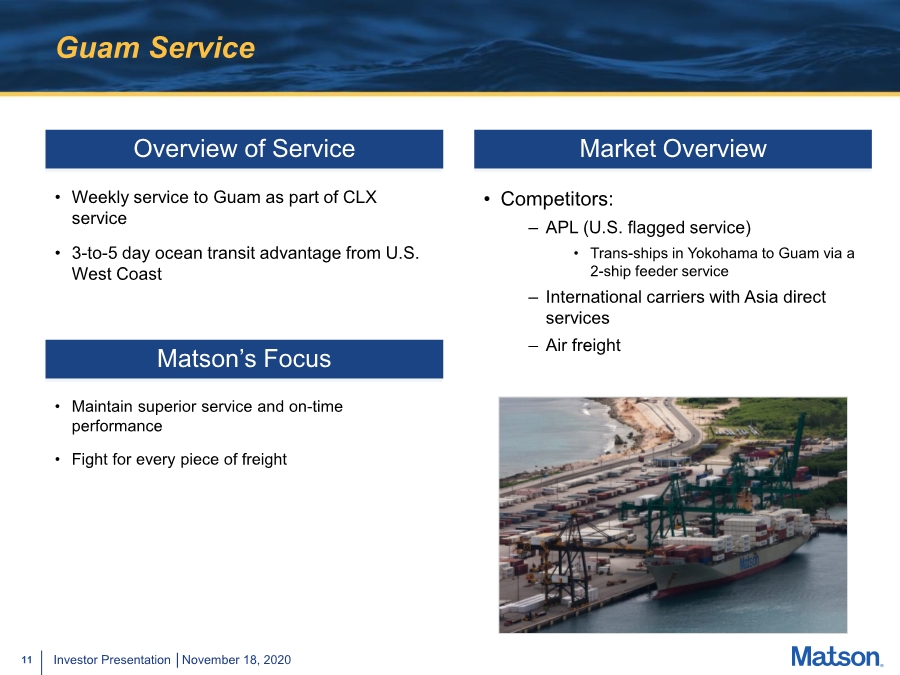
| 11 Investor Presentation │November 18, 2020 Guam Service • Weekly service to Guam as part of CLX service • 3-to-5 day ocean transit advantage from U.S. West Coast Overview of Service Matson’s Focus • Maintain superior service and on-time performance • Fight for every piece of freight Market Overview • Competitors: – APL (U.S. flagged service) • Trans-ships in Yokohama to Guam via a 2-ship feeder service – International carriers with Asia direct services – Air freight |
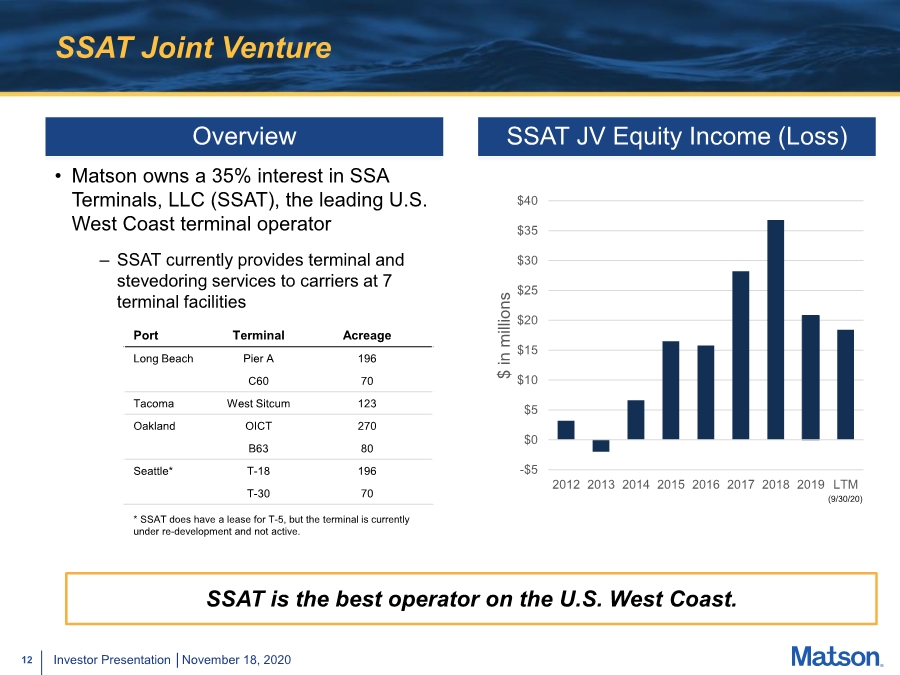
| 12 Investor Presentation │November 18, 2020 SSAT Joint Venture • Matson owns a 35% interest in SSA Terminals, LLC (SSAT), the leading U.S. West Coast terminal operator – SSAT currently provides terminal and stevedoring services to carriers at 7 terminal facilities Overview SSAT is the best operator on the U.S. West Coast. -$5 $0 $5 $10 $15 $20 $25 $30 $35 $40 2012 2013 2014 2015 2016 2017 2018 2019 LTM $ in millions SSAT JV Equity Income (Loss) (9/30/20) Port Terminal Acreage Long Beach Pier A 196 C60 70 Tacoma West Sitcum 123 Oakland OICT 270 B63 80 Seattle* T-18 196 T-30 70 * SSAT does have a lease for T-5, but the terminal is currently under re-development and not active. |
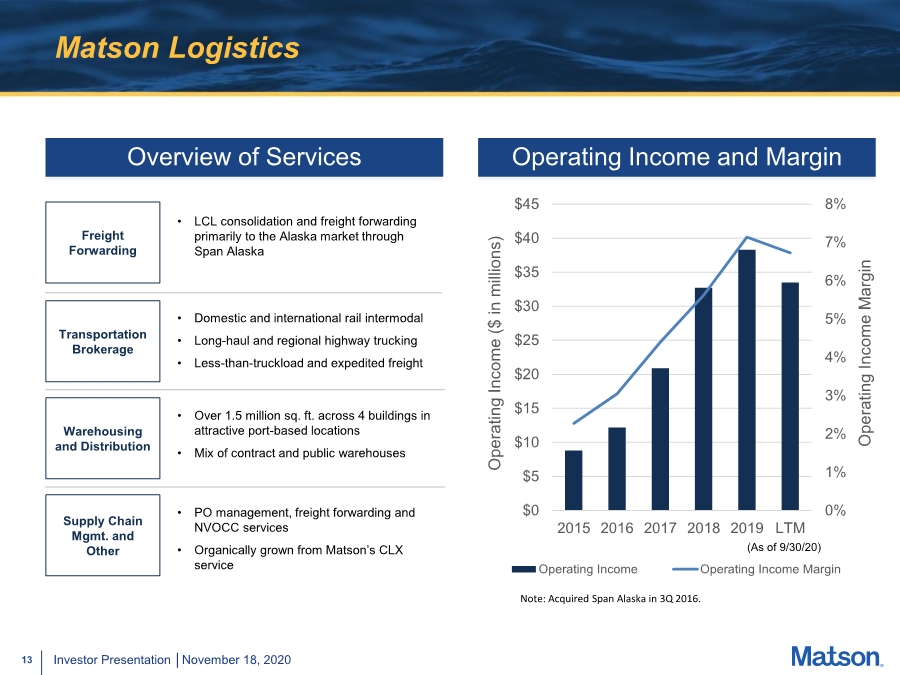
| 13 Investor Presentation │November 18, 2020 0% 1% 2% 3% 4% 5% 6% 7% 8% $0 $5 $10 $15 $20 $25 $30 $35 $40 $45 2015 2016 2017 2018 2019 LTM Operating Income Margin Operating Income ($ in millions) Operating Income Operating Income Margin Matson Logistics Note: Acquired Span Alaska in 3Q 2016. (As of 9/30/20) Transportation Brokerage • Domestic and international rail intermodal • Long-haul and regional highway trucking • Less-than-truckload and expedited freight • Over 1.5 million sq. ft. across 4 buildings in attractive port-based locations • Mix of contract and public warehouses Supply Chain Mgmt. and Other • PO management, freight forwarding and NVOCC services • Organically grown from Matson’s CLX service Warehousing and Distribution Overview of Services Operating Income and Margin Freight Forwarding • LCL consolidation and freight forwarding primarily to the Alaska market through Span Alaska |
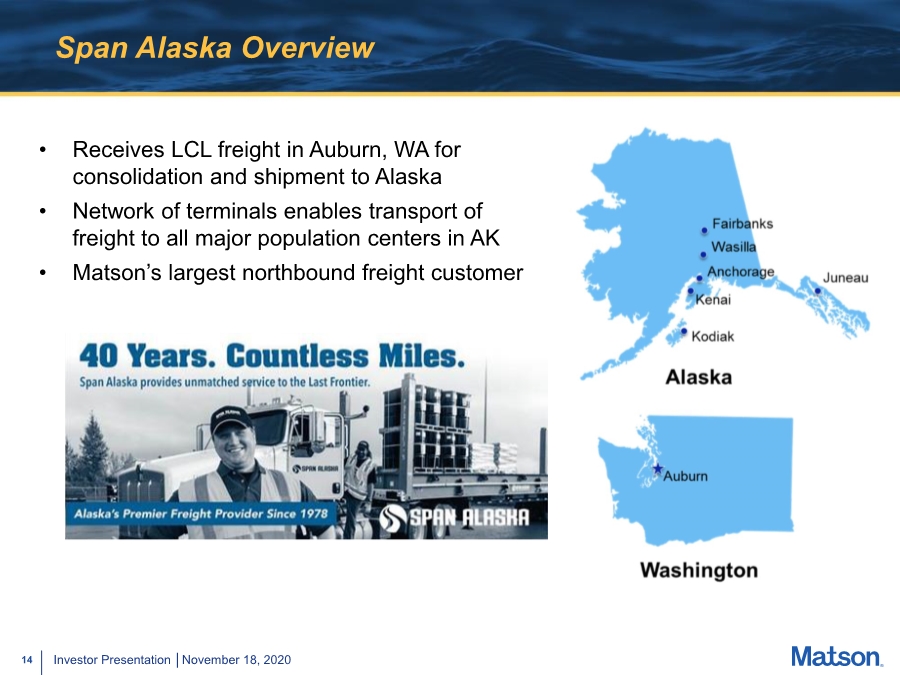
| 14 Investor Presentation │November 18, 2020 Span Alaska Overview • Receives LCL freight in Auburn, WA for consolidation and shipment to Alaska • Network of terminals enables transport of freight to all major population centers in AK • Matson’s largest northbound freight customer |
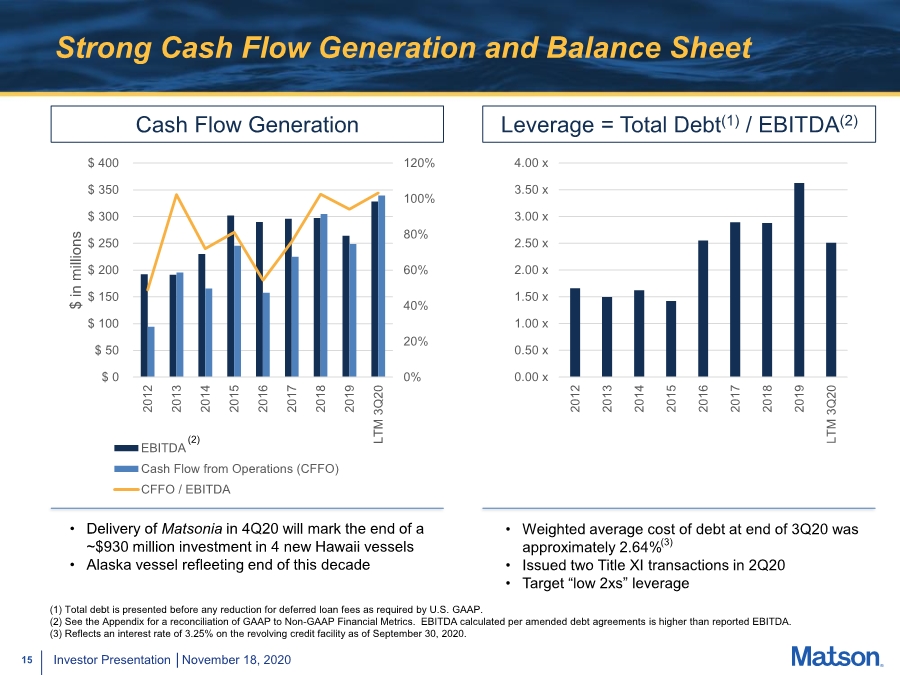
| 15 Investor Presentation │November 18, 2020 Strong Cash Flow Generation and Balance Sheet Cash Flow Generation Leverage = Total Debt(1) / EBITDA(2) • Weighted average cost of debt at end of 3Q20 was approximately 2.64% • Issued two Title XI transactions in 2Q20 • Target “low 2xs” leverage • Delivery of Matsonia in 4Q20 will mark the end of a ~$930 million investment in 4 new Hawaii vessels • Alaska vessel refleeting end of this decade (1) Total debt is presented before any reduction for deferred loan fees as required by U.S. GAAP. (2) See the Appendix for a reconciliation of GAAP to Non-GAAP Financial Metrics. EBITDA calculated per amended debt agreements is higher than reported EBITDA. (3) Reflects an interest rate of 3.25% on the revolving credit facility as of September 30, 2020. 0% 20% 40% 60% 80% 100% 120% $ 0 $ 50 $ 100 $ 150 $ 200 $ 250 $ 300 $ 350 $ 400 2012 2013 2014 2015 2016 2017 2018 2019 LTM 3Q20 $ in millions EBITDA Cash Flow from Operations (CFFO) CFFO / EBITDA (2) 0.00 x 0.50 x 1.00 x 1.50 x 2.00 x 2.50 x 3.00 x 3.50 x 4.00 x 2012 2013 2014 2015 2016 2017 2018 2019 LTM 3Q20 (3) |
| 16 Investor Presentation │November 18, 2020 Capital Allocation • Fund maintenance capital expenditures – Investing approximately $30 million in new equipment to support growth of China service and AAX to maximize opportunities – In 2021, expect to be higher than maintenance level of $50 to $60 million per annum • Continue to pay down debt – YTD 3Q20, retired nearly $135 million of debt • Invest in organic growth opportunities – low capital, high ROIC investments • Pursue opportunistic M&A opportunities – will remain disciplined in our approach – The opportunity must: 1) have an enduring competitive advantage, 2) be a good cultural fit and be strategic or complementary, and 3) generate a cash-on-cash return in excess of 10% initially and have the ability to grow organically • Return capital to shareholders – In the absence of organic growth and acquisition opportunities, will consider return of excess cash via share repurchases and/or special dividends |
| 17 Investor Presentation │November 18, 2020 Appendix |
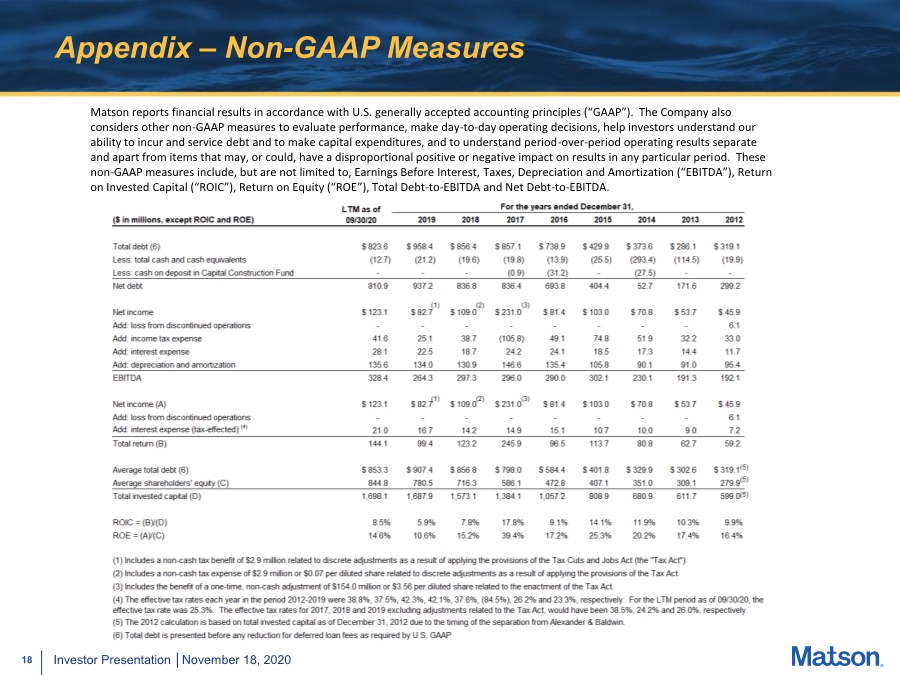
| 18 Investor Presentation │November 18, 2020 Appendix – Non-GAAP Measures Matson reports financial results in accordance with U.S. generally accepted accounting principles (“GAAP”). The Company also considers other non-GAAP measures to evaluate performance, make day-to-day operating decisions, help investors understand our ability to incur and service debt and to make capital expenditures, and to understand period-over-period operating results separate and apart from items that may, or could, have a disproportional positive or negative impact on results in any particular period. These non-GAAP measures include, but are not limited to, Earnings Before Interest, Taxes, Depreciation and Amortization (“EBITDA”), Return on Invested Capital (“ROIC”), Return on Equity (“ROE”), Total Debt-to-EBITDA and Net Debt-to-EBITDA. |