Attached files
| file | filename |
|---|---|
| 8-K - FORM 8-K - HERITAGE COMMERCE CORP | tm2036256-1_8k.htm |
Exhibit 99.1

Keefe, Bruyette & Woods Virtual West Coast Field Trip November 18, 2020 1
2 Forward Looking Statement Disclaimer Forward - looking statements are based on management’s knowledge and belief as of today and include information concerning Heritage Commerce Corp, the holding company (the “Company” or “Heritage”) for Heritage Bank of Commerce (the “Bank”), possible or assumed future financial condition, and its results of operations, business and earnings outlook. These forward - looking statements are subject to risks and uncertainties. For a discussion of risk factors which could cause results to differ, please see the Company’s reports on Forms 10 - K and 10 - Q as filed with the Securities and Exchange Commission and the Company’s press releases. Readers should not place undue reliance on the forward - looking statements, which reflect management's view only as of the date hereof. The Company undertakes no obligation to publicly revise these forward - looking statements to reflect subsequent events or circumstances.
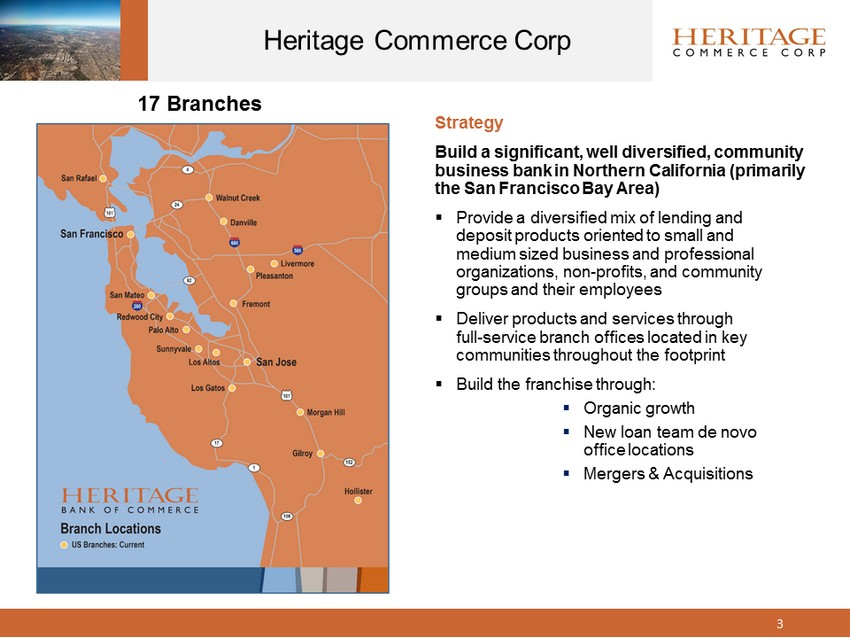
3 Heritage Commerce Corp Strategy Build a significant, well diversified, community business bank in Northern California (primarily the San Francisco Bay Area) ▪ Provide a diversified mix of lending and deposit products oriented to small and medium sized business and professional organizations, non - profits, and community groups and their employees ▪ Deliver products and services through full - service branch offices located in key communities throughout the footprint ▪ Build the franchise through: ▪ Organic growth ▪ New loan team de novo office locations ▪ Mergers & Acquisitions 17 Branches
4 Heritage Commerce Corp Profile History: ▪ Heritage Bank of Commerce, a community business bank founded in 1994 headquartered in San Jose, California ▪ Heritage Commerce Corp, a California corporation organized in 1997, the holding company for Heritage Bank of Commerce Relationship Banking ▪ Offers a full range of banking services to small and medium sized businesses, professional organizations, non - profits, and community groups and their employees using a “Consultative” relationship banking approach Core Clientele ▪ Small to medium sized closely held businesses (and their principals and key employees) ▪ Professional organizations ▪ High net worth individuals ▪ Non - profits ▪ Community groups Specialty Expertise ▪ Small Business Administration (“SBA”) Lending and loan sales ▪ Dental Lending ▪ Corporate Finance/Asset - Based Lending ▪ Factoring ▪ Construction Lending ▪ Cash Management ▪ Non - profit organizations, education, and churches ▪ Homeowner Association Services (“HOA”)
5 Heritage Commerce Corp Recent Highlights ▪ Acquired Bay View Funding in 4Q14 ▪ Acquired Focus Business Bank in 3Q15 ▪ Acquired Tri - Valley Bank in 2Q18 ▪ Acquired United American Bank in 2Q18 ▪ Acquired Presidio Bank (“Presidio”) in 4Q19 (the largest acquisition in our history) ▪ Presidio Bank systems and integration successfully completed in 1Q20 ▪ Funded SBA Payroll Protection Program (“PPP”) loans totaling $325 million at the end of 2Q20
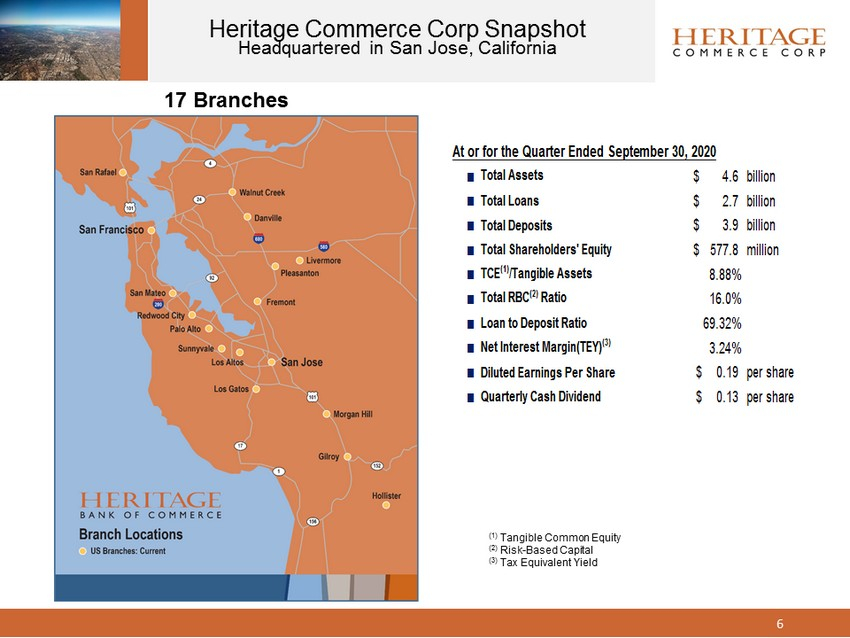
6 Heritage Commerce Corp Snapshot Headquartered in San Jose, California 17 Branches (1) Tangible Common Equity (2) Risk - Based Capital (3) Tax Equivalent Yield At or for the Quarter Ended September 30, 2020 n Total Assets 4.6$ billion n Total Loans 2.7$ billion n Total Deposits 3.9$ billion n Total Shareholders' Equity 577.8$ million n TCE (1) /Tangible Assets 8.88% n Total RBC (2) Ratio 16.0% n Loan to Deposit Ratio 69.32% n Net Interest Margin(TEY) (3) 3.24% n Diluted Earnings Per Share 0.19$ per share n Quarterly Cash Dividend 0.13$ per share
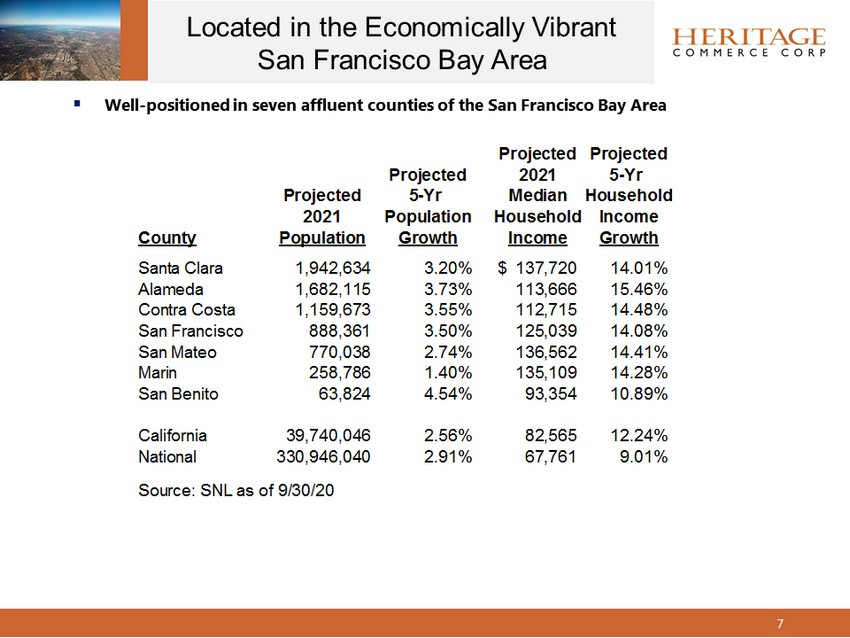
Projected Projected Projected 2021 5-Yr Projected 5-Yr Median Household 2021 Population Household Income County Population Growth Income Growth Santa Clara 1,942,634 3.20% 137,720$ 14.01% Alameda 1,682,115 3.73% 113,666 15.46% Contra Costa 1,159,673 3.55% 112,715 14.48% San Francisco 888,361 3.50% 125,039 14.08% San Mateo 770,038 2.74% 136,562 14.41% Marin 258,786 1.40% 135,109 14.28% San Benito 63,824 4.54% 93,354 10.89% California 39,740,046 2.56% 82,565 12.24% National 330,946,040 2.91% 67,761 9.01% Source: SNL as of 9/30/20 ▪ Well - positioned in seven affluent counties of the San Francisco Bay Area Located in the Economically Vibrant San Francisco Bay Area 7
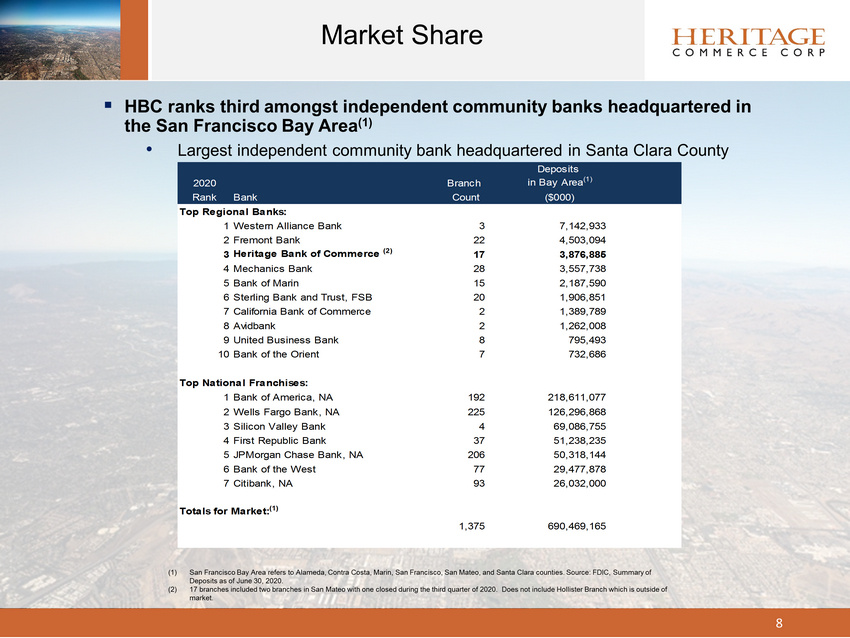
8 Market Share ▪ HBC ranks third amongst Independent Community Banks headquartered in the San Francisco Bay Area (1) • Largest independent community bank headquartered in Santa Clara County (1) San Francisco Bay Area refers to Alameda, Contra Costa, Marin, San Francisco, San Mateo, and Santa Clara counties. Source: FDIC, Sum mary of Deposits as of June 30, 2020. (2) 17 branches included two branches in San Mateo with one closed during the third quarter of 2020. Does not include Hollister Branch which is outside of market. Deposits 2020 Branch in Bay Area (1) Rank Bank Count ($000) Top Regional Banks: 1Western Alliance Bank 3 7,142,933 2Fremont Bank 22 4,503,094 3 Heritage Bank of Commerce (2) 17 3,876,885 4Mechanics Bank 28 3,557,738 5Bank of Marin 15 2,187,590 6Sterling Bank and Trust, FSB 20 1,906,851 7California Bank of Commerce 2 1,389,789 8Avidbank 2 1,262,008 9United Business Bank 8 795,493 10Bank of the Orient 7 732,686 Top National Franchises: 1Bank of America, NA 192 218,611,077 2Wells Fargo Bank, NA 225 126,296,868 3Silicon Valley Bank 4 69,086,755 4First Republic Bank 37 51,238,235 5JPMorgan Chase Bank, NA 206 50,318,144 6Bank of the West 77 29,477,878 7Citibank, NA 93 26,032,000 Totals for Market: (1) 1,375 690,469,165
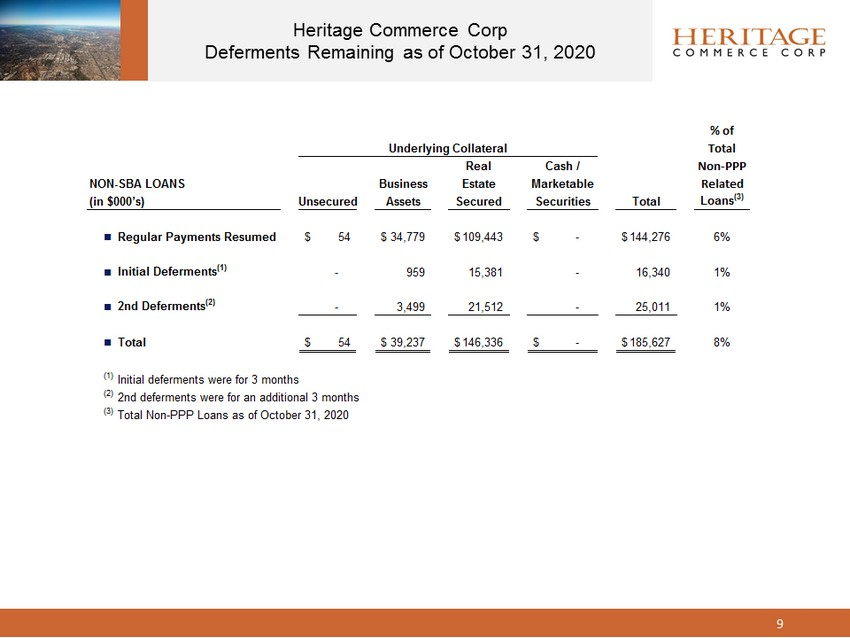
Heritage Commerce Corp Deferments Remaining as of October 31, 2020 9 % of Underlying Collateral Total Real Cash / Non-PPP NON-SBA LOANS Business Estate Marketable Related (in $000’s) Unsecured Assets Secured Securities Total Loans (3) n Regular Payments Resumed 54$ 34,779$ 109,443$ -$ 144,276$ 6% n Initial Deferments (1) - 959 15,381 - 16,340 1% n 2nd Deferments (2) - 3,499 21,512 - 25,011 1% n Total 54$ 39,237$ 146,336$ -$ 185,627$ 8% (1) Initial deferments were for 3 months (2) 2nd deferments were for an additional 3 months (3) Total Non-PPP Loans as of October 31, 2020
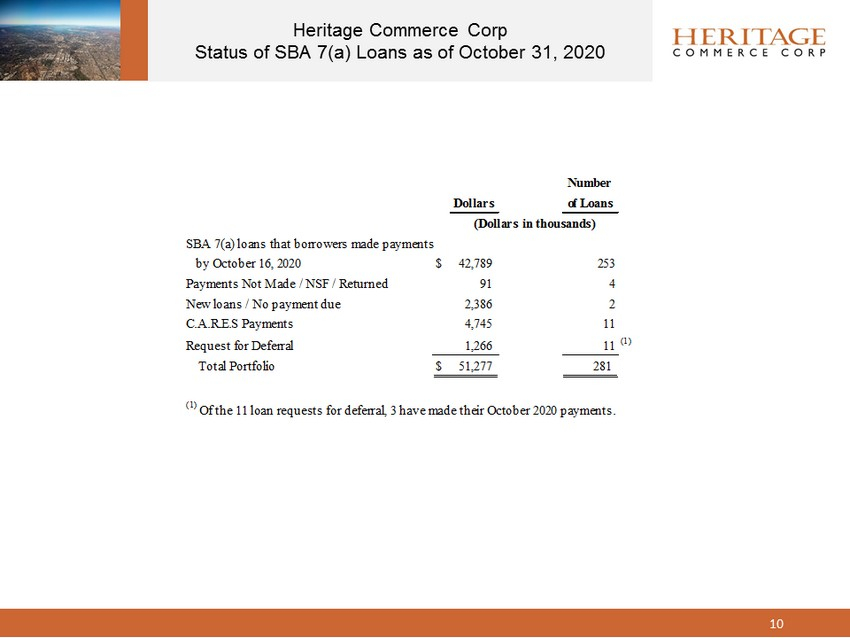
Heritage Commerce Corp Status of SBA 7(a) Loans as of October 31, 2020 10 Number Dollars of Loans SBA 7(a) loans that borrowers made payments by October 16, 2020 $ 42,789 253 Payments Not Made / NSF / Returned 91 4 New loans / No payment due 2,386 2 C.A.R.E.S Payments 4,745 11 Request for Deferral 1,266 11 (1) Total Portfolio $ 51,277 281 (Dollars in thousands) (1) Of the 11 loan requests for deferral, 3 have made their October 2020 payments.
11 2020 Significant Events ▪ Current E xpected C redit L osses (“CECL”) methodology adopted January 1, 2020 ▪ Effective January 1, 2020, the Company incurred a $ 6.2 Million (net of $2.4 mil of tax) reduction to retained earnings ▪ Provisions for credit losses were $ 13.3 million in Q1 driven primarily by a significantly deteriorating economic outlook resulting from the Coronavirus pandemic; $1.1 million in Q2 and $197,000 in Q3 under the CECL methodology ▪ The total provision for credit losses on loans was $14.6 million for the nine months ended September 30, 2020. ▪ Presidio Bank integration ▪ The Company completed the acquisition by its wholly - owned bank subsidiary, Heritage Bank of Commerce, of Presidio Bank effective October 11, 2019. ▪ Presidio’s asset base, at the time of the acquisition, was $904.5 million, with $686.0 million in net loans and $774.3 million in deposits, at fair value, making it by far the largest in the Company’s history and the results of its operations were included in the Company’s results of operations beginning October 12, 2019. ▪ The system conversion and operational integration of Presidio was successfully completed in the first quarter of 2020. ▪ Since March 15, 2020, management took a number of steps to help protect the safety and well - being of our customers, employees and communities due to the Coronavirus (COVID - 19). ▪ Invoked protocols of well established “Pandemic Response” section of Disaster Recovery Plan. ▪ Approximately 75% of staff moved to working remotely through robust remote access system capability. ▪ Established social distancing protocols within our bank premises and branches for required “In Premise” employees and all customers . ▪ All branches remain open to serve our customers and communities but with a “Maximum Two Clients at a Time” entry, “Masks Required” and “Marked 6 Foot Spacing” to ensure “Social Distancing”. ▪ Operating in compliance with all county Health Directives including all branch personnel (and customers, if required), being supplied with, among other PPE, masks, gloves and sanitizer . ▪ In the third quarter of 2020, the Company relocated its corporate headquarters, San Jose Branch and factoring subsidiary, Bay View Funding, to 224 Airport Parkway, San Jose, California. ▪ This new facility allows us to cost effectively consolidate many of the Bank’s dispersed operating units into a single location to better support our customers, community partners and the entire Heritage organization .
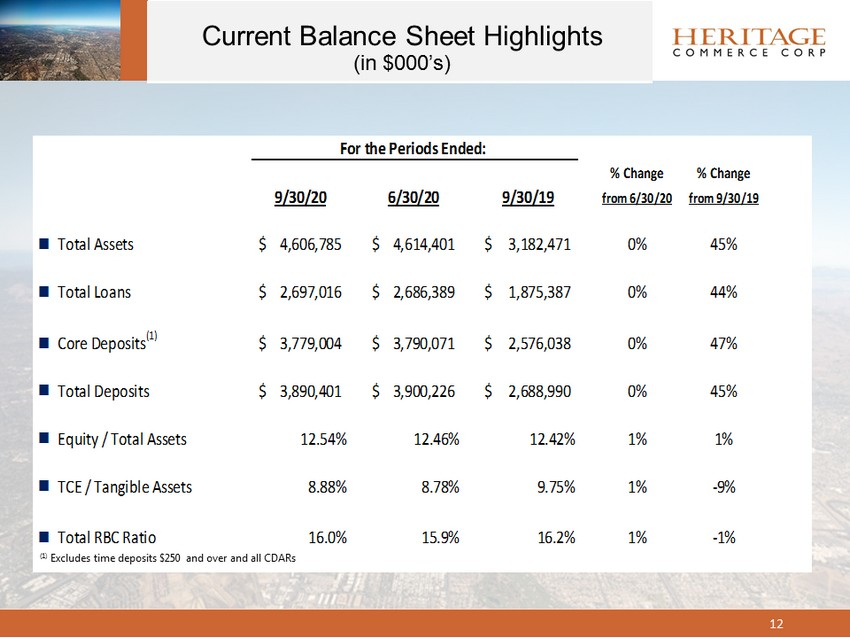
12 Current Balance Sheet Highlights ( in $000’s ) % Change % Change 9/30/20 6/30/20 9/30/19 from 6/30/20 from 9/30/19 n Total Assets 4,606,785$ 4,614,401$ 3,182,471$ 0% 45% n Total Loans 2,697,016$ 2,686,389$ 1,875,387$ 0% 44% n Core Deposits (1) 3,779,004$ 3,790,071$ 2,576,038$ 0% 47% n Total Deposits 3,890,401$ 3,900,226$ 2,688,990$ 0% 45% n Equity / Total Assets 12.54% 12.46% 12.42% 1% 1% n TCE / Tangible Assets 8.88% 8.78% 9.75% 1% -9% n Total RBC Ratio 16.0% 15.9% 16.2% 1% -1% For the Periods Ended: (1) Excludes time deposits $250 and over and all CDARs
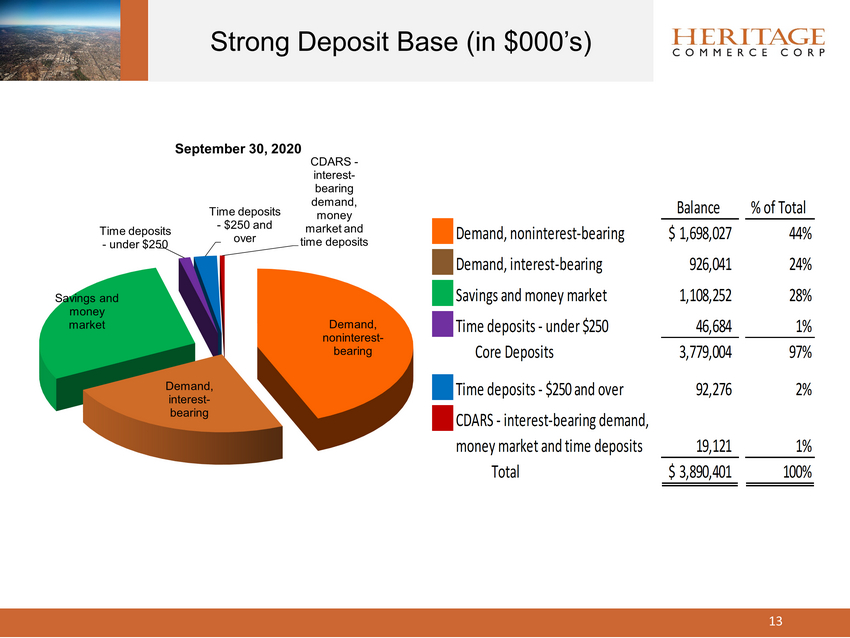
Demand, noninterest - bearing Demand, interest - bearing Savings and money market Time deposits - under $250 Time deposits - $250 and over CDARS - interest - bearing demand, money market and time deposits September 30, 2020 Balance % of Total Demand, noninterest-bearing 1,698,027$ 44% Demand, interest-bearing 926,041 24% Savings and money market 1,108,252 28% Time deposits - under $250 46,684 1% Core Deposits 3,779,004 97% Time deposits - $250 and over 92,276 2% CDARS - interest-bearing demand, money market and time deposits 19,121 1% Total 3,890,401$ 100% Strong Deposit Base (in $000’s) 13
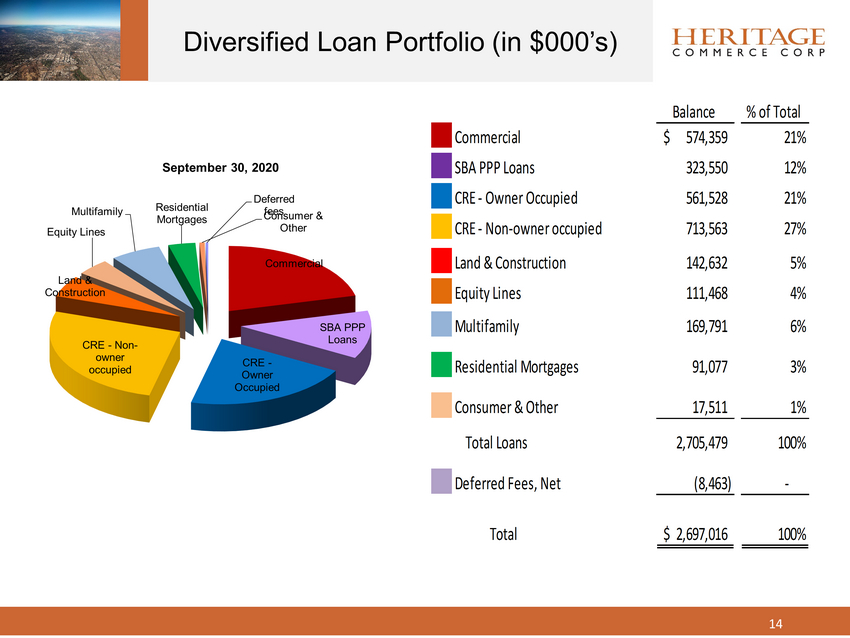
Commercial SBA PPP Loans CRE - Owner Occupied CRE - Non - owner occupied Land & Construction Equity Lines Multifamily Residential Mortgages Consumer & Other Deferred fees September 30, 2020 Diversified Loan Portfolio (in $000’s) 14 Balance % of Total Commercial 574,359$ 21% SBA PPP Loans 323,550 12% CRE - Owner Occupied 561,528 21% CRE - Non-owner occupied 713,563 27% Land & Construction 142,632 5% Equity Lines 111,468 4% Multifamily 169,791 6% Residential Mortgages 91,077 3% Consumer & Other 17,511 1% Total Loans 2,705,479 100% Deferred Fees, Net (8,463) - Total 2,697,016$ 100%
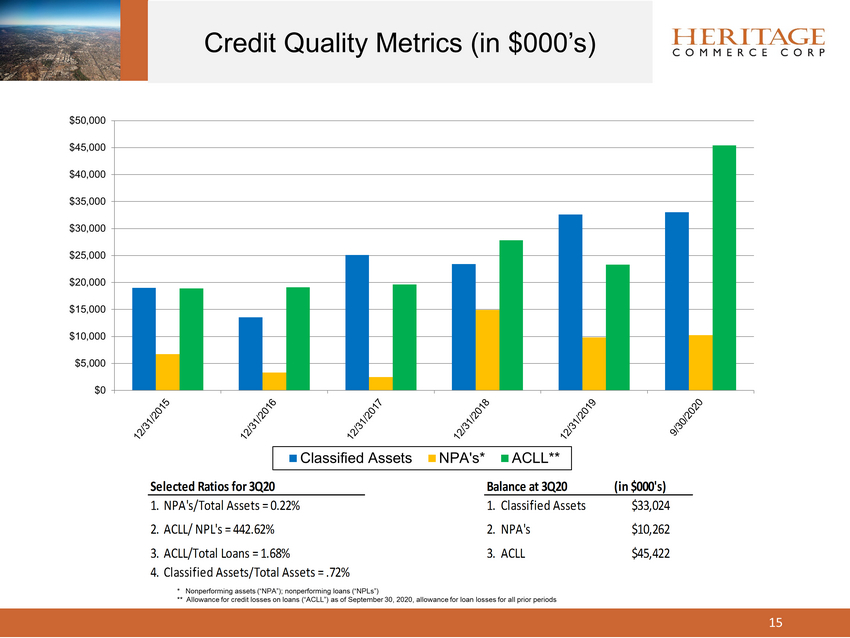
$0 $5,000 $10,000 $15,000 $20,000 $25,000 $30,000 $35,000 $40,000 $45,000 $50,000 Classified Assets NPA's* ALLL** Selected Ratios for 3Q20 Balance at 3Q20 (in $000's) 1.NPA's/Total Assets = 0.22% 1.Classified Assets $33,024 2.ACLL/ NPL's = 442.62% 2.NPA's $10,262 3.ACLL/Total Loans = 1.68% 3.ACLL $45,422 4.Classified Assets/Total Assets = .72% Credit Quality Metrics (in $000’s) 15 * Nonperforming assets (“NPA”) ** Allowance for credit losses on loans (“ACLL”) as of September 30, 2020, allowance for loan losses for all prior periods
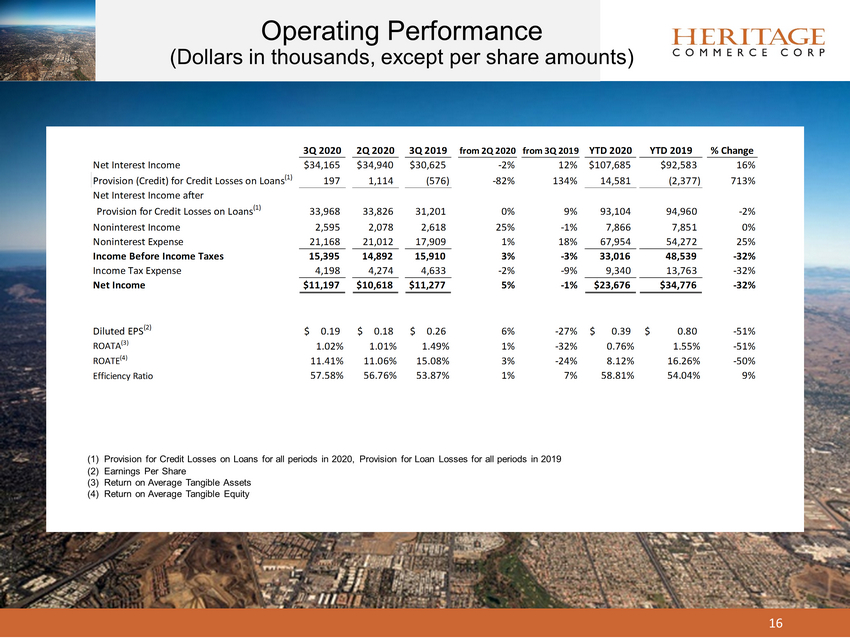
16 Operating Performance ( in $000’s ) (1) Provision for Credit Losses on Loans for all periods in 2020, Provision for Loan Losses for all periods in 2019 (2) Earnings Per Share ( 3 ) Return on Average Tangible Assets (4) Return on Average Tangible Equity 3Q 2020 2Q 2020 3Q 2019 from 2Q 2020 from 3Q 2019 YTD 2020 YTD 2019 % Change Net Interest Income $34,165 $34,940 $30,625 -2% 12% $107,685 $92,583 16% Provision (Credit) for Credit Losses on Loans (1) 197 1,114 (576) -82% 134% 14,581 (2,377) 713% Net Interest Income after Provision for Credit Losses on Loans (1) 33,968 33,826 31,201 0% 9% 93,104 94,960 -2% Noninterest Income 2,595 2,078 2,618 25% -1% 7,866 7,851 0% Noninterest Expense 21,168 21,012 17,909 1% 18% 67,954 54,272 25% Income Before Income Taxes 15,395 14,892 15,910 3% -3% 33,016 48,539 -32% Income Tax Expense 4,198 4,274 4,633 -2% -9% 9,340 13,763 -32% Net Income $11,197 $10,618 $11,277 5% -1% $23,676 $34,776 -32% Diluted EPS (2) 0.19$ 0.18$ 0.26$ 6% -27% 0.39$ 0.80$ -51% ROATA (3) 1.02% 1.01% 1.49% 1% -32% 0.76% 1.55% -51% ROATE (4) 11.41% 11.06% 15.08% 3% -24% 8.12% 16.26% -50% Efficiency Ratio 57.58% 56.76% 53.87% 1% 7% 58.81% 54.04% 9%
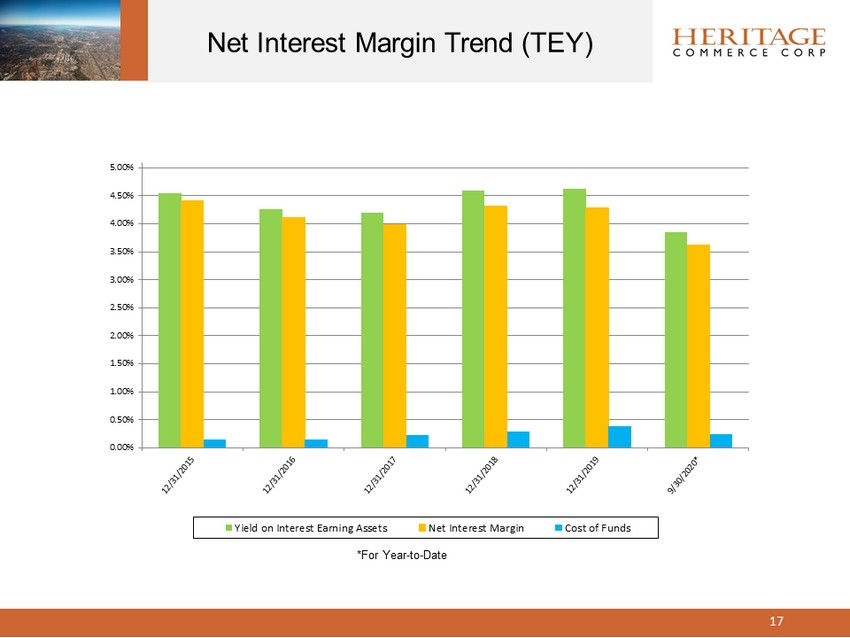
0.00% 0.50% 1.00% 1.50% 2.00% 2.50% 3.00% 3.50% 4.00% 4.50% 5.00% Yield on Interest Earning Assets Net Interest Margin Cost of Funds Net Interest Margin Trend (TEY) 17 *For Year - to - Date
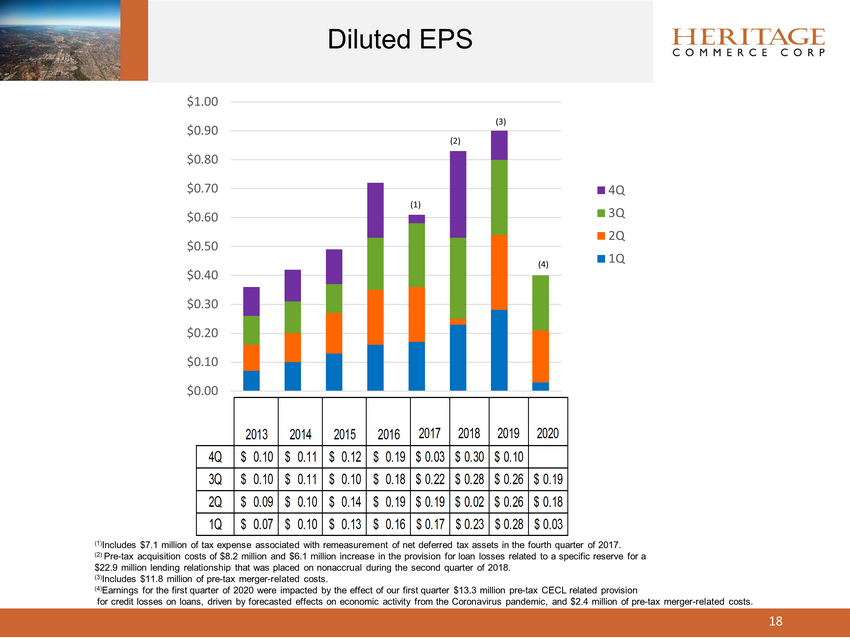
$0.00 $0.10 $0.20 $0.30 $0.40 $0.50 $0.60 $0.70 $0.80 $0.90 $1.00 4Q 3Q 2Q 1Q (1) (2) (4) 2013 2014 2015 2016 2017 2018 2019 2020 4Q 0.10$ 0.11$ 0.12$ 0.19$ 0.03$ 0.30$ 0.10$ 3Q 0.10$ 0.11$ 0.10$ 0.18$ 0.22$ 0.28$ 0.26$ 0.19$ 2Q 0.09$ 0.10$ 0.14$ 0.19$ 0.19$ 0.02$ 0.26$ 0.18$ 1Q 0.07$ 0.10$ 0.13$ 0.16$ 0.17$ 0.23$ 0.28$ 0.03$ (1) Includes $7.1 million of tax expense associated with remeasurement of net deferred tax assets in the fourth quarter of 2017 (2) Pre - tax acquisition costs of $8.2 million and $6.1 million increase in the provision for loan losses related to a specific reser ve for a $22.9 million lending relationship that was placed on nonaccrual during the second quarter of 2018. (3) Includes $11.8 million of pre - tax merger - related costs. (4) Earnings for the first quarter of 2020 were impacted by the effect of our first quarter $13.3 million pre - tax (“ CECL”) related provision for credit losses on loans, driven by forecasted effects on economic activity from the Coronavirus pandemic, and $2.4 million of pre - tax merger - related costs. Diluted EPS 18 (3)
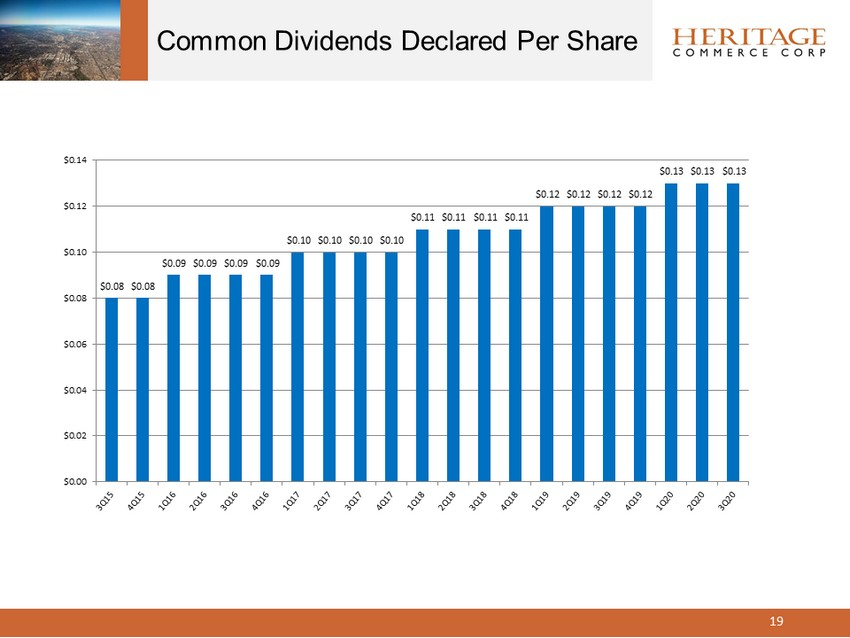
$0.08 $0.08 $0.09 $0.09 $0.09 $0.09 $0.10 $0.10 $0.10 $0.10 $0.11 $0.11 $0.11 $0.11 $0.12 $0.12 $0.12 $0.12 $0.13 $0.13 $0.13 $0.00 $0.02 $0.04 $0.06 $0.08 $0.10 $0.12 $0.14 Common Dividends Declared Per Share 19
▪ Small to medium size business customer relationship focus in vibrant economic geography ▪ Competitive loan and deposit/cash management products catering to businesses ▪ Diversified specialty business units ▪ Highly experienced management team throughout the company ▪ Solid capital and liquidity management • 16.0% total risk - based capital ratio under the Basel III regulatory requirements at 9/30/20 • 69.32% loan to deposit ratio at 9/30/20 • Quarterly common dividend at $ 0.13 per share in the third quarter of 2020 ▪ Excellent locations and markets with solid market share among community banks • 17 branch locations • HBC ranks third in deposit market share amongst independent community banks (1 ) • San Francisco and San Jose combined MSA’s are second in the state of California in households with income greater than $200,000 (1) Market refers to Alameda, Contra Costa, Marin, San Francisco, San Mateo, and Santa Clara counties. Source: FDIC, Summary of Deposits as of June 30, 2020. Positioned for Continued Growth in the San Francisco Bay Area 20
Michael E . Benito Executive Vice President Business Banking Manager 408 . 792 . 4085 Margo G . Butsch Executive Vice President Chief Credit Officer 408 . 200 . 8738 Jeffrey L . Javits Executive Vice President Chief Information Officer 408 . 494 . 4520 Robertson Clay Jones Executive Vice President President of Community Business Banking Group 408 . 792 . 4010 Lawrence D . McGovern Executive Vice President Chief Financial Officer 408 . 494 . 4562 Teresa L . Powell Executive Vice President Director of HOA & Deposit Services 408 . 200 . 8712 Keith A. Wilton President and Chief Executive Officer 408.494.4534 Deborah K. Reuter Executive Vice President Chief Risk Officer & Corporate Secretary 408.494.4542 Glen E. Shu Executive Vice President President of Specialty Finance Group 650.645.4834 May K . Y . Wong Executive Vice President Controller 408 . 494 . 4596 Management Team 21 Corporate Headquarters 224 Airport Parkway San Jose, CA 95110 NASDAQ: HTBK
For more information contact: Deborah K. Reuter Executive Vice President Chief Risk Officer & Corporate Secretary 408 - 494 - 4542 22