Attached files
| file | filename |
|---|---|
| EX-32.2 - EX-32.2 - HERITAGE COMMERCE CORP | a2202355zex-32_2.htm |
| EX-31.1 - EX-31.1 - HERITAGE COMMERCE CORP | a2202355zex-31_1.htm |
| EX-12.1 - EX-12.1 - HERITAGE COMMERCE CORP | a2202355zex-12_1.htm |
| EX-31.2 - EX-31.2 - HERITAGE COMMERCE CORP | a2202355zex-31_2.htm |
| EX-99.2 - EX-99.2 - HERITAGE COMMERCE CORP | a2202355zex-99_2.htm |
| EX-32.1 - EX-32.1 - HERITAGE COMMERCE CORP | a2202355zex-32_1.htm |
| EX-99.1 - EX-99.1 - HERITAGE COMMERCE CORP | a2202355zex-99_1.htm |
| EX-23.1 - EX-23.1 - HERITAGE COMMERCE CORP | a2202355zex-23_1.htm |
UNITED STATES
SECURITIES AND EXCHANGE COMMISSION
Washington, D.C. 20549
FORM 10-K
| (MARK ONE) | ||
ý |
ANNUAL REPORT PURSUANT TO SECTION 13 OR 15(d) OF THE SECURITIES EXCHANGE ACT OF 1934 |
|
For the fiscal year ended December 31, 2010 |
||
OR |
||
o |
TRANSITION REPORT PURSUANT TO SECTION 13 OR 15(d) OF THE SECURITIES EXCHANGE ACT OF 1934 |
|
FOR THE TRANSITION PERIOD FROM TO |
||
Commission file number 000-23877
Heritage Commerce Corp
(Exact name of Registrant as Specified in its Charter)
| California (State or Other Jurisdiction of Incorporation or Organization) |
77-0469558 (I.R.S. Employer Identification Number) |
|
150 Almaden Boulevard San Jose, California 95113 (Address of Principal Executive Offices including Zip Code) |
||
(408) 947-6900 (Registrant's Telephone Number, Including Area Code) |
||
Securities registered pursuant to Section 12(b) of the Act:
| Title of Each Class | Name of Each Exchange on which Registered | |
|---|---|---|
| Common Stock, no par value | The NASDAQ Stock Market |
Securities registered pursuant to Section 12(g) of the Act: None
Indicate by check mark if the registrant is a well-known seasoned issuer, as defined in Rule 405 of the Securities Act. Yes o No ý
Indicate by check mark if the registrant is not required to file reports pursuant to Section 13 or I5(d) of the Act. Yes o No ý
Indicate by check mark whether the registrant (1) has filed all reports required to be filed by Section 13 or 15(d) of the Securities Exchange Act of 1934 during the preceding 12 months (or for such shorter period that the registrant was required to file such reports), and (2) has been subject to such filing requirements for the past 90 days. Yes ý No o
Indicate by check mark whether the registrant has submitted electronically and posted on its corporate Web site, if any, every Interactive Data File required to be submitted and posted pursuant to Rule 405 of Regulation S-T (§ 232.405 of this chapter) during the preceding 12 months (or for such shorter period that the Registrant was required to submit and post such files). Yes o No o
Indicate by check mark if disclosure of delinquent filers pursuant to Item 405 of Regulation S-K is not contained herein, and will not be contained, to the best of Registrant's knowledge, in definitive proxy or information statements incorporated by reference in Part III of this Form 10-K, or any amendment to this Form 10-K. ý
Indicate by check mark whether the Registrant is a large accelerated filer, an accelerated filer, a non-accelerated filer, or a smaller reporting company. See the definitions of "large accelerated filer", "accelerated filer" and "small reporting company" in Rule 12b-2 of the Exchange Act.
| Large accelerated filer o | Accelerated filer o | Non-accelerated filer o (Do not check if a smaller reporting company) |
Smaller reporting company ý |
Indicate by check mark whether the registrant is a shell company (as defined in Rule 12b-2 of the Act). Yes o No ý
The aggregate market value of the common stock held by non-affiliates of the Registrant as of June 30, 2010, based upon the closing price on that date of $3.67 per share, and 9,661,348 shares held, as reported on the NASDAQ Global Select Market, was approximately $35.5 million.
As of February 15, 2011, there were 26,233,001 shares of the Registrant's common stock (no par value) outstanding.
DOCUMENTS INCORPORATED BY REFERENCE
Portions of the Registrant's definitive proxy statement to be filed with the Securities and Exchange Commission pursuant to Regulation 14A in connection with the 2011 Annual Meeting of Shareholders to be held on May 26, 2011 are incorporated by reference into Part III of this Report. The proxy statement will be filed with the Securities and Exchange Commission not later than 120 days after the Registrant's fiscal year ended December 31, 2010.
HERITAGE COMMERCE CORP
INDEX TO ANNUAL REPORT ON FORM 10-K
FOR YEAR ENDED DECEMBER 31, 2010
1
Cautionary Note Regarding Forward-Looking Statements
This Report on Form 10-K contains various statements that may constitute forward-looking statements within the meaning of Section 27A of the Securities Act of 1933, as amended, and Section 21E of the Securities Exchange Act of 1934, as amended, and are intended to be covered by the safe harbor provisions of the Private Securities Litigation Reform Act of 1995. Any statements about our expectations, beliefs, plans, objectives, assumptions or future events or performance are not historical facts and may be forward-looking. These forward-looking statements often can be, but are not always, identified by the use of words such as "assume," "expect," "intend," "plan," "project," "believe," "estimate," "predict," "anticipate," "may," "might," "should," "could," "goal," "potential" and similar expressions. We base these forward-looking statements on our current expectations and projections about future events, our assumptions regarding these events and our knowledge of facts at the time the statements are made. These statements include statements relating to our projected growth, anticipated future financial performance, and management's long-term performance goals, as well as statements relating to the anticipated effects on results of operations and financial condition.
These forward-looking statements are subject to various risks and uncertainties that may be outside our control and our actual results could differ materially from our projected results. In addition, our past results of operations do not necessarily indicate our future results. The forward-looking statements could be affected by many factors, including but not limited to:
- •
- Competition for loans and deposits and failure to attract or retain deposits and loans;
- •
- Local, regional, and national economic conditions and events and the impact they may have on us and our customers, and our
assessment of that impact on our estimates including, the allowance for loan losses;
- •
- Risks associated with concentrations in real estate related loans;
- •
- Changes in the level of nonperforming assets and charge-offs and other credit quality measures, and their
impact on the adequacy of the Company's allowance for loan losses and the Company's provision for loan losses;
- •
- The effects of and changes in trade, monetary and fiscal policies and laws, including the interest rate policies of the
Federal Open Market Committee of the Federal Reserve Board;
- •
- Stability of funding sources and continued availability of borrowings;
- •
- Our compliance with and the effects of the regulatory Written Agreement the Company and Heritage Bank of Commerce, its
subsidiary bank, have entered into with their regulators;
- •
- The effect of changes in laws and regulations with which the Company and Heritage Bank of Commerce must comply, including
any increase in FDIC insurance premiums;
- •
- Our ability to raise capital or incur debt on reasonable terms;
- •
- Regulatory limits on Heritage Bank of Commerce's ability to pay dividends to the Company;
- •
- Future legislative or administrative changes to the U.S. Treasury Capital Purchase Program enacted under the Emergency
Economic Stabilization Act of 2008;
- •
- The impact of the Emergency Economic Stabilization Act of 2008 and the American Recovery and Reinvestment Act of 2009 and related rules and regulations on our business operations and competitiveness, including the impact of executive compensation restrictions, which may affect our ability to retain and recruit executives in competition with other firms who do not operate under those restrictions;
2
- •
- The impact of the Dodd Frank Wall Street Reform and Consumer Protection Act signed by President Obama on July 21,
2010;
- •
- The effect of changes in accounting policies and practices, as may be adopted by the regulatory agencies, as well as the
Public Company Accounting Oversight Board, the Financial Accounting Standards Board and other accounting standard setters;
- •
- Changes in the deferred tax asset valuation allowance in future quarters;
- •
- The costs and effects of legal and regulatory developments, including resolution of legal proceedings or regulatory or
other governmental inquiries, and the results of regulatory examinations or reviews;
- •
- The ability to increase market share and control expenses; and
- •
- Our success in managing the risks involved in the foregoing items.
We are not able to predict all the factors that may affect future results. You should not place undue reliance on any forward looking statement, which speaks only as of the date of this Report on Form 10-K. Except as required by applicable laws or regulations, we do not undertake any obligation to update or revise any forward looking statement, whether as a result of new information, future events or otherwise.
General
Heritage Commerce Corp, a California corporation organized in 1997, is a bank holding company registered under the Bank Holding Company Act of 1956, as amended. We provide a wide range of banking services through Heritage Bank of Commerce, our wholly-owned subsidiary and our principal asset. Heritage Bank of Commerce is a California state-chartered bank headquartered in San Jose, California and has been conducting business since 1994.
Heritage Bank of Commerce is a multi-community independent bank that offers a full range of commercial banking services to small and medium-sized businesses and their owners, managers and employees. We operate through 10 full service branch offices located entirely in the southern and eastern regions of the general San Francisco Bay Area of California in the counties of Santa Clara, Alameda, and Contra Costa. Our market includes the headquarters of a number of technology based companies in the region commonly known as "Silicon Valley."
Our lending activities are diversified and include commercial, real estate, construction and land development, consumer and SBA guaranteed loans. We generally lend in markets where we have a physical presence through our branch offices and an SBA loan production office. We attract deposits throughout our market area with a customer-oriented product mix, competitive pricing, and convenient locations. We offer a wide range of deposit products for business banking and retail markets. We offer a multitude of other products and services to complement our lending and deposit services.
As a bank holding company, Heritage Commerce Corp is subject to the supervision of the Board of Governors of the Federal Reserve System (the "Federal Reserve"). We are required to file with the Federal Reserve reports and other information regarding our business operations and the business operations of our subsidiaries. As a California chartered bank, Heritage Bank of Commerce is subject to primary supervision, periodic examination, and regulation by the California Department of Financial Institutions ("DFI"), and by the Federal Reserve, as its primary federal regulator.
Our principal executive office is located at 150 Almaden Boulevard, San Jose, California 95113, telephone number: (408) 947-6900.
3
At December 31, 2010, we had consolidated assets of $1.25 billion, deposits of $993.9 million and shareholders' equity of $182.2 million.
When we use "we", "us", "our" or the "Company", we mean the Company on a consolidated basis with Heritage Bank of Commerce. When we refer to "HCC" or the "holding company", we are referring to Heritage Commerce Corp on a standalone basis. When we use "HBC", we mean Heritage Bank of Commerce on a standalone basis.
The Internet address of the Company's website is "http://www.heritagecommercecorp.com." The Company makes available free of charge through the Company's website, the Company's annual reports on Form 10-K, quarterly reports on Form 10-Q, current reports on Form 8-K and amendments to these reports. The Company makes these reports available on its website on the same day they appear on the Securities and Exchange Commission's (the "SEC") website.
Heritage Bank of Commerce
HBC is a California state-chartered bank headquartered in San Jose, California. It was incorporated in November 1993 and opened for business in January 1994. HBC operates through ten full service branch offices. The locations of HBC's current offices are:
| San Jose: | Administrative Office Main Branch 150 Almaden Boulevard San Jose, CA 95113 |
|
Fremont: |
Branch Office 3077 Stevenson Boulevard Fremont, CA 94538 |
|
Danville: |
Branch Office 387 Diablo Road Danville, CA 94526 |
|
Gilroy: |
Branch Office 7598 Monterey Street Suite 110 Gilroy, CA 95020 |
|
Los Altos: |
Branch Office 419 South San Antonio Road Los Altos, CA 95032 |
|
Los Gatos: |
Branch Office 15575 Los Gatos Boulevard Los Gatos, CA 95032 |
|
Morgan Hill: |
Branch Office 18625 Sutter Boulevard Morgan Hill, CA 95037 |
|
Mountain View: |
Branch Office 175 E. El Camino Real Mountain View, CA 94040 |
4
| Pleasanton: | Branch Office 300 Main Street Pleasanton, CA 94566 |
|
Walnut Creek: |
Branch Office 101 Ygnacio Valley Road Suite 100 Walnut Creek, CA 94596 |
HBC is a full-service community bank offering an array of banking products and services to the communities it serves, including accepting time and demand products and originating commercial loans, commercial real estate loans, construction loans, and small business and consumer loans.
Lending Activities
Our commercial loan portfolio is comprised of operating secured loans advanced for working capital, equipment purchases and other business purposes. Generally short-term loans have maturities ranging from thirty days to one year, and "term loans" have maturities ranging from one to five years. Short-term business loans are generally intended to finance current transactions and typically provide for periodic principal payments, with interest payable monthly. Term loans generally provide for floating or fixed interest rates, with monthly payments of both principal and interest. Repayment of secured commercial loans depends substantially on the borrower's underlying business, financial condition and cash flows, as well as the sufficiency of the collateral. Compared to real estate, the collateral may be more difficult to monitor, evaluate and sell. It may also depreciate more rapidly than real estate. Such risks can be significantly affected by economic conditions. HBC's commercial loans are originated for in locally-oriented commercial activities in communities where HBC has a physical presence through its branch offices and loan production office.
HBC actively engages in Small Business Administration ("SBA") lending. HBC has been designated as an SBA Preferred Lender since 1999.
The commercial real estate loan portfolio is comprised of loans secured by commercial real estate. These loans are generally advanced based on the borrower's cash flow, and the underlying collateral provides a secondary source of payment. HBC generally restricts real estate term loans to no more than 75% of the property's appraised value or the purchase price of the property, depending on the type of property and its utilization. HBC offers both fixed and floating rate loans. Maturities on such loans are generally restricted to between five and ten years (with amortization ranging from fifteen to twenty-five years and a balloon payment due at maturity); however, SBA and certain real estate loans that can be sold in the secondary market may be advanced for longer maturities. Commercial real estate loans typically involve large balances to single borrowers or groups of related borrowers. Since payments on these loans are often dependent on the successful operation or management of the properties, as well as the business and financial condition of the borrower, repayment of such loans may be subject to adverse conditions in the real estate market, adverse economic conditions or changes in applicable government regulations. If the cash flow from the project decreases, or if leases are not obtained or renewed, the borrower's ability to repay the loan may be impaired.
We make commercial construction loans for rental properties, commercial buildings and homes built by developers on speculative, undeveloped property. The terms of commercial construction loans are made in accordance with our commercial loan policy. Advances on construction loans are made in accordance with a schedule reflecting the cost of construction, but are generally limited to a 75% loan-to-completed-appraised-value ratio. Repayment of construction loans on non-residential properties is normally expected from the property's eventual rental income, income from the borrower's operating entity or the sale of the subject property. In the case of income-producing property, repayment is usually expected from permanent financing upon completion of construction. At times we provide the permanent mortgage financing on our
5
construction loans on income-producing property. Construction loans are interest-only loans during the construction period, which typically do not exceed 12 months. If HBC provides permanent financing the short-term loan converts to permanent, amortizing financing following the completion of construction. Generally, before making a commitment to fund a construction loan, we require an appraisal of the property by a state-certified or state-licensed appraiser. We review and inspect properties before disbursement of funds during the term of the construction loan. The repayment of construction loans is dependent upon the successful and timely completion of the construction of the subject property, as well as the sale of the property to third parties or the availability of permanent financing upon completion of all improvements. Construction loans expose us to the risk that improvements will not be completed on time, and in accordance with specifications and projected costs. Construction delays, the financial impairment of the builder, interest rate increases or economic downturn may further impair the borrower's ability to repay the loan. In addition, the borrower may not be able to obtain permanent financing or ultimate sale or rental of the property may not occur as anticipated. HBC utilizes underwriting guidelines to assess the likelihood of repayment from sources such as sale of the property or permanent mortgage financing prior to making the construction loan.
Our home equity line portfolio is comprised of home equity lines to customers in our markets. Home equity lines of credit are underwritten in a manner such that they result in credit risk that is substantially similar to that of residential mortgage loans. Nevertheless, home equity lines of credit have greater credit risk than residential mortgage loans because they are often secured by mortgages that are subordinated to the existing first mortgage on the property, which we may or may not hold, and they are not covered by private mortgage insurance coverage.
The consumer loan portfolio includes miscellaneous consumer loans including loans for financing automobiles, various consumer goods and other personal purposes. Consumer loans are generally secured. Repossessed collateral for a defaulted consumer loan may not provide an adequate source of repayment for the outstanding loan, and the remaining deficiency may not warrant further substantial collection efforts against the borrower. In addition, consumer loan collections are dependent on the borrower's continued financial stability, which can be adversely affected by job loss, divorce, illness or personal bankruptcy. Furthermore, the application of various federal and state laws, including federal and state bankruptcy and insolvency laws, may limit the amount which can be recovered on such loans.
As of December 31, 2010, the percentage of our total loans for each of the principal areas in which we directed our lending activities were as follows: (i) commercial and industrial 45% (including SBA loans), (ii) real estate secured loans 40%, (iii) land and construction loans 7%, and (iv) consumer (including home equity) 8%. While no specific industry concentration is considered significant, our lending operations are located in market areas dependent on technology and real estate industries and their supporting companies.
Investments
Our investment policy is established by the Board of Directors. The general investment strategies are developed and authorized by our Finance and Investment Committee of the Board of Directors. The investment policy is reviewed annually by the Finance and Investment Committee, and any changes to the policy are subject to approval by the full Board of Directors. The overall objectives of the investment policy are to maintain a portfolio of high quality and diversified investments to maximize interest income over the long term and to minimize risk, to provide collateral for borrowings, to provide additional earnings when loan production is low. The policy dictates that investment decisions give consideration to the safety of principal, liquidity requirements and interest rate risk management. All securities transactions are reported to the Board of Directors' Finance and Investment Committee on a monthly basis.
6
Sources of Funds
Deposits traditionally have been our primary source of funds for our investment and lending activities. We also are able to borrow from the Federal Home Loan Bank of San Francisco to supplement cash flow needs. Our additional sources of funds are scheduled loan payments, maturing investments, loan repayments, income on other earning assets and the proceeds of loan sales.
Interest rates, maturity terms, service fees and withdrawal penalties are established on a periodic basis. Deposit rates and terms are based primarily on current operating strategies and market interest rates, liquidity requirements and our deposit growth goals.
We offer a wide range of deposit products for retail and business banking markets including checking accounts, interest-bearing transaction accounts, savings accounts, time deposits and retirement accounts. Our branch network enables us to attract deposits from throughout our market area with a customer-oriented product mix, competitive pricing, and convenient locations. HBC joined the Certificate of Deposit Account Registry Service (CDARS®) program in August 2008, which enables our local customers to obtain expanded FDIC insurance coverage on their deposits. At December 31, 2010, HBC had approximately 15,600 deposit accounts totaling $993.9 million, including brokered deposits, compared to 15,700 deposit accounts totaling approximately $1.09 billion as of December 31, 2009.
Other Banking Services
We offer a multitude of other products and services to complement our lending and deposit services. These include cashier's checks, traveler's checks, bank-by-mail, ATM, night depository, safe deposit boxes, direct deposit, automated payroll services, electronic funds transfers, online banking, online bill pay, and other customary banking services. HBC currently operates ATMs at six different locations. In addition, we have established a convenient customer service group accessible by toll-free telephone to answer questions and promote a high level of customer service. HBC does not have a trust department. In addition to the traditional financial services offered, HBC offers remote deposit capture, automated clearing house origination, electronic data interchange and check imaging. HBC continues to investigate products and services that it believes address the growing needs of its customers and to analyze other markets for potential expansion opportunities.
U.S. Treasury Capital Purchase Program
On November 21, 2008, HCC issued 40,000 shares of Series A Fixed Rate Cumulative Perpetual Preferred Stock ("Series A Preferred Stock") to the U.S. Treasury under the terms of the U.S. Treasury Capital Purchase Program for $40.0 million with a liquidation preference of $1,000 per share. The Series A Preferred Stock carries a coupon of 5% for five years and 9% thereafter. The Series A Preferred Stock is non-voting, cumulative, and perpetual and may be redeemed at 100% of its liquidation preference plus accrued and unpaid dividends. In addition, HCC issued a warrant to the U.S. Treasury to purchase 462,963 shares of HCC's common stock. The warrant is exercisable immediately at a price of $12.96 per share, will expire after a period of 10 years from issuance and is transferable by the U.S. Treasury. The U.S. Treasury may transfer a portion or portions of the warrant, and/or exercise the warrant at any time. The U.S. Treasury has agreed not to exercise voting power with respect to any common shares issued to it upon exercise of the warrant. At December 31, 2010, there had been no changes to the number of common shares covered by the warrant nor had the U.S. Treasury exercised any portion of the warrant.
Under the terms of the Capital Purchase Program, HCC is prohibited from increasing dividends above $0.08 per share on its common stock, and from making certain repurchases of equity securities, including its common stock, without the U.S. Treasury's consent. Furthermore, as long as the preferred stock issued to the U.S. Treasury is outstanding, dividend payments and repurchases or redemptions relating to certain equity securities, including HCC's common stock, are prohibited until all accrued and unpaid dividends are paid on the Series A Preferred Stock. As permitted under the terms of the Series A Preferred Stock, HCC
7
suspended the payment of dividends on its Series A Preferred Stock in November 2009. HCC is further restricted from paying dividends on the Series A Preferred Stock under its Written Agreement with its regulators. Under the terms of the Written Agreement, HCC may not pay any dividends on its capital stock, including preferred stock without the prior approval of its regulators. As a result, HCC has accrued but has not paid approximately $2.8 million in dividends on its Series A Preferred Stock as of December 31, 2010. On February 15, 2011, HCC suspended payment of dividends on the Series A Preferred Stock for the sixth consecutive quarter, and therefore, the U.S. Treasury has the right to appoint two members to the Company's Board of Directors. If the U.S. Treasury exercises its rights, these directors would serve on the Company's Board of Directors until such time as the Company has paid in full all dividends not previously paid. So long as payment of dividends on the Series A Preferred Stock remain suspended, we may not, among other things and with limited exceptions, pay cash dividends on or repurchase our common stock or preferred stock. Effective during the first quarter of 2011, the Company has permitted the U.S. Treasury to allow an observer employed by the U. S. Treasury to attend meetings of the Company's Board of Directors.
Regulatory Action
On February 17, 2010, HCC and HBC entered into a Written Agreement with the Federal Reserve Bank of San Francisco and the California Department of Financial Institutions ("DFI"). Under the terms of the Written Agreement, the Company must obtain the prior written approval of the Federal Reserve and DFI before it may (i) declare or pay any dividends on common stock or preferred stock; (ii) make any distributions of principal or interest on HCC's outstanding trust preferred securities and related subordinated debt; (iii) incur, increase or guarantee any debt; (iv) redeem any outstanding stock; or (v) take dividends or any other form of payment that represents a reduction in capital from HBC. The Written Agreement required the Company to submit written plans within certain timeframes to the Federal Reserve and the DFI that addresses the following items (i) strengthening credit risk management practices; (ii) improving HBC's position with respect to problem loans in excess of $2 million; (iii) maintaining adequate reserves for loan and lease losses; (iv) maintaining sufficient capital at HCC and HBC; (v) improving the management of HBC's liquidity position and funds management practices; and (vi) improving the Company's earnings and overall condition through a business plan and budget.
In addition, the Written Agreement (i) required HBC's Board of Directors or a designated committee thereof to approve any extension, renewal or restructuring of any credit to any borrower whose loans have been "criticized"; (ii) requires HBC to charge off loans classified as "loss" by the Federal Reserve and/or DFI; (iii) requires the Company to notify the Federal Reserve and DFI no more than 30 days after the end of any quarter in which the capital ratios of HCC or HBC fall below the approved capital plan' minimum levels; (iv) requires HCC and HBC to comply with the notice provisions of Section 32 of the Federal Deposit Insurance Act and Subpart H of Regulation Y of the Board of Governors of the Federal Reserve System in connection with appointing any new director or senior executive officer or changing the responsibilities of any senior executive officer so that the officer would assume a different senior executive officer position; (v) requires HCC and HBC to comply with the restrictions on indemnification and severance payments of Section 18(k) of the Federal Deposit Insurance Act and Part 359 of the FDIC's regulations; and (vi) requires the Company to provide quarterly progress reports to the Federal Reserve and the DFI.
The Board of Directors and management of the Company are committed to addressing and resolving the matters raised in the Written Agreement on a timely basis and actions have been undertaken to comply with the various items addressed by the Written Agreement. A joint compliance committee was formed by the Board of Directors in February 2010 to oversee HCC's and HBC's response to the Written Agreement. The committee reports monthly to the Board of Directors.
Prior to entering into the Written Agreement in February 2010, HCC had already ceased paying dividends on its common stock (in the second quarter of 2009), suspended interest payments on its trust
8
preferred securities and related subordinated debt (in the fourth quarter of 2009), and suspended dividend payments on its Series A Preferred Stock (also in the fourth quarter of 2009). As a result, the Company has accrued but has not paid approximately $2.5 million in interest on its subordinated debt, and approximately $2.8 million in dividends on its Series A Preferred Stock as of December 31, 2010.
The Company submitted specific plans to the FRB and DFI relating to improving asset quality and credit risk management, improving profitability, liquidity management and its capital plan. All of these plans have been accepted as satisfactory by the FRB and DFI. With respect to credit risk management, management has developed and utilizes risk of loss and loss given default models to evaluate risk exposure limits and potential changes in market conditions and conducts monthly reviews of credit risk management reports with the Boards of Directors of HCC and HBC. With respect to asset improvement, the Company has taken steps to mitigate risk on each real estate loan upon renewal, or sooner based on facts and circumstances, to ensure that HBC has updated appraisals or evaluations which may result in additional collateral or guarantees. If necessary, the loan will be downgraded, placed on nonaccrual status, or foreclosed upon. In addition, the Company has reduced nonperforming loans as evidenced by a 47% decline in nonperforming loans at December 31, 2010 to $33.3 million compared to nonperforming loans at December 31, 2009 of $62.4 million. With respect to allowance for loan and lease losses, the Company's current methodology considers HBC's loan grading system, the volume and severity of criticized loans, concentrations, historical losses, and the impact of overall economic and market conditions on loan and collateral values that could result in probable losses within the portfolio, and the methodology is monitored as events and circumstances change. With respect to capital, HCC issued $75 million of preferred stock on June 21, 2010 and subsequently contributed $40 million of capital to HBC. In addition, the Company has developed a capital stress testing methodology that is updated each quarter and reviewed by the Finance and Investment Committee of the Board of Directors. With respect to liquidity funds management, the Company has a contingent liquidity plan and updates the contingent liquidity plan and its liquidity models each quarter which are reviewed by the Finance and Investment Committee of the Board of Directors. With respect to earnings and overall condition, the Company's Board of Directors has approved a 2011 budget for the Company.
As of the date of this filing, HCC and HBC believe they are in compliance with the requirements of the Written Agreement. Failure to comply with the Written Agreement may subject HCC and HBC to additional supervisory actions and orders.
Private Placement
On June 21, 2010, HCC issued to various institutional investors 53,996 shares of Series B Mandatorily Convertible Cumulative Perpetual Preferred Stock ("Series B Preferred Stock") and 21,004 shares of Series C Convertible Perpetual Preferred Stock ("Series C Preferred Stock") for an aggregate purchase price of $75 million. The Series B Preferred Stock was mandatorily convertible into common stock upon approval by the shareholders at a conversion price of $3.75 per share. The Series C Preferred Stock is mandatorily convertible into common stock at a conversion price of $3.75 per share upon both approval by the shareholders and, thereafter, a subsequent transfer of the Series C Preferred Stock to third parties not affiliated with the holder in a widely dispersed offering. At HCC's Special Meeting of Shareholders held on September 15, 2010, HCC's shareholders approved the issuance of common stock upon the conversion of the Series B Preferred Stock and upon the conversion of the Series C Preferred Stock as required by The NASDAQ Stock Market and California corporate law. As a result, on September 16, 2010, the Series B Preferred Stock was converted into 14,398,992 shares of common stock of HCC and the shares of Series B Preferred Stock ceased to be outstanding. The Series C Preferred Stock remains outstanding until it has been converted into common stock in accordance with its terms. The Series C Preferred Stock is non-voting except in the case of certain transactions that would affect the rights of the holders of the Series C Preferred Stock or applicable law. Holders of Series C Preferred Stock will receive dividends if and only to the extent dividends are paid to holders of common stock. The Series C Preferred Stock is not
9
redeemable by HCC or by the holders and has a liquidation preference of $1,000 per share. The Series C Preferred Stock ranks senior to HCC's common stock and ranks on parity with HCC's Series A Preferred Stock.
Correspondent Banks
Correspondent bank deposit accounts are maintained to enable the Company to transact types of activity that it would otherwise be unable to perform or would not be cost effective due to the size of the Company or volume of activity. The Company has utilized several correspondent banks to process a variety of transactions.
Competition
The banking and financial services business in California generally, and in the Company's market areas specifically, is highly competitive. The industry continues to consolidate and unregulated competitors have entered banking markets with products targeted at highly profitable customer segments. Many larger unregulated competitors are able to compete across geographic boundaries, and provide customers with meaningful alternatives to most significant banking services and products. These consolidation trends are likely to continue. The increasingly competitive environment is a result primarily of changes in regulation, changes in technology and product delivery systems, and the consolidation among financial service providers.
With respect to commercial bank competitors, the business is dominated by a relatively small number of major banks that operate a large number of offices within our geographic footprint. For the combined Santa Clara, Alameda and Contra Costa county region, the three counties within which the Company operates, the top three institutions are all multi-billion dollar entities with an aggregate of 387 offices that control a combined 56.08% of deposit market share based on June 30, 2010 FDIC market share data. HBC ranks fifteenth with 0.90% share of total deposits based on June 30, 2010 market share data. These banks have, among other advantages, the ability to finance wide-ranging advertising campaigns and to allocate their resources to regions of highest yield and demand. They can also offer certain services that we do not offer directly, but may offer indirectly through correspondent institutions. By virtue of their greater total capitalization, these banks also have substantially higher lending limits than we do. For customers whose needs exceed our legal lending limit, we arrange for the sale, or "participation," of some of the balances to financial institutions that are not within our geographic footprint.
In addition to other large regional banks and local community banks, our competitors include savings institutions, securities and brokerage companies, mortgage companies, credit unions, finance companies and money market funds. In recent years, we have also witnessed increased competition from specialized companies that offer wholesale finance, credit card, and other consumer finance services, as well as services that circumvent the banking system by facilitating payments via the internet, wireless devices, prepaid cards, or other means. Technological innovations have lowered traditional barriers of entry and enabled many of these companies to compete in financial services markets. Such innovation has, for example, made it possible for non-depository institutions to offer customers automated transfer payment services that previously were considered traditional banking products. In addition, many customers now expect a choice of delivery channels, including telephone and smart phones, mail, personal computer, ATMs, self-service branches, and/or in-store branches. Competitors offering such products include traditional banks and savings associations, credit unions, brokerage firms, asset management groups, finance and insurance companies, internet-based companies, and mortgage banking firms.
Strong competition for deposits and loans among financial institutions and non-banks alike affects interest rates and other terms on which financial products are offered to customers. Mergers between financial institutions have placed additional pressure on other banks within the industry to remain competitive by streamlining operations, reducing expenses, and increasing revenues. Competition has also
10
intensified due to federal and state interstate banking laws enacted in the mid-1990's, which permit banking organizations to expand into other states. The relatively large and expanding California market has been particularly attractive to out of state institutions. The Gramm — Leach — Bliley Act of 1999 has made it possible for full affiliations to occur between banks and securities firms, insurance companies, and other financial companies, and has also intensified competitive conditions. See Item 1 — "Business — Supervision and Regulation — Heritage Commerce Corp — Financial Modernization".
In order to compete with the other financial service providers, the Company principally relies upon community-oriented, personalized service, local promotional activities, personal relationships established by officers, directors, and employees with its customers, and specialized services tailored to meet its customers' needs. Our "preferred lender" status with the Small Business Administration allows us to approve SBA loans faster than many of our competitors. In those instances where the Company is unable to accommodate a customer's needs, the Company seeks to arrange for such loans on a participation basis with other financial institutions or to have those services provided in whole or in part by its correspondent banks. See Item 1 — "Business — Correspondent Banks."
Economic Conditions, Government Policies, Legislation, and Regulation
The Company's profitability, like most financial institutions, is primarily dependent on interest rate differentials. In general, the difference between the interest rates paid by HBC on interest-bearing liabilities, such as deposits and other borrowings, and the interest rates received by HBC on interest-earning assets, such as loans extended to customers and securities held in the investment portfolio, will comprise the major portion of the Company's earnings. These rates are highly sensitive to many factors that are beyond the control of the Company and HBC, such as inflation, recession and unemployment, and the impact which future changes in domestic and foreign economic conditions might have on the Company and HBC cannot be predicted.
The Company's business is also influenced by the monetary and fiscal policies of the federal government and the policies of regulatory agencies, particularly the Board of Governors of the Federal Reserve Board. The Federal Reserve Board implements national monetary policies (with objectives such as curbing inflation and combating recession) through its open-market operations in U.S. Government securities by adjusting the required level of reserves for depository institutions subject to its reserve requirements, and by varying the target Federal funds and discount rates applicable to borrowings by depository institutions. The actions of the Federal Reserve Board in these areas influence the growth of bank loans, investments, and deposits and also affect interest earned on interest-earning assets and paid on interest-bearing liabilities. The nature and impact of any future changes in monetary and fiscal policies on the Company cannot be predicted.
From time to time, federal and state legislation is enacted which may have the effect of materially increasing the cost of doing business, limiting or expanding permissible activities, or affecting the competitive balance between banks and other financial services providers. In addition, the various bank regulatory agencies often adopt new rules and regulations and policies to implement and enforce existing legislation. It cannot be predicted whether, or in what form, any such legislation or regulations or changes in policy may be enacted or the extent to which the business of the Company would be affected thereby. The Company cannot predict whether or when potential legislation will be enacted and, if enacted, the effect that it, or any implemented regulations and supervisory policies, would have on our financial condition or results of operations. In addition, the outcome of examinations, any litigation or any investigations initiated by state or federal authorities may result in necessary changes in our operations and increased compliance costs.
On October 3, 2008, the Emergency Economic Stabilization Act of 2008 was enacted to restore confidence and stabilize the volatility in the U.S. banking system and to encourage financial institutions to increase their lending to customers and to each other. Initially introduced as the Troubled Asset Relief
11
Program, the Emergency Economic Stabilization Act authorized the U.S. Treasury to purchase from financial institutions and their holding companies up to $700 billion in mortgage loans, mortgage-related securities and certain other financial instruments, including debt and equity securities issued by financial institutions and their holding companies in a troubled asset relief program. Initially, $350 billion or half of the $700 billion was made immediately available to the U.S. Treasury. On January 15, 2009, the remaining $350 billion was released to the U.S. Treasury.
On October 14, 2008, the U.S. Treasury announced its intention to inject capital into nine large U.S. financial institutions under the U.S. Treasury Capital Purchase Program, and since then has injected capital into many other financial institutions, including the Company. On November 21, 2008, HCC entered into a Letter Agreement and Securities Purchase Agreement — Standard Terms, pursuant to which HCC issued and sold preferred stock for $40.0 million and issued a common stock warrant.
On February 17, 2009, the American Recovery and Reinvestment Act of 2009 was signed into law. The American Recovery and Reinvestment Act includes various programs intended to stimulate the economy. In addition, the American Recovery and Reinvestment Act imposes certain new executive compensation and corporate governance requirements on all current and future Capital Purchase Program recipients, including the Company, until the institution has repaid the U.S. Treasury, which is permitted under the American Recovery and Reinvestment Act without penalty, subject to the U.S. Treasury's consultation with the recipient's appropriate regulatory agency.
Dodd-Frank Legislation
On July 21, 2010, the President signed the Dodd-Frank Wall Street Reform and Consumer Protection Act (the "Dodd-Frank Act"). This new law will significantly change the current bank regulatory structure and affect the lending, deposit, investment, trading and operating activities of financial institutions and their holding companies. The Dodd-Frank Act requires various federal agencies to adopt a broad range of new implementing rules and regulations, and to prepare numerous studies and reports for Congress. The federal agencies are given significant discretion in drafting the implementing rules and regulations and, consequently, many of the details and much of the impact of the Dodd-Frank Act may not be known for many months or years.
Effective one year after the date of enactment is a provision for the Dodd-Frank Act that eliminates the federal prohibitions on paying interest on demand deposits, thus allowing businesses to have interest bearing checking accounts. Depending on competitive responses, this significant change to existing law could have an adverse impact on our interest expense.
The Dodd-Frank Act also broadens the base for Federal Deposit Insurance Corporation deposit insurance assessments. Assessments will now be based on the average consolidated total assets less tangible equity capital of a financial institution, rather than deposits. The Dodd-Frank Act also permanently increases the maximum amount of deposit insurance for banks, savings institutions and credit unions to $250,000 per account, retroactive to January 1, 2008, and non-interest bearing transaction accounts have unlimited deposit insurance through December 31, 2013. The legislation also increases the required minimum reserve ratio for the Deposit Insurance Fund, from 1.15% to 1.35% of insured deposits, and directs the FDIC to offset the effects of increased assessments on depository institutions with less than $10 billion in assets.
The Dodd-Frank Act will require publicly traded companies to give stockholders a non-binding vote on executive compensation and so-called "golden parachute" payments, and authorizes the Securities and Exchange Commission to promulgate rules that would allow stockholders to nominate their own candidates using a company's proxy materials. It also provides that the listing standards of the national securities exchanges must require listed companies to implement and disclose "clawback" policies mandating the recovery of incentive compensation paid to executive officers in connection with accounting restatements. The legislation also directs the Federal Reserve Board to promulgate rules prohibiting excessive compensation paid to bank holding company executives, regardless of whether the company is publicly traded or not.
12
The Dodd-Frank Act creates a new Consumer Financial Protection Bureau with broad powers to supervise and enforce consumer protection laws. The Consumer Financial Protection Bureau has broad rule-making authority for a wide range of consumer protection laws that apply to all banks and savings institutions, including the authority to prohibit "unfair, deceptive or abusive" acts and practices. The Consumer Financial Protection Bureau has examination and enforcement authority over all banks and savings institutions with more than $10 billion in assets. Banks such as HBC with $10 billion or less in assets will continue to be examined for compliance with the consumer laws by their primary bank regulators. The Dodd-Frank Act also weakens the federal preemption rules that have been applicable for national banks and federal savings associations, and gives state attorneys general the ability to enforce federal consumer protection laws.
The Dodd-Frank Act requires minimum leverage (Tier 1) and risk based capital requirements for bank and savings and loan holding companies that are no less than those applicable to banks, which will exclude certain instruments that previously have been eligible for inclusion by bank holding companies as Tier 1 capital, such as trust preferred securities.
It is difficult to predict at this time what specific impact the Dodd-Frank Act and the yet to be written implementing rules and regulations will have on community banks. However, it is expected that at a minimum they will increase our operating and compliance costs.
Supervision and Regulation
Introduction
Banking is a complex, highly regulated industry. The primary goals of the regulatory scheme are to maintain a safe and sound banking system, protect depositors and the Federal Deposit Insurance Corporation's ("FDIC") insurance fund, and facilitate the conduct of sound monetary policy. In furtherance of these goals, Congress and the states have created several largely autonomous regulatory agencies and enacted numerous laws that govern banks, bank holding companies and the financial services industry. Consequently, the growth and earnings performance of the Company can be affected not only by management decisions and general economic conditions, but also by the requirements of applicable state and federal statues, regulations and the policies of various governmental regulatory authorities, including the Federal Reserve Board, FDIC, and the DFI.
The system of supervision and regulation applicable to financial services businesses governs most aspects of the business of the Company, including: (i) the scope of permissible business; (ii) investments; (iii) reserves that must be maintained against deposits; (iv) capital levels that must be maintained; (v) the nature and amount of collateral that may be taken to secure loans; (vi) the establishment of new branches; (vii) mergers and consolidations with other financial institutions; and (viii) the payment of dividends.
Set forth below is a description of the significant elements of the laws and regulations applicable to HCC and HBC. The description is qualified in its entirety by reference to the full text of the statutes, regulations and policies that are described. Also, such statutes, regulations and policies are continually under review by the U.S. Congress and state legislatures and federal and state regulatory agencies. A change in statutes, regulations or regulatory policies applicable to HCC or HBC could have a material effect on our business.
Heritage Commerce Corp
General. As a bank holding company, HCC is registered under the Bank Holding Company Act of 1956, as amended ("BHCA"), and is subject to regulation by the Federal Reserve Board. Under the BHCA, HCC and HBC are subject to periodic examination by the Federal Reserve Board. HCC is also required to file periodic reports of its operations and any additional information regarding its activities and those of its subsidiaries, as may be required by the Federal Reserve Board.
HCC is also a bank holding company within the meaning of Section 3700 of the California Financial Code. Consequently, HCC and HBC are subject to examination by, and may be required to file reports
13
with, the DFI. Regulations have not yet been proposed or adopted or steps otherwise taken to implement the DFI's powers under this statute.
HCC's stock is traded on the NASDAQ Global Select Market (under the trading symbol "HTBK"), and HCC is subject to rules and regulations of The NASDAQ Stock Market, including those related to corporate governance. HCC is also subject to the periodic reporting requirements of Section 13 of the Securities Exchange Act of 1934 (the "Exchange Act") which requires HCC to file annual, quarterly and other current reports with the SEC. HCC is subject to additional regulations including, but not limited to, the proxy and tender offer rules promulgated by the SEC under Sections 13 and 14 of the Exchange Act, the reporting requirements of directors, executive officers and principal shareholders regarding transactions in the HCC's common stock and short swing profits rules promulgated by the SEC under Section 16 of the Exchange Act, and certain additional reporting requirements by principal shareholders of HCC promulgated by the SEC under Section 13 of the Exchange Act.
Dividends. The principal source of HCC's cash revenues are dividends from its bank subsidiary, HBC. HCC's earnings and activities are affected by legislation, by regulations and by local legislative and administrative bodies and decisions of courts in the jurisdictions in which we conduct business. For example, these include limitations on the ability of HBC to pay dividends to HCC and our ability to pay dividends to our shareholders. It is the policy of the Federal Reserve Board that bank holding companies should pay cash dividends on common stock only out of income available over the past year and only if prospective earnings retention is consistent with the organization's expected future needs and financial condition. The policy provides that bank holding companies should not maintain a level of cash dividends that undermines the bank holding company's ability to serve as a source of strength to its banking subsidiary.
As a member of the Federal Reserve System, HBC is subject to Regulation H, which, among other things, provides that a member bank may not declare or pay a dividend if the total of all dividends declared during the calendar year, including the proposed dividend, exceeds the sum of the bank's net income (as reportable in its Reports of Condition and Income) during the current calendar year and its retained net income for the prior two calendar years, unless the Federal Reserve has approved the dividend. Regulation H also provides that a member bank may not declare or pay a dividend if the dividend would exceed the bank's undivided profits as reportable on its Reports of Condition and Income, unless the Federal Reserve and holders of at least two-thirds of the outstanding shares of each class of the bank's outstanding stock have approved the dividend. Additionally, there are potential additional restrictions and prohibitions if a bank were to be less than well-capitalized.
As a California state-chartered bank, HBC is also subject to limitations under California law on the payment of dividends. HCC is entitled to receive dividends, when and as declared by HBC's Board of Directors. Those dividends may come from funds legally available for those dividends, as specified and limited by the California Financial Code. Under the California Financial Code, funds available for cash dividends by a California-chartered bank are restricted to the lesser of: (i) the bank's retained earnings; or (ii) the bank's net income for its last three fiscal years (less any distributions to shareholders made during such period). With the prior approval of the DFI, cash dividends may also be paid out of the greater of: (a) the bank's retained earnings; (b) net income for the bank's last preceding fiscal year; or (c) net income of the bank's current fiscal year. If the DFI determines that the shareholders' equity of the bank paying the dividend is not adequate or that the payment of the dividend would be unsafe or unsound for the bank, the DFI may order the bank not to pay the dividend. Since HBC is an FDIC-insured institution, it is also possible, depending upon its financial condition and other factors, that the FDIC could assert that the payment of dividends or other payments might, under some circumstances, constitute an unsafe or unsound practice and thereby prohibit such payments.
The California General Corporation Law prohibits HCC from paying dividends on the common stock unless: (i) its retained earnings, immediately prior to the dividend payment, equals or exceeds the amount of the dividend; or (ii) immediately after giving effect to the dividend, the sum of HCC's assets (exclusive of goodwill and deferred charges) would be at least equal to 125% of its liabilities (not including deferred
14
taxes, deferred income and other deferred credits) and the current assets of HCC would be at least equal to its current liabilities, or, if the average of its earnings before taxes on income and before interest expense for the two preceding fiscal years was less than the average of its interest expense for the two preceding fiscal years, at least equal to 125% of its current liabilities.
The Written Agreement discussed above prohibits both HCC and HBC from paying dividends without the prior written approval of the Federal Reserve and the DFI.
As long as the Series A Preferred Stock is outstanding, dividend payments relating to HCC's common stock are prohibited until all accrued and unpaid dividends are paid on the Series A Preferred Stock. As permitted under the terms of the Series A Preferred Stock, HCC suspended the payment of dividends on its Series A Preferred Stock in November 2009.
Under the terms of our trust preferred financings, including our related subordinated debentures, we cannot declare or pay any dividends or distributions (other than stock dividends) on, or redeem, purchase, acquire or make a liquidation payment with respect to, any shares of our capital stock if: (i) an event of default under any of the subordinated debenture agreements has occurred and is continuing; or (ii) if we give notice of our election to begin an extension period whereby we may defer payment of interest on the trust preferred securities for a period of up to sixty consecutive months as long as we are in compliance with all covenants of the agreement. In November 2009, we elected to defer regularly scheduled interest payments on each of our subordinated debentures until further notice. In addition, we are currently restricted from making payments of principal or interest on our subordinated debentures or trust preferred securities under the terms of our Written Agreement without the prior approval of the Federal Reserve.
Affiliate Transactions. There are various restrictions on the ability of the holding company to borrow from, and engage in certain other transactions with its bank subsidiary. In general, these restrictions require that any extensions of credit must be secured by designated amounts of specified collateral and are limited, as to transactions with HBC, to 10% of HBC's capital stock and surplus, and, as HCC, to 20% of HBC's capital stock and surplus.
Federal law also provides that extensions of credit and other transactions between HBC and HCC must be on terms and conditions, including credit standards, that are substantially the same or at least as favorable to HBC as those prevailing at the time for comparable transactions involving other non-affiliated companies or, in the absence of comparable transactions, on terms and conditions, including credit standards that in good faith would be offered to or would apply to non-affiliated companies.
Source of Strength Doctrine. Federal Reserve Board policy requires bank holding companies to act as a source of financial and managerial strength to their subsidiary banks. Under this policy, the holding company is expected to commit resources to support its bank subsidiary, including at times when the holding company may not be in a financial position to provide it. It is the Federal Reserve Board's position that bank holding companies should stand ready to use their available resources to provide adequate capital to their subsidiary banks during periods of financial stress or adversity. Bank holding companies must also maintain the financial flexibility and capital raising capacity to obtain additional resources for assisting their subsidiary bank. Any capital loans by a bank holding company to its subsidiary bank are subordinate in right of payment to deposits and to certain other indebtedness of such subsidiary bank. The BHCA provides that, in the event of a bank holding company's bankruptcy, any commitment by the bank holding company to a federal bank regulatory agency to maintain the capital of a bank subsidiary will be assumed by the bankruptcy trustee and entitled to priority of payment.
Investments and Acquisition of other Banks. Under the BHCA, a bank holding company must obtain the Federal Reserve Board's approval before: (i) directly or indirectly acquiring more than 5% ownership or control of any voting shares of another bank or bank holding company; (ii) acquiring all or substantially all of the assets of another bank; or (iii) merging or consolidating with another bank holding company.
Tie-in Arrangements. Federal law prohibits a bank holding company and any subsidiary banks from engaging in certain tie-in arrangements in connection with the extension of credit. Thus, for example, HBC
15
may not extend credit, lease or sell property, or furnish any services, or fix or vary the consideration for any of the foregoing on the condition that: (i) the customer must obtain or provide some additional credit, property or services from or to HBC other than a loan, discount, deposit or trust services; (ii) the customer must obtain or provide some additional credit, property or service from or to HCC or HBC; or (iii) the customer must not obtain some other credit, property or services from competitors, except reasonable requirements to assure soundness of credit extended.
Interstate Banking and Branching. The Riegle-Neal Interstate Banking and Branching Efficiency Act of 1994 (the "Interstate Banking Act") regulates the interstate activities of banks and bank holding companies and establishes a framework for nationwide interstate banking and branching. Since June 1, 1997, a bank has generally been permitted to merge with a bank in another state without state law authorization. However, states were given the ability to prohibit interstate mergers with banks in their own state by "opting out" (enacting state legislation applying equality to all out of state banks prohibiting such mergers) prior to June 1, 1997. The Dodd-Frank Act eliminates interstate branching restrictions that were implemented as part of the Interstate Banking Act, and removes many restrictions on de novo interstate branching by national and state-chartered banks.
In 1995, California enacted legislation to implement important provisions of the Interstate Banking Act discussed above and to repeal California's previous interstate banking laws, which were largely preempted by the Interstate Banking Act.
The changes effected by the Interstate Banking Act and California laws have increased competition in the environment in which the Company operates to the extent that out of state financial institutions directly or indirectly enter the Company's market areas. It appears that the Interstate Banking Act has contributed to accelerated consolidation within the banking industry.
Capital Adequacy. Bank holding companies must maintain minimum levels of capital under the Federal Reserve Board's risk-based capital adequacy guidelines. If capital falls below minimum guideline levels, a bank holding company, among other things, may be denied approval to acquire or establish additional banks or non-bank businesses.
The Federal Reserve Board's risk-based capital adequacy guidelines, discussed in more detail below in the section entitled "Supervision and Regulation — Heritage Bank of Commerce — Regulatory Capital Guidelines," assign various risk percentages to different categories of assets, and capital is measured as a percentage of risk-weighted assets. Under the terms of the guidelines, bank holding companies are expected to meet capital adequacy guidelines based both on total risk-weighted assets and on total assets, without regard to risk weights.
The risk-based guidelines are minimum requirements. Higher capital levels will be required if warranted by the particular circumstances or risk profiles of individual organizations. For example, the Federal Reserve Board's capital guidelines contemplate that additional capital may be required to take adequate account of, among other things, interest rate risk, or the risks posed by concentrations of credit, nontraditional activities or securities trading activities. Moreover, any banking organization experiencing or anticipating significant growth or expansion into new activities, particularly under the expanded powers under the Gramm — Leach — Bliley Act, would be expected to maintain capital ratios, including tangible capital positions, well above the minimum levels.
Pursuant to the Written Agreement, as discussed above, HCC and HBC submitted a written plan to the Federal Reserve and DFI to continue to maintain sufficient capital at HCC and HBC, respectively. Although the Written Agreement does not require any specific capital levels, it required the capital plan to address, consider and include HCC and HBC's current and future capital needs; the adequacy of HBC's capital, taking into account classified credits, concentrations of credit, allowance for loan losses, current and projected asset growth and projected retained earnings; the source and timing of additional funds to fulfill HCC and HBC's future capital requirements; and that HCC serve as a source of strength to HBC. The capital plan has been approved by the Federal Reserve and DFI. The Written Agreement does not address any prompt corrective action with respect to either HCC or HBC.
16
Basel, Basel II and Basel III Accords. The current risk-based capital guidelines that apply to HCC and HBC are based upon the 1988 capital accord of the International Basel Committee on Banking Supervision, a committee of central banks and bank supervisors, as implemented by the Federal Reserve. In 2008, the Federal Reserve began to phase-in capital standards based on a second capital accord, referred to as Basel II, for large or core and international banks (total assets of $250 billion or more or consolidated foreign exposures of $10 billion or more). Basel II emphasizes internal assessment of credit, market and operational risk, as well as supervisory assessment and market discipline in determining minimum capital requirements.
On September 12, 2010, the Group of Governors and Heads of Supervision, the oversight body of the Basel Committee, announced agreement on the calibration and phase-in arrangements for a strengthened set of capital requirements, known as the Basel Capital Adequacy Accords or Basel III. Basel III increases the minimum Tier 1 common equity ratio to 4.5%, net of regulatory deductions, and introduces a capital conservation buffer of an additional 2.5% of common equity to risk-weighted assets, raising the target minimum common equity ratio to 7.0%. Basel III increases (a) the minimum Tier 1 capital ratio to 8.5% inclusive of the capital conservation buffer, (b) increases the minimum total capital ratio to 10.5% inclusive of the capital buffer and (c) introduces a countercyclical capital buffer of up to 2.5% of common equity or other fully loss absorbing capital for periods of excess credit growth. Basel III also introduces a non-risk adjusted Tier 1 leverage ratio of 3.0%, based on a measure of total exposure rather than total assets, and new liquidity standards. The new capital standards provide for the capital reduction of certain assets including deferred tax assets. The Basel III capital and liquidity standards are expected to be phased in over a multi-year period. The final package of Basel III reforms was endorsed at the Seoul G20 Leaders Summit in November 2010, and is subject to individual adoption by member nations, including the United States. The Federal Reserve will likely implement changes to the capital adequacy standards applicable to HCC and HBC in light of Basel III.
Non-Banking Activities. The business activities of HCC, as a bank holding company, are restricted by the BHCA. Under the BHCA and the Federal Reserve's bank holding company regulations, HCC may only engage in, acquire, or control voting securities or assets of a company engaged in: (i) banking or managing or controlling banks and other subsidiaries authorized under the BHCA; and (ii) any non-banking activity the Federal Reserve has determined to be so closely related to banking or managing or controlling banks to be a proper incident thereto. These include any incidental activities necessary to carry on those activities as well as a lengthy list of activities that the Federal Reserve has determined to be so closely related to the business of banking as to be a proper incident thereto.
Financial Modernization. The Gramm — Leach — Bliley Act, which became effective in March 2000, permits greater affiliation among banks, securities firms, insurance companies, and other companies under a new type of financial services company known as a "financial holding company." A financial holding company essentially is a bank holding company with significantly expanded powers. Financial holding companies are authorized by statute to engage in a number of financial activities previously impermissible for bank holding companies, including securities underwriting, dealing and market making; sponsoring mutual funds and investment companies; insurance underwriting and agency; and merchant banking activities. The Gramm — Leach — Bliley Act also permits the Federal Reserve and the Treasury Department to authorize additional activities for financial holding companies if they are "financial in nature" or "incidental" to financial activities. A bank holding company may become a financial holding company if each of its subsidiary banks is well capitalized, well managed, and has at least a "satisfactory" CRA rating. A financial holding company must provide notice to the Federal Reserve within 30 days after commencing activities previously determined by statute or by the Federal Reserve and Department of the Treasury to be permissible. HCC has not and has no present plans to submit notice to the Federal Reserve to be a financial holding company.
In addition, HBC is subject to other provisions of the Gramm — Leach — Bliley Act, including those relating to CRA, privacy and the safe-guarding of confidential customer information, regardless of whether
17
the Company elects to become a financial holding company or to conduct activities through a financial subsidiary of HBC.
HCC and HBC do not believe that the Gramm — Leach — Bliley Act has had, or will have in the near term, a material adverse effect on their operations. However, to the extent that it permits banks, securities firms, and insurance companies to affiliate, the financial services industry may experience further consolidation. The Gramm — Leach — Bliley Act is intended to grant to community banks certain powers as a matter of right that larger institutions have accumulated on an ad hoc basis. Nevertheless, the Gramm — Leach — Bliley Act may have the result of increasing the amount of competition that HCC and HBC face from larger institutions and other types of companies offering financial products, many of which may have substantially more financial resources than HCC and HBC.
The Sarbanes-Oxley Act of 2002. The Sarbanes-Oxley Act of 2002 ("SOX") became effective on July 30, 2002, and represents the most far reaching corporate and accounting reform legislation since the enactment of the Securities Act of 1933 and the Exchange Act. SOX is intended to provide a permanent framework that improves the quality of independent audits and accounting services, improves the quality of financial reporting, strengthens the independence of accounting firms and increases the responsibility of management for corporate disclosures and financial statements.
SOX's provisions are significant to all companies that have a class of securities registered under Section 12 of the Exchange Act, or are otherwise reporting to the SEC (or the appropriate federal banking agency) pursuant to Section 15(d) of the Exchange Act, including HCC (collectively, "public companies"). In addition to SEC rulemaking to implement SOX, The NASDAQ Stock Market has adopted corporate governance rules intended to allow shareholders to more easily and effectively monitor the performance of companies and directors. The principal provisions of SOX, provide for and include, among other things: (i) the creation of an independent accounting oversight board; (ii) auditor independence provisions that restrict non-audit services that accountants may provide to their audit clients; (iii) additional corporate governance and responsibility measures, including the requirement that the chief executive officer and chief financial officer of a public company certify financial statements; (iv) the forfeiture of bonuses or other incentive-based compensation and profits from the sale of a public company's securities by directors and senior officers in the twelve month period following initial publication of any financial statements that later require restatement; (v) an increase in the oversight of, and enhancement of certain requirements relating to, audit committees of public companies and how they interact with the public company's independent auditors; (vi) requirements that audit committee members must be independent and are barred from accepting consulting, advisory or other compensatory fees from the public company; (vii) requirements that public companies disclose whether at least one member of the audit committee is a "financial expert' (as such term is defined by the SEC) and if not discuss, why the audit committee does not have a financial expert; (viii) expanded disclosure requirements for corporate insiders, including accelerated reporting of stock transactions by insiders and a prohibition on insider trading during pension blackout periods; (ix) a prohibition on personal loans to directors and officers, except certain loans made by insured financial institutions on non-preferential terms and in compliance with other bank regulatory requirements; (x) disclosure of a code of ethics and filing a Form 8-K for a change or waiver of such code; (xi) a range of enhanced penalties for fraud and other violations; and (xii) expanded disclosure and certification relating to a public company's disclosure controls and procedures and internal controls over financial reporting.
Heritage Bank of Commerce
General. As a California chartered bank, HBC is subject to supervision, periodic examination, and regulation by the DFI and by the Federal Reserve Board, as HBC's primary federal regulator. As a member bank, HBC is a stockholder of the Federal Reserve Bank of San Francisco. If, as a result of an examination, the DFI or the Federal Reserve Board should determine that the financial condition, capital resources, asset quality, earnings prospects, management, liquidity, or other aspects of HBC's operations are unsatisfactory or that HBC or its management is violating or has violated any law or regulation, the
18
DFI and the Federal Reserve Board, and separately the FDIC as insurer of HBC's deposits, have residual authority to: (i) require affirmative action to correct any conditions resulting from any violation or practice; (ii) direct an increase in capital; (iii) restrict HBC's growth geographically, by products and services or by mergers and acquisitions; (iv) enter into informal nonpublic or formal public memoranda of understanding or written agreements; (v) enjoin unsafe and unsound practices and issue cease and desist orders to take corrective action; (vi) remove officers and directors and assess civil monetary penalties; and (vii) take possession and close and liquidate HBC.
California law permits state chartered commercial banks to engage in any activity permissible for national banks. Therefore, HBC may form subsidiaries to engage in the many so-called "closely related to banking" or "nonbanking" activities commonly conducted by national banks in operating subsidiaries, and further, pursuant to the Gramm — Leach — Bliley Act, HBC may conduct certain "financial" activities in a subsidiary to the same extent as may a national bank, provided HBC is and remains "well-capitalized," "well-managed" and in satisfactory compliance with the Community Reinvestment Act (discussed below).
HBC is a member of the Federal Home Loan Bank ("FHLB") of San Francisco. Among other benefits, each FHLB serves as a reserve or central bank for its members within its assigned region and makes available loans or advances to its members. Each FHLB is financed primarily from the sale of consolidated obligations of the FHLB system. As an FHLB member, HBC is required to own a certain amount of capital stock in the FHLB. At December 31, 2010, HBC was in compliance with the FHLB's stock ownership requirement.
Regulatory Capital Guidelines. The federal banking agencies have established minimum capital standards known as risk-based capital guidelines. These guidelines are intended to provide a measure of capital that reflects the degree of risk associated with a bank's operations. The risk-based capital guidelines include both a definition of capital and a framework for calculating the amount of capital that must be maintained against a bank's assets and off-balance sheet items. The amount of capital required to be maintained is based upon the credit risks associated with the various types of a bank's assets and off-balance sheet items. A bank's assets and off-balance sheet items are classified under several risk categories, with each category assigned a particular risk weighting from 0% to 100%. The following table sets forth the regulatory capital guidelines and the actual capitalization levels for HBC and the Company (consolidated) as of December 31, 2010:
| |
Adequately Capitalized |
Well Capitalized |
HBC | Company (consolidated) |
|||||||||
|---|---|---|---|---|---|---|---|---|---|---|---|---|---|
Total risk-based capital |
8.0 | % | 10.0 | % | 18.1 | % | 20.9 | % | |||||
Tier 1 risk-based capital |
4.0 | % | 6.0 | % | 16.8 | % | 19.7 | % | |||||
Tier 1 leverage capital ratio |
4.0 | % | 5.0 | % | 12.1 | % | 14.1 | % | |||||
As of December 31, 2010, the Company's capital levels met all minimum regulatory requirements and HBC was considered "well capitalized" under the regulatory framework for prompt corrective action. There are no conditions or events since December 31, 2010 that management believes has changed the Company's or HBC's category.
To enhance regulatory capital and to provide liquidity, the Company, through unconsolidated subsidiary grantor trusts, issued $23.7 million of trust preferred securities and related subordinated debt. These securities are currently included in our Tier 1 capital for purposes of determining the Company's Tier 1 and total risk-based capital ratios. The Federal Reserve Board has promulgated a modification of the capital regulations affecting trust preferred securities. Under this modification, effective March 31, 2011, the Company will be required to use a more restrictive formula to determine the amount of trust preferred securities that can be included in regulatory Tier 1 capital. When the new regulations become effective, the Company may include in Tier 1 capital an amount of trust preferred securities equal to no more than 25% of the sum of all core capital elements, which is generally defined as shareholders' equity excluding accumulated other comprehensive income/(loss), less goodwill and other intangible assets and any related deferred income tax liability. The regulations currently in effect through March 31, 2011, limit
19
the amount of trust preferred securities that can be included in Tier 1 capital to 25% of the sum of core capital elements without a deduction for goodwill. Management has determined that the Company's Tier 1 capital ratios would be substantially the same had the modification of the capital regulations been in effect at December 31, 2010.
Prompt Corrective Action. The federal banking agencies possess broad powers to take prompt corrective action to resolve the problems of insured banks. Each federal banking agency has issued regulations defining five capital categories: "well capitalized," "adequately capitalized," "undercapitalized," "significantly undercapitalized," and "critically undercapitalized." Under the regulations, a bank shall be deemed to be:
- •
- "well capitalized" if it has a total risk-based capital ratio of 10.0% or more, has a Tier 1
risk-based capital ratio of 6.0% or more, has a leverage capital ratio of 5.0% or more, and is not subject to specified requirements to meet and maintain a specific capital level for any
capital measure;
- •
- "adequately capitalized" if it has a total risk-based capital ratio of 8.0% or more, a Tier 1
risk-based capital ratio of 4.0% or more, and a leverage capital ratio of 4.0% or more (3.0% under certain circumstances) and does not meet the definition of "well capitalized";
- •
- "undercapitalized" if it has a total risk-based capital ratio that is less than 8.0%, a Tier 1
risk-based capital ratio that is less than 4.0%, or a leverage capital ratio that is less than 4.0% (3.0% under certain circumstances);
- •
- "significantly undercapitalized" if it has a total risk-based capital ratio that is less than 6.0%, a
Tier 1 risk-based capital ratio that is less than 3.0% or a leverage capital ratio that is less than 3.0%; and
- •
- "critically undercapitalized" if it has a ratio of tangible equity to total assets that is equal to or less than 2.0%.
Banks are prohibited from paying dividends or management fees to controlling persons or entities if, after making the payment the bank would be "undercapitalized," that is, the bank fails to meet the required minimum level for any relevant capital measure. Asset growth and branching restrictions apply to "undercapitalized" banks. Banks classified as "undercapitalized" are required to submit acceptable capital plans guaranteed by its holding company, if any. Broad regulatory authority was granted with respect to "significantly undercapitalized" banks, including forced mergers, growth restrictions, ordering new elections for directors, forcing divestiture by its holding company, if any, requiring management changes, and prohibiting the payment of bonuses to senior management. Even more severe restrictions are applicable to "critically undercapitalized" banks, those with capital at or less than 2%. Restrictions for these banks include the appointment of a receiver or conservator. All of the federal banking agencies have promulgated substantially similar regulations to implement this system of prompt corrective action.
A bank, based upon its capital levels, that is classified as "well capitalized," "adequately capitalized" or "undercapitalized" may be treated as though it were in the next lower capital category if the appropriate federal banking agency, after notice and opportunity for a hearing, determines that an unsafe or unsound condition, or an unsafe or unsound practice, warrants such treatment. At each successive lower capital category, an insured bank is subject to more restrictions. The federal banking agencies, however, may not treat an institution as "critically undercapitalized" unless its capital ratios actually warrant such treatment.
In addition to measures taken under the prompt corrective action provisions, insured banks may be subject to potential enforcement actions by the federal banking agencies for unsafe or unsound practices in conducting their businesses or for violations of any law, rule, regulation or any condition imposed in writing by the agency or any written agreement with the agency. Enforcement actions may include the imposition of a conservator or receiver, the issuance of a cease-and-desist order that can be judicially enforced, the termination of insurance of deposits (in the case of a depository institution), the imposition of civil money penalties, the issuance of directives to increase capital, the issuance of formal and informal agreements, and the issuance of removal and prohibition orders against "institution-affiliated" parties. The enforcement of such actions through injunctions or restraining orders may be based upon a judicial determination that the agency would be harmed if such equitable relief was not granted. For information on the Company's recent regulatory action see "Business — Regulatory Action."
20
Safety and Soundness Standards. The federal banking agencies have also adopted guidelines establishing safety and soundness standards for all insured depository institutions. Those guidelines relate to internal controls, information systems, internal audit systems, loan underwriting and documentation, compensation and interest rate exposure. In general, the standards are designated to assist the federal banking agencies in identifying and addressing problems at insured depository institutions before capital becomes impaired. If an institution fails to meet these standards, the appropriate federal banking agency may require the institution to submit a compliance plan and institute enforcement proceedings if an acceptable compliance plan is not submitted.
FDIC Insurance and Insurance Assessments. The FDIC is an independent federal agency that insures deposits, up to prescribed statutory limits, of federally insured banks and savings institutions and safeguards the safety and soundness of the banking and savings industries. The FDIC insures HBC's customer deposits through the Deposit Insurance Fund ("DIF"). The maximum deposit insurance amount has been permanently increased from $100,000 to $250,000 under the Dodd-Frank Act.
The amount of FDIC assessments paid by each DIF member institution is based on its relative risk of default as measured by regulatory capital ratios and other supervisory factors. Pursuant to the Federal Deposit Insurance Reform Act of 2005, the FDIC is authorized to set the reserve ratio for the DIF annually at between 1.15% and 1.50% of estimated insured deposits. The FDIC may increase or decrease the assessment rate schedule on a semi-annual basis. In an effort to restore capitalization levels and to ensure the DIF will adequately cover projected losses from future bank failures, the FDIC, in October 2008, proposed a rule to alter the way in which it differentiates for risk in the risk-based assessment system and to revise deposit insurance assessment rates, including base assessment rates. Effective April 1, 2009, initial base assessment rates were increased to between 12 and 45 basis points.
On May 22, 2009, the FDIC adopted a final rule imposing a 5 basis point special assessment on each depository institution's assets minus Tier 1 capital as of June 30, 2009. This special assessment was collected on September 30, 2009.
On November 12, 2009, the FDIC adopted a final rule requiring insured institutions to prepay slightly over three years of estimated insurance assessments. The pre-payment allowed the FDIC to strengthen the cash position of the DIF immediately without impacting earnings of the industry. Payment of the prepaid assessment, along with the payment of institutions' regular third quarter assessment was due on December 30, 2009. HBC received an exemption from prepaying its FDIC insurance premiums.
On February 7, 2011, as required by the Dodd-Frank Act, the FDIC adopted final rules to revise the assessment base to consist of average consolidated total assets during the assessment period minus the average tangible equity during the assessment period. In addition, the revisions eliminate the adjustment for secured borrowings and make certain other changes to the impact of unsecured borrowings and brokered deposits on an institution's deposit insurance assessment. The rule also revises the assessment rate schedule to provide assessments ranging from 5 to 45 basis points, that takes effect on April 1, 2011.
In addition, all institutions with deposits insured by the FDIC are required to pay assessments to fund interest payments on bonds issued by the Financing Corporation, a mixed-ownership government corporation established to recapitalize a predecessor to the DIF. The current annualized assessment rate is 1.04 basis points. These assessments will continue until the Financing Corporation bonds mature in 2017 through 2019.
The FDIC may terminate a depository institution's deposit insurance upon a finding that the institution's financial condition is unsafe or unsound or that the institution has engaged in unsafe or unsound practices that pose a risk to the DIF or that may prejudice the interest of depositors. The termination of deposit insurance for a bank would also result in the revocation of the bank's charter by the DFI.
Temporary Liquidity Guarantee Program. The FDIC's Transaction Account Guarantee ("TAG") Program, one of two components of the Temporary Liquidity Guarantee Program, provides full federal deposit insurance coverage for noninterest-bearing transaction deposit accounts, regardless of dollar
21
amount. HBC opted to participate in this program, which was initially set to expire on December 31, 2009. On August 26, 2009, the FDIC extended the program until June 30, 2010, and revised the annualized assessment rate charged for the guarantee to between fifteen and twenty-five basis points, depending on the institution's risk category, on balances in noninterest-bearing transaction accounts that exceed the existing deposit insurance limit of $250,000. HBC opted into the extension. On April 13, 2010, the FDIC announced a second extension of the program until December 31, 2010, and that it retained the discretion to further extend the program until December 31, 2011 without further rulemaking. HBC did opt into the extension. The Dodd-Frank Act has extended unlimited deposit insurance to non-interest-bearing transaction accounts until December 31, 2012.
The Dodd-Frank Act included a two-year extension of the TAG Program, though the extension does not apply to all accounts covered under the current program. The extension through December 31, 2012 applies only to non-interest bearing transaction accounts. Beginning January 1, 2011, low-interest consumer checking accounts ("NOW Accounts") will no longer be eligible for the unlimited guarantee. Unlike the original TAG Program, which allowed banks to opt in, the extended program will apply at all FDIC-insured institutions and will no longer be funded by separate premiums. The FDIC will account for the additional TAG insurance coverage in determining the amount of the general assessment it charges under the risk-based assessment system.
The second component of the Temporary Liquidity Guarantee Program, the Debt Guarantee Program, guarantees certain senior unsecured debt of participating organizations. HBC opted not to participate in this component of the Temporary Liquidity Guarantee Program.
Depositor Preference. In the event of the "liquidation or other resolution" of an insured depository institution, the claims of depositors of the institution, including the claims of the FDIC as subrogee of insured depositors, and certain claims for administrative expenses of the FDIC as a receiver, will have priority over other general unsecured claims against the institution. If an insured depository institution fails, insured and uninsured depositors, along with the FDIC, will have priority in payment ahead of unsecured, non-deposit creditors, including the parent bank holding company, with respect to any extensions of credit they have made to such insured depository institution.
Community Reinvestment Act ("CRA"). The CRA is intended to encourage insured depository institutions, while operating safely and soundly, to help meet the credit needs of their communities. The CRA specifically directs the federal bank regulatory agencies, in examining insured depository institutions, to assess their record of helping to meet the credit needs of their entire community, including low- and moderate-income neighborhoods, consistent with safe and sound banking practices. The CRA further requires the agencies to take a financial institution's record of meeting its community credit needs into account when evaluating applications for, among other things, domestic branches, consummating mergers or acquisitions, or holding company formations.
The federal banking agencies have adopted regulations which measure a bank's compliance with its CRA obligations on a performance-based evaluation system. This system bases CRA ratings on an institution's actual lending service and investment performance rather than the extent to which the institution conducts needs assessments, documents community outreach or complies with other procedural requirements. The ratings range from "outstanding" to a low of "substantial noncompliance." HBC had a CRA rating of "satisfactory" as of its most recent regulatory examination.
Other Consumer Protection Laws and Regulations. The bank regulatory agencies are increasingly focusing attention on compliance with consumer protection laws and regulations. Banks have been advised to carefully monitor compliance with various consumer protection laws and regulations. The federal Interagency Task Force on Fair Lending issued a policy statement on discrimination in home mortgage lending describing three methods that federal agencies will use to prove discrimination: overt evidence of discrimination, evidence of disparate treatment, and evidence of disparate impact. In addition to CRA and fair lending requirements, HBC is subject to numerous other federal consumer protection statutes and regulations. Due to heightened regulatory concern related to compliance with consumer protection laws
22
and regulations generally, HBC may incur additional compliance costs or be required to expend additional funds for investments in the local communities it serves.
Environmental Regulation. Federal, state and local laws and regulations regarding the discharge of harmful materials into the environment may have an impact on HBC. Since HBC is not involved in any business that manufactures, uses or transports chemicals, waste, pollutants or toxins that might have a material adverse effect on the environment, HBC's primary exposure to environmental laws is through its lending activities and through properties or businesses HBC may own, lease or acquire. Based on a general survey of HBC's loan portfolio, conversations with local appraisers and the type of lending currently and historically done by HBC, management is not aware of any potential liability for hazardous waste contamination that would be reasonably likely to have a material adverse effect on the Company as of December 31, 2010.
Safeguarding of Customer Information and Privacy. The Federal Reserve Board and other bank regulatory agencies have adopted guidelines for safeguarding confidential, personal customer information. These guidelines require financial institutions to create, implement and maintain a comprehensive written information security program designed to ensure the security and confidentiality of customer information, protect against any anticipated threats or hazards to the security or integrity of such information and protect against unauthorized access to or use of such information that could result in substantial harm or inconvenience to any customer. HBC has adopted a customer information security program to comply with such requirements.
Financial institutions are also required to implement policies and procedures regarding the disclosure of nonpublic personal information about consumers to non-affiliated third parties. In general, financial institutions must provide explanations to consumers on policies and procedures regarding the disclosure of such nonpublic personal information, and, except as otherwise required by law, prohibits disclosing such information except as provided in HBC's policies and procedures. HBC has implemented privacy policies addressing these restrictions which are distributed regularly to all existing and new customers of HBC.
USA Patriot Act of 2001. On October 26, 2001, President Bush signed the USA Patriot Act of 2001 (the "Patriot Act"). Enacted in response to the terrorist attacks in New York, Pennsylvania and Washington, D.C. on September 11, 2001, the Patriot Act is intended to strengthen the ability of U.S. law enforcement agencies and intelligence communities to work cohesively to combat terrorism on a variety of fronts. The impact of the Patriot Act on financial institutions of all kinds has been significant and wide-ranging. The Patriot Act substantially enhanced existing anti-money laundering and financial transparency laws, and required appropriate regulatory authorities to adopt rules to promote cooperation among financial institutions, regulators, and law enforcement entities in identifying parties that may be involved in terrorism or money laundering. Under the Patriot Act, financial institutions are subject to prohibitions regarding specified financial transactions and account relationships, as well as enhanced due diligence and "know your customer" standards in their dealings with foreign financial institutions and foreign customers. For example, the enhanced due diligence policies, procedures, and controls generally require financial institutions to take reasonable steps:
- •
- to conduct enhanced scrutiny of account relationships to guard against money laundering and report any suspicious
transactions;
- •
- to ascertain the identity of the nominal and beneficial owners of, and the source of funds deposited into, each account as
needed to guard against money laundering and report any suspicious transactions;
- •
- to ascertain for any foreign bank, the shares of which are not publicly traded, the identity of the owners of the foreign
bank, and the nature and extent of the ownership interest of each such owner; and
- •
- to ascertain whether any foreign bank provides correspondent accounts to other foreign banks and, if so, the identity of those foreign banks and related due diligence information.
23
The Patriot Act also requires all financial institutions to establish anti-money laundering programs, which must include, at a minimum:
- •
- the development of internal policies, procedures, and controls;
- •
- the designation of a compliance officer;
- •
- an ongoing employee training program; and
- •
- an independent audit function to test the programs.
Material deficiencies in anti-money laundering compliance can result in public enforcement actions by the banking agencies, including the imposition of civil money penalties and supervisory restrictions on growth and expansion. Such enforcement actions could also have serious reputation consequences for HCC and HBC.
Office of Foreign Assets Control Regulation. The United States has imposed economic sanctions that affect transactions with designated foreign countries, nationals and others. These are typically known as the "OFAC" rules based on their administration by the U.S. Treasury Department Office of Foreign Assets Control ("OFAC"). The OFAC-administered sanctions targeting countries take many different forms. Generally, however, they contain one or more of the following elements: (i) restrictions on trade with or investment in a sanctioned country, including prohibitions against direct or indirect imports from and exports to a sanctioned country and prohibitions on "U.S. persons" engaging in financial transactions relating to making investments in, or providing investment-related advice or assistance to, a sanctioned country; and (ii) a blocking of assets in which the government or specially designated nationals of the sanctioned country have an interest, by prohibiting transfers of property subject to U.S. jurisdiction (including property in the possession or control of U.S. persons). Blocked assets (e.g., property and bank deposits) cannot be paid out, withdrawn, set off or transferred in any manner without a license from OFAC. Failure to comply with these sanctions could have serious legal and reputational consequences.
Other Aspects of Banking Law. HBC is also subject to federal statutory and regulatory provisions covering, among other things, security procedures, insider and affiliated party transactions, management interlocks, electronic funds transfers, funds availability, and truth-in-savings.
U.S. Treasury Capital Purchase Program
On November 21, 2008, HCC entered into a Securities Purchase Agreement Standard Terms with the U.S. Treasury pursuant to the U.S. Treasury Capital Purchase Program authorized under the Emergency Economic Stabilization Act. In accordance with the Purchase Agreement HCC sold to the U.S. Treasury, for an aggregate purchase price of $40 million, Series A Preferred Stock and issued a warrant to purchase 462,963 shares of HCC common stock. Under the terms of the Capital Purchase Program, HCC is prohibited from increasing dividends on its common stock, and from making certain repurchases of equity securities, including its common stock, without the U.S. Treasury's consent. Furthermore, as long as the preferred stock issued to the U.S. Treasury is outstanding, dividend payments and repurchases or redemptions relating to certain equity securities, including HCC's common stock, are prohibited until all accrued and unpaid dividends are paid on such preferred stock. In order to participate in the Capital Purchase Program, financial institutions were required to adopt certain standards for executive compensation and corporate governance. These standards generally apply to the chief executive officer, chief financial officer and the three next most highly compensated senior executive officers.
On February 15, 2011, HCC suspended payment of dividends on the Series A Preferred Stock for the sixth consecutive quarter, and therefore, the U.S. Treasury has the right to appoint two members to the Company's Board of Directors. If the U.S. Treasury exercises its rights, these directors would serve on the Company's Board of Directors until such time as the Company has paid in full all dividends not previously paid. So long as payment of dividends on the Series A Preferred Stock remain suspended, we may not, among other things and with limited exceptions, pay cash dividends on or repurchase our common stock or preferred stock. As of the date of this filing, the Company has not been advised whether the U.S. Treasury will exercise its rights to elect two members to the Board of Directors and, in the meantime, the U.S
24
Treasury has requested, and the Company has agreed to permit, effective in the first quarter of 2011 an observer employed by the U.S Treasury to attend meetings of the Company's Board of Directors.
The bank regulatory agencies, U.S. Treasury and the Office of Special Inspector General, also created by the Emergency Economic Stabilization Act, have issued guidance and requests to the financial institutions that participate in the Capital Purchase Program to document their plans and use of the proceeds from the sale of the preferred stock and their plans for addressing the executive compensation requirements associated with the Capital Purchase Program.
In addition, the American Recovery and Reinvestment Act imposes certain new executive compensation and corporate expenditure limits on all current and future Capital Purchase Program recipients, including the Company, until the institution has repaid the U.S. Treasury, which is permitted under the American Recovery Reinvestment Act without penalty, subject to the U.S. Treasury's consultation with the recipient's appropriate regulatory agency. The executive compensation standards are more stringent than those in effect under the Emergency Economic Stabilization Act. The new standards include: (i) prohibitions on bonuses, retention awards and other incentive compensation, other than restricted stock grants which do not fully vest until the preferred stock issued to the U.S. Treasury is no longer outstanding up to one-third of an employee's total annual compensation; (ii) prohibitions on golden parachute payments for departure from a company; (iii) an expanded clawback of bonuses, retention awards, and incentive compensation if payment is based on materially inaccurate statements of earnings, revenues, gains or other criteria; (iv) prohibitions on compensation plans that encourage manipulation of reported earnings; (v) retroactive review of bonuses, retention awards and other compensation previously provided by Capital Purchase Program recipients if found by the U.S. Treasury to be inconsistent with the purposes of the Emergency Economic Stabilization Act or otherwise contrary to the public interest; (vi) required establishment of a company-wide policy regarding "excessive or luxury expenditures"; and (vii) inclusion in a participant's proxy statements for annual shareholder meetings of a nonbinding "say on pay" shareholder vote on the compensation of executives.
Other Pending and Proposed Legislation
Other legislative and regulatory initiatives which could affect HCC, HBC and the banking industry in general may be proposed or introduced before the United States Congress, the California legislature and other governmental bodies in the future. Such proposals, if enacted, may further alter the structure, regulation and competitive relationship among financial institutions, and may subject HCC or HBC to increased regulation, disclosure and reporting requirements. In addition, the various banking regulatory agencies often adopt new rules and regulations to implement and enforce existing legislation. It cannot be predicted whether, or in what form, any such legislation or regulations may be enacted or the extent to which the business of HCC or HBC would be affected thereby.
Employees
At December 31, 2010, the Company had 181 full-time equivalent employees. The Company's employees are not represented by any union or collective bargaining agreement and the Company believes its employee relations are satisfactory.
Our business, financial condition and results of operations are subject to various risks, including those discussed below. The risks discussed below are those that we believe are the most significant risks, although additional risks not presently known to us or that we currently deem less significant may also adversely affect our business, financial condition and results of operations, perhaps materially.
25
Risks Relating to Recent Economic Conditions and Governmental Response Efforts
Our business may be adversely affected by conditions in the financial markets and economic conditions generally.
The United States economy has experienced a downturn since 2007, leading to a general reduction of business activity and growth across industries and regions. Consumer spending, liquidity and availability of credit have all been restricted, and unemployment has increased nationally as well as in the markets we serve.
The financial services industry and the securities markets generally have been materially and adversely affected by significant declines in the values of nearly all asset classes. General declines in home prices and the resulting impact on sub-prime mortgages, and eventually, all mortgage and real estate classes as well as equity markets resulted in widespread shortages of liquidity across the financial services industry. Continuation of the economic downturn, high unemployment and liquidity shortages may negatively impact our operating results. Additionally, adverse changes in the economy may also have a negative effect on the ability of our borrowers to make timely repayments of their loans. These factors could expose us to an increased risk of loan defaults and losses and have an adverse impact on our earnings.
Recent legislative and required regulatory initiatives will impose restrictions and requirements on financial institutions that could have an adverse effect on our business.
The United States Congress, the Treasury Department and the Federal Deposit Insurance Corporation have taken several steps to support the financial services industry, which have included certain well-publicized programs, such as the Troubled Asset Relief Program, as well as programs enhancing the liquidity available to financial institutions and increasing insurance available on bank deposits. These programs have provided an important source of support to many financial institutions. Partly in response to these programs and the current economic climate, the President signed into law on July 21, 2010 the Dodd-Frank Wall Street Reform and Consumer Protection Act of 2010 (the "Dodd-Frank Act"). Few provisions of the Dodd-Frank Act are effective immediately, with various provisions becoming effective in stages. Many of the provisions require governmental agencies to implement rules over the next 18 months. These rules will increase regulation of the financial services industry and impose restrictions on the ability of firms within the industry to conduct business consistent with historical practices. These rules will, as examples, impact the ability of financial institutions to charge certain banking and other fees, allow interest to be paid on demand deposits, impose new restrictions on lending practices and require depository institution holding companies to maintain capital levels at levels not less than the levels required for insured depository institutions. The Dodd-Frank Act creates a new financial consumer protection agency, known as the Bureau of Consumer Financial Protection (the "Bureau"), that is empowered to promulgate new consumer protection regulations and revise existing regulations in many areas of consumer compliance, which will increase our regulatory compliance burden and costs and may restrict the financial products and services we offer to our customers. Moreover, the Dodd-Frank Act permits states to adopt stricter consumer protection laws and state attorney generals may enforce consumer protection rules issued by the Bureau. The Dodd-Frank Act prohibits new trust preferred issuances from counting as Tier 1 capital. These restrictions will limit future capital strategies. Although we do not use derivative transactions, the Dodd-Act also increases regulation of derivatives and hedging transactions, which could limit our ability in the future to enter into, or increase the costs associated with, interest rate and other hedging transactions. Although certain provisions of the Dodd-Frank Act, such as direct supervision by the Bureau, will not apply to banking organizations with less than $10 billion of assets, such as the Company, the changes resulting from the legislation will impact our business. These changes will require us to invest significant management attention and resources to evaluate and make necessary changes.
Any future FDIC insurance premium increases will adversely affect our earnings.
In April 2009, FDIC revised its risk-based assessment system. The changes to the assessment system involve adjustments to the risk-based calculation of an institution's unsecured debt, secured liabilities and brokered deposits. As a result of the recent revisions, we anticipate paying higher FDIC insurance
26
premiums, which will add to our cost of operations and, thus, adversely affect our results of operations. Depending on any future losses that the FDIC insurance fund may suffer due to failed institutions, there can be no assurance that there will not be additional premium increases in order to replenish the fund. FDIC deposit insurance expense for the year ended December 31, 2010 was approximately $4.0 million. During the latter half of 2009 the FDIC issued a final ruling requiring insured institutions, exclusive of those granted an exemption, to pre-pay their regulatory assessments for 2010, 2011 and 2012. We were granted an exemption.
Risks Related to Our Market and Business
We are subject to a Written Agreement with the Federal Reserve and the California Department of Financial Institutions, and in the future may become subject to additional supervisory actions and/or enhanced regulation that could have a material adverse effect on our business, operating flexibility, financial condition and the value of our common stock.
Under federal and state laws and regulations pertaining to the safety and soundness of insured depository institutions, various state regulators (for state chartered-banks), the Federal Reserve (for bank holding companies and state member banks), the California Department of Financial Institutions (for California state-chartered banks) ("DFI") and separately the FDIC as the insurer of bank deposits, each have the authority to compel or restrict certain actions on our part if they determine that we have insufficient capital or are otherwise operating in a manner that may be deemed to be inconsistent with safe and sound banking practices. Under their respective authority, our bank regulators can require us to enter into informal or formal enforcement orders, including board resolutions, memoranda of understanding, written agreements and consent or cease and desist orders, pursuant to which we may be required to take identified corrective actions to address cited concerns and to refrain from taking certain actions.
On February 17, 2010 HCC and HBC entered into a Written Agreement with the Federal Reserve Bank of San Francisco and the DFI. Among other things, the Written Agreement required HCC and HBC to submit to the Federal Reserve and the DFI their continuing plans to enhance credit risk and administration functions, to maintain policies and procedures for the maintenance of an adequate allowance for loan losses, to improve earnings, to improve HBC's liquidity position and funds management practices, and to update the Company's capital plan in order to maintain capital at or above sufficient levels based on the respective risk profiles of HCC and HBC. The Written Agreement also restricts the payment of dividends and any payments on trust preferred securities and related subordinated debt, or any reduction in capital or the purchase or redemption of stock without the prior approval of the Federal Reserve and the DFI. The Written Agreement requires the Company to comply with restrictions on indemnification and golden parachute payments, and to comply with notice and approval requirements related to the appointment of directors and senior executive officers. Progress reports detailing the form and manner of all actions taken to secure compliance with the Written Agreement must be submitted to the Federal Reserve and DFI at least quarterly. See Item 1 — "Business — Regulatory Action."
If we are unable to comply with the terms of the Written Agreement with the Federal Reserve and DFI, or if we are unable to comply with the terms of any future regulatory orders to which we may become subject, then we could become subject to additional supervisory actions and orders, including cease and desist orders, prompt corrective action and/or other regulatory enforcement actions. If our regulators were to take such additional supervisory actions, then we could, among other things, become subject to significant restrictions on our ability to develop any new business, as well as restrictions on our existing business, and we could be required to raise additional capital, dispose of certain assets and liabilities within a prescribed period of time, or both. Failure to implement the measures in the time frames provided, or at all, could result in additional orders or penalties from the Federal Reserve and the DFI, which could include further restrictions on the Company's business, assessment of civil money penalties on the Company, as well as its directors, officers and other affiliated parties, termination of deposit insurance, removal of one or more officers and/or directors and the liquidation or other closure of the Company. The terms of any such supervisory action and the consequences associated with any failure to comply therewith
27
could have a material negative effect on our business, operating flexibility, financial condition and the value of our common stock.
We are subject to credit risk.
There are inherent risks associated with our lending activities. These risks include, among other things, the impact of changes in interest rates and changes in the economic conditions in the markets where we operate as well as those across the United States and abroad. Increases in interest rates and/or weakening economic conditions could adversely impact the ability of borrowers to repay outstanding loans or the value of the collateral securing these loans. We are also subject to various laws and regulations that affect our lending activities. Failure to comply with applicable laws and regulations could subject us to regulatory enforcement action that could result in the assessment of significant civil money penalties against us.
We seek to mitigate the risks inherent in our loan portfolio by adhering to specific underwriting practices. Although we believe that our underwriting criteria are appropriate for the various kinds of loans we make, we may incur losses on loans that meet our underwriting criteria, and these losses may exceed the amounts set aside as reserves in our allowance for loan losses. Due to recent economic conditions affecting the real estate market, many lending institutions, including us, have experienced substantial declines in the performance of their loans, including construction, land development loans and land loans. The value of real estate collateral supporting many construction and land development loans, land loans, commercial loans and multi-family loans have declined and may continue to decline. Recent negative developments in the financial industry and credit markets may continue to adversely impact our financial condition and results of operations.
Our allowance for loan losses may not be adequate to cover actual loan losses, which could adversely affect our earnings.
We maintain an allowance for loan losses for probable incurred losses in the portfolio. The allowance is established through a provision for loan losses based on management's evaluation of the risks inherent in the loan portfolio and the general economy. The allowance is also appropriately increased for new loan growth. The allowance is based upon a number of factors, including the size of the loan portfolio, asset classifications, economic trends, industry experience and trends, industry and geographic concentrations, estimated collateral values, management's assessment of the credit risk inherent in the portfolio, historical loan loss experience and loan underwriting policies.
In addition, we evaluate all loans identified as problem loans and allocate an allowance based upon our estimation of the potential loss associated with those problem loans. While we strive to carefully manage and monitor credit quality and to identify loans that may be deteriorating, at any time there are loans included in the portfolio that may result in losses, but that have not yet been identified as potential problem loans. Through established credit practices, we attempt to identify deteriorating loans and adjust the allowance for loan losses accordingly. However, because future events are uncertain and because we may not successfully identify all deteriorating loans in a timely manner, there may be loans that deteriorate in an accelerated time frame. As a result, future additions to the allowance may be necessary. Further, because the loan portfolio contains a number of commercial real estate, construction, and land development loans with relatively large balances, a deterioration in the credit quality of one or more of these loans may require a significant increase to the allowance for loan losses. Future additions to the allowance may also be required based on changes in the financial condition of borrowers, such as changes resulting from the current, and potentially worsening, economic conditions or as a result of incorrect assumptions by management in determining the allowance for loan losses. Our regulators, as an integral part of their examination process, periodically review our allowance for loan losses and may require us to increase our allowance for loan losses by recognizing additional provisions for loan losses charged to expense, or to decrease our allowance for loan losses by recognizing loan charge-offs, net of recoveries. Any such additional provisions for loan losses or charge-offs, as required by these regulatory agencies, could have a material adverse effect on our financial condition and results of operations.
28
Nonperforming assets take significant time to resolve and adversely affect our results of operations and financial condition.
At December 31, 2010, nonperforming loans were 3.93% of the total loan portfolio plus nonaccrual loans held-for-sale and 2.78% of total assets. Nonperforming assets adversely affect our earnings in various ways. Until economic and market conditions improve, we may continue to incur losses relating to an increase in nonperforming assets. We do not record interest income on nonaccrual loans or other real estate owned, thereby adversely affecting our income, and increasing our loan administration costs. Upon foreclosure or similar proceedings, we record the repossessed asset at the estimated fair value, less costs to sell, which may result in a loss. An increase in the level of nonperforming assets increases our risk profile and may impact the capital levels our regulators believe are appropriate in light of the increased risk profile. While we reduce problem assets through collection efforts, asset sales, workouts, restructurings and otherwise, decreases in the value of the underlying collateral, or in these borrowers' performance or financial condition, whether or not due to economic and market conditions beyond our control, could adversely affect our business, results of operations and financial condition.
In addition, the resolution of nonperforming assets requires significant commitments of time from management and our directors, which can be detrimental to the performance of their other responsibilities. If the current economic and market conditions persist or worsen, it is likely that we will experience future increases in nonperforming assets, particularly if we are unsuccessful in our efforts to reduce our classified assets, which would have a significant adverse effect on our business.
We may be required to make additional provisions for loan losses and charge off additional loans in the future, which could adversely affect our results of operations.
For the year ended December 31, 2010, we recorded a $26.8 million provision for loan losses, charged-off $32.2 million of loans, and recovered $1.8 million of loans. Since 2008 there has been a significant slowdown in the real estate markets in portions of counties in California where a majority of our loan customers, including our largest borrowing relationships, are based. This slowdown reflects declining prices in real estate, higher levels of inventories of homes and higher vacancies in commercial and industrial properties, all of which have contributed to financial strain on real estate developers and suppliers. At December 31, 2010, we had $337.5 million in commercial and residential real estate loans and $62.4 million in construction and land real estate loans, of which $22.1 million were on nonaccrual at December 31, 2010. Construction loans and commercial real estate loans comprise a substantial portion of our nonperforming assets. Continued deterioration in the real estate market could affect the ability of our loan customers to service their debt, which could result in additional loan charge-offs and provisions for loan losses in the future, which could have a material adverse effect on our financial condition, results of operations and capital.
Our business is subject to interest rate risk and variations in interest rates may negatively affect our financial performance.
Our earnings and cash flows are highly dependent upon net interest income. Net interest income is the difference between interest income earned on interest-earning assets such as loans and securities and interest expense paid on interest-bearing liabilities such as deposits and borrowed funds. Our net interest income (including net interest spread and margin) and ultimately our earnings are impacted by changes in interest rates and monetary policy. Changes in interest rates and monetary policy can impact the demand for new loans, the credit profile of our borrowers, the yields earned on loans and securities and rates paid on deposits and borrowings. Given our current volume and mix of interest-bearing liabilities and interest-earning assets, we would expect our interest rate spread (the difference in the rates paid on interest-bearing liabilities and the yields earned on interest-earning assets) as well as net interest income to increase if interest rates rise and, conversely, to decline if interest rates fall. Additionally, increasing levels of competition in the banking and financial services business may decrease our net interest spread as well as net interest margin by forcing us to offer lower lending interest rates and pay higher deposit interest rates. Although we believe our current level of interest rate sensitivity is reasonable, significant fluctuations in interest rates (such as a sudden and substantial increase in Prime and Overnight Fed Funds rates) as well as increasing competition may require us to increase rates on deposits at a faster pace than the yield we receive on interest-earning assets increases. The impact of any sudden and substantial move in interest rates and/or increased competition may have an adverse effect on our business, financial condition and results of operations, as our net interest income (including the net interest spread and margin) may be negatively impacted.
29
Additionally, a sustained decrease in market interest rates could adversely affect our earnings. When interest rates decline, borrowers tend to refinance higher-rate, fixed-rate loans at lower rates, prepaying their existing loans. Under those circumstances, we would not be able to reinvest those prepayments in assets earning interest rates as high as the rates on the prepaid loans. In addition, our commercial real estate and commercial loans, which carry interest rates that, in general, adjust in accordance with changes in the prime rate, will adjust to lower rates. We are also significantly affected by the level of loan demand available in our market. The inability to make sufficient loans directly affects the interest income we earn. Lower loan demand will generally result in lower interest income realized as we place funds in lower yielding investments.
Liquidity risk could impair our ability to fund operations and jeopardize our financial condition.
Liquidity is essential to our business. An inability to raise funds through deposits, borrowings, the sale of loans and other sources could have a substantial negative effect on our liquidity. Our access to funding sources in amounts adequate to finance our activities could be impaired by factors that affect us specifically or the financial services industry in general. Factors that could detrimentally impact our access to liquidity sources include a decrease in the level of our business activity due to a market downturn in markets in which our loans are concentrated or adverse regulatory action against us. Our ability to borrow could also be impaired by factors that are not specific to us, such as a severe disruption of the financial markets or negative views and expectations about the prospects for the financial services industry as a whole.
If we lost a significant portion of our low-cost deposits, it would negatively impact our liquidity and profitability.
Our profitability depends in part on our success in attracting and retaining a stable base of low-cost deposits. At December 31, 2010, 28% of our deposit base was comprised of noninterest-bearing deposits. While we generally do not believe these core deposits are sensitive to interest rate fluctuations, the competition for these deposits in our markets is strong and customers are increasingly seeking investments that are safe, including the purchase of U.S. Treasury securities and other government-guaranteed obligations, as well as the establishment of accounts at the largest, most-well capitalized banks. If we were to lose a significant portion of our low-cost deposits, it would negatively impact our liquidity and profitability.
We borrow from the Federal Home Loan Bank and the Federal Reserve, and there can be no assurance these programs will continue in their current manner.
We, at times, utilize the Federal Home Loan Bank of San Francisco for overnight borrowings and term advances; we also borrow from the Federal Reserve Bank of San Francisco and from correspondent banks under our Federal funds lines of credit. The amount loaned to us is generally dependent on the value of the collateral pledged. These lenders could reduce the percentages loaned against various collateral categories, could eliminate certain types of collateral and could otherwise modify or even terminate their loan programs, particularly to the extent they are required to do so because of capital adequacy or other balance sheet concerns. Any change or termination of the programs under which we borrow from the Federal Home Loan Bank of San Francisco, the Federal Reserve Bank of San Francisco or correspondent banks could have an adverse effect on our liquidity and profitability.
Our results of operations may be adversely affected by other-than-temporary impairment charges relating to our securities portfolio.
We may be required to record future impairment charges on our securities, including our stock in the Federal Home Loan Bank of San Francisco, if they suffer declines in value that we consider other-than-temporary. Numerous factors, including the lack of liquidity for re-sales of certain securities, the absence of reliable pricing information for securities, adverse changes in the business climate, adverse regulatory actions or unanticipated changes in the competitive environment, could have a negative effect
30
on our securities portfolio in future periods. Significant impairment charges could also negatively impact our regulatory capital ratios and result in HBC not being classified as "well-capitalized" for regulatory purposes.
We depend on cash dividends from our subsidiary bank to meet our cash obligations, but our Written Agreement prohibits the payment of such dividends without prior regulatory approval, which may impair our ability to fulfill our obligations.
As a holding company, dividends from our subsidiary bank provide a substantial portion of our cash flow used to service the interest payments on our trust preferred securities, dividends on our preferred stock and other obligations, including any cash dividends on our common stock. Various statutory provisions restrict the amount of dividends our subsidiary bank can pay to us without regulatory approval. Under our Written Agreement, HBC cannot pay any cash dividends or other payments to the holding company without prior written consent of the regulatory authorities. Additionally, HCC cannot declare or pay any dividends (including those on outstanding preferred stock issued to the U.S. Treasury under the TARP Capital Purchase Program) or make any distributions of principal, interest or other sums on its trust preferred securities without prior written approval of the Federal Reserve and DFI.
We may need to raise additional capital in the future and such capital may not be available when needed or at all.
We may need to raise additional capital in the future to provide us with sufficient capital resources and liquidity to meet our commitments and business needs. Our ability to raise additional capital, if needed, will depend on, among other things, conditions in the capital markets at that time, which are outside of our control, and our financial performance. The ongoing liquidity crisis and the loss of confidence in financial institutions may increase our cost of funding and limit our access to some of our customary sources of capital, including, but not limited to, inter-bank borrowings, repurchase agreements and borrowings from the discount window of the Federal Reserve.
We cannot assure you that such capital will be available to us on acceptable terms or at all. Any occurrence that may limit our access to the capital markets, such as a decline in the confidence of debt purchasers, depositors of HBC or counterparties participating in the capital markets may adversely affect our capital costs and our ability to raise capital and, in turn, our liquidity. An inability to raise additional capital on acceptable terms when needed could have a material adverse effect on our business, financial condition and results of operations.
Our profitability is dependent upon the economic conditions of the markets in which we operate.
We operate primarily in Santa Clara County, Contra Costa County and Alameda County and, as a result, our financial condition and results of operations are subject to changes in the economic conditions in those areas. Our success depends upon the business activity, population, income levels, deposits and real estate activity in these markets. Although our customers' business and financial interests may extend well beyond these market areas, adverse economic conditions that affect these market areas could reduce our growth rate, affect the ability of our customers to repay their loans to us and generally affect our financial condition and results of operations. Our lending operations are located in market areas dependent on technology and real estate industries and their supporting companies. Thus, our borrowers could be adversely impacted by a downturn in these sectors of the economy that could reduce the demand for loans and adversely impact the borrowers' ability to repay their loans, which would, in turn, increase our nonperforming assets. Because of our geographic concentration, we are less able than regional or national financial institutions to diversify our credit risks across multiple markets.
31
Our loan portfolio has a large concentration of real estate loans in California, which involve risks specific to real estate values.
A further downturn in our real estate markets could adversely affect our business because many of our loans are secured by real estate. Real estate lending (including commercial, land development and construction) is a large portion of our loan portfolio. At December 31, 2010, approximately $453.5 million, or 54% of our loan portfolio, was secured by various forms of real estate, including residential and commercial real estate. Included in the $453.5 million of loans secured by real estate were $252.8 million (or 56%) of owner-occupied loans. The real estate securing our loan portfolio is concentrated in California which has experienced a significant decline in real estate values. There have been adverse developments affecting real estate values in one or more of our markets. The market value of real estate can fluctuate significantly in a short period of time as a result of market conditions in the geographic area in which the real estate is located. Real estate values and real estate markets are generally affected by changes in national, regional or local economic conditions, fluctuations in interest rates and the availability of loans to potential purchasers, changes in tax laws and other governmental statutes, regulations and policies and acts of nature, such as earthquakes and natural disasters particular to California. Additionally, commercial real estate lending typically involves larger loan principal amounts and the repayment of the loans generally is dependent, in large part, on sufficient income from the properties securing the loans to cover operating expenses and debt service. If real estate values, including values of land held for development, continue to decline, the value of real estate collateral securing our loans could be significantly reduced. Our ability to recover on defaulted loans by foreclosing and selling the real estate collateral would then be diminished and we would be more likely to suffer losses on defaulted loans.
Our construction and land development loans are based upon estimates of costs and value associated with the complete project. These estimates may be inaccurate and we may be exposed to more losses on these projects than on other loans.
At December 31, 2010, land and construction loans, including land acquisition and development total $62.4 million or 7% of our loan portfolio. This amount was comprised of 12% owner-occupied and 88% non-owner occupied construction and land loans. Additionally at December 31, 2010, there were no unfunded amounts in the land and construction real estate loan portfolio. Risk of loss on a construction loan depends largely upon whether our initial estimate of the property's value at completion of construction equals or exceeds the cost of the property construction (including interest) and the availability of permanent take-out financing. During the construction phase, a number of factors can result in delays and cost overruns. Because of the uncertainties inherent in estimating construction costs, as well as the market value of the completed project, it is relatively difficult to evaluate accurately the total funds required to complete a project and the related loan-to-value ratio. As a result, construction loans often involve the disbursement of substantial funds with repayment dependent primarily on the completion of the project and the ability of the borrower to sell the property, rather than the ability of the borrower or guarantor to repay principal and interest. If estimates of value are inaccurate or if actual construction costs exceed estimates, the value of the property securing the loan may be insufficient to ensure full repayment. If our appraisal of the value of the completed project proves to be overstated, our collateral may be inadequate for the repayment of the loan upon completion of construction of the project. If we are forced to foreclose on a project prior to or at completion due to a default, there can be no assurance that we will be able to recover all of the unpaid balance of, and accrued interest on, the loan as well as related foreclosure and holding costs. In addition, we may be required to fund additional amounts to complete the project and may have to hold the property for an unspecified period of time.
We must effectively manage our growth strategy.
As part of our general growth strategy, we may expand into additional communities or attempt to strengthen our position in our current markets by opening new offices, subject to any regulatory constraints
32
on our ability to open new offices. To the extent that we are able to open additional offices, we are likely to experience the effects of higher operating expenses relative to operating income from the new operations for a period of time, which may have an adverse effect on our levels of reported net income, return on average equity and return on average assets. Our current growth strategies involve internal growth from our current offices and, subject to any regulatory constraints on our ability to open new branch offices, the addition of new offices over time, so that the additional overhead expenses associated with these openings are absorbed prior to opening other new offices.
We have a significant deferred tax asset and cannot assure that it will be fully realized.
Deferred tax assets and liabilities are the expected future tax amounts for the temporary differences between the carrying amounts and tax basis of assets and liabilities computed using enacted tax rates. If we determine that we will not achieve sufficient future taxable income to realize our net deferred tax asset, we are required under generally accepted accounting principles to establish a full or partial valuation allowance. If we determine that a valuation allowance is necessary, we are required to incur a charge to operations. We regularly assess available positive and negative evidence to determine whether it is more likely than not that our net deferred tax asset will be realized. Realization of a deferred tax asset requires us to apply significant judgment and is inherently speculative because it requires estimates that cannot be made with certainty. At December 31, 2010, we had a net deferred tax asset of $27.4 million. For the year ended December 31, 2010, we established a partial valuation allowance of $3.7 million. If we were to determine at some point in the future that we will not achieve sufficient future taxable income to realize our net deferred tax asset, we would be required, under generally accepted accounting principles, to establish a full or increase our partial valuation allowance which would require us to incur a charge to operations for the period in which the determination was made.
We face strong competition from financial service companies and other companies that offer banking services.
We face substantial competition in all phases of our operations from a variety of different competitors. Our competitors, including larger commercial banks, community banks, savings and loan associations, mutual savings banks, credit unions, consumer finance companies, insurance companies, securities dealers, brokers, mortgage bankers, investment advisors, money market mutual funds and other financial institutions, compete with lending and deposit-gathering services offered by us. Increased competition in our markets may result in reduced loans and deposits.
Many of these competing institutions have much greater financial and marketing resources than we have. Due to their size, many competitors can achieve larger economies of scale and may offer a broader range of products and services than we can. If we are unable to offer competitive products and services, our business may be negatively affected.
Some of the financial services organizations with which we compete are not subject to the same degree of regulation as is imposed on bank holding companies and federally insured financial institutions or are not subject to increased supervisory oversight arising from regulatory examinations. As a result, these non-bank competitors have certain advantages over us in accessing funding and in providing various services. The banking business in our primary market areas is very competitive, and the level of competition facing us may increase further, which may limit our asset growth and financial results.
We are subject to extensive government regulation that could limit or restrict our activities, which in turn may adversely impact our ability to increase our assets and earnings.
We operate in a highly regulated environment and are subject to supervision and regulation by a number of governmental regulatory agencies, including the Federal Reserve, the DFI and the FDIC. Regulations adopted by these agencies, which are generally intended to provide protection for depositors and customers rather than for the benefit of shareholders, govern a comprehensive range of matters
33
relating to ownership and control of our shares, our acquisition of other companies and businesses, permissible activities for us to engage in, maintenance of adequate capital levels, and other aspects of our operations. These bank regulators possess broad authority to prevent or remedy unsafe or unsound practices or violations of law. The laws and regulations applicable to the banking industry could change at any time and we cannot predict the effects of these changes on our business and profitability. Increased regulation could increase our cost of compliance and adversely affect profitability. Moreover, certain of these regulations contain significant punitive sanctions for violations, including monetary penalties and limitations on a bank's ability to implement components of its business plan, such as expansion through mergers and acquisitions or the opening of new branch offices. In addition, changes in regulatory requirements may add costs associated with compliance efforts. Furthermore, government policy and regulation, particularly as implemented through the Federal Reserve System, significantly affect credit conditions. As a result of the negative financial market and general economic trends, there is a potential for new federal or state laws and regulation regarding lending and funding practices and liquidity standards, and bank regulatory agencies have been and are expected to be aggressive in responding to concerns and trends identified in examinations, including the expected issuance of many formal enforcement orders. Negative developments in the financial industry and the impact of new legislation and regulation in response to those developments could negatively impact our business operations and adversely impact our financial performance. We are also subject to supervision, regulation and investigation by the U.S. Treasury and the Office of the Special Inspector General under the Emergency Economic Stabilization Act and the American Recovery and Reinvestment Act by virtue of our participation in the U.S. Treasury Capital Purchase Program.
Technology is continually changing and we must effectively implement new technologies.
The financial services industry is undergoing rapid technological changes with frequent introductions of new technology-driven products and services. In addition to better serving customers, the effective use of technology increases efficiency and enables us to reduce costs. Our future success will depend in part upon our ability to address the needs of our customers by using technology to provide products and services that will satisfy customer demands for convenience as well as to create additional efficiencies in our operations as we continue to grow and expand our market areas. In order to anticipate and develop new technology, we employ a qualified staff of internal information system specialists and consider this area a core part of our business. We do not develop our own software products, but have been able to respond to technological changes in a timely manner through association with leading technology vendors. We must continue to make substantial investments in technology which may affect our results of operations. If we are unable to make such investments, or we are unable to respond to technological changes in a timely manner, our operating costs may increase which could adversely affect our results of operations.
System failure or breaches of our network security could subject us to increased operating costs as well as litigation and other liabilities.
The computer systems and network infrastructure we use could be vulnerable to unforeseen problems. Our operations are dependent upon our ability to protect our computer equipment against damage from physical theft, fire, power loss, telecommunications failure or a similar catastrophic event, as well as from security breaches, denial of service attacks, viruses, worms and other disruptive problems caused by hackers. Any damage or failure that causes an interruption in our operations could have a material adverse effect on our financial condition and results of operations. Computer break-ins and other disruptions could also jeopardize the security of information stored in and transmitted through our computer systems and network infrastructure, which may result in significant liability to us and may cause existing and potential customers to refrain from doing business with us. We employ external auditors to conduct auditing and testing for weaknesses in our systems, controls, firewalls and encryption to reduce the likelihood of any security failures or breaches. Although we, with the help of third-party service providers and auditors,
34
intend to continue to implement security technology and establish operational procedures to prevent such damage, there can be no assurance that these security measures will be successful. In addition, advances in computer capabilities, new discoveries in the field of cryptography or other developments could result in a compromise or breach of the algorithms we and our third-party service providers use to encrypt and protect customer transaction data. A failure of such security measures could have a material adverse effect on our financial condition and results of operations.
We are exposed to the risk of environmental liabilities with respect to properties to which we take title.
In the course of our business, when a borrower defaults on a loan secured by real property, we generally purchase the property in foreclosure or accept a deed to the property surrendered by the borrower. We may also take over the management of properties when owners have defaulted on loans. While we have guidelines intended to exclude properties with an unreasonable risk of contamination, hazardous substances may exist on some of the properties that we own, manage or occupy and unknown hazardous risks could impact the value of real estate collateral. We may be held liable to a governmental entity or to third parties for property damage, personal injury, investigation and clean-up costs incurred by these parties in connection with environmental contamination, or may be required to investigate or clean up hazardous or toxic substances, or chemical releases at a property. The costs associated with investigation or remediation activities could be substantial and exceed the value of the property. In addition, if we are the owner or former owner of a contaminated site, we may be subject to common law claims by third parties based on damages and costs resulting from environmental contamination emanating from the property. If we become subject to significant environmental liabilities, our business, financial condition, results of operations and prospects could be adversely affected.
Managing operational risk is important to attracting and maintaining customers, investors and employees.
Operational risk represents the risk of loss resulting from our operations, including but not limited to, the risk of fraud by employees or persons outside the Company, the execution of unauthorized transactions by employees, transaction processing errors and breaches of the internal control system and compliance requirements. This risk of loss also includes the potential legal actions that could arise as a result of an operational deficiency or as a result of noncompliance with applicable regulatory standards, adverse business decisions or their implementation and customer attrition due to potential negative publicity. Operational risk is inherent in all business activities and the management of this risk is important to the achievement of our business objectives. In the event of a breakdown in our internal control system, improper operation of systems or improper employee actions, we could suffer financial loss, face regulatory action and suffer damage to our reputation. We have policies and procedures in place to protect our reputation and promote ethical conduct, but these policies and procedures may not be fully effective. Negative publicity regarding our business, employees, or customers, with or without merit, may result in the loss of customers, investors and employees, costly litigation, a decline in revenues and increased governmental regulation.
Potential acquisitions may disrupt our business and adversely affect our results of operations.
We have in the past and, subject to any regulatory constraints on our ability to undertake any acquisitions, we may in the future seek to grow our business by acquiring other businesses. We cannot predict the frequency, size or timing of our acquisitions, and we typically do not comment publicly on a possible acquisition until we have signed a definitive agreement. There can be no assurance that our acquisitions will have the anticipated positive results, including results related to the total cost of integration, the time required to complete the integration, the amount of longer-term cost savings, continued growth, or the overall performance of the acquired company or combined entity. Integration of an acquired business can be complex and costly. If we are not able to successfully integrate future acquisitions, there is a risk that our results of operations could be adversely affected. In addition, if
35
goodwill recorded in connection with potential future acquisitions was determined to be impaired, then we would be required to recognize a charge against operations, which could materially and adversely affect our results of operations during the period in which the impairment was recognized.
We are dependent on key personnel and the loss of one or more of those key personnel may materially and adversely affect our prospects.
Competition for qualified employees and personnel in the banking industry is intense and there are a limited number of qualified persons with knowledge of, and experience in, the California community banking industry. The process of recruiting personnel with the combination of skills and attributes required to carry out our strategies is often lengthy. In addition, the Emergency Economic Stabilization Act and the American Recovery and Reinvestment Act have imposed significant limitations on executive compensation for recipients, such as us, of funds under the U.S. Treasury Capital Purchase Program, which may make it more difficult for us to retain and recruit key personnel. Our success depends to a significant degree upon our ability to attract and retain qualified management, loan origination, finance, administrative, marketing and technical personnel and upon the continued contributions of our management and personnel. In particular, our success has been and continues to be highly dependent upon the abilities of key executives, including our Chief Executive Officer and certain other key employees.
Severe weather, natural disasters, acts of war or terrorism and other external events could significantly impact our business
Severe weather, natural disasters, acts of war or terrorism and other adverse external events could have a significant impact on our ability to conduct business. Such events could affect the stability of our deposit base, impair the ability of borrowers to repay outstanding loans, impair the value of collateral securing loans, cause significant property damage, result in loss of revenue and/or cause us to incur additional expenses. For example, our primary market areas in California are subject to earthquakes and fires. Operations in our market could be disrupted by both the evacuation of large portions of the population as well as damage and or lack of access to our banking and operation facilities. While we have not experienced such an occurrence to date, other severe weather or natural disasters, acts of war or terrorism or other adverse external events may occur in the future. Although management has established disaster recovery policies and procedures, the occurrence of any such event could have a material adverse effect on our business, which, in turn, could have a material adverse effect on our financial condition and results of operations.
Because of our participation in the U.S. Treasury Capital Purchase Program, we are subject to various restrictions, including restrictions on compensation paid to our executives.
Pursuant to the terms of the agreements we entered into with the U.S. Treasury and provisions of the Emergency Economy Stabilization Act, we adopted certain standards for executive compensation and corporate governance for the period during which the U.S. Treasury holds our Series A Preferred Stock. These standards generally apply to our chief executive officer, chief financial officer, and the three next most highly compensated senior executive officers. The standards include (i) ensuring that incentive compensation for senior executives does not encourage unnecessary and excessive risks that threaten the value of the financial institution; (ii) required clawback of any bonus or incentive compensation paid to a senior executive based on statements of earnings, gains or other criteria that are later proven to be materially inaccurate; (iii) prohibition on making golden parachute payments to senior executives; and (iv) agreement not to deduct for tax purposes executive compensation in excess of $500,000 for each senior executive. In addition, the American Recovery and Reinvestment Act imposes certain executive compensation and corporate governance requirements on all current and future Capital Purchase Program recipients, including the Company. The executive compensation standards are more stringent than those in effect under the Emergency Economic Stabilization Act. The standards include (but are not limited to)
36
(a) prohibitions on bonuses, retention awards and other incentive compensation, other than restricted stock grants which do not fully vest until the Series A Preferred Stock is no longer outstanding up to one-third of an employee's total annual compensation; (b) prohibitions on golden parachute payments for departure from a company; (c) an expanded clawback of bonuses, retention awards, and incentive compensation if payment is based on materially inaccurate statements of earnings, revenues, gains or other criteria; (d) prohibitions on compensation plans that encourage manipulation of reported earnings; (e) retroactive review of bonuses, retention awards and other compensation previously provided by Capital Purchase Program recipients if found by the U.S. Treasury to be inconsistent with the purposes of the Emergency Economic Stabilization Act or otherwise contrary to public interest; (f) establishment of a company-wide policy regarding "excessive or luxury expenditures;" and (g) inclusion in a participant's proxy statements for annual shareholder meetings of a nonbinding "say on pay" shareholder vote on the compensation of executives. Such restrictions and any future restrictions on executive compensation, which may be adopted, could adversely affect our ability to hire and retain senior executive officers and other key employees.
Until we are able to repurchase the Series A Preferred Stock we are required to operate under the restrictions imposed by the U.S. Treasury under the Capital Purchase Program, and such restrictions may have unforeseen and unintended adverse effects on our business.
Until such time as we repurchase the Series A Preferred Stock, we will remain subject to the respective terms and conditions set forth in the agreements we entered into with the U.S. Treasury under the Capital Purchase Program. The continued existence of the Capital Purchase Program investment subjects us to increased regulatory and legislative oversight. Future legal requirements and implementing standards under the Capital Purchase Program may apply retroactively and may have unforeseen or unintended adverse effects on Capital Purchase Program participants and on the financial services industry as a whole. They may require us to expend significant time, effort and resources to ensure compliance, and the evolving regulations concerning executive compensation may impose limitations on us that affect our ability to compete successfully for executive and management talent.
We can make no assurance as to when or if we will be in a position to repurchase the Series A Preferred Stock and the warrant issued to the U.S. Treasury. Furthermore, the repurchase of the Series A Preferred Stock and warrant is subject to regulatory approval.
Risks Related to Our Securities
Our participation in the U.S. Treasury's Capital Purchase Program may pose certain risks to holders of our securities.
The Company sold to the U.S. Treasury 40,000 shares of Series A Preferred Stock, and issued a warrant to purchase 462,963 shares of the Company's common stock. Although the Company believes that its participation in the U.S. Treasury's Capital Purchase Program was in the best interests of its shareholders in that it enhanced our capital, it may pose certain risks to the holders of our securities such as the following:
- •
- The warrant, if exercised, may be dilutive to current common stockholders.
- •
- The warrant is immediately exercisable, thus the U.S. Treasury may at any time become a holder of the Company's common
stock and possess voting power.
- •
- Although the Series A Preferred Stock issued to the U.S. Treasury is non-voting, the terms of the Capital Purchase Program stipulate that the U.S. Treasury may vote its senior equity in matters deemed by the U.S. Treasury to have an impact on its holdings.
37
- •
- Under the terms of the Capital Purchase Program, the Company must seek the approval of the U.S. Treasury for any increases
in dividends paid to holders of our common stock as well as any repurchases of our common stock.
- •
- The U.S. Treasury may at any time change the terms of our participation in the Capital Purchase Program.
- •
- The Company has suspended six quarterly dividend payments on the Series A Preferred Stock, and therefore, the U.S.
Treasury has the right to appoint two directors to our Board of Directors.
- •
- We are unable to pay any dividends on our common stock unless we are current with our dividend payments on the
Series A Preferred Stock.
- •
- We can make no assurance as to when or if we will receive regulatory approval to pay the accrued dividends on the Series A Preferred Stock.
Our securities are not an insured deposit.
Our securities are not bank deposits and, therefore, are not insured against loss by the FDIC, any other deposit insurance fund or by any other public or private entity. Investment in our securities is inherently risky for the reasons described in this section and elsewhere in this report and is subject to the same market forces that affect the price of securities in any company.
Our outstanding preferred stock impacts net income allocable to our common shareholders and earnings per common share, and conversion of our Series C Preferred Stock or exercise of the warrant issued to the U.S. Treasury will be dilutive to holders of our common stock.
The dividends declared and the accretion on our outstanding preferred stock reduce the net income available to common shareholders and our earnings per common share. Our preferred stock will also receive preferential treatment in the event of our liquidation, dissolution or winding up.
The ownership interest of the existing holders of our common stock will be diluted to the extent the warrant issued to the U.S. Treasury is exercised. The shares of common stock underlying the warrant represent approximately 2% of the shares of our common stock outstanding as of December 31, 2010. Although the U.S. Treasury has agreed to not vote any of the common shares it receives upon exercise of the warrant, a transferee of any portion of the warrant or of any common shares acquired upon exercise of the warrant is not bound by this restriction. The terms of the warrant include an anti-dilution adjustment which provides that, if we issue common shares or securities convertible or exercisable into, or exchangeable for, common shares at a price that is less than 90% of the market price of such shares on the last trading day preceding the date of the agreement to sell such shares, the number of common shares to be issued would increase and the per share price of common shares to be purchased pursuant to the warrant would decrease.
Additionally, we have 21,004 shares of Series C Preferred Stock outstanding. The ownership interest of our existing holders of common stock will be diluted to the extent the Series C Preferred Stock is automatically converted into common stock. The Series C Preferred Stock is convertible into an aggregate of 5,601,000 shares of our common stock upon a transfer of the Series C Preferred Stock to a transferee not affiliated with the holder in a widely dispersed offering. The shares of common stock underlying the Series C Preferred Stock represent approximately 21% of the shares of our common stock outstanding on December 31, 2010.
Holders of our subordinated debt have rights that are senior to those of our common and preferred shareholders.
We have supported our continued growth through four issuances of trust preferred securities from four separate special purpose trusts and related issuance of subordinated debt to these trusts. At
38
December 31, 2010, we had outstanding subordinated debt totaling $23.7 million. Payments of the principal and interest on the subordinated debt are fully and unconditionally guaranteed by us. Further, the accompanying subordinated debt we issued to the special purpose trusts are senior to our outstanding shares of common stock and preferred stock. As a result, we must make payments on the subordinated debt before any dividends can be paid on our common stock or preferred stock and, in the event of our bankruptcy, dissolution or liquidation, the holders of the subordinated debt must be satisfied before any distributions can be made on our preferred stock or common stock. We have the right to defer interest payments on our subordinated debt and the related trust preferred securities for up to five years, during which time no cash dividends may be paid on our common stock or preferred stock. In November 2009, we exercised our right to defer the payment of interest on the subordinated debt and related trust preferred securities. Until the accrued interest due on the subordinated debt and related trust preferred securities has been paid, we are unable to make any dividend payment on our common stock or preferred stock. We can make no assurance as to when or if we will be in a position to pay the accrued interest on the subordinated debt and related trust preferred securities.
We are subject to a Written Agreement with the Federal Reserve Bank of San Francisco and DFI that prohibits the payment of interest on our subordinated debt (and related trust preferred securities) and dividends on our common and preferred stock without prior approval.
The Written Agreement with our regulators restricts the payment of dividends on common stock and preferred stock, and any payments on our subordinated debt and related trust preferred securities, any reductions in capital or the purchase or redemption of stock without the prior consent of the Federal Reserve Bank of San Francisco and the Director of the Division of Banking Supervision and Regulation of the Federal Reserve and DFI. We can make no assurance as to when or if we will receive regulatory approval to pay interest and dividends in the future.
The price of our common stock may fluctuate significantly, and this may make it difficult for you to resell shares of common stock owned by you at times or at prices you find attractive.
The stock market and, in particular, the market for financial institution stocks, have experienced significant volatility. In some cases, the markets have produced downward pressure on stock prices for certain issuers without regard to those issuers' underlying financial strength. As a result, the trading volume in our common stock may fluctuate more than usual and cause significant price variations to occur. This may make it difficult for you to resell shares of Common Stock owned by you at times or at prices you find attractive.
The trading price of the shares of our common stock will depend on many factors, which may change from time to time and which may be beyond our control, including, without limitation, our financial condition, performance, creditworthiness and prospects, future sales or offerings of our equity or equity related securities, and other factors identified above under "Cautionary Note Regarding Forward-Looking Statements," "Risk Factors" and below. These broad market fluctuations have adversely affected and may continue to adversely affect the market price of our common stock. Among the factors that could affect our stock price are:
- •
- actual or anticipated quarterly fluctuations in our operating results and financial condition;
- •
- changes in financial estimates or publication of research reports and recommendations by financial analysts or actions
taken by rating agencies with respect to our common stock or those of other financial institutions;
- •
- failure to meet analysts' revenue or earnings estimates;
- •
- speculation in the press or investment community generally or relating to our reputation, our operations, our market area, our competitors or the financial services industry in general;
39
- •
- strategic actions by us or our competitors, such as acquisitions, restructurings, dispositions or financings;
- •
- actions by our current shareholders, including sales of common stock by existing shareholders and/or directors and
executive officers;
- •
- trends in our nonperforming assets;
- •
- the costs and effectiveness of our efforts to reduce our classified assets;
- •
- fluctuations in the stock price and operating results of our competitors;
- •
- future sales of our equity, equity-related or debt securities;
- •
- proposed or adopted regulatory changes or developments;
- •
- anticipated or pending investigations, proceedings, or litigation that involve or affect us;
- •
- trading activities in our common stock, including short-selling;
- •
- domestic and international economic factors unrelated to our performance; and
- •
- general market conditions and, in particular, developments related to market conditions for the financial services industry.
Our common stock is listed for trading on the NASDAQ Global Select Market under the symbol "HTBK." The trading volume has historically been significantly less than that of larger financial services companies. Stock price volatility may make it more difficult for you to sell your common stock when you want and at prices you find attractive.
A public trading market having the desired characteristics of depth, liquidity and orderliness depends on the presence in the marketplace of willing buyers and sellers of our common stock at any given time. This presence depends on the individual decisions of investors and general economic and market conditions over which we have no control. Given the relatively low trading volume of our common stock, significant sales of our common stock in the public market, or the perception that those sales may occur, could cause the trading price of our common stock to decline or to be lower than it otherwise might be in the absence of those sales or perceptions.
Federal and state law may limit the ability of another party to acquire us, which could cause the price of our securities to decline.
Federal law prohibits a person or group of persons "acting in concert" from acquiring "control" of a bank holding company unless the Federal Reserve has been given 60 days prior written notice of such proposed acquisition and within that time period the Federal Reserve has not issued a notice disapproving the proposed acquisition or extending for up to another 30 days the period during which such a disapproval may be issued. An acquisition may be made prior to the expiration of the disapproval period if the Federal Reserve issues written notice of its intent not to disapprove the action. Under a rebuttable presumption established by the Federal Reserve, the acquisition of 10% or more of a class of voting stock of a bank or bank holding company with a class of securities registered under Section 12 of the Securities Exchange Act would, under the circumstances set forth in the presumption, constitute the acquisition of control. In addition, any "company" would be required to obtain the approval of the Federal Reserve under the BHCA, before acquiring 25% (5% in the case of an acquiror that is, or is deemed to be, a bank holding company) or more of any class of voting stock, or such lesser number of shares as may constitute control.
Under the California Financial Code, no person shall, directly or indirectly, acquire control of a California state bank or its holding company unless the DFI has approved such acquisition of control. A person would be deemed to have acquired control of HBC if such person, directly or indirectly, has the power (i) to vote 25% or more of the voting power of Heritage Bank of Commerce; or (ii) to direct or
40
cause the direction of the management and policies of HBC. For purposes of this law, a person who directly or indirectly owns or controls 10% or more of our outstanding common stock would be presumed to control HBC.
These provisions of federal and state law may prevent a merger or acquisition that would be attractive to shareholders and could limit the price investors would be willing to pay in the future for our securities.
We may raise additional capital, which could have a dilutive effect on the existing holders of our securities and adversely affect the market price of our securities.
We are not restricted from issuing additional shares of common stock or securities that are convertible into or exchangeable for, or represent the right to receive shares of common stock. We frequently evaluate opportunities to access the capital markets taking into account our regulatory capital ratios, financial condition and other relevant considerations and, subject to market conditions, we may take further capital actions. Such actions could include, among other things, the issuance of additional shares of common stock or other securities in public or private transactions in order to further increase our capital levels above the requirements for a "well capitalized" institution established by the federal bank regulatory agencies as well as other regulatory targets. These issuances could dilute ownership interests of investors and could dilute the per share book value of our common stock.
The issuance of additional shares of preferred stock could adversely affect holders of common stock, which may negatively impact an investment in our securities.
Our Board of Directors is authorized to issue additional classes or series of preferred stock without any action on the part of the shareholders, except in certain circumstances. Our Board of Directors also has the power, without shareholder approval except in certain circumstances, to set the terms of any such classes or series of preferred stock that may be issued, including voting rights, dividend rights and preferences over the common stock with respect to dividends or upon the liquidation, dissolution or winding up of our business and other terms. If we issue preferred stock in the future that has a preference over the common stock with respect to the payment of dividends or upon liquidation, dissolution or winding up, or if we issue preferred stock with voting rights that dilute the voting power of the common stock, then the rights of holders of the common stock or the market price of the common stock could be adversely affected.
ITEM 1B — UNRESOLVED STAFF COMMENTS
None.
The main and executive offices of HCC and HBC are located at 150 Almaden Boulevard in San Jose, California 95113, with branch offices located at 15575 Los Gatos Boulevard in Los Gatos, California 95032, at 387 Diablo Road in Danville, California 94526, at 3077 Stevenson Boulevard in Fremont, California 94538, at 300 Main Street in Pleasanton, California 94566, at 101 Ygnacio Valley Road in Walnut Creek, California 94596, at 18625 Sutter Boulevard in Morgan Hill, California 95037, at 7598 Monterey Street in Gilroy, California 95020, at 419 S. San Antonio Road in Los Altos, California 94022, and at 175 E. El Camino Real in Mountain View, California 94040.
Main Offices
The main offices of HBC are located at 150 Almaden Boulevard in San Jose, California on the first three floors in a fifteen-story Class-A type office building. All three floors, consisting of approximately 35,547 square feet, are subject to a direct lease dated April 13, 2000, as amended, which expires on May 31, 2015. The current monthly rent payment for the first two floors, consisting of approximately 22,723 square
41
feet, is $56,808 and is subject to 3% annual increases until the lease expires. The current monthly rent payment for the third floor, which consists of approximately 12,824 square feet, is $53,861 until the lease expires. The Company has reserved the right to extend the term of the lease for two additional periods of five years each.
In January of 1997, the Company leased approximately 1,255 square feet (referred to as the "Kiosk") located next to the primary operating area at 150 Almaden Boulevard in San Jose, California to be used for meetings, staff training and marketing events. The current monthly rent payment is $5,271 until the lease expires on May 31, 2015. The Company has reserved the right to extend the term of the lease for two additional periods of five years each.
Branch Offices
In March of 1999, the Company leased approximately 7,260 square feet in a one-story multi-tenant office building located at 18625 Sutter Boulevard in Morgan Hill, California. The current monthly rent payment is $12,183 and is subject to adjustment every 36 months, based on the Consumer Price Index of the Labor of Statistics as defined in the lease agreement, until the lease expires on October 31, 2014.
In May of 2006, the Company leased approximately 2,505 square feet on the first floor in a three-story multi-tenant multi-use building located at 7598 Monterey Street in Gilroy, California. The current monthly rent payment is $4,881 and is subject to annual increases of 2% until the lease expires on September 30, 2016. The Company has reserved the right to extend the term of the lease for two additional periods of five years each.
In April of 2007, the Company leased approximately 3,850 square feet on the first floor in a four-story multi-tenant office building located at 101 Ygnacio Valley Road in Walnut Creek, California. The current monthly rent payment is $13,883 and is subject to annual increases of 3% until the lease expires on August 15, 2014. The Company has reserved the right to extend the term of the lease for one additional period of five years.
In June of 2007, as part of the acquisition of Diablo Valley Bank the Company took ownership of an 8,300 square foot one-story commercial building, including the land, located at 387 Diablo Road in Danville, California. The Company also assumed a lease for approximately 4,096 square feet in a one-story stand-alone office building located at 300 Main Street in Pleasanton, California. The current monthly rent payment is $14,336 and is subject to annual increases of 3% until the lease expires on October 31, 2017.
In August of 2007, the Company extended its lease for approximately 6,590 square feet in a one-story stand-alone office building located at 3077 Stevenson Boulevard in Fremont, California. The current monthly rent payment is $14,402 and is subject to annual increases of 3% until the lease expires on February 28, 2013. The Company has reserved the right to extend the term of the lease for one additional period of five years.
In February 2008, the Company extended its lease for approximately 4,840 square feet in a one-story multi-tenant shopping center located at 175 E. El Camino Real in Mountain View, California. The current monthly rent payment is $14,837 and is subject to annual increases, based on the Consumer Price Index of the Bureau of Labor Statistics as defined in the lease agreement. The lease expires on May 31, 2013; however, the Company has reserved the right to extend the term of the lease for one additional period of five years.
In June of 2008, the Company entered into a sublease agreement for approximately 5,213 square feet on the first floor in a two-story multi-tenant office building located at 419 S. San Antonio Road in Los Altos, California. The current monthly rent payment is $17,697 and is subject to annual increases of 3% until the sublease expires on April 30, 2012. After the sublease has expired, occupancy will continue under a direct lease, also entered into in June of 2008. The monthly rent payment beginning on May 1, 2012 will
42
be $24,501 and is subject to annual increases of 3% until the lease expires on April 30, 2018. The Company has reserved the right to extend the term of the lease for two additional periods of five years each.
In December of 2008, the Company extended its lease for approximately 1,920 square feet in a one-story stand-alone building located in an office complex at 15575 Los Gatos Boulevard in Los Gatos, California. The current monthly rent payment is $5,601 and is subject to annual increases of 3% until the lease expires on November 30, 2013. The Company has reserved the right to extend the term of the lease for one additional period of five years.
Loan Production Office
In October of 2009, the Company renewed its lease for approximately 250 square feet of office space located at 740 Fourth Street in Santa Rosa, California. The current monthly rent payment is $1,287 until the lease expires on October 8, 2011.
For additional information on operating leases and rent expense, refer to Note 5 to the Consolidated Financial Statements following "Item 15 — Exhibits and Financial Statement Schedules."
The Company is involved in certain legal actions arising from normal business activities. Management, based upon the advice of legal counsel, believes the ultimate resolution of all pending legal actions will not have a material effect on the financial statements of the Company.
ITEM 5 — MARKET FOR REGISTRANT'S COMMON EQUITY, RELATED STOCKHOLDER MATTERS AND ISSUER PURCHASES OF EQUITY SECURITIES
Market Information
The Company's common stock is listed on the NASDAQ Global Select Market under the symbol "HTBK." Management is aware of the following securities dealers which make a market in the Company's common stock: Credit Suisse Securities, UBS Securities, Goldman Sachs & Company, Citadel Securities, Knight Capital America, L.P., Keefe, Bruyette & Woods, Barclays Capital Inc., Howes Barnes Investments, Timber Hill, Susquehanna Capital Group, Susquehanna Financial Group, Merrill Lynch, Pierce, Fenner & Smith Incorporated, Cantor Fitzgerald & Company, Fig Partners, D.A. Davidson & Company, Automated Trading Desk Financial Services, Bloomberg Tradebook, Domestic Securities Inc., E*Trade Capital Markets, Hudson Securities, Nasdaq Execution Services, Sandler, O'Neill & Partners, and Stifel, Nicolaus & Company. These market makers have committed to make a market for the Company's common stock, although they may discontinue making a market at any time. No assurance can be given that an active trading market will be sustained for the common stock at any time in the future.
43
The information in the following table for 2010 and 2009 indicates the high and low closing prices for the common stock, based upon information provided by the NASDAQ Global Select Market and cash dividend payment for each quarter presented.
| |
Stock Price | |
||||||||
|---|---|---|---|---|---|---|---|---|---|---|
| |
Dividend Per Share |
|||||||||
Quarter
|
High | Low | ||||||||
Year ended December 31, 2010: |
||||||||||
Fourth quarter |
$ | 4.50 | $ | 3.49 | $ | — | ||||
Third quarter |
$ | 3.77 | $ | 3.36 | $ | — | ||||
Second quarter |
$ | 5.83 | $ | 3.55 | $ | — | ||||
First quarter |
$ | 4.48 | $ | 3.40 | $ | — | ||||
Year ended December 31, 2009: |
||||||||||
Fourth quarter |
$ | 4.64 | $ | 2.50 | $ | — | ||||
Third quarter |
$ | 5.75 | $ | 2.99 | $ | — | ||||
Second quarter |
$ | 8.66 | $ | 3.61 | $ | — | ||||
First quarter |
$ | 11.75 | $ | 3.75 | $ | 0.02 | ||||
The closing price of our common stock on February 15, 2011 was $4.99 per share as reported by the NASDAQ Global Select Market.
As of February 15, 2011, there were approximately 700 holders of record of common stock. There are no other classes of common equity outstanding.
Dividend Policy
Under the Written Agreement we are required to obtain the prior approval of the Federal Reserve Bank of San Francisco and the Director of the Division of Banking Supervision and Regulation of the Federal Reserve to make any interest payments on our outstanding trust preferred securities and related subordinate debt, or to pay any dividends on our common stock or preferred stock.
The amount of future dividends will depend upon our earnings, financial condition, capital requirements and other factors, and will be determined by our board of directors on a quarterly basis. It is Federal Reserve policy that bank holding companies generally pay dividends on common stock only out of income available over the past year, and only if prospective earnings retention is consistent with the organization's expected future needs and financial condition. It is also Federal Reserve policy that bank holding companies not maintain dividend levels that undermine the holding company's ability to be a source of strength to its banking subsidiaries. Additionally, in consideration of the current financial and economic environment, the Federal Reserve has indicated that bank holding companies should carefully review their dividend policy and has discouraged payment ratios that are at maximum allowable levels unless both asset quality and capital are very strong. Under the federal Prompt Corrective Action regulations, the Federal Reserve or the FDIC may prohibit a bank holding company from paying any dividends if the holding company's bank subsidiary is classified as undercapitalized.
As a holding company, our ability to pay cash dividends is affected by the ability of our bank subsidiary, HBC, to pay cash dividends. The ability of HBC (and our ability) to pay cash dividends in the future and the amount of any such cash dividends is and could be in the future further influenced by bank regulatory requirements and approvals and capital guidelines. Our ability to pay cash dividends is further subject to restrictions set forth in the California General Corporation Law (the "CGCL"). The CGCL provides that a corporation may make a distribution to its shareholders if the corporation's retained earnings equal at least the amount of the proposed distribution. The CGCL further provides that, in the event sufficient retained earnings are not available for the proposed distribution, a corporation may nevertheless make a distribution to its shareholders if, after giving effect to the distribution, it meets two conditions, which generally stated are as follows: (i) the corporation's assets must equal at least 125% of its
44
liabilities; and (ii) the corporation's current assets must equal at least its current liabilities or, if the average of the corporation's earnings before taxes on income and before interest expense for the two preceding fiscal years was less than the average of the corporation's interest expense for those fiscal years, then the corporation's current assets must equal at least 125% of its current liabilities.
Funds for payment of any cash dividends by HCC would be obtained from its investments as well as dividends from HBC. As a California banking corporation, the ability of HBC to pay cash dividends is subject to restrictions set forth in the California Financial Code (the "Financial Code"). The Financial Code provides that a bank may not make a cash distribution to its shareholders in excess of the lesser of (i) the bank's retained earnings; or (ii) the bank's net income for its last three fiscal years, less the amount of any distributions made by the bank or by any majority-owned subsidiary of the bank to the shareholders of the bank during such period. However, a bank may, with the approval of the DFI, make a distribution to its shareholders in an amount not exceeding the greater of (a) its retained earnings; (b) its net income for its last fiscal year; or (c) its net income for its current fiscal year. In the event that the DFI determines that the shareholders' equity of a bank is inadequate or that the making of a distribution by the bank would be unsafe or unsound, the Commissioner may order the bank to refrain from making a proposed distribution.
Under the terms of the Capital Purchase Program, for so long as any preferred stock issued under the Capital Purchase Program remains outstanding, we are prohibited from increasing quarterly dividends on our common stock in excess of $0.08 per share, and from making certain repurchases of equity securities, including our common stock, without the U.S. Treasury's consent until the third anniversary of the U.S. Treasury investment or until the U.S. Treasury has transferred all of the Series A Preferred Stock it purchased to third parties. As long as the Series A Preferred Stock is outstanding, dividend payments and repurchases or redemptions relating to certain equity securities, including our common stock and Series C Preferred Stock, are also prohibited until all accrued and unpaid dividends are paid on such preferred stock, subject to certain limited exceptions. In November 2009, we suspended dividend payments on our Series A Preferred Stock. So long as dividends on the Series A Preferred Stock remain suspended, we may not, among other things and with limited exceptions, pay cash dividends on or repurchase our common stock or preferred stock.
We have supported our growth through the issuance of trust preferred securities from special purpose trusts and accompanying sales of subordinated debt to these trusts. The subordinated debt that we issued to the trusts is senior to our shares of common stock, Series A Preferred Stock and Series C Preferred Stock. As a result, we must make payments on the subordinated debt before any dividends can be paid on our common stock, Series A Preferred Stock and Series C Preferred Stock. Under the terms of the subordinated debt, we may defer interest payments for up to five years. In November 2009, we exercised our right to defer regularly scheduled interest payments on our outstanding $23.7 million of subordinated debt relating to our trust preferred securities. So long as interest payments remain deferred, we may not pay cash dividends on or repurchase our common stock or preferred stock.
At such time as we become current with the dividends payable on the Series A Preferred Stock and interest payments on our trust preferred securities and related subordinated debt, the decision whether to pay dividends will be made by our Board of Directors in light of conditions then existing, including factors such as our results of operations, financial condition, business conditions, regulatory capital requirements and covenants under any applicable contractual arrangements, including agreements with regulatory authorities.
45
Securities Authorized for Issuance Under Equity Compensation Plans
The following table provides information as of December 31, 2010 regarding equity compensation plans under which equity securities of the Company were authorized for issuance:
| |
Number of securities to be issued upon exercise of outstanding options, warrants and rights (a) |
Weighted average exercise price of outstanding options, warrants and rights (b) |
Number of securities remaining available for future issuance under equity compensation plans (excluding securities reflected in column (a)) (c) |
|||
|---|---|---|---|---|---|---|
Equity compensation plans approved by security holders |
1,150,821(1) | $15.47 | 716,193(5) | |||
Equity compensation plans approved by security holders |
13,500(2) |
$3.57 |
716,193(5) |
|||
Equity compensation plans not approved by security holders |
12,750(3) |
$18.15 |
N/A |
|||
Equity compensation plans not approved by security holders |
462,963(4) |
$12.96 |
N/A |
- (1)
- Consists
of 142,919 options to acquire shares of common stock issued under the Company's 1994 stock option plan, and 1,007,902 options to acquire shares
under the Company's Amended and Restated 2004 Equity Plan.
- (2)
- Consist
of 13,500 shares of restricted stock issued under the Company's Amended and Restated 2004 Equity Plan.
- (3)
- Consists
of restricted stock issued to the Company's chief executive officer pursuant to a restricted stock agreement dated March 17, 2005.
- (4)
- Consists
of a warrant issued to the U.S. Treasury to purchase 462,963 shares of the Company's common stock. The warrant is immediately exercisable and has a
10-year term with an initial exercise price of $12.96 pursuant to a Written Agreement of Securities Purchase dated November 21, 2008.
- (5)
- Available under the Company's Amended and Restated 2004 Equity Plan.
Performance Graph
The following graph compares the stock performance of the Company from December 31, 2005 to December 31, 2010, to the performance of several specific industry indices. The performance of the S&P 500 Index, NASDAQ Stock Index and NASDAQ Bank Stocks were used as comparisons to the Company's stock performance. Management believes that a performance comparison to these indices provides meaningful information and has therefore included those comparisons in the following graph.
46
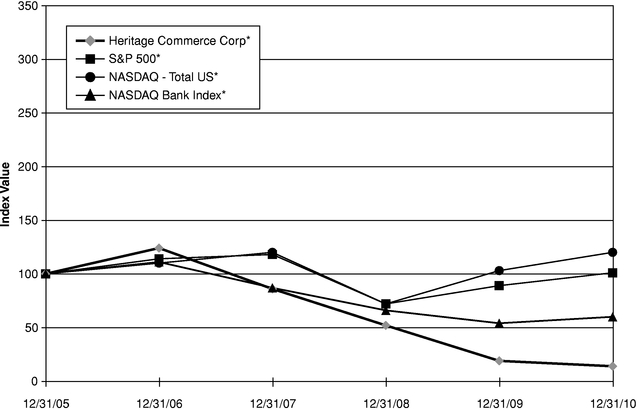
The following chart compares the stock performance of the Company from December 31, 2005 to December 31, 2010, to the performance of several specific industry indices. The performance of the S&P 500 Index, NASDAQ Stock Index and NASDAQ Bank Stocks were used as comparisons to the Company's stock performance.
| |
Period Ended | |||||||||||
|---|---|---|---|---|---|---|---|---|---|---|---|---|
Index
|
12/31/05 | 12/31/06 | 12/31/07 | 12/31/08 | 12/31/09 | 12/31/10 | ||||||
Heritage Commerce Corp* |
100 | 124 | 86 | 52 | 19 | 14 | ||||||
S&P 500* |
100 | 114 | 118 | 72 | 89 | 101 | ||||||
NASDAQ — Total US* |
100 | 110 | 120 | 72 | 103 | 120 | ||||||
NASDAQ Bank Index* |
100 | 111 | 87 | 66 | 54 | 60 | ||||||
- *
- Source: SNL Financial Bank Information Group — (434) 977-1600
47
ITEM 6 — SELECTED FINANCIAL DATA
The following table presents a summary of selected financial information that should be read in conjunction with the Company's consolidated financial statements and notes thereto included under Item 8 — "FINANCIAL STATEMENTS AND SUPPLEMENTARY DATA."
SELECTED FINANCIAL DATA
| |
AT OR FOR YEAR ENDED DECEMBER 31, | |||||||||||||||||
|---|---|---|---|---|---|---|---|---|---|---|---|---|---|---|---|---|---|---|
| |
2010 | 2009 | 2008 | 2007 | 2006 | |||||||||||||
| |
(Dollars in thousands, except per share amounts and ratios) |
|||||||||||||||||
INCOME STATEMENT DATA: |
||||||||||||||||||
Interest income |
$ | 55,087 | $ | 62,293 | $ | 75,957 | $ | 78,712 | $ | 72,957 | ||||||||
Interest expense |
10,512 | 16,326 | 24,444 | 27,012 | 22,525 | |||||||||||||
Net interest income before provision for loan losses |
44,575 | 45,967 | 51,513 | 51,700 | 50,432 | |||||||||||||
Provision for loan losses |
26,804 | 33,928 | 15,537 | (11 | ) | (503 | ) | |||||||||||
Net interest income after provision for loan losses |
17,771 | 12,039 | 35,976 | 51,711 | 50,935 | |||||||||||||
Noninterest income |
8,733 | 8,027 | 6,791 | 8,052 | 9,840 | |||||||||||||
Noninterest expense |
88,127 | 44,760 | 42,392 | 37,530 | 34,268 | |||||||||||||
Income (loss) before income taxes |
(61,623 | ) | (24,694 | ) | 375 | 22,233 | 26,507 | |||||||||||
Income tax expense (benefit) |
(5,766 | ) | (12,709 | ) | (1,387 | ) | 8,137 | 9,237 | ||||||||||
Net income (loss) |
(55,857 | ) | (11,985 | ) | 1,762 | 14,096 | 17,270 | |||||||||||
Dividends and discount accretion on preferred stock |
(2,398 | ) | (2,376 | ) | (255 | ) | — | — | ||||||||||
Net income (loss) allocable to common shareholders |
$ | (58,255 | ) | $ | (14,361 | ) | $ | 1,507 | $ | 14,096 | $ | 17,270 | ||||||
PER COMMON SHARE DATA: |
||||||||||||||||||
Basic net income (loss)(1) |
$ | (3.64 | ) | $ | (1.21 | ) | $ | 0.13 | $ | 1.13 | $ | 1.47 | ||||||
Diluted net income (loss)(2) |
$ | (3.64 | ) | $ | (1.21 | ) | $ | 0.13 | $ | 1.12 | $ | 1.44 | ||||||
Book value per common share(3) |
$ | 4.73 | $ | 11.34 | $ | 12.38 | $ | 12.90 | $ | 10.54 | ||||||||
Tangible book value per common share(4) |
$ | 4.61 | $ | 7.38 | $ | 8.37 | $ | 9.20 | $ | 10.54 | ||||||||
Pro forma tangible book value per share, assuming Series C Preferred Stock was converted into common stock(5) |
$ | 4.41 | $ | 7.38 | 8.37 | 9.20 | 10.54 | |||||||||||
Weighted average number of shares outstanding — basic |
16,026,058 | 11,820,509 | 12,002,910 | 12,449,270 | 11,776,671 | |||||||||||||
Weighted average number of shares outstanding — diluted |
16,026,058 | 11,820,509 | 12,039,776 | 12,566,801 | 11,966,397 | |||||||||||||
Shares outstanding at period end |
26,233,001 | 11,820,509 | 11,820,509 | 12,774,926 | 11,656,943 | |||||||||||||
Pro forma common shares outstanding at period end, assuming Series C Preferred Stock was converted into common stock(6) |
31,834,001 | 11,820,509 | 11,820,509 | 12,774,926 | 11,656,943 | |||||||||||||
BALANCE SHEET DATA: |
||||||||||||||||||
Securities |
$ | 232,165 | $ | 109,966 | $ | 104,475 | $ | 135,402 | $ | 172,298 | ||||||||
Net loans |
$ | 820,845 | $ | 1,041,345 | $ | 1,223,624 | $ | 1,024,247 | $ | 699,957 | ||||||||
Allowance for loan losses |
$ | 25,204 | $ | 28,768 | $ | 25,007 | $ | 12,218 | $ | 9,279 | ||||||||
Goodwill and other intangible assets |
$ | 3,014 | $ | 46,770 | $ | 47,412 | $ | 48,153 | $ | — | ||||||||
Total assets |
$ | 1,246,369 | $ | 1,363,870 | $ | 1,499,227 | $ | 1,347,472 | $ | 1,037,138 | ||||||||
Total deposits |
$ | 993,918 | $ | 1,089,285 | $ | 1,154,050 | $ | 1,064,226 | $ | 846,593 | ||||||||
Securities sold under agreement to repurchase |
$ | 5,000 | $ | 25,000 | $ | 35,000 | $ | 10,900 | $ | 21,800 | ||||||||
Subordinated debt |
$ | 23,702 | $ | 23,702 | $ | 23,702 | $ | 23,702 | $ | 23,702 | ||||||||
Note payable |
$ | — | $ | — | $ | 15,000 | $ | — | $ | — | ||||||||
Short-term borrowings |
$ | 2,445 | $ | 20,000 | $ | 55,000 | $ | 60,000 | $ | — | ||||||||
Total shareholders' equity |
$ | 182,152 | $ | 172,305 | $ | 184,267 | $ | 164,824 | $ | 122,820 | ||||||||
SELECTED PERFORMANCE RATIOS:(7) |
||||||||||||||||||
Return (loss) on average assets |
-4.17 | % | -0.83 | % | 0.12 | % | 1.18 | % | 1.57 | % | ||||||||
Return (loss) on average tangible assets |
-4.25 | % | -0.86 | % | 0.13 | % | 1.21 | % | 1.57 | % | ||||||||
Return (loss) on average equity |
-30.82 | % | -6.68 | % | 1.15 | % | 9.47 | % | 14.62 | % | ||||||||
Return (loss) on average tangible equity |
-35.66 | % | -9.06 | % | 1.67 | % | 11.43 | % | 14.62 | % | ||||||||
Net interest margin |
3.69 | % | 3.53 | % | 3.94 | % | 4.86 | % | 5.06 | % | ||||||||
Efficiency ratio, excluding impairment of goodwill |
84.31 | % | 82.90 | % | 72.71 | % | 62.81 | % | 56.86 | % | ||||||||
Average net loans (excludes loans held for sale) as a percentage of average deposits |
87.53 | % | 98.98 | % | 100.01 | % | 84.06 | % | 77.61 | % | ||||||||
Average total shareholders' equity as a percentage of average total assets |
13.55 | % | 12.46 | % | 10.52 | % | 12.47 | % | 10.75 | % | ||||||||
SELECTED ASSET QUALITY DATA:(8) |
||||||||||||||||||
Net loan charge-offs (recoveries) to average loans |
3.18 | % | 2.59 | % | 0.23 | % | (0.10 | )% | 0.06 | % | ||||||||
Allowance for loan losses to total loans |
2.98 | % | 2.69 | % | 2.00 | % | 1.18 | % | 1.31 | % | ||||||||
Nonperforming loans to total loans plus nonaccrual loans — loans held-for-sale |
3.93 | % | 5.83 | % | 3.24 | % | 0.33 | % | 0.61 | % | ||||||||
Nonperforming assets |
$ | 34,635 | $ | 64,616 | $ | 41,101 | $ | 4,526 | $ | 4,317 | ||||||||
CAPITAL RATIOS: |
||||||||||||||||||
Total risk-based |
20.9 | % | 12.9 | % | 13.4 | % | 12.5 | % | 18.4 | % | ||||||||
Tier 1 risk-based |
19.7 | % | 11.6 | % | 12.1 | % | 11.5 | % | 17.3 | % | ||||||||
Leverage |
14.1 | % | 10.1 | % | 11.3 | % | 11.1 | % | 13.6 | % | ||||||||
Notes:
- 1)
- Represents net income (loss) allocable to common shareholders divided by the average number of shares of common stock outstanding for the respective period. For years prior to 2009, earnings per share ("EPS") and weighted average shares outstanding have been adjusted retrospectively to apply new accounting guidance that became effective in 2009. Except for reducing basic EPS from $1.14 to $1.13 in 2007, this change in computation did not involve a sufficient number of shares to change basic or diluted EPS from amounts previously reported.
48
- 2)
- Represents
net income (loss) allocable to common shareholders divided by the average number of shares of common stock and common stock-equivalents
outstanding for the respective period.
- 3)
- Represents
shareholders' equity minus preferred stock divided by the number of shares of common stock outstanding at the end of the period indicated.
- 4)
- Represents
shareholders' equity minus preferred stock and minus goodwill and other intangible assets divided by the number of shares of common stock
outstanding at the end of period indicated.
- 5)
- Represents
shareholders' equity minus preferred stock and minus goodwill and other intangible assets divided by the number of shares of common stock
outstanding at the end of period indicated, assuming Series C Preferred Stock was converted into common stock.
- 6)
- Assumes
21,004 shares of Series C Preferred Stock were converted into 5,601,000 shares of common stock at December 31, 2010.
- 7)
- Average
balances used in this table and throughout this Annual Report are based on daily averages.
- 8)
- Average loans and total loans exclude loans held-for-sale.
ITEM 7 — MANAGEMENT'S DISCUSSION AND ANALYSIS OF FINANCIAL CONDITION AND RESULTS OF OPERATIONS
The following discussion provides information about the results of operations, financial condition, liquidity, and capital resources of HCC and its wholly-owned subsidiary, HBC. This information is intended to facilitate the understanding and assessment of significant changes and trends related to our financial condition and the results of operations. This discussion and analysis should be read in conjunction with our consolidated financial statements and the accompanying notes presented elsewhere in this report.
Executive Summary
This summary is intended to identify the most important matters on which management focuses when it evaluates the financial condition and performance of the Company. When evaluating financial condition and performance, management looks at certain key metrics and measures. The Company's evaluation includes comparisons with peer group financial institutions and its own performance objectives established in the internal planning process.
The primary activity of the Company is commercial banking. The Company's operations are located entirely in the southern and eastern regions of the general San Francisco Bay Area of California in the counties of Santa Clara, Alameda and Contra Costa. The largest city in this area is San Jose and the Company's market includes the headquarters of a number of technology based companies in the region known commonly as Silicon Valley. The Company's customers are primarily closely held businesses and professionals.
On February 17, 2010 HCC and HBC entered into a Written Agreement with the Federal Reserve Bank of San Francisco, and the California Department of Financial Institutions. The Board of Directors and management of the Company are committed to addressing and resolving the matters raised in the Written Agreement on a timely basis and actions have been undertaken to comply with the various items addressed by the Written Agreement. As of the date of this filing, both HCC and HBC were in compliance with all of the provisions of the Written Agreement. Further discussion of the Written Agreement appears under "Item 1 — BUSINESS — Regulatory Action" and Note 12 to the financial statements located elsewhere herein.
Performance Overview
During 2010, there were several significant events that impacted the Company's financial condition and operations:
- •
- The Company completed a private placement of convertible preferred stock for $75 million in the second quarter of
2010 which significantly improved the Company's regulatory capital ratios.
- •
- During the second quarter of 2010, the Company identified $31.0 million of real estate loans classified as substandard or substandard-nonaccrual that it transferred to the held-for-sale portfolio
49
- •
- Due to the continued depressed economic conditions and the length of time and amount by which the Company's book value
exceeded the market value per common share, and the Company's closing of a private placement at a conversion price of $3.75 per share, the Company determined that goodwill related to the acquisition
of Diablo Valley Bank of $43.2 million was fully impaired.
- •
- After an analysis in the second quarter of 2010 of both the positive and negative evidence regarding the realization of the deferred tax asset, the Company recorded a $3.7 million partial valuation allowance on the Company's deferred tax asset.
and the Company recorded $13.9 million of related loan charge-offs. During the third quarter of 2010, $11.2 million of these loans were sold which resulted in a loss on sale of other loans of $887,000. The remaining problem real estate loans held-for-sale were written down by an additional $1.1 million during the third quarter of 2010. After additional liquidations efforts during the fourth quarter of 2010, problem real estate loans held-for-sale were reduced to $2.3 million at December 31, 2010.
For the year ended December 31, 2010, the net loss was ($55.9) million and the net loss allocable to common shareholders was ($58.3) million, or ($3.64) per diluted common share, which included a non-cash goodwill impairment charge of $43.2 million and loan charge-offs of $13.9 million related to problem real estate loans transferred to loans held-for-sale in the second quarter of 2010. For the year ended December 31, 2009, the net loss was ($12.0) million and the net loss allocable to common shareholders was ($14.4) million, or $(1.21) per diluted common share. For the year ended December 31, 2008, net income was $1.8 million and net income allocable to common shareholders was $1.5 million, or $0.13 per diluted common share.
The annualized return (loss) on average assets and average equity for the year ended December 31, 2010 were -4.17% and -30.82%, respectively, compared to -0.83% and -6.68%, respectively, for 2009, and 0.12% and 1.15%, respectively, for 2008. The annualized return (loss) on average tangible assets and average tangible equity for the year ended December 31, 2010 were -4.25% and -35.66%, respectively, compared to -0.86% and -9.06%, respectively, for 2009, and 0.13% and 1.67%, respectively, for 2008.
The following are major factors that impacted the Company's results of operations:
- •
- Net interest income decreased 3% to $44.6 million for the year ended December 31, 2010 from
$46.0 million for the year ended December 31, 2009, primarily due to a decrease in loan balances. Net interest income decreased 11% to $46.0 million for the year ended
December 31, 2009 from $51.5 million for the year ended December 31, 2008, primarily due to compression of the net interest margin.
- •
- The net interest margin increased 16 basis points to 3.69% for the year ended December 31, 2010, compared with
3.53% for the year ended December 31, 2009. The increase in the net interest margin for 2010 compared to 2009 was primarily due to an increase in the yields on loans and securities and a
decrease in rates paid on deposits and borrowings. The net interest margin decreased 41 basis points to 3.53% for the year ended December 31, 2009, compared with 3.94% for the year ended
December 31, 2008. The decrease in the net interest margin for 2009 compared to 2008 was primarily due to the 325 basis points decline in short-term interest rates from
January 22, 2008 through December 16, 2008, with the prime rate remaining at a historically low level of 3.25% for all of 2009 and 2010.
- •
- The provision for loan losses was $26.8 million for the year ended December 31, 2010, compared to $33.9 million for the year ended December 31, 2009, and $15.5 million for the year ended December 31, 2008. The decrease in the 2010 provision for loan losses compared to 2009 reflects the decline in the size of the loan portfolio and improvement in credit quality in the latter half of the year. The significant increase in the provision for loan losses in 2009 compared to 2008 reflects a higher volume of classified and nonperforming loans and an increase in loan charge-offs caused by
50
- •
- Noninterest income increased 9% to $8.7 million for the year ended December 31, 2010 from
$8.0 million for the year ended December 31, 2009. The increase in noninterest income in 2010 compared to 2009 was primarily due to $2.0 million in gains on the sale of securities
in 2010, offset by an $887,000 loss on sale of other loans. Noninterest income increased by 18% in 2009 to $8.0 million, compared to $6.8 million in 2008, primarily a result of gains on
the sale of SBA loans in 2009.
- •
- Noninterest expense, excluding the $43.2 million impairment of goodwill, was $44.9 million for the year
ended December 31, 2010, compared to $44.8 million for the year ended December 31, 2009. Noninterest expense increased to $44.8 million for the year ended
December 31, 2009 from $42.4 million for the year ended December 31, 2008, primarily due to higher FDIC deposit insurance costs.
- •
- The income tax benefit for the year ended December 31, 2010 was $5.8 million, compared to an income tax benefit of $12.7 million for the year ended December 31, 2009, and an income tax benefit of $1.4 million for the year ended December 31, 2008. The income tax benefit for 2010 included $3.7 million of income tax expense in the second quarter of 2010 to establish a partial valuation allowance on the Company's net deferred tax asset. The difference in the effective tax rate compared to the combined Federal and state statutory tax rate of 42% is primarily the result of the Company's investment in life insurance policies whose earnings are not subject to taxes, and tax credits related to investments in low income housing limited partnerships.
challenging conditions in commercial lending and the residential housing market, turmoil in the financial markets, and the prolonged downturn in the overall economy.
The following are important factors in understanding our current financial condition and liquidity position:
- •
- Cash, Federal funds sold, interest-bearing deposits in other financial institutions and securities
available-for-sale increased 96% to $304.3 million at December 31, 2010, from $155.5 million at December 31, 2009. The increase in liquid assets is
primarily due to: proceeds from the June 2010 private placement; proceeds from loan sales; and loan paydowns.
- •
- Total loans, excluding loans held-for-sale, decreased $224.2 million, or 21%, to
$845.2 million at December 31, 2010, compared to $1.07 billion at December 31, 2009. Land and construction loans decreased $120.5 million to $62.4 million at
December 31, 2010 from $182.9 million at December 31, 2009. In addition, real estate mortgage loans decreased $63.2 million to $337.5 million at December 31,
2010 from $400.7 million at December 31, 2009.
- •
- Classified assets decreased to $91.8 million at December 31, 2010, compared to $166.3 million at
December 31, 2009.
- •
- The allowance for loan losses at December 31, 2010 was $25.2 million, or 2.98% of total loans, representing
75.60% of nonperforming loans and 80.49% of nonperforming loans excluding nonaccrual loans in loans held-for-sale. The allowance for loan losses for December 31, 2009
was $28.8 million, or 2.69% of total loans and 46.12% of nonperforming loans.
- •
- Nonperforming assets decreased $30.0 million to $34.6 million, or 2.78% of total assets at December 31,
2010, from $64.6 million, or 4.74% of total assets at December 31, 2009.
- •
- Net loan charge-offs were $30.4 million for the year ended December 31, 2010, compared to
$30.2 million for the year ended December 31, 2009.
- •
- Brokered deposits decreased to $98.5 million at December 31, 2010, compared to $178.0 million at December 31, 2009.
51
- •
- The ratio of noncore funding (which consists of time deposits $100,000 and over, CDARS deposits, brokered deposits,
securities under agreement to repurchase, and short-term borrowings) to total assets was 20.96% at December 31, 2010, compared to 28.67% at December 31, 2009.
- •
- The liquidity position improved with a loan to deposit ratio of 85.12% at December 31, 2010, compared to 98.24% at
December 31, 2009.
- •
- The $75 million of new capital raised in June 2010 increased tangible equity to $179.1 million at
December 31, 2010, from $125.5 million at December 31, 2009.
- •
- Capital ratios substantially exceed regulatory requirements for a well-capitalized financial institution, both at the holding company and the bank. The leverage ratio at the holding company was 14.1%, with a Tier 1 risk-based capital ratio of 19.7%, and a total risk-based capital ratio of 20.9% at December 31, 2010. The leverage ratio for HBC was 12.1%, with a Tier 1 risk-based capital ratio of 16.8%, and a total risk-based capital ratio of 18.1% at December 31, 2010. The regulatory well-capitalized guidelines are a minimum of a 5% leverage ratio, a 6% Tier 1 risk-based capital ratio, and a 10% total risk-based capital ratio.
Deposits
The composition and cost of the Company's deposit base are important in analyzing the Company's net interest margin and balance sheet liquidity characteristics. Except for brokered time deposits, the Company's depositors are generally located in its primary market area. Depending on loan demand and other funding requirements, the Company also obtains deposits from wholesale sources including deposit brokers. The Company had $98.5 million in brokered deposits at December 31, 2010, compared to $178.0 million at December 31, 2009. The Company has a policy to monitor all deposits that may be sensitive to interest rate changes to help assure that liquidity risk does not become excessive due to deposit concentrations. Deposits at December 31, 2010 were $993.9 million, compared to $1.09 billion at December 31, 2009. Increases in core deposit balances allowed the Company to decrease higher-cost wholesale funding.
HBC is a member of the Certificate of Deposit Account Registry Service ("CDARS") program. The CDARS program allows customers with deposits in excess of FDIC insured limits to obtain coverage on time deposits through a network of banks within the CDARS program. Deposits gathered through this program are considered brokered deposits under regulatory guidelines. Deposits in the CDARS program totaled $17.9 million at December 31, 2010, and $38.2 million at December 31, 2009.
Liquidity
Our liquidity position refers to our ability to maintain cash flows sufficient to fund operations and to meet obligations and other commitments in a timely fashion. We believe that our liquidity position is more than sufficient to meet our operating expenses, borrowing needs and other obligations for 2011. Our liquidity has been significantly enhanced from the proceeds from the June 2010 private placement, proceeds from loan sales, and loan paydowns. At December 31, 2010, we had $72.2 million in cash and cash equivalents and approximately $219.7 million in available borrowing capacity from various sources including the Federal Home Loan Bank ("FHLB"), the Federal Reserve Bank of San Francisco ("FRB"), and Federal funds facilities with several financial institutions. The Company also had $199.1 million in unpledged securities available at December 31, 2010. Our loan to deposit ratio decreased to 85.12% at December 31, 2010, compared to 98.24% at December 31, 2009, primarily due to a $224.2 million reduction in the loan portfolio.
52
Lending
Our lending business originates primarily through our branch offices located in our primary market. The Company also has an additional SBA loan production office in Santa Rosa, California. As a result of the weakened economy in our primary service area throughout 2010 and 2009 and loan payoffs, we have seen a contraction in our loan portfolio during the last two years. The total loan portfolio remains well diversified with commercial loans accounting for 45% of the portfolio at December 31, 2010. Commercial real estate loans accounted for 40% of the total loan portfolio at December 31, 2010, of which 57% were owner-occupied by businesses. Land and construction loans continued to decrease, accounting for 7% of the portfolio at December 31, 2010, compared to 17% at December 31, 2009. Consumer and home equity loans accounted for the remaining 8% of total loans at December 31, 2010. The decline in gross loans in 2010 compared to 2009 was primarily due to loans transferred to loans held-for-sale, diminished loan demand, and loan payoffs exceeding draw downs of loan commitments. Lower volume of loan originations can be attributed in part to lower demand for certain types of credit as well as more selectivity with respect to the types of loans the Company chooses to originate.
Net Interest Income
The management of interest income and expense is fundamental to the performance of the Company. Net interest income, the difference between interest income and interest expense, is the largest component of the Company's total revenue. Management closely monitors both total net interest income and the net interest margin (net interest income divided by average earning assets).
The Company, through its asset and liability policies and practices, seeks to maximize net interest income without exposing the Company to an excessive level of interest rate risk. Interest rate risk is managed by monitoring the pricing, maturity and repricing options of all classes of interest bearing assets and liabilities. This is discussed in more detail under Liquidity and Asset/Liability Management. In addition, we believe there are measures and initiatives we can take to improve the net interest margin, including increasing loan rates, adding floors on floating rate loans, reducing nonperforming assets, managing deposit interest rates, and reducing higher cost deposits.
From January 22, 2008 through December 16, 2008, the Board of Governors of the Federal Reserve System reduced short-term interest rates by 325 basis points. This decrease in short-term rates immediately affected the rates applicable to the majority of the Company's loans. While the decrease in interest rates also lowered the cost of interest bearing deposits, which represents the Company's primary funding source, these deposits tend to price more slowly than floating rate loans. The rapid, substantial drop in short-term interest rates, including the prime rate, has significantly compressed the Company's net interest margin. The Company's net interest margin expanded in the first half of 2010, as yields on loans and securities increased and the costs of deposits and borrowings continued to decline. However, the net interest margin decreased in the third and fourth quarters of 2010, primarily due to investment of proceeds from the June 2010 capital raise in short-term investments and deposits at the Federal Reserve Bank, partially offset by maturing higher-cost wholesale funding and a more cost-effective blend of core deposits.
The net interest margin is also adversely impacted by the reversal of interest on nonaccrual loans and the reinvestment of loan payoffs into lower yielding investment securities and other short-term investments.
Management of Credit Risk
We continue to proactively identify, quantify, and manage our problem loans. Early identification of problem loans and potential future losses helps enable us to resolve credit issues with potentially less risk and ultimate losses. We maintain an allowance for loan losses in an amount that we believe is adequate to absorb probable incurred losses in the portfolio. While we strive to carefully manage and monitor credit quality and to identify loans that may be deteriorating, circumstances can change at any time for loans
53
included in the portfolio that may result in future losses, that as of the date of the financial statements have not yet been identified as potential problem loans. Through established credit practices, we adjust the allowance for loan losses accordingly. However, because future events are uncertain, there may be loans that deteriorate some of which could occur in an accelerated time frame. As a result, future additions to the allowance may be necessary. Because the loan portfolio contains a number of commercial loans, commercial real estate, construction and land development loans with relatively large balances, deterioration in the credit quality of one or more of these loans may require a significant increase to the allowance for loan losses. Future additions to the allowance may also be required based on changes in the financial condition of borrowers, such as have resulted due to the current, and potentially worsening, economic conditions. Additionally, Federal and state banking regulators, as an integral part of their supervisory function, periodically review our allowance for loan losses. These regulatory agencies may require us to recognize further loan loss provisions or charge-offs based upon their judgments, which may be different from ours. Any increase in the allowance for loan losses would have an adverse effect, which may be material, on our financial condition and results of operation.
Further discussion of the management of credit risk appears under "Provision for Loan Losses" and "Allowance for Loan Losses."
Noninterest Income
While net interest income remains the largest single component of total revenues, noninterest income is an important component.
The Company sold $44.0 million of investment securities for total gross proceeds of $46.0 million resulting in a $2.0 million gain on sale of securities for 2010, compared to a $231,000 gain on sale of securities for 2009, and no gain on sale of securities in 2008.
Prior to the third quarter of 2007, a significant percentage of the Company's noninterest income was associated with its SBA lending activity, consisting of gains on the sale of loans sold in the secondary market and servicing income from loans sold with servicing retained. From the third quarter of 2007 through the second quarter of 2009, the Company retained its SBA production. In the third quarter of 2009, the Company began to again sell loans in the secondary market. When the Company sells SBA loans to third parties, the loans are subject to a 90 day SBA warranty. The Company adopted new accounting guidance in the first quarter of 2010 that requires the Company to treat the SBA loans sold as secured borrowings during the warranty period. The Company has $2.4 million of SBA loans that were transferred to third parties during the fourth quarter of 2010. Provided the loans remain current through the end of the warranty period, all elements necessary to record the sale will have been met. The Company has deferred gains of $194,000 associated with these loans, which are included in other liabilities on the consolidated balance sheet. For the year ended December 31, 2010, the net gain on sales of SBA loans was $1.1 million, compared to $1.3 million for the year ended December 31, 2009, and no gain for the year ended December 31, 2008. During the third quarter of 2010, the sale of $11.2 million of problem real estate loans held-for-sale resulted in net proceeds of $10.3 million, with a loss on sale of $887,000.
54
During the second quarter of 2010, the Company identified $31.0 million of problem real estate loans for sale. These loans were written down by $13.9 million to reflect the estimated proceeds from the sale, resulting in a net balance of $17.1 million which was transferred into the loans held-for-sale portfolio. The following table shows the detail of the problem loans transferred to the loans held-for-sale portfolio from June 30, 2010 to December 31, 2010:
| |
Balance Prior to Transfer |
Amount Charged-off |
June 30, 2010 Balance Transferred to Loans Held-for-Sale |
Paydowns/ Sales |
Writedowns | December 31, 2010 Balance |
|||||||||||||||
|---|---|---|---|---|---|---|---|---|---|---|---|---|---|---|---|---|---|---|---|---|---|
| |
(Dollars in thousands) |
||||||||||||||||||||
Real estate: |
|||||||||||||||||||||
Commercial and residential |
$ | 9,893 | $ | (2,781 | ) | $ | 7,112 | $ | (5,032 | ) | $ | (917 | ) | $ | 1,163 | ||||||
Land and construction |
21,112 | (11,145 | ) | 9,967 | (8,707 | ) | (163 | ) | 1,097 | ||||||||||||
Total |
$ | 31,005 | $ | (13,926 | ) | $ | 17,079 | $ | (13,739 | ) | $ | (1,080 | ) | $ | 2,260 | ||||||
Noninterest Expense
Management considers the control of operating expenses to be a critical element of the Company's performance. Over the last several quarters, the Company has undertaken several initiatives to reduce its noninterest expense and improve its efficiency. Operating expense (excluding impairment of goodwill) increased $186,000 for the year ended December 31, 2010 compared to the year ended December 31, 2009, primarily due to a $1.1 million writedown of loans held-for-sale and an increase in FDIC deposit insurance premiums, partially offset by lower salaries and employee benefits expense. Noninterest expense, excluding the $43.2 million impairment of goodwill which was recorded in the second quarter of 2010, was $44.9 million for year ended December 31, 2010, compared to $44.8 million for year ended December 31, 2009.
Capital Management
As part of its asset and liability process, the Company continually assesses its capital position to take into consideration growth, expected earnings, risk profile and potential corporate activities that it may choose to pursue.
On November 21, 2008, the Company issued to the U.S. Treasury under its Capital Purchase Program 40,000 shares of Series A Preferred Stock for $40.0 million and issued a warrant to purchase 462,963 shares of common stock at an exercise price of $12.96. The terms of the U.S. Treasury Capital Purchase Program could reduce investment returns to our shareholders by restricting dividends to common shareholders, diluting existing shareholders' interests, and restricting capital management practices.
Under the terms of the Capital Purchase Program with the U.S. Treasury, so long as our Series A Preferred Stock is outstanding, we are prohibited from increasing quarterly dividends on our common stock in excess of $0.08 per share, and from making certain repurchases of equity securities, including our common stock, without the U.S. Treasury consent until the third anniversary of the U.S. Treasury investment or until the U.S. Treasury has transferred all of the Series A Preferred Stock it purchased under the Capital Purchase Program to third parties. As long as the Series A Preferred Stock is outstanding, dividend payments and repurchases or redemptions relating to certain equity securities, including our common stock, and the Series C Preferred Stock, are also prohibited until all accrued and unpaid dividends are paid on such preferred stock, subject to certain limited exceptions. On November 6, 2009, we suspended dividend payments on our Series A Preferred Stock. As a result, the Company has accrued but has not paid approximately $2.8 million in dividends on its Series A Preferred Stock as of December 31, 2010. The Company's dividend payment on its outstanding Series A Preferred Stock issued to the U.S. Treasury that was due on February 15, 2011 was the sixth consecutive dividend payment suspended. Under
55
the terms of the Series A Preferred Stock, if the Company fails to pay dividends on the Series A Preferred Stock for a total of six quarters, whether or not consecutive, the U.S. Treasury has the right to elect two members of the Company's Board of Directors. These directors would serve on the Company's Board of Directors until such time as the Company has paid in full all dividends not previously paid. Although the U.S. Treasury has not indicated if or when it may exercise its right to have two members appointed to the Board of Directors, effective during the first quarter of 2011, the Company has permitted the U.S. Treasury to allow an observer employed by the U. S. Treasury to attend meetings of the Company's Board of Directors. So long as payment of dividends on the Series A Preferred Stock remain suspended, we may not, among other things and with limited exceptions, pay cash dividends on or repurchase our common stock or preferred stock.
On June 21, 2010, the Company issued Series B Mandatorily Convertible Cumulative Perpetual Preferred Stock ("Series B Preferred Stock") and Series C Convertible Perpetual Preferred Stock ("Series C Preferred Stock") to a limited number of institutional investors for an aggregate amount of $75.0 million. HCC then downstreamed $40 million of the proceeds from the private placement to the capital of HBC.
After receiving shareholder approval in September 2010, the outstanding Series B Preferred Stock converted into approximately 14.4 million shares of the Company's common stock. The Series C Preferred Stock remains outstanding until converted to common stock upon the transfer of the Series C Preferred Stock in accordance with its terms. Holders of Series C Preferred Stock will receive dividends if and only to the extent dividends are paid to holders of common stock.
We have supported our growth through the issuance of trust preferred securities from special purpose trusts and accompanying sales of subordinated debt to these trusts. The subordinated debt that we issued to the trusts is senior to our shares of common stock, Series A Preferred Stock, and Series C Preferred Stock. As a result, we must make payments on the subordinated debt before any dividends can be paid on our common stock, Series A Preferred Stock, and Series C Preferred Stock. Under the terms of the subordinated debt, we may defer interest payments for up to five years. On November 6, 2009, we exercised our right to defer regularly scheduled interest payments on our $23.7 million of subordinated debt relating to our trust preferred securities. As a result the Company has accrued but has not paid approximately $2.5 million in interest on its subordinated debt as of December 31, 2010. So long as interest payments remain deferred, we may not pay cash dividends on or repurchase our common stock or preferred stock.
Under the Written Agreement with our regulators we are required to obtain the prior approval of the Federal Reserve Bank of San Francisco and the Director of the Division of Banking Supervision and Regulation of the Federal Reserve to make any interest payments on our outstanding trust preferred securities and related subordinate debt, or to pay any dividends on our common stock or preferred stock. At December 31, 2010, HBC's total risk-based capital ratio was 18.1%, compared to the 10% regulatory requirement for well-capitalized banks under the regulatory framework for prompt corrective actions. HBC's Tier 1 risk-based capital ratio of 16.8% and leverage ratio of 12.1% at December 31, 2010 also exceeded regulatory guidelines for well-capitalized banks under the prompt corrective actions framework. On a consolidated basis, the Company has a leverage ratio of 14.1%, a Tier 1 risk-based capital ratio of 19.7%, and a total risk-based capital ratio of 21.0% at December 31, 2010.
Results of Operations
The Company earns income from two primary sources. The first is net interest income, which is interest income generated by earning assets less interest expense on interest-bearing liabilities. The second is noninterest income, which primarily consists of gains on the sale of SBA loans, loan servicing fees, customer service charges and fees, the increase in cash surrender value of life insurance, and gains on the
56
sale of securities. The majority of the Company's noninterest expenses are operating costs that relate to providing a full range of banking services to our customers.
Net Interest Income and Net Interest Margin
The level of net interest income depends on several factors in combination, including growth in earning assets, yields on earning assets, the cost of interest-bearing liabilities, the relative volumes of earning assets and interest-bearing liabilities, and the mix of products that comprise the Company's earning assets, deposits, and other interest-bearing liabilities. To maintain its net interest margin, the Company must manage the relationship between interest earned and paid.
The following Distribution, Rate and Yield table presents for each of the past three years, the average amounts outstanding for the major categories of the Company's balance sheet, the average interest rates earned or paid thereon, and the resulting net interest margin on average interest earning assets for the periods indicated. Average balances are based on daily averages.
Distribution, Rate and Yield
| |
Year Ended December 31, | ||||||||||||||||||||||||||||
|---|---|---|---|---|---|---|---|---|---|---|---|---|---|---|---|---|---|---|---|---|---|---|---|---|---|---|---|---|---|
| |
2010 | 2009 | 2008 | ||||||||||||||||||||||||||
| |
Average Balance |
Interest Income/ Expense |
Average Yield/ Rate |
Average Balance |
Interest Income/ Expense |
Average Yield/ Rate |
Average Balance |
Interest Income/ Expense |
Average Yield/ Rate |
||||||||||||||||||||
| |
(Dollars in thousands) |
||||||||||||||||||||||||||||
Assets: |
|||||||||||||||||||||||||||||
Loans, gross(1) |
$ | 971,025 | $ | 49,633 | 5.11 | % | $ | 1,171,537 | $ | 58,602 | 5.00 | % | $ | 1,178,194 | $ | 70,488 | 5.98 | % | |||||||||||
Securities |
148,069 | 5,236 | 3.54 | % | 106,806 | 3,628 | 3.40 | % | 126,223 | 5,395 | 4.27 | % | |||||||||||||||||
Federal funds sold and interest-bearing deposits in other financial institutions |
89,082 | 218 | 0.24 | % | 23,260 | 63 | 0.27 | % | 3,941 | 74 | 1.88 | % | |||||||||||||||||
Total interest earning assets |
1,208,176 | 55,087 | 4.56 | % | 1,301,603 | 62,293 | 4.79 | % | 1,308,358 | 75,957 | 5.81 | % | |||||||||||||||||
Cash and due from banks |
21,235 | 24,985 | 34,339 | ||||||||||||||||||||||||||
Premises and equipment, net |
8,742 | 9,311 | 9,273 | ||||||||||||||||||||||||||
Goodwill and other intangible assets |
24,609 | 47,105 | 47,788 | ||||||||||||||||||||||||||
Other assets |
75,216 | 56,940 | 56,603 | ||||||||||||||||||||||||||
Total assets |
$ | 1,337,978 | $ | 1,439,944 | $ | 1,456,361 | |||||||||||||||||||||||
Liabilities and shareholders' equity: |
|||||||||||||||||||||||||||||
Deposits: |
|||||||||||||||||||||||||||||
Demand, interest-bearing |
$ | 153,618 | 341 | 0.22 | % | $ | 136,734 | $ | 336 | 0.25 | % | $ | 145,785 | $ | 1,513 | 1.04 | % | ||||||||||||
Savings and money market |
297,257 | 1,440 | 0.48 | % | 334,657 | 2,514 | 0.75 | % | 433,839 | 7,679 | 1.77 | % | |||||||||||||||||
Time deposits-under $100 |
37,889 | 496 | 1.31 | % | 43,946 | 983 | 2.24 | % | 36,301 | 1,101 | 3.03 | % | |||||||||||||||||
Time deposits-$100 and over |
134,024 | 1,900 | 1.42 | % | 155,475 | 2,813 | 1.81 | % | 162,298 | 4,853 | 2.99 | % | |||||||||||||||||
Time deposits-CDARS |
18,252 | 159 | 0.87 | % | 19,702 | 303 | 1.54 | % | 3,488 | 81 | 2.32 | % | |||||||||||||||||
Time deposits-brokered |
155,558 | 3,750 | 2.41 | % | 196,113 | 6,513 | 3.32 | % | 120,591 | 4,808 | 3.99 | % | |||||||||||||||||
Subordinated debt |
23,702 | 1,878 | 7.92 | % | 23,702 | 1,933 | 8.15 | % | 23,702 | 2,148 | 9.06 | % | |||||||||||||||||
Securities sold under agreement to repurchase |
18,767 | 418 | 2.23 | % | 28,822 | 787 | 2.73 | % | 32,030 | 937 | 2.93 | % | |||||||||||||||||
Note payable |
— | — | N/A | 2,507 | 82 | 3.27 | % | 10,243 | 292 | 2.85 | % | ||||||||||||||||||
Short-term borrowings |
8,347 | 130 | 1.56 | % | 24,940 | 62 | 0.25 | % | 48,238 | 1,032 | 2.14 | % | |||||||||||||||||
Total interest-bearing liabilities |
847,414 | 10,512 | 1.24 | % | 966,598 | 16,326 | 1.69 | % | 1,016,515 | 24,444 | 2.40 | % | |||||||||||||||||
Demand, noninterest-bearing |
265,546 | 261,539 | 258,624 | ||||||||||||||||||||||||||
Total interest-bearing liabilities and demand, noninterest-bearing / cost of funds |
1,112,960 | 10,512 | 0.94 | % | 1,228,137 | 16,326 | 1.33 | % | 1,275,139 | 24,444 | 1.92 | % | |||||||||||||||||
Other liabilities |
43,776 | 32,417 | 28,006 | ||||||||||||||||||||||||||
Total liabilities |
1,156,736 | 1,260,554 | 1,303,145 | ||||||||||||||||||||||||||
Shareholders' equity |
181,242 | 179,390 | 153,216 | ||||||||||||||||||||||||||
Total liabilities and shareholders' equity |
$ | 1,337,978 | $ | 1,439,944 | $ | 1,456,361 | |||||||||||||||||||||||
Net interest income / margin |
$ | 44,575 | 3.69 | % | $ | 45,967 | 3.53 | % | $ | 51,513 | 3.94 | % | |||||||||||||||||
- (1)
- Includes loans held-for-sale. Yields and amounts earned on loans include loan fees and costs. Nonaccrual loans are included in average balance.
57
The Volume and Rate Variances table below sets forth the dollar difference in interest earned and paid for each major category of interest-earning assets and interest-bearing liabilities for the noted periods, and the amount of such change attributable to changes in average balances (volume) or changes in average interest rates. Volume variances are equal to the increase or decrease in the average balance times the prior period rate and rate variances are equal to the increase or decrease in the average rate times the prior period average balance. Variances attributable to both rate and volume changes are equal to the change in rate times the change in average balance and are included below in the average volume column.
Volume and Rate Variances
| |
2010 vs. 2009 | 2009 vs. 2008 | ||||||||||||||||||||
|---|---|---|---|---|---|---|---|---|---|---|---|---|---|---|---|---|---|---|---|---|---|---|
| |
Increase (Decrease) Due to Change in: |
Increase (Decrease) Due to Change in: |
||||||||||||||||||||
| |
Average Volume |
Average Rate |
Net Change |
Average Volume |
Average Rate |
Net Change |
||||||||||||||||
| |
(Dollars in thousands) |
|||||||||||||||||||||
Income from the interest earning assets: |
||||||||||||||||||||||
Loans, gross |
$ | (10,233 | ) | $ | 1,264 | $ | (8,969 | ) | $ | (308 | ) | $ | (11,578 | ) | $ | (11,886 | ) | |||||
Securities |
1,455 | 153 | 1,608 | (664 | ) | (1,103 | ) | (1,767 | ) | |||||||||||||
Federal funds sold and interest-bearing deposits in other financial institutions |
163 | (8 | ) | 155 | 52 | (63 | ) | (11 | ) | |||||||||||||
Total interest income on interest earning assets |
(8,615 | ) | 1,409 | (7,206 | ) | (920 | ) | (12,744 | ) | (13,664 | ) | |||||||||||
Expense from the interest-bearing liabilities: |
||||||||||||||||||||||
Demand, interest-bearing |
40 | (35 | ) | 5 | (28 | ) | (1,149 | ) | (1,177 | ) | ||||||||||||
Savings and money market |
(166 | ) | (908 | ) | (1,074 | ) | (740 | ) | (4,425 | ) | (5,165 | ) | ||||||||||
Time deposits-under $100 |
(80 | ) | (407 | ) | (487 | ) | 170 | (288 | ) | (118 | ) | |||||||||||
Time deposits-$100 and over |
(308 | ) | (605 | ) | (913 | ) | (125 | ) | (1,915 | ) | (2,040 | ) | ||||||||||
Time deposits-CDARS |
(12 | ) | (132 | ) | (144 | ) | 249 | (27 | ) | 222 | ||||||||||||
Time deposits-brokered |
(976 | ) | (1,787 | ) | (2,763 | ) | 2,509 | (804 | ) | 1,705 | ||||||||||||
Subordinated debt |
— | (55 | ) | (55 | ) | — | (216 | ) | (216 | ) | ||||||||||||
Securities sold under agreement to repurchase |
(225 | ) | (144 | ) | (369 | ) | (87 | ) | (63 | ) | (150 | ) | ||||||||||
Notes payable |
(82 | ) | — | (82 | ) | (253 | ) | 43 | (210 | ) | ||||||||||||
Short-term borrowings |
(259 | ) | 327 | 68 | (58 | ) | (911 | ) | (969 | ) | ||||||||||||
Total interest expense on interest-bearing liabilities |
(2,068 | ) | (3,746 | ) | (5,814 | ) | 1,637 | (9,755 | ) | (8,118 | ) | |||||||||||
Net interest income |
$ | (6,547 | ) | $ | 5,155 | $ | (1,392 | ) | $ | (2,557 | ) | $ | (2,989 | ) | $ | (5,546 | ) | |||||
The Company's net interest margin, expressed as a percentage of average earning assets was 3.69% for 2010, an increase of 16 basis points from 3.53% for 2009. The Company's net interest margin expanded in 2010 as yields on loans and securities increased and the costs of deposits and borrowings continued to decline. The yield on interest earning assets decreased by 23 basis points to 4.56% in 2010 from 4.79% in 2009, primarily due to the investment of proceeds from the June 2010 capital raise in short-term investments and deposits at the Federal Reserve Bank. The Company's relatively short-term investments allow the Company to maximize yields on excess liquidity while providing cash flow to support potential loan growth in future periods. The cost of total deposits, including noninterest-bearing demand deposits, decreased 41 basis points to 0.76% in 2010 from 1.17% in 2009. The cost of funds decreased 39 basis points
58
to 0.94% in 2010 from 1.33% in 2009, as a result of maturing higher-cost wholesale funding and a more cost-effective blend of core deposits.
Net interest income for the year ended December 31, 2010 decreased $1.4 million to $44.6 million, compared to $46.0 million a year ago, primarily due to a decrease in average loan balances, partially offset by an increase in average investment securities, an increase in average Federal funds sold, and interest-bearing deposits, as well as a lower cost of funds.
Net interest income for 2009 decreased $5.5 million from 2008, primarily due to compression of the net interest margin. The decrease in the net interest margin in 2009 compared to 2008 was primarily due to the 325 basis points decline in short-term interest rates from January 22, 2008 through December 16, 2008, with the prime rate remaining at a historically low level of 3.25% for all of 2009 and 2010. The Company's net interest margin was 3.53% in 2009, compared to 3.94% in 2008, a decrease of 41 basis points. The net interest margin was also lower in 2009 due to an increase in nonaccrual loans.
A substantial portion of the Company's earning assets are variable-rate loans that re-price when the Company's prime lending rate is changed, in contrast to a large base of core deposits that are generally slower to re-price. This causes the Company's balance sheet to be asset-sensitive which means that, all else being equal, the Company's net interest margin will be lower during periods when short-term interest rates are falling and higher when rates are rising.
Provision for Loan Losses
Credit risk is inherent in the business of making loans. The Company establishes an allowance for loan losses through charges to earnings, which are shown in the statements of operations as the provision for loan losses. Specifically identifiable and quantifiable known losses are promptly charged off against the allowance. The provision for loan losses is determined by conducting a quarterly evaluation of the adequacy of the Company's allowance for loan losses and charging the shortfall, if any, to the current quarter's expense. This has the effect of creating variability in the amount and frequency of charges to the Company's earnings. The provision for loan losses and level of allowance for each period are dependent upon many factors, including loan growth, net charge-offs, changes in the composition of the loan portfolio, delinquencies, management's assessment of the quality of the loan portfolio, the valuation of problem loans and the general economic conditions in the Company's market area.
For 2010, the Company had a provision for loan losses of $26.8 million, compared to a provision for loan losses of $33.9 million for 2009 and a provision for loan losses of $15.5 million for 2008. The decrease in the 2010 provision for loan losses compared to 2009 reflects the decrease in the size of the loan portfolio and improvement in credit quality in the latter half of the year. The significant increase in the provision for loan losses in 2009 compared to 2008 reflects a higher volume of classified and nonperforming loans and an increase in loan charge-offs caused by challenging conditions in commercial lending and the residential housing market, turmoil in the financial markets, and the prolonged downturn in the overall economy.
The allowance for loan losses represented 2.98%, 2.69% and 2.00% of total loans at December 31, 2010, 2009 and 2008, respectively. Provisions for loan losses are charged to operations to bring the allowance for loan losses to a level deemed appropriate by the Company based on the factors discussed under "Allowance for Loan Losses."
59
Noninterest Income
The following table sets forth the various components of the Company's noninterest income:
| |
Year Ended December 31, | Increase (decrease) 2010 versus 2009 |
Increase (decrease) 2009 versus 2008 |
|||||||||||||||||
|---|---|---|---|---|---|---|---|---|---|---|---|---|---|---|---|---|---|---|---|---|
| |
2010 | 2009 | 2008 | Amount | Percent | Amount | Percent | |||||||||||||
| |
(Dollars in thousands) |
|||||||||||||||||||
Service charges and fees on deposit accounts |
$ | 2,228 | $ | 2,221 | $ | 2,007 | $ | 7 | 0% | $ | 214 | 11% | ||||||||
Gain on sale of securities |
1,955 | 231 | — | 1,724 | 746% | 231 | N/A | |||||||||||||
Servicing income |
1,719 | 1,587 | 1,790 | 132 | 8% | (203 | ) | (11)% | ||||||||||||
Increase in cash surrender value of life insurance |
1,677 | 1,664 | 1,645 | 13 | 1% | 19 | 1% | |||||||||||||
Gain on sale of SBA loans |
1,058 | 1,306 | — | (248 | ) | (19)% | 1,306 | N/A | ||||||||||||
Loss on sale of other loans |
(887 | ) | — | — | (887 | ) | N/A | — | N/A | |||||||||||
Other |
983 | 1,018 | 1,349 | (35 | ) | (3)% | (331 | ) | (25)% | |||||||||||
Total |
$ | 8,733 | $ | 8,027 | $ | 6,791 | $ | 706 | 9% | $ | 1,236 | 18% | ||||||||
The increase in noninterest income in 2010 compared to 2009 was primarily due to $2.0 million in gains on the sale of securities in 2010, partially offset by an $887,000 loss on the sale of problem loans. The increase in noninterest income in 2009 compared to 2008 was primarily attributable to a $1.3 million increase in gain on sale of SBA loans. Other sources of noninterest income include loan servicing fees, service charges and fees, and the cash surrender value from company owned life insurance policies.
In 2010, the Company sold $44.0 million of investment securities for total gross proceeds of $46.0 million resulting in a $2.0 million gain on sale of securities, compared to a $231,000 gain on sale of securities in 2009, and no gain on sale of securities in 2008.
Historically, a significant percentage of the Company's noninterest income has been associated with its SBA lending activity, as gains on the sale of loans sold in the secondary market and servicing income from loans sold with servicing rights retained. During 2010, SBA loan sales resulted in a $1.1 million gain, compared to a $1.3 million gain on sale of SBA loans in 2009, and no gain on sale of SBA loans in 2008. The servicing assets that result from the sale of SBA loans with servicing retained are amortized over the expected term of the loans using a method approximating the interest method. Servicing income generally declines as the respective loans are repaid.
The increase in cash surrender value of life insurance approximates a 4.02% after tax yield on the policies. To realize this tax advantaged yield the policies must be held until death of the insured individuals, who are current and former officers and directors of the Company.
60
Noninterest Expense
The following table sets forth the various components of the Company's noninterest expense:
| |
Year Ended December 31, | Increase (decrease) 2010 versus 2009 |
Increase (decrease) 2009 versus 2008 |
||||||||||||||||||||
|---|---|---|---|---|---|---|---|---|---|---|---|---|---|---|---|---|---|---|---|---|---|---|---|
| |
2010 | 2009 | 2008 | Amount | Percent | Amount | Percent | ||||||||||||||||
| |
(Dollars in thousands) |
||||||||||||||||||||||
Salaries and employee benefits |
$ | 21,234 | $ | 22,927 | $ | 22,624 | $ | (1,693 | ) | (7 | )% | $ | 303 | 1 | % | ||||||||
Occupancy and equipment |
4,087 | 3,937 | 4,623 | 150 | 4 | % | (686 | ) | (15 | )% | |||||||||||||
FDIC deposit insurance premiums |
4,002 | 3,321 | 766 | 681 | 21 | % | 2,555 | 334 | % | ||||||||||||||
Professional fees |
3,975 | 3,851 | 2,954 | 124 | 3 | % | 897 | 30 | % | ||||||||||||||
Writedown of loans held-for-sale |
1,080 | — | — | 1,080 | N/A | — | N/A | ||||||||||||||||
Insurance expense |
1,007 | 639 | 535 | 368 | 58 | % | 104 | 19 | % | ||||||||||||||
Software subscription |
1,004 | 865 | 940 | 139 | 16 | % | (75 | ) | (8 | )% | |||||||||||||
Data processing |
831 | 912 | 1,021 | (81 | ) | (9 | )% | (109 | ) | (11 | )% | ||||||||||||
Low income housing investment losses |
795 | 922 | 865 | (127 | ) | (14 | )% | 57 | 7 | % | |||||||||||||
Other real estate owned expense |
650 | 518 | 238 | 132 | 25 | % | 280 | 118 | % | ||||||||||||||
Advertising and promotion |
395 | 406 | 882 | (11 | ) | (3 | )% | (476 | ) | (54 | )% | ||||||||||||
Impairment of goodwill |
43,181 | — | — | 43,181 | N/A | — | N/A | ||||||||||||||||
Other |
5,886 | 6,462 | 6,944 | (576 | ) | (9 | )% | (482 | ) | (7 | )% | ||||||||||||
Total |
$ | 88,127 | $ | 44,760 | $ | 42,392 | $ | 43,367 | 97 | % | $ | 2,368 | 6 | % | |||||||||
The following table indicates the percentage of noninterest expense in each category:
Noninterest Expense by Category
| |
2010 | 2009 | 2008 | |||||||||||||||||
|---|---|---|---|---|---|---|---|---|---|---|---|---|---|---|---|---|---|---|---|---|
| |
Amount | Percent of Total |
Amount | Percent of Total |
Amount | Percent of Total |
||||||||||||||
| |
(Dollars in thousands) |
|||||||||||||||||||
Salaries and employee benefits |
$ | 21,234 | 24 | % | $ | 22,927 | 51 | % | $ | 22,624 | 53 | % | ||||||||
Occupancy and equipment |
4,087 | 5 | % | 3,937 | 9 | % | 4,623 | 11 | % | |||||||||||
FDIC deposit insurance premiums |
4,002 | 4 | % | 3,321 | 7 | % | 766 | 2 | % | |||||||||||
Professional fees |
3,975 | 5 | % | 3,851 | 9 | % | 2,954 | 7 | % | |||||||||||
Writedown of loans held-for-sale |
1,080 | 1 | % | — | 0 | % | — | 0 | % | |||||||||||
Insurance expense |
1,007 | 1 | % | 639 | 1 | % | 535 | 1 | % | |||||||||||
Software subscription |
1,004 | 1 | % | 865 | 2 | % | 940 | 2 | % | |||||||||||
Data processing |
831 | 1 | % | 912 | 2 | % | 1,021 | 2 | % | |||||||||||
Low income housing investment losses |
795 | 1 | % | 922 | 2 | % | 865 | 2 | % | |||||||||||
Other real estate owned expense |
650 | 1 | % | 518 | 1 | % | 238 | 1 | % | |||||||||||
Advertising and promotion |
395 | 0 | % | 406 | 1 | % | 882 | 2 | % | |||||||||||
Impairment of goodwill |
43,181 | 49 | % | — | 0 | % | — | 0 | % | |||||||||||
Other |
5,886 | 7 | % | 6,462 | 15 | % | 6,944 | 17 | % | |||||||||||
Total |
$ | 88,127 | 100 | % | $ | 44,760 | 100 | % | $ | 42,392 | 100 | % | ||||||||
Salaries and employee benefits decreased $1.7 million, or 7%, for 2010, compared to 2009, primarily due to a reduction in workforce implemented in the fourth quarter of 2009, an additional reduction in workforce implemented in the fourth quarter of 2010, and a reduction of stock option expense as stock options forfeited exceeded the initial forfeiture rate utilized. Full-time equivalent employees were 181, 206, and 225 at December 31, 2010, 2009, and 2008, respectively. FDIC deposit insurance premiums increased
61
$681,000, or 21%, for 2010, compared to 2009, mainly due to an increase in the FDIC deposit assessment rate. Noninterest expense for 2010 included the $1.1 million writedown of loans held-for-sale. Insurance expense increased $368,000, or 58%, in 2010 from 2009, primarily due to an increase in the directors' and officers' insurance premiums. Other real estate owned expense increased $132,000 for 2010, compared to 2009, primarily due to an increase in writedowns of OREO properties in 2010. During the second quarter of 2010, the Company determined that the entire $43.2 million of goodwill related to the acquisition of Diablo Valley Bank was impaired, due to the continued depressed economic conditions and the length of time and amount by which the Company's book value exceeded market value per share, and the Company's closing of the June 2010 private placement at a conversion price of $3.75 per share. Other operating expense decreased $576,000 in 2010 from 2009, primarily due to a lower loan provision for off-balance sheet risk liabilities and management's efforts to control costs.
Salaries and employee benefits increased $303,000 for 2009, compared to 2008, primarily due to reduced capitalized loan origination costs, partially offset by lower bonuses and lower 401(k) plan contributions. Occupancy and equipment decreased $686,000 in 2009 compared to 2008, primarily due to the consolidation of our two offices in Los Altos in the third quarter of 2008. FDIC deposit insurance premiums increased 334%, or $2.6 million for 2009 from 2008, primarily due to the special assessment imposed on each depository institution to help maintain public confidence in the federal deposit insurance system and an increase in the FDIC deposit assessment rate. Professional fees increased $897,000 in 2009 from 2008, primarily due to legal fees related to loan workouts and litigation, a branch acquisition transaction that was terminated in the second quarter of 2009 and increased expenses for bank regulatory compliance. More frequent testing for goodwill impairment with the assistance of a valuation firm, also increased professional fees in 2009 compared to 2008. Other real estate owned expense increased $280,000 for 2009, compared to 2008, due to an increase in OREO properties caused by the prolonged downturn in the overall economy. Advertising and promotion decreased $476,000 in 2009 from 2008, as a result of management's effort to control costs.
Income Tax Expense
The Company computes its provision for income taxes on a monthly basis. The effective tax rate is determined by applying the Company's statutory income tax rates to pre-tax book income as adjusted for permanent differences between pre-tax book income and actual taxable income. These permanent differences include, but are not limited to, tax-exempt interest income, increases in the cash surrender value of life insurance policies, California Enterprise Zone deductions, certain expenses that are not allowed as tax deductions, and tax credits.
The Company's Federal and state income tax benefit in 2010 was $5.8 million, as compared to an income tax benefit of $12.7 million in 2009, and an income tax benefit of $1.4 million in 2008. The $5.8 million income tax benefit for 2010 included $3.7 million of income tax expense in the second quarter of 2010 to establish a partial valuation allowance on the Company's net deferred tax asset. The following table shows the effective income tax rates for 2010, 2009, and 2008:
| |
For the Year Ended December 31, | |||||||||
|---|---|---|---|---|---|---|---|---|---|---|
| |
2010 | 2009 | 2008 | |||||||
Effective income tax rate |
(9.4 | )% | (51.5 | )% | (369.9 | )% | ||||
The difference in the effective tax rate compared to the combined Federal and state statutory tax rate of 42% is primarily the result of the Company's investment in life insurance policies whose earnings are not subject to taxes and tax credits related to investments in low income housing limited partnerships, the $43.2 million goodwill impairment, and the effect of the $3.7 million valuation allowance on deferred tax assets.
62
The Company has total investments of $4.7 million in low-income housing limited partnerships as of December 31, 2010. These investments have generated annual tax credits of approximately $1.0 million for the year ended December 31, 2010, and $1.1 million in each of the years ended December 31, 2009, and 2008.
Some items of income and expense are recognized in different years for tax purposes than when applying generally accepted accounting principles, leading to timing differences between the Company's actual tax liability and the amount accrued for this liability based on book income. These temporary differences comprise the "deferred" portion of the Company's tax expense or benefit, which is accumulated on the Company's books as a deferred tax asset or deferred tax liability until such time as they reverse. At the end of 2010, the Company had a net deferred tax asset of $27.4 million, compared to a deferred tax asset of $22.4 million at the end of 2009, and a net deferred tax asset of $17.3 million at the end of 2008.
Realization of the Company's deferred tax assets is primarily dependent upon the Company generating sufficient taxable income to obtain benefit from the reversal of net deductible temporary differences and utilization of tax credit carryforwards and the net operating loss carryforwards for Federal and California state income tax purposes. The amount of deferred tax assets considered realizable is subject to adjustment in future periods based on estimates of future taxable income. Under generally accepted accounting principles, a valuation allowance is required to be recognized if it is "more likely than not" that a deferred tax asset will not be realized. The determination of the realizability of the deferred tax assets is highly subjective and dependent upon judgment concerning management's evaluation of both positive and negative evidence, including forecasts of future income, cumulative losses, applicable tax planning strategies, and assessments of current and future economic and business conditions.
In assessing the realization of deferred tax assets at December 31, 2010, based on these factors, the Company believed that it was more likely than not that the Company will realize approximately $27.4 million of the benefits of these deductible differences, and therefore, a partial valuation allowance for deferred tax assets in the amount of $3.7 million was recorded at December 31, 2010. The $5.8 million income tax benefit for 2010 is net of the $3.7 million income tax expense to establish the partial valuation allowance.
In assessing the realization of deferred tax assets at December 31, 2009, the Company estimated that it had sufficient forecasted future taxable income and various tax planning strategies which could be implemented to generate taxable income in future periods, to support the balance of deferred tax assets. Based on these factors, the Company believed it was more likely than not that the Company will realize the benefits of these deductible differences, and therefore, no valuation allowance for deferred tax assets was recorded at December 31, 2009.
Financial Condition
As of December 31, 2010, total assets were $1.25 billion, a decrease of 9% from $1.36 billion at December 31, 2009. Total securities available-for-sale (at fair value) were $232.2 million, an increase of 111% from $110.0 million at December 31, 2009. The total loan portfolio, excluding loans held-for-sale, was $846.0 million, a decrease of 21% from $1.07 billion at year-end 2009. Total deposits were $993.9 million, a decrease of 9% from $1.09 billion at year-end 2009. Securities sold under agreement to repurchase decreased $20.0 million, or 80%, to $5.0 million at December 31, 2010, from $25.0 million at year-end 2009. In addition, short-term borrowings were $2.4 million at December 31, 2010, a decrease of 88% from $20.0 million at December 31, 2009.
63
Securities Portfolio
The following table reflects the estimated fair value for each category of securities for the past three years:
Investment Portfolio
| |
December 31, | |||||||||||
|---|---|---|---|---|---|---|---|---|---|---|---|---|
| |
2010 | 2009 | 2008 | |||||||||
| |
(Dollars in thousands) |
|||||||||||
Securities available-for-sale (at fair value) |
||||||||||||
U.S. Treasury |
$ | — | $ | — | $ | 19,496 | ||||||
U.S. Government Sponsored Entities |
— | 1,973 | 8,696 | |||||||||
Municipals — Tax Exempt |
— | — | 701 | |||||||||
Agency Mortgage-Backed Securities |
232,165 | 102,546 | 69,036 | |||||||||
Collateralized Mortgage Obligations |
— | 5,447 | 6,546 | |||||||||
Total |
$ | 232,165 | $ | 109,966 | $ | 104,475 | ||||||
The following table summarizes the weighted average life and weighted average yields of securities as of December 31, 2010:
| |
December 31, 2010 Weighted Average Life |
|||||||||||||||||||||||||||||||
|---|---|---|---|---|---|---|---|---|---|---|---|---|---|---|---|---|---|---|---|---|---|---|---|---|---|---|---|---|---|---|---|---|
| |
Within One Year |
After One and Within Five Years |
After Five and Within Ten Years |
After Ten Years |
Total | |||||||||||||||||||||||||||
| |
Amount | Yield | Amount | Yield | Amount | Yield | Amount | Yield | Amount | Yield | ||||||||||||||||||||||
| |
(Dollars in thousands) |
|||||||||||||||||||||||||||||||
Securities available-for-sale (at fair value): |
||||||||||||||||||||||||||||||||
Mortgage-Backed Securities — Residential |
$ | — | — | $ | 85,689 | 3.15 | % | $ | 99,444 | 3.04 | % | $ | 47,032 | 3.49 | % | $ | 232,165 | 3.17 | % | |||||||||||||
The securities portfolio is the second largest component of the Company's interest-earning assets, and the structure and composition of this portfolio is important to an analysis of the financial condition of the Company. The portfolio serves the following purposes: (i) it provides a source of pledged assets for securing certain deposits and borrowed funds, as may be required by law or by specific agreement with a depositor or lender; (ii) it can be used as an interest rate risk management tool, since it provides a large base of assets, the maturity and interest rate characteristics of which can be changed more readily than the loan portfolio to better match changes in the deposit base and other funding sources of the Company; and (iii) it is an alternative interest-earning use of funds when loan demand is weak or when deposits grow more rapidly than loans.
The Company's securities are all currently classified under existing accounting rules as "available-for-sale" to allow flexibility for the management of the portfolio. Accounting guidance requires available-for-sale securities to be marked to fair value with an offset to accumulated other comprehensive income (loss), a component of shareholders' equity. Monthly adjustments are made to reflect changes in the fair value of the Company's available-for-sale securities.
The Company's portfolio is historically comprised primarily of: (i) U.S. Treasury securities and U.S. Government sponsored entities' debt securities for liquidity and pledging; (ii) mortgage-backed securities, which in many instances can also be used for pledging, and which generally enhance the yield of the portfolio; (iii) municipal obligations, which provide tax free income and limited pledging potential; and (iv) collateralized mortgage obligations, which generally enhance the yield of the portfolio.
64
Compared to December 31, 2009, the securities portfolio increased by $122.2 million, or 111%, and increased to 19% of total assets at December 31, 2010, from 8% at December 31, 2009. The Company increased its holding of mortgage-back securities by $129.6 million to $232.2 million at December 31, 2010, from $102.5 million at December 31, 2009 to deploy proceeds from the June 2010 private placement and also offset a portion of the contraction in the loan portfolio. The Company has not used interest rate swaps or other derivative instruments to hedge fixed rate loans or securities to otherwise mitigate interest rate risk.
Loans
The Company's loans represent the largest portion of earning assets, substantially greater than the securities portfolio or any other asset category, and the quality and diversification of the loan portfolio is an important consideration when reviewing the Company's financial condition.
Gross loans, excluding loans held-for-sale, represented 68% of total assets at December 31, 2010, as compared to 78% of at December 31, 2009. The ratio of loans to deposits decreased to 85.12% at the end of 2010 from 98.24% at the end of 2009. Demand for loans has weakened within the Company's markets due to the current economic environment, and the Company has been more selective with respect to the types of loans the Company chooses to originate.
The Loan Distribution table that follows sets forth the Company's gross loans outstanding, excluding loans held-for-sale, and the percentage distribution in each category at the dates indicated.
Loan Distribution
| |
December 31, | |||||||||||||||||||||||||||||||
|---|---|---|---|---|---|---|---|---|---|---|---|---|---|---|---|---|---|---|---|---|---|---|---|---|---|---|---|---|---|---|---|---|
| |
2010 | % to Total | 2009 | % to Total | 2008 | % to Total | 2007 | % to Total | 2006 | % to Total | ||||||||||||||||||||||
| |
(Dollars in thousands) |
|||||||||||||||||||||||||||||||
Commercial |
$ | 378,412 | 45 | % | $ | 427,177 | 40 | % | $ | 525,080 | 42 | % | $ | 411,251 | 40 | % | $ | 284,093 | 40 | % | ||||||||||||
Real estate: |
||||||||||||||||||||||||||||||||
Commercial and residential |
337,457 | 40 | % | 400,731 | 37 | % | 405,530 | 33 | % | 361,211 | 35 | % | 239,041 | 34 | % | |||||||||||||||||
Land and construction |
62,356 | 7 | % | 182,871 | 17 | % | 256,567 | 21 | % | 215,597 | 21 | % | 143,834 | 20 | % | |||||||||||||||||
Home equity |
53,697 | 6 | % | 51,368 | 5 | % | 55,490 | 4 | % | 44,187 | 4 | % | 38,976 | 6 | % | |||||||||||||||||
Consumer |
13,244 | 2 | % | 7,181 | 1 | % | 4,310 | 0 | % | 3,044 | 0 | % | 2,422 | 0 | % | |||||||||||||||||
Loans |
845,166 | 100 | % | 1,069,328 | 100 | % | 1,246,977 | 100 | % | 1,035,290 | 100 | % | 708,366 | 100 | % | |||||||||||||||||
Deferred loan costs, net |
883 | — | 785 | — | 1,654 | — | 1,175 | — | 870 | — | ||||||||||||||||||||||
Total loans, including deferred costs |
846,049 | 100 | % | 1,070,113 | 100 | % | 1,248,631 | 100 | % | 1,036,465 | 100 | % | 709,236 | 100 | % | |||||||||||||||||
Allowance for loan losses |
(25,204 | ) | (28,768 | ) | (25,007 | ) | (12,218 | ) | (9,279 | ) | ||||||||||||||||||||||
Loans, net |
$ | 820,845 | $ | 1,041,345 | $ | 1,223,624 | $ | 1,024,247 | $ | 699,957 | ||||||||||||||||||||||
The Company's loan portfolio is concentrated in commercial, primarily manufacturing, wholesale, and services and commercial real estate, with a balance in land development and construction and home equity and consumer loans. The decrease in the Company's loan portfolio in 2010 is due to loans transferred to loans held-for-sale, diminished loan demand, and loan payoffs exceeding draw downs of loan commitments. Outstanding loan balances to total loan commitments were 75% at December 31, 2010, compared to 77% at December 31, 2009. The Company does not have any concentrations by industry or group of industries in its loan portfolio, however, 54% of its gross loans were secured by real property as of December 31, 2010, compared to 59% as of December 31, 2009. While no specific industry concentration is considered significant, the Company's lending operations are located in areas that are dependent on the technology and real estate industries and their supporting companies.
65
The Company's commercial loans are made for working capital, financing the purchase of equipment or for other business purposes. Commercial loans include loans with maturities ranging from thirty days to one year and "term loans" with maturities normally ranging from one to five years. Short-term business loans are generally intended to finance current transactions and typically provide for periodic principal payments, with interest payable monthly. Term loans normally provide for floating interest rates, with monthly payments of both principal and interest.
The Company is an active participant in the SBA and U.S. Department of Agriculture guaranteed lending programs, and has been approved by the SBA as a lender under the Preferred Lender Program. The Company regularly makes such guaranteed loans (collectively referred to as "SBA loans"). The guaranteed portion of these loans is typically sold in the secondary market depending on market conditions. When the guaranteed portion of an SBA loan is sold, the Company retains the servicing rights for the sold portion. During 2010, loans were sold resulting in a gain on sale of SBA loans of $1.1 million.
As of December 31, 2010, commercial and residential real estate loans of $337.5 million consist primarily of adjustable and fixed rate loans secured by deeds of trust on commercial and residential property. The commercial and residential real estate loans at December 31, 2010 consist of $191.6 million, or 57%, of commercial owner occupied properties, $141.1 million, or 42%, of commercial investment properties, and $4.8 million, or 1%, of residential properties. Properties securing the commercial and residential real estate loans are primarily located in the Company's primary market, which is the Greater San Francisco Bay Area.
The Company's commercial real estate loans consist primarily of loans based on the borrower's cash flow and are secured by deeds of trust on commercial and residential property to provide a secondary source of repayment. The Company generally restricts real estate term loans to no more than 75% of the property's appraised value or the purchase price of the property during the initial underwriting of the credit, depending on the type of property and its utilization. The Company offers both fixed and floating rate loans. Maturities on real estate mortgage loans are generally between five and ten years (with amortization ranging from fifteen to twenty-five years and a balloon payment due at maturity); however, SBA and certain other real estate loans that can be sold in the secondary market may be granted for longer maturities.
The Company's land and construction loans are primarily to finance the development/construction of commercial and single family residential properties. The Company utilizes underwriting guidelines to assess the likelihood of repayment from sources such as sale of the property or availability of permanent mortgage financing prior to making the construction loan. Land and construction loans decreased $120.5 million to $62.4 million, or 7% of total loans at December 31, 2010, from $182.9 million, or 17% of total loans at December 31, 2009.
The Company makes home equity lines of credit available to its existing customers. Home equity lines of credit are underwritten initially with a maximum 70% loan to value ratio. Home equity lines are reviewed at least semiannually, with specific emphasis on loans with a loan to value ratio greater than 70% and loans that were underwritten from mid-2005 through 2008, when real estate values were at the peak in the cycle. The Company takes measures to work with customers to reduce line commitments and minimize potential losses. There have been no adverse classifications to date as a result of the review.
Additionally, the Company makes consumer loans for the purpose of financing automobiles, various types of consumer goods, and other personal purposes. Consumer loans generally provide for the monthly payment of principal and interest. Most of the Company's consumer loans are secured by the personal property being purchased or, in the instances of home equity loans or lines, real property.
With certain exceptions, state chartered banks are permitted to make extensions of credit to any one borrowing entity up to 15% of the bank's capital and reserves for unsecured loans and up to 25% of the
66
bank's capital and reserves for secured loans. For HBC, these lending limits were $30.0 million and $49.9 million at December 31, 2010, respectively.
Loan Maturities
The following table presents the maturity distribution of the Company's loans as of December 31, 2010. The table shows the distribution of such loans between those loans with predetermined (fixed) interest rates and those with variable (floating) interest rates. Floating rates generally fluctuate with changes in the prime rate as reflected in the Western Edition of The Wall Street Journal. As of December 31, 2010, approximately 69% of the Company's loan portfolio consisted of floating interest rate loans.
Loan Maturities
| |
Due in One Year or Less |
Over One Year But Less than Five Years |
Over Five Years |
Total | |||||||||||
|---|---|---|---|---|---|---|---|---|---|---|---|---|---|---|---|
| |
(Dollars in thousands) |
||||||||||||||
Commercial |
$ | 333,152 | $ | 39,121 | $ | 6,139 | $ | 378,412 | |||||||
Real estate: |
|||||||||||||||
Commercial and residential |
110,767 | 191,488 | 35,202 | 337,457 | |||||||||||
Land and construction |
60,485 | 1,871 | — | 62,356 | |||||||||||
Home equity |
52,173 | 2 | 1,522 | 53,697 | |||||||||||
Consumer |
12,879 | 365 | — | 13,244 | |||||||||||
Loans |
$ | 569,456 | $ | 232,847 | $ | 42,863 | $ | 845,166 | |||||||
Loans with variable interest rates |
$ | 511,958 | $ | 67,509 | $ | 694 | $ | 580,161 | |||||||
Loans with fixed interest rates |
57,498 | 165,338 | 42,169 | 265,005 | |||||||||||
Loans |
$ | 569,456 | $ | 232,847 | $ | 42,863 | $ | 845,166 | |||||||
Loan Servicing
As of December 31, 2010 and 2009, there were $168.9 million and $162.8 million, respectively, in SBA loans were serviced by the Company for others. Activity for loan servicing rights was as follows:
| |
2010 | 2009 | 2008 | ||||||||
|---|---|---|---|---|---|---|---|---|---|---|---|
| |
(Dollars in thousands) |
||||||||||
Beginning of year balance |
$ | 1,067 | $ | 1,013 | $ | 1,754 | |||||
Additions |
325 | 572 | — | ||||||||
Amortization |
(477 | ) | (518 | ) | (741 | ) | |||||
End of year balance |
$ | 915 | $ | 1,067 | $ | 1,013 | |||||
Loan servicing rights are included in Accrued Interest Receivable and Other Assets on the consolidated balance sheets and reported net of amortization. There was no valuation allowance as of December 31, 2010 and 2009, as the fair market value of the assets was greater than the carrying value.
67
Activity for the I/O strip receivable was as follows:
| |
2010 | 2009 | 2008 | ||||||||
|---|---|---|---|---|---|---|---|---|---|---|---|
| |
(Dollars in thousands) |
||||||||||
Beginning of year balance |
$ | 2,116 | $ | 2,248 | $ | 2,332 | |||||
Additions |
— | — | — | ||||||||
Amortization |
(236 | ) | (425 | ) | (886 | ) | |||||
Unrealized gain (loss) |
260 | 293 | 802 | ||||||||
End of year balance |
$ | 2,140 | $ | 2,116 | $ | 2,248 | |||||
Nonperforming Assets
Financial institutions generally have a certain level of exposure to credit quality risk, and could potentially receive less than a full return of principal and interest if a debtor becomes unable or unwilling to repay. Since loans are the most significant assets of the Company and generate the largest portion of its revenues, the Company's management of credit quality risk is focused primarily on loan quality. Banks have generally suffered their most severe earnings declines as a result of customers' inability to generate sufficient cash flow to service their debts and/or downturns in national and regional economies and declines in overall asset values including real estate. In addition, certain debt securities that the Company may purchase have the potential of declining in value if the obligor's financial capacity to repay deteriorates.
The Company's policies and procedures identify market segments, set goals for portfolio growth or contraction, and establish limits on industry and geographic credit concentrations. In addition, these policies establish the Company's underwriting standards and the methods of monitoring ongoing credit quality. The Company's internal credit risk controls are centered in underwriting practices, credit granting procedures, training, risk management techniques, and familiarity with loan customers as well as the relative diversity and geographic concentration of our loan portfolio.
The Company's credit risk may also be affected by external factors such as the level of interest rates, employment, general economic conditions, real estate values, and trends in particular industries or geographic markets. As an independent community bank serving a specific geographic area, the Company must contend with the unpredictable changes in the general California market and, particularly, primary local markets. The Company's asset quality has suffered in the past from the impact of national and regional economic recessions, consumer bankruptcies, and depressed real estate values.
Nonperforming assets are comprised of the following: loans and loans held-for-sale for which the Company is no longer accruing interest; restructured loans; loans 90 days or more past due and still accruing interest (although they are generally placed on nonaccrual when they become 90 days past due, unless they are both well-secured and in the process of collection); and OREO from foreclosures. Management's classification of a loan as "nonaccrual" is an indication that there is reasonable doubt as to the full recovery of principal or interest on the loan. At that point, the Company stops accruing interest income, and reverses any uncollected interest that had been accrued as income. The Company begins recognizing interest income only as cash interest payments are received and it has been determined the collection of all outstanding principal is not in doubt. The loans may or may not be collateralized, and collection efforts are pursued. Loans may be restructured by management when a borrower has experienced some change in financial status causing an inability to meet the original repayment terms and where the Company believes the borrower will eventually overcome those circumstances and make full restitution. OREO consists of properties acquired by foreclosure or similar means that management is offering or will offer for sale. Total OREO was $1.3 million at December 31, 2010, compared to $2.2 million at December 31, 2009.
68
The following table provides information with respect to components of the Company's nonperforming assets at the dates indicated:
Nonperforming Assets
| |
December 31, | ||||||||||||||||
|---|---|---|---|---|---|---|---|---|---|---|---|---|---|---|---|---|---|
| |
2010 | 2009 | 2008 | 2007 | 2006 | ||||||||||||
| |
(Dollars in thousands) |
||||||||||||||||
Nonaccrual loans — held-for-sale |
$ | 2,026 | $ | — | $ | — | $ | — | $ | — | |||||||
Nonaccrual loans — held-for-investment |
28,821 | 59,480 | 39,981 | 3,363 | 3,866 | ||||||||||||
Restructured and loans over 90 days past due and still accruing |
2,492 | 2,895 | 460 | 101 | 451 | ||||||||||||
Total nonperforming loans |
33,339 | 62,375 | 40,441 | 3,464 | 4,317 | ||||||||||||
Other real estate owned |
1,296 | 2,241 | 660 | 1,062 | — | ||||||||||||
Total nonperforming assets |
$ | 34,635 | $ | 64,616 | $ | 41,101 | $ | 4,526 | $ | 4,317 | |||||||
Nonperforming assets as a percentage of loans plus other real estate owned plus nonaccrual loans held-for-sale |
4.08 | % | 6.03 | % | 3.30 | % | 0.44 | % | 0.61 | % | |||||||
Nonperforming assets as a percentage of total assets |
2.78 | % | 4.74 | % | 2.74 | % | 0.34 | % | 0.42 | % | |||||||
The following table provides nonperforming loans by loan type as of December 31, 2010:
| |
Nonaccrual | Restructured and Loans Over 90 Days Past Due and Still Accruing |
Total | |||||||||
|---|---|---|---|---|---|---|---|---|---|---|---|---|
| |
(Dollars in thousands) |
|||||||||||
Commercial |
$ | 13,545 | $ | 829 | $ | 14,374 | ||||||
Real estate: |
||||||||||||
Commercial and residential |
6,450 | 1,663 | 8,113 | |||||||||
Land and construction |
9,954 | — | 9,954 | |||||||||
Consumer |
898 | — | 898 | |||||||||
Total |
$ | 30,847 | $ | 2,492 | $ | 33,339 | ||||||
Allowance for Loan Losses
The allowance for loan losses is an estimate of probable incurred losses in the loan portfolio. Loans are charged-off against the allowance when management believes the uncollectibility of a loan balance is confirmed. Subsequent recoveries, if any, are credited to the allowance for loan losses. Management's methodology for estimating the allowance balance consists of several key elements, which include specific allowances on individual impaired loans and the formula driven allowances on pools of loans with similar risk characteristics. Allocations of the allowance may be made for specific loans, but the entire allowance is available for any loan that, in management's judgment, should be charged off.
Specific allowances are established for impaired loans. Management considers a loan to be impaired when it is probable that the Company will be unable to collect all amounts due according to the original contractual terms of the loan agreement, including scheduled interest payments. Loans for which the terms have been modified with a concession granted, and for which the borrower is experiencing financial difficulties, are considered troubled debt restructurings and classified as impaired. When a loan is considered to be impaired, the amount of impairment is measured based on the fair value of the collateral, less costs to sell, if the loan is collateral dependent or on the present value of expected future cash flows or values that are observable in the secondary market. If the measure of the impaired loans is less than the
69
investment in the loan, the deficiency will be charged off against the allowance for loan losses if the amount is a confirmed loss, or, alternatively, a specific allocation within the allowance will be established. Loans that are considered impaired are specifically excluded from the formula portion of the allowance for loan losses analysis.
The estimated loss factors for pools of loans that are not impaired are based on determining the probability of default and loss given default for loans within each segment of the portfolio, adjusted for significant factors that, in management's judgment, affect collectibility as of the evaluation date. The Company's historical delinquency experience and loss experience are utilized to determine the probability of default and loss given default for segments of the portfolio where the Company has experienced losses in the past. For segments of the portfolio where the Company has no significant prior loss experience, the Company uses quantifiable observable industry data to determine the probability of default and loss given default.
Loans that demonstrate a weakness, for which there is a possibility of loss if the weakness is not corrected, are categorized as "classified." Classified assets include all loans considered as substandard, substandard-nonaccrual, and doubtful and may result from problems specific to a borrower's business or from economic downturns that affect the borrower's ability to repay or that cause a decline in the value of the underlying collateral (particularly real estate), and OREO. The principal balance of classified assets, net of SBA guarantees, was $91.8 million at December 31, 2010, $166.3 million at December 31, 2009, and $135.4 million at December 31, 2008. Included in the $91.8 million of classified assets at December 31, 2010, were $2.3 million of loans held-for-sale. Loans held-for-sale are carried at the lower of cost or estimated fair value, and are not allocated an allowance for loan losses. Management of the level of classified assets will continue to be a focus for executive management, the lending staff and the Company's Special Assets Department.
It is the policy of management to maintain the allowance for loan losses at a level adequate for risks inherent in the loan portfolio. On an ongoing basis, we have engaged an outside firm to perform independent credit reviews of our loan portfolio. The Federal Reserve Bank of San Francisco and the California Department of Financial Institutions also review the allowance for loan losses as an integral part of the examination process. Based on information currently available, management believes that the allowance for loan losses is adequate. However, the loan portfolio can be adversely affected if California economic conditions and the real estate market in the Company's market area were to further weaken. Also, any weakness of a prolonged nature in the technology industry would have a negative impact on the local market. The effect of such events, although uncertain at this time, could result in an increase in the level of nonperforming loans and increased loan losses, which could adversely affect the Company's future growth and profitability. No assurance of the ultimate level of credit losses can be given with any certainty.
70
The following table summarizes the Company's loan loss experience, as well as provisions and charges to the allowance for loan losses and certain pertinent ratios for the periods indicated:
Allowance for Loan Losses
| |
2010 | 2009 | 2008 | 2007 | 2006 | |||||||||||||
|---|---|---|---|---|---|---|---|---|---|---|---|---|---|---|---|---|---|---|
| |
(Dollars in thousands) |
|||||||||||||||||
Balance, beginning of year |
$ | 28,768 | $ | 25,007 | $ | 12,218 | $ | 9,279 | $ | 10,224 | ||||||||
Charge-offs: |
||||||||||||||||||
Commercial |
(7,098 | ) | (16,512 | ) | (2,731 | ) | (84 | ) | (291 | ) | ||||||||
Real estate: |
||||||||||||||||||
Commercial and residential |
(6,763 | ) | (1,610 | ) | — | — | — | |||||||||||
Land and construction |
(17,927 | ) | (12,588 | ) | (75 | ) | — | — | ||||||||||
Home equity |
(25 | ) | (764 | ) | — | (20 | ) | (540 | ) | |||||||||
Consumer |
(354 | ) | (60 | ) | — | — | — | |||||||||||
Total charge-offs |
(32,167 | ) | (31,534 | ) | (2,806 | ) | (104 | ) | (831 | ) | ||||||||
Recoveries: |
||||||||||||||||||
Commercial |
837 | 1,187 | 49 | 929 | 389 | |||||||||||||
Real estate: |
||||||||||||||||||
Commercial and residential |
5 | 10 | — | — | — | |||||||||||||
Land and construction |
921 | 170 | 9 | — | — | |||||||||||||
Home equity |
36 | — | — | — | — | |||||||||||||
Total recoveries |
1,799 | 1,367 | 58 | 929 | 389 | |||||||||||||
Net (charge-offs) recoveries |
(30,368 | ) | (30,167 | ) | (2,748 | ) | 825 | (442 | ) | |||||||||
Provision for loan losses |
26,804 | 33,928 | 15,537 | (11 | ) | (503 | ) | |||||||||||
Allowance acquired in bank acquisition |
— | — | — | 2,125 | — | |||||||||||||
Balance, end of year |
$ | 25,204 | $ | 28,768 | $ | 25,007 | $ | 12,218 | $ | 9,279 | ||||||||
RATIOS: |
||||||||||||||||||
Net charge-offs (recoveries) to average loans* |
3.18 | % | 2.59 | % | 0.23 | % | (0.10 | )% | 0.06 | % | ||||||||
Allowance for loan losses to total loans* |
2.98 | % | 2.69 | % | 2.00 | % | 1.18 | % | 1.31 | % | ||||||||
Allowance for loan losses to nonperforming loans* |
80.49 | % | 46.12 | % | 62.00 | % | 353.00 | % | 215.00 | % | ||||||||
- *
- Excludes loans held-for-sale
The Company's allowance for loan losses decreased $3.6 million in 2010. The decrease in the provision for loan losses in 2010 was primarily due to a lower volume of classified and nonperforming loans and a lower loan balance. The Company had $32.2 million in charge-offs in 2010, which were nominally offset by loan recoveries of $1.8 million.
Net loans charged-off reflects the realization of losses in the portfolio that were partially recognized previously through provisions for loan losses. Net charge-offs were $30.4 million in 2010, compared to net charge-offs of $30.2 million in 2009, and net charge-offs of $2.7 million in 2008. Historical net loan charge-offs are not necessarily indicative of the amount of net charge-offs that the Company will realize in the future.
The following table provides a summary of the allocation of the allowance for loan losses for specific categories at the dates indicated. The allocation presented should not be interpreted as an indication that charges to the allowance for loan losses will be incurred in these amounts or proportions, or that the portion of the allowance allocated to each category represents the total amount available for charge-offs that may occur within these categories.
71
Allocation of Loan Loss Allowance
| |
December 31, | |||||||||||||||||||||||||||||||
|---|---|---|---|---|---|---|---|---|---|---|---|---|---|---|---|---|---|---|---|---|---|---|---|---|---|---|---|---|---|---|---|---|
| |
2010 | 2009 | 2008 | 2007 | 2006 | |||||||||||||||||||||||||||
| |
Allowance | Percent of Loans in each category to total loans |
Allowance | Percent of Loans in each category to total loans |
Allowance | Percent of Loans in each category to total loans |
Allowance | Percent of Loans in each category to total loans |
Allowance | Percent of Loans in each category to total loans |
||||||||||||||||||||||
| |
(Dollars in thousands) |
|||||||||||||||||||||||||||||||
Commercial |
$ | 13,952 | 45 | % | $ | 12,687 | 40 | % | $ | 13,913 | 42 | % | $ | 6,067 | 40 | % | $ | 4,872 | 40 | % | ||||||||||||
Real estate: |
||||||||||||||||||||||||||||||||
Commercial and residential |
5,500 | 40 | % | 3,467 | 37 | % | 4,261 | 33 | % | 2,416 | 35 | % | 1,507 | 34 | % | |||||||||||||||||
Land and construction |
4,271 | 7 | % | 11,492 | 17 | % | 5,014 | 21 | % | 1,923 | 21 | % | 1,243 | 20 | % | |||||||||||||||||
Home equity |
592 | 6 | % | 993 | 5 | % | 367 | 4 | % | 335 | 4 | % | 244 | 6 | % | |||||||||||||||||
Consumer |
889 | 2 | % | 129 | 1 | % | 47 | 0 | % | 88 | 0 | % | 24 | 0 | % | |||||||||||||||||
Unallocated |
— | N/A | — | N/A | 1,405 | N/A | 1,389 | N/A | 1,389 | N/A | ||||||||||||||||||||||
Total |
$ | 25,204 | 100 | % | $ | 28,768 | 100 | % | $ | 25,007 | 100 | % | $ | 12,218 | 100 | % | $ | 9,279 | 100 | % | ||||||||||||
In conjunction with the Company's revised methodology in estimating losses on loans that are not impaired, the unallocated portion of the allowance for loan losses was reallocated to the respective loan categories in 2009. Management believes that the revised methodology improves its ability to allocate probable credit loss to loan segments. Prior to 2009, management considered the unallocated portion of the allowance for loan losses necessary because of inherent subjective risk in the loan portfolio; however, the prior methodology did not distinguish this subjective allocation by loan segment. Management considers this matter to be a reallocation in its allowance for loan losses calculation, and believes that there would be no significant change in the balance of the allowance for loan losses if this approach was used in all of the years presented above. Therefore, amounts prior to 2009 have not been reallocated.
Goodwill
Goodwill resulted from the acquisition of Diablo Valley Bank in June 2007 and represented the excess of the purchase price over the fair value of acquired tangible assets and liabilities and identifiable intangible assets. Goodwill was assessed at least annually, as of November 30, for impairment with the assistance of an independent valuation firm. Goodwill impairment exists when a reporting unit's carrying value exceeds its fair value, which is determined through a two-step impairment test. Step 1 includes the determination of the carrying value of the Company's single reporting unit, including the existing goodwill and intangible assets, and estimating the fair value of the reporting unit. If the carrying amount of a reporting unit exceeds its fair value, the Company is required to perform a second step to the impairment test. Step 2 requires that the implied fair value of the reporting unit goodwill be compared to the carrying amount of that goodwill. If the carrying amount of the reporting unit goodwill exceeds the implied fair value of that goodwill, an impairment loss will be recognized in an amount equal to that excess.
Due to concerns about the Company's stock price, the condition of the banking industry in general, and the closing of the private placement of convertible preferred stock in June 2010, goodwill was tested for impairment in the second quarter of 2010, with the assistance of an independent valuation firm. Due to the continued depressed economic conditions and the length of time and amount by which the Company's book value exceeded market value per share, and the Company's closing of the private placement at a conversion price of $3.75 per share, the Company determined goodwill related to the acquisition of Diablo Valley Bank of $43.2 million was fully impaired during the second quarter of 2010.
72
Intangible Assets
Intangible assets consist of core deposit and customer relationship intangible assets arising from the acquisition of Diablo Valley Bank in June 2007. These assets are amortized over their estimated useful lives. Impairment testing of these assets is performed at the individual asset level. Impairment exists if the carrying amount of the asset is not recoverable and exceeds its fair value at the date of the impairment test. For intangible assets, estimates of expected future cash flows (cash inflows less cash outflows) that are directly associated with an intangible asset are used to determine the fair value of that asset. Management makes certain estimates and assumptions in determining the expected future cash flows from core deposit and customer relationship intangibles including account attrition, expected lives, discount rates, interest rates, servicing costs and other factors. Significant changes in these estimates and assumptions could adversely impact the valuation of these intangible assets. If an impairment loss exists, the carrying amount of the intangible asset is adjusted to a new cost basis. The new cost basis is then amortized over the remaining useful life of the asset. Based on its assessment, management concluded that there was no impairment of intangible assets at December 31, 2010.
Deposits
The composition and cost of the Company's deposit base are important components in analyzing the Company's net interest margin and balance sheet liquidity characteristics, both of which are discussed in greater detail in other sections in this report. The Company's liquidity is impacted by the volatility of deposits or other funding instruments or, in other words, by the propensity of that money to leave the institution for rate-related or other reasons. Deposits can be adversely affected if economic conditions in California, and the Company's market area in particular, continue to weaken. Potentially, the most volatile deposits in a financial institution are jumbo certificates of deposit, meaning time deposits with balances that equal or exceed $100,000, as customers with balances of that magnitude are typically more rate-sensitive than customers with smaller balances.
The following table summarizes the distribution of deposits and the percentage of distribution in each category of deposits for the periods indicated:
Deposits
| |
Years Ended December 31, | |||||||||||||||||||
|---|---|---|---|---|---|---|---|---|---|---|---|---|---|---|---|---|---|---|---|---|
| |
2010 | 2009 | 2008 | |||||||||||||||||
| |
Balance | % to Total | Balance | % to Total | Balance | % to Total | ||||||||||||||
| |
(Dollars in thousands) |
|||||||||||||||||||
Demand deposits, noninterest-bearing |
$ | 280,258 | 28 | % | $ | 260,840 | 24 | % | $ | 261,337 | 22 | % | ||||||||
Demand deposits, interest-bearing |
153,917 | 16 | % | 146,828 | 13 | % | 134,814 | 12 | % | |||||||||||
Savings and money market |
272,399 | 27 | % | 295,404 | 27 | % | 344,767 | 30 | % | |||||||||||
Time deposits — under $100 |
33,499 | 3 | % | 40,197 | 4 | % | 45,615 | 4 | % | |||||||||||
Time deposits — $100 and over |
137,514 | 14 | % | 129,831 | 12 | % | 171,269 | 15 | % | |||||||||||
Time deposits — CDARS |
17,864 | 2 | % | 38,154 | 4 | % | 11,666 | 1 | % | |||||||||||
Time deposits — brokered |
98,467 | 10 | % | 178,031 | 16 | % | 184,582 | 16 | % | |||||||||||
Total deposits |
$ | 993,918 | 100 | % | $ | 1,089,285 | 100 | % | $ | 1,154,050 | 100 | % | ||||||||
The Company obtains deposits from a cross-section of the communities it serves. The Company's business is not generally seasonal in nature. The Company is not dependent upon funds from sources outside the United States of America. At December 31, 2010 and 2009, less than 1% of deposits were from public sources.
73
Noninterest and low interest-bearing demand deposits increased $26.5 million, or 7% to $434.2 million at December 31, 2010, compared to $407.7 million at December 31, 2009. At December 31, 2010, brokered deposits decreased $79.6 million, or 45%, to $98.5 million, compared to $178.0 million at December 31, 2009.
The following table indicates the contractual maturity schedule of the Company's time deposits of $100,000 and over, and all CDARS and brokered deposits as of December 31, 2010:
Deposit Maturity Distribution
| |
Balance | % of Total | ||||||
|---|---|---|---|---|---|---|---|---|
| |
(Dollars in thousands) |
|||||||
Three months or less |
$ | 128,271 | 51 | % | ||||
Over three months through six months |
50,340 | 20 | % | |||||
Over six months through twelve months |
69,566 | 27 | % | |||||
Over twelve months |
5,668 | 2 | % | |||||
Total |
$ | 253,845 | 100 | % | ||||
The Company focuses primarily on providing and servicing business deposit accounts that are frequently over $100,000 in average balance per account. As a result, certain types of business clients that the Company serves typically carry average deposits in excess of $100,000. The account activity for some account types and client types necessitates appropriate liquidity management practices by the Company to ensure its ability to fund deposit withdrawals.
Return (Loss) on Equity and Assets
The following table indicates the ratios for return (loss) on average assets and average equity, dividend payout, and average equity to average assets for 2010, 2009, and 2008:
| |
2010 | 2009 | 2008 | |||||||
|---|---|---|---|---|---|---|---|---|---|---|
Return (loss) on average assets |
(4.17 | )% | (0.83 | )% | 0.12 | % | ||||
Return (loss) on average tangible assets |
(4.25 | )% | (0.86 | )% | 0.13 | % | ||||
Return (loss) on average equity(1) |
(30.82 | )% | (6.68 | )% | 1.15 | % | ||||
Return (loss) on average tangible equity(1) |
(35.66 | )% | (9.06 | )% | 1.67 | % | ||||
Dividend payout ratio(2) |
N/A | N/A | 253.42 | % | ||||||
Average equity to average assets ratio(1) |
13.55 | % | 12.46 | % | 10.52 | % | ||||
- (1)
- The
2010 ratios reflect the $70.0 million of net proceeds from the private placement completed in the second quarter of 2010.
- (2)
- Percentage is calculated based on dividends declared on common stock divided by net income (loss) available to common shareholders.
Off-Balance Sheet Arrangements
In the normal course of business, the Company makes commitments to extend credit to its customers as long as there are no violations of any conditions established in contractual arrangements. These commitments are obligations that represent a potential credit risk to the Company, yet are not reflected in any form within the Company's consolidated balance sheets. Total unused commitments to extend credit were $284.0 million at December 31, 2010, as compared to $328.2 million at December 31, 2009. Unused commitments represented 34% and 31% of outstanding gross loans at December 31, 2010 and 2009, respectively.
74
The effect on the Company's revenues, expenses, cash flows and liquidity from the unused portion of the commitments to provide credit cannot be reasonably predicted, because there is no certainty that the lines of credit will ever be fully utilized. For more information regarding the Company's off-balance sheet arrangements, see Note 14 to the financial statements located elsewhere herein.
The following table presents the Company's commitments to extend credit for the periods indicated:
| |
December 31, 2010 | December 31, 2009 | |||||||||||
|---|---|---|---|---|---|---|---|---|---|---|---|---|---|
| |
Fixed Rate | Variable Rate | Fixed Rate | Variable Rate | |||||||||
| |
(Dollars in thousands) |
||||||||||||
Unused lines of credit and commitments to make loans |
$ | 6,740 | $ | 256,575 | $ | 10,540 | $ | 297,900 | |||||
Standby letters of credit |
2,291 | 18,419 | 557 | 19,218 | |||||||||
|
$ | 9,031 | $ | 274,994 | $ | 11,097 | $ | 317,118 | |||||
Contractual Obligations
The contractual obligations of the Company, summarized by type of obligation and contractual maturity, at December 31, 2010, are as follows:
| |
Less Than One Year |
One to Three Years |
Three to Five Years |
After Five Years |
Total | ||||||||||||
|---|---|---|---|---|---|---|---|---|---|---|---|---|---|---|---|---|---|
| |
(Dollars in thousands) |
||||||||||||||||
Securities sold under agreement to repurchase |
$ | 5,000 | $ | — | $ | — | $ | — | $ | 5,000 | |||||||
Subordinated debt |
— | — | — | 23,702 | 23,702 | ||||||||||||
Short-term borrowings |
2,445 | — | — | — | 2,445 | ||||||||||||
Operating leases |
2,604 | 5,165 | 3,463 | 1,199 | 12,431 | ||||||||||||
Time deposits of $100 or more |
248,177 | 5,668 | — | — | 253,845 | ||||||||||||
Total debt and operating leases |
$ | 258,226 | $ | 10,833 | $ | 3,463 | $ | 24,901 | $ | 297,423 | |||||||
In addition to those obligations listed above, in the normal course of business, the Company will make cash distributions for the payment of interest on interest-bearing deposit accounts and debt obligations, payments for quarterly income tax estimates and contributions to certain employee benefit plans.
Liquidity and Asset/Liability Management
Liquidity refers to the Company's ability to maintain cash flows sufficient to fund operations and to meet obligations and other commitments in a timely and cost effective fashion. At various times the Company requires funds to meet short-term cash requirements brought about by loan growth or deposit outflows, the purchase of assets, or liability repayments. An integral part of the Company's ability to manage its liquidity position appropriately is the Company's large base of core deposits, which are generated by offering traditional banking services in its service area and which have, historically, been a stable source of funds. To manage liquidity needs properly, cash inflows must be timed to coincide with anticipated outflows or sufficient liquidity resources must be available to meet varying demands. The Company manages liquidity to be able to meet unexpected sudden changes in levels of its assets or deposit liabilities without maintaining excessive amounts of balance sheet liquidity. Excess balance sheet liquidity can negatively impact the Company's interest margin. In order to meet short-term liquidity needs, the Company may utilize overnight Federal funds purchase arrangements and other borrowing arrangements with correspondent banks, solicit brokered deposits if cost effective deposits are not available from local sources and maintains collateralized lines of credit with the FHLB and FRB. In addition, the Company can raise cash for temporary needs by selling securities under agreements to repurchase and selling securities available-for-sale.
75
At December 31, 2010, the Company had loan contraction, including loans held-for-sale, of $223.8 million from December 31, 2009, and it has experienced an improvement in its liquidity position. One of the measures of liquidity is our loan to deposit ratio. Our loan to deposit ratio improved to 85.12% at December 31, 2010, compared to 98.24% at December 31, 2009.
FHLB and FRB Borrowings and Available Lines of Credit
The Company has off-balance sheet liquidity in the form of Federal funds purchase arrangements with correspondent banks, including the FHLB and FRB. The Company can borrow from the FHLB on a short-term (typically overnight) or long-term (over one year) basis. At December 31, 2010, the Company had no overnight borrowings from the FHLB. At December 31, 2009, the Company had $20.0 million of overnight borrowings from the FHLB, bearing interest at 0.04%. The Company had $221.1 million of loans pledged to the FHLB as collateral on an available line of credit of $111.8 million at December 31, 2010. The Company had $271.2 million of loans and no securities pledged to the FHLB as collateral on a line of credit of $136.4 million at December 31, 2009.
The Company can also borrow from FRB's discount window. The Company had $134.5 million of loans pledged to the FRB as collateral on an available line of credit of $77.9 million at December 31, 2010, none of which was outstanding. The Company had approximately $88.4 million of loans pledged to the FRB as collateral on an available line of credit of approximately $39.7 million at December 31, 2009, none of which was outstanding.
At December 31, 2010, the Company had Federal funds purchase arrangements available of $30.0 million. There were no Federal funds purchased outstanding at December 31, 2010 or 2009.
The Company also had $2.4 million of secured borrowings at December 31, 2010. Secured borrowings represent the guaranteed portions of SBA 7a loans transferred to third parties subject to a SBA warranty for a period of 90 days. This requires the Company to treat these loans as secured borrowings during the warranty period. The warranty period for these loans expires in the following quarter. Provided the loans remain current through the end of the warranty period all elements necessary to record the sale will have been met.
The Company also utilizes securities sold under repurchase agreements to manage our liquidity position. Repurchase agreements are accounted for as collateralized financial transactions and are secured by mortgage-backed securities carried at an amortized cost of approximately $6.3 million at December 31, 2010, and approximately $29.1 million at December 31, 2009. Securities sold under agreements to repurchase totaled $5.0 million at December 31, 2010, compared to $25.0 million at December 31, 2009.
The following table summarizes the Company's borrowings under its Federal funds purchased, security repurchase arrangements and lines of credit for the periods indicated:
| |
December 31, | |||||||||
|---|---|---|---|---|---|---|---|---|---|---|
| |
2010 | 2009 | 2008 | |||||||
| |
(Dollars in thousands) |
|||||||||
Average balance during the year |
$ | 23,888 | $ | 56,269 | $ | 90,511 | ||||
Average interest rate during the year |
1.78 | % | 1.65 | % | 2.50 | % | ||||
Maximum month-end balance during the year |
$ | 73,000 | $ | 122,000 | $ | 105,000 | ||||
Average rate at December 31 |
3.09 | % | 1.32 | % | 2.27 | % | ||||
Capital Resources
On June 21, 2010, the Company completed a private placement of Series B Preferred Stock and Series C Preferred Stock to a limited number of institutional investors for gross proceeds of $75.0 million. HCC downstreamed $40.0 million of the proceeds from the private placement to HBC as Tier 1 capital for regulatory purposes. The Company's shareholders approved the conversion of the Series B Preferred Stock
76
and Series C Preferred Stock in September 2010, and as a result the proceeds from the private placement constitute Tier 1 capital for regulatory purposes at the holding company level. As discussed below, the proceeds from the private placement have significantly improved the Company's regulatory ratios. Tangible equity increased to $179.1 million at December 31, 2010, from $125.5 million at December 31, 2009.
The Company uses a variety of measures to evaluate capital adequacy. Management reviews various capital measurements on a regular basis and takes appropriate action to ensure that such measurements are within established internal and external guidelines. The external guidelines, which are issued by the Federal Reserve Board and the FDIC, establish a risk-adjusted ratio relating capital to different categories of assets and off-balance sheet exposures. There are two categories of capital under the Federal Reserve Board and FDIC guidelines: Tier 1 and Tier 2 Capital. Our Tier 1 Capital currently consists of total shareholders' equity (excluding accumulated other comprehensive income or loss) and the proceeds from the issuance of trust preferred securities (trust preferred securities are counted only up to a maximum of 25% of Tier 1 capital), less goodwill and other intangible assets and disallowed deferred tax assets. Our Tier 2 Capital includes the allowances for loan losses and off balance sheet credit losses.
The following table summarizes risk-based capital, risk-weighted assets, and risk-based capital ratios of the Company:
| |
December 31, | |
|
|||||||||||||||
|---|---|---|---|---|---|---|---|---|---|---|---|---|---|---|---|---|---|---|
| |
2010 | 2009 | 2008 | |
|
|||||||||||||
| |
(Dollars in thousands) |
|
|
|||||||||||||||
Capital components: |
||||||||||||||||||
Tier 1 Capital |
$ | 185,775 | $ | 134,833 | $ | 163,328 | ||||||||||||
Tier 2 Capital |
11,988 | 14,720 | 16,989 | |||||||||||||||
Total risk-based capital |
$ | 197,763 | $ | 149,553 | $ | 180,317 | ||||||||||||
Risk-weighted assets |
$ | 945,499 | $ | 1,163,125 | $ | 1,350,823 | ||||||||||||
Average assets (regulatory purposes) |
$ | 1,316,600 | $ | 1,341,670 | $ | 1,449,380 | ||||||||||||
Well-Capitalized Regulatory Requirements |
Minimum Regulatory Requirements |
|||||||||||||||||
Capital ratios: |
||||||||||||||||||
Total risk-based capital |
20.9 | % | 12.9 | % | 13.4 | % | 10.00 | % | 8.00 | % | ||||||||
Tier 1 risk-based capital |
19.7 | % | 11.6 | % | 12.1 | % | 6.00 | % | 4.00 | % | ||||||||
Leverage(1) |
14.1 | % | 10.1 | % | 11.3 | % | N/A | 4.00 | % | |||||||||
- (1)
- Tier 1 capital divided by quarterly average assets (excluding goodwill, other intangible assets and disallowed deferred tax assets).
The table above presents the capital ratios of the Company computed in accordance with applicable regulatory guidelines and compared to the standards for minimum capital adequacy requirements. The risk-based and leverage capital ratios are also discussed in Item 1 — "Business — Supervision and Regulation — Heritage Bank of Commerce."
77
The following table summarizes risk-based capital, risk-weighted assets, and risk-based capital ratios of HBC:
| |
December 31, | |
|
|||||||||||||||
|---|---|---|---|---|---|---|---|---|---|---|---|---|---|---|---|---|---|---|
| |
2010 | 2009 | 2008 | |
|
|||||||||||||
| |
(Dollars in thousands) |
|
|
|||||||||||||||
Capital components: |
||||||||||||||||||
Tier 1 Capital |
$ | 159,192 | $ | 133,216 | $ | 152,675 | ||||||||||||
Tier 2 Capital |
11,993 | 14,743 | 16,973 | |||||||||||||||
Total risk-based capital |
$ | 171,185 | $ | 147,959 | $ | 169,648 | ||||||||||||
Risk-weighted assets |
$ | 945,918 | $ | 1,165,014 | $ | 1,349,471 | ||||||||||||
Average assets for capital purposes |
$ | 1,316,969 | $ | 1,344,407 | $ | 1,449,158 | ||||||||||||
Well-Capitalized Regulatory Requirements |
Minimum Regulatory Requirements |
|||||||||||||||||
Capital ratios: |
||||||||||||||||||
Total risk-based capital |
18.1 | % | 12.7 | % | 12.6 | % | 10.00 | % | 8.00 | % | ||||||||
Tier 1 risk-based capital |
16.8 | % | 11.4 | % | 11.3 | % | 6.00 | % | 4.00 | % | ||||||||
Leverage(1) |
12.1 | % | 9.9 | % | 10.5 | % | 5.00 | % | 4.00 | % | ||||||||
- (1)
- Tier 1 capital divided by quarterly average assets (excluding goodwill other intangible assets and disallowed deferred tax assets).
The table above presents the capital ratios of HBC computed in accordance with applicable regulatory guidelines and compared to the standards for minimum capital adequacy requirements under the FDIC's prompt corrective action authority. During 2010, in accordance with the Written Agreement, we submitted a written plan for sufficient capitalization of both HBC and HCC (on a consolidated basis), based on their respective risk profiles to the Federal Reserve and DFI. The plan was approved in the fourth quarter of 2010.
At December 31, 2010 and 2009, HCC's and HBC's capital met all minimum regulatory requirements. As of December 31, 2010, HBC's capital ratios exceed the highest regulatory capital requirement of "well-capitalized" under the prompt corrective action provisions.
At December, 2010, the Company had total shareholders' equity of $182.2 million, including $58.1 million in preferred stock, $130.5 million in common stock, ($1.8) million in accumulated deficit, and ($4.6) million of accumulated other comprehensive loss. The components of other comprehensive loss at December 31, 2010 include the following: an unrealized loss on available-for-sale securities of ($1.7) million; an unrealized loss on split dollar life insurance benefit plan of ($2.1) million; an unrealized loss on the supplemental executive retirement plan of ($2.0) million; and an unrealized gain on interest-only strip from SBA loans of $1.2 million.
Mandatory Redeemable Cumulative Trust Preferred Securities
To enhance regulatory capital and to provide liquidity, the Company, through unconsolidated subsidiary grantor trusts, issued the following mandatory redeemable cumulative trust preferred securities of subsidiary grantor trusts: In the first quarter of 2000, the Company issued $7.2 million aggregate principal amount of 10.875% subordinated debt due on March 8, 2030 to a subsidiary trust, which in turn issued a similar amount of trust preferred securities. In the third quarter of 2000, the Company issued $7.2 million aggregate principal amount of 10.60% subordinated debt due on September 7, 2030 to a subsidiary trust, which in turn issued a similar amount of trust preferred securities. In the third quarter of 2001, the Company issued $5.2 million aggregate principal amount of Floating Rate Junior Subordinated
78
Deferrable Interest Debentures due on July 31, 2031 to a subsidiary trust, which in turn issued a similar amount of trust preferred securities. In the third quarter of 2002, the Company issued $4.1 million of aggregate principal amount of Floating Rate Junior Subordinated Deferrable Interest Debentures due on September 26, 2032 to a subsidiary trust, which in turn issued a similar amount of trust preferred securities. The subordinated debt is recorded as a component of long-term debt and includes the value of the common stock issued by the trusts to the Company. The common stock is recorded as other assets for the amount issued. Under applicable regulatory guidelines, the trust preferred securities currently qualify as Tier I capital. The subsidiary trusts are not consolidated in the Company's consolidated financial statements. Under the Dodd-Frank Wall Street Reform and Consumer Protection Act, certain trust preferred securities will no longer be eligible to be included as Tier 1 capital for regulatory purposes. However, an exception to this statutory prohibition applies to securities issued prior to May 19, 2010 by bank holding companies with less than $15 billion of total assets. We believe, therefore, that our trust preferred securities will continue to be eligible to be treated as Tier 1 capital, subject to other rules and limitations.
In November 2009, the Company announced that it was exercising its right to defer interest payments on its outstanding trust preferred subordinated debt securities. The Company will continue to accrue the cost and recognize the expense of the interest at the normal rate on a compounded basis until such time as the deferred arrearage has been paid current. As a result the Company has accrued but has not paid approximately $2.5 million in interest on its subordinated debt as of December 31, 2010.
U.S. Treasury Capital Purchase Program
The Company received $40.0 million in November 2008 through the issuance of its Series A Preferred Stock and a warrant to purchase 462,963 shares of its common stock to the Treasury through the U.S. Treasury Capital Purchase Program. The Series A Preferred Stock qualifies as a component of Tier 1 capital. In November 2009, the Company announced that it was exercising its right to suspend payment of dividends on its Series A Preferred Stock. The Company accrues the cumulative unpaid dividends at the compounded dividend rate. As a result of the Company has accrued but has not paid approximately $2.8 million in dividends on its Series A Preferred Stock as of December 31, 2010.
Private Placement
On June 21, 2010, the Company issued to various institutional investors 53,996 shares of Series B Preferred Stock and 21,004 shares of Series C Preferred Stock for an aggregate purchase price of $75.0 million. The Series B Preferred Stock was mandatorily convertible into common stock, upon approval by the shareholders at a conversion price of $3.75 per share. The Series C Preferred Stock is mandatorily convertible into common stock at a conversion price of $3.75 per share upon both approval by the shareholders and thereafter, a subsequent transfer of the Series C Preferred stock to third parties not affiliates with the holder in a widely dispersed offering. The Series B Preferred Stock and the Series C Preferred Stock did not include a beneficial conversion feature, as the conversion price at $3.75 per share was not below the fair market value of the Company's common stock on the commitment date.
At the Company's Special Meeting of shareholders held on September 15, 2010, the Company's shareholders approved the issuance of common stock upon the conversion of the Series B Preferred Stock and upon the conversion of the Series C Preferred Stock. As a result, on September 16, 2010, the Series B Preferred Stock was converted into 14,398,992 shares of common stock of the Company and the shares of Series B Preferred Stock ceased to be outstanding.
The Series C Preferred Stock remains outstanding until it has been converted into common stock in accordance with its terms. The Series C Preferred Stock is non-voting except in the case of certain transactions that would affect the rights of the holders of the Series C Preferred Stock or applicable law. Holders of Series C Preferred Stock will receive dividends if and only to the extent dividends are paid to
79
holders of common stock. The Series C Preferred Stock is not redeemable by the Company or by the holders and has a liquidation preference of $1,000 per share. The Series C Preferred Stock ranks senior to the Company's common stock and ranks on parity with the Company's Series A Preferred Stock.
The holders of the Series B Preferred Stock and Series C Preferred Stock were entitled to receive cumulative dividends at a per annum rate of 20%, payable semi-annually in arrears commencing on December 21, 2010, unless shareholder approval was obtained before December 21, 2010. The Company recorded $411,000 of dividends on the Series B Preferred Stock and Series C Preferred Stock in the second quarter of 2010. As a result of the shareholder approval on September 15, 2010, no cumulative dividends were paid on the Series B Preferred Stock and the Series C Preferred Stock and the previously recognized dividends were reversed in the third quarter of 2010.
Market Risk
Market risk is the risk of loss of future earnings, fair values, or future cash flows that may result from changes in the price of a financial instrument. The value of a financial instrument may change as a result of changes in interest rates, foreign currency exchange rates, commodity prices, equity prices and other market changes that affect market risk sensitive instruments. Market risk is attributed to all market risk sensitive financial instruments, including securities, loans, deposits and borrowings, as well as the Company's role as a financial intermediary in customer-related transactions. The objective of market risk management is to avoid excessive exposure of the Company's earnings and equity to loss and to reduce the volatility inherent in certain financial instruments.
Interest Rate Management
Market risk arises from changes in interest rates, exchange rates, commodity prices and equity prices. The Company's market risk exposure is primarily that of interest rate risk, and it has established policies and procedures to monitor and limit earnings and balance sheet exposure to changes in interest rates. The Company does not engage in the trading of financial instruments, nor does the Company have exposure to currency exchange rates.
The principal objective of interest rate risk management (often referred to as "asset/liability management") is to manage the financial components of the Company in a manner that will optimize the risk/reward equation for earnings and capital in relation to changing interest rates. The Company's exposure to market risk is reviewed on a regular basis by the Asset/Liability Committee. Interest rate risk is the potential of economic losses due to future interest rate changes. These economic losses can be reflected as a loss of future net interest income and/or a loss of current fair market values. The objective is to measure the effect on net interest income and to adjust the balance sheet to minimize the inherent risk while at the same time maximizing income. Management realizes certain risks are inherent, and that the goal is to identify and manage the risks. Management uses two methodologies to manage interest rate risk: (i) a standard GAP analysis; and (ii) an interest rate shock simulation model.
The planning of asset and liability maturities is an integral part of the management of an institution's net interest margin. To the extent maturities of assets and liabilities do not match in a changing interest rate environment, the net interest margin may change over time. Even with perfectly matched repricing of assets and liabilities, risks remain in the form of prepayment of loans or securities or in the form of delays in the adjustment of rates of interest applying to either earning assets with floating rates or to interest bearing liabilities. The Company has generally been able to control its exposure to changing interest rates by maintaining primarily floating interest rate loans and a majority of its time certificates with relatively short maturities.
Interest rate changes do not affect all categories of assets and liabilities equally or at the same time. Varying interest rate environments can create unexpected changes in prepayment levels of assets and liabilities, which may have a significant effect on the net interest margin and are not reflected in the
80
interest sensitivity analysis table. Because of these factors, an interest sensitivity gap report may not provide a complete assessment of the exposure to changes in interest rates.
The Company uses modeling software for asset/liability management in order to simulate the effects of potential interest rate changes on the Company's net interest margin, and to calculate the estimated fair values of the Company's financial instruments under different interest rate scenarios. The program imports current balances, interest rates, maturity dates and repricing information for individual financial instruments, and incorporates assumptions on the characteristics of embedded options along with pricing and duration for new volumes to project the effects of a given interest rate change on the Company's interest income and interest expense. Rate scenarios consisting of key rate and yield curve projections are run against the Company's investment, loan, deposit and borrowed funds portfolios. These rate projections can be shocked (an immediate and parallel change in all base rates, up or down) and ramped (an incremental increase or decrease in rates over a specified time period), based on current trends and econometric models or stable economic conditions (unchanged from current actual levels).
The following table sets forth the estimated changes in the Company's net interest income that would result from the designated instantaneous parallel shift in interest rates noted, as of December 31, 2010. Computations of prospective effects of hypothetical interest rate changes are based on numerous assumptions including relative levels of market interest rates, loan prepayments and deposit decay, and should not be relied upon as indicative of actual results.
| |
Increase/(Decrease) in Estimated Net Interest Income |
|||||||
|---|---|---|---|---|---|---|---|---|
| |
Amount | Percent | ||||||
| |
(Dollars in thousands) |
|||||||
Change in Interest Rates (basis points) |
||||||||
+400 |
$ | 8,083 | 16.2 | % | ||||
+300 |
$ | 5,836 | 11.7 | % | ||||
+200 |
$ | 3,574 | 7.2 | % | ||||
+100 |
$ | 1,478 | 3.0 | % | ||||
0 |
$ | — | 0.0 | % | ||||
-100 |
$ | (3,538 | ) | -7.1 | % | |||
-200 |
$ | (8,101 | ) | -16.2 | % | |||
-300 |
$ | (12,576 | ) | -25.2 | % | |||
-400 |
$ | (13,718 | ) | -27.5 | % | |||
This data does not reflect any actions that we may undertake in response to changes in interest rates such as changes in rates paid on certain deposit accounts based on local competitive factors, which could reduce the actual impact on net interest income, if any.
As with any method of gauging interest rate risk, there are certain shortcomings inherent to the methodology noted above. The model assumes interest rate changes are instantaneous parallel shifts in the yield curve. In reality, rate changes are rarely instantaneous. The use of the simplifying assumption that short-term and long-term rates change by the same degree may also misstate historic rate patterns, which rarely show parallel yield curve shifts. Further, the model assumes that certain assets and liabilities of similar maturity or period to repricing will react in the same way to changes in rates. In reality, certain types of financial instruments may react in advance of changes in market rates, while the reaction of other types of financial instruments may lag behind the change in general market rates. Additionally, the methodology noted above does not reflect the full impact of annual and lifetime restrictions on changes in rates for certain assets, such as adjustable rate loans. When interest rates change, actual loan prepayments and actual early withdrawals from certificates may deviate significantly from the assumptions used in the model. Finally, this methodology does not measure or reflect the impact that higher rates may have on
81
adjustable-rate loan clients' ability to service their debt. All of these factors are considered in monitoring the Company's exposure to interest rate risk.
Critical Accounting Policies
General
The Company's consolidated financial statements are prepared in accordance with accounting principles generally accepted in the United States of America ("GAAP"). The financial information contained within our consolidated financial statements is, to a significant extent, based on approximate measures of the financial effects of transactions and events that have already occurred. A variety of factors could affect the ultimate value that is obtained either when earning income, recognizing an expense, recovering an asset or relieving a liability. In certain instances, we use a discount factor and prepayment assumptions to determine the present value of assets and liabilities. A change in the discount factor or prepayment speeds could increase or decrease the values of those assets and liabilities which would result in either a beneficial or adverse impact to our financial results. We use historical loss factors as one factor in determining the inherent loss that may be present in our loan portfolio. Actual losses could differ significantly from the historical factors that we use. Other estimates that we use are related to the realization of our deferred tax assets and the expected useful lives of our depreciable assets. In addition, GAAP itself may change from one previously acceptable method to another method, although the economics of our transactions would be the same.
Allowance for Loan Losses
The allowance for loan losses is an estimate of the losses in our loan portfolio. Our accounting for estimated loan losses was previously discussed under the heading "Allowance for Loan Losses."
Loan Sales and Servicing
The amounts of gains recorded on sales of loans and the initial recording of servicing assets and I/O strips are based on the estimated fair values of the respective components. In recording the initial value of the servicing assets and the fair value of the I/O strips receivable, the Company uses estimates which are made on management's expectations of future prepayment and discount rates as discussed in Notes 1 and 3 to the consolidated financial statements.
Stock Based Compensation
We grant stock options to purchase our common stock to our employees and directors under the 2004 Plan. We also granted our chief executive officer restricted stock when he joined the Company. Additionally, we have outstanding options that were granted under an option plan from which we no longer make grants. The benefits provided under all of these plans are subject to the provisions of accounting guidance related to share-based payments. Our results of operations for fiscal years 2010, 2009, and 2008 were impacted by the recognition of non-cash expense related to the fair value of our share-based compensation awards.
The determination of fair value of stock-based payment awards on the date of grant using the Black-Scholes model is affected by our stock price, as well as the input of other subjective assumptions. These assumptions include, but are not limited to, the expected term of stock options and our stock price volatility. Our stock options have characteristics significantly different from those of traded options, and changes in the assumptions can materially affect the fair value estimates.
Accounting guidance requires forfeitures to be estimated at the time of grant and revised, if necessary, in subsequent periods if actual forfeitures differ from those estimates. If actual forfeitures vary from our estimates, we will recognize the difference in compensation expense in the period the actual forfeitures occur.
82
Our accounting for stock options is disclosed primarily in Notes 1 and 10 to the consolidated financial statements.
Accounting for Goodwill and Other Intangible Assets
The Company accounts for acquisitions of businesses using the purchase method of accounting. Our accounting for Goodwill was previously discussed under the heading "Goodwill" and disclosed primarily in Notes 1 and 6 to the consolidated financial statements.
Intangible assets consist of core deposit and customer relationship intangible assets arising from the acquisition of Diablo Valley Bank in June 2007. Our accounting for Intangible Assets was previously discussed under the heading "Intangible Assets" and disclosed primarily in Notes 1 and 6 to the consolidated financial statements.
Deferred Tax Assets
Our net deferred income tax asset arises from temporary differences between the carrying amount of assets and liabilities reported in the financial statements and the amounts used for income tax return purposes. Our accounting for Deferred Tax Assets was previously discussed under the heading "Income Tax Expense" and disclosed primarily in Notes 1 and 9 to the consolidated financial statements.
ITEM 7A — QUANTITATIVE AND QUALITATIVE DISCLOSURES ABOUT MARKET RISK
As a financial institution, the Company's primary component of market risk is interest rate volatility. Fluctuations in interest rates will ultimately impact both the level of income and expense recorded on most of the Company's assets and liabilities and the market value of all interest-earning assets, other than those which have a short term to maturity. Based upon the nature of the Company's operations, the Company is not subject to foreign exchange or commodity price risk. The Company has no market risk sensitive instruments held for trading purposes. As of December 31, 2010, the Company did not use interest rate derivatives to hedge its interest rate risk.
The information concerning quantitative and qualitative disclosure or market risk called for by Item 305 of Regulation S-K is included as part of Item 7 of this report.
ITEM 8 — FINANCIAL STATEMENTS AND SUPPLEMENTARY DATA
The financial statements and report of the Independent Registered Public Accounting Firm are set forth on pages 89 through 139.
ITEM 9 — CHANGES IN AND DISAGREEMENTS WITH ACCOUNTANTS ON ACCOUNTING AND FINANCIAL DISCLOSURES
None.
ITEM 9A — CONTROLS AND PROCEDURES
Disclosure Control and Procedures
The Company has carried out an evaluation, under the supervision and with the participation of the Company's management, including the Chief Executive Officer and Chief Financial Officer, of the effectiveness of the design and operation of the Company's disclosure controls and procedures as of December 31, 2010. As defined in Rule 13a-15(e) under the Securities Exchange Act of 1934, as amended (the "Exchange Act"), disclosure controls and procedures are controls and procedures designed to reasonably assure that information required to be disclosed in our reports filed or submitted under the Exchange Act are recorded, processed, summarized and reported on a timely basis. Disclosure controls are
83
also designed to reasonably assure that such information is accumulated and communicated to our management, including the Chief Executive Officer and Chief Financial Officer, as appropriate, to allow timely decisions regarding required disclosure. Based upon their evaluation, our Chief Executive Officer and Chief Financial Officer concluded that the Company's disclosure controls were effective as of December 31, 2010, the period covered by this report.
Management's Annual Report on Internal Control over Financial Reporting
Management of the Company is responsible for establishing and maintaining adequate internal control over financial reporting. As defined in Rule 13a-15(f) under the Exchange Act, internal control over financial reporting is a process designed by, or under the supervision of, a company's principal executive and principal financial officers and effected by a company's board of directors, management and other personnel, to provide reasonable assurance regarding the reliability of financial reporting and the preparation of financial statements for external purposes in accordance with generally accepted accounting principles. It includes those policies and procedures that:
- •
- Pertain to the maintenance of records that in reasonable detail accurately and fairly reflect the transactions and
dispositions of the assets of a company;
- •
- Provide reasonable assurance that transactions are recorded as necessary to permit preparation of financial statements in
accordance with generally accepted accounting principles, and that receipts and expenditures of a company are being made only in accordance with authorizations of management and the board of directors
of the company; and
- •
- Provide reasonable assurance regarding prevention or timely detection of unauthorized acquisition, use or disposition of a company's assets that could have a material effect on its financial statements.
Because of the inherent limitations, internal control over financial reporting may not prevent or detect misstatements. Also, projections of any evaluation of effectiveness to future periods are subject to the risk that controls may become inadequate because of changes in conditions, or that the degree of compliance with the policies or procedures may deteriorate.
The Company's management has used the criteria established in Internal Control — Integrated Framework issued by the Committee of Sponsoring Organizations of the Treadway Commission ("COSO") to evaluate the effectiveness of the Company's internal control over financial reporting. Management has selected the COSO framework for its evaluation as it is a control framework recognized by the SEC and the Public Company Accounting Oversight Board, that is free from bias, permits reasonably consistent qualitative and quantitative measurement of the Company's internal controls, is sufficiently complete so that relevant controls are not omitted and is relevant to an evaluation of internal controls over financial reporting.
Based on our assessment, management has concluded that our internal control over financial reporting, based on criteria established in Internal Control — Integrated Framework issued by COSO was effective as of December 31, 2010.
The independent registered public accounting firm of Crowe Horwath LLP, as auditors of our consolidated financial statements, has issued an attestation report on the effectiveness of management's internal control over financial reporting based on criteria established in "Internal Control — Integrated Framework," issued by COSO.
Inherent Limitations on Effectiveness of Controls
The Company's management, including the Chief Executive Officer and Chief Financial Officer, does not expect that our disclosure controls or our internal control over financial reporting will prevent or detect all errors and fraud. A control system, no matter how well designed and operated, can provide only
84
reasonable, not absolute, assurance that the control system's objectives will be met. The design of a control system must reflect the fact that there are resource constraints, and the benefits of controls must be considered relative to their costs. Further, because of the inherent limitations in all control systems, no evaluation of controls can provide absolute assurance that misstatements due to error or fraud will not occur or that all control issues and instances of fraud, if any, within the Company have been detected. These inherent limitations include the realities that judgments in decision-making can be faulty and that breakdowns can occur because of simple error or mistake. Controls can also be circumvented by the individual acts of some persons, by collusion of two or more people, or by management override of the controls. The design of any system of controls is based in part on certain assumptions about the likelihood of future events, and there can be no assurance that any design will succeed in achieving its stated goals under all potential future conditions. Projections of any evaluation of controls effectiveness to future periods are subject to risks. Over time, controls may become inadequate because of changes in conditions or deterioration in the degree of compliance with policies or procedures.
Changes in Internal Control over Financial Reporting
There was no change in our internal control over financial reporting that occurred during the quarter ended December 31, 2010 that has materially affected or is reasonably likely to materially affect our internal control over financial reporting.
None.
ITEM 10 — DIRECTORS, EXECUTIVE OFFICERS AND CORPORATE GOVERNANCE
Information required by this item will be contained in our Definitive Proxy Statement for our 2011 Annual Meeting of Shareholders to be filed pursuant to Regulation 14A with the Securities and Exchange Commission within 120 days of December 31, 2010. Such Information is incorporated herein by reference.
We have adopted a code of ethics that applies to our Chief Executive Officer, Chief Financial Officer, and to our other principal financial officers. The code of ethics is available at the Governance Documents section of our website at www.heritagecommercecorp.com. We intend to disclose future amendments to, or waivers from, certain provisions of our code of ethics on the above website within four business days following the date of such amendment or waiver.
ITEM 11 — EXECUTIVE COMPENSATION
Information required by this item will be contained in our Definitive Proxy Statement for our 2011 Annual Meeting of Shareholders to be filed pursuant to Regulation 14A with the Securities and Exchange Commission within 120 days of December 31, 2010. Such information is incorporated herein by reference.
ITEM 12 — SECURITY OWNERSHIP OF CERTAIN BENEFICIAL OWNERS AND MANAGEMENT AND RELATED STOCKHOLDER MATTERS
Information required by this item will be contained in our Definitive Proxy Statement for our 2011 Annual Meeting of Shareholders to be filed pursuant to Regulation 14A with the Securities and Exchange Commission within 120 days of December 31, 2010. Such information is incorporated herein by reference.
85
ITEM 13 — CERTAIN RELATIONSHIPS AND RELATED TRANSACTIONS AND DIRECTOR INDEPENDENCE
Information required by this item will be contained in our Definitive Proxy Statement for our 2011 Annual Meeting of Shareholders to be filed pursuant to Regulation 14A with the Securities and Exchange Commission within 120 days of December 31, 2010. Such information is incorporated herein by reference.
ITEM 14 — PRINCIPAL ACCOUNTANT FEES AND SERVICES
Information required by this item will be contained in our Definitive Proxy Statement for our 2011 Annual Meeting of Shareholders to be filed pursuant to Regulation 14A with the Securities and Exchange Commission within 120 days of December 31, 2010. Such information is incorporated herein by reference.
ITEM 15 — EXHIBITS AND FINANCIAL STATEMENT SCHEDULES
(a)(1) FINANCIAL STATEMENTS
The Financial Statements of the Company and the Report of Independent Registered Public Accounting Firm are set forth on pages 89 through 139.
(a)(2) FINANCIAL STATEMENT SCHEDULES
All schedules to the Financial Statements are omitted because of the absence of the conditions under which they are required or because the required information is included in the Financial Statements or accompanying notes.
(a)(3) EXHIBITS
The exhibit list required by this Item is incorporated by reference to the Exhibit Index included in this report.
86
Pursuant to the requirements of Section 13 or 15(d) of the Securities Exchange Act of 1934, the Company has duly caused this report on Form 10-K to be signed on its behalf by the undersigned thereunto duly authorized.
| HERITAGE COMMERCE CORP | ||||
DATE: March 4, 2011 |
BY: |
/s/ WALTER T. KACZMAREK Walter T. Kaczmarek Chief Executive Officer |
||
Pursuant to the requirements of Section 13 of the Securities Exchange Act of 1934, the registrant has duly caused this report to be signed below by the following persons on behalf of the registrant and in the capacities and on the date indicated:
Signature
|
Title
|
Date
|
||
|---|---|---|---|---|
| /s/ FRANK G. BISCEGLIA Frank G. Bisceglia |
Director | March 4, 2011 | ||
/s/ JACK W. CONNER Jack W. Conner |
Director and Chairman of the Board |
March 4, 2011 |
||
/s/ JOHN M. EGGEMEYER III John M. Eggemeyer III |
Director |
March 4, 2011 |
||
/s/ CELESTE V. FORD Celeste V. Ford |
Director |
March 4, 2011 |
||
/s/ WALTER T. KACZMAREK Walter T. Kaczmarek |
Director and Chief Executive Officer and President (Principle Executive Officer) |
March 4, 2011 |
||
/s/ MARK E. LEFANOWICZ Mark E. Lefanowicz |
Director |
March 4, 2011 |
||
/s/ LAWRENCE D. MCGOVERN Lawrence D. McGovern |
Executive Vice President and Chief Financial Officer (Principal Financial and Accounting Officer) |
March 4, 2011 |
||
Robert T. Moles |
Director |
|||
/s/ HUMPHREY P. POLANEN Humphrey P. Polanen |
Director |
March 4, 2011 |
||
/s/ CHARLES T. TOENISKOETTER Charles T. Toeniskoetter |
Director |
March 4, 2011 |
||
Ranson W. Webster |
Director |
|||
/s/ W. KIRK WYCOFF W. Kirk Wycoff |
Director |
March 4, 2011 |
87
HERITAGE COMMERCE CORP
INDEX TO FINANCIAL STATEMENTS
DECEMBER 31, 2010
88
REPORT OF INDEPENDENT REGISTERED PUBLIC ACCOUNTING FIRM
Board
of Directors
Heritage Commerce Corp
San Jose, California
We have audited the accompanying consolidated balance sheets of Heritage Commerce Corp (the "Company") as of December 31, 2010 and 2009, and the related consolidated statements of operations, changes in shareholders' equity and cash flows for each of the years in the three-year period ended December 31, 2010. We also have audited Heritage Commerce Corp's internal control over financial reporting as of December 31, 2010, based on criteria established in Internal Control — Integrated Framework issued by the Committee of Sponsoring Organizations of the Treadway Commission (COSO). Heritage Commerce Corp's management is responsible for these financial statements, for maintaining effective internal control over financial reporting, and for its assessment of the effectiveness of internal control over financial reporting included in the accompanying Management's Annual Report on Internal Control over Financial Reporting included in Item 9A in Form 10-K. Our responsibility is to express an opinion on these financial statements and an opinion on the Company's internal control over financial reporting based on our audits.
We conducted our audits in accordance with the standards of the Public Company Accounting Oversight Board (United States). Those standards require that we plan and perform the audits to obtain reasonable assurance about whether the financial statements are free of material misstatement and whether effective internal control over financial reporting was maintained in all material respects. Our audits of the financial statements included examining, on a test basis, evidence supporting the amounts and disclosures in the financial statements, assessing the accounting principles used and significant estimates made by management, and evaluating the overall financial statement presentation. Our audit of internal control over financial reporting included obtaining an understanding of internal control over financial reporting, assessing the risk that a material weakness exists, and testing and evaluating the design and operating effectiveness of internal control based on the assessed risk. Our audits also included performing such other procedures as we considered necessary in the circumstances. We believe that our audits provide a reasonable basis for our opinions.
A company's internal control over financial reporting is a process designed to provide reasonable assurance regarding the reliability of financial reporting and the preparation of financial statements for external purposes in accordance with generally accepted accounting principles. A company's internal control over financial reporting includes those policies and procedures that (1) pertain to the maintenance of records that, in reasonable detail, accurately and fairly reflect the transactions and dispositions of the assets of the company; (2) provide reasonable assurance that transactions are recorded as necessary to permit preparation of financial statements in accordance with generally accepted accounting principles, and that receipts and expenditures of the company are being made only in accordance with authorizations of management and directors of the company; and (3) provide reasonable assurance regarding prevention or timely detection of unauthorized acquisition, use, or disposition of the company's assets that could have a material effect on the financial statements.
Because of its inherent limitations, internal control over financial reporting may not prevent or detect misstatements. Also, projections of any evaluation of effectiveness to future periods are subject to the risk that controls may become inadequate because of changes in conditions, or that the degree of compliance with the policies or procedures may deteriorate.
89
In our opinion, the consolidated financial statements referred to above present fairly, in all material respects, the financial position of Heritage Commerce Corp as of December 31, 2010 and 2009, and the results of its operations and its cash flows for each of the years in the three-year period ended December 31, 2010 in conformity with accounting principles generally accepted in the United States of America. Also in our opinion, Heritage Commerce Corp maintained, in all material respects, effective internal control over financial reporting as of December 31, 2010, based on criteria established in Internal Control — Integrated Framework issued by the Committee of Sponsoring Organizations of the Treadway Commission (COSO).
/s/ Crowe Horwath LLP
Costa
Mesa, California
March 4, 2011
90
HERITAGE COMMERCE CORP
CONSOLIDATED BALANCE SHEETS
| |
December 31, 2010 | December 31, 2009 | ||||||||
|---|---|---|---|---|---|---|---|---|---|---|
| |
(Dollars in thousands, except per share data) |
|||||||||
ASSETS |
||||||||||
Cash and due from banks |
$ | 71,842 | $ | 45,372 | ||||||
Federal funds sold |
— | 100 | ||||||||
Interest-bearing deposits in other financial institutions |
335 | 90 | ||||||||
Total cash and cash equivalents |
72,177 | 45,562 | ||||||||
Securities available-for-sale, at fair value |
232,165 | 109,966 | ||||||||
Loans held-for-sale — SBA, at lower of cost or market, including deferred costs |
8,750 | 10,742 | ||||||||
Loans held-for-sale — other, at lower of cost or market, including deferred costs |
2,260 | — | ||||||||
Loans, including deferred costs |
846,049 | 1,070,113 | ||||||||
Allowance for loan losses |
(25,204 | ) | (28,768 | ) | ||||||
Loans, net |
820,845 | 1,041,345 | ||||||||
Federal Home Loan Bank and Federal Reserve Bank stock, at cost |
9,174 | 8,454 | ||||||||
Company owned life insurance |
43,682 | 42,313 | ||||||||
Premises and equipment, net |
8,397 | 9,006 | ||||||||
Goodwill |
— | 43,181 | ||||||||
Intangible assets |
3,014 | 3,589 | ||||||||
Accrued interest receivable and other assets |
45,905 | 49,712 | ||||||||
Total assets |
$ | 1,246,369 | $ | 1,363,870 | ||||||
LIABILITIES AND SHAREHOLDERS' EQUITY |
||||||||||
Liabilities: |
||||||||||
Deposits: |
||||||||||
Demand, noninterest-bearing |
$ | 280,258 | $ | 260,840 | ||||||
Demand, interest-bearing |
153,917 | 146,828 | ||||||||
Savings and money market |
272,399 | 295,404 | ||||||||
Time deposits-under $100 |
33,499 | 40,197 | ||||||||
Time deposits-$100 and over |
137,514 | 129,831 | ||||||||
Time deposits-CDARS |
17,864 | 38,154 | ||||||||
Time deposits-brokered |
98,467 | 178,031 | ||||||||
Total deposits |
993,918 | 1,089,285 | ||||||||
Securities sold under agreement to repurchase |
5,000 | 25,000 | ||||||||
Subordinated debt |
23,702 | 23,702 | ||||||||
Short-term borrowings |
2,445 | 20,000 | ||||||||
Accrued interest payable and other liabilities |
39,152 | 33,578 | ||||||||
Total liabilities |
1,064,217 | 1,191,565 | ||||||||
Commitments and contingencies (Note 14) |
||||||||||
Shareholders' equity: |
||||||||||
Preferred stock, no par value; 10,000,000 shares authorized |
||||||||||
Series A fixed rate cumulative preferred stock, 40,000 shares issued and outstanding (liquidation preference of $42,810 at December 31, 2010 and $40,783 at December 31, 2009) |
39,846 | 39,846 | ||||||||
Discount on Series A preferred stock |
(1,227 | ) | (1,598 | ) | ||||||
Series C convertible perpetual preferred stock, 21,004 shares issued and outstanding at December 31, 2010 and none at December 31, 2009 (liquidation preference of $21,004 at December 31, 2010) |
19,519 | — | ||||||||
Common stock, no par value; 60,000,000 shares authorized; 26,233,001 shares issued and outstanding at December 31, 2010 and 11,820,509 shares issued and outstanding at December 31, 2009 |
130,531 | 80,222 | ||||||||
Retained earnings / (Accumulated deficit) |
(1,866 | ) | 56,389 | |||||||
Accumulated other comprehensive loss |
(4,651 | ) | (2,554 | ) | ||||||
Total shareholders' equity |
182,152 | 172,305 | ||||||||
Total liabilities and shareholders' equity |
$ | 1,246,369 | $ | 1,363,870 | ||||||
See notes to consolidated financial statements
91
HERITAGE COMMERCE CORP
CONSOLIDATED STATEMENTS OF OPERATIONS
| |
Years Ended December 31, | ||||||||||||
|---|---|---|---|---|---|---|---|---|---|---|---|---|---|
| |
2010 | 2009 | 2008 | ||||||||||
| |
(Dollars in thousands, except per share data) |
||||||||||||
Interest income: |
|||||||||||||
Loans, including fees |
$ | 49,633 | $ | 58,602 | $ | 70,488 | |||||||
Securities, taxable |
5,236 | 3,619 | 5,321 | ||||||||||
Securities, non-taxable |
— | 9 | 74 | ||||||||||
Interest-bearing deposits in other financial institutions |
218 | 63 | 74 | ||||||||||
Total interest income |
55,087 | 62,293 | 75,957 | ||||||||||
Interest expense: |
|||||||||||||
Deposits |
8,086 | 13,462 | 20,035 | ||||||||||
Subordinated debt |
1,878 | 1,933 | 2,148 | ||||||||||
Repurchase agreements |
418 | 787 | 937 | ||||||||||
Short-term borrowings |
130 | 62 | 1,032 | ||||||||||
Note payable |
— | 82 | 292 | ||||||||||
Total interest expense |
10,512 | 16,326 | 24,444 | ||||||||||
Net interest income before provision for loan losses |
44,575 | 45,967 | 51,513 | ||||||||||
Provision for loan losses |
26,804 | 33,928 | 15,537 | ||||||||||
Net interest income after provision for loan losses |
17,771 | 12,039 | 35,976 | ||||||||||
Noninterest income: |
|||||||||||||
Service charges and fees on deposit accounts |
2,228 | 2,221 | 2,007 | ||||||||||
Gain on sales of securities |
1,955 | 231 | — | ||||||||||
Servicing income |
1,719 | 1,587 | 1,790 | ||||||||||
Increase in cash surrender value of life insurance |
1,677 | 1,664 | 1,645 | ||||||||||
Gain on sales of SBA loans |
1,058 | 1,306 | — | ||||||||||
Loss on sales of other loans |
(887 | ) | — | — | |||||||||
Other |
983 | 1,018 | 1,349 | ||||||||||
Total noninterest income |
8,733 | 8,027 | 6,791 | ||||||||||
Noninterest expense: |
|||||||||||||
Salaries and employee benefits |
21,234 | 22,927 | 22,624 | ||||||||||
Occupancy and equipment |
4,087 | 3,937 | 4,623 | ||||||||||
FDIC deposit insurance premiums |
4,002 | 3,321 | 766 | ||||||||||
Professional fees |
3,975 | 3,851 | 2,954 | ||||||||||
Writedown of loans held-for-sale |
1,080 | — | — | ||||||||||
Insurance expense |
1,007 | 639 | 535 | ||||||||||
Software subscription |
1,004 | 865 | 940 | ||||||||||
Data processing |
831 | 912 | 1,021 | ||||||||||
Low income housing investment losses |
795 | 922 | 865 | ||||||||||
Other real estate expense |
650 | 518 | 238 | ||||||||||
Advertising and promotion |
395 | 406 | 882 | ||||||||||
Impairment of goodwill |
43,181 | — | — | ||||||||||
Other |
5,886 | 6,462 | 6,944 | ||||||||||
Total noninterest expense |
88,127 | 44,760 | 42,392 | ||||||||||
Income (loss) before income tax (benefit) |
(61,623 | ) | (24,694 | ) | 375 | ||||||||
Income tax (benefit) |
(5,766 | ) | (12,709 | ) | (1,387 | ) | |||||||
Net income (loss) |
(55,857 | ) | (11,985 | ) | 1,762 | ||||||||
Dividends and discount accretion on preferred stock |
(2,398 | ) | (2,376 | ) | (255 | ) | |||||||
Net (loss) income allocable to common shareholders |
$ | (58,255 | ) | $ | (14,361 | ) | $ | 1,507 | |||||
Earnings (loss) per common share: |
|||||||||||||
Basic |
$ | (3.64 | ) | $ | (1.21 | ) | $ | 0.13 | |||||
Diluted |
$ | (3.64 | ) | $ | (1.21 | ) | $ | 0.13 | |||||
See notes to consolidated financial statements
92
HERITAGE COMMERCE CORP
CONSOLIDATED STATEMENTS OF CHANGES IN SHAREHOLDERS' EQUITY
| |
Years Ended December 31, 2010, 2009, and 2008 | |||||||||||||||||||||||||||||
|---|---|---|---|---|---|---|---|---|---|---|---|---|---|---|---|---|---|---|---|---|---|---|---|---|---|---|---|---|---|---|
| |
|
|
Common Stock | |
|
|
|
|
||||||||||||||||||||||
| |
Preferred Stock | |
|
|
Accumulated Other Comprehensive Loss |
|
|
|||||||||||||||||||||||
| |
|
|
Retained Earnings |
Total Shareholders' Equity |
Comprehensive Income (Loss) |
|||||||||||||||||||||||||
| |
Shares | Amount | Discount | Shares | Amount | |||||||||||||||||||||||||
| |
(Dollars in thousands, except share data) |
|||||||||||||||||||||||||||||
Balance, January 1, 2008 |
— | $ | — | $ | — | 12,774,926 | $ | 92,414 | $ | 73,298 | $ | (888 | ) | $ | 164,824 | |||||||||||||||
Cumulative effect adjustment upon adoption of split dollar life insurance accounting guidance, net of deferred income taxes |
— | — | — | — | — | — | (3,182 | ) | (3,182 | ) | ||||||||||||||||||||
Net income |
— | — | — | — | — | 1,762 | — | 1,762 | $ | 1,762 | ||||||||||||||||||||
Net change in unrealized gain/loss on securities available-for-sale and interest-only strips, net of reclassification adjustment and deferred income taxes |
— | — | — | — | — | — | 1,532 | 1,532 | 1,532 | |||||||||||||||||||||
Net change in pension liability, net of deferred income taxes |
— | — | — | — | — | — | (935 | ) | (935 | ) | (935 | ) | ||||||||||||||||||
Total comprehensive income |
$ | 2,359 | ||||||||||||||||||||||||||||
Amortization of restricted stock award, net of forfeitures and taxes |
— | — | — | — | 155 | — | — | 155 | ||||||||||||||||||||||
Issuance of 40,000 preferred shares and a warrant to purchase 462,963 common shares, net of issuance costs of $154 |
40,000 | 39,846 | (1,979 | ) | — | 1,979 | — | — | 39,846 | |||||||||||||||||||||
Cash dividends accrued on preferred stock |
— | — | — | — | — | (222 | ) | — | (222 | ) | ||||||||||||||||||||
Accretion of discount on preferred stock |
— | — | 33 | — | — | (33 | ) | — | — | |||||||||||||||||||||
Cash dividend declared on common stock, $0.32 per share |
— | — | — | — | — | (3,819 | ) | — | (3,819 | ) | ||||||||||||||||||||
Common stock repurchased |
— | — | — | (1,007,749 | ) | (17,655 | ) | — | — | (17,655 | ) | |||||||||||||||||||
Stock option expense, net of forfeitures and taxes |
— | — | — | — | 1,381 | — | — | 1,381 | ||||||||||||||||||||||
Stock options exercised, including related tax benefits |
— | — | — | 53,332 | 580 | — | — | 580 | ||||||||||||||||||||||
Balance, December 31, 2008 |
40,000 | 39,846 | (1,946 | ) | 11,820,509 | 78,854 | 70,986 | (3,473 | ) | 184,267 | ||||||||||||||||||||
Net loss |
— | — | — | — | (11,985 | ) | (11,985 | ) | $ | (11,985 | ) | |||||||||||||||||||
Net change in unrealized gain/loss on securities available-for-sale and interest-only strips, net of reclassification adjustment and deferred income taxes |
— | — | — | — | — | — | 159 | 159 | 159 | |||||||||||||||||||||
Net change in pension and other postretirement obligations, net of deferred income taxes |
760 | 760 | 760 | |||||||||||||||||||||||||||
Total comprehensive loss |
$ | (11,066 | ) | |||||||||||||||||||||||||||
Amortization of restricted stock award, net of forfeitures and taxes |
— | — | — | — | 84 | — | — | 84 | ||||||||||||||||||||||
Cash dividends accrued on Series A preferred stock |
— | — | — | — | — | (2,028 | ) | — | (2,028 | ) | ||||||||||||||||||||
Accretion of discount on Series A preferred stock |
— | — | 348 | — | — | (348 | ) | — | — | |||||||||||||||||||||
Cash dividend declared on common stock, $0.02 per share |
— | — | — | — | — | (236 | ) | — | (236 | ) | ||||||||||||||||||||
Stock option expense, net of forfeitures and taxes |
— | — | — | — | 1,284 | — | — | 1,284 | ||||||||||||||||||||||
Balance, December 31, 2009 |
40,000 | $ | 39,846 | $ | (1,598 | ) | 11,820,509 | $ | 80,222 | $ | 56,389 | $ | (2,554 | ) | $ | 172,305 | ||||||||||||||
93
HERITAGE COMMERCE CORP
CONSOLIDATED STATEMENTS OF CHANGES IN SHAREHOLDERS' EQUITY (Continued)
| |
Years Ended December 31, 2010, 2009, and 2008 | |||||||||||||||||||||||||||||
|---|---|---|---|---|---|---|---|---|---|---|---|---|---|---|---|---|---|---|---|---|---|---|---|---|---|---|---|---|---|---|
| |
|
|
Common Stock | |
|
|
|
|
||||||||||||||||||||||
| |
Preferred Stock | |
|
|
Accumulated Other Comprehensive Loss |
|
|
|||||||||||||||||||||||
| |
|
|
Retained Earnings |
Total Shareholders' Equity |
Comprehensive Income (Loss) |
|||||||||||||||||||||||||
| |
Shares | Amount | Discount | Shares | Amount | |||||||||||||||||||||||||
| |
(Dollars in thousands, except share data) |
|||||||||||||||||||||||||||||
Balance, December 31, 2009 |
40,000 | $ | 39,846 | $ | (1,598 | ) | 11,820,509 | $ | 80,222 | $ | 56,389 | $ | (2,554 | ) | $ | 172,305 | ||||||||||||||
Net loss |
— | — | — | — | (55,857 | ) | (55,857 | ) | $ | (55,857 | ) | |||||||||||||||||||
Net change in unrealized gain/loss on securities available-for-sale and interest-only strips, net of reclassification adjustment and deferred income taxes |
— | — | — | — | — | — | (2,340 | ) | (2,340 | ) | (2,340 | ) | ||||||||||||||||||
Net change in pension and other postretirement obligations, net of deferred income taxes |
243 | 243 | 243 | |||||||||||||||||||||||||||
Total comprehensive loss |
— | — | — | — | — | — | $ | (57,954 | ) | |||||||||||||||||||||
Issuance of Series B manditorily convertible cumulative perpetual preferred stock, net of issuance costs |
53,996 | 50,179 | — | — | — | — | — | 50,179 | ||||||||||||||||||||||
Conversion of Series B manditorily convertible cumulative perpetual preferred stock into common stock |
(53,996 | ) | (50,179 | ) | — | 14,398,992 | 50,179 | — | — | — | ||||||||||||||||||||
Issuance of Series C convertible perpetual preferred stock, net of issuance costs |
21,004 | 19,519 | — | — | — | 19,519 | ||||||||||||||||||||||||
Issuance of restricted stock awards |
— | — | 13,500 | — | — | — | — | |||||||||||||||||||||||
Amortization of restricted stock awards, net of forfeitures and taxes |
— | — | — | — | 89 | — | 89 | |||||||||||||||||||||||
Cash dividends accrued on Series A preferred stock |
— | — | — | — | — | (2,027 | ) | — | (2,027 | ) | ||||||||||||||||||||
Accretion of discount on Series A preferred stock |
— | — | 371 | — | — | (371 | ) | — | — | |||||||||||||||||||||
Stock option expense, net of forfeitures and taxes |
— | — | — | — | 41 | — | — | 41 | ||||||||||||||||||||||
Balance, December 31, 2010 |
61,004 | $ | 59,365 | $ | (1,227 | ) | 26,233,001 | $ | 130,531 | $ | (1,866 | ) | $ | (4,651 | ) | $ | 182,152 | |||||||||||||
See notes to consolidated financial statements
94
HERITAGE COMMERCE CORP
CONSOLIDATED STATEMENTS OF CASH FLOWS
| |
Years ended December 31, | |||||||||||
|---|---|---|---|---|---|---|---|---|---|---|---|---|
| |
2010 | 2009 | 2008 | |||||||||
| |
(Dollars in thousands) |
|||||||||||
CASH FLOWS FROM OPERATING ACTIVITIES: |
||||||||||||
Net income (loss) |
$ | (55,857 | ) | $ | (11,985 | ) | $ | 1,762 | ||||
Adjustments to reconcile net income (loss) to net cash provided by operating activities: |
||||||||||||
Amortization (accretion) of discounts and premiums on securities |
(1,557 | ) | (259 | ) | 245 | |||||||
Gain on sale of securities available-for-sale |
(1,955 | ) | (231 | ) | — | |||||||
Gain on sale of SBA loans |
(1,058 | ) | (1,306 | ) | — | |||||||
Proceeds from sale of SBA loans originated for sale |
19,824 | 12,023 | — | |||||||||
Net change in SBA loans originated for sale |
(21,599 | ) | (20,630 | ) | — | |||||||
Loss on sale of other loans |
887 | — | — | |||||||||
Writedowns on other loans held-for-sale |
1,080 | — | — | |||||||||
Provision for loan losses |
26,804 | 33,928 | 15,537 | |||||||||
Federal Home Loan bank and Federal Reserve Bank stock dividends |
— | (10 | ) | (211 | ) | |||||||
Increase in cash surrender value of life insurance |
(1,677 | ) | (1,664 | ) | (1,645 | ) | ||||||
Depreciation and amortization |
799 | 807 | 1,022 | |||||||||
Goodwill impairment |
43,181 | — | — | |||||||||
Amortization of other intangible assets |
575 | 642 | 741 | |||||||||
Writedowns and losses on sale of foreclosed assets, net |
576 | 79 | 92 | |||||||||
Stock option expense, net |
41 | 1,284 | 1,381 | |||||||||
Amortization of restricted stock awards, net |
89 | 84 | 155 | |||||||||
Effect of changes in: |
||||||||||||
Accrued interest receivable and other assets |
4,664 | (12,866 | ) | 2,260 | ||||||||
Accrued interest payable and other liabilities |
1,064 | (1,944 | ) | (855 | ) | |||||||
Net cash provided by (used in) operating activities |
15,881 | (2,048 | ) | 20,484 | ||||||||
CASH FLOWS FROM INVESTING ACTIVITIES: |
||||||||||||
Purchase of securities available-for-sale |
(197,978 | ) | (147,590 | ) | (25,415 | ) | ||||||
Maturities/paydowns/calls of securities available-for-sale |
31,864 | 131,362 | 57,936 | |||||||||
Proceeds from sales of securities available-for-sale |
46,012 | 15,272 | — | |||||||||
Net change in SBA loans previously transferred to held-for-sale |
(358 | ) | (1,118 | ) | — | |||||||
Proceeds from sales of SBA loans previously transferred to held-for-sale |
2,816 | 20,795 | — | |||||||||
Net change in other loans transferred to held-for-sale |
1,223 | — | — | |||||||||
Proceeds from sale of other loans transferred to held-for-sale |
10,303 | — | — | |||||||||
Net change in loans |
168,390 | 121,989 | (216,012 | ) | ||||||||
Changes in Federal Home Loan Bank stock and other investments |
(720 | ) | (628 | ) | (603 | ) | ||||||
Purchase of company owned life insurance |
— | — | (361 | ) | ||||||||
Proceeds from redemption of company owned life insurance |
308 | — | — | |||||||||
Purchase of premises and equipment |
(190 | ) | (296 | ) | (1,231 | ) | ||||||
Proceeds from sale of foreclosed assets |
12,288 | 4,196 | 1,409 | |||||||||
Net cash provided by (used in) investing activities |
73,958 | 143,982 | (184,277 | ) | ||||||||
CASH FLOWS FROM FINANCING ACTIVITIES: |
||||||||||||
Net change in deposits |
(95,367 | ) | (64,765 | ) | 89,824 | |||||||
Net change in securities sold under agreement to repurchase |
(20,000 | ) | (10,000 | ) | 24,100 | |||||||
Net change in note payable |
— | (15,000 | ) | 15,000 | ||||||||
Net change in short-term borrowings |
(17,555 | ) | (35,000 | ) | (5,000 | ) | ||||||
Issuance of preferred stock, net of offering costs |
69,698 | — | 39,846 | |||||||||
Payment of cash dividends — preferred stock |
— | (1,467 | ) | — | ||||||||
Exercise of stock options |
— | — | 580 | |||||||||
Common stock repurchased |
— | — | (17,655 | ) | ||||||||
Payment of cash dividends — common stock |
— | (236 | ) | (3,819 | ) | |||||||
Other financing activities |
— | — | 1,920 | |||||||||
Net cash provided by (used in) financing activities |
(63,224 | ) | (126,468 | ) | 144,796 | |||||||
Net increase (decrease) in cash and cash equivalents |
26,615 | 15,466 | (18,997 | ) | ||||||||
Cash and cash equivalents, beginning of year |
45,562 | 30,096 | 49,093 | |||||||||
Cash and cash equivalents, end of year |
$ | 72,177 | $ | 45,562 | $ | 30,096 | ||||||
Supplemental disclosures of cash flow information: |
||||||||||||
Interest paid |
$ | 8,896 | $ | 19,030 | $ | 24,778 | ||||||
Income taxes paid (refund) |
(6,357 | ) | 605 | 1,199 | ||||||||
Supplemental schedule of non-cash activity: |
||||||||||||
Due to broker for securities purchased, settling after year-end |
$ | 2,902 | $ | 4,065 | $ | — | ||||||
Transfer of loans held-for-sale to loan portfolio |
2,367 | — | — | |||||||||
Transfer of portfolio loans to loans held-for-sale |
17,079 | 20,506 | — | |||||||||
Loans transferred to foreclosed assets |
11,919 | 5,856 | 1,098 | |||||||||
Conversion of Series B preferred stock to common stock |
50,179 | — | — | |||||||||
Cash dividends accrued on Series A preferred stock |
2,027 | 783 | — | |||||||||
See notes to consolidated financial statements
95
HERITAGE COMMERCE CORP
NOTES TO CONSOLIDATED FINANCIAL STATEMENTS
(1) Summary of Significant Accounting Policies
Description of Business and Basis of Presentation
Heritage Commerce Corp ("HCC") operates as a registered bank holding company for its wholly-owned subsidiary Heritage Bank of Commerce ("HBC" or the "Bank"), collectively referred to as the "Company". HBC was incorporated on November 23, 1993 and commenced operations on June 8, 1994. HBC is a California state chartered bank which offers a full range of commercial and personal banking services to residents and the business/professional community in Santa Clara, Alameda, and Contra Costa counties, California. The Company acquired Diablo Valley Bank on June 20, 2007 and merged Diablo Valley Bank into HBC.
The consolidated financial statements are prepared in accordance with accounting policies generally accepted in the United States of America and general practices in the banking industry. The financial statements include the accounts of the Company. All inter-company accounts and transactions have been eliminated in consolidation.
The Company also has four wholly-owned Delaware business trusts that were formed to issue trust preferred and related common securities: Heritage Capital Trust I and Heritage Statutory Trust I, formed in 2000, Heritage Statutory Trust II, formed in 2001, and Heritage Statutory Trust III, formed in 2002 ("Trusts").
All of the common securities of the Trusts totaling $702,000 are owned by the Company and included in other assets on the consolidated balance sheets. The Trusts issued their preferred securities to investors, and used the proceeds to purchase subordinated debt issued by the Company. The subordinated debt payable to the Trusts is recorded as debt of the Company. The Company has fully and unconditionally guaranteed the trust preferred securities along with all obligations of the Trusts under the trust agreements. Interest income from the subordinated debt is the source of revenues for these Trusts. In accordance with generally accepted accounting standards, the Trusts are not consolidated in the Company's financial statements.
Use of Estimates
The preparation of financial statements in conformity with accounting principles generally accepted in the United States of America requires management to make estimates and assumptions that affect the reported amounts of assets and liabilities and disclosure of contingent assets and liabilities at the date of the financial statements and the reported amounts of revenues and expenses during the reporting period. Actual results could differ from those estimates. The allowance for loan losses, carrying value of the other real estate owned, goodwill and other intangible assets, loan servicing rights, interest-only strip receivables, defined benefit pension and other post-retirement obligations, purchase accounting adjustments, and the fair values of financial instruments are particularly subject to change.
Cash and Cash Equivalents
Cash and cash equivalents include cash on hand, amounts due from banks, amounts held at the Federal Reserve Bank, and Federal funds sold. The Company is required to maintain reserves against certain of the deposit accounts with the Federal Reserve Bank. Federal funds are generally sold and purchased for one-day periods.
96
HERITAGE COMMERCE CORP
NOTES TO CONSOLIDATED FINANCIAL STATEMENTS (Continued)
Cash Flows
Net cash flows are reported for customer loan and deposit transactions, Federal funds purchased, notes payable, repurchase agreements and other short-term borrowings.
Securities
The Company classifies its securities as either available-for-sale or held-to-maturity at the time of purchase. Securities available-for-sale are recorded at fair value with a corresponding recognition of the net unrealized holding gain or loss, net of deferred income taxes, as a net amount within accumulated other comprehensive income (loss), which is a separate component of shareholders' equity. Securities held-to-maturity are recorded at amortized cost, based on the Company's positive intent and ability to hold the securities to maturity. As of December 31, 2010 and 2009, all of the Company's securities were classified as available-for-sale.
A decline in the fair value of any available-for-sale or held-to-maturity security below amortized cost that is deemed other than temporary results in a charge to earnings and the corresponding establishment of a new cost basis for the security. In estimating other-than-temporary losses, management considers (1) the length of time and extent that fair value has been less than cost, (2) the financial condition and near-term prospects of the issuer, (3) whether the fair value decline was affected by macroeconomic conditions, and (4) whether the Company has the intention to sell the security or more likely than not will be required to sell the security before any anticipated recovery in fair value.
Interest income includes amortization of purchase premiums or discounts. Premiums and discounts are amortized, or accreted, over the life of the related security as an adjustment to income using a method that approximates the interest method. Realized gains and losses are recorded on the trade date and determined using the specific identification method for the cost of securities sold.
Federal Home Loan Bank and Federal Reserve Bank Stock
As a member of the Federal Home Loan Bank ("FHLB") system, the Bank is required to own common stock in the FHLB based on the Bank's level of borrowings and outstanding FHLB advances. FHLB stock is carried at cost, classified as a restricted security, and periodically evaluated for impairment. Both cash and stock dividends are reported as income.
As a member of the Federal Reserve Bank ("FRB") of San Francisco, the Bank is required to own stock in the FRB of San Francisco based on a specified ratio relative to our capital. FRB stock is carried at cost and may be sold back to the FRB at its carrying value. Cash dividends received are reported as income.
Loan Sales and Servicing
The Company holds for sale the guaranteed portion of certain loans guaranteed by the Small Business Administration or the U.S. Department of Agriculture (collectively referred to as "SBA loans"). These loans are carried at the lower of aggregate cost or fair value. Net unrealized losses, if any, are recorded as a valuation allowance and charged to earnings.
Gains or losses on SBA loans held-for-sale are recognized upon completion of the sale, based on the difference between the net sales proceeds and the relative fair value of the guaranteed portion of the loan sold compared to the relative fair value of the unguaranteed portion. When the Company sells SBA loans to third parties, the loans are subject to a 90 day SBA warranty. The Company adopted new accounting guidance in the first quarter of 2010 that requires the Company to treat the SBA loans sold as secured
97
HERITAGE COMMERCE CORP
NOTES TO CONSOLIDATED FINANCIAL STATEMENTS (Continued)
borrowings during the warranty period. Effective in the first quarter of 2011, the SBA removed the warranty from the sale agreement. As such, sales under the revised agreement will meet the definition of a participating interest, and gains on sales will be recognized immediately.
SBA loans are sold with servicing retained. Servicing assets recognized separately upon the sale of SBA loans consist of servicing rights and, for loans sold prior to 2009, interest-only strip receivables ("I/O strips"). The Company did not sell any SBA loans in the year ended December 31, 2008, or the first two quarters of 2009.
The Company accounts for the sale and servicing of SBA loans based on the financial and servicing assets it controls and liabilities it has incurred, reversing recognition of financial assets when control has been surrendered, and reversing recognition of liabilities when extinguished. Servicing rights are initially recorded at fair value with the income statement effect recorded in gains on sale of loans. Servicing rights are amortized in proportion to and over the period of net servicing income and are assessed for impairment on an ongoing basis. Impairment is determined by stratifying the servicing rights based on interest rates and terms. Any servicing assets in excess of the contractually specified servicing fees are reclassified at fair value as an I/O strip receivable and treated like an available for sale security. Fair value is determined using prices for similar assets with similar characteristics, when available, or based upon discounted cash flows using market-based assumptions. Impairment is recognized through a valuation allowance. The servicing rights, net of any required valuation allowance, and I/O strip receivable are included in other assets.
Servicing income, net of amortization of servicing rights, is recognized as noninterest income. The initial fair value of I/O strip receivables is amortized against interest income on loans.
Loans
Loans that management has the intent and ability to hold for the foreseeable future or until maturity or payoff are stated at the principal amount outstanding, net of deferred loan origination fees and costs and an allowance for loan losses. The majority of the Company's loans have variable interest rates. Interest on loans is accrued on the unpaid principal balance and is credited to income using the effective yield interest method.
When a loan is classified as nonaccrual, the accrual of interest is discontinued, any accrued and unpaid interest is reversed, and the amortization of deferred loan fees and costs is discontinued. Loans are classified as nonaccrual when the payment of principal or interest is 90 days past due, unless the loan is well secured and in the process of collection. Nonaccrual loans and loans past due 90 days still on accrual include both smaller balance homogeneous loans that are collectively evaluated for impairment and individually classified impaired loans. Any interest or principal payments received on nonaccrual loans are applied toward reduction of principal. Nonaccrual loans generally are not returned to performing status until the obligation is brought current, the loan has performed in accordance with the contract terms for a reasonable period of time, and the ultimate collectability of the contractual principal and interest is no longer in doubt.
Non-refundable loan fees and direct origination costs are deferred and recognized over the expected lives of the related loans using the effective yield interest method.
Allowance for Loan Losses
The allowance for loan losses is an estimate of probable incurred losses in the loan portfolio. Loans are charged-off against the allowance when management believes the uncollectibility of a loan balance is
98
HERITAGE COMMERCE CORP
NOTES TO CONSOLIDATED FINANCIAL STATEMENTS (Continued)
confirmed. Subsequent recoveries, if any, are credited to the allowance for loan losses. Management's methodology for estimating the allowance balance consists of several key elements, which include specific allowances on individual impaired loans and the formula driven allowances on pools of loans with similar risk characteristics. Allocations of the allowance may be made for specific loans, but the entire allowance is available for any loan that, in management's judgment, should be charged off.
Specific allowances are established for impaired loans. Management considers a loan to be impaired when it is probable that the Company will be unable to collect all amounts due according to the original contractual terms of the loan agreement, including scheduled interest payments. Loans for which the terms have been modified with a concession granted, and for which the borrower is experiencing financial difficulties, are considered troubled debt restructurings and classified as impaired. When a loan is considered to be impaired, the amount of impairment is measured based on the fair value of the collateral, less costs to sell, if the loan is collateral dependent, or on the present value of expected future cash flows or values that are observable in the secondary market if the loan is not collateral dependent. The amount of any impairment will be charged off against the allowance for loan losses if the amount is a confirmed loss or, alternatively, a specific allocation within the allowance will be established. Loans that are considered impaired are specifically excluded from the formula portion of the allowance for loan losses analysis.
The estimated loss factors for pools of loans that are not impaired are based on determining the probability of default and loss given default for loans within each segment of the portfolio, adjusted for significant factors that, in management's judgment, affect collectibility as of the evaluation date. The Company's historical delinquency experience and loss experience are utilized to determine the probability of default and loss given default for segments of the portfolio where the Company has experienced losses in the past. For segments of the portfolio where the Company has no significant prior loss experience, the Company uses quantifiable observable industry data to determine the probability of default and loss given default.
Loan Commitments and Related Financial Instruments
Financial instruments include off-balance sheet credit instruments, such as commitments to make loans and commercial letters of credit, issued to meet customer financing needs. The face amount for these items represents the exposure to loss, before considering customer collateral or ability to repay. Such financial instruments are recorded when they are funded.
Loss Contingencies
Loss contingencies, including claims and legal actions arising in the ordinary course of business, are recorded as liabilities when the likelihood of loss is probable and an amount or range of loss can be reasonably estimated. Management does not believe that the ultimate loss from such matters, if any, will have a material effect on the financial statements.
Other Real Estate Owned
Assets acquired through or instead of loan foreclosure are initially recorded at fair value less costs to sell when acquired, establishing a new cost basis. If fair value declines subsequent to foreclosure, a valuation allowance is recorded through expense. Operating costs after acquisition are expensed. Gains on disposition are included in noninterest income, while losses on disposition are included in noninterest expense.
The carrying value of other real estate owned was $1,296,000 and $2,241,000 at December 31, 2010 and 2009, respectively, and is included in other assets on the consolidated balance sheet.
99
HERITAGE COMMERCE CORP
NOTES TO CONSOLIDATED FINANCIAL STATEMENTS (Continued)
Company Owned Life Insurance and Other Postretirement Benefit Plan
The Company has purchased life insurance policies on certain directors and officers. Company owned life insurance is recorded at the amount that can be realized under the insurance contract at the balance sheet date, which is the cash surrender value adjusted for other charges or other amounts due that are probable at settlement. The purchased insurance is subject to split-dollar insurance agreements with the insured participants, which continues after the participant's employment and retirement.
In September 2006, final accounting guidance was established for deferred compensation and postretirement benefit aspects of endorsement split-dollar life insurance arrangements. The guidance requires that a liability be recorded over the average life expectancy when a split-dollar life insurance agreement continues after a participant's employment or retirement. The required accrued liability is based on either the post-employment benefit cost for the continuing life insurance or the future death benefit depending on the contractual terms of the underlying agreement. The Company adopted this guidance on January 1, 2008. The adoption of this guidance in 2008 resulted in a cumulative effect adjustment to retained earnings of $3,182,000, net of deferred income taxes, at January 1, 2008. In 2009, the Company determined that this adjustment should have been made to accumulated other comprehensive income and, as allowed by SEC Staff Accounting Bulletin No. 108, the Company reclassified the cumulative effect adjustment of $3,182,000 from retained earnings to accumulated other comprehensive income as of January 1, 2008. Total shareholders' equity remains unchanged due to this reclassification. The reclassification does not affect assets, liabilities, net income or loss, or cash flows for any period.
Goodwill and Intangible Assets
Goodwill resulted from the acquisition of Diablo Valley Bank and represented the excess of the purchase price over the fair value of acquired tangible assets and liabilities and identifiable intangible assets. Goodwill was assessed at least annually for impairment and any such impairment is recognized in the period identified. During the second quarter of 2010, the Company determined that the $43,181,000 of goodwill was fully impaired.
Other intangible assets consist of core deposit and customer relationship intangible assets arising from the Diablo Valley Bank acquisition. They are initially measured at fair value and then are amortized on an accelerated method over their estimated useful lives. The core deposits and customer relationship intangible assets are being amortized over ten and seven years, respectively.
Retirement Plans
Expenses for the Company's non-qualified, unfunded defined benefits plan consists of service and interest cost and amortization of gains and losses not immediately recognized. Employee 401(k) and profit sharing plan expense is the amount of matching contributions. Deferred compensation and supplemental retirement plan expense allocates the benefits over years of service.
Premises and Equipment
Land is carried at cost. Premises and equipment are stated at cost. Depreciation and amortization are computed on the straight-line basis over the lesser of the respective lease terms or estimated useful lives. The Company owns one building which is being depreciated over 40 years. Furniture, equipment, and leasehold improvements are depreciated over estimated useful lives generally ranging from five to fifteen years. The Company evaluates the recoverability of long-lived assets on an ongoing basis.
100
HERITAGE COMMERCE CORP
NOTES TO CONSOLIDATED FINANCIAL STATEMENTS (Continued)
Income Taxes
The Company files consolidated Federal and combined state income tax returns. Income tax expense is the total of the current year income tax payable or refundable and the change in deferred tax assets and liabilities. Deferred tax assets and liabilities are the expected future tax amounts for the temporary differences between carrying amounts and tax basis of assets and liabilities, computed using enacted tax rates. A valuation allowance, if needed, reduces deferred tax assets to the amount expected to be realized. For purposes of a valuation allowance, the Company evaluates all evidence currently available, both positive and negative, including existence of taxes paid in available carry-back years, forecasts of future income, cumulative losses, applicable tax planning strategies and assessments of the current and future economic and business conditions. This analysis is updated quarterly. During the second quarter of 2010, the Company established a partial valuation allowance of $3,700,000 on the net deferred tax asset. The Company's estimate did not change in the third and fourth quarters of 2010.
A tax position is recognized as a benefit only if it is "more likely than not" that the tax position would be sustained in a tax examination, with a tax examination being presumed to occur. The amount recognized is the largest amount of tax benefit that is greater than 50% likely of being realized on examination. For tax positions not meeting the "more likely than not" test, no tax benefit is recorded. The Company recognizes interest related to income tax matters as interest expense and penalties related to income tax matters as other noninterest expense.
Stock-Based Compensation
Compensation cost is recognized for stock options and restricted stock awards issued to employees, based on the fair value of these awards at the date of grant. A Black-Scholes model is utilized to estimate the fair value of stock options, while the market price of the Company's common stock at the date of grant is used for restricted stock awards. Compensation cost is recognized over the required service period, generally defined as the vesting period. For awards with graded vesting, compensation cost is recognized on a straight-line basis over the requisite service period for the entire award. Compensation cost recognized reflects estimated forfeitures, adjusted as necessary for actual forfeitures.
Comprehensive Income (Loss)
Comprehensive income (loss) consists of other comprehensive income and net income (loss). Other comprehensive income refers to gains and losses that are included in comprehensive income (loss) but are excluded from net income (loss) because they have been recorded directly in equity under the provisions of other accounting guidance. The Company's sources of other comprehensive income are unrealized gains and losses on securities available-for-sale and I/O strips, which are treated like available-for-sale securities, and the liabilities related to the Company's supplemental retirement plan and the split-dollar life insurance benefit plan. Reclassification adjustments result from gains or losses on securities that were realized and included in net income (loss) of the current period that also had been included in other comprehensive income as unrealized holding gains and losses.
Segment Reporting
HBC is an independent community business bank with ten branch offices that offer similar products to customers. No customer accounts for more than 10 percent of revenues for HBC or the Company. While the chief decision-makers monitor the revenue streams of the various products and services, operations are managed and financial performance is evaluated on a Company wide basis. Management evaluates the Company's performance as a whole and does not allocate resources based on the
101
HERITAGE COMMERCE CORP
NOTES TO CONSOLIDATED FINANCIAL STATEMENTS (Continued)
performance of different lending or transaction activities. Accordingly, the Company and its subsidiary bank all operate as one business segment.
Reclassifications
Certain items in the consolidated financial statements for the years ended December 31, 2009 and 2008 were reclassified to conform to the 2010 presentation. These reclassifications did not affect previously reported net income.
Adoption of Other New Accounting Standards
In June 2009, the FASB amended previous accounting guidance to enhance reporting about transfers of financial assets, including securitizations, and where companies have continuing exposure to the risks related to transferred financial assets. The new accounting guidance eliminates the concept of a "qualifying special-purpose entity" and changes the requirements for derecognizing financial assets. The new authoritative accounting guidance also requires additional disclosures about all continuing involvements with transferred financial assets including information about gains and losses resulting from transfers during the period. The provisions from the new accounting guidance became effective on January 1, 2010. The adoption of the new accounting guidance did not have an impact on the prior period financial statements or beginning retained earnings. The new accounting guidance had an impact on the 2010 financial statements which resulted in the deferral of approximately $194,000 of gains on sale of SBA loans as of December 31, 2010. During the quarter ended December 31, 2010, the Company sold guaranteed portions of SBA loans with a principal balance of $2,445,000 to third parties. However, these loans are subject to a 90 day SBA warranty period, which requires, under this new accounting guidance, the Company to treat these as secured borrowings during the warranty period. The warranty periods for these loans expire in the first quarter of 2011. Provided the loans remain current through the end of the warranty period, all elements necessary to record the sale and recognize the gain will have been met.
In January 2010, the FASB issued guidance requiring increased fair value disclosures. There are two components to the increased disclosure requirements set forth in the update: (1) a description of, as well as the disclosure of, the dollar amount of transfers in or out of level one or level two (2) in the reconciliation for fair value measurements using significant unobservable inputs (level 3), a reporting entity should present separately information about purchases, sales, issuances and settlements (that is, gross amounts shall be disclosed as opposed to a single net figure). Increased disclosures regarding the transfers in or out of level one and two are required for interim and annual periods beginning after December 15, 2009. The adoption of this portion of the standard did not have a material impact on the Company's financial statements. Increased disclosures regarding the level three fair value reconciliation are required for fiscal years beginning after December 15, 2010.
In July 2010, the FASB updated disclosure requirements with respect to the credit quality of financing receivables and the allowance for credit losses. According to the guidance there are two levels of detail at which credit information will presented — the portfolio segment and class levels. The portfolio segment level is defined as the level where financing receivables are aggregated in developing a Company's systematic method for calculating its allowance for credit losses. The class level is the second level at which credit information will be presented and represents the categorization of financing related receivables at a slightly less aggregated level than the portfolio segment level. Companies will now be required to provide the following disclosures as a result of this update: a rollforward of the allowance for credit losses at the portfolio segment level with the ending balances further categorized according to impairment method along with the balance reported in the related financing receivables at period end; additional disclosure of nonaccrual and impaired financing receivables by class as of period end; credit quality and past due/ aging
102
HERITAGE COMMERCE CORP
NOTES TO CONSOLIDATED FINANCIAL STATEMENTS (Continued)
information by class as of period end; information surrounding the nature and extent of loan modifications and troubled-debt restructurings and their effect on the allowance for credit losses during the period; and detail of any significant purchases or sales of financing receivables during the period. The increased period-end disclosure requirements became effective for periods ending on or after December 15, 2010, with the exception of additional disclosures surrounding trouble-debt restructurings, which were deferred in December 2010 and become effective for periods ending on or after June 15, 2011. The increased disclosures for activity within a reporting period become effective for periods beginning on or after December 15, 2010. The provisions of this update expanded the Company's current disclosures with respect to the allowance for loan losses.
(2) Securities
The amortized cost and estimated fair value of securities at year-end were as follows:
2010
|
Amortized Cost |
Gross Unrealized Gains |
Gross Unrealized Losses |
Estimated Fair Value |
||||||||||
|---|---|---|---|---|---|---|---|---|---|---|---|---|---|---|
| |
(Dollars in thousands) |
|||||||||||||
Securities available-for-sale: |
||||||||||||||
Agency Mortgage-Backed Securities |
$ | 235,099 | $ | 1,079 | $ | (4,013 | ) | $ | 232,165 | |||||
2009
|
Amortized Cost |
Gross Unrealized Gains |
Gross Unrealized Losses |
Estimated Fair Value |
|||||||||||
|---|---|---|---|---|---|---|---|---|---|---|---|---|---|---|---|
Securities available-for-sale: |
|||||||||||||||
U.S. Government Sponsored Entities |
$ | 2,000 | $ | — | $ | (27 | ) | $ | 1,973 | ||||||
Agency Mortgage-Backed Securities |
101,356 | 1,653 | (463 | ) | 102,546 | ||||||||||
Collateralized Mortgage Obligations |
5,227 | 220 | — | 5,447 | |||||||||||
Total securities available-for-sale |
$ | 108,583 | $ | 1,873 | $ | (490 | ) | $ | 109,966 | ||||||
Securities classified as U.S. Government Sponsored Entities as of December 31, 2009 were issued by the Federal National Mortgage Association ("Fannie Mae"). At December 31, 2010 and 2009, all mortgage-backed securities and collateralized mortgage obligations were issued by Fannie Mae, the Federal Home Loan Mortgage Corporation ("Freddie Mac"), or the Government National Mortgage Association ("Ginnie Mae").
At year end 2010 and 2009, there were no holdings of securities of any one issuer, other than the U.S. Government and its sponsored entities, in an amount greater than 10% of shareholders' equity.
The proceeds from sales of securities and the resulting gains and losses are listed below:
| |
2010 | 2009 | 2008 | |||||||
|---|---|---|---|---|---|---|---|---|---|---|
| |
(Dollars in thousands) |
|||||||||
Proceeds |
$ | 46,012 | $ | 15,272 | $ | — | ||||
Gross gains |
1,956 | 238 | — | |||||||
Gross losses |
(1 | ) | (7 | ) | — | |||||
103
HERITAGE COMMERCE CORP
NOTES TO CONSOLIDATED FINANCIAL STATEMENTS (Continued)
Securities with unrealized losses at year end, aggregated by investment category and length of time that individual securities have been in a continuous unrealized loss position, are as follows:
| |
Less Than 12 Months | 12 Months or More | Total | ||||||||||||||||
|---|---|---|---|---|---|---|---|---|---|---|---|---|---|---|---|---|---|---|---|
2010
|
Fair Value |
Unrealized Losses |
Fair Value |
Unrealized Losses |
Fair Value |
Unrealized Losses |
|||||||||||||
| |
(Dollars in thousands) |
||||||||||||||||||
Agency Mortgage-Backed Securities |
$ | 140,142 | (4,013 | ) | $ | — | $ | — | $ | 140,142 | $ | (4,013 | ) | ||||||
| |
Less Than 12 Months | 12 Months or More | Total | |||||||||||||||||
|---|---|---|---|---|---|---|---|---|---|---|---|---|---|---|---|---|---|---|---|---|
2009
|
Fair Value |
Unrealized Losses |
Fair Value |
Unrealized Losses |
Fair Value |
Unrealized Losses |
||||||||||||||
| |
(Dollars in thousands) |
|||||||||||||||||||
U.S. Government Sponsored Entities |
$ | 1,973 | $ | (27 | ) | $ | — | $ | — | $ | 1,973 | $ | (27 | ) | ||||||
Agency Mortgage-Backed Securities |
43,600 | (463 | ) | — | — | 43,600 | (463 | ) | ||||||||||||
Total |
$ | 45,573 | $ | (490 | ) | $ | — | $ | — | $ | 45,573 | $ | (490 | ) | ||||||
At December 31, 2010, the Company held 106 securities, of which 54 had fair values below amortized cost. No securities had been carried with an unrealized loss for over 12 months. Unrealized losses were due to higher interest rates. The issuers are of high credit quality and all principal amounts are expected to be paid when securities mature. The fair value is expected to recover as the securities approach their maturity date and/or market rates decline. The Company does not intend to sell any securities with an unrealized loss and does not believe that it is more likely than not that the Company will be required to sell a security in an unrealized loss position prior to recovery in value. The Company does not consider these securities to be other-than-temporarily impaired at December 31, 2010.
At December 31, 2009, the Company held 75 securities, of which 23 had fair values below amortized cost. No securities had been carried with an unrealized loss for over 12 months. The Company did not consider these securities to be other-than-temporarily impaired at December 31, 2009.
The amortized cost and estimated fair values of securities as of December 31, 2010, by weighted average life, are shown below. The weighted average life will differ from contractual maturities because borrowers may have the right to call or pre-pay obligations with or without call or pre-payment penalties.
| |
Available-for-sale | |||||||
|---|---|---|---|---|---|---|---|---|
| |
Amortized Cost |
Estimated Fair Value |
||||||
| |
(Dollars in thousands) |
|||||||
Due within one year |
$ | — | $ | — | ||||
Due after one through five years |
84,871 | 85,689 | ||||||
Due after five through ten years |
101,858 | 99,444 | ||||||
Due after ten years |
48,370 | 47,032 | ||||||
Total |
$ | 235,099 | $ | 232,165 | ||||
Securities with amortized cost of $42,149,000 and $55,263,000 as of December 31, 2010 and 2009 were pledged to secure repurchase agreements, public deposits and for other purposes as required or permitted by law or contract.
104
HERITAGE COMMERCE CORP
NOTES TO CONSOLIDATED FINANCIAL STATEMENTS (Continued)
(3) Loans and Loan Servicing
Loans at year-end were as follows:
| |
2010 | 2009 | |||||||
|---|---|---|---|---|---|---|---|---|---|
| |
(Dollars in thousands) |
||||||||
Loans held-for-sale: |
|||||||||
Loans held-for-sale — SBA |
$ | 8,750 | $ | 10,742 | |||||
Loans held-for-sale — other |
2,260 | — | |||||||
Total loans held-for-sale |
$ | 11,010 | $ | 10,742 | |||||
Loans held-for-investment: |
|||||||||
Commercial |
378,412 | $ | 427,177 | ||||||
Real estate: |
|||||||||
Commercial and residential |
337,457 | 400,731 | |||||||
Land and construction |
62,356 | 182,871 | |||||||
Home equity |
53,697 | 51,368 | |||||||
Consumer |
13,244 | 7,181 | |||||||
Loans |
845,166 | 1,069,328 | |||||||
Deferred loan origination costs and fees, net |
883 | 785 | |||||||
Loans, including deferred costs |
846,049 | 1,070,113 | |||||||
Allowance for loan losses |
(25,204 | ) | (28,768 | ) | |||||
Loans, net |
$ | 820,845 | $ | 1,041,345 | |||||
At December 31, 2010, included in the balance of loans held-for-sale were $2,445,000 of SBA loans that were transferred to third parties during the fourth quarter. However, because these loans are subject to an SBA warranty for a period of 90 days, the Company must treat these loans as secured borrowings during the warranty period under recent accounting guidance. The secured borrowings are classified as "short-term borrowings" on the consolidated balance sheets. The warranty period for these loans expires in the following quarter. Provided the loans remain current through the end of the warranty period all elements necessary to record the sale will have been met. The Company has deferred gains of $194,000 associated with these loans, which are included in other liabilities on the consolidated balance sheets. Effective in the first quarter of 2011, the SBA removed the warranty from the sale agreement. As such, sales under the revised agreement will meet the definition of a participating interest, and gains on sales will be recognized immediately.
During the second quarter of 2010, the Company identified $31,005,000 of problem real estate loans for sale. These loans were written down by $13,926,000 to reflect the estimated proceeds from the sale, resulting in a net balance of $17,079,000 which was transferred into the loans held-for-sale portfolio. The
105
HERITAGE COMMERCE CORP
NOTES TO CONSOLIDATED FINANCIAL STATEMENTS (Continued)
following table shows the detail of the problem loans transferred to the loans held-for-sale portfolio from June 30, 2010 to December 31, 2010:
| |
Balance Prior to Transfer |
Amount Charged-off |
June 30, 2010 Balance Transferred to Loans Held-for-Sale |
Paydowns/ Sales |
Writedowns | December 31, 2010 Balance |
|||||||||||||||
|---|---|---|---|---|---|---|---|---|---|---|---|---|---|---|---|---|---|---|---|---|---|
| |
(Dollars in thousands) |
||||||||||||||||||||
Real estate: |
|||||||||||||||||||||
Commercial and residential |
$ | 9,893 | $ | (2,781 | ) | $ | 7,112 | $ | (5,032 | ) | $ | (917 | ) | $ | 1,163 | ||||||
Land and construction |
21,112 | (11,145 | ) | 9,967 | (8,707 | ) | (163 | ) | 1,097 | ||||||||||||
Total |
$ | 31,005 | $ | (13,926 | ) | $ | 17,079 | $ | (13,739 | ) | $ | (1,080 | ) | $ | 2,260 | ||||||
Changes in the allowance for loan losses were as follows:
| |
Year ended December 31, | |||||||||
|---|---|---|---|---|---|---|---|---|---|---|
| |
2010 | 2009 | 2008 | |||||||
| |
(Dollars in thousands) |
|||||||||
Balance, beginning of year |
$ | 28,768 | $ | 25,007 | $ | 12,218 | ||||
Loans charged-off |
(32,167 | ) | (31,534 | ) | (2,806 | ) | ||||
Recoveries |
1,799 | 1,367 | 58 | |||||||
Net (charge-offs) |
(30,368 | ) | (30,167 | ) | (2,748 | ) | ||||
Provision for loan losses |
26,804 | 33,928 | 15,537 | |||||||
Balance, end of year |
$ | 25,204 | $ | 28,768 | $ | 25,007 | ||||
The following table presents the balance in the allowance for loan losses and the recorded investment in loans by portfolio and based on impairment method as of December 31, 2010:
| |
Commercial | Real Estate | Consumer | Total | ||||||||||||
|---|---|---|---|---|---|---|---|---|---|---|---|---|---|---|---|---|
| |
(Dollars in thousands) |
|||||||||||||||
Allowance for loan losses: |
||||||||||||||||
Ending allowance balance attributable to loans: |
||||||||||||||||
Individually evaluated for impairment |
$ | 3,427 | $ | 1,855 | $ | 778 | $ | 6,060 | ||||||||
Collectively evaluated for impairment |
10,525 | 8,508 | 111 | 19,144 | ||||||||||||
Total ending allowance balance |
$ | 13,952 | $ | 10,363 | $ | 889 | $ | 25,204 | ||||||||
Loans: |
||||||||||||||||
Individually evaluated for impairment |
$ | 14,374 | $ | 16,041 | $ | 898 | $ | 31,313 | ||||||||
Collectively evaluated for impairment |
364,038 | 437,469 | 12,346 | 813,853 | ||||||||||||
Total ending loan balance |
$ | 378,412 | $ | 453,510 | $ | 13,244 | $ | 845,166 | ||||||||
106
HERITAGE COMMERCE CORP
NOTES TO CONSOLIDATED FINANCIAL STATEMENTS (Continued)
Impaired loans excluding non-accrual loans held-for-sale were as follows:
| |
2010 | 2009 | ||||||
|---|---|---|---|---|---|---|---|---|
| |
(Dollars in thousands) |
|||||||
Year-end loans with no allocated allowance for loan losses |
$ | 10,985 | $ | 13,202 | ||||
Year-end loans with allocated allowance for loan losses |
20,328 | 49,173 | ||||||
Total |
$ | 31,313 | $ | 62,375 | ||||
| |
2010 | 2009 | 2008 | |||||||
|---|---|---|---|---|---|---|---|---|---|---|
| |
(Dollars in thousands) |
|||||||||
Amount of the allowance for loan losses allocated at year-end |
$ | 6,060 | $ | 9,103 | $ | 10,581 | ||||
Average of impaired loans during the year |
$ | 52,281 | $ | 59,539 | $ | 34,295 | ||||
Cash basis interest income recognized during impairment |
$ | 27 | $ | 48 | $ | 246 | ||||
Interest income during impairment |
$ | 41 | $ | 67 | $ | 554 | ||||
The following table presents loans held-for-investment individually evaluated for impairment by class of loans as of December 31, 2010. The recorded investment included in the following table represents loan principal net of any partial charge-offs recognized on the loans. The unpaid principal balance represents the recorded balance prior to any partial charge-offs.
| |
Unpaid Principal Balance |
Recorded Investment |
Allowance for Loan Losses Allocated |
||||||||||
|---|---|---|---|---|---|---|---|---|---|---|---|---|---|
| |
(Dollars in thousands) |
||||||||||||
With no related allowance recorded: |
|||||||||||||
Commercial |
$ | 5,557 | $ | 5,125 | $ | — | |||||||
Real estate: |
|||||||||||||
Commercial and residential |
4,392 | 2,431 | — | ||||||||||
Land and construction |
6,138 | 3,429 | — | ||||||||||
Total with no related allowance recorded |
16,087 | 10,985 | — | ||||||||||
With an allowance recorded: |
|||||||||||||
Commercial |
9,695 | 9,249 | 3,427 | ||||||||||
Real estate: |
|||||||||||||
Commercial and residential |
4,753 | 4,753 | 1,002 | ||||||||||
Land and construction |
6,862 | 5,428 | 853 | ||||||||||
Consumer |
898 | 898 | 778 | ||||||||||
Total with an allowance recorded |
22,208 | 20,328 | 6,060 | ||||||||||
Total |
$ | 38,295 | $ | 31,313 | $ | 6,060 | |||||||
107
HERITAGE COMMERCE CORP
NOTES TO CONSOLIDATED FINANCIAL STATEMENTS (Continued)
Nonperforming loans include both smaller dollar balance homogenous loans that are collectively evaluated for impairment and individually classified loans. Nonperforming loans were as follows at year-end:
| |
2010 | 2009 | ||||||
|---|---|---|---|---|---|---|---|---|
| |
(Dollars in thousands) |
|||||||
Nonaccrual loans — held-for-sale |
$ | 2,026 | $ | — | ||||
Nonaccrual loans — held-for-investment |
28,821 | 59,480 | ||||||
Restructured and loans past due over 90 days still on accrual |
2,492 | 2,895 | ||||||
Total |
$ | 33,339 | $ | 62,375 | ||||
The following table presents the nonperforming loans by class as of December 31, 2010:
| |
Nonaccrual | Restructured and Loans Over 90 Days Past Due and Still Accruing |
Total | ||||||||
|---|---|---|---|---|---|---|---|---|---|---|---|
| |
(Dollars in thousands) |
||||||||||
Commercial |
$ | 13,545 | $ | 829 | $ | 14,374 | |||||
Real estate: |
|||||||||||
Commercial and residential |
6,450 | 1,663 | 8,113 | ||||||||
Land and construction |
9,954 | — | 9,954 | ||||||||
Consumer |
898 | — | 898 | ||||||||
Total |
$ | 30,847 | $ | 2,492 | $ | 33,339 | |||||
Nonaccrual loans held-for-investment at December 31, 2010, included $5,432,000 related to six loans that were restructured during 2010. Three of the loans were restructured to extend amortization periods at market interest rates and required additional collateral. Nonaccrual restructured loans held-for-investment also included one loan that was bifurcated into two separate loans to provide 1) a fully secured loan for half of the outstanding balance, and 2) an unsecured loan for the other half of the outstanding balance. Principal was not reduced on the two loans and payments are interest only. These two loans have been extended once since they were restructured, and are current in accordance with their modified terms. Additionally, one nonaccrual restructured loan is not current in accordance with the terms of its forbearance agreement, and the forbearance has expired. The borrower under this loan is making monthly payments, but the payments are not sufficient to cure the loan default.
At December 31, 2010, restructured loans still on accrual included five loans totaling $2,492,000. These restructurings primarily resulted from short term principal deferments and extensions of the amortization periods. The loans are current according to their modified terms and repayment of the remaining contractual payments is expected. The Company has no commitments to lend any additional amounts to customers with outstanding loans that are classified as troubled debt restructurings.
108
HERITAGE COMMERCE CORP
NOTES TO CONSOLIDATED FINANCIAL STATEMENTS (Continued)
The following table presents the aging of past due loans as of December 31, 2010 by class of loans:
| |
30 - 59 Days Past Due |
60 - 89 Days Past Due |
90 Days or Greater Past Due |
Total Past Due |
Loans Not Past Due |
Total | ||||||||||||||
|---|---|---|---|---|---|---|---|---|---|---|---|---|---|---|---|---|---|---|---|---|
| |
(Dollars in thousands) |
|||||||||||||||||||
Commercial |
$ | 3,176 | $ | 807 | $ | 14,374 | $ | 18,357 | $ | 360,055 | $ | 378,412 | ||||||||
Real estate: |
||||||||||||||||||||
Commercial and residential |
1,078 | 1,595 | 7,184 | 9,857 | 327,600 | 337,457 | ||||||||||||||
Land and construction |
— | — | 8,857 | 8,857 | 53,499 | 62,356 | ||||||||||||||
Home equity |
80 | — | — | 80 | 53,617 | 53,697 | ||||||||||||||
Consumer |
— | — | 898 | 898 | 12,346 | 13,244 | ||||||||||||||
Total |
$ | 4,334 | $ | 2,402 | $ | 31,313 | $ | 38,049 | $ | 807,117 | $ | 845,166 | ||||||||
Credit Quality Indicators
Concentrations of credit risk arise when a number of clients are engaged in similar business activities, or activities in the same geographic region, or have similar features that would cause their ability to meet contractual obligations to be similarly affected by changes in economic conditions. The Company's loan portfolio is concentrated in commercial (primarily manufacturing, wholesale, and service) and real estate lending, with the balance in consumer loans. While no specific industry concentration is considered significant, the Company's lending operations are located in the Company's market areas that are dependent on the technology and real estate industries and their supporting companies. Thus, the Company's borrowers could be adversely impacted by a continued downturn in these sectors of the economy which could reduce the demand for loans and adversely impact the borrowers' ability to repay their loans.
The Company categorizes loans into risk categories based on relevant information about the ability of borrowers to service their debt such as: current financial information, historical payment experience, credit documentation, public information, and current economic trends, among other factors. The Company analyzes loans individually by classifying the loans as to credit risk. This analysis is performed on a quarterly basis. Nonclassified loans generally include those loans that are expected to be repaid in accordance with contractual loans terms. Classified loans are those loans that are assigned a substandard, substandard-nonaccrual, or doubtful risk rating using the following definitions:
Substandard. Loans classified as substandard are inadequately protected by the current net worth and paying capacity of the obligor or of the collateral pledged, if any. Loans so classified have a well-defined weakness or weaknesses that jeopardize the liquidation of the debt. They are characterized by the distinct possibility that the institution will sustain some loss if the deficiencies are not corrected.
Substandard-Nonaccrual. Loans classified as substandard-nonaccrual are inadequately protected by the current net worth and paying capacity of the obligor or of the collateral pledged, if any. Loans so classified have a well-defined weakness or weaknesses that jeopardize the liquidation of the debt. They are characterized by the distinct possibility that the institution will sustain some loss if the deficiencies are not corrected.
Doubtful. Loans classified as doubtful have all the weaknesses inherent in those classified as substandard, with the added characteristic that the weaknesses make collection or liquidation in full, on the basis of currently existing facts, conditions, and values, highly questionable and improbable.
109
HERITAGE COMMERCE CORP
NOTES TO CONSOLIDATED FINANCIAL STATEMENTS (Continued)
The following table provides a summary of the loan portfolio by loan type and credit quality classification at December 31, 2010:
| |
Nonclassified | Classified | Total | ||||||||
|---|---|---|---|---|---|---|---|---|---|---|---|
| |
(Dollars in thousands) |
||||||||||
Commercial |
$ | 338,164 | $ | 40,248 | $ | 378,412 | |||||
Real estate: |
|||||||||||
Commercial and residential |
320,867 | 16,590 | 337,457 | ||||||||
Land and construction |
32,664 | 29,692 | 62,356 | ||||||||
Home equity |
50,757 | 2,940 | 53,697 | ||||||||
Consumer |
12,346 | 898 | 13,244 | ||||||||
Total |
$ | 754,798 | $ | 90,368 | $ | 845,166 | |||||
HBC makes loans to executive officers, directors, and their affiliates. The following table presents the loans outstanding to these related parties:
| |
2010 | 2009 | |||||
|---|---|---|---|---|---|---|---|
| |
(Dollars in thousands) |
||||||
Balance, beginning of year |
$ | — | $ | 2 | |||
Advances on loans during the year |
— | 50 | |||||
Repayment on loans during the year |
— | (52 | ) | ||||
Balance, end of year |
$ | — | $ | — | |||
At December 31, 2010 and 2009, the Company serviced SBA loans sold to the secondary market of approximately $168,913,000, and $162,759,000.
Servicing assets represent the servicing spread generated from the sold guaranteed portions of SBA loans. The weighted average servicing rate for all loans serviced was 1.37% and 1.42% at December 31, 2010 and 2009, respectively.
Servicing rights are included in "accrued interest receivable and other assets" on the consolidated balance sheets. Activity for loan servicing rights follows:
| |
2010 | 2009 | 2008 | |||||||
|---|---|---|---|---|---|---|---|---|---|---|
| |
(Dollars in thousands) |
|||||||||
Beginning of year balance |
$ | 1,067 | $ | 1,013 | $ | 1,754 | ||||
Additions |
325 | 572 | — | |||||||
Amortization |
(477 | ) | (518 | ) | (741 | ) | ||||
End of year balance |
$ | 915 | $ | 1,067 | $ | 1,013 | ||||
There was no valuation allowance for servicing rights as of December 31, 2010 and 2009, because the fair value of the servicing rights was greater than the carrying value. The estimated fair value of loan servicing rights was $3,200,000 and $2,856,000 at December 31, 2010 and 2009. The fair value of servicing rights at December 31, 2010 was estimated using a weighted average constant prepayment rate ("CPR") assumption of 10.02%, and a weighted average discount rate assumption of 12.32%. The fair value of servicing rights at December 31, 2009 was estimated using a weighted average constant prepayment rate ("CPR") assumption of 15.8%, and a weighted average discount rate assumption of 10.7%.
110
HERITAGE COMMERCE CORP
NOTES TO CONSOLIDATED FINANCIAL STATEMENTS (Continued)
The weighted average discount rate and CPR assumptions used to estimate the fair value of the I/O strip receivables are the same as for the servicing rights. Management reviews the key economic assumptions used to estimate the fair value of I/O strip receivables on a quarterly basis. The fair value of the I/O strip can be adversely impacted by a significant increase in either the prepayment speed of the portfolio or the discount rate. At December 31, 2010, key economic assumptions and the sensitivity of the fair value of the I/O strip receivables to immediate 10% and 20% changes to the CPR assumption, and 1% and 2% changes to the discount rate assumption, are as follows:
| |
(Dollars in thousands) | |||
|---|---|---|---|---|
Carrying amount/fair value of Interest-Only (I/O) strip |
$ | 2,140 | ||
Prepayment speed assumption (annual rate) |
10.0 | % | ||
Impact on fair value of 10% adverse change in prepayment speed (CPR 11.0%) |
$ | (77 | ) | |
Impact on fair value of 20% adverse change in prepayment speed (CPR 12.0%) |
$ | (151 | ) | |
Residual cash flow discount rate assumption (annual) |
12.3 | % | ||
Impact on fair value of 1% adverse change in discount rate (13.6% discount rate) |
$ | (71 | ) | |
Impact on fair value of 2% adverse change in discount rate (14.8% discount rate) |
$ | (137 | ) | |
I/O strip receivables are included in "accrued interest receivable and other assets" on the consolidated balance sheets. Activity for I/O strip receivables follows:
| |
2010 | 2009 | 2008 | ||||||||
|---|---|---|---|---|---|---|---|---|---|---|---|
| |
(Dollars in thousands) |
||||||||||
Beginning of year balance |
$ | 2,116 | $ | 2,248 | $ | 2,332 | |||||
Additions |
— | — | — | ||||||||
Amortization |
(236 | ) | (425 | ) | (886 | ) | |||||
Unrealized gain |
260 | 293 | 802 | ||||||||
End of year balance |
$ | 2,140 | $ | 2,116 | $ | 2,248 | |||||
(4) Premises and Equipment
Premises and equipment at year-end were as follows:
| |
2010 | 2009 | ||||||
|---|---|---|---|---|---|---|---|---|
| |
(Dollars in thousands) |
|||||||
Building |
$ | 3,256 | $ | 3,256 | ||||
Land |
2,900 | 2,900 | ||||||
Furniture and equipment |
6,630 | 6,494 | ||||||
Leasehold improvements |
4,632 | 4,615 | ||||||
|
17,418 | 17,265 | ||||||
Accumulated depreciation and amortization |
(9,021 | ) | (8,259 | ) | ||||
Premises and equipment, net |
$ | 8,397 | $ | 9,006 | ||||
111
HERITAGE COMMERCE CORP
NOTES TO CONSOLIDATED FINANCIAL STATEMENTS (Continued)
Depreciation and amortization expense was $799,000, $807,000, and $1,022,000 in 2010, 2009, and 2008, respectively.
(5) Leases
Operating Leases
The Company owns one of its offices and leases the others under non-cancelable operating leases with terms, including renewal options, ranging from five to fifteen years. Future minimum payments under the agreements are as follows:
Year ending December 31,
|
(Dollars in thousands) | ||||
|---|---|---|---|---|---|
2011 |
$ | 2,604 | |||
2012 |
2,680 | ||||
2013 |
2,485 | ||||
2014 |
2,271 | ||||
2015 |
1,192 | ||||
Thereafter |
1,199 | ||||
Total |
$ | 12,431 | |||
Rent expense under operating leases was $2,727,000, $2,558,000, and $2,715,000 respectively, in 2010, 2009, and 2008.
(6) Goodwill and Intangible Assets
Goodwill
Goodwill resulted from the acquisition of Diablo Valley Bank in June 2007 and represented the excess of the purchase price over the fair value of acquired tangible assets and liabilities and identifiable intangible assets. Goodwill was assessed at least annually, as of November 30, for impairment with the assistance of an independent valuation firm. Goodwill impairment exists when a reporting unit's carrying value exceeds its fair value, which is determined through a two-step impairment test. Step 1 includes the determination of the carrying value of the Company's single reporting unit, including the existing goodwill and intangible assets, and estimating the fair value of the reporting unit. If the carrying amount of a reporting unit exceeds its fair value, the Company is required to perform a second step to the impairment test. Step 2 requires that the implied fair value of the reporting unit goodwill be compared to the carrying amount of that goodwill. If the carrying amount of the reporting unit goodwill exceeds the implied fair value of that goodwill, an impairment loss will be recognized in an amount equal to that excess.
Due to concerns about the Company's stock price, the condition of the banking industry in general, and the pricing of the closed private placement of convertible preferred stock, goodwill was tested for impairment in the second quarter of 2010, with the assistance of an independent valuation firm. Due to the continued depressed economic conditions and the length of time and amount by which the Company's book value exceeded market value per share, and the Company's closing of the private placement at a conversion price of $3.75 per share, the Company determined goodwill related to the acquisition of Diablo Valley Bank of $43,181,000 was fully impaired during the second quarter of 2010. The method for estimating the value of the reporting unit included a weighted average of the discounted cash flows income approach and publicly traded company approach.
112
HERITAGE COMMERCE CORP
NOTES TO CONSOLIDATED FINANCIAL STATEMENTS (Continued)
Acquired Intangible Assets
Core deposit and customer relationship intangible assets acquired in the 2007 acquisition of Diablo Valley Bank were $5,049,000 and $276,000, respectively. These assets are amortized over their estimated useful lives. Accumulated amortization of these intangible assets was $2,311,000 and $1,736,000 at December 31, 2010 and 2009, respectively.
Estimated amortization expense for each of the next five years follows:
| |
(Dollars in thousands) | |||
|---|---|---|---|---|
2011 |
$ | 523 | ||
2012 |
491 | |||
2013 |
473 | |||
2014 |
459 | |||
2015 |
446 | |||
Impairment testing of the intangible assets is performed at the individual asset level. Impairment exists if the carrying amount of the asset is not recoverable and exceeds its fair value at the date of the impairment test. For intangible assets, estimates of expected future cash flows (cash inflows less cash outflows) that are directly associated with an intangible asset are used to determine the fair value of that asset. Management makes certain estimates and assumptions in determining the expected future cash flows from core deposit and customer relationship intangibles including account attrition, expected lives, discount rates, interest rates, servicing costs and other factors. Significant changes in these estimates and assumptions could adversely impact the valuation of these intangible assets. If an impairment loss exists, the carrying amount of the intangible asset is adjusted to a new cost basis. The new cost basis is then amortized over the remaining useful life of the asset. Based on its assessment, management concluded that there was no impairment of intangible assets at December 31, 2010 and December 31, 2009.
(7) Deposits
Time deposits of $100,000 and over, including deposits within the Certificate of Deposit Account Registry Service ("CDARS") and brokered deposits of $100,000 and over, were $252,913,000 and $343,883,000 at December 31, 2010 and 2009, respectively. The following table presents the scheduled maturities of time deposits, including brokered deposits for the next five years:
| |
December 31, 2010 | ||||
|---|---|---|---|---|---|
| |
(Dollars in thousands) |
||||
2011 |
$ | 266,089 | |||
2012 |
18,923 | ||||
2013 |
2,171 | ||||
2014 |
45 | ||||
2015 |
116 | ||||
Total |
$ | 287,344 | |||
As of December 31, 2010, CDARS deposits decreased to $17,864,000 compared to $38,154,000 at December 31, 2009. The CDARS program allows customers with deposits in excess of FDIC-insured limits to obtain full coverage on time deposits through a network of banks within the CDARS program. Deposits gathered through these programs are considered brokered deposits under current regulatory reporting guidelines.
113
HERITAGE COMMERCE CORP
NOTES TO CONSOLIDATED FINANCIAL STATEMENTS (Continued)
At December 31, 2010, brokered deposits decreased 45%, to $98,467,000, compared to $178,031,000 at December 31, 2009.
Deposits from executive officers, directors, and their affiliates were $1,482,000 and $2,142,000 at December 31, 2010 and 2009, respectively.
(8) Borrowing Arrangements
Federal Home Loan Bank and Federal Reserve Bank Borrowings, Available Lines of Credit and Other Borrowings
The Company maintains a collateralized line of credit with the FHLB of San Francisco. Under this line, the Company can borrow from the FHLB on a short-term (typically overnight) or long-term (over one year) basis. As of December 31, 2010, the Company had no overnight borrowings from the FHLB. As of December 31, 2009, the Company had $20,000,000 of overnight borrowings from the FHLB, bearing interest at 0.04%. The Company had $221,093,000 of loans and no securities pledged to the FHLB as collateral on a line of credit of $111,781,000 at December 31, 2010. The Company had $271,207,000 of loans and no securities pledged to the FHLB as collateral on a line of credit of $136,389,000 at December 31, 2009.
The Company can also borrow from the FRB's discount window. The Company had approximately $134,482,000 of loans pledged to the FRB as collateral on an available line of credit of approximately $77,924,000 at December 31, 2010, none of which was outstanding. The Company had approximately $88,400,000 of loans pledged to the FRB as collateral on an available line of credit of approximately $39,700,000 at December 31, 2009, none of which was outstanding.
At December 31, 2010, the Company has Federal funds purchase arrangements and lines of credit available of $30,000,000. There were no Federal funds purchased at December 31, 2010 and 2009.
Securities Sold Under Agreements to Repurchase
Securities sold under agreements to repurchase are secured by mortgage-backed securities carried at approximately $6,254,000 and $29,100,000, respectively, at December 31, 2010 and 2009.
Securities sold under agreements to repurchase are financing arrangements that mature within two and a half years. At maturity, the securities underlying the agreements are returned to the Company. Information concerning securities sold under agreements to repurchase is summarized as follows:
| |
December 31, | |||||||||
|---|---|---|---|---|---|---|---|---|---|---|
| |
2010 | 2009 | 2008 | |||||||
| |
(Dollars in thousands) |
|||||||||
Average balance during the year |
$ | 18,767 | $ | 28,822 | $ | 32,030 | ||||
Average interest rate during the year |
2.23 | % | 2.73 | % | 2.93 | % | ||||
Maximum month-end balance during the year |
$ | 25,000 | $ | 35,000 | $ | 35,000 | ||||
Average rate at December 31 |
3.09 | % | 2.35 | % | 2.95 | % | ||||
Subordinated Debt
Interest payments on the subordinated notes payable to the Company's subsidiary grantor Trusts are deductible for tax purposes. The subordinated debt is not registered with the Securities and Exchange Commission. For regulatory reporting purposes, the subordinated debt qualifies for Tier 1 capital treatment. Under the Dodd-Frank Wall Street Reform and Consumer Protection Act, certain trust
114
HERITAGE COMMERCE CORP
NOTES TO CONSOLIDATED FINANCIAL STATEMENTS (Continued)
preferred securities will no longer be eligible to be included as Tier 1 capital for regulatory purposes. However, an exception to this statutory prohibition applies to securities issued prior to May 19, 2010 by bank holding companies with less than $15 billion of total assets. We believe, therefore, that our trust preferred securities will continue to be eligible to be treated as Tier 1 capital, subject to other rules and limitations.
The table below summarizes subordinated debt as of December 31:
| |
2010 | 2009 | ||||||
|---|---|---|---|---|---|---|---|---|
| |
(Dollars in thousands) |
|||||||
Subordinated debentures due to Heritage Capital Trust I with interest payable semi-annually at 10.875%, redeemable with a premium beginning March 8, 2010 and with no premium beginning March 8, 2020, due March 8, 2030 |
$ | 7,217 | $ | 7,217 | ||||
Subordinated debentures due to Heritage Statutory Trust I with interest payable semi-annually at 10.6%, redeemable with a premium beginning September 7, 2010 and with no premium beginning September 7, 2020, due September 7, 2030 |
7,206 |
7,206 |
||||||
Subordinated debentures due to Heritage Statutory Trust II with interest payable quarterly based on 3-month Libor plus 3.58% (3.88% at December 31, 2010), redeemable with a premium beginning July 31, 2006 and with no premium beginning July 31, 2011, due July 31, 2031 |
5,155 |
5,155 |
||||||
Subordinated debentures due to Heritage Statutory Trust III with interest payable quarterly based on 3-month Libor plus 3.40% (3.70% at December 31, 2010), redeemable with no premium beginning September 26, 2007 and due September 26, 2032 |
4,124 |
4,124 |
||||||
Total |
$ | 23,702 | $ | 23,702 | ||||
In November 2009, the Company announced that it was exercising its right to defer interest payments on its outstanding trust preferred subordinated debt securities. The Company will continue to accrue the cost and recognize the expense of the interest at the normal rate on a compounded basis until such time as the deferred arrearage has been paid current. As a result the Company has accrued but has not paid approximately $2,453,000 and $575,000 in interest on its subordinated debt as of December 31, 2010 and 2009, respectively, which is included in accrued interest payable on the consolidated balance sheets.
During the deferral period, the Company may not, among other things and with limited exceptions, pay cash dividends on or repurchase its common stock or preferred stock nor make any payment on outstanding debt obligations that rank equally with or junior to the subordinated debt.
115
HERITAGE COMMERCE CORP
NOTES TO CONSOLIDATED FINANCIAL STATEMENTS (Continued)
(9) Income Taxes
Income tax (benefit) consisted of the following:
| |
December 31, | ||||||||||||
|---|---|---|---|---|---|---|---|---|---|---|---|---|---|
| |
2010 | 2009 | 2008 | ||||||||||
| |
(Dollars in thousands) |
||||||||||||
Currently (refundable) payable tax: |
|||||||||||||
Federal |
$ | (2,281 | ) | $ | (6,192 | ) | $ | 3,307 | |||||
State |
(44 | ) | 2 | 1,312 | |||||||||
Total currently (refundable) payable |
(2,325 | ) | (6,190 | ) | 4,619 | ||||||||
Deferred tax (benefit): |
|||||||||||||
Federal |
(4,849 | ) | (3,108 | ) | (4,426 | ) | |||||||
State |
(2,292 | ) | (3,411 | ) | (1,580 | ) | |||||||
Deferred tax valuation allowance |
3,700 | — | — | ||||||||||
Total deferred tax (benefit) |
(3,441 | ) | (6,519 | ) | (6,006 | ) | |||||||
Income tax (benefit) |
$ | (5,766 | ) | $ | (12,709 | ) | $ | (1,387 | ) | ||||
The effective tax rate differs from the federal statutory rate for the years ended December 31, as follows:
| |
2010 | 2009 | 2008 | ||||||||
|---|---|---|---|---|---|---|---|---|---|---|---|
Statutory Federal income tax rate |
(35.0 | )% | (35.0 | )% | 35.0 | % | |||||
State income taxes, net of federal tax benefit |
(2.7 | )% | (9.0 | )% | (46.3 | )% | |||||
Change in valuation allowance |
6.0 | % | 0.0 | % | 0.0 | % | |||||
Low income housing credits |
(1.7 | )% | (4.3 | )% | (283.1 | )% | |||||
Goodwill impairment |
24.5 | % | 0.0 | % | 0.0 | % | |||||
Non-taxable interest income |
(0.1 | )% | (0.4 | )% | (20.3 | )% | |||||
Increase in cash surrender value of life insurance |
(1.0 | )% | (2.4 | )% | (153.4 | )% | |||||
Stock based compensation |
(0.1 | )% | 0.6 | % | 55.9 | % | |||||
Other, net |
0.7 | % | (1.0 | )% | 42.3 | % | |||||
Effective tax rate |
(9.4 | )% | (51.5 | )% | (369.9 | )% | |||||
116
HERITAGE COMMERCE CORP
NOTES TO CONSOLIDATED FINANCIAL STATEMENTS (Continued)
Deferred tax assets and liabilities that result from the tax effects of temporary differences between the carrying amount of assets and liabilities for financial reporting purposes and the amounts used for income tax purposes at December 31, are as follows:
| |
2010 | 2009 | ||||||||
|---|---|---|---|---|---|---|---|---|---|---|
| |
(Dollars in thousands) |
|||||||||
Deferred tax assets: |
||||||||||
Allowance for loan losses |
$ | 10,597 | $ | 12,062 | ||||||
Defined postretirement benefit obligation |
6,816 | 6,135 | ||||||||
Tax credit carryforwards |
4,061 | 1,882 | ||||||||
Federal net operating loss carryforwards |
3,618 | — | ||||||||
California net operating loss carryforwards |
3,164 | 1,615 | ||||||||
Other postretirement obligations |
2,501 | 2,752 | ||||||||
Securities available-for-sale |
1,232 | — | ||||||||
Stock compensation |
1,094 | 1,107 | ||||||||
Accrued expenses |
676 | 441 | ||||||||
Fixed assets |
611 | 439 | ||||||||
Deferred compensation |
215 | 53 | ||||||||
Nonaccrual loan interest |
185 | 448 | ||||||||
Loans |
60 | 88 | ||||||||
State income taxes |
1 | 1 | ||||||||
Other |
189 | 254 | ||||||||
Total deferred tax assets |
35,020 | 27,277 | ||||||||
Deferred tax liabilities: |
||||||||||
Securities available-for-sale |
— | (582 | ) | |||||||
FHLB stock |
(270 | ) | (304 | ) | ||||||
Prepaid expenses |
(490 | ) | (401 | ) | ||||||
I/O strips |
(858 | ) | (739 | ) | ||||||
Loan fees |
(940 | ) | (1,157 | ) | ||||||
Intangible assets |
(1,267 | ) | (1,509 | ) | ||||||
Other |
(134 | ) | (184 | ) | ||||||
Total deferred tax liabilities |
(3,959 | ) | (4,876 | ) | ||||||
Net deferred tax assets |
31,061 | 22,401 | ||||||||
Valuation allowance |
(3,700 | ) | — | |||||||
Net deferred tax assets |
$ | 27,361 | $ | 22,401 | ||||||
Tax credit carryforwards as of December 31, 2010 consist of the following:
| |
2010 | |
||||
|---|---|---|---|---|---|---|
| |
(Dollars in thousands) |
|
||||
Low income housing credits |
$ | 3,143 | (begin to expire in 2028) | |||
Alternative Minimum Tax credits |
718 | (no expiration date) | ||||
State tax credits, net of federal tax effects |
200 | (no expiration date) | ||||
Total tax credit carryforwards |
$ | 4,061 | ||||
117
HERITAGE COMMERCE CORP
NOTES TO CONSOLIDATED FINANCIAL STATEMENTS (Continued)
After the carryback of the 2010 net operating loss and low income housing credits, the Company does not have the ability to recover federal income taxes paid in prior years. Under California law, the Company cannot recover state income taxes paid in prior years.
At year-end 2010, the Company has a Federal net operating loss carryforward of approximately $10,336,000 and a California net operating loss carryforward of approximately $44,911,000 that will begin to expire in 2030 and 2021, respectively, if not utilized to reduce future taxable income.
Under generally accepted accounting principles, a valuation allowance is required if it is "more likely than not" that a deferred tax asset will not be realized. The determination of the realizability of the deferred tax assets is highly subjective and dependent upon judgment concerning management's evaluation of both positive and negative evidence, including forecasts of future income, cumulative losses, applicable tax planning strategies, and assessments of current and future economic and business conditions.
In assessing the realization of deferred tax assets at December 31, 2010, based on these factors, the Company believed that it was more likely than not that the Company will realize approximately $27,361,000 of the benefits of these deductible differences, and therefore, a partial valuation allowance for deferred tax assets in the amount of $3,700,000 was recorded at December 31, 2010. The $5,766,000 income tax benefit for 2010 is net of the $3,700,000 income tax expense to establish the partial valuation allowance.
In assessing the realization of deferred tax assets at December 31, 2009, the Company estimated that it had sufficient forecasted future taxable income and various tax planning strategies which could be implemented to generate taxable income in future periods, to support the balance of deferred tax assets. Based on these factors, the Company believed it was more likely than not that the Company will realize the benefits of these deductible differences, and therefore, no valuation allowance for deferred tax assets was recorded at December 31, 2009.
The Company and its subsidiaries are subject to U.S. Federal income tax as well as income tax of the State of California. The Company is no longer subject to examination by federal and state taxing authorities for years before 2007 and 2006, respectively.
(10) Equity Plan
The Company has an Amended and Restated 2004 Equity Plan (the "Equity Plan") for directors, officers, and key employees. The Equity Plan provides for the grant of incentive and non-qualified stock options and restricted stock. The Equity Plan provides that the option price for both incentive and non-qualified stock options will be determined by the Board of Directors at no less than the fair value at the date of grant. Options granted vest on a schedule determined by the Board of Directors at the time of grant. Generally, options vest over four years. All options expire no later than ten years from the date of grant. As of December 31, 2010, there are 716,193 shares available for future grants under the Equity Plan.
118
HERITAGE COMMERCE CORP
NOTES TO CONSOLIDATED FINANCIAL STATEMENTS (Continued)
Stock option activity under the Equity Plan is as follows:
Total Stock Options
|
Number of Shares |
Weighted Average Exercise Price |
Weighted Average Remaining Contractual Life (Years) |
Aggregate Intrinsic Value |
||||||||||
|---|---|---|---|---|---|---|---|---|---|---|---|---|---|---|
Outstanding at January 1, 2010 |
1,110,056 | $ | 16.93 | |||||||||||
Granted |
130,500 | $ | 3.57 | |||||||||||
Exercised |
— | $ | — | |||||||||||
Forfeited or expired |
(89,735 | ) | $ | 16.17 | ||||||||||
Outstanding at December 31, 2010 |
1,150,821 | $ | 15.47 | 6.2 | $ | 161,200 | ||||||||
Vested or expected to vest |
1,093,280 | $ | 15.47 | 6.2 | $ | 153,200 | ||||||||
Exercisable at December 31, 2010 |
874,983 | $ | 17.83 | 5.4 | $ | 28,000 | ||||||||
Information related to the Equity Plan for each of the last three years:
| |
2010 | 2009 | 2008 | |||||||
|---|---|---|---|---|---|---|---|---|---|---|
Intrinsic value of options exercised |
$ | — | $ | — | $ | 272,000 | ||||
Cash received from option exercise |
$ | — | $ | — | $ | 509,000 | ||||
Tax benefit realized from option exercises |
$ | — | $ | — | $ | 71,000 | ||||
Weighted average fair value of options granted |
$ | 2.00 | $ | 2.92 | $ | 3.54 | ||||
As of December 31, 2010, there was $1,300,000 of total unrecognized compensation cost related to nonvested stock options granted under the Equity Plan. That cost is expected to be recognized over a weighted-average period of approximately 2.1 years.
The fair value of each option grant is estimated on the date of grant using the Black-Scholes option pricing model that uses the assumptions noted in the following table, including the weighted average assumptions for the option grants in each year.
| |
2010 | 2009 | 2008 | |||||||
|---|---|---|---|---|---|---|---|---|---|---|
Expected life in months(1) |
72 | 72 | 72 | |||||||
Volatility(1) |
59 | % | 45 | % | 25 | % | ||||
Weighted average risk-free interest rate(2) |
2.11 | % | 2.48 | % | 3.22 | % | ||||
Expected dividends(3) |
0.00 | % | 0.33 | % | 2.15 | % | ||||
- (1)
- The
expected life of employee stock options represents the weighted average period the stock options are expected to remain outstanding based on historical
experience. Volatility is based on the historical volatility of the stock price over the same period of the expected life of the option.
- (2)
- Based
on the U.S. Treasury constant maturity interest rate with a term consistent with the expected life of the option granted.
- (3)
- Each grant's dividend yield is calculated by annualizing the most recent quarterly cash dividend and dividing that amount by the market price of the Company's common stock as of the grant date.
The Company estimates the impact of forfeitures based on historical experience. Should the Company's current estimate change, additional expense could be recognized or reversed in future periods. The Company issues authorized shares of common stock to satisfy stock option exercises.
119
HERITAGE COMMERCE CORP
NOTES TO CONSOLIDATED FINANCIAL STATEMENTS (Continued)
The Company granted 51,000 restricted shares of its common stock to an executive officer pursuant to the terms of a restricted stock agreement, dated March 17, 2005. The grant price was $18.15. Under the terms of the agreement, the restricted shares will vest 25% per year at the end of years three, four, five and six, provided the executive officer is still with the Company, subject to accelerated vesting upon a change of control, termination without cause, termination by the executive officer for good reason (as defined by the executive employment agreement), death or disability. The fair value of stock award at the grant date was $926,000, which is being amortized over the six-year vesting period on the straight-line method. Amortization expense was $154,000, $154,000, and $155,000 in 2010, 2009 and 2008, respectively. In 2010 and 2009, 12,750 shares vested in each year and there were 12,750 shares nonvested at December 31, 2010.
The Company granted 13,500 restricted shares of its common stock to three officers pursuant to the terms of the restricted stock agreements, dated July 26, 2010, under the Amended and Restated 2004 Equity Plan. The grant price was $3.57. Under the terms of the agreements, the period of restriction, during which the Common Shares shall be subject to the Company's return right, shall lapse upon the later of the following (a) and (b) to occur: (a) on the date the Company has redeemed all of the issued and outstanding shares of the Company's Series A Fixed Rate Cumulative Perpetual Preferred Stock, or (b) upon the second anniversary of the grant date. However, upon the occurrence of a change in control, or the death or disability of the participant, the Company's return right will lapse immediately. The fair value of stock award at the grant date was $48,195, which is being amortized over three-year period on the straight-line method. Amortization expense was $7,000 in 2010. None of the shares were vested at December 31, 2010.
(11) Benefit Plans
401(k) Savings Plan
The Company offers a 401(k) savings plan that allows employees to contribute up to a maximum percentage of their compensation, as established by the Internal Revenue Code. The Company made a discretionary matching contribution of up to $1,000 for each employee's contributions in 2010 and a discretionary matching contribution of up to $1,500 for each employee's contributions in 2008. The Company suspended the discretionary matching contribution in 2009. Contribution expense was $187,000, $0, and $332,000 in 2010, 2009 and 2008, respectively.
Employee Stock Ownership Plan
The Company sponsors a non-contributory employee stock ownership plan. To participate in this plan, an employee must have worked at least 1,000 hours during the year and must be employed by the Company at year-end. Employer contributions to the ESOP are discretionary. The Company suspended contributions to the ESOP in 2010, 2009 and 2008. At December 31, 2010, the ESOP owned 147,480 shares of the Company's common stock.
Deferred Compensation Plan
The Company has a nonqualified deferred compensation plan for its directors ("Deferral Agreements"). Under the Deferral Agreements, a participating director may defer up to 100% of his or her board fees into a deferred account. The director may elect a distribution schedule of up to ten years. Amounts deferred earn interest. The Company's deferred compensation obligation of $397,000 and $472,000 as of December 31, 2010 and 2009 is included in "Accrued interest payable and other liabilities."
The Company has purchased life insurance policies on the lives of directors who have Deferral Agreements. It is expected that the earnings on these policies will offset the cost of the program. In
120
HERITAGE COMMERCE CORP
NOTES TO CONSOLIDATED FINANCIAL STATEMENTS (Continued)
addition, the Company will receive death benefit payments upon the death of the director. The proceeds will permit the Company to "complete" the deferral program as the director originally intended if he dies prior to the completion of the deferral program. The disbursement of deferred fees is accelerated at death and commences one month after the director dies.
In the event of the director's disability prior to attainment of his benefit eligibility date, the director may request that the Board permit him to receive an immediate disability benefit equal to the annualized value of the director's deferral account.
Nonqualified Defined Benefit Pension Plan
The Company has a supplemental retirement plan covering key executives and directors ("SERP"). The SERP is an unfunded, nonqualified defined benefit plan. The combined number of active and retired/terminated participants in the SERP was 51 at December 31, 2010. The defined benefit represents a stated amount for key executives and directors that generally vests over nine years and is reduced for early retirement. The projected benefit obligation is included in "Accrued interest payable and other liabilities" on the consolidated balance sheets. Since the SERP has no assets, the entire projected benefit obligation is unfunded. The measurement date of the SERP is December 31.
The following table sets forth the SERP's status at December 31:
| |
2010 | 2009 | |||||||
|---|---|---|---|---|---|---|---|---|---|
| |
(Dollars in thousands) |
||||||||
Change in projected benefit obligation |
|||||||||
Projected benefit obligation at beginning of year |
$ | 14,591 | $ | 13,301 | |||||
Service cost |
978 | 965 | |||||||
Actuarial (gain)/loss |
874 | 78 | |||||||
Interest cost |
834 | 762 | |||||||
Benefits paid |
(1,048 | ) | (515 | ) | |||||
Projected benefit obligation at end of year |
$ | 16,229 | $ | 14,591 | |||||
Amounts recognized in accumulated other comprehensive loss |
|||||||||
Net actuarial loss |
$ | 3,430 | $ | 2,625 | |||||
Prior service cost |
63 | 99 | |||||||
Accumulated other comprehensive loss |
$ | 3,493 | $ | 2,724 | |||||
Weighted-average assumptions used to determine the benefit obligation at year-end:
| |
2010 | 2009 | |||||
|---|---|---|---|---|---|---|---|
Discount rate |
5.21 | % | 5.85 | % | |||
121
HERITAGE COMMERCE CORP
NOTES TO CONSOLIDATED FINANCIAL STATEMENTS (Continued)
Estimated benefit payments over the next ten years, which reflect anticipated future events, service and other assumptions, are as follows:
Year
|
Estimated Benefit Payments |
|||
|---|---|---|---|---|
| |
(Dollars in thousands) |
|||
2011 |
$ | 735 | ||
2012 |
846 | |||
2013 |
868 | |||
2014 |
1,074 | |||
2015 |
1,159 | |||
2016 to 2020 |
7,186 | |||
The components of pension cost for the SERP follow:
| |
2010 | 2009 | |||||||
|---|---|---|---|---|---|---|---|---|---|
| |
(Dollars in thousands) |
||||||||
Components of net periodic benefit cost |
|||||||||
Service cost |
$ | 978 | $ | 965 | |||||
Interest cost |
834 | 762 | |||||||
Amortization of prior service cost |
36 | 36 | |||||||
Amortization of net actuarial loss |
68 | 192 | |||||||
Net periodic benefit cost |
$ | 1,916 | $ | 1,955 | |||||
Net periodic benefit cost was determined using the following assumptions:
| |
2010 | 2009 | |||||
|---|---|---|---|---|---|---|---|
Discount rate |
5.85 | % | 5.85 | % | |||
Split-Dollar Life Insurance Postretirement Benefit Plan
The Company has purchased insurance on the lives of the directors and executive officers participating in the SERP. The purchased insurance is subject to split- dollar life insurance agreements with the insured participants, which continues after the participant's employment and retirement. All participants are fully vested in their split-dollar life insurance benefits. The accrued benefit liability for the split-dollar insurance agreements represents either the present value of the future death benefits payable to the participants' beneficiaries or the present value of the estimated cost to maintain life insurance, depending on the contractual terms of the participant's underlying agreement.
The split-dollar life insurance projected benefit obligation is included in "Accrued interest payable and other liabilities" on the consolidated balance sheets. The measurement date of the split-dollar life insurance benefit plan is December 31.
122
HERITAGE COMMERCE CORP
NOTES TO CONSOLIDATED FINANCIAL STATEMENTS (Continued)
The following sets forth the funded status of the split dollar life insurance benefits.
| |
2010 | 2009 | |||||||
|---|---|---|---|---|---|---|---|---|---|
| |
(Dollars in thousands) |
||||||||
Change in projected benefit obligation |
|||||||||
Projected benefit obligation at beginning of year |
$ | 6,957 | $ | 7,447 | |||||
Interest cost |
392 | 443 | |||||||
Actuarial loss (gain) |
(833 | ) | (80 | ) | |||||
Benefits paid |
(155 | ) | — | ||||||
Amendments to split dollar agreements |
— | (853 | ) | ||||||
Projected benefit obligation at end of year |
$ | 6,361 | $ | 6,957 | |||||
Amounts recognized in accumulated other comprehensive loss at December 31 consist of:
| |
2010 | 2009 | ||||||
|---|---|---|---|---|---|---|---|---|
| |
(Dollars in thousands) |
|||||||
Net actuarial loss (gain) |
$ | (407 | ) | $ | 426 | |||
Prior transition obligation |
4,049 | 4,404 | ||||||
Accumulated other comprehensive loss |
$ | 3,642 | $ | 4,830 | ||||
Components of net periodic benefit cost during the year are:
| |
2010 | 2009 | ||||||
|---|---|---|---|---|---|---|---|---|
| |
(Dollars in thousands) |
|||||||
Amortization of prior transition obligation |
$ | 200 | $ | 229 | ||||
Interest cost |
392 | 443 | ||||||
Net periodic benefit cost |
$ | 592 | $ | 672 | ||||
Weighted-average assumptions used to determine the benefit obligation at year-end follow:
| |
2010 | 2009 | |||||
|---|---|---|---|---|---|---|---|
Discount rate |
5.71 | % | 6.16 | % | |||
Weighted-average assumption used to determine the net periodic benefit cost:
| |
2010 | 2009 | |||||
|---|---|---|---|---|---|---|---|
Discount rate |
6.16 | % | 6.05 | % | |||
(12) Regulatory Matters
On February 17, 2010 HCC and HBC entered into a Written Agreement with the Federal Reserve Bank of San Francisco, and the California Department of Financial Institutions ("DFI"). Under the terms of the Written Agreement, the Company must obtain the prior written approval of the Federal Reserve and DFI before it may (i) declare or pay any dividends on common stock or preferred stock; (ii) make any distributions of principal or interest on HCC's outstanding trust preferred securities and related subordinated debt; (iii) incur, increase or guarantee any debt; (iv) redeem any outstanding stocks, or; (v) take dividends or any other form of payment that represents a reduction in capital from HBC. The Written Agreement required the Company to submit written plans within certain timeframes to the
123
HERITAGE COMMERCE CORP
NOTES TO CONSOLIDATED FINANCIAL STATEMENTS (Continued)
Federal Reserve and the DFI that addresses the following items (i) strengthening credit risk management practices; (ii) improving HBC's position with respect to problem loans in excess of $2 million; (iii) maintaining adequate reserves for loan and lease losses; (iv) maintaining sufficient capital at HCC and HBC; (v) improving the management of HBC's liquidity position and funds management practices; and (vi) improving the Company's earnings and overall condition through a business plan and budget. All plans were submitted to the appropriate regulatory agencies, and all plans requiring approval by such agencies were approved.
In addition, the Agreement (i) required HBC's Board of Directors or a designated committee thereof to approve any extension, renewal or restructuring of any credit to any borrower whose loans have been "criticized"; (ii) requires HBC to charge off loans classified as "loss" by the Federal Reserve and/or DFI; (iii) requires the Company to notify the Federal Reserve and DFI no more than 30 days after the end of any quarter in which the capital ratios of HCC or HBC fall below the approved capital plan' minimum levels; (iv) requires HCC and HBC to comply with the notice provisions of Section 32 of the Federal Deposit Insurance Act and Subpart H of Regulation Y of the Board of Governors of the Federal Reserve System in connection with appointing any new director or senior executive officer or changing the responsibilities of any senior executive officer so that the officer would assume a different senior executive officer position; (v) requires HCC and HBC to comply with the restrictions on indemnification and severance payments of Section 18(k) of the Federal Deposit Insurance Act and Part 359 of the FDIC's regulations; and (vi) requires the Company to provide quarterly progress reports to the Federal Reserve and the DFI.
The Board of Directors and management of the Company are committed to addressing and resolving the matters raised in the Written Agreement on a timely basis and actions have been undertaken to comply with the various items addressed by the Written Agreement. A new joint compliance committee was formed by the Board of Directors to oversee HCC's and HBC's response to the Written Agreement. The committee reports monthly to the Board of Directors.
As of this filing date, HCC and HBC believe they are in compliance with the requirements of the Written Agreement. Failure to comply with the Written Agreement may subject the Company and HBC to additional supervisory actions and orders.
(13) Fair Value
Accounting guidance establishes a fair value hierarchy which requires an entity to maximize the use of observable inputs and minimize the use of unobservable inputs when measuring fair value. The standard describes three levels of inputs that may be used to measure fair value:
Level 1: Quoted prices (unadjusted) for identical assets or liabilities in active markets that the entity has the ability to access as of the measurement date.
Level 2: Significant other observable inputs other than Level 1 prices such as quoted prices for similar assets or liabilities in active markets; quoted prices for identical assets or liabilities in markets that are not active; or other inputs that are observable or can be corroborated by observable market data (for example, interest rates and yield curves observable at commonly quoted intervals, prepayment speeds, credit risks, and default rates).
Level 3: Significant unobservable inputs that reflect a reporting entity's own assumptions about the assumptions that market participants would use in pricing an asset or liability.
124
HERITAGE COMMERCE CORP
NOTES TO CONSOLIDATED FINANCIAL STATEMENTS (Continued)
Financial Assets and Liabilities Measured on a Recurring Basis
The fair values of securities available for sale are determined by obtaining quoted prices on nationally recognized securities exchanges (Level 1 inputs) or matrix pricing, which is a mathematical technique widely used in the industry to value debt securities without relying exclusively on quoted prices for the specific securities, but rather by relying on the securities' relationship to other benchmark quoted securities (Level 2 inputs).
The fair value of interest-only ("I/O") strip receivable assets is based on a valuation model used by a third party. The Company is able to compare the valuation model inputs and results to widely available published industry data for reasonableness (Level 2 inputs).
| |
|
Fair Value Measurements Using | |||||||||||||
|---|---|---|---|---|---|---|---|---|---|---|---|---|---|---|---|
| |
Balance | Quoted Prices in Active Markets for Identical Assets (Level 1) |
Significant Other Obeservable Inputs (Level 2) |
Significant Unobservable Inputs (Level 3) |
|||||||||||
| |
(Dollars in thousands) |
||||||||||||||
Assets at December 31, 2010: |
|||||||||||||||
Available-for-sale securities: |
|||||||||||||||
Agency Mortgage-Backed Securities |
$ | 232,165 | $ | — | $ | 232,165 | — | ||||||||
I/O strip receivables |
2,140 | — | 2,140 | — | |||||||||||
Assets at December 31, 2009: |
|||||||||||||||
Available-for-sale securities: |
|||||||||||||||
U.S. Government Sponsored Entities |
$ | 1,973 | — | $ | 1,973 | — | |||||||||
Agency Mortgage-Backed Securities |
102,546 | — | 102,546 | — | |||||||||||
Collateralized Mortgage Obligations |
5,447 | — | 5,447 | — | |||||||||||
I/O strip receivables |
2,116 | — | 2,116 | — | |||||||||||
There were no transfers between Level 1 and Level 2 during the year for assets measured at fair value on a recurring basis.
Assets and Liabilities Measured on a Non-Recurring Basis
The fair value of loans held-for-sale is generally based on obtaining bids and broker indications on the estimated value of these loans held-for-sale, resulting in a Level 2 classification.
The fair value of impaired loans with specific allocations of the allowance for loan losses is generally based on recent real estate appraisals. The appraisals may utilize a single valuation approach or a combination of approaches including comparable sales and the income approach. Adjustments are routinely made in the appraisal process by the appraisers to adjust for differences between the comparable sales and income data available. Such adjustments are usually significant and typically result in a Level 3 classification of the inputs for determining fair value.
Nonrecurring adjustments to certain commercial and residential estate properties classified as other real estate owned are measured at the lower of carrying amount or fair value, less costs to sell. Fair values are generally based on third party appraisals of the property, resulting in a Level 3 classification. In cases where the carrying amount exceeds the fair value, less costs to sell, an impairment loss is recognized.
125
HERITAGE COMMERCE CORP
NOTES TO CONSOLIDATED FINANCIAL STATEMENTS (Continued)
Assets and Liabilities Measured on a Non-Recurring Basis
| |
|
Fair Value Measurements Using | ||||||||||||||
|---|---|---|---|---|---|---|---|---|---|---|---|---|---|---|---|---|
| |
Balance | Quoted Prices in Active Markets for Identical Assets (Level 1) |
Significant Other Obeservable Inputs (Level 2) |
Significant Unobservable Inputs (Level 3) |
||||||||||||
| |
(Dollars in thousands) |
|||||||||||||||
Assets at December 31, 2010: |
||||||||||||||||
Loans held-for-sale — other: |
||||||||||||||||
Real estate: |
||||||||||||||||
Commercial and residential |
$ | 929 | — | $ | 929 | — | ||||||||||
Land and construction |
1,097 | — | 1,097 | — | ||||||||||||
|
$ | 2,026 | — | $ | 2,026 | — | ||||||||||
Impaired loans — held-for-investment: |
||||||||||||||||
Commercial |
$ | 6,725 | — | — | $ | 6,725 | ||||||||||
Real estate: |
||||||||||||||||
Commercial and residential |
5,982 | — | — | 5,982 | ||||||||||||
Land and construction |
8,005 | — | — | 8,005 | ||||||||||||
Consumer |
120 | — | — | 120 | ||||||||||||
|
$ | 20,832 | — | — | $ | 20,832 | ||||||||||
Other real estate owned |
$ | 1,296 | — | — | $ | 1,296 | ||||||||||
Assets at December 31, 2009: |
||||||||||||||||
Impaired loans |
$ | 48,410 | — | — | $ | 48,410 | ||||||||||
Other real estate owned |
812 | — | — | 812 | ||||||||||||
The following table shows the detail of the impaired loans held for investment and the impaired loans held-for-investment carried at fair value for the periods indicated:
| |
December 31, 2010 | December 31, 2009 | |||||||
|---|---|---|---|---|---|---|---|---|---|
| |
(Dollars in thousands) |
||||||||
Impaired loans held-for-investment: |
|||||||||
Book value of impaired loans held-for-investment carried at fair value |
$ | 26,892 | $ | 57,513 | |||||
Book value of impaired loans held-for-investment carried at cost |
4,421 | 4,862 | |||||||
Total impaired loans held-for-investment |
$ | 31,313 | $ | 62,375 | |||||
Impaired loans held-for-investment carried at fair value: |
|||||||||
Book value of impaired loans held-for-investment carried at fair value |
$ | 26,892 | $ | 57,513 | |||||
Specific valuation allowance |
(6,060 | ) | (9,103 | ) | |||||
Impaired loans held-for-investment carried at fair value, net |
$ | 20,832 | $ | 48,410 | |||||
Impaired loans held-for-investment which are measured primarily for impairment using the fair value of the collateral were $31,313,000 at December 31, 2010, after partial charge-offs of $6,982,000 in 2010. In
126
HERITAGE COMMERCE CORP
NOTES TO CONSOLIDATED FINANCIAL STATEMENTS (Continued)
addition, these loans had a specific valuation allowance of $6,060,000 at December 31, 2010. Impaired loans held-for-investment totaling $26,892,000 at December 31, 2010 were carried at fair value as a result of the aforementioned partial charge-offs and specific valuation allowances at year-end. The remaining $4,421,000 of impaired loans were carried at cost at December 31, 2010, as the fair value of the collateral exceeded the cost basis of each respective loan. Partial charge-offs and changes in specific valuation allowances during 2010 on impaired loans held-for-investment carried at fair value at December 31, 2010 resulted in an additional provision for loan losses of $9,791,000.
Total other real estate owned, consisting of one property, had a fair value of $1,296,000 at December 31, 2010.
At December 31, 2009, impaired loans using the fair value of the collateral were $62,375,000 at December 31, 2009, after partial charge-offs of $14,027,000 in 2009. In addition, these loans had a specific valuation allowance of $9,103,000 at December 31, 2009. Impaired loans totaling $57,513,000 at December 31, 2009 were carried at fair value as a result of the aforementioned partial charge-offs and specific valuation allowances at year-end. The remaining $4,862,000 of impaired loans were carried at cost at December 31, 2009, as the fair value of the collateral exceeded the cost basis of each respective loan. Partial charge-offs and changes in specific valuation allowances during 2009 on impaired loans carried at fair value at December 31, 2009 resulted in an additional provision for loan losses of $16,574,000.
Total other real estate owned, consisting of two properties, had a carrying value of $2,241,000 at December 31, 2009. One property is carried at fair value, less costs to sell, of $812,000 at December 31, 2009, with a valuation allowance of $0. The other property was carried at cost as of December 31, 2009. There were no impairment writedowns subsequent to acquisition in 2009.
The carrying amounts and estimated fair values of the Company's financial instruments, at year-end were as follows:
| |
2010 | 2009 | ||||||||||||
|---|---|---|---|---|---|---|---|---|---|---|---|---|---|---|
| |
Carrying Amounts |
Estimated Fair Value |
Carrying Amounts |
Estimated Fair Value |
||||||||||
| |
(Dollars in thousands) |
|||||||||||||
Assets |
||||||||||||||
Cash and cash equivalents |
$ | 72,177 | $ | 72,177 | $ | 45,562 | $ | 45,562 | ||||||
Securities available-for-sale |
232,165 | 232,165 | 109,966 | 109,966 | ||||||||||
Loans (including loans held-for-sale), net |
831,855 | 855,327 | 1,052,087 | 955,242 | ||||||||||
FHLB and FRB stock |
9,174 | N/A | 8,454 | N/A | ||||||||||
Accrued interest receivable |
3,215 | 3,215 | 3,472 | 3,472 | ||||||||||
Loan servicing rights and I/O strips receivables |
3,055 | 5,340 | 3,183 | 4,972 | ||||||||||
Liabilities |
||||||||||||||
Time deposits |
$ | 287,344 | $ | 288,798 | $ | 386,213 | $ | 389,027 | ||||||
Other deposits |
706,574 | 706,574 | 703,072 | 703,072 | ||||||||||
Securities sold under agreement to repurchase |
5,000 | 5,018 | 25,000 | 25,341 | ||||||||||
Short-term borrowings |
2,445 | 2,445 | 20,000 | 20,000 | ||||||||||
Subordinated debt |
23,702 | 14,445 | 23,702 | 14,938 | ||||||||||
Accrued interest payable |
2,810 | 2,810 | 1,194 | 1,194 | ||||||||||
127
HERITAGE COMMERCE CORP
NOTES TO CONSOLIDATED FINANCIAL STATEMENTS (Continued)
The methods and assumptions, not previously discussed, used to estimate the fair value are described as follows:
Cash and Cash Equivalents and Accrued Interest Receivable and Payable
The carrying amount approximates fair value because of the short maturities of these instruments.
Loans
Loans with similar financial characteristics are grouped together for purposes of estimating their fair value. Loans are segregated by type such as commercial, term real estate, construction and land development, and consumer. Each loan category is further segmented into fixed and adjustable rate interest terms.
The fair value of performing, fixed rate loans is calculated by discounting scheduled future cash flows using estimated market discount rates that reflect the credit and interest rate risk inherent in the loan. The fair value of variable rate loans approximates the carrying amount as these loans generally reprice within 90 days.
The fair value of loans held-for-sale is based on estimated market values from third party investors.
FHLB and FRB Stock
It was not practical to determine the fair value of FHLB and FRB stock due to the restrictions placed on transferability.
Deposits
The fair value of deposits with no stated maturity, such as demand deposits, savings, and money market accounts, approximates the amount payable on demand. The carrying amount approximates the fair value of time deposits with a remaining maturity of less than 90 days. The fair value of all other time deposits is calculated based on discounting the future cash flows using rates currently offered for time deposits with similar remaining maturities.
Subordinated debt and Securities Sold Under Agreement to Purchase
The fair values of subordinated debt and securities sold under agreement to repurchase were determined based on the current market value for like kind instruments of a similar maturity and structure.
Short-term Borrowings and Note Payable
The carrying amount approximates the fair value of short-term borrowings and the note payable that reprice frequently and fully.
Off-Balance Sheet Items
The fair value of off-balance sheet items, such as commitments to extend credit, is not considered material and therefore is not included in the table above.
Limitations
Fair value estimates are made at a specific point in time, based on relevant market information about the financial instruments. These estimates do not reflect any premium or discount that could result from
128
HERITAGE COMMERCE CORP
NOTES TO CONSOLIDATED FINANCIAL STATEMENTS (Continued)
offering for sale at one time the entire holdings of a particular financial instrument. Fair value estimates are based on judgments regarding future expected loss experience, current economic conditions, risk characteristics of various financial instruments, and other factors. These estimates are subjective in nature and involve uncertainties and matters of significant judgment and therefore cannot be determined with precision. Changes in assumptions could significantly affect the estimates.
(14) Commitments and Contingencies
Financial Instruments with Off-Balance Sheet Risk
HBC is a party to financial instruments with off-balance sheet risk in the normal course of business to meet the financing needs of its clients. These financial instruments include commitments to extend credit and standby letters of credit. Those instruments involve, to varying degrees, elements of credit and interest rate risk in excess of the amounts recognized in the balance sheets.
HBC's exposure to credit loss in the event of non-performance of the other party to the financial instrument for commitments to extend credit and standby letters of credit is represented by the contractual amount of those instruments. HBC uses the same credit policies in making commitments and conditional obligations as it does for on-balance sheet instruments. Credit risk is the possibility that a loss may occur because a party to a transaction failed to perform according to the terms of the contract. HBC controls the credit risk of these transactions through credit approvals, limits, and monitoring procedures. Management does not anticipate any significant losses as a result of these transactions.
Commitments to extend credit were as follows:
| |
December 31, | December 31, | |||||||||||
|---|---|---|---|---|---|---|---|---|---|---|---|---|---|
| |
2010 | 2009 | |||||||||||
| |
Fixed Rate |
Variable Rate |
Fixed Rate |
Variable Rate |
|||||||||
| |
(Dollars in thousands) |
||||||||||||
Unused lines of credit and commitments to make loans |
$ | 6,740 | $ | 256,575 | $ | 10,540 | $ | 297,900 | |||||
Standby letters of credit |
2,291 | 18,419 | 557 | 19,218 | |||||||||
|
$ | 9,031 | $ | 274,994 | $ | 11,097 | $ | 317,118 | |||||
Commitments generally expire within one year.
Standby letters of credit are written with conditional commitments issued by HBC to guarantee the performance of a client to a third party. The credit risk involved in issuing letters of credit is essentially the same as that involved in extending loan facilities to clients.
The Company is required to maintain noninterest bearing reserves. Reserve requirements are based on a percentage of certain deposits. As of December 31, 2010, the Company maintained reserves of $3,662,000 in the form of vault cash and balances at the Federal Reserve Bank of San Francisco, which satisfied the regulatory requirements.
Claims
The Company is involved in certain legal actions arising from normal business activities. Management, based upon the advice of legal counsel, believes the ultimate resolution of all pending legal actions will not have a material effect on the financial statements of the Company.
129
HERITAGE COMMERCE CORP
NOTES TO CONSOLIDATED FINANCIAL STATEMENTS (Continued)
(15) Stockholders' Equity and Earnings Per Share
Authorized Shares — On May 27, 2010, the Company's shareholders approved an amendment to the Company's Articles of Incorporation to increase the number of authorized shares of common stock from 30,000,000 to 60,000,000. The additional authorized shares provide the Company greater flexibility for stock splits and stock dividends, issuances under employee benefit plans, financings, corporate mergers and acquisitions, and other general corporate purposes. As of December 31, 2010, the Company also had 10,000,000 authorized shares of preferred stock.
Dividends — Under the Written Agreement we are required to obtain the prior approval of the Federal Reserve Bank of San Francisco and the Director of the Division of Banking Supervision and Regulation of the Federal Reserve to pay any dividends on our common stock or preferred stock.
Series A Preferred Stock — On November 21, 2008, the Company issued 40,000 shares of Series A Fixed Rate Cumulative Perpetual Preferred Stock ("Series A Preferred Stock") to the U.S. Treasury under the terms of the U.S. Treasury Capital Purchase Program for $40.0 million with a liquidation preference of $1,000 per share. The Series A Preferred Stock carries a coupon of 5% for five years and 9% thereafter. The Series A Preferred Stock is non-voting, cumulative, and perpetual and may be redeemed at 100% of its liquidation preference plus accrued and unpaid dividends. In addition, the Company issued a warrant to the U.S. Treasury to purchase 462,963 shares of the Company's common stock. The warrant is exercisable immediately at a price of $12.96 per share, will expire after a period of 10 years from issuance and is transferable by the U.S. Treasury. The U.S. Treasury may transfer a portion or portions of the warrant, and/or exercise the warrant at any time. The U.S. Treasury has agreed not to exercise voting power with respect to any common shares issued to it upon exercise of the warrant. At December 31, 2010, there had been no changes to the number of common shares covered by the warrant nor had the U.S. Treasury exercised any portion of the warrant.
Under the terms of the Capital Purchase Program, the Company is prohibited from increasing dividends above $0.08 per share on its common stock, and from making certain repurchases of equity securities, including its common stock, without the U.S. Treasury's consent. Furthermore, as long as the preferred stock issued to the U.S. Treasury is outstanding, dividend payments and repurchases or redemptions relating to certain equity securities, including the Company's common stock, are prohibited until all accrued and unpaid dividends are paid on the Series A Preferred Stock. As permitted under the terms of the Series A Preferred Stock, The Company suspended the payment of dividends on its Series A Preferred Stock in November 2009. The Company is further restricted from paying dividends on the Series A Preferred Stock under its Written Agreement with its regulators. Under the terms of the Written Agreement, the Company may not pay any dividends on its capital stock, including preferred stock without the prior approval of its regulators. As a result, the Company has accrued but has not paid approximately $2,810,000 and $783,000 in dividends on its Series A Preferred Stock as of December 31, 2010 and 2009, respectively.
On February 15, 2011, HCC suspended payment of dividends on the Series A Preferred Stock for the sixth consecutive quarter, and therefore, the U.S. Treasury has the right to appoint two members to the Company's Board of Directors. If the U.S. Treasury exercises its rights, these directors would serve on the Company's Board of Directors until such time as the Company has paid in full all dividends not previously paid. So long as payment of dividends on the Series A Preferred Stock remain suspended, we may not, among other things and with limited exceptions, pay cash dividends on or repurchase our common stock or preferred stock. As of the date of this filing, the Company has not been advised whether the U.S. Treasury will exercise its rights to elect two members to the Board of Directors and, in the meantime, the U.S
130
HERITAGE COMMERCE CORP
NOTES TO CONSOLIDATED FINANCIAL STATEMENTS (Continued)
Treasury has requested, and the Company has agreed, to permit effective in the first quarter of 2011 an observer employed by the U.S Treasury to attend meetings of the Company's Board of Directors.
Warrants — During 2008, in conjunction with the issuance of the Series A preferred stock, the Company issued a warrant with an initial exercise price of $12.96 per share of common stock, with an allocated fair value of $1,979,000. The estimated fair value of the warrant was recorded as a discount on the Series A Preferred Stock, with an offsetting credit to paid-in-capital. The discount on the preferred stock is being accreted on the effective yield method over five years as a charge to retained earnings, thus reducing net income available to common shareholders. The warrant may be exercised at any time on or before November 21, 2018. The warrant, and all rights under the warrant, are otherwise transferable. As of December 31, 2010, there were 462,963 shares issuable upon exercise of the warrant.
Private Placement — On June 21, 2010, the Company issued to various institutional investors 53,996 shares of Series B Mandatorily Convertible Cumulative Perpetual Preferred Stock ("Series B Preferred Stock") and 21,004 shares of Series C Convertible Perpetual Preferred Stock ("Series C Preferred Stock") for an aggregate purchase price of $75,000,000. The Series B Preferred Stock was mandatorily convertible into common stock, upon approval by the shareholders, at a conversion price of $3.75 per share. The Series C Preferred Stock is mandatorily convertible into common stock at a conversion price of $3.75 per share upon both approval by the shareholders and thereafter, a subsequent transfer of the Series C Preferred Stock to third parties not affiliated with the holder in a widely dispersed offering. The Series B Preferred Stock and the Series C Preferred Stock did not include a beneficial conversion feature, as the conversion price of $3.75 per share was not below the fair market value of the Company's common stock on the commitment date.
At the Company's Special Meeting of shareholders held on September 15, 2010, the Company's shareholders approved the issuance of common stock upon the conversion of the Series B Preferred Stock and upon the conversion of the Series C Preferred Stock. As a result, on September 16, 2010, the Series B Preferred Stock was converted into 14,398,992 shares of common stock of the Company and the shares of Series B Preferred Stock ceased to be outstanding.
The Series C Preferred Stock remains outstanding until it has been converted into common stock in accordance with its terms. The Series C Preferred Stock is non-voting except in the case of certain transactions that would affect the rights of the holders of the Series C Preferred Stock or applicable law. Holders of Series C Preferred Stock will receive dividends if and only to the extent dividends are paid to holders of common stock. The Series C Preferred Stock is not redeemable by the Company or by the holders and has a liquidation preference of $1,000 per share. The Series C Preferred Stock ranks senior to the Company's common stock and ranks on parity with the Company's Series A Preferred Stock.
Earnings (Loss) Per Share — Basic earnings (loss) per common share is computed by dividing net income (loss), less dividends and discount accretion on preferred stock, by the weighted average common shares outstanding. The 21,004 shares of Series C Preferred Stock are convertible into 5,601,000 shares of common stock. The Series C Preferred Stock participates in the earnings of the Company and, therefore, the shares issued on the conversion of the Series C Preferred Stock would be considered outstanding under the two-class method of computing basic earnings per common share during periods of earnings. The shares issued on the conversion of the Series C Preferred Stock are not considered outstanding for the year ended December 31, 2010 due to the net loss allocable to common shareholders during the period. Diluted earnings (loss) per share reflect potential dilution from outstanding stock options and common stock warrants, using the treasury stock method. Due to the Company's net loss in 2010 and 2009, all stock options and warrants were excluded from the computation of diluted earnings (loss) per share. There were 815,865 stock options in 2008 that were considered to be antidilutive and excluded from the computation
131
HERITAGE COMMERCE CORP
NOTES TO CONSOLIDATED FINANCIAL STATEMENTS (Continued)
of diluted earnings per share. For each of the years presented, net income (loss) available to common shareholders is the same for basic and diluted earnings per share. A reconciliation of the weighted average shares used in computing basic and diluted earnings (loss) per common share is as follows:
| |
Year ended December 31, | ||||||||||
|---|---|---|---|---|---|---|---|---|---|---|---|
| |
2010 | 2009 | 2008 | ||||||||
Weighted average common shares outstanding — used in computing basic earnings (loss) per common share |
16,026,058 | 11,820,509 | 12,002,910 | ||||||||
Dilutive effect of stock options and warrants outstanding |
N/A | N/A | 36,866 | ||||||||
Shares used in computing diluted earnings (loss) per common share |
16,026,058 | 11,820,509 | 12,039,776 | ||||||||
Comprehensive Income (Loss) — Comprehensive income (loss) consists of other comprehensive income and net income (loss). Other comprehensive income refers to gains and losses that are included in comprehensive income (loss) but are excluded from net income (loss) because they have been recorded directly in equity under the provisions of other accounting guidance. The following is a summary of the components of other comprehensive (loss) income:
| |
Year ended December 31, | |||||||||||
|---|---|---|---|---|---|---|---|---|---|---|---|---|
| |
2010 | 2009 | 2008 | |||||||||
| |
(Dollars in thousands) |
|||||||||||
Net unrealized holding gains (losses) on available-for-sale securities and I/O strips during the year, |
$ | (2,078 | ) | $ | 505 | $ | 2,641 | |||||
Reclassification adjustment for (gains) realized in income |
(1,955 | ) | (231 | ) | — | |||||||
Less: Deferred (income tax) benefit |
1,693 | (115 | ) | (1,109 | ) | |||||||
Change in unrealized gains (losses) on available-for-sale |
||||||||||||
securities and I/O strips, net of deferred income tax |
(2,340 | ) | 159 | 1,532 | ||||||||
Net pension and other post retirement plan liability adjustment |
418 | 1,312 | (1,615 | ) | ||||||||
Less: Deferred income tax |
(175 | ) | (552 | ) | 680 | |||||||
Change in pension and other post retirement plan liability, net of deferred income tax |
243 | 760 | (935 | ) | ||||||||
Other comprehensive (loss) income |
$ | (2,097 | ) | $ | 919 | $ | 597 | |||||
Accumulated other comprehensive loss consisted of the following items, net of deferred income tax, at December 31:
| |
2010 | 2009 | ||||||
|---|---|---|---|---|---|---|---|---|
| |
(Dollars in thousands) |
|||||||
Net unrealized loss on split-dollar life insurance benefit plan |
$ | (2,112 | ) | $ | (2,801 | ) | ||
Net unrealized loss on defined benefit plan |
(2,026 | ) | (1,580 | ) | ||||
Net unrealized (loss) gain on securities available-for-sale |
(1,699 | ) | 805 | |||||
Net unrealized gain on I/O strips |
1,186 | 1,022 | ||||||
Accumulated other comprehensive loss |
$ | (4,651 | ) | $ | (2,554 | ) | ||
132
HERITAGE COMMERCE CORP
NOTES TO CONSOLIDATED FINANCIAL STATEMENTS (Continued)