Attached files
| file | filename |
|---|---|
| 8-K - FORM 8-K - KANSAS CITY SOUTHERN | ksu-20201117.htm |
Exhibit 99.1 Stephens Investment Conference © KANSAS CITY SOUTHERN KANSAS © November 17th, 2020
Safe Harbor Statement This presentation contains forward-looking statements within the meaning of Section 27A of the Securities Act of 1933, as amended, Section 21E of the Securities Exchange Act of 1934, as amended and the Private Securities Litigation Reform Act of 1995. In addition, management may make forward-looking statements orally or in other writing, including, but not limited to, in press releases, quarterly earnings calls, executive presentations, in the annual report to stockholders and in other filings with the Securities and Exchange Commission. Readers can usually identify these forward-looking statements by the use of such words as "may," "will," "should," "likely," "plans," "projects," "expects," "anticipates," "believes" or similar words. These statements involve a number of risks and uncertainties. Actual results could materially differ from those anticipated by such forward-looking statements as a result of a number of factors or combination of factors including, but not limited: public health threats or outbreaks of communicable diseases, such as the ongoing COVID-19 pandemic and its impact on KCS’s business, suppliers, consumers, customers, employees and supply chains; rail accidents or other incidents or accidents on KCS’s rail network or at KCS’s facilities or customer facilities involving the release of hazardous materials, including toxic inhalation hazards; legislative and regulatory developments and disputes, including environmental regulations; loss of the rail concession of Kansas City Southern’s subsidiary, Kansas City Southern de México, S.A. de C.V.; domestic and international economic, political and social conditions; disruptions to the Company’s technology infrastructure, including its computer systems; increased demand and traffic congestion; the level of trade between the United States and Asia or Mexico; fluctuations in the peso-dollar exchange rate; natural events such as severe weather, hurricanes and floods; the outcome of claims and litigation involving the Company or its subsidiaries; competition and consolidation within the transportation industry; the business environment in industries that produce and use items shipped by rail; the termination of, or failure to renew, agreements with customers, other railroads and third parties; fluctuation in prices or availability of key materials, in particular diesel fuel; access to capital; climate change and the market and regulatory responses to climate change; dependency on certain key suppliers of core rail equipment; changes in securities and capital markets; unavailability of qualified personnel; labor difficulties, including strikes and work stoppages; acts of terrorism or risk of terrorist activities, war or other acts of violence; and other factors affecting the operation of the business; and other risks identified in this presentation, in KCS's Annual Report on Form 10-K for the year ended December 31, 2019, and in other reports filed by KCS with the Securities and Exchange Commission. Forward-looking statements reflect the information only as of the date on which they are made. KCS does not undertake any obligation to update any forward-looking statements to reflect future events, developments, or other information. Reconciliation to U.S. GAAP Financial Information In addition to disclosing financial results in accordance with U.S. GAAP, the accompanying presentation contains non-GAAP financial measures. These non-GAAP measures should be viewed as a supplement to and not a substitute for our U.S. GAAP measures of performance and liquidity, and the financial results calculated in accordance with U.S. GAAP and reconciliations from these results should be carefully evaluated. All reconciliations to the most directly comparable financial measures calculated and presented in accordance with U.S. GAAP can be found on the KCS's website in the Investors section. © KANSAS CITY SOUTHERN KANSAS © 2
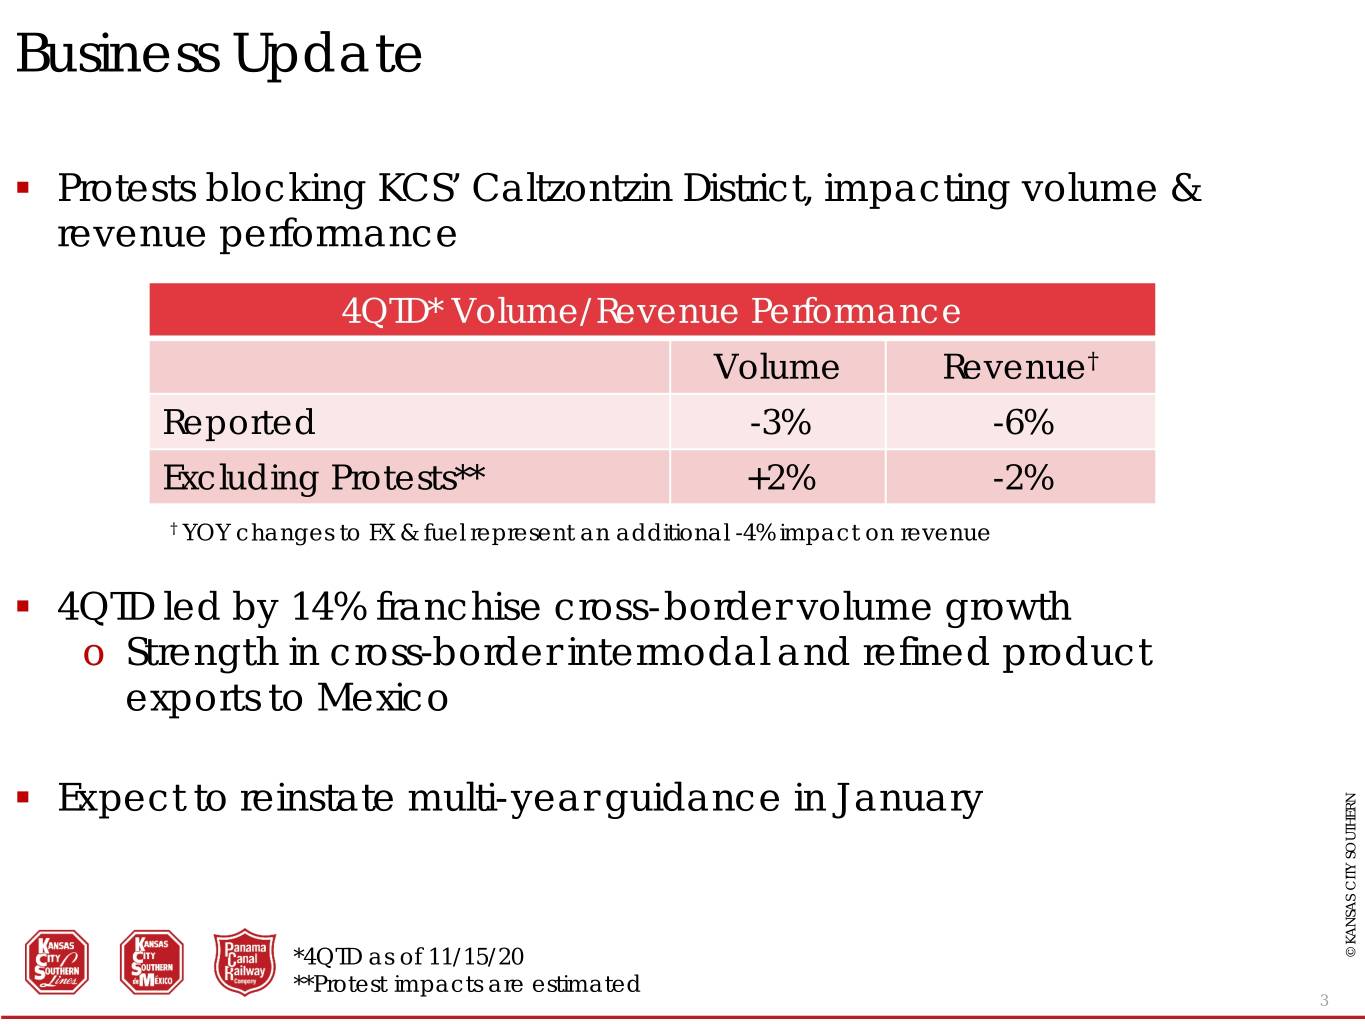
Business Update . Protests blocking KCS’ Caltzontzin District, impacting volume & revenue performance 4QTD* Volume/Revenue Performance Volume Revenue† Reported -3% -6% Excluding Protests** +2% -2% † YOY changes to FX & fuel represent an additional -4% impact on revenue . 4QTD led by 14% franchise cross-border volume growth o Strength in cross-border intermodal and refined product exports to Mexico . Expect to reinstate multi-year guidance in January *4QTD as of 11/15/20 CITY SOUTHERN KANSAS © **Protest impacts are estimated 3
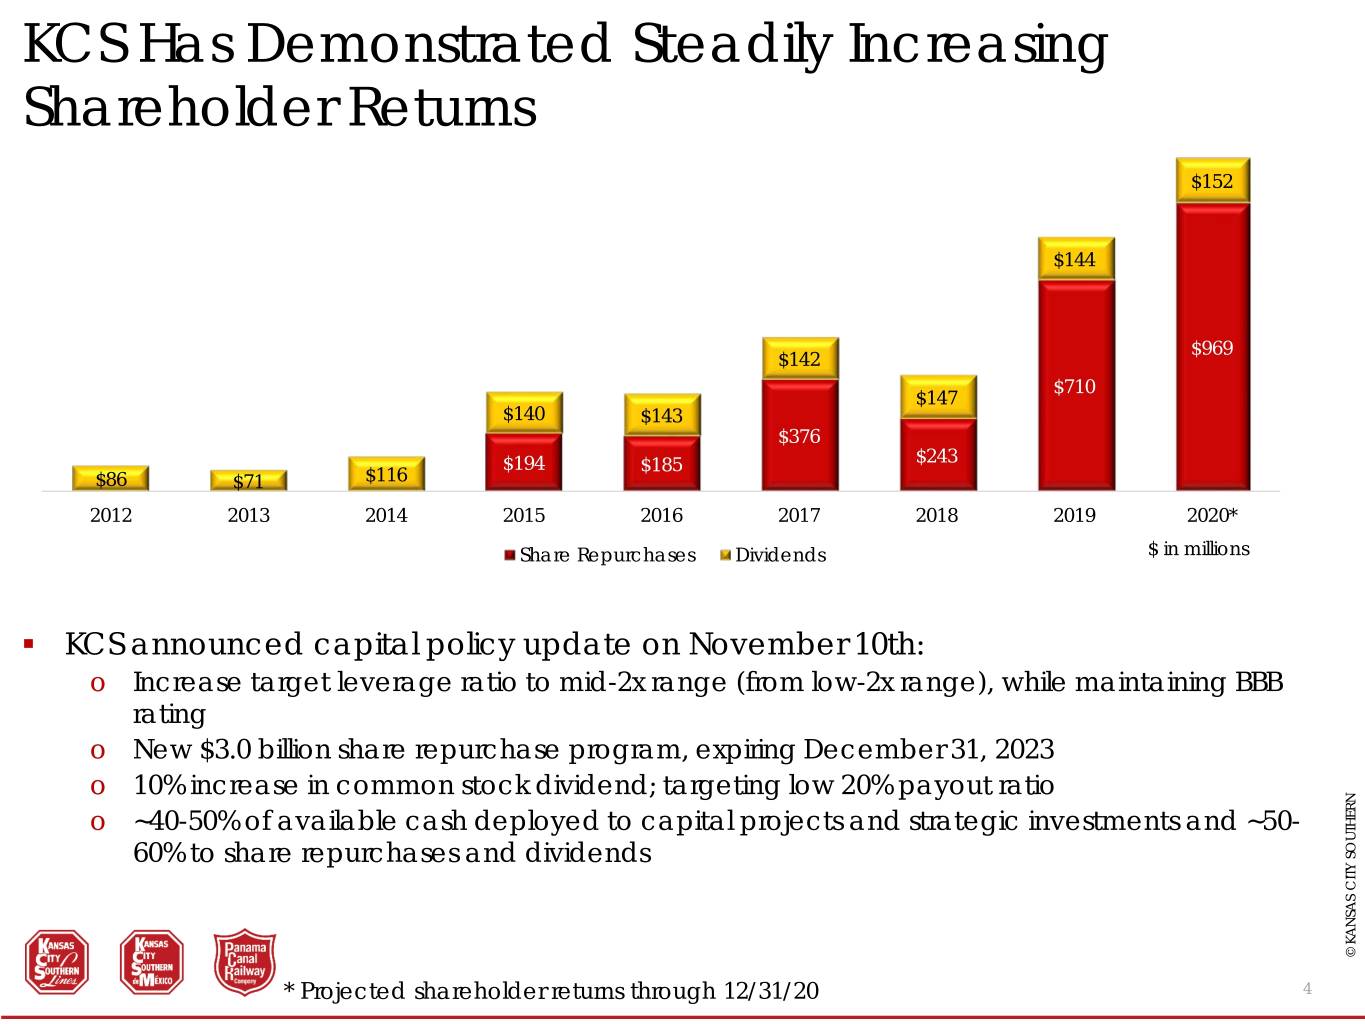
KCS Has Demonstrated Steadily Increasing Shareholder Returns $152 $144 $969 $142 $710 $147 $140 $143 $376 $194 $185 $243 $86 $71 $116 2012 2013 2014 2015 2016 2017 2018 2019 2020* Share Repurchases Dividends $ in millions . KCS announced capital policy update on November 10th: o Increase target leverage ratio to mid-2x range (from low-2x range), while maintaining BBB rating o New $3.0 billion share repurchase program, expiring December 31, 2023 o 10% increase in common stock dividend; targeting low 20% payout ratio o ~40-50% of available cash deployed to capital projects and strategic investments and ~50- 60% to share repurchases and dividends © KANSAS CITY SOUTHERN KANSAS © * Projected shareholder returns through 12/31/20 4
KCS GROWTH PROFILE © KANSAS CITY SOUTHERN KANSAS © 5
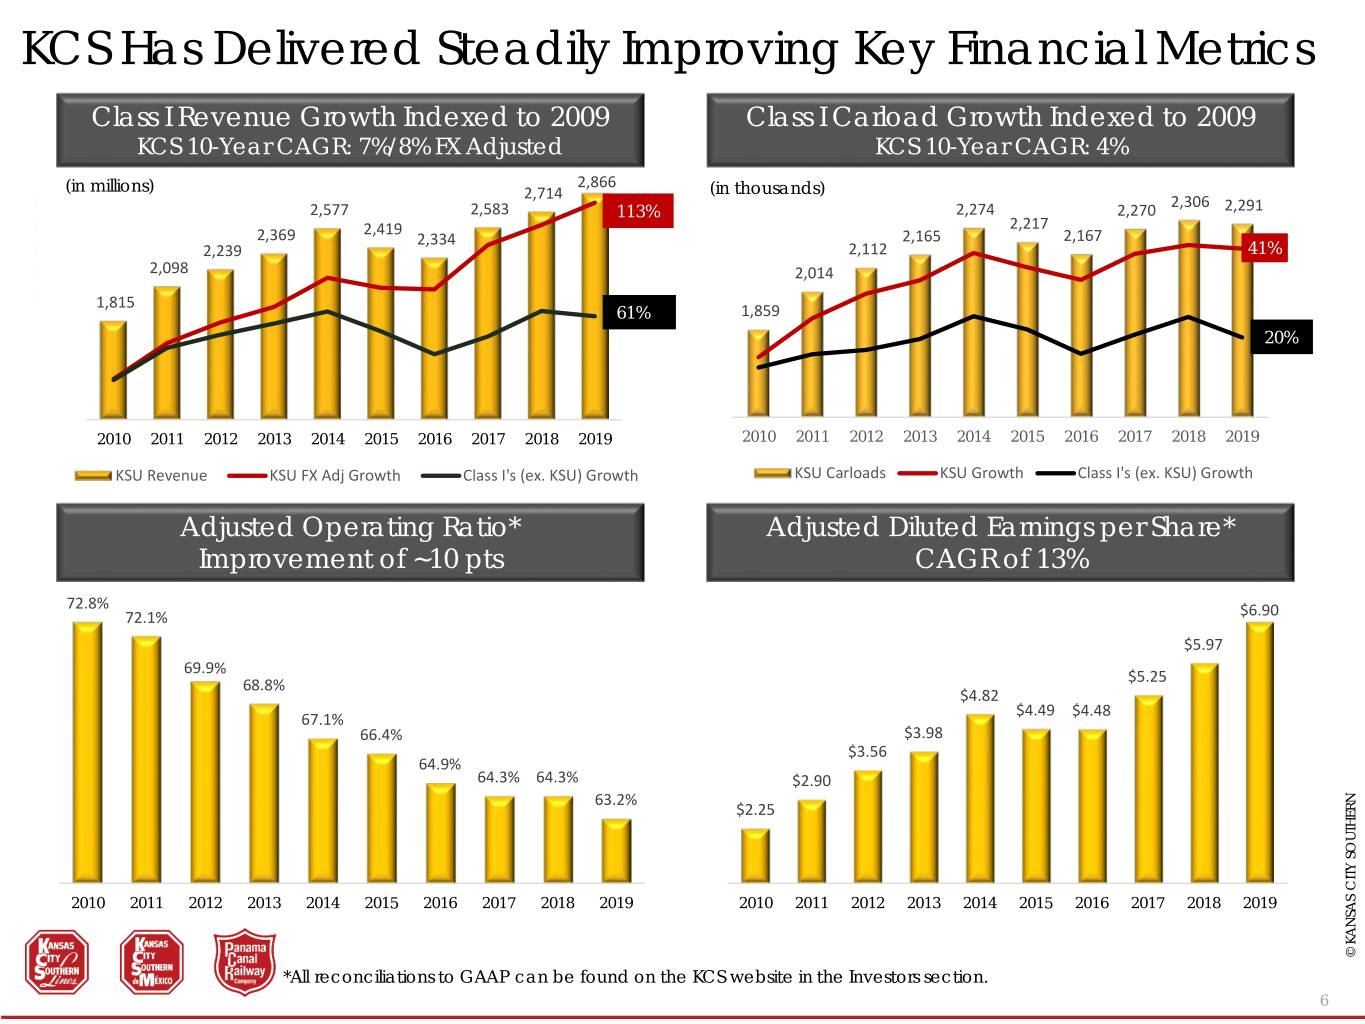
KCS Has Delivered Steadily Improving Key Financial Metrics Class I Revenue Growth Indexed to 2009 Class I Carload Growth Indexed to 2009 KCS 10-Year CAGR: 7%/8% FX Adjusted KCS 10-Year CAGR: 4% 2,866 (in millions) 2,714 120% (in thousands) 2,800 2,306 2,577 2,583 113% 2,274 2,270 2,291 2,600 2,419 100% 2,217 2,369 2,334 2,165 2,167 2,400 2,239 2,112 41% 2,200 2,098 80% 2,014 2,000 1,815 60% 61% 1,859 1,800 1,600 40% 20% 1,400 20% 1,200 1,000 0% 2010 2011 2012 2013 2014 2015 2016 2017 2018 2019 2010 2011 2012 2013 2014 2015 2016 2017 2018 2019 KSU Revenue KSU FX Adj Growth Class I's (ex. KSU) Growth KSU Carloads KSU Growth Class I's (ex. KSU) Growth Adjusted Operating Ratio* Adjusted Diluted Earnings per Share* Improvement of ~10 pts CAGR of 13% 72.8% 72.1% $6.90 $5.97 69.9% $5.25 68.8% $4.82 $4.49 $4.48 67.1% 66.4% $3.98 $3.56 64.9% 64.3% 64.3% $2.90 63.2% $2.25 2010 2011 2012 2013 2014 2015 2016 2017 2018 2019 2010 2011 2012 2013 2014 2015 2016 2017 2018 2019 © KANSAS CITY SOUTHERN KANSAS © *All reconciliations to GAAP can be found on the KCS website in the Investors section. 6
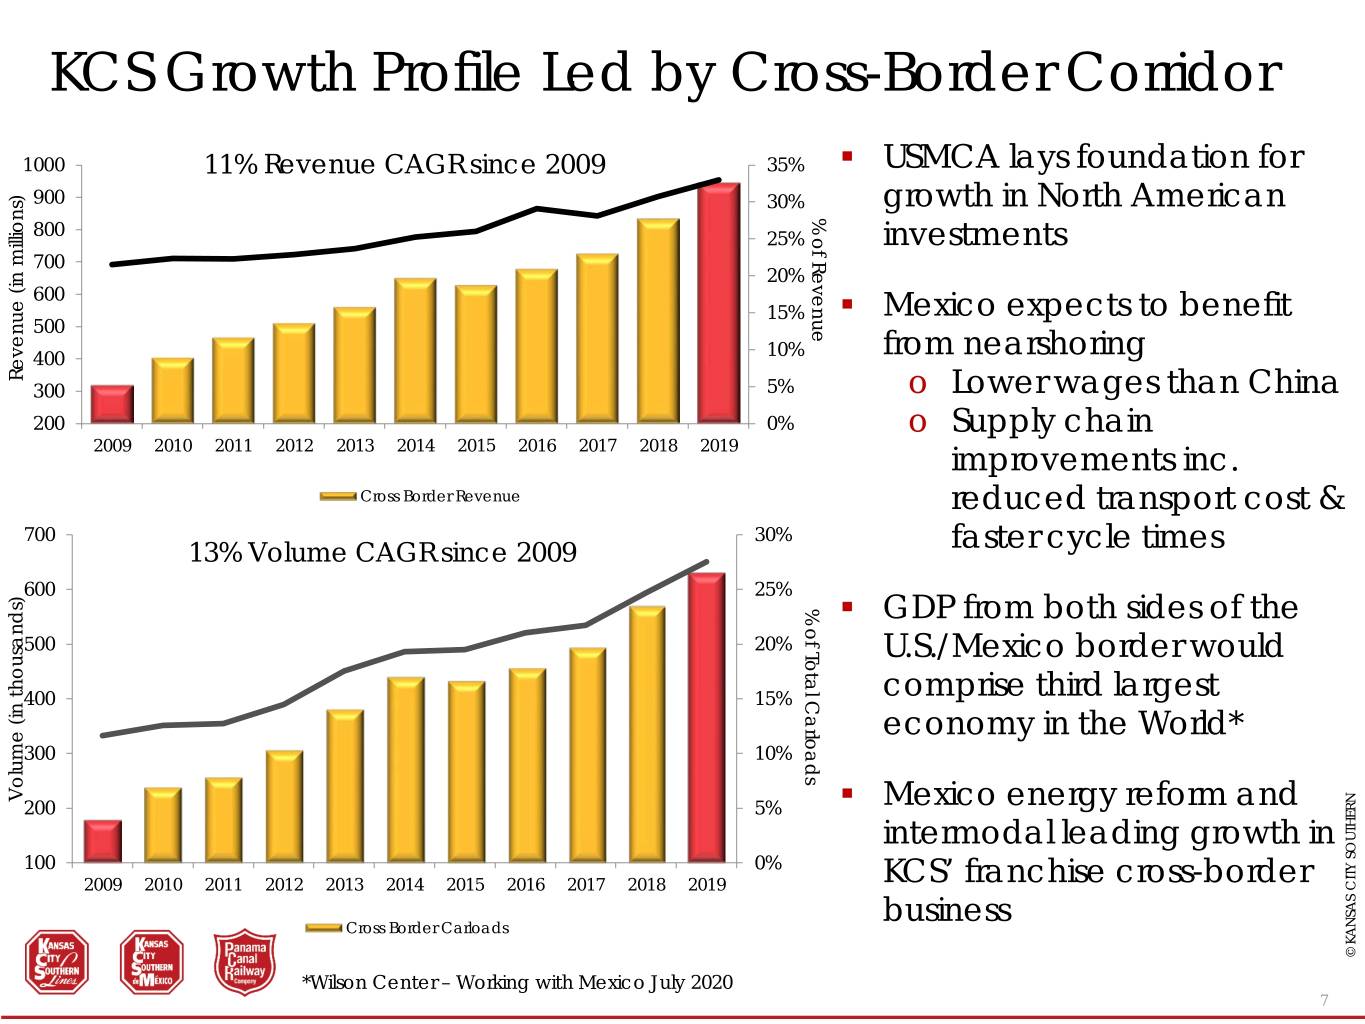
KCS Growth Profile Led by Cross-Border Corridor 1000 11% Revenue CAGR since 2009 35% . USMCA lays foundation for 900 30% growth in North American % of Revenue % of 800 25% investments 700 20% 600 15% . Mexico expects to benefit 500 400 10% from nearshoring Revenue (in millions) (in Revenue 300 5% o Lower wages than China 200 0% o Supply chain 2009 2010 2011 2012 2013 2014 2015 2016 2017 2018 2019 improvements inc. Cross Border Revenue reduced transport cost & 700 30% 13% Volume CAGR since 2009 faster cycle times 600 25% % of Total Carloads Total of % . GDP from both sides of the 500 20% U.S./Mexico border would thousands) 400 15% comprise third largest economy in the World* 300 10% Volume (in 200 5% . Mexico energy reform and intermodal leading growth in 100 0% 2009 2010 2011 2012 2013 2014 2015 2016 2017 2018 2019 KCS’ franchise cross-border Cross Border Carloads business © KANSAS CITY SOUTHERN KANSAS © *Wilson Center – Working with Mexico July 2020 7
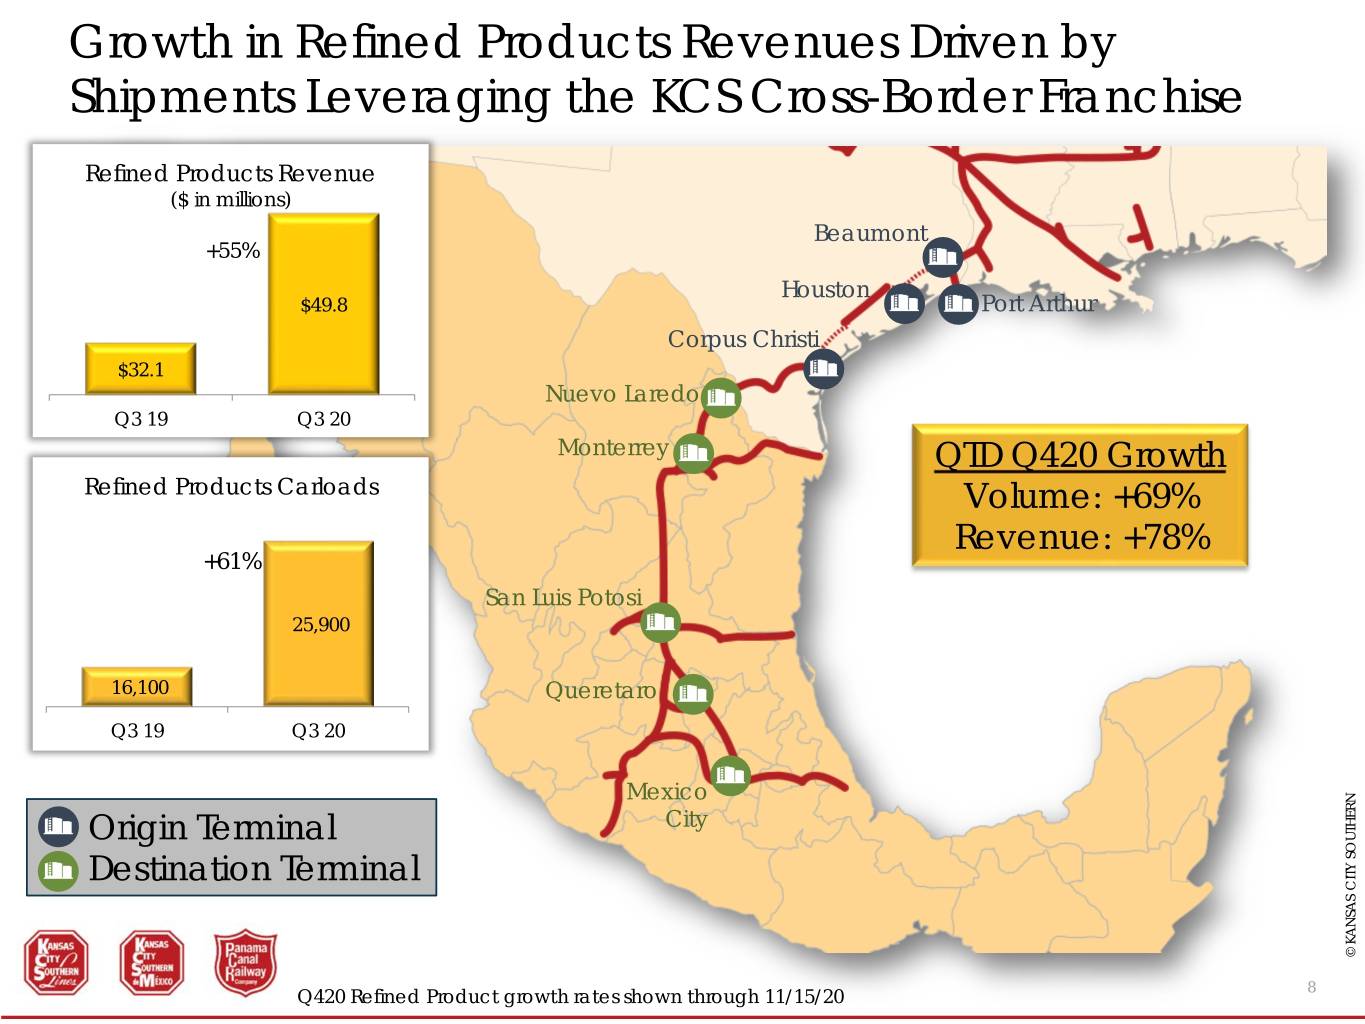
Growth in Refined Products Revenues Driven by Shipments Leveraging the KCS Cross-Border Franchise Refined Products Revenue ($ in millions) Beaumont +55% Houston $49.8 Port Arthur Corpus Christi $32.1 Nuevo Laredo Q3 19 Q3 20 Monterrey QTD Q420 Growth Refined Products Carloads Volume: +69% Revenue: +78% +61% San Luis Potosi 25,900 16,100 Queretaro Q3 19 Q3 20 Mexico Origin Terminal City Destination Terminal © KANSAS CITY SOUTHERN KANSAS © 8 Q420 Refined Product growth rates shown through 11/15/20
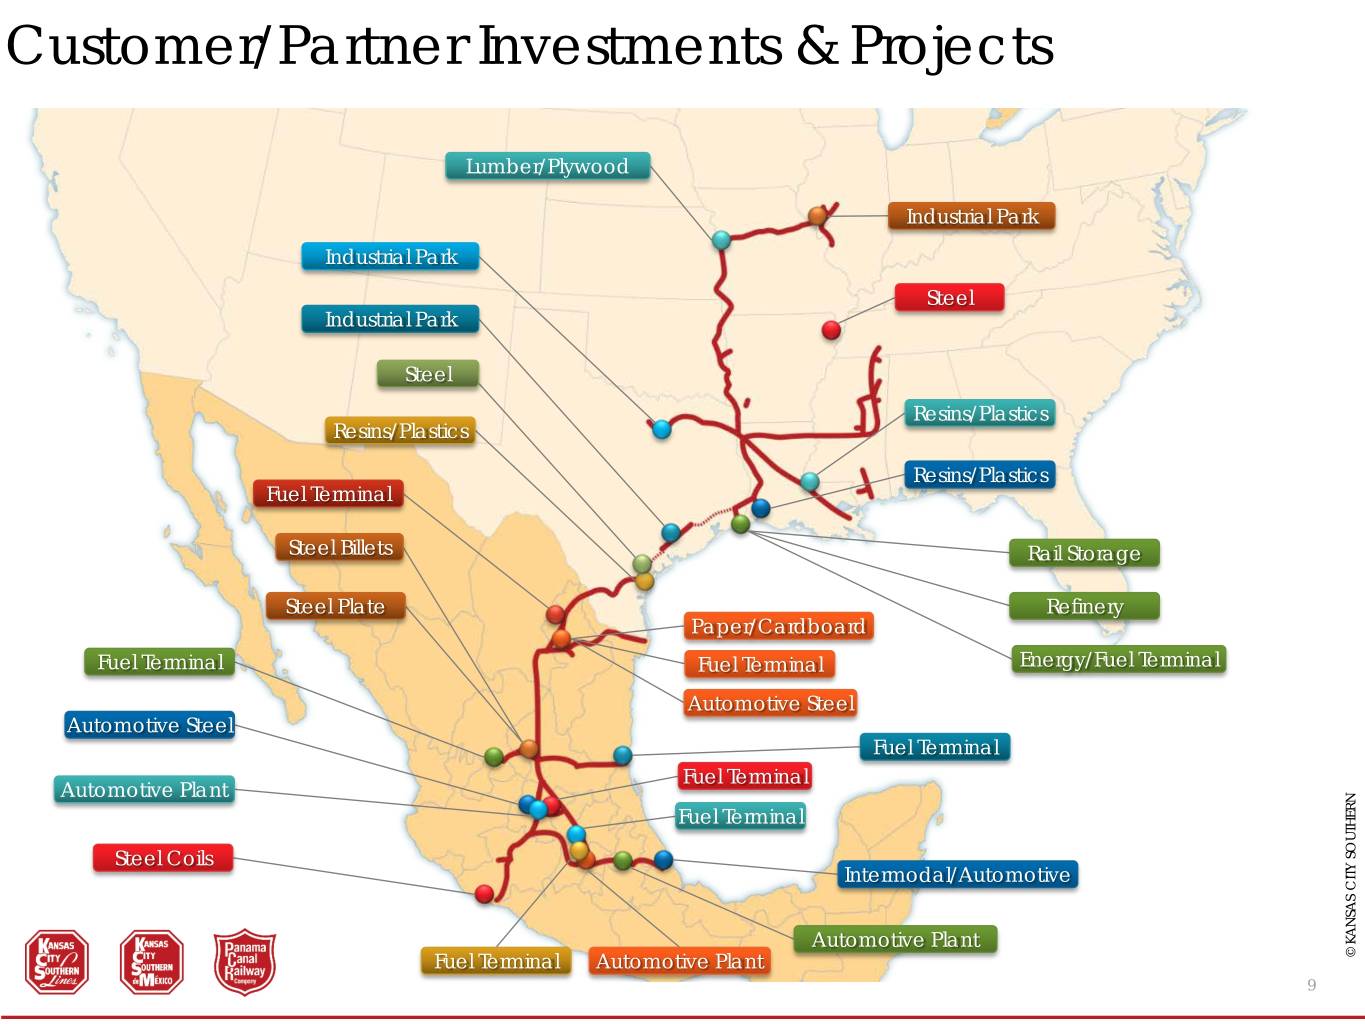
Customer/Partner Investments & Projects Lumber/Plywood Industrial Park Industrial Park Steel Industrial Park Steel Resins/Plastics Resins/Plastics Resins/Plastics Fuel Terminal Steel Billets Rail Storage Steel Plate Refinery Paper/Cardboard Fuel Terminal Fuel Terminal Energy/Fuel Terminal Automotive Steel Automotive Steel Fuel Terminal Fuel Terminal Automotive Plant Fuel Terminal Steel Coils Intermodal/Automotive Automotive Plant Fuel Terminal Automotive Plant CITY SOUTHERN KANSAS © 9

PRECISION SCHEDULED RAILROADING © KANSAS CITY SOUTHERN KANSAS © 10
KCS Top 10 PSR Achievements Record YTD Q320 fuel efficiency of 1.24, a 5% improvement YOY Record Q320 train length of 7,043 feet, a 16% improvement YOY Q320 active loco fleet of 769, down 29% from pre-PSR levels YTD Q320 road locomotive failures down 30% vs. YTD Q319 Q320 active car fleet of ~18,300, down 16% from pre-PSR levels YTD Q320 foreign car cycle times improved by 16% from pre-PSR levels YTD Q320 equipment costs down 22% vs. YTD Q319 Q320 headcount levels down 9% YOY Q320 carloads per crew start up 25% YOY Total PSR program annualized savings of $150M in 2021 © KANSAS CITY SOUTHERN KANSAS © 11
Thank You! www.KCSouthern.com © KANSAS CITY SOUTHERN KANSAS © 12
