Attached files
| file | filename |
|---|---|
| EX-32.2 - PRINCIPAL FINANCIAL OFFICER'S CERTIFICATION - KANSAS CITY SOUTHERN | kcsex32209302014.htm |
| EX-31.2 - PRINCIPAL FINANCIAL OFFICER'S CERTIFICATION - KANSAS CITY SOUTHERN | kcsex31209302014.htm |
| EX-32.1 - PRINCIPAL EXECUTIVE OFFICER'S CERTIFICATION - KANSAS CITY SOUTHERN | kcsex32109302014.htm |
| EXCEL - IDEA: XBRL DOCUMENT - KANSAS CITY SOUTHERN | Financial_Report.xls |
| EX-31.1 - PRINCIPAL EXECUTIVE OFFICER'S CERTIFICATION - KANSAS CITY SOUTHERN | kcsex31109302014.htm |
UNITED STATES
SECURITIES AND EXCHANGE COMMISSION
Washington, D.C. 20549
Form 10-Q
ý | QUARTERLY REPORT PURSUANT TO SECTION 13 OR 15(d) OF THE SECURITIES EXCHANGE ACT OF 1934 |
For the quarterly period ended September 30, 2014 | |
or
¨ | TRANSITION REPORT PURSUANT TO SECTION 13 OR 15(d) OF THE SECURITIES EXCHANGE ACT OF 1934 |
For the transition period from to | |
Commission File Number 1-4717
KANSAS CITY SOUTHERN
(Exact name of registrant as specified in its charter)
Delaware |  | 44-0663509 | ||
(State or other jurisdiction of incorporation or organization) | (I.R.S. Employer Identification No.) | |||
427 West 12th Street, Kansas City, Missouri | 64105 | |||
(Address of principal executive offices) | (Zip Code) | |||
816.983.1303
(Registrant’s telephone number, including area code)
No Change
(Former name, former address and former fiscal year, if changed since last report.)
____________________________________________________
Indicate by check mark whether the registrant (1) has filed all reports required to be filed by Section 13 or 15(d) of the Securities Exchange Act of 1934 during the preceding 12 months (or for such shorter period that the registrant was required to file such reports), and (2) has been subject to such filing requirements for the past 90 days. Yes ý No ¨
Indicate by check mark whether the registrant has submitted electronically and posted on its corporate Web site, if any, every Interactive Data File required to be submitted and posted pursuant to Rule 405 of Regulation S-T during the preceding 12 months (or for such shorter period that the registrant was required to submit and post such files). Yes ý No ¨
Indicate by check mark whether the registrant is a large accelerated filer, an accelerated filer, a non-accelerated filer, or a smaller reporting company. See the definitions of “large accelerated filer,” “accelerated filer” and “smaller reporting company” in Rule 12b-2 of the Exchange Act. (Check one):
Large accelerated filer ý Accelerated filer ¨ Non-accelerated filer ¨ Smaller reporting company ¨
(Do not check if a smaller reporting company)
Indicate by check mark whether the registrant is a shell company (as defined in Rule 12b-2 of the Exchange Act). Yes ¨ No ý
Indicate the number of shares outstanding of each of the issuer’s classes of common stock, as of the latest practicable date.
Class | October 10, 2014 | |
Common Stock, $0.01 per share par value | 110,360,358 Shares | |
Kansas City Southern and Subsidiaries
Form 10-Q
September 30, 2014
Index
Page | ||
PART I — FINANCIAL INFORMATION | ||
Item 1. | ||
Item 2. | ||
Item 3. | ||
Item 4. | ||
PART II — OTHER INFORMATION | ||
Item 1. | ||
Item 1A. | ||
Item 2. | ||
Item 3. | ||
Item 4. | ||
Item 5. | ||
Item 6. | ||
2
Kansas City Southern and Subsidiaries
Form 10-Q
September 30, 2014
PART I — FINANCIAL INFORMATION
Item 1. | Financial Statements |
Introductory Comments
The unaudited consolidated financial statements included herein have been prepared by Kansas City Southern pursuant to the rules and regulations of the Securities and Exchange Commission (“SEC”). As used herein, “KCS” or the “Company” may refer to Kansas City Southern or, as the context requires, to one or more subsidiaries of Kansas City Southern. Certain information and footnote disclosures normally included in financial statements prepared in accordance with U.S. generally accepted accounting principles (“U.S. GAAP”) have been condensed or omitted pursuant to such rules and regulations. The Company believes that the disclosures are adequate to enable a reasonable understanding of the information presented. The Consolidated Financial Statements and Management’s Discussion and Analysis of Financial Condition and Results of Operations included in this Form 10-Q should be read in conjunction with the consolidated financial statements and the related notes, as well as Management’s Discussion and Analysis of Financial Condition and Results of Operations, included in the Company’s Annual Report on Form 10-K for the year ended December 31, 2013. Results for the three and nine months ended September 30, 2014, are not necessarily indicative of the results expected for the full year ending December 31, 2014.
3
Kansas City Southern and Subsidiaries
Consolidated Statements of Income
Three Months Ended | Nine Months Ended | ||||||||||||||
September 30, | September 30, | ||||||||||||||
2014 | 2013 | 2014 | 2013 | ||||||||||||
(In millions, except share and per share amounts) (Unaudited) | |||||||||||||||
Revenues | $ | 677.5 | $ | 621.6 | $ | 1,934.6 | $ | 1,753.7 | |||||||
Operating expenses: | |||||||||||||||
Compensation and benefits | 125.2 | 111.4 | 351.3 | 328.4 | |||||||||||
Purchased services | 64.2 | 57.2 | 183.2 | 160.4 | |||||||||||
Fuel | 109.2 | 102.7 | 320.8 | 286.6 | |||||||||||
Equipment costs | 28.4 | 39.5 | 89.6 | 120.0 | |||||||||||
Depreciation and amortization | 65.0 | 57.2 | 190.8 | 165.0 | |||||||||||
Materials and other | 56.1 | 53.3 | 165.4 | 150.8 | |||||||||||
Lease termination costs | — | — | 38.3 | — | |||||||||||
Total operating expenses | 448.1 | 421.3 | 1,339.4 | 1,211.2 | |||||||||||
Operating income | 229.4 | 200.3 | 595.2 | 542.5 | |||||||||||
Equity in net earnings of unconsolidated affiliates | 5.0 | 4.8 | 16.6 | 13.8 | |||||||||||
Interest expense | (17.9 | ) | (18.3 | ) | (54.5 | ) | (61.2 | ) | |||||||
Debt retirement costs | — | (2.4 | ) | (6.6 | ) | (113.8 | ) | ||||||||
Foreign exchange loss | (12.5 | ) | (1.4 | ) | (4.1 | ) | (10.1 | ) | |||||||
Other expense, net | (0.4 | ) | (0.7 | ) | (3.7 | ) | (0.5 | ) | |||||||
Income before income taxes | 203.6 | 182.3 | 542.9 | 370.7 | |||||||||||
Income tax expense | 65.2 | 63.3 | 180.3 | 131.8 | |||||||||||
Net income | 138.4 | 119.0 | 362.6 | 238.9 | |||||||||||
Less: Net income attributable to noncontrolling interest | 0.3 | 0.6 | 1.0 | 1.3 | |||||||||||
Net income attributable to Kansas City Southern and subsidiaries | 138.1 | 118.4 | 361.6 | 237.6 | |||||||||||
Preferred stock dividends | 0.1 | 0.1 | 0.2 | 0.2 | |||||||||||
Net income available to common stockholders | $ | 138.0 | $ | 118.3 | $ | 361.4 | $ | 237.4 | |||||||
Earnings per share: | |||||||||||||||
Basic earnings per share | $ | 1.25 | $ | 1.08 | $ | 3.28 | $ | 2.16 | |||||||
Diluted earnings per share | $ | 1.25 | $ | 1.07 | $ | 3.27 | $ | 2.15 | |||||||
Average shares outstanding (in thousands): | |||||||||||||||
Basic | 110,182 | 110,003 | 110,141 | 109,956 | |||||||||||
Potentially dilutive common shares | 259 | 370 | 271 | 361 | |||||||||||
Diluted | 110,441 | 110,373 | 110,412 | 110,317 | |||||||||||
See accompanying notes to consolidated financial statements.
4
Kansas City Southern and Subsidiaries
Consolidated Statements of Comprehensive Income
Three Months Ended | Nine Months Ended | ||||||||||||||
September 30, | September 30, | ||||||||||||||
2014 | 2013 | 2014 | 2013 | ||||||||||||
(In millions) (Unaudited) | |||||||||||||||
Net income | $ | 138.4 | $ | 119.0 | $ | 362.6 | $ | 238.9 | |||||||
Other comprehensive income (loss): | |||||||||||||||
Unrealized loss on cash flow hedges arising during the period, net of tax of less than $(0.1) million | — | (0.1 | ) | — | (0.2 | ) | |||||||||
Reclassification adjustment from cash flow hedges included in net income, net of tax of $0.1 million and $0.3 million, respectively | — | 0.1 | — | 0.6 | |||||||||||
Amortization of prior service credit, net of tax of $(0.1) million | (0.1 | ) | — | (0.1 | ) | (0.1 | ) | ||||||||
Foreign currency translation adjustments, net of tax of $(0.2) million | (0.2 | ) | — | (0.2 | ) | — | |||||||||
Other comprehensive income (loss) | (0.3 | ) | — | (0.3 | ) | 0.3 | |||||||||
Comprehensive income | 138.1 | 119.0 | 362.3 | 239.2 | |||||||||||
Less: Comprehensive income attributable to noncontrolling interest | 0.3 | 0.6 | 1.0 | 1.3 | |||||||||||
Comprehensive income attributable to Kansas City Southern and subsidiaries | $ | 137.8 | $ | 118.4 | $ | 361.3 | $ | 237.9 | |||||||
See accompanying notes to consolidated financial statements.
5
Kansas City Southern and Subsidiaries
Consolidated Balance Sheets
September 30, 2014 | December 31, 2013 | ||||||
(In millions, except share and per share amounts) | |||||||
(Unaudited) | |||||||
ASSETS | |||||||
Current assets: | |||||||
Cash and cash equivalents | $ | 285.8 | $ | 429.5 | |||
Accounts receivable, net | 208.5 | 198.3 | |||||
Materials and supplies | 122.8 | 121.3 | |||||
Deferred income taxes | 115.4 | 131.6 | |||||
Other current assets | 47.8 | 61.7 | |||||
Total current assets | 780.3 | 942.4 | |||||
Investments | 43.3 | 41.1 | |||||
Restricted funds | — | 4.2 | |||||
Property and equipment (including concession assets), net | 6,909.4 | 6,356.3 | |||||
Other assets | 84.0 | 91.4 | |||||
Total assets | $ | 7,817.0 | $ | 7,435.4 | |||
LIABILITIES AND EQUITY | |||||||
Current liabilities: | |||||||
Debt due within one year | $ | 24.8 | $ | 332.0 | |||
Commercial paper | 312.0 | — | |||||
Accounts payable and accrued liabilities | 424.1 | 398.6 | |||||
Total current liabilities | 760.9 | 730.6 | |||||
Long-term debt | 1,846.1 | 1,856.9 | |||||
Deferred income taxes | 1,128.0 | 1,044.6 | |||||
Other noncurrent liabilities and deferred credits | 128.9 | 126.7 | |||||
Total liabilities | 3,863.9 | 3,758.8 | |||||
Commitments and contingencies | — | — | |||||
Stockholders’ equity: | |||||||
$25 par, 4% noncumulative, preferred stock, 840,000 shares authorized, 649,736 shares issued, 242,170 shares outstanding | 6.1 | 6.1 | |||||
$.01 par, common stock, 400,000,000 shares authorized; 123,352,185 shares issued; 110,360,558 and 110,229,229 shares outstanding at September 30, 2014 and December 31, 2013, respectively | 1.1 | 1.1 | |||||
Additional paid-in capital | 949.6 | 942.5 | |||||
Retained earnings | 2,691.6 | 2,422.9 | |||||
Accumulated other comprehensive loss | (2.3 | ) | (2.0 | ) | |||
Total stockholders’ equity | 3,646.1 | 3,370.6 | |||||
Noncontrolling interest | 307.0 | 306.0 | |||||
Total equity | 3,953.1 | 3,676.6 | |||||
Total liabilities and equity | $ | 7,817.0 | $ | 7,435.4 | |||
See accompanying notes to consolidated financial statements.
6
Kansas City Southern and Subsidiaries
Consolidated Statements of Cash Flows
Nine Months Ended | |||||||
September 30, | |||||||
2014 | 2013 | ||||||
(In millions) (Unaudited) | |||||||
Operating activities: | |||||||
Net income | $ | 362.6 | $ | 238.9 | |||
Adjustments to reconcile net income to net cash provided by operating activities: | |||||||
Depreciation and amortization | 190.8 | 165.0 | |||||
Deferred income taxes | 96.6 | 86.9 | |||||
Equity in net earnings of unconsolidated affiliates | (16.6 | ) | (13.8 | ) | |||
Share-based compensation | 6.2 | 11.3 | |||||
Excess tax benefit from share-based compensation | (3.0 | ) | (3.7 | ) | |||
Distributions from unconsolidated affiliates | 15.8 | 6.5 | |||||
Debt retirement costs | 6.6 | 113.8 | |||||
Changes in working capital items: | |||||||
Accounts receivable | (8.5 | ) | (28.8 | ) | |||
Materials and supplies | (0.6 | ) | (7.0 | ) | |||
Other current assets | 9.5 | (16.9 | ) | ||||
Accounts payable and accrued liabilities | 32.9 | 16.5 | |||||
Other, net | (10.5 | ) | 3.8 | ||||
Net cash provided by operating activities | 681.8 | 572.5 | |||||
Investing activities: | |||||||
Capital expenditures | (403.5 | ) | (381.8 | ) | |||
Purchase or replacement of equipment under operating leases | (302.2 | ) | (155.1 | ) | |||
Property investments in MSLLC | (25.6 | ) | (25.0 | ) | |||
Proceeds from disposal of property | 6.2 | 6.2 | |||||
Other, net | 2.3 | (8.1 | ) | ||||
Net cash used for investing activities | (722.8 | ) | (563.8 | ) | |||
Financing activities: | |||||||
Proceeds from commercial paper | 11,502.7 | — | |||||
Repayment of commercial paper | (11,191.8 | ) | — | ||||
Proceeds from issuance of long-term debt | 175.0 | 1,468.7 | |||||
Repayment of long-term debt | (502.8 | ) | (1,301.8 | ) | |||
Dividends paid | (85.7 | ) | (47.6 | ) | |||
Debt costs | (4.4 | ) | (109.3 | ) | |||
Excess tax benefit from share-based compensation | 3.0 | 3.7 | |||||
Proceeds from employee stock plans | 1.3 | 0.9 | |||||
Net cash provided by (used for) financing activities | (102.7 | ) | 14.6 | ||||
Cash and cash equivalents: | |||||||
Net increase (decrease) during each period | (143.7 | ) | 23.3 | ||||
At beginning of year | 429.5 | 72.6 | |||||
At end of period | $ | 285.8 | $ | 95.9 | |||
See accompanying notes to consolidated financial statements.
7
Kansas City Southern and Subsidiaries
Notes to Consolidated Financial Statements
1. Accounting Policies, Interim Financial Statements and Basis of Presentation
In the opinion of the management of KCS, the accompanying unaudited consolidated financial statements contain all adjustments necessary for a fair presentation of the results for interim periods. All adjustments made were of a normal and recurring nature. Certain information and note disclosures normally included in financial statements prepared in accordance with U.S. GAAP have been condensed or omitted. These consolidated financial statements should be read in conjunction with the consolidated financial statements and accompanying notes included in the Company’s Annual Report on Form 10-K for the year ended December 31, 2013. The results of operations for the three and nine months ended September 30, 2014, are not necessarily indicative of the results to be expected for the full year ending December 31, 2014.
Effective January 1, 2014, the Company adopted, on a prospective basis, ASU No. 2013-11, Income Taxes, issued by the Financial Accounting Standards Board (FASB), related to the presentation of an unrecognized tax benefit when a net operating loss carryforward, a similar tax loss, or a tax credit carryforward exists. The guidance requires, unless certain conditions exist, an unrecognized tax benefit, or a portion of an unrecognized tax benefit, to be presented in the financial statements as a reduction to a deferred tax asset for a net operating loss carryforward, similar tax loss, or a tax credit carryforward. If a net operating loss carryforward, a similar tax loss, or a tax credit carryforward is not available at the reporting date, the unrecognized tax benefit should be presented in the financial statements as a liability and should not be combined with deferred tax assets. The adoption of this guidance did not have a material impact on the Company’s consolidated financial statements.
In May 2014, the FASB issued ASU No. 2014-09, Revenue from Contracts with Customers, which requires companies to recognize revenue to depict the transfer of promised goods or services to customers in an amount that reflects the consideration it expects to be entitled in exchange for those goods or services. The standard will be effective for the Company beginning in the first quarter of 2017 and early adoption is not permitted. The new standard permits the use of either the retrospective or cumulative effect transition method on adoption. The adoption of this guidance is not expected to have a material impact on the Company’s consolidated financial statements.
2. Earnings Per Share Data
Basic earnings per common share is computed by dividing net income available to common stockholders by the weighted-average number of common shares outstanding for the period. Diluted earnings per share adjusts basic earnings per common share for the effects of potentially dilutive common shares, if the effect is not anti-dilutive. Potentially dilutive common shares include the dilutive effects of shares issuable under the stock option and performance award plans.
The following table reconciles the basic earnings per share computation to the diluted earnings per share computation (in millions, except share and per share amounts):
Three Months Ended | Nine Months Ended | ||||||||||||||
September 30, | September 30, | ||||||||||||||
2014 | 2013 | 2014 | 2013 | ||||||||||||
Net income available to common stockholders for purposes of computing basic and diluted earnings per share | $ | 138.0 | $ | 118.3 | $ | 361.4 | $ | 237.4 | |||||||
Weighted-average number of shares outstanding (in thousands): | |||||||||||||||
Basic shares | 110,182 | 110,003 | 110,141 | 109,956 | |||||||||||
Effect of dilution | 259 | 370 | 271 | 361 | |||||||||||
Diluted shares | 110,441 | 110,373 | 110,412 | 110,317 | |||||||||||
Earnings per share: | |||||||||||||||
Basic earnings per share | $ | 1.25 | $ | 1.08 | $ | 3.28 | $ | 2.16 | |||||||
Diluted earnings per share | $ | 1.25 | $ | 1.07 | $ | 3.27 | $ | 2.15 | |||||||
Potentially dilutive shares excluded from the calculation (in thousands): | |||||||||||||||
Stock options excluded as their inclusion would be anti-dilutive | — | — | 76 | 74 | |||||||||||
8
Kansas City Southern and Subsidiaries
Notes to Consolidated Financial Statements—(Continued)
3. Lease Termination Costs
During the nine months ended September 30, 2014, the Company purchased $300.8 million of equipment under existing operating leases and replacement equipment as certain operating leases expired. These purchases were primarily funded with proceeds from the senior notes issued during the fourth quarter of 2013. For the nine months ended September 30, 2014, the Company recognized $38.3 million of lease termination costs (included in operating expenses) due to the early termination of certain operating leases and the related purchase of the equipment. The Company did not incur lease termination costs during the third quarter of 2014.
4. Property and Equipment (including Concession Assets)
Property and equipment, including concession assets, and related accumulated depreciation and amortization are summarized below (in millions):
September 30, 2014 | December 31, 2013 | ||||||
Land | $ | 216.3 | $ | 216.4 | |||
Concession land rights | 141.2 | 141.2 | |||||
Road property | 6,206.9 | 5,955.7 | |||||
Equipment | 1,862.5 | 1,436.2 | |||||
Technology and other | 153.9 | 152.8 | |||||
Construction in progress | 173.4 | 171.4 | |||||
Total property | 8,754.2 | 8,073.7 | |||||
Accumulated depreciation and amortization | 1,844.8 | 1,717.4 | |||||
Property and equipment (including concession assets), net | $ | 6,909.4 | $ | 6,356.3 | |||
Concession assets, net of accumulated amortization of $466.3 million and $444.1 million, totaled $1,983.2 million and $1,951.0 million at September 30, 2014 and December 31, 2013, respectively.
5. Fair Value Measurements
Assets and liabilities recognized at fair value are required to be classified into a three-level hierarchy. In general, fair values determined by Level 1 inputs utilize quoted prices (unadjusted) in active markets for identical assets or liabilities that the Company has the ability to access. Level 2 inputs include quoted prices for similar assets and liabilities in active markets, and inputs other than quoted prices that are observable for the asset or liability. Level 3 inputs are unobservable inputs for the asset or liability, and include situations where there is little, if any, market activity for the asset or liability. In certain cases, the inputs used to measure fair value may fall into different levels of the fair value hierarchy. In such cases, the level in the fair value hierarchy within which the fair value measurement in its entirety falls has been determined based on the lowest level input that is significant to the fair value measurement in its entirety. The Company’s assessment of the significance of a particular input to the fair value in its entirety requires judgment and considers factors specific to the asset or liability.
The Company’s derivative financial instruments are measured at fair value on a recurring basis and consist of foreign currency forward contracts, which are classified as Level 2 instruments. The Company determines the fair value of its derivative financial instrument positions based upon pricing models using inputs observed from actively quoted markets and also takes into consideration the contract terms as well as other inputs, including market currency exchange rates. The fair value of the foreign currency forward contract liabilities was $1.4 million as of September 30, 2014. There were no outstanding foreign currency forward contracts as of December 31, 2013.
The Company’s short-term financial instruments include cash and cash equivalents, accounts receivable, accounts payable and commercial paper obligations. The carrying value of the short-term financial instruments approximates their fair value.
The fair value of the Company’s debt is estimated using quoted market prices when available. When quoted market prices are not available, fair value is estimated based on current market interest rates for debt with similar maturities and credit quality. The fair value of the Company’s debt was $1,856.5 million and $2,082.9 million at September 30, 2014 and December 31, 2013, respectively. The carrying value was $1,870.9 million and $2,188.9 million at September 30, 2014 and December 31, 2013, respectively. If the Company’s debt were measured at fair value, the fair value measurements of the individual debt instruments would have been classified as either Level 1 or Level 2 in the fair value hierarchy.
9
Kansas City Southern and Subsidiaries
Notes to Consolidated Financial Statements—(Continued)
6. Derivative Instruments
The Company enters into derivative transactions in certain situations based on management’s assessment of current market conditions and perceived risks. Management intends to respond to evolving business and market conditions and in doing so, may enter into such transactions as deemed appropriate.
Credit Risk. As a result of the use of derivative instruments, the Company is exposed to counterparty credit risk. The Company manages this risk by limiting its counterparties to large financial institutions which meet the Company’s credit rating standards and have an established banking relationship with the Company. As of September 30, 2014, the Company did not expect any losses as a result of default of its counterparties.
Foreign Currency Forward Contracts. The Company’s Mexican subsidiaries have net U.S. dollar-denominated liabilities (primarily debt) which, for Mexican income tax purposes, are subject to periodic revaluation based on changes in the value of the Mexican peso against the U.S. dollar. This revaluation creates fluctuations in the Company’s Mexican income tax expense and the amount of income taxes paid in Mexico. The Company enters into foreign currency forward contracts to hedge its exposure to this risk. In the first quarter of 2014, the Company entered into foreign currency forward contracts with an aggregate notional amount of $345.0 million. These contracts mature on December 31, 2014, and obligate the Company to purchase a total of Ps.4,642.5 million at a weighted-average exchange rate of Ps.13.46 to each U.S. dollar. In the first half of 2013, the Company entered into foreign currency forward contracts with an aggregate notional amount of $325.0 million maturing on December 31, 2013. These contracts obligated the Company to purchase a total of Ps.4,202.3 million at a weighted-average exchange rate of Ps.12.93 to each U.S. dollar. The Company has not designated any of the foreign currency forward contracts as hedging instruments for accounting purposes. The Company measures the foreign currency forward contracts at fair value each period and recognizes any change in fair value in foreign exchange loss within the consolidated statements of income.
The following table presents the fair value of derivative instruments included in the consolidated balance sheets (in millions):
Derivative Liabilities | |||||||||
Balance Sheet Location | September 30, 2014 | December 31, 2013 | |||||||
Derivatives not designated as hedging instruments: | |||||||||
Foreign currency forward contracts | Accounts payable and accrued liabilities | $ | 1.4 | $ | — | ||||
Total derivative liabilities | $ | 1.4 | $ | — | |||||
The following table presents the amounts included in the consolidated statements of income (in millions):
Location of Gain/(Loss) Recognized in Income on Derivative | Amount of Gain/(Loss) Recognized in Income on Derivative | |||||||||||||||||||||
Three months ended | Nine months ended | |||||||||||||||||||||
September 30, | September 30, | |||||||||||||||||||||
Derivatives not designated as hedging instruments: | 2014 | 2013 | 2014 | 2013 | ||||||||||||||||||
Foreign currency forward contracts | Foreign exchange loss | $ | (10.1 | ) | $ | (1.3 | ) | $ | (1.4 | ) | $ | (6.3 | ) | |||||||||
Total | $ | (10.1 | ) | $ | (1.3 | ) | $ | (1.4 | ) | $ | (6.3 | ) | ||||||||||
10
Kansas City Southern and Subsidiaries
Notes to Consolidated Financial Statements—(Continued)
7. Long-Term Debt
KCSR Credit Agreement Amendment. On January 30, 2014, the Company and The Kansas City Southern Railway Company (“KCSR”), a wholly-owned subsidiary of KCS, entered into agreements to establish a $450.0 million commercial paper program for KCSR (the “KCSR Commercial Paper Program”). Also on January 30, 2014, the Company, KCSR and certain other subsidiaries of the Company that guaranty the 2012 KCSR credit agreement entered into an amendment to the 2012 KCSR credit agreement which eliminated certain representations as a condition to borrowing under the revolving credit facility (the “KCSR Revolving Facility”), provided for the prepayment of all outstanding term loans (the “Term Loan”) under the 2012 KCSR credit agreement on or before February 13, 2014, and increased the borrowing capacity under the KCSR Revolving Facility to $450.0 million. The KCSR Revolving Facility serves as a backstop for the KCSR Commercial Paper Program, which generally serves as KCSR’s primary means of short-term funding.
KCSM Credit Agreement Amendment. On January 30, 2014, Kansas City Southern de México, S.A. de C.V. (“KCSM”), a wholly-owned subsidiary of KCS, entered into agreements to establish a $200.0 million commercial paper program for KCSM (the “KCSM Commercial Paper Program”). Also on January 30, 2014, KCSM and certain subsidiaries of KCSM that guaranty the 2012 KCSM credit agreement entered into an amendment to the 2012 KCSM credit agreement which eliminated certain representations as a condition to borrowing under the KCSM revolving credit facility (the “KCSM Revolving Facility”) and provided for same-day availability of borrowed funds if desired by KCSM. The KCSM Revolving Facility serves as a backstop for the KCSM Commercial Paper Program, which generally serves as KCSM’s primary means of short-term funding.
KCSM 8.0% Senior Notes. On February 3, 2014, KCSM redeemed all of the remaining $62.8 million aggregate principal amount of the KCSM 8.0% senior unsecured notes due February 1, 2018, at a redemption price (expressed as a percentage of the principal amount) of 104.0%, using a portion of the proceeds from the KCSM floating rate senior unsecured notes due October 28, 2016, issued in the fourth quarter of 2013.
KCSR Revolving Credit Facility and Term Loan. On February 7, 2014, KCSR borrowed $175.0 million under the KCSR Revolving Facility and used the proceeds and cash on hand to repay the outstanding $245.3 million principal amount of the KCSR Term Loan. On February 14, 2014, KCSR repaid the outstanding $175.0 million principal amount of the KCSR Revolving Facility using proceeds received under the KCSR Commercial Paper Program.
8. Commercial Paper
KCSR and KCSM’s Commercial Paper Programs generally serve as the primary means of short-term funding. As of September 30, 2014, KCSR had $312.0 million of commercial paper outstanding at a weighted-average interest rate of 0.605% and KCSM had no commercial paper outstanding.
9. Equity
The following tables summarize the changes in equity (in millions):
Three Months Ended September 30, 2014 | Three Months Ended September 30, 2013 | ||||||||||||||||||||||
Kansas City Southern Stockholders’ Equity | Noncontrolling Interest | Total Equity | Kansas City Southern Stockholders’ Equity | Noncontrolling Interest | Total Equity | ||||||||||||||||||
Beginning balance | $ | 3,535.1 | $ | 306.7 | $ | 3,841.8 | $ | 3,178.5 | $ | 304.8 | $ | 3,483.3 | |||||||||||
Net income | 138.1 | 0.3 | 138.4 | 118.4 | 0.6 | 119.0 | |||||||||||||||||
Other comprehensive loss | (0.3 | ) | — | (0.3 | ) | — | — | — | |||||||||||||||
Dividends on common stock | (30.9 | ) | — | (30.9 | ) | (23.6 | ) | — | (23.6 | ) | |||||||||||||
Dividends on $25 par preferred stock | (0.1 | ) | — | (0.1 | ) | (0.1 | ) | — | (0.1 | ) | |||||||||||||
Options exercised and stock subscribed, net of shares withheld for employee taxes | 1.9 | — | 1.9 | 0.7 | — | 0.7 | |||||||||||||||||
Excess tax benefit from share-based compensation | 0.5 | — | 0.5 | 0.4 | — | 0.4 | |||||||||||||||||
Share-based compensation | 1.8 | — | 1.8 | 3.0 | — | 3.0 | |||||||||||||||||
Ending balance | $ | 3,646.1 | $ | 307.0 | $ | 3,953.1 | $ | 3,277.3 | $ | 305.4 | $ | 3,582.7 | |||||||||||
11
Kansas City Southern and Subsidiaries
Notes to Consolidated Financial Statements—(Continued)
Nine Months Ended September 30, 2014 | Nine Months Ended September 30, 2013 | ||||||||||||||||||||||
Kansas City Southern Stockholders’ Equity | Noncontrolling Interest | Total Equity | Kansas City Southern Stockholders’ Equity | Noncontrolling Interest | Total Equity | ||||||||||||||||||
Beginning balance | $ | 3,370.6 | $ | 306.0 | $ | 3,676.6 | $ | 3,096.6 | $ | 304.1 | $ | 3,400.7 | |||||||||||
Net income | 361.6 | 1.0 | 362.6 | 237.6 | 1.3 | 238.9 | |||||||||||||||||
Other comprehensive income (loss) | (0.3 | ) | — | (0.3 | ) | 0.3 | — | 0.3 | |||||||||||||||
Dividends on common stock | (92.7 | ) | — | (92.7 | ) | (71.0 | ) | — | (71.0 | ) | |||||||||||||
Dividends on $25 par preferred stock | (0.2 | ) | — | (0.2 | ) | (0.2 | ) | — | (0.2 | ) | |||||||||||||
Options exercised and stock subscribed, net of shares withheld for employee taxes | (2.1 | ) | — | (2.1 | ) | (1.0 | ) | — | (1.0 | ) | |||||||||||||
Excess tax benefit from share-based compensation | 3.0 | — | 3.0 | 3.7 | — | 3.7 | |||||||||||||||||
Share-based compensation | 6.2 | — | 6.2 | 11.3 | — | 11.3 | |||||||||||||||||
Ending balance | $ | 3,646.1 | $ | 307.0 | $ | 3,953.1 | $ | 3,277.3 | $ | 305.4 | $ | 3,582.7 | |||||||||||
Cash Dividends on Common Stock
On August 5, 2014, the Company’s Board of Directors declared a cash dividend of $0.280 per share payable on October 8, 2014, to common stockholders of record as of September 8, 2014. The aggregate amount of the dividends declared for the three and nine months ended September 30, 2014 was $30.9 million and $92.7 million, respectively.
The following table presents the amount of cash dividends declared per common share by the Company’s Board of Directors:
Three Months Ended | Nine Months Ended | ||||||||||||||
September 30, | September 30, | ||||||||||||||
2014 | 2013 | 2014 | 2013 | ||||||||||||
Cash dividends declared per common share | $ | 0.280 | $ | 0.215 | $ | 0.840 | $ | 0.645 | |||||||
10. Commitments and Contingencies
Concession Duty. Under KCSM’s 50-year railroad concession from the Mexican government (the “Concession”), which would expire in 2047 unless extended, KCSM pays concession duty expense of 1.25% of gross revenues. For the three and nine months ended September 30, 2014, the concession duty expense, which is recorded within materials and other in operating expenses, was $4.2 million and $11.8 million, respectively, compared to $3.7 million and $10.5 million for the same periods in 2013.
Litigation. The Company is a party to various legal proceedings and administrative actions, all of which, except as set forth below, are of an ordinary, routine nature and incidental to its operations. Included in these proceedings are various tort claims brought by current and former employees for job-related injuries and by third parties for injuries related to railroad operations. KCS aggressively defends these matters and has established liability provisions, which management believes are adequate to cover expected costs. Although it is not possible to predict the outcome of any legal proceeding, in the opinion of management, other than those proceedings described in detail below, such proceedings and actions should not, individually, or in the aggregate, have a material adverse effect on the Company’s consolidated financial statements.
12
Kansas City Southern and Subsidiaries
Notes to Consolidated Financial Statements—(Continued)
On April 15, 2014, a putative securities class action lawsuit was filed in the United States District Court for the Western District of Missouri against the Company and certain of its current and former officers and directors. The securities class action is styled as Gross v. Kansas City Southern, et al., 4:14-cv-00345-BCW. On April 16, 2014, the first of two shareholder derivative actions purportedly brought on behalf of the Company (which is named as a “nominal defendant”) was filed in the United States District Court for the Western District of Missouri against certain of the Company’s current and former directors and officers. The first derivative action is styled as Webster v. Starling, et al., 4:14-cv-00349-BCW. The second derivative action was filed on June 6, 2014, and is styled as Lerner v. Starling, et al., 4:14-cv-00509-BCW. The complaints allege, among other things, that the Company made misrepresentations or omitted to disclose certain facts in connection with its volume guidance for fiscal year 2013. The complaints seek unspecified damages and equitable relief. While the outcome of these matters cannot be predicted with certainty, the Company does not believe that, when resolved, these disputes will have a material effect on its consolidated financial statements. However, an adverse resolution could have a material effect on the Company’s consolidated financial statements.
Environmental Liabilities. The Company’s U.S. operations are subject to extensive federal, state and local environmental laws and regulations. The major U.S. environmental laws to which the Company is subject include, among others, the Federal Comprehensive Environmental Response, Compensation and Liability Act (“CERCLA,” also known as the Superfund law), the Toxic Substances Control Act, the Federal Water Pollution Control Act, and the Hazardous Materials Transportation Act. CERCLA can impose joint and several liabilities for cleanup and investigation costs, without regard to fault or legality of the original conduct, on current and predecessor owners and operators of a site, as well as those who generate, or arrange for the disposal of, hazardous substances. The Company does not believe that compliance with the requirements imposed by the environmental legislation will impair its competitive capability or result in any material additional capital expenditures, operating or maintenance costs. The Company is, however, subject to environmental remediation requirements as described in the following paragraphs.
The Company’s Mexico operations are subject to Mexican federal and state laws and regulations relating to the protection of the environment through the establishment of standards for water discharge, water supply, emissions, noise pollution, hazardous substances and transportation and handling of hazardous and solid waste. The Mexican government may bring administrative and criminal proceedings, impose economic sanctions against companies that violate environmental laws, and temporarily or even permanently close non-complying facilities.
The risk of incurring environmental liability is inherent in the railroad industry. As part of serving the petroleum and chemicals industry, the Company transports hazardous materials and has a professional team available to respond to and mitigate environmental issues that might occur in the transport of such materials.
The Company performs ongoing reviews and evaluations of the various environmental programs and issues within the Company’s operations, and, as necessary, takes actions intended to limit the Company’s exposure to potential liability. Although these costs cannot be predicted with certainty, management believes that the ultimate outcome of identified matters will not have a material adverse effect on the Company’s consolidated financial statements.
Personal Injury. The Company’s personal injury liability is based on semi-annual actuarial studies performed on an undiscounted basis by an independent third party actuarial firm and reviewed by management. This liability is based on personal injury claims filed and an estimate of claims incurred but not yet reported. Actual results may vary from estimates due to the number, type and severity of the injury, costs of medical treatments and uncertainties in litigation. Adjustments to the liability are reflected within operating expenses in the period in which changes to estimates are known. Personal injury claims in excess of self-insurance levels are insured up to certain coverage amounts, depending on the type of claim and year of occurrence. The personal injury liability as of September 30, 2014, was based on an updated actuarial study of personal injury claims through May 31, 2014, and review of the last four months’ experience.
The personal injury liability activity was as follows (in millions):
Nine Months Ended September 30, | |||||||
2014 | 2013 | ||||||
Balance at beginning of year | $ | 31.2 | $ | 34.4 | |||
Accruals | 6.6 | 6.6 | |||||
Change in estimate | (0.7 | ) | 4.1 | ||||
Payments | (6.0 | ) | (7.8 | ) | |||
Balance at end of period | $ | 31.1 | $ | 37.3 | |||
13
Kansas City Southern and Subsidiaries
Notes to Consolidated Financial Statements—(Continued)
Certain Disputes with Ferromex. KCSM and Ferrocarril Mexicano, S.A. de C.V. (“Ferromex”) use certain trackage rights, haulage rights and interline services (the “Services”) provided by each other. The rates to be charged after January 1, 2009, were agreed to pursuant to the Trackage Rights Agreement, dated February 9, 2010 (the “Trackage Rights Agreement”), between KCSM and Ferromex. The rates payable for these Services for the period beginning in 1998 through December 31, 2008, are still not resolved. KCSM is currently involved in discussions with Ferromex regarding the amounts payable to each other for the Services for this period. If KCSM cannot reach an agreement with Ferromex for rates applicable for Services which were provided prior to January 1, 2009, which are not subject to the Trackage Rights Agreement, the Mexican Secretaría de Comunicaciones y Transportes (“Secretary of Communications and Transportation” or “SCT”) is entitled to set the rates in accordance with Mexican law and regulations. KCSM and Ferromex both initiated administrative proceedings seeking a determination by the SCT of the rates that KCSM and Ferromex should pay each other in connection with the Services. The SCT issued rulings in 2002 and 2008 setting the rates for the Services and both KCSM and Ferromex challenged these rulings. Although KCSM and Ferromex have challenged these matters based on different grounds and these cases continue to evolve, management believes the amounts recorded related to these matters are adequate. While the outcome of these matters cannot be predicted with certainty, the Company does not believe that, when resolved, these disputes will have a material effect on its consolidated financial statements.
Contractual Agreements. In the normal course of business, the Company enters into various contractual agreements related to commercial arrangements and the use of other railroads’ or governmental entities’ infrastructure needed for the operations of the business. The Company is involved or may become involved in certain disputes involving transportation rates, product loss or damage, charges, and interpretations related to these agreements. While the outcome of these matters cannot be predicted with certainty, the Company does not believe that, when resolved, these disputes will have a material effect on its consolidated financial statements.
Credit Risk. The Company continually monitors risks related to economic changes and certain customer receivables concentrations. Significant changes in customer concentration or payment terms, deterioration of customer creditworthiness or further weakening in economic trends could have a significant impact on the collectability of the Company’s receivables and its operating results. If the financial condition of the Company’s customers were to deteriorate and result in an impairment of their ability to make payments, additional allowances may be required. The Company has recorded provisions for uncollectability based on its best estimate at September 30, 2014.
Income Tax. Tax returns filed in the U.S. for periods after 2010 and in Mexico for periods after 2008 remain open to examination by the taxing authorities. In 2014, the Internal Revenue Service (“IRS”) initiated an examination on the 2011 and 2012 U.S. federal tax returns and the Servicio de Administración Tributaria (the “SAT”), the Mexican equivalent of the IRS, initiated an examination on the 2012 tax return of KCSM Servicios, S.A. de C.V., a wholly-owned subsidiary of KCS. KCSM’s 2007 and 2010 tax returns are currently under examination by the SAT. The Company is litigating an audit assessment from the SAT for KCSM for the year ended December 31, 2005. The Company believes it is more likely than not that it will prevail in challenging the KCSM 2005 assessment. While the outcome of this matter cannot be predicted with certainty, the Company does not believe, when resolved, that this dispute will have a material effect on its consolidated financial statements. However, an unexpected adverse resolution could have a material effect on the consolidated financial statements in a particular quarter or fiscal year.
NAFTA Value Added Tax. NAFTA Rail, S. de R.L. de C.V. (NAFTA), a wholly-owned subsidiary of KCS, recorded a receivable from the SAT for Value Added Tax (“VAT”) paid by NAFTA in connection with NAFTA’s purchase of locomotives. NAFTA subsequently collected VAT in connection with leasing these locomotives, and offset the resulting VAT payable against the existing VAT receivable. The SAT issued a resolution in 2013 which denied this offset, and assessed payment. NAFTA is litigating this resolution; however, an adverse resolution could result in the determination that approximately $14.0 million of VAT receivable recorded by NAFTA is not recoverable.
KCSM Value Added Tax. KCSM has not historically assessed VAT on international import transportation services provided to its customers based on a written ruling that KCSM obtained from the SAT in 2008 stating that such services were exempt from VAT (the “2008 Ruling”). Notwithstanding the 2008 Ruling, in December 2013, the SAT unofficially informed KCSM of an intended implementation of new criteria effective as of January 1, 2014, pursuant to which VAT would be assessed on all international import transportation services on the portion of the services provided within Mexico. Additionally, in November 2013, the SAT filed an action to nullify the 2008 Ruling, potentially exposing the application of the new criteria to open tax years. In February 2014, KCSM filed an action opposing the SAT’s nullification action. While the SAT’s unofficial communication to KCSM is not enforceable and the 2008 Ruling continues to be in effect, KCSM notified its customers in December 2013 of the potential assessment of VAT on international import transportation services as of January 1, 2014, and is considering potential changes to the KCSM billing systems; however, implementation of any VAT assessment will depend on future developments and guidance expected to be published by the SAT. Due to the pass-through nature of VAT assessed on services provided to customers, the Company does not believe any ultimate requirement to assess VAT on international import transportation services will have a significant effect on its consolidated financial statements.
14
Kansas City Southern and Subsidiaries
Notes to Consolidated Financial Statements—(Continued)
However, unexpected adverse implementation criteria imposed by the SAT for open tax years could have a material effect on the consolidated financial statements of the Company in a particular quarter or fiscal year.
Mexican Legislation. In Mexico, proposed legislation was introduced in 2013 in the House of Deputies to amend certain provisions in the Mexican Regulatory Railroad Service Law. In February 2014, this proposed legislation was approved by the Mexican House of Deputies. The proposed legislation was not acted on by the Mexican Senate in the congressional period which ended on April 30, 2014, and is expected to be considered in the congressional period which began on September 1, 2014. Because any final legislation is still subject to discussion and revision in the Mexican Senate, and requires the signature of the President of Mexico, it is too early to determine what, if any, impact the proposed rail legislation could have on the Mexican railroad industry and its customers.
In May 2014, new Mexican antitrust legislation was approved, and became effective on July 7, 2014. This new law replaces antitrust law that had been effective since 1993. The Company will continue to evaluate the Mexican government’s implementation of this legislation.
Panama Canal Railway Company (“PCRC”) Guarantees and Indemnities. At September 30, 2014, the Company had issued and outstanding $5.3 million under a standby letter of credit to fulfill its obligation to fund fifty percent of the debt service reserve and liquidity reserve established by PCRC in connection with the issuance of the 7.0% Senior Secured Notes due November 1, 2026 (the “PCRC Notes”). Additionally, KCS has pledged its shares of PCRC as security for the PCRC Notes.
11. Geographic Information
The Company strategically manages its rail operations as one reportable business segment over a single coordinated rail network that extends from the Midwest and Southeast portions of the United States south into Mexico and connects with other Class I railroads. Financial information reported at this level, such as revenues, operating income and cash flows from operations, is used by corporate management, including the Company’s chief operating decision-maker, in evaluating overall financial and operational performance, market strategies, as well as the decisions to allocate capital resources.
The Company’s strategic initiatives, which drive its operational direction, are developed and managed at the Company’s headquarters and targets are communicated to its various activity centers. The activity centers are responsible for executing the overall corporate strategy and operating plan established by corporate management as a coordinated system. The role of each region is to manage the operational activities and monitor and control costs over the coordinated rail network.
The following tables provide information by geographic area (in millions):
Three Months Ended | Nine Months Ended | ||||||||||||||
September 30, | September 30, | ||||||||||||||
Revenues | 2014 | 2013 | 2014 | 2013 | |||||||||||
U.S. | $ | 363.8 | $ | 334.9 | $ | 1,032.9 | $ | 945.0 | |||||||
Mexico | 313.7 | 286.7 | 901.7 | 808.7 | |||||||||||
Total revenues | $ | 677.5 | $ | 621.6 | $ | 1,934.6 | $ | 1,753.7 | |||||||
Property and equipment (including concession assets), net | September 30, 2014 | December 31, 2013 | |||||||||||||
U.S. | $ | 4,087.3 | $ | 3,662.2 | |||||||||||
Mexico | 2,822.1 | 2,694.1 | |||||||||||||
Total property and equipment (including concession assets), net | $ | 6,909.4 | $ | 6,356.3 | |||||||||||
15
Kansas City Southern and Subsidiaries
Notes to Consolidated Financial Statements—(Continued)
12. Condensed Consolidating Financial Information
As of September 30, 2014, KCSR had outstanding $450.0 million principal amount of 4.30% Senior Notes due May 15, 2043, and $200.0 million principal amount of 3.85% Senior Notes due November 15, 2023, which are unsecured obligations of KCSR, and are also jointly and severally and fully and unconditionally guaranteed on an unsecured senior basis by KCS and certain wholly-owned domestic subsidiaries. KCSR filed a registration statement on Form S-4 with the Securities and Exchange Commission (the “SEC”) in connection with an exchange offer with respect to the 4.30% Senior Notes and the 3.85% Senior Notes, which was declared effective on May 28, 2014. As a result, the Company is providing the accompanying condensed consolidating financial information (in millions) pursuant to SEC Regulation S-X Rule 3-10 “Financial statements of guarantors and issuers of guaranteed securities registered or being registered.”
CONDENSED CONSOLIDATING STATEMENTS OF COMPREHENSIVE INCOME
Three Months Ended September 30, 2014 | |||||||||||||||||||||||
Parent | KCSR | Guarantor Subsidiaries | Non-Guarantor Subsidiaries | Consolidating Adjustments | Consolidated KCS | ||||||||||||||||||
Revenues | $ | — | $ | 327.4 | $ | 12.7 | $ | 348.2 | $ | (10.8 | ) | $ | 677.5 | ||||||||||
Operating expenses | 1.6 | 228.5 | 10.4 | 218.4 | (10.8 | ) | 448.1 | ||||||||||||||||
Operating income (loss) | (1.6 | ) | 98.9 | 2.3 | 129.8 | — | 229.4 | ||||||||||||||||
Equity in net earnings (losses) of unconsolidated affiliates | 131.0 | (0.1 | ) | 1.2 | 4.4 | (131.5 | ) | 5.0 | |||||||||||||||
Interest expense | (0.1 | ) | (20.6 | ) | — | (9.6 | ) | 12.4 | (17.9 | ) | |||||||||||||
Debt retirement costs | — | — | — | — | — | — | |||||||||||||||||
Foreign exchange loss | — | — | — | (12.5 | ) | — | (12.5 | ) | |||||||||||||||
Other income (expense), net | 12.4 | (0.3 | ) | — | (0.1 | ) | (12.4 | ) | (0.4 | ) | |||||||||||||
Income before income taxes | 141.7 | 77.9 | 3.5 | 112.0 | (131.5 | ) | 203.6 | ||||||||||||||||
Income tax expense | 3.6 | 29.8 | 1.4 | 30.4 | — | 65.2 | |||||||||||||||||
Net income | 138.1 | 48.1 | 2.1 | 81.6 | (131.5 | ) | 138.4 | ||||||||||||||||
Less: Net income attributable to noncontrolling interest | — | — | 0.3 | — | — | 0.3 | |||||||||||||||||
Net income attributable to Kansas City Southern and subsidiaries | 138.1 | 48.1 | 1.8 | 81.6 | (131.5 | ) | 138.1 | ||||||||||||||||
Other comprehensive loss | (0.3 | ) | (0.1 | ) | — | (0.5 | ) | 0.6 | (0.3 | ) | |||||||||||||
Comprehensive income attributable to Kansas City Southern and subsidiaries | $ | 137.8 | $ | 48.0 | $ | 1.8 | $ | 81.1 | $ | (130.9 | ) | $ | 137.8 | ||||||||||
16
Kansas City Southern and Subsidiaries
Notes to Consolidated Financial Statements—(Continued)
CONDENSED CONSOLIDATING STATEMENTS OF COMPREHENSIVE INCOME - (Continued)
Three Months Ended September 30, 2013 | |||||||||||||||||||||||
Parent | KCSR | Guarantor Subsidiaries | Non-Guarantor Subsidiaries | Consolidating Adjustments | Consolidated KCS | ||||||||||||||||||
Revenues | $ | — | $ | 295.9 | $ | 10.7 | $ | 325.1 | $ | (10.1 | ) | $ | 621.6 | ||||||||||
Operating expenses | 1.1 | 212.3 | 9.9 | 208.8 | (10.8 | ) | 421.3 | ||||||||||||||||
Operating income (loss) | (1.1 | ) | 83.6 | 0.8 | 116.3 | 0.7 | 200.3 | ||||||||||||||||
Equity in net earnings (losses) of unconsolidated affiliates | 114.8 | (0.2 | ) | 1.8 | 4.3 | (115.9 | ) | 4.8 | |||||||||||||||
Interest expense | (0.1 | ) | (17.8 | ) | — | (12.3 | ) | 11.9 | (18.3 | ) | |||||||||||||
Debt retirement costs | — | — | — | (2.4 | ) | — | (2.4 | ) | |||||||||||||||
Foreign exchange loss | — | — | — | (1.4 | ) | — | (1.4 | ) | |||||||||||||||
Other income (expense), net | 11.0 | 1.0 | — | (0.2 | ) | (12.5 | ) | (0.7 | ) | ||||||||||||||
Income before income taxes | 124.6 | 66.6 | 2.6 | 104.3 | (115.8 | ) | 182.3 | ||||||||||||||||
Income tax expense | 6.2 | 25.7 | 0.9 | 30.4 | 0.1 | 63.3 | |||||||||||||||||
Net income | 118.4 | 40.9 | 1.7 | 73.9 | (115.9 | ) | 119.0 | ||||||||||||||||
Less: Net income attributable to noncontrolling interest | — | — | 0.6 | — | — | 0.6 | |||||||||||||||||
Net income attributable to Kansas City Southern and subsidiaries | 118.4 | 40.9 | 1.1 | 73.9 | (115.9 | ) | 118.4 | ||||||||||||||||
Other comprehensive income | — | — | — | — | — | — | |||||||||||||||||
Comprehensive income attributable to Kansas City Southern and subsidiaries | $ | 118.4 | $ | 40.9 | $ | 1.1 | $ | 73.9 | $ | (115.9 | ) | $ | 118.4 | ||||||||||
Nine Months Ended September 30, 2014 | |||||||||||||||||||||||
Parent | KCSR | Guarantor Subsidiaries | Non-Guarantor Subsidiaries | Consolidating Adjustments | Consolidated KCS | ||||||||||||||||||
Revenues | $ | — | $ | 913.7 | $ | 36.4 | $ | 1,015.5 | $ | (31.0 | ) | $ | 1,934.6 | ||||||||||
Operating expenses | 6.7 | 674.7 | 30.4 | 659.7 | (32.1 | ) | 1,339.4 | ||||||||||||||||
Operating income (loss) | (6.7 | ) | 239.0 | 6.0 | 355.8 | 1.1 | 595.2 | ||||||||||||||||
Equity in net earnings of unconsolidated affiliates | 346.5 | 0.5 | 3.3 | 14.9 | (348.6 | ) | 16.6 | ||||||||||||||||
Interest expense | (0.1 | ) | (62.9 | ) | — | (29.5 | ) | 38.0 | (54.5 | ) | |||||||||||||
Debt retirement costs | — | (2.7 | ) | — | (3.9 | ) | — | (6.6 | ) | ||||||||||||||
Foreign exchange loss | — | — | — | (4.1 | ) | — | (4.1 | ) | |||||||||||||||
Other income (expense), net | 37.9 | 0.1 | — | (2.6 | ) | (39.1 | ) | (3.7 | ) | ||||||||||||||
Income before income taxes | 377.6 | 174.0 | 9.3 | 330.6 | (348.6 | ) | 542.9 | ||||||||||||||||
Income tax expense | 16.0 | 66.7 | 3.6 | 94.0 | — | 180.3 | |||||||||||||||||
Net income | 361.6 | 107.3 | 5.7 | 236.6 | (348.6 | ) | 362.6 | ||||||||||||||||
Less: Net income attributable to noncontrolling interest | — | — | 1.0 | — | — | 1.0 | |||||||||||||||||
Net income attributable to Kansas City Southern and subsidiaries | 361.6 | 107.3 | 4.7 | 236.6 | (348.6 | ) | 361.6 | ||||||||||||||||
Other comprehensive loss | (0.3 | ) | — | — | (0.4 | ) | 0.4 | (0.3 | ) | ||||||||||||||
Comprehensive income attributable to Kansas City Southern and subsidiaries | $ | 361.3 | $ | 107.3 | $ | 4.7 | $ | 236.2 | $ | (348.2 | ) | $ | 361.3 | ||||||||||
17
Kansas City Southern and Subsidiaries
Notes to Consolidated Financial Statements—(Continued)
CONDENSED CONSOLIDATING STATEMENTS OF COMPREHENSIVE INCOME - (Continued)
Nine Months Ended September 30, 2013 | |||||||||||||||||||||||
Parent | KCSR | Guarantor Subsidiaries | Non-Guarantor Subsidiaries | Consolidating Adjustments | Consolidated KCS | ||||||||||||||||||
Revenues | $ | — | $ | 836.1 | $ | 30.9 | $ | 916.6 | $ | (29.9 | ) | $ | 1,753.7 | ||||||||||
Operating expenses | 3.7 | 617.8 | 28.5 | 593.0 | (31.8 | ) | 1,211.2 | ||||||||||||||||
Operating income (loss) | (3.7 | ) | 218.3 | 2.4 | 323.6 | 1.9 | 542.5 | ||||||||||||||||
Equity in net earnings of unconsolidated affiliates | 222.7 | 1.0 | 4.0 | 11.2 | (225.1 | ) | 13.8 | ||||||||||||||||
Interest expense | (0.1 | ) | (49.4 | ) | — | (47.4 | ) | 35.7 | (61.2 | ) | |||||||||||||
Debt retirement costs | — | (1.5 | ) | — | (112.3 | ) | — | (113.8 | ) | ||||||||||||||
Foreign exchange loss | — | (1.6 | ) | — | (8.5 | ) | — | (10.1 | ) | ||||||||||||||
Other income (expense), net | 33.4 | 4.2 | (0.1 | ) | (0.4 | ) | (37.6 | ) | (0.5 | ) | |||||||||||||
Income before income taxes | 252.3 | 171.0 | 6.3 | 166.2 | (225.1 | ) | 370.7 | ||||||||||||||||
Income tax expense | 14.7 | 63.9 | 2.3 | 50.8 | 0.1 | 131.8 | |||||||||||||||||
Net income | 237.6 | 107.1 | 4.0 | 115.4 | (225.2 | ) | 238.9 | ||||||||||||||||
Less: Net income attributable to noncontrolling interest | — | — | 1.3 | — | — | 1.3 | |||||||||||||||||
Net income attributable to Kansas City Southern and subsidiaries | 237.6 | 107.1 | 2.7 | 115.4 | (225.2 | ) | 237.6 | ||||||||||||||||
Other comprehensive income | 0.3 | 0.4 | — | — | (0.4 | ) | 0.3 | ||||||||||||||||
Comprehensive income attributable to Kansas City Southern and subsidiaries | $ | 237.9 | $ | 107.5 | $ | 2.7 | $ | 115.4 | $ | (225.6 | ) | $ | 237.9 | ||||||||||
CONDENSED CONSOLIDATING BALANCE SHEETS
September 30, 2014 | |||||||||||||||||||||||
Parent | KCSR | Guarantor Subsidiaries | Non-Guarantor Subsidiaries | Consolidating Adjustments | Consolidated KCS | ||||||||||||||||||
Assets: | |||||||||||||||||||||||
Current assets | $ | 4.6 | $ | 231.3 | $ | 6.3 | $ | 574.5 | $ | (36.4 | ) | $ | 780.3 | ||||||||||
Investments | — | 3.9 | — | 39.4 | — | 43.3 | |||||||||||||||||
Investments in consolidated subsidiaries | 2,495.9 | (3.2 | ) | 466.0 | — | (2,958.7 | ) | — | |||||||||||||||
Property and equipment (including concession assets), net | — | 3,171.2 | 193.8 | 3,544.4 | — | 6,909.4 | |||||||||||||||||
Other assets | 1.6 | 46.0 | — | 36.4 | — | 84.0 | |||||||||||||||||
Total assets | $ | 2,502.1 | $ | 3,449.2 | $ | 666.1 | $ | 4,194.7 | $ | (2,995.1 | ) | $ | 7,817.0 | ||||||||||
Liabilities and equity: | |||||||||||||||||||||||
Current liabilities | $ | (1,164.4 | ) | $ | 1,639.0 | $ | 118.4 | $ | 204.3 | $ | (36.4 | ) | $ | 760.9 | |||||||||
Long-term debt | 0.2 | 701.9 | 0.2 | 1,143.8 | — | 1,846.1 | |||||||||||||||||
Deferred income taxes | 7.2 | 759.0 | 130.1 | 231.7 | — | 1,128.0 | |||||||||||||||||
Other liabilities | 3.4 | 97.0 | 0.7 | 27.8 | — | 128.9 | |||||||||||||||||
Stockholders’ equity | 3,655.7 | 252.3 | 109.7 | 2,587.1 | (2,958.7 | ) | 3,646.1 | ||||||||||||||||
Noncontrolling interest | — | — | 307.0 | — | — | 307.0 | |||||||||||||||||
Total liabilities and equity | $ | 2,502.1 | $ | 3,449.2 | $ | 666.1 | $ | 4,194.7 | $ | (2,995.1 | ) | $ | 7,817.0 | ||||||||||
18
Kansas City Southern and Subsidiaries
Notes to Consolidated Financial Statements—(Continued)
CONDENSED CONSOLIDATING BALANCE SHEETS - (Continued)
December 31, 2013 | |||||||||||||||||||||||
Parent | KCSR | Guarantor Subsidiaries | Non-Guarantor Subsidiaries | Consolidating Adjustments | Consolidated KCS | ||||||||||||||||||
Assets: | |||||||||||||||||||||||
Current assets | $ | 2.6 | $ | 403.0 | $ | 8.8 | $ | 560.1 | $ | (32.1 | ) | $ | 942.4 | ||||||||||
Investments | — | 9.6 | — | 31.5 | — | 41.1 | |||||||||||||||||
Investments in consolidated subsidiaries | 2,154.6 | (2.1 | ) | 461.8 | — | (2,614.3 | ) | — | |||||||||||||||
Restricted funds | — | — | — | 4.2 | — | 4.2 | |||||||||||||||||
Property and equipment (including concession assets), net | 0.1 | 2,780.4 | 198.6 | 3,377.2 | — | 6,356.3 | |||||||||||||||||
Other assets | 1.5 | 50.9 | — | 39.0 | — | 91.4 | |||||||||||||||||
Total assets | $ | 2,158.8 | $ | 3,241.8 | $ | 669.2 | $ | 4,012.0 | $ | (2,646.4 | ) | $ | 7,435.4 | ||||||||||
Liabilities and equity: | |||||||||||||||||||||||
Current liabilities | $ | (1,216.5 | ) | $ | 1,580.6 | $ | 130.7 | $ | 267.9 | $ | (32.1 | ) | $ | 730.6 | |||||||||
Long-term debt | 0.2 | 704.3 | 0.2 | 1,152.2 | — | 1,856.9 | |||||||||||||||||
Deferred income taxes | (11.7 | ) | 719.8 | 127.6 | 208.9 | — | 1,044.6 | ||||||||||||||||
Other liabilities | 6.6 | 92.0 | 0.7 | 27.5 | (0.1 | ) | 126.7 | ||||||||||||||||
Stockholders’ equity | 3,380.2 | 145.1 | 104.0 | 2,355.5 | (2,614.2 | ) | 3,370.6 | ||||||||||||||||
Noncontrolling interest | — | — | 306.0 | — | — | 306.0 | |||||||||||||||||
Total liabilities and equity | $ | 2,158.8 | $ | 3,241.8 | $ | 669.2 | $ | 4,012.0 | $ | (2,646.4 | ) | $ | 7,435.4 | ||||||||||
CONDENSED CONSOLIDATING STATEMENTS OF CASH FLOWS
Nine Months Ended September 30, 2014 | |||||||||||||||||||||||
Parent | KCSR | Guarantor Subsidiaries | Non-Guarantor Subsidiaries | Consolidating Adjustments | Consolidated KCS | ||||||||||||||||||
Operating activities: | |||||||||||||||||||||||
Net cash provided | $ | 83.7 | $ | 241.9 | $ | 0.8 | $ | 361.4 | $ | (6.0 | ) | $ | 681.8 | ||||||||||
Investing activities: | |||||||||||||||||||||||
Capital expenditures | — | (270.1 | ) | (0.8 | ) | (134.1 | ) | 1.5 | (403.5 | ) | |||||||||||||
Purchase or replacement of equipment under operating leases | — | (203.8 | ) | — | (98.4 | ) | — | (302.2 | ) | ||||||||||||||
Property investments in MSLLC | — | — | — | (25.6 | ) | — | (25.6 | ) | |||||||||||||||
Other investing activities | (1.2 | ) | 9.0 | (1.0 | ) | 1.0 | 0.7 | 8.5 | |||||||||||||||
Net cash used | (1.2 | ) | (464.9 | ) | (1.8 | ) | (257.1 | ) | 2.2 | (722.8 | ) | ||||||||||||
Financing activities: | |||||||||||||||||||||||
Proceeds from commercial paper | — | 11,502.7 | — | — | — | 11,502.7 | |||||||||||||||||
Repayment of commercial paper | — | (11,191.8 | ) | — | — | — | (11,191.8 | ) | |||||||||||||||
Proceeds from issuance of long-term debt | — | 175.0 | — | — | — | 175.0 | |||||||||||||||||
Repayment of long-term debt | — | (422.7 | ) | (0.1 | ) | (80.0 | ) | — | (502.8 | ) | |||||||||||||
Dividends paid | (85.7 | ) | — | — | (6.0 | ) | 6.0 | (85.7 | ) | ||||||||||||||
Other financing activities | 4.3 | (1.2 | ) | 1.0 | (2.0 | ) | (2.2 | ) | (0.1 | ) | |||||||||||||
Net cash provided (used) | (81.4 | ) | 62.0 | 0.9 | (88.0 | ) | 3.8 | (102.7 | ) | ||||||||||||||
Cash and cash equivalents: | |||||||||||||||||||||||
Net increase (decrease) | 1.1 | (161.0 | ) | (0.1 | ) | 16.3 | — | (143.7 | ) | ||||||||||||||
At beginning of year | 0.4 | 196.1 | 0.2 | 232.8 | — | 429.5 | |||||||||||||||||
At end of period | $ | 1.5 | $ | 35.1 | $ | 0.1 | $ | 249.1 | $ | — | $ | 285.8 | |||||||||||
19
Kansas City Southern and Subsidiaries
Notes to Consolidated Financial Statements—(Continued)
CONDENSED CONSOLIDATING STATEMENTS OF CASH FLOWS - (Continued)
Nine Months Ended September 30, 2013 | |||||||||||||||||||||||
Parent | KCSR | Guarantor Subsidiaries | Non-Guarantor Subsidiaries | Consolidating Adjustments | Consolidated KCS | ||||||||||||||||||
Operating activities: | |||||||||||||||||||||||
Net cash provided | $ | 67.3 | $ | 187.2 | $ | 2.3 | $ | 320.7 | $ | (5.0 | ) | $ | 572.5 | ||||||||||
Investing activities: | |||||||||||||||||||||||
Capital expenditures | — | (246.6 | ) | (1.9 | ) | (133.7 | ) | 0.4 | (381.8 | ) | |||||||||||||
Purchase or replacement of equipment under operating leases | — | (88.6 | ) | — | (66.5 | ) | — | (155.1 | ) | ||||||||||||||
Property investments in MSLLC | — | — | — | (25.0 | ) | — | (25.0 | ) | |||||||||||||||
Proceeds from repayment of loans to affiliates | — | 97.4 | — | — | (97.4 | ) | — | ||||||||||||||||
Loans to affiliates | — | (69.5 | ) | — | — | 69.5 | — | ||||||||||||||||
Other investing activities | (0.7 | ) | (5.3 | ) | (1.0 | ) | 4.2 | 0.9 | (1.9 | ) | |||||||||||||
Net cash used | (0.7 | ) | (312.6 | ) | (2.9 | ) | (221.0 | ) | (26.6 | ) | (563.8 | ) | |||||||||||
Financing activities: | |||||||||||||||||||||||
Proceeds from issuance of long-term debt | — | 487.9 | — | 980.8 | — | 1,468.7 | |||||||||||||||||
Repayment of long-term debt | — | (336.5 | ) | (0.1 | ) | (965.2 | ) | — | (1,301.8 | ) | |||||||||||||
Debt costs | — | (5.6 | ) | — | (103.7 | ) | — | (109.3 | ) | ||||||||||||||
Dividends paid | (47.6 | ) | — | — | (5.0 | ) | 5.0 | (47.6 | ) | ||||||||||||||
Proceeds from loans from affiliates | — | — | — | 69.5 | (69.5 | ) | — | ||||||||||||||||
Repayment of loans from affiliates | — | — | — | (97.4 | ) | 97.4 | — | ||||||||||||||||
Other financing activities | 4.6 | — | 0.6 | 0.7 | (1.3 | ) | 4.6 | ||||||||||||||||
Net cash provided (used) | (43.0 | ) | 145.8 | 0.5 | (120.3 | ) | 31.6 | 14.6 | |||||||||||||||
Cash and cash equivalents: | |||||||||||||||||||||||
Net increase (decrease) | 23.6 | 20.4 | (0.1 | ) | (20.6 | ) | — | 23.3 | |||||||||||||||
At beginning of year | 0.1 | 29.6 | 0.1 | 42.8 | — | 72.6 | |||||||||||||||||
At end of period | $ | 23.7 | $ | 50.0 | $ | — | $ | 22.2 | $ | — | $ | 95.9 | |||||||||||
13. Subsequent Event
On October 8, 2014, the Company settled a portion of its foreign currency forward contracts by entering into offsetting contracts with an aggregate notional amount of $30.0 million. These offsetting contracts mature on December 31, 2014, and obligate the Company to sell a total of Ps.403.7 million at a weighted-average exchange rate of Ps.13.46 to each U.S. dollar.
20
Item 2. | Management’s Discussion and Analysis of Financial Condition and Results of Operations |
The discussion below, as well as other portions of this Form 10-Q, contain forward-looking statements that are not based upon historical information. Readers can identify these forward-looking statements by the use of such verbs as “expects,” “anticipates,” “believes” or similar verbs or conjugations of such verbs. Such forward-looking statements are based upon information currently available to management and management’s perception thereof as of the date of this Form 10-Q. However, such statements are dependent on and, therefore, can be influenced by, a number of external variables over which management has little or no control, including: competition and consolidation within the transportation industry; the business environment in industries that produce and use items shipped by rail; loss of the rail concession of Kansas City Southern’s subsidiary, Kansas City Southern de México, S.A. de C.V.; the termination of, or failure to renew, agreements with customers, other railroads and third parties; interest rates; access to capital; disruptions to the Company’s technology infrastructure, including its computer systems; natural events such as severe weather, hurricanes and floods; market and regulatory responses to climate change; credit risk of customers and counterparties and their failure to meet their financial obligations; legislative and regulatory developments and disputes; rail accidents or other incidents or accidents on KCS’s rail network or at KCS’s facilities or customer facilities involving the release of hazardous materials, including toxic inhalation hazards; fluctuation in prices or availability of key materials, in particular diesel fuel; dependency on certain key suppliers of core rail equipment; changes in securities and capital markets; loss of key personnel; labor difficulties, including strikes and work stoppages; insufficiency of insurance to cover lost revenue, profits or other damages; acts of terrorism or risk of terrorist activities; war or risk of war; domestic and international economic conditions; political and economic conditions in Mexico and the level of trade between the United States and Mexico; and the outcome of claims and litigation involving the Company or its subsidiaries. For more discussion about each risk factor, see Part II Item 7 “Management’s Discussion and Analysis of Financial Condition and Results of Operations” in the Company’s Annual Report on Form 10-K for the year ended December 31, 2013, which is on file with the U.S. Securities and Exchange Commission (File No. 1-4717) and Part I Item 1A — “Risk Factors” in the Form 10-K and any updates contained herein. Readers are strongly encouraged to consider these factors when evaluating forward-looking statements. Forward-looking statements should not be read as a guarantee of future performance or results and will not necessarily be accurate indications of the timing when, or by which, such performance or results will be achieved. As a result, actual outcomes or results could materially differ from those indicated in forward-looking statements. We are not under any obligation, and we expressly disclaim any obligation, to update or alter any forward-looking statements.
This discussion is intended to clarify and focus on Kansas City Southern’s (“KCS” or the “Company”) results of operations, certain changes in its financial position, liquidity, capital structure and business developments for the periods covered by the consolidated financial statements included under Item 1 of this Form 10-Q. This discussion should be read in conjunction with those consolidated financial statements and the related notes and is qualified by reference to them.
Critical Accounting Policies and Estimates
The Company’s discussion and analysis of its financial position and results of operations is based upon its consolidated financial statements. The preparation of these consolidated financial statements requires estimation and judgment that affect the reported amounts of revenue, expenses, assets and liabilities. The Company bases its estimates on historical experience and on various other factors that are believed to be reasonable under the circumstances, the results of which form the basis for making judgments about the accounting for assets and liabilities that are not readily apparent from other sources. If the estimates differ materially from actual results, the impact on the consolidated financial statements may be material. The Company’s critical accounting policies are disclosed in the 2013 Annual Report on Form 10-K.
Overview
The Company is engaged in the freight rail transportation business, operating a coordinated rail network under one reportable business segment. The primary operating subsidiaries of the Company consist of the following: The Kansas City Southern Railway Company (“KCSR”), Kansas City Southern de México, S.A. de C.V. (“KCSM”), Meridian Speedway, LLC (“MSLLC”), and The Texas Mexican Railway Company (“TexMex”). The Company generates revenues and cash flows by providing customers with freight delivery services within its regions, and throughout North America through connections with other Class I rail carriers. Customers conduct business in a number of different industries, including chemical and petroleum products, industrial and consumer products, agriculture and mineral products, energy products, automotive products and intermodal transportation. Appropriate eliminations and reclassifications have been recorded in preparing the consolidated financial statements.
21
Third Quarter Analysis
The Company reported a 9% increase in revenues, a 5% increase in revenue per carload/unit and a 4% increase in carload/unit volumes during the three months ended September 30, 2014, as compared to the same period in 2013. Revenue increases were driven by positive pricing impacts and volumes.
Operating expenses increased $26.8 million during the three months ended September 30, 2014, as compared to the same period in 2013, due to higher carload/unit volumes. Operating expenses as a percentage of revenues decreased to 66.1% for the three months ended September 30, 2014, as compared to 67.8% for the same period in 2013.
KCSM’s revenues and operating expenses are affected by fluctuations of the Mexican peso against the U.S. dollar. Based on the volume of revenue and expense transactions denominated in Mexican pesos, revenue and expense fluctuations generally offset, with insignificant net impacts to operating income.
The Company reported quarterly earnings of $1.25 per diluted share on consolidated net income of $138.1 million for the three months ended September 30, 2014, compared to earnings of $1.07 per diluted share on consolidated net income of $118.4 million for the same period in 2013. The increase for the three months ended September 30, 2014, as compared to the same period in 2013, is attributable to higher operating income, partially offset by higher foreign exchange loss.
Results of Operations
The following summarizes KCS’s consolidated income statement components (in millions):
Three Months Ended | Change | ||||||||||
September 30, | |||||||||||
2014 | 2013 | ||||||||||
Revenues | $ | 677.5 | $ | 621.6 | $ | 55.9 | |||||
Operating expenses | 448.1 | 421.3 | 26.8 | ||||||||
Operating income | 229.4 | 200.3 | 29.1 | ||||||||
Equity in net earnings of unconsolidated affiliates | 5.0 | 4.8 | 0.2 | ||||||||
Interest expense | (17.9 | ) | (18.3 | ) | 0.4 | ||||||
Debt retirement costs | — | (2.4 | ) | 2.4 | |||||||
Foreign exchange loss | (12.5 | ) | (1.4 | ) | (11.1 | ) | |||||
Other expense, net | (0.4 | ) | (0.7 | ) | 0.3 | ||||||
Income before income taxes | 203.6 | 182.3 | 21.3 | ||||||||
Income tax expense | 65.2 | 63.3 | 1.9 | ||||||||
Net income | 138.4 | 119.0 | 19.4 | ||||||||
Less: Net income attributable to noncontrolling interest | 0.3 | 0.6 | (0.3 | ) | |||||||
Net income attributable to Kansas City Southern and subsidiaries | $ | 138.1 | $ | 118.4 | $ | 19.7 | |||||
22
Nine Months Ended | Change | ||||||||||
September 30, | |||||||||||
2014 | 2013 | ||||||||||
Revenues | $ | 1,934.6 | $ | 1,753.7 | $ | 180.9 | |||||
Operating expenses | 1,339.4 | 1,211.2 | 128.2 | ||||||||
Operating income | 595.2 | 542.5 | 52.7 | ||||||||
Equity in net earnings of unconsolidated affiliates | 16.6 | 13.8 | 2.8 | ||||||||
Interest expense | (54.5 | ) | (61.2 | ) | 6.7 | ||||||
Debt retirement costs | (6.6 | ) | (113.8 | ) | 107.2 | ||||||
Foreign exchange loss | (4.1 | ) | (10.1 | ) | 6.0 | ||||||
Other expense, net | (3.7 | ) | (0.5 | ) | (3.2 | ) | |||||
Income before income taxes | 542.9 | 370.7 | 172.2 | ||||||||
Income tax expense | 180.3 | 131.8 | 48.5 | ||||||||
Net income | 362.6 | 238.9 | 123.7 | ||||||||
Less: Net income attributable to noncontrolling interest | 1.0 | 1.3 | (0.3 | ) | |||||||
Net income attributable to Kansas City Southern and subsidiaries | $ | 361.6 | $ | 237.6 | $ | 124.0 | |||||
Revenues
The following summarizes revenues (in millions), carload/unit statistics (in thousands) and revenue per carload/unit:
Revenues | Carloads and Units | Revenue per Carload/Unit | ||||||||||||||||||||||||||||
Three Months Ended | Three Months Ended | Three Months Ended | ||||||||||||||||||||||||||||
September 30, | September 30, | September 30, | ||||||||||||||||||||||||||||
2014 | 2013 | % Change | 2014 | 2013 | % Change | 2014 | 2013 | % Change | ||||||||||||||||||||||
Chemical and petroleum | $ | 117.4 | $ | 109.5 | 7 | % | 63.3 | 62.2 | 2 | % | $ | 1,855 | $ | 1,760 | 5 | % | ||||||||||||||
Industrial and consumer products | 166.9 | 148.0 | 13 | % | 90.6 | 85.8 | 6 | % | 1,842 | 1,725 | 7 | % | ||||||||||||||||||
Agriculture and minerals | 104.6 | 97.1 | 8 | % | 55.7 | 53.1 | 5 | % | 1,878 | 1,829 | 3 | % | ||||||||||||||||||
Energy | 90.7 | 94.6 | (4 | %) | 81.8 | 84.0 | (3 | %) | 1,109 | 1,126 | (2 | %) | ||||||||||||||||||
Intermodal | 106.7 | 95.8 | 11 | % | 269.9 | 256.8 | 5 | % | 395 | 373 | 6 | % | ||||||||||||||||||
Automotive | 65.8 | 51.4 | 28 | % | 34.1 | 28.0 | 22 | % | 1,930 | 1,836 | 5 | % | ||||||||||||||||||
Carload revenues, carloads and units | 652.1 | 596.4 | 9 | % | 595.4 | 569.9 | 4 | % | $ | 1,095 | $ | 1,046 | 5 | % | ||||||||||||||||
Other revenue | 25.4 | 25.2 | 1 | % | ||||||||||||||||||||||||||
Total revenues (i) | $ | 677.5 | $ | 621.6 | 9 | % | ||||||||||||||||||||||||
(i) Included in revenues: | ||||||||||||||||||||||||||||||
Fuel surcharge | $ | 88.5 | $ | 86.8 | ||||||||||||||||||||||||||
23
Revenues | Carloads and Units | Revenue per Carload/Unit | ||||||||||||||||||||||||||||
Nine Months Ended | Nine Months Ended | Nine Months Ended | ||||||||||||||||||||||||||||
September 30, | September 30, | September 30, | ||||||||||||||||||||||||||||
2014 | 2013 | % Change | 2014 | 2013 | % Change | 2014 | 2013 | % Change | ||||||||||||||||||||||
Chemical and petroleum | $ | 337.7 | $ | 320.9 | 5 | % | 185.3 | 184.1 | 1 | % | $ | 1,822 | $ | 1,743 | 5 | % | ||||||||||||||
Industrial and consumer products | 472.2 | 434.3 | 9 | % | 263.5 | 254.7 | 3 | % | 1,792 | 1,705 | 5 | % | ||||||||||||||||||
Agriculture and minerals | 332.9 | 264.8 | 26 | % | 174.7 | 149.4 | 17 | % | 1,906 | 1,772 | 8 | % | ||||||||||||||||||
Energy | 250.3 | 256.2 | (2 | %) | 227.6 | 229.3 | (1 | %) | 1,100 | 1,117 | (2 | %) | ||||||||||||||||||
Intermodal | 293.4 | 262.2 | 12 | % | 758.6 | 722.7 | 5 | % | 387 | 363 | 7 | % | ||||||||||||||||||
Automotive | 177.8 | 148.0 | 20 | % | 94.6 | 81.0 | 17 | % | 1,879 | 1,827 | 3 | % | ||||||||||||||||||
Carload revenues, carloads and units | 1,864.3 | 1,686.4 | 11 | % | 1,704.3 | 1,621.2 | 5 | % | $ | 1,094 | $ | 1,040 | 5 | % | ||||||||||||||||
Other revenue | 70.3 | 67.3 | 4 | % | ||||||||||||||||||||||||||
Total revenues (i) | $ | 1,934.6 | $ | 1,753.7 | 10 | % | ||||||||||||||||||||||||
(i) Included in revenues: | ||||||||||||||||||||||||||||||
Fuel surcharge | $ | 253.7 | $ | 236.9 | ||||||||||||||||||||||||||
Freight revenues include revenue for transportation services and fuel surcharges. For the three months ended September 30, 2014, revenues and carload/unit volumes increased 9% and 4%, respectively, compared to the same period in 2013. For the nine months ended September 30, 2014, revenues and carload/unit volumes increased 10% and 5%, respectively, compared to the same period in 2013. Agriculture and minerals revenues increased $7.5 million and $68.1 million for the three and nine months ended September 30, 2014, respectively, compared to the same periods in 2013, due to an increase of $10.5 million and $61.9 million, respectively, in grain revenues. During the first half of 2013, grain volumes and average length of haul were adversely affected as a result of the severe drought conditions experienced in the Midwest region of the United States during 2012. Revenue per carload/unit increased by 5% for the three and nine months ended September 30, 2014, compared to the same periods in 2013, due to positive pricing impacts and commodity mix.
KCS’s fuel surcharges are a mechanism to adjust revenue based upon changing fuel prices. Fuel surcharges are calculated differently depending on the type of commodity transported. For most commodities, fuel surcharge is calculated using a fuel price from a prior time period that can be up to 60 days earlier. In a period of volatile fuel prices or changing customer business mix, changes in fuel expense and fuel surcharge may differ.
The following discussion provides an analysis of revenues by commodity group:
Revenues by commodity group for the three months ended September 30, 2014 | |
Chemical and petroleum. Revenues increased $7.9 million for the three months ended September 30, 2014, compared to the same period in 2013, due to a 5% increase in revenue per carload/unit and a 2% increase in carload/unit volumes. Revenues increased $16.8 million for the nine months ended September 30, 2014, compared to the same period in 2013, due to a 5% increase in revenue per carload/unit and a 1% increase in carload/unit volumes. Revenues increased due to positive pricing impacts in petroleum, plastics and chemicals. | 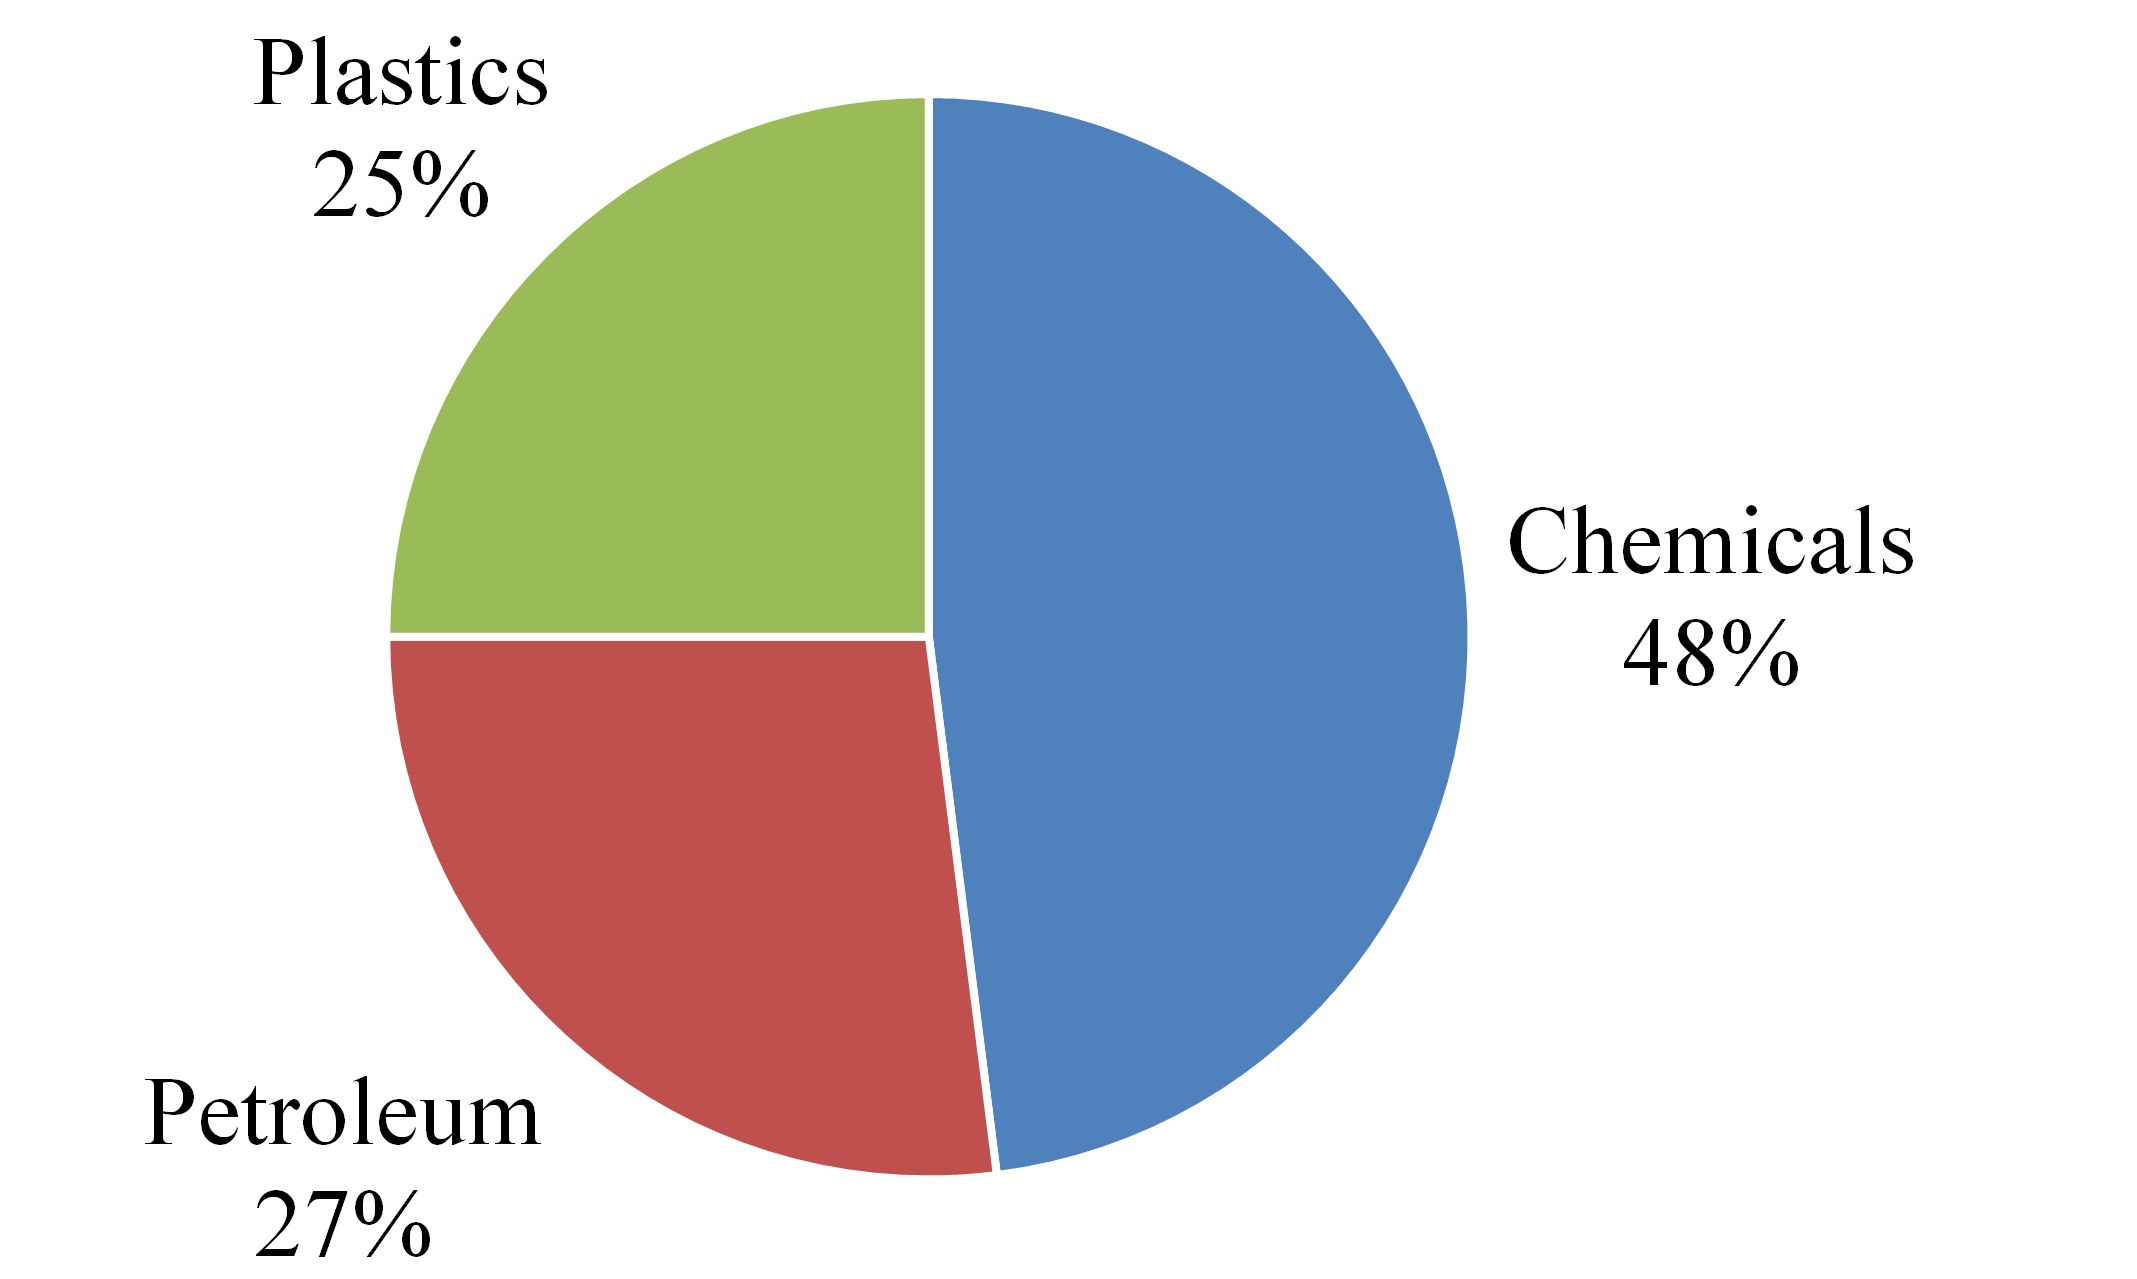 |
24
Revenues by commodity group for the three months ended September 30, 2014 | |
Industrial and consumer products. Revenues increased $18.9 million for the three months ended September 30, 2014, compared to the same period in 2013, due to a 7% increase in revenue per carload/unit and a 6% increase in carload/unit volumes. Revenues increased $37.9 million for the nine months ended September 30, 2014, compared to the same period in 2013, due to a 5% increase in revenue per carload/unit and a 3% increase in carload/unit volumes. Metals and scrap revenues increased due to strong demand, positive pricing impacts and increased length of haul. Pulp and paper revenues increased due to positive pricing impacts and higher volumes due to increased market demand and a customer’s temporary plant shutdown during the third quarter of 2013. | 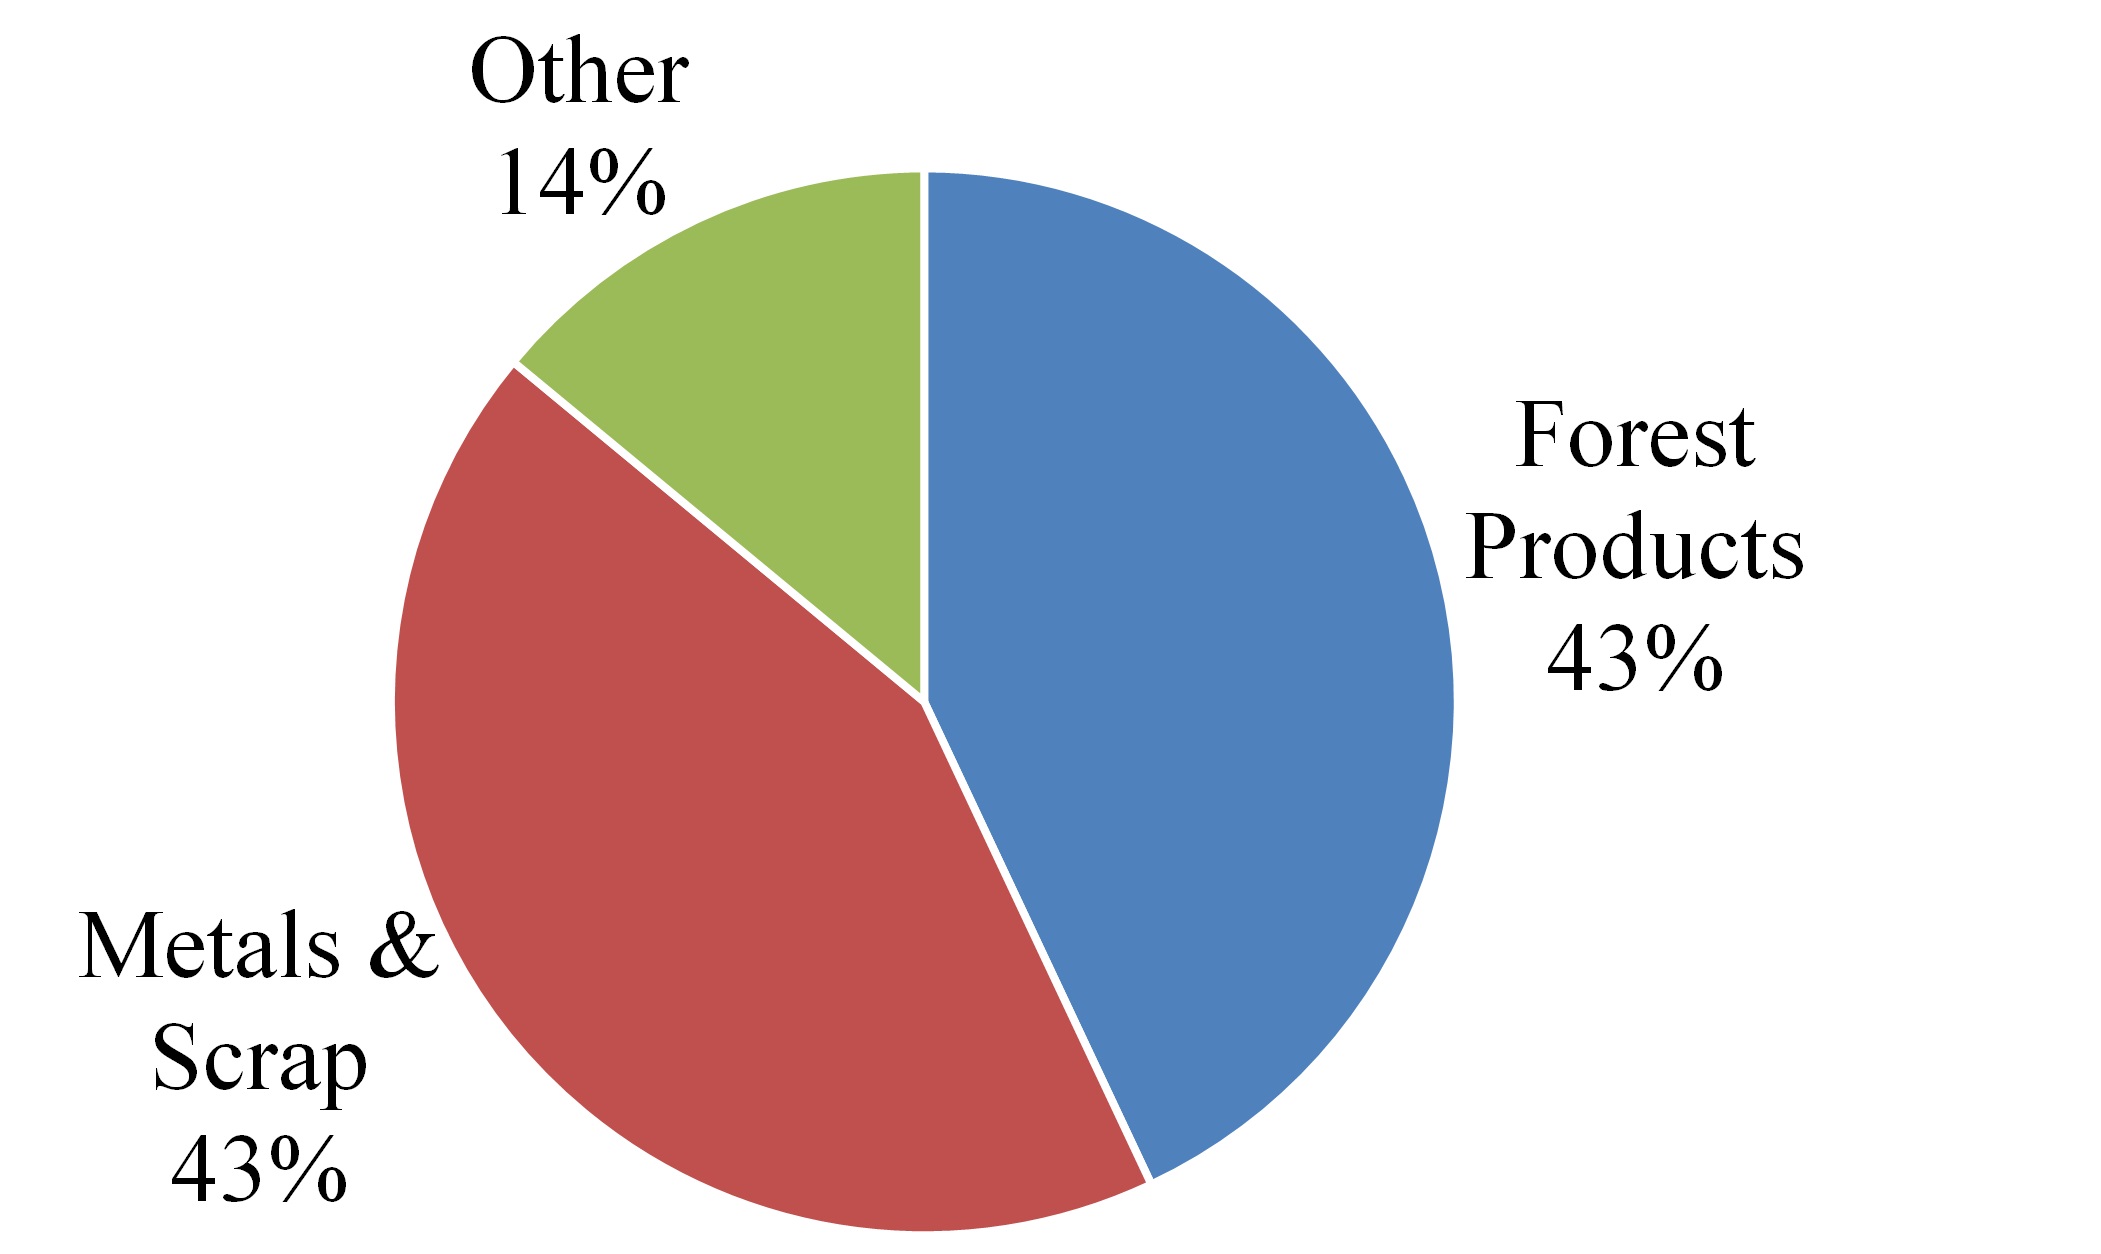 |
Agriculture and minerals. Revenues increased $7.5 million for the three months ended September 30, 2014, compared to the same period in 2013, due to a 5% increase in carload/unit volumes and a 3% increase in revenue per carload/unit. For the nine months ended September 30, 2014, revenues increased $68.1 million due to a 17% increase in carload/unit volumes and an 8% increase in revenue per carload/unit. For the three and nine months ended September 30, 2014, grain revenues increased $10.5 million and $61.9 million, respectively, as volumes and average length of haul were adversely affected in the first half of 2013 as a result of the severe drought conditions experienced in the Midwestern region of the United States during 2012. In addition, for the three months ended September 30, 2014, food products volumes decreased as a result of a customer's temporary plant shutdown. | 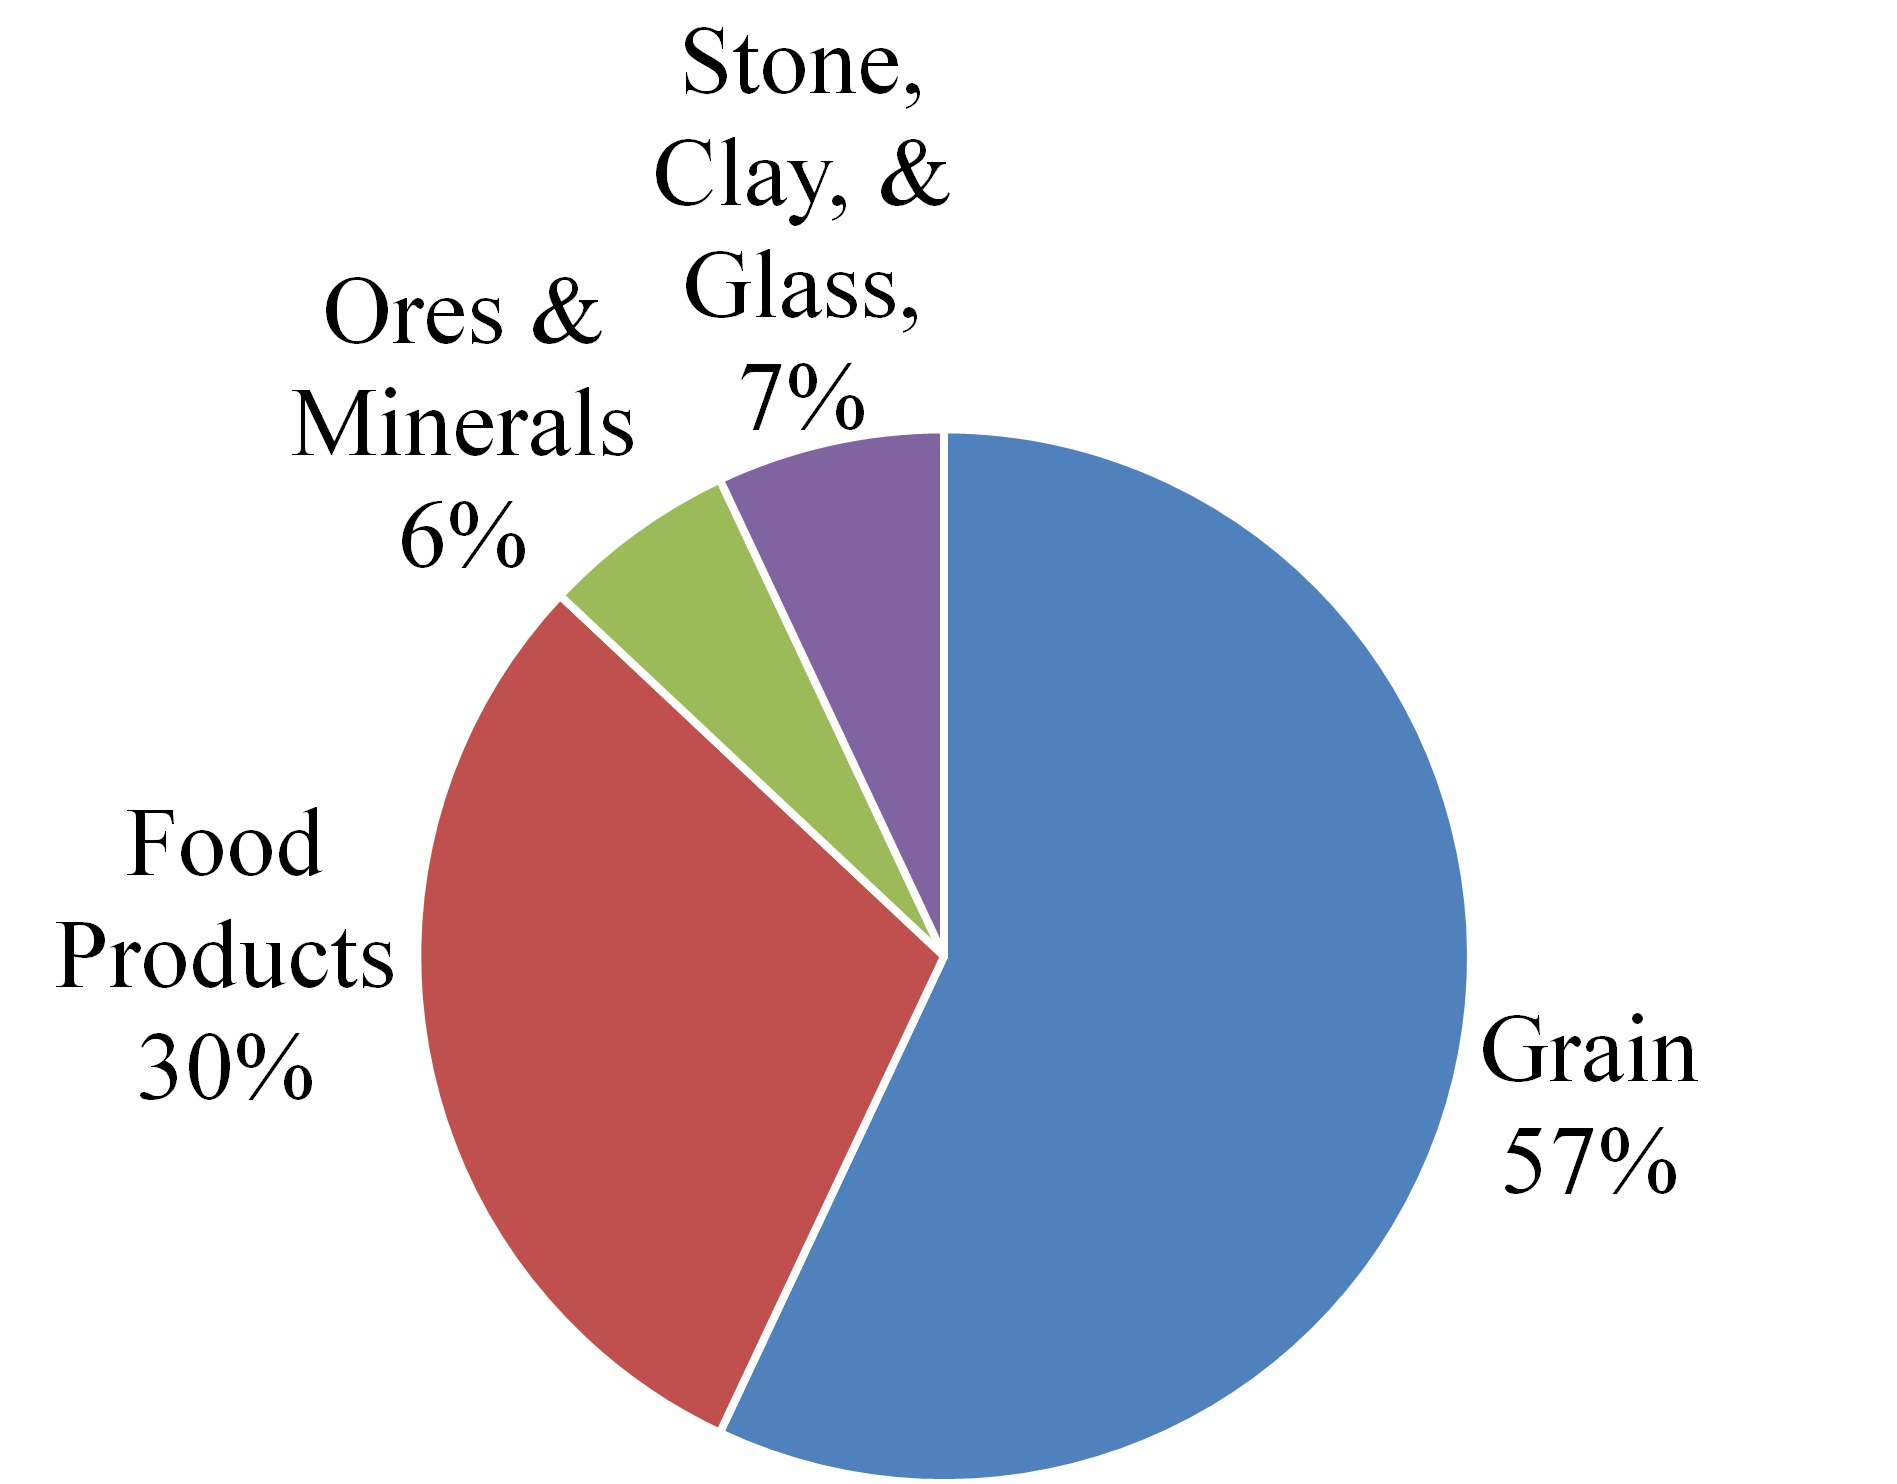 |
Energy. Revenues decreased $3.9 million for the three months ended September 30, 2014, compared to the same period in 2013, due to a 3% decrease in carload/unit volumes and a 2% decrease in revenue per carload/unit. Revenue per carload/unit decreases were driven by shorter length of haul. Volumes decreased due to longer cycle times and connecting carrier fluidity in moving utility coal and slowing frac sand growth due to lost business. This decrease was partially offset by crude oil growth due to new business. Revenues decreased $5.9 million for the nine months ended September 30, 2014, compared to the same period in 2014, due to a 2% decrease in revenue per carload/unit and a 1% decrease in carload/unit volumes. Revenue per carload/unit decreases were driven by shorter length of haul. Volumes decreased due to longer cycle times and connecting carrier fluidity in moving utility coal and lost crude oil business. This decrease was partially offset by strong frac sand demand in the first half of the year driven by higher crude oil prices. | 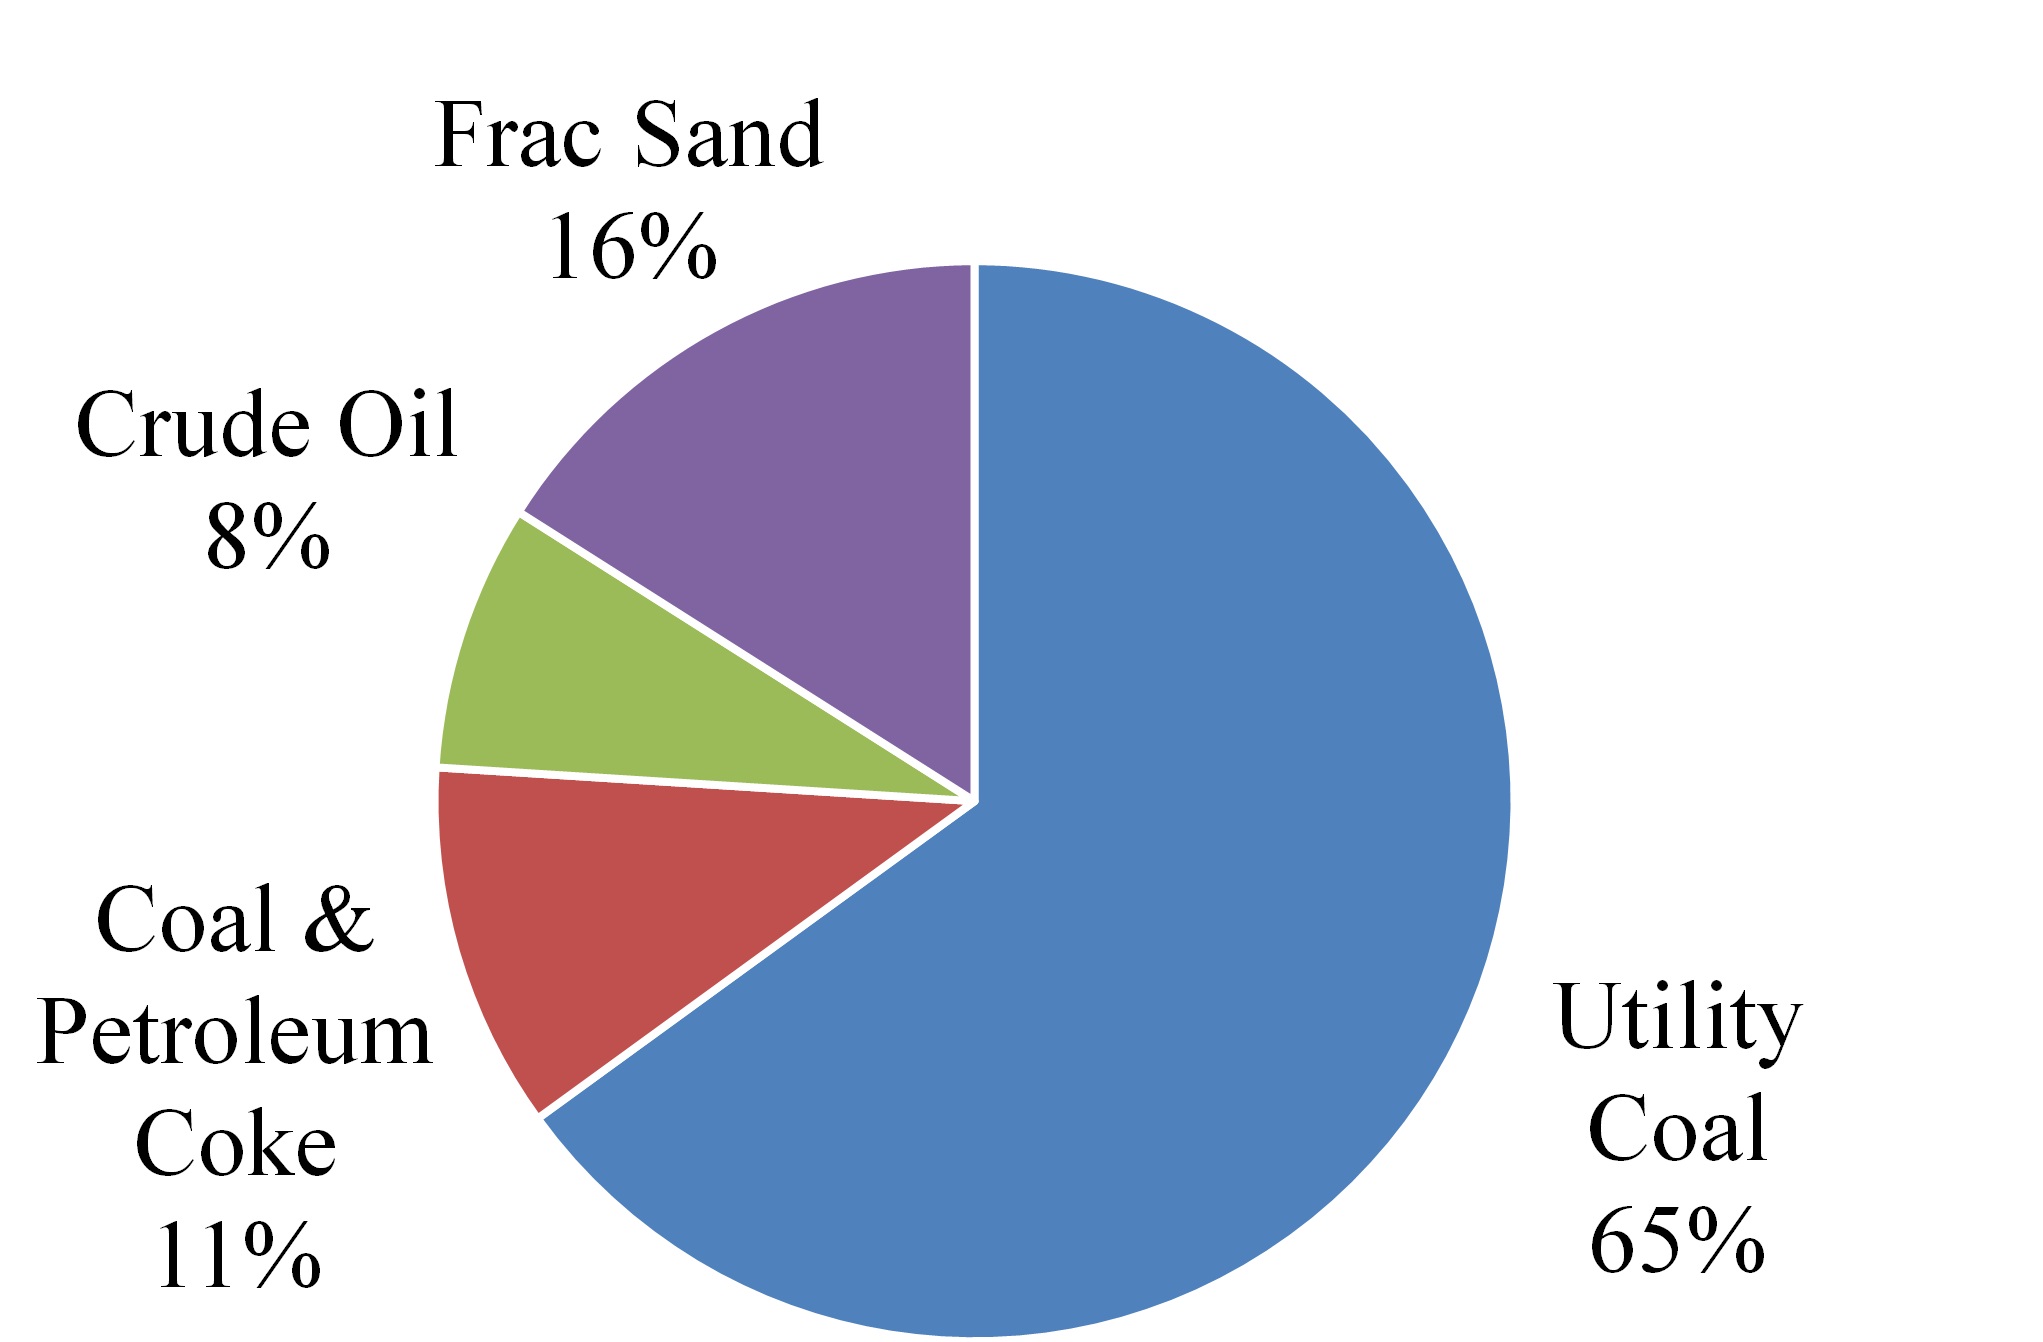 |
Intermodal. Revenues increased $10.9 million for the three months ended September 30, 2014, compared to the same period in 2013, due to a 6% increase in revenue per carload/unit and a 5% increase in carload/unit volumes. Revenues increased $31.2 million for the nine months ended September 30, 2014, compared to the same period in 2013, due to a 7% increase in revenue per carload/unit and a 5% increase in carload/unit volumes. Revenue per carload/unit increased as a result of cross border length of haul and pricing. Volume growth was driven by conversion of cross border and domestic general commodity truck traffic to rail, and trans-Pacific imports via the Port of Lazaro Cardenas.
25
Automotive. Revenues increased $14.4 million for the three months ended September 30, 2014, compared to the same period in 2013, due to a 22% increase in carload/unit volumes and a 5% increase in revenue per carload/unit. Revenues increased $29.8 million for the nine months ended September 30, 2014, compared to the same period in 2013, due to a 17% increase in carload/unit volumes and a 3% increase in revenue per carload/unit. Growth was driven by the opening of three automotive plants in Mexico and an increase in import/export volumes through the Port of Lazaro Cardenas.
Operating Expenses
Operating expenses, as shown below (in millions), increased $26.8 million and $128.2 million for the three and nine months ended September 30, 2014, respectively, compared to the same periods in 2013, due to higher carload/unit volumes. In addition, operating expenses for the nine months ended September 30, 2014, compared to the same period in 2013, increased due to lease termination costs.
Three Months Ended | ||||||||||||||
September 30, | Change | |||||||||||||
2014 | 2013 | Dollars | Percent | |||||||||||
Compensation and benefits | $ | 125.2 | $ | 111.4 | $ | 13.8 | 12 | % | ||||||
Purchased services | 64.2 | 57.2 | 7.0 | 12 | % | |||||||||
Fuel | 109.2 | 102.7 | 6.5 | 6 | % | |||||||||
Equipment costs | 28.4 | 39.5 | (11.1 | ) | (28 | %) | ||||||||
Depreciation and amortization | 65.0 | 57.2 | 7.8 | 14 | % | |||||||||
Materials and other | 56.1 | 53.3 | 2.8 | 5 | % | |||||||||
Total operating expenses | $ | 448.1 | $ | 421.3 | $ | 26.8 | 6 | % | ||||||
Nine Months Ended | ||||||||||||||
September 30, | Change | |||||||||||||
2014 | 2013 | Dollars | Percent | |||||||||||
Compensation and benefits | $ | 351.3 | $ | 328.4 | $ | 22.9 | 7 | % | ||||||
Purchased services | 183.2 | 160.4 | 22.8 | 14 | % | |||||||||
Fuel | 320.8 | 286.6 | 34.2 | 12 | % | |||||||||
Equipment costs | 89.6 | 120.0 | (30.4 | ) | (25 | %) | ||||||||
Depreciation and amortization | 190.8 | 165.0 | 25.8 | 16 | % | |||||||||
Materials and other | 165.4 | 150.8 | 14.6 | 10 | % | |||||||||
Lease termination costs | 38.3 | — | 38.3 | 100 | % | |||||||||
Total operating expenses | $ | 1,339.4 | $ | 1,211.2 | $ | 128.2 | 11 | % | ||||||
Compensation and benefits. Compensation and benefits increased $13.8 million and $22.9 million for the three and nine months ended September 30, 2014, respectively, compared to the same periods in 2013, due to carload/unit volumes, incentive compensation, higher headcount and annual salary rate increases. The increase in compensation and benefits for the nine months ended September 30, 2014 was partially offset by the weakening of the Mexican peso against the U.S. dollar.
Purchased services. Purchased services expense increased $7.0 million and $22.8 million for the three and nine months ended September 30, 2014, respectively, compared to the same periods in 2013, due to carload/unit volumes and increases in track maintenance, consulting and legal expenses.
Fuel. Fuel expense increased $6.5 million and $34.2 million for the three and nine months ended September 30, 2014, respectively, compared to the same periods in 2013, due to higher consumption and diesel fuel prices. The average price per gallon, including the effects of the weakening of the Mexican peso against the U.S. dollar, was $3.10 for the three and nine months ended September 30, 2014, respectively, compared to $3.06 and $3.04 for the same periods in 2013.
Equipment costs. Equipment costs decreased $11.1 million and $30.4 million for the three and nine months ended September 30, 2014, respectively, compared to the same periods in 2013, due to lower lease expense as a result of the purchase of equipment under existing operating leases and replacement equipment as certain operating leases expired. As a result of reduced lease expense from the conversion of equipment from leased to owned and reduced net car hire expense due to the increase in owned equipment, total equipment costs are expected to decrease by approximately 25% for the year ended December 31, 2014, as compared to the same period in 2013.
26
Depreciation and amortization. Depreciation and amortization expense increased $7.8 million and $25.8 million for the three and nine months ended September 30, 2014, respectively, compared to the same periods in 2013, due to a larger asset base, including the purchase of equipment under existing operating leases and replacement equipment as certain operating leases expired. As a result of expected capital expenditures and the conversion of equipment from leased to owned, total depreciation and amortization expense is expected to increase by approximately 15% for the year ended December 31, 2014, as compared to the same period in 2013.
Materials and other. Materials and other expense increased $2.8 million for the three months ended September 30, 2014, compared to the same period in 2013, due to increases in materials and supplies expense and employee expenses, partially offset by lower casualty expense. Materials and other expense increased $14.6 million for the nine months ended September 30, 2014, compared to the same period in 2013, due to increases in materials and supplies expense, employee expenses, and casualty expense. In addition, the Company recognized a recovery from a legal dispute in the first quarter of 2013.
Lease termination costs. Lease termination costs were $38.3 million for the nine months ended September 30, 2014, due to the early termination of certain operating leases and the related purchase of the equipment. The Company did not incur lease termination costs during the third quarter of 2014.
Non-Operating Income and Expenses
Equity in net earnings of unconsolidated affiliates. Equity in net earnings from unconsolidated affiliates increased $0.2 million and $2.8 million for the three and nine months ended September 30, 2014, respectively, compared to the same periods in 2013. For the nine months ended September 30, 2014, equity in earnings from the operations of Panama Canal Railway Company (“PCRC”) increased as PCRC’s volumes were adversely affected during the first half of 2013 as the movement of containers was either trucked or rerouted to other destinations as a result of delays caused by a system implementation at the Port of Balboa.
Interest expense. Interest expense decreased $0.4 million and $6.7 million for the three and nine months ended September 30, 2014, respectively, compared to the same periods in 2013, due to lower average interest rates as a result of the Company’s refinancing activities during 2013 and the utilization of the commercial paper program during 2014. These decreases were partially offset by higher average debt balances driven by financing incurred during 2013. During the three and nine months ended September 30, 2014, the average debt and commercial paper balances were $2,202.9 million and $2,145.9 million, respectively, compared to $1,806.8 million and $1,731.1 million for the same periods in 2013. Average interest rates during the three and nine months ended September 30, 2014 were 3.2% and 3.3%, respectively, compared to 4.0% and 4.6% for the same periods in 2013.
Debt retirement costs. Debt retirement costs were $2.4 million for the three months ended September 30, 2013. The Company did not incur debt retirement costs during the third quarter of 2014. For the nine months ended September 30, 2014 and 2013, debt retirement costs were $6.6 million and $113.8 million, respectively. The debt retirement costs include tender and call premiums, original issue discounts and the write-off of unamortized debt issuance costs associated with the Company’s various debt refinancing and redemption activities.
Foreign exchange loss. For the three and nine months ended September 30, 2014, foreign exchange loss was $12.5 million and $4.1 million, respectively, compared to a foreign exchange loss of $1.4 million and $10.1 million for the same periods in 2013. Foreign exchange loss includes the re-measurement and settlement of monetary assets and liabilities denominated in Mexican pesos and the loss on foreign currency forward contracts.
For the three and nine months ended September 30, 2014, the re-measurement and settlement of monetary assets and liabilities denominated in Mexican pesos resulted in a foreign exchange loss of $2.4 million and $2.7 million, respectively, compared to a foreign exchange loss of $0.1 million and $3.8 million for the same periods in 2013.
The Company enters into foreign currency forward contracts to hedge its net exposure to fluctuations in the Mexican cash tax obligation due to changes in the value of the Mexican peso against the U.S. dollar. For the three and nine months ended September 30, 2014, foreign exchange loss on foreign currency forward contracts was $10.1 million and $1.4 million, respectively, compared to a loss of $1.3 million and $6.3 million for the same periods in 2013.
27
Income tax expense. Income tax expense increased $1.9 million and $48.5 million for the three and nine months ended September 30, 2014, respectively, compared to the same periods in 2013, due to higher pre-tax income, partially offset by lower effective tax rates. The components of the effective tax rates for the three and nine months ended September 30, 2014, compared to the same periods in 2013 are as follows:
Three Months Ended | Nine Months Ended | ||||||||||
September 30, | September 30, | ||||||||||
2014 | 2013 | 2014 | 2013 | ||||||||
Statutory rate in effect | 35.0 | % | 35.0 | % | 35.0 | % | 35.0 | % | |||
Tax effect of: | |||||||||||
Difference between U.S. and foreign tax rate | (3.4 | %) | (3.1 | %) | (3.3 | %) | (3.1 | %) | |||
State and local income tax provision, net | 1.3 | % | 1.8 | % | 1.3 | % | 1.8 | % | |||
Foreign exchange (i) | (1.8 | %) | 0.2 | % | (0.2 | %) | 0.5 | % | |||
Reversal of previously recognized benefit due to court ruling | — | — | — | 1.2 | % | ||||||
Other, net | 0.9 | % | 0.8 | % | 0.4 | % | 0.2 | % | |||
Effective tax rate | 32.0 | % | 34.7 | % | 33.2 | % | 35.6 | % | |||
(i) | Mexican income taxes are paid in Mexican pesos, and as a result, the effective income tax rate reflects fluctuations in the value of the Mexican peso against the U.S. dollar measured by the forward exchange rate. Most significantly, any gain or loss from the revaluation of net U.S. dollar-denominated monetary liabilities (primarily debt) into Mexican pesos is included in Mexican taxable income under Mexican tax law. As a result, a strengthening of the Mexican peso against the U.S. dollar for the reporting period will generally increase the Mexican cash tax obligation and the effective income tax rate, and a weakening of the Mexican peso against the U.S. dollar for the reporting period will generally decrease the Mexican cash tax obligation and the effective tax rate. To hedge its exposure to this risk, the Company enters into foreign currency forward contracts, which are measured at fair value each period and any change in fair value is recognized in foreign exchange gain (loss) within the consolidated statements of income as described above. Refer to Note 6 Derivative Instruments for more information. |
Liquidity and Capital Resources
Overview
The Company focuses its cash and capital resources on investing in the business, shareholder returns and optimizing its capital structure.
The Company believes, based on current expectations, that cash and other liquid assets, operating cash flows, access to debt and equity capital markets, and other available financing resources will be sufficient to fund anticipated operating expenses, capital expenditures, debt service costs, dividends and other commitments in the foreseeable future. The Company’s current financing instruments contain restrictive covenants which limit or preclude certain actions; however, the covenants are structured such that the Company has sufficient flexibility to conduct its operations. The Company was in compliance with all of its debt covenants as of September 30, 2014.
Though KCS’s cash flows from operations are expected to be sufficient to fund operations, capital expenditures, debt service and dividends, the Company may, from time to time, incur debt to refinance existing indebtedness, purchase equipment under operating leases, or to fund equipment additions or new investments.
During the nine months ended September 30, 2014, the Company purchased $300.8 million of equipment under existing operating leases and replacement equipment as certain operating leases expired. These purchases were primarily funded with proceeds from the senior notes issued during the fourth quarter of 2013.
During the nine months ended September 30, 2014, the Company’s Board of Directors declared quarterly cash dividends on its common stock of $0.280 per share (total of $92.7 million). Subject to the discretion of the Board of Directors, capital availability and a determination that cash dividends continue to be in the best interest of its stockholders, the Company intends to pay a quarterly dividend on an ongoing basis.
On September 30, 2014, total available liquidity (the unrestricted cash balance plus revolving credit facility and commercial paper program availability) was $623.8 million. As of September 30, 2014, the total cash and cash equivalents held outside of the U.S. in foreign subsidiaries was $246.6 million. The Company expects that this cash will be available to fund operations without incurring additional taxes.
28
In January 2014, the Company amended its credit agreements to eliminate certain representations as a condition to borrowing under the KCSR and KCSM revolving facilities, provided for the prepayment of all outstanding term loans under the KCSR credit agreement on or before February 13, 2014, and increased the borrowing capacity under KCSR’s revolving credit facility (the “KCSR Revolving Facility”) to $450.0 million. In addition, the Company established a $450.0 million commercial paper program for KCSR and a $200.0 million commercial paper program for KCSM. The Company’s revolving facilities serve as a backstop for the commercial paper programs and these commercial paper programs generally serve as the Company’s primary means of short-term funding. As of September 30, 2014, KCSR had $312.0 million outstanding amount issued under the KCSR commercial paper program and KCSM had no outstanding amount issued under the KCSM commercial paper program.
KCSM 8.0% Senior Notes. On February 3, 2014, KCSM redeemed all of the remaining $62.8 million aggregate principal amount of the KCSM 8.0% senior unsecured notes due February 1, 2018, at a redemption price (expressed as a percentage of the principal amount) of 104.0%, using a portion of the proceeds from the KCSM floating rate senior unsecured notes due October 28, 2016, issued in the fourth quarter of 2013.
KCSR Revolving Credit Facility and Term Loan. On February 7, 2014, KCSR borrowed $175.0 million under the KCSR Revolving Facility and used the proceeds and cash on hand to repay the outstanding $245.3 million principal amount of the KCSR term loan. On February 14, 2014, KCSR repaid the outstanding $175.0 million principal amount of the KCSR Revolving Facility using proceeds received under the KCSR Commercial Paper Program.
For additional discussion of the agreements representing the indebtedness of KCS, see “Liquidity and Capital Resources — Debt and Capital Structure” in the Company’s Annual Report on Form 10-K for the year ended December 31, 2013.
KCS’s operating results and financing alternatives can be unexpectedly impacted by various factors, some of which are outside of its control. For example, if KCS were to experience a reduction in revenues or a substantial increase in operating costs or other liabilities, its earnings could be significantly reduced, increasing the risk of non-compliance with debt covenants. Additionally, the Company is subject to external factors impacting debt and equity capital markets and its ability to obtain financing under reasonable terms is subject to market conditions. Volatility in capital markets and the tightening of market liquidity could impact KCS’s access to capital. Further, KCS’s cost of debt can be impacted by independent rating agencies which assign debt ratings based on certain factors including credit measurements such as interest coverage and leverage ratios, liquidity and competitive position.
Cash Flow Information
Summary cash flow data follows (in millions):
Nine Months Ended | |||||||
September 30, | |||||||
2014 | 2013 | ||||||
Cash flows provided by (used for): | |||||||
Operating activities | $ | 681.8 | $ | 572.5 | |||
Investing activities | (722.8 | ) | (563.8 | ) | |||
Financing activities | (102.7 | ) | 14.6 | ||||
Net increase (decrease) in cash and cash equivalents | (143.7 | ) | 23.3 | ||||
Cash and cash equivalents beginning of year | 429.5 | 72.6 | |||||
Cash and cash equivalents end of period | $ | 285.8 | $ | 95.9 | |||
Cash flows from operating activities increased $109.3 million for the nine month period ended September 30, 2014, compared to the same period in 2013, due to increased revenues, an increase in cash generated from working capital items resulting mainly from the timing of certain payments and receipts, and distributions from unconsolidated affiliates. Net cash used for investing activities increased $159.0 million due to the purchase or replacement of equipment under existing operating leases. Additional information regarding capital expenditures is provided below. During 2014, net financing cash outflows were $102.7 million due to the payment of dividends of $85.7 million and the net repayment of long-term debt was offset by the net proceeds from the issuance of commercial paper. During 2013, net financing cash inflows were $14.6 million due to the net proceeds from long-term borrowings of $166.9 million, partially offset with the payment of $109.3 million in debt costs and $47.6 million in dividends.
29
Capital Expenditures
KCS has funded, and expects to continue to fund capital expenditures with operating cash flows, debt financing, short-term borrowings and equipment leases.
The following table summarizes capital expenditures by type (in millions):
Nine Months Ended | |||||||
September 30, | |||||||
2014 | 2013 | ||||||
Roadway capital program | $ | 214.5 | $ | 230.5 | |||
Locomotives and freight cars | 117.4 | 89.2 | |||||
Capacity | 40.1 | 37.4 | |||||
Information technology | 17.8 | 8.6 | |||||
Other | 7.9 | 6.3 | |||||
Total capital expenditures (accrual basis) | 397.7 | 372.0 | |||||
Change in capital accruals | 5.8 | 9.8 | |||||
Total cash capital expenditures | $ | 403.5 | $ | 381.8 | |||
Purchase or replacement of equipment under operating leases | |||||||
Locomotives | $ | 76.3 | $ | 155.1 | |||
Freight cars | 224.5 | — | |||||
Total purchase or replacement of equipment under operating leases (accrual basis) | 300.8 | 155.1 | |||||
Change in capital accruals | 1.4 | — | |||||
Total cash purchase or replacement of equipment under operating leases | $ | 302.2 | $ | 155.1 | |||
Generally, the Company’s capital program consists of capital replacement and equipment. For 2014, internally generated cash flows and short-term borrowings are expected to fund cash capital expenditures, which are currently estimated to be between $690.0 million and $740.0 million. In addition, the purchase or replacement of equipment under existing operating leases for the year 2014 is substantially complete. However, the Company is continuously reviewing its equipment under existing operating leases. Any additional purchase or replacement of equipment under operating leases through the end of 2014 is expected to be funded with external borrowings.
Other Matters
Approximately 80% of KCSR employees are covered by collective bargaining agreements. KCSR participates in industry-wide bargaining as a member of the National Carriers’ Conference Committee. Long-term settlement agreements were reached and ratified during 2011 and the first half of 2012 covering all of the participating unions. These agreements will be in effect through December 2015.
KCSM Servicios, S.A. de C.V. (“KCSM Servicios”), a wholly owned subsidiary of KCS, provides employee services to KCSM, and KCSM pays KCSM Servicios market-based rates for these services. KCSM Servicios union employees are covered by one labor agreement, which was signed on June 23, 1997, between KCSM and the Sindicato de Trabajadores Ferrocarrileros de la República Mexicana (“Mexican Railroad Union”), for a term of fifty years, for the purpose of regulating the relationship between the parties. Approximately 80% of KCSM Servicios employees are covered by this labor agreement. The compensation terms under this labor agreement are subject to renegotiation on an annual basis and all other benefits are subject to negotiation every two years. The union labor negotiations with the Mexican Railroad Union have not historically resulted in any strike, boycott or other disruption in KCSM’s business operations. On October 14, 2014, compensation terms covering the period from July 1, 2014 through June 30, 2015, were finalized between KCSM Servicios and the Mexican Railroad Union. The finalization of the compensation terms will not have a significant effect on the consolidated financial statements.
30
Item 3. | Quantitative and Qualitative Disclosures about Market Risk |
There was no material change during the quarter from the information set forth in Part II, Item 7A. “Quantitative and Qualitative Disclosure about Market Risk” in the Annual Report on Form 10-K for the year ended December 31, 2013.
Item 4. | Controls and Procedures |
(a) Disclosure Controls and Procedures
As of the end of the period for which this Quarterly Report on Form 10-Q is filed, the Company’s Chief Executive Officer and Chief Financial Officer have each reviewed and evaluated the effectiveness of the Company’s disclosure controls and procedures (as defined in Rules 13a-15(e) and 15d-15(e) of the Securities Exchange Act of 1934, as amended (the “Exchange Act”)). Based on that evaluation, the Chief Executive Officer and Chief Financial Officer have each concluded that the Company’s current disclosure controls and procedures are effective to ensure that information required to be disclosed by the Company in reports that it files or submits under the Exchange Act is recorded, processed, summarized and reported within the time periods specified in the Securities and Exchange Commission rules and forms, and include controls and procedures designed to ensure that information required to be disclosed by the Company in such reports is accumulated and communicated to the Company’s management, including the Chief Executive Officer and Chief Financial Officer, as appropriate, to allow timely decisions regarding required disclosure.
(b) Changes in Internal Control over Financial Reporting
There have not been any changes in the Company’s internal control over financial reporting that occurred during the third quarter of 2014 that have materially affected, or are reasonably likely to materially affect, the Company’s internal control over financial reporting.
31
PART II — OTHER INFORMATION
Item 1. | Legal Proceedings |
For information related to the Company’s legal proceedings, see Note 10, Commitments and Contingencies under Part I, Item 1 of this quarterly report on Form 10-Q.
Item 1A. | Risk Factors |
There were no material changes during the quarter to the Risk Factors disclosed in Item 1A — “Risk Factors” in our annual report on Form 10-K for the year ended December 31, 2013.
Item 2. | Unregistered Sales of Equity Securities and Use of Proceeds |
None.
Item 3. | Defaults upon Senior Securities |
None.
Item 4. | Mine Safety Disclosures |
Not applicable.
Item 5. | Other Information |
None.
32
Item 6. | Exhibits |
Exhibit No. | Description of Exhibits Filed with this Report | |
31.1 | Principal Executive Officer’s Certification Pursuant to Section 302 of the Sarbanes-Oxley Act of 2002 is attached to this Form 10-Q as Exhibit 31.1. | |
31.2 | Principal Financial Officer’s Certification Pursuant to Section 302 of the Sarbanes-Oxley Act of 2002 is attached to this Form 10-Q as Exhibit 31.2. | |
32.1 | Principal Executive Officer’s Certification furnished Pursuant to Section 906 of the Sarbanes-Oxley Act of 2002 is attached to this Form 10-Q as Exhibit 32.1. | |
32.2 | Principal Financial Officer’s Certification furnished Pursuant to Section 906 of the Sarbanes-Oxley Act of 2002 is attached to this Form 10-Q as Exhibit 32.2. | |
101 | The following unaudited financial information from Kansas City Southern’s Quarterly Report on Form 10-Q for the quarter ended September 30, 2014, formatted in XBRL (Extensible Business Reporting Language) includes: (i) Consolidated Statements of Income for the three and nine months ended September 30, 2014 and 2013, (ii) Consolidated Statements of Comprehensive Income for the three and nine months ended September 30, 2014 and 2013, (iii) Consolidated Balance Sheets as of September 30, 2014 and December 31, 2013, (iv) Consolidated Statements of Cash Flows for the nine months ended September 30, 2014 and 2013, and (v) the Notes to Consolidated Financial Statements. | |
Exhibit No. | Description of Exhibits Incorporated by Reference | |
3.1 | Kansas City Southern Bylaws, amended and restated as of September 26, 2014, filed as Exhibit 3.1 to the Company’s Current Report on Form 8-K, filed on September 30, 2014 (File No. 1-4717), are incorporated herein by reference as Exhibit 3.1. | |
33
SIGNATURES
Pursuant to the requirements of the Securities Exchange Act of 1934, the Company has duly caused this report to be signed on its behalf by the undersigned thereunto duly authorized and in the capacities indicated on October 17, 2014.
Kansas City Southern |
/s/ MICHAEL W. UPCHURCH |
Michael W. Upchurch |
Executive Vice President and Chief Financial Officer (Principal Financial Officer) |
/s/ MARY K. STADLER |
Mary K. Stadler |
Senior Vice President and Chief Accounting Officer |
(Principal Accounting Officer) |
34