Attached files
| file | filename |
|---|---|
| 8-K - 8-K - Daseke, Inc. | dske-20201117x8k.htm |
Exhibit 99.1
| Investor Presentation (NASDAQ: DSKE) November 2020 |

| Important Disclaimers 2 Forward-Looking Statements This presentation contains “forward-looking statements” within the meaning of the Private Securities Litigation Reform Act of 1995. All statements, other than statements of historical fact, are forward-looking statements. Forward-looking statements may be identified by the use of words such as “may,” “will,” “continue,” “forecast,” “intend,” “seek,” “target,” “anticipate,” “believe,” “expect,” “estimate,” “plan,” “outlook,” “should,” “could,” “would,” “predict,” “potential,” and “project,” the negative of these terms, or other comparable terminology and similar expressions. Forward-looking statements may include projected financial information and results as well as statements about Daseke’s goals, including its restructuring plans; Daseke’s financial strategy, liquidity and capital required for its business strategy and plans; and general economic conditions. The forward-looking statements contained herein are based on information available as of the date of this news release and current expectations, forecasts and assumptions. While management believes that these forward-looking statements are reasonable as and when made, there can be no assurance that future developments affecting us will be those that Daseke anticipates, and readers are cautioned not to place undue reliance on the forward-looking statements. A number of factors, many of which are beyond our control, could cause actual results or outcomes to differ materially from those indicated by the forward-looking statements contained herein. These factors include, but are not limited to, general economic and business risks, such as downturns in customers’ business cycles and disruptions in capital and credit markets (including as a result of the coronavirus (COVID-19) pandemic or other global and national heath epidemics or concerns); Daseke’s ability to adequately address downward pricing and other competitive pressures; driver shortages and increases in driver compensation or owner-operator contracted rates; Daseke’s ability to execute and realize all of the expected benefits of its integration, business improvement and comprehensive restructuring plans; loss of key personnel; Daseke’s ability to realize all of the intended benefits from recent or future acquisitions; Daseke’s ability to complete recent or future divestitures successfully; seasonality and the impact of weather and other catastrophic events; fluctuations in the price or availability of diesel fuel; increased prices for, or decreases in the availability of, new revenue equipment and decreases in the value of used revenue equipment; Daseke’s ability to generate sufficient cash to service all of its indebtedness and Daseke’s ability to finance its capital requirements; restrictions in Daseke’s existing and future debt agreements; increases in interest rates; changes in existing laws or regulations, including environmental and worker health safety laws and regulations and those relating to tax rates or taxes in general; the impact of governmental regulations and other governmental actions related to Daseke and its operations; insurance and claims expenses; and litigation and governmental proceedings. For additional information regarding known material factors that could cause our actual results to differ from those expressed in forward-looking statements, please see Daseke’s filings with the Securities and Exchange Commission (the “SEC”), available at www.sec.gov, including Daseke’s Annual Report on Form 10-K filed with the SEC on March 10, 2020 and subsequent Quarterly Reports on Form 10-Q, particularly the section titled “Risk Factors.” The effect of the COVID-19 pandemic may remain prevalent for a significant period of time and may continue to adversely affect the Company’s business, results of operations and financial condition even after the COVID-19 pandemic has subsided and “stay at home” mandates have been lifted. The extent to which the COVID-19 pandemic impacts the Company will depend on numerous evolving factors and future developments that we are not able to predict. There are no comparable recent events that provide guidance as to the effect the COVID-19 global pandemic may have, and, as a result, the ultimate impact of the pandemic is highly uncertain and subject to change. Additionally, the Company will regularly evaluate its capital structure and liquidity position. From time to time and as opportunities arise, the Company may access the debt capital markets and modify its debt arrangements to optimize its capital structure and liquidity position. Daseke does not undertake any obligation to update forward-looking statements to reflect events or circumstances after the date as of when they were made, whether as a result of new information, future events or otherwise, except as may be required under applicable securities laws. You should not place undue reliance on these forward-looking statements. Non-GAAP Financial Measures This presentation includes non-GAAP financial measures for the Company and its reporting segments. The Company believes its presentation of Non-GAAP financial measures is useful because it provides investors and industry analysts the same information that the Company uses internally for purposes of assessing its core operating performance. You can find the reconciliations of these measures to the nearest comparable GAAP measure in the Appendix of this presentation. Please note that non-GAAP measures are not a substitute for, or more meaningful than, net income (loss), cash flows from operating activities, operating income or any other measure prescribed by GAAP, and there are limitations to using non-GAAP measures. Certain items excluded from these non- GAAP measures are significant components in understanding and assessing a company’s financial performance, such as a company’s cost of capital, tax structure and the historic costs of depreciable assets. Also, other companies in Daseke’s industry may define these non‐GAAP measures differently than Daseke does, and as a result, it may be difficult to use these non‐GAAP measures to compare the performance of those companies to Daseke’s performance. Because of these limitations, these non-GAAP measures should not be considered a measure of the income generated by Daseke’s business or discretionary cash available to it to invest in the growth of its business. Daseke’s management compensates for these limitations by relying primarily on Daseke’s GAAP results and using these non-GAAP measures supplementally. Daseke defines Adjusted EBITDA as net income (loss) plus (i) depreciation and amortization, (ii) interest expense, and other fees and charges associated with financings, net of interest income, (iii) income taxes, (iv) acquisition-related transaction expenses (including due diligence costs, legal, accounting and other advisory fees and costs, retention and severance payments and financing fees and expenses), (v) business transformation costs, (vi) non-cash impairment, (vii) restructuring charges, (viii) stock compensation expense, and (ix) impaired lease termination. Daseke defines Adjusted EBITDA Margin as Adjusted EBITDA as a percentage of total revenue. Daseke defines Adjusted Net Income (Loss) as net income (loss) adjusted for acquisition related transaction expenses, business transformation costs, non-cash impairments, restructuring charges, amortization of intangible assets, the net impact of step-up in basis of acquired assets and unusual or non-regularly recurring expenses or recoveries. Daseke defines Adjusted Operating Expenses as (a) total operating expenses (i) less, acquisition-related transaction expenses, non-cash impairment charges, unusual or non-regularly recurring expenses or recoveries, (ii) less, business transformation costs, (iii) adjusted for impaired lease termination and (iv) further adjusted for the net impact of the step-up in basis (such as increased depreciation and amortization expense) and amortization of identifiable intangible assets resulting from acquisitions. Daseke defines Adjusted Operating Income (Loss) as (a) total revenue less (b) Adjusted Operating Expenses. Daseke defines Adjusted Operating Ratio as (a) Adjusted Operating Expenses, as a percentage of (b) total revenue.. Daseke defines Free Cash Flow as net cash provided by operating activities less purchases of property and equipment, plus proceeds from sale of property and equipment as such amounts are shown on the face of the Statements of Cash Flows. Daseke defines Net Debt as total debt less cash. See the Appendix for directly comparable GAAP measures. Industry and Market Data This presentation includes market data and other statistical information from third party sources, including independent industry publications, government publications and other published independent sources. Although Daseke believes these third-party sources are reliable as of their respective dates, Daseke has not independently verified the accuracy or completeness of this information. |
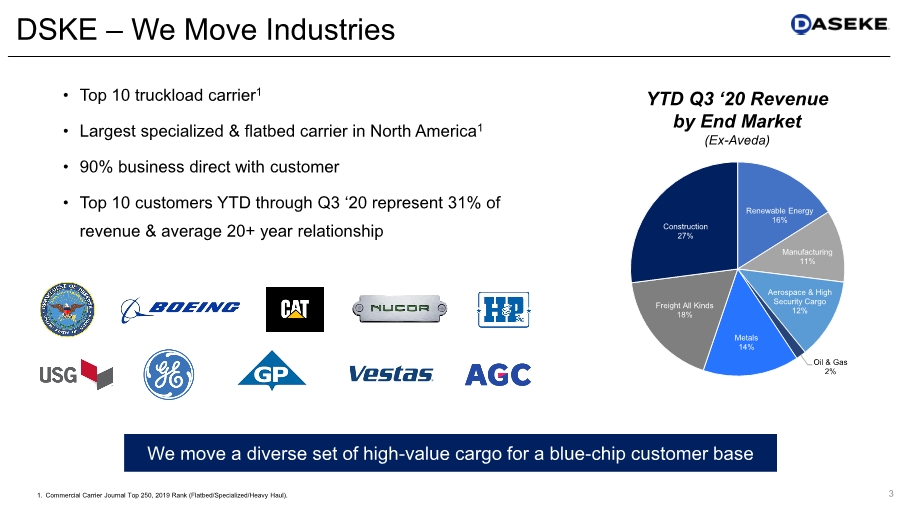
| • Top 10 truckload carrier1 • Largest specialized & flatbed carrier in North America1 • 90% business direct with customer • Top 10 customers YTD through Q3 ‘20 represent 31% of revenue & average 20+ year relationship 3 1. Commercial Carrier Journal Top 250, 2019 Rank (Flatbed/Specialized/Heavy Haul). DSKE – We Move Industries We move a diverse set of high-value cargo for a blue-chip customer base YTD Q3 ‘20 Revenue by End Market (Ex-Aveda) Renewable Energy 16% Manufacturing 11% Aerospace & High Security Cargo 12% Oil & Gas 2% Metals 14% Freight All Kinds 18% Construction 27% |
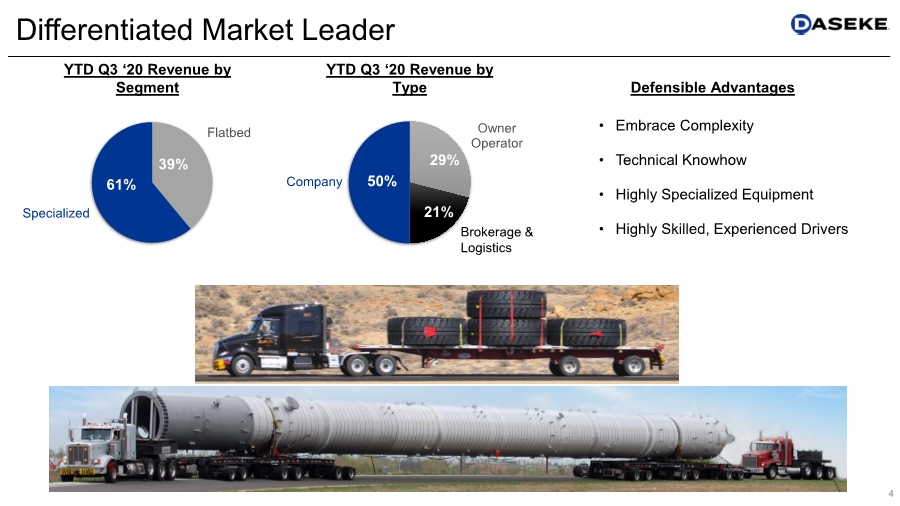
| • Embrace Complexity • Technical Knowhow • Highly Specialized Equipment • Highly Skilled, Experienced Drivers 4 Differentiated Market Leader 50% 29% 21% YTD Q3 ‘20 Revenue by Segment Flatbed Specialized 39% 61% Company Brokerage & Logistics YTD Q3 ‘20 Revenue by Type Defensible Advantages Owner Operator |
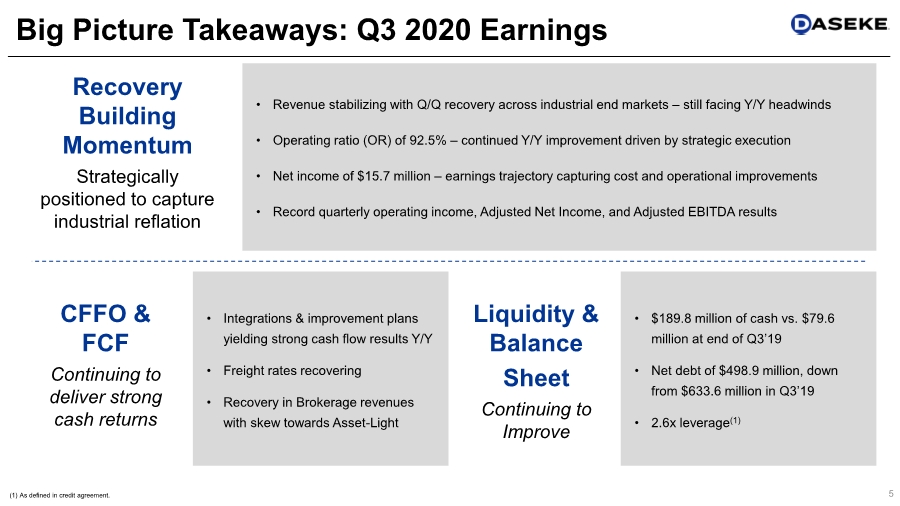
| • Integrations & improvement plans yielding strong cash flow results Y/Y • Freight rates recovering • Recovery in Brokerage revenues with skew towards Asset-Light 5 Big Picture Takeaways: Q3 2020 Earnings Liquidity & Balance Sheet Continuing to Improve Recovery Building Momentum Strategically positioned to capture industrial reflation • $189.8 million of cash vs. $79.6 million at end of Q3’19 • Net debt of $498.9 million, down from $633.6 million in Q3’19 • 2.6x leverage(1) • Revenue stabilizing with Q/Q recovery across industrial end markets – still facing Y/Y headwinds • Operating ratio (OR) of 92.5% – continued Y/Y improvement driven by strategic execution • Net income of $15.7 million – earnings trajectory capturing cost and operational improvements • Record quarterly operating income, Adjusted Net Income, and Adjusted EBITDA results CFFO & FCF Continuing to deliver strong cash returns (1) As defined in credit agreement. |
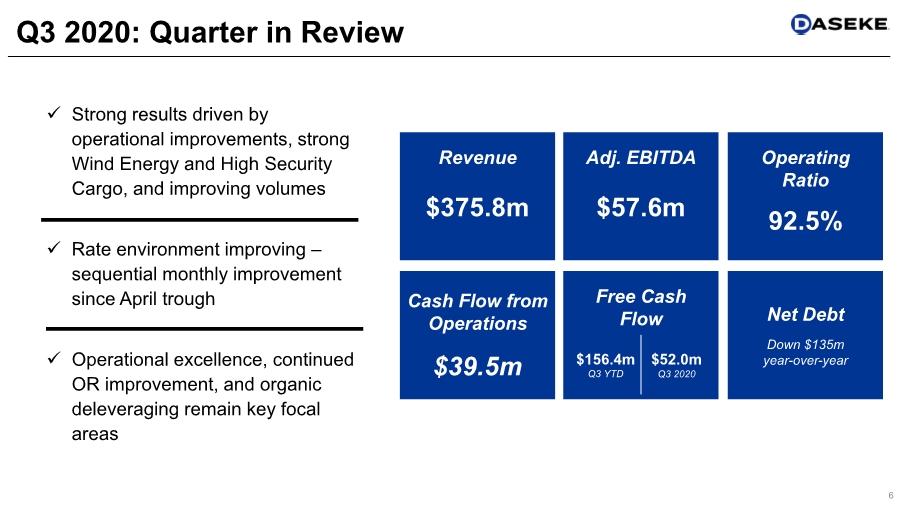
| ✓ Strong results driven by operational improvements, strong Wind Energy and High Security Cargo, and improving volumes ✓ Rate environment improving – sequential monthly improvement since April trough ✓ Operational excellence, continued OR improvement, and organic deleveraging remain key focal areas Cash Flow from Operations $39.5m Net Debt Down $135m year-over-year Q3 2020: Quarter in Review Revenue $375.8m 6 Adj. EBITDA $57.6m Free Cash Flow $156.4m Q3 YTD $52.0m Q3 2020 Operating Ratio 92.5% |
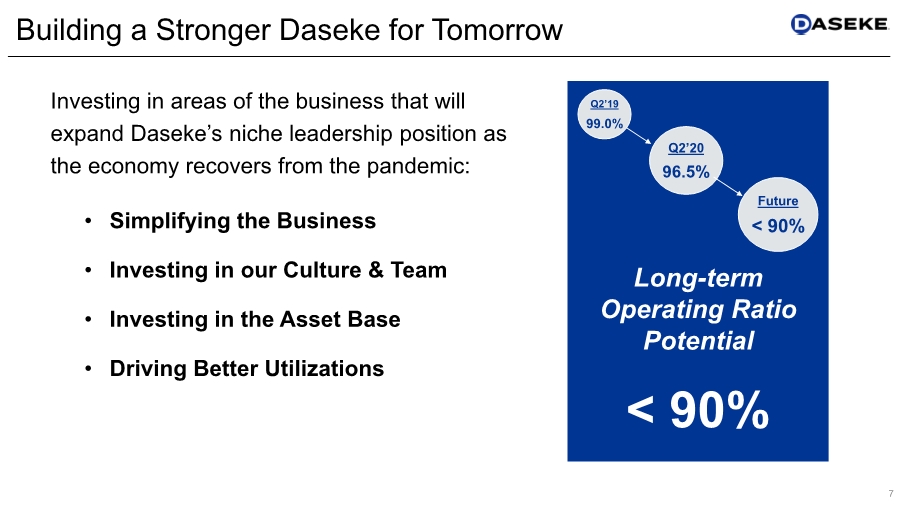
| Building a Stronger Daseke for Tomorrow 7 Investing in areas of the business that will expand Daseke’s niche leadership position as the economy recovers from the pandemic: • Simplifying the Business • Investing in our Culture & Team • Investing in the Asset Base • Driving Better Utilizations Long-term Operating Ratio Potential < 90% Q2’19 99.0% Future < 90% Q2’20 96.5% |
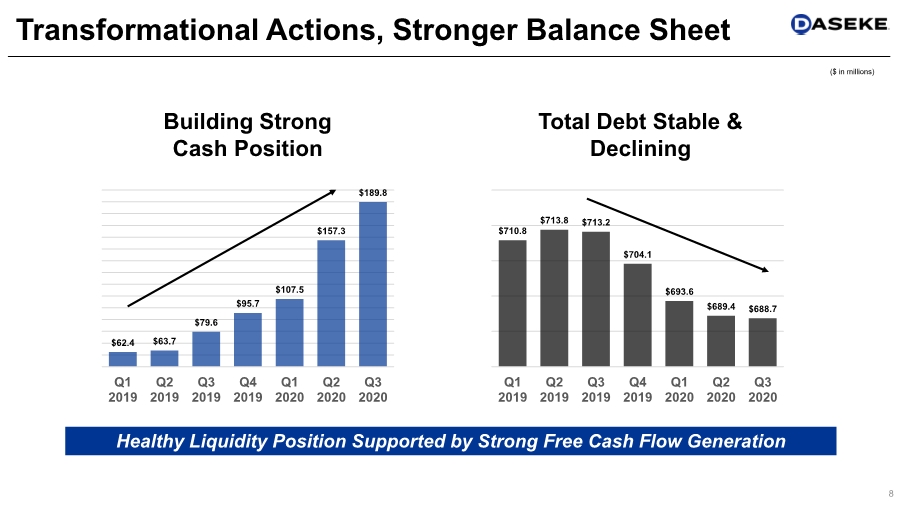
| Transformational Actions, Stronger Balance Sheet 8 $62.4 $63.7 $79.6 $95.7 $107.5 $157.3 $189.8 $50.00 $60.00 $70.00 $80.00 $90.00 $100.00 $110.00 $120.00 $130.00 $140.00 $150.00 $160.00 $170.00 $180.00 $190.00 $200.00 Q1 2019 Q2 2019 Q3 2019 Q4 2019 Q1 2020 Q2 2020 Q3 2020 Building Strong Cash Position $710.8 $713.8 $713.2 $704.1 $693.6 $689.4 $688.7 $675.00 $685.00 $695.00 $705.00 $715.00 $725.00 Q1 2019 Q2 2019 Q3 2019 Q4 2019 Q1 2020 Q2 2020 Q3 2020 Total Debt Stable & Declining Healthy Liquidity Position Supported by Strong Free Cash Flow Generation ($ in millions) |
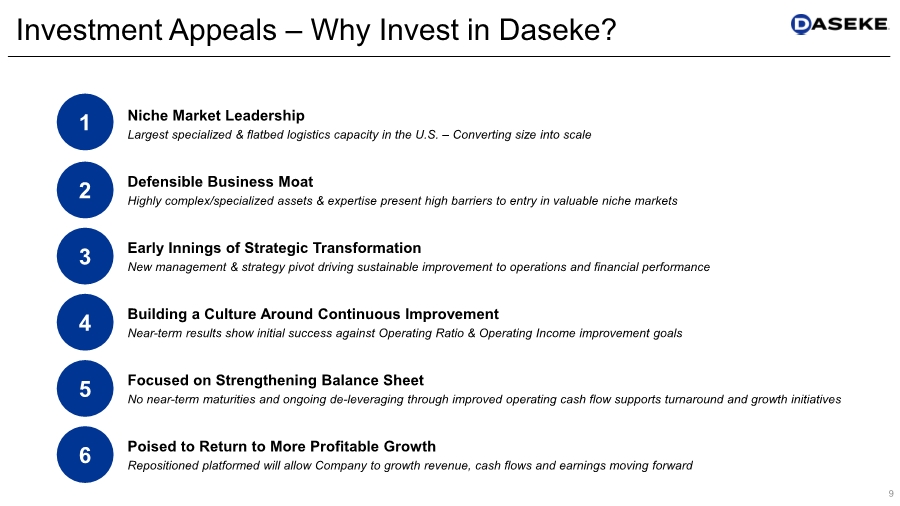
| 9 Investment Appeals – Why Invest in Daseke? Niche Market Leadership Largest specialized & flatbed logistics capacity in the U.S. – Converting size into scale 1 Defensible Business Moat Highly complex/specialized assets & expertise present high barriers to entry in valuable niche markets 2 Early Innings of Strategic Transformation New management & strategy pivot driving sustainable improvement to operations and financial performance 3 Building a Culture Around Continuous Improvement Near-term results show initial success against Operating Ratio & Operating Income improvement goals 4 Focused on Strengthening Balance Sheet No near-term maturities and ongoing de-leveraging through improved operating cash flow supports turnaround and growth initiatives 5 Poised to Return to More Profitable Growth Repositioned platformed will allow Company to growth revenue, cash flows and earnings moving forward 6 |
| APPENDIX 10 |
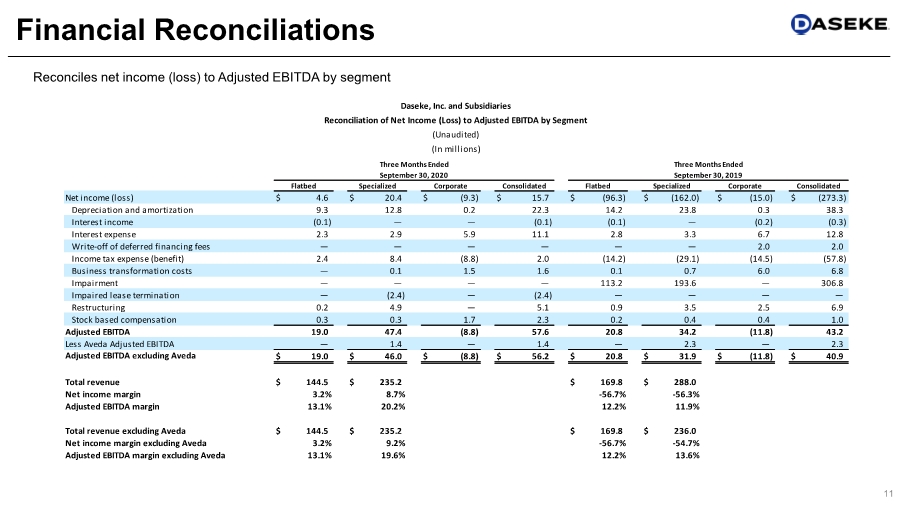
| 11 Financial Reconciliations Reconciles net income (loss) to Adjusted EBITDA by segment Net income (loss) $ 4.6 $ 20.4 $ (9.3) $ 15.7 $ (96.3) $ (162.0) $ (15.0) $ (273.3) Depreciation and amortization 9.3 12.8 0.2 22.3 14.2 23.8 0.3 38.3 Interest income (0.1) — — (0.1) (0.1) — (0.2) (0.3) Interest expense 2.3 2.9 5.9 11.1 2.8 3.3 6.7 12.8 Write-off of deferred financing fees — — — — — — 2.0 2.0 Income tax expense (benefit) 2.4 8.4 (8.8) 2.0 (14.2) (29.1) (14.5) (57.8) Business transformation costs — 0.1 1.5 1.6 0.1 0.7 6.0 6.8 Impairment — — — — 113.2 193.6 — 306.8 Impaired lease termination — (2.4) — (2.4) — — — — Restructuring 0.2 4.9 — 5.1 0.9 3.5 2.5 6.9 Stock based compensation 0.3 0.3 1.7 2.3 0.2 0.4 0.4 1.0 Adjusted EBITDA 19.0 47.4 (8.8) 57.6 20.8 34.2 (11.8) 43.2 Less Aveda Adjusted EBITDA — 1.4 — 1.4 — 2.3 — 2.3 Adjusted EBITDA excluding Aveda $ 19.0 $ 46.0 $ (8.8) $ 56.2 $ 20.8 $ 31.9 $ (11.8) $ 40.9 Total revenue $ 144.5 $ 235.2 $ 169.8 $ 288.0 Net income margin 3.2% 8.7% -56.7% -56.3% Adjusted EBITDA margin 13.1% 20.2% 12.2% 11.9% Total revenue excluding Aveda $ 144.5 $ 235.2 $ 169.8 $ 236.0 Net income margin excluding Aveda 3.2% 9.2% -56.7% -54.7% Adjusted EBITDA margin excluding Aveda 13.1% 19.6% 12.2% 13.6% Flatbed Specialized Corporate Consolidated Daseke, Inc. and Subsidiaries Reconciliation of Net Income (Loss) to Adjusted EBITDA by Segment (Unaudited) (In millions) Flatbed Specialized Corporate Consolidated Three Months Ended September 30, 2019 Three Months Ended September 30, 2020 |
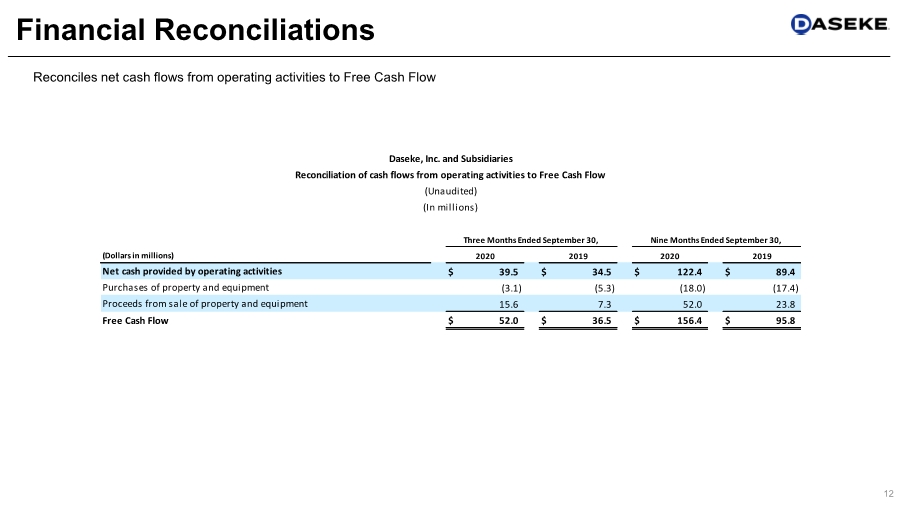
| 12 Financial Reconciliations Reconciles net cash flows from operating activities to Free Cash Flow (Dollars in millions) Net cash provided by operating activities $ 39.5 $ 34.5 $ 122.4 $ 89.4 Purchases of property and equipment (3.1) (5.3) (18.0) (17.4) Proceeds from sale of property and equipment 15.6 7.3 52.0 23.8 Free Cash Flow $ 52.0 $ 36.5 $ 156.4 $ 95.8 2020 2019 2020 2019 Daseke, Inc. and Subsidiaries Reconciliation of cash flows from operating activities to Free Cash Flow (Unaudited) (In millions) Three Months Ended September 30, Nine Months Ended September 30, |
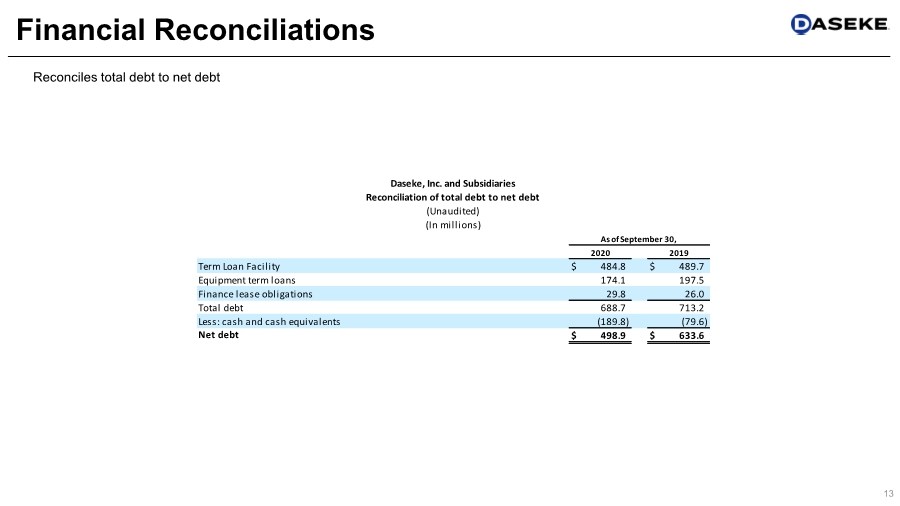
| 13 Financial Reconciliations Reconciles total debt to net debt Term Loan Facility $ 484.8 $ 489.7 Equipment term loans 174.1 197.5 Finance lease obligations 29.8 26.0 Total debt 688.7 713.2 Less: cash and cash equivalents (189.8) (79.6) Net debt $ 498.9 $ 633.6 2020 2019 Daseke, Inc. and Subsidiaries Reconciliation of total debt to net debt (Unaudited) (In millions) As of September 30, |
| Daseke, Inc. 15455 Dallas Parkway, Ste 550 Addison, TX 75001 www.Daseke.com Investor Relations Joe Caminiti / Chris Hodges, Alpha IR 312-445-2870 DSKE@alpha-ir.com 14 Contact Information |