Attached files
| file | filename |
|---|---|
| EX-32.2 - EX-32.2 - Daseke, Inc. | dske-20200331ex32213e454.htm |
| EX-32.1 - EX-32.1 - Daseke, Inc. | dske-20200331ex321524c4f.htm |
| EX-31.2 - EX-31.2 - Daseke, Inc. | dske-20200331ex31239fbf2.htm |
| EX-31.1 - EX-31.1 - Daseke, Inc. | dske-20200331ex311bd39ca.htm |
UNITED STATES
SECURITIES AND EXCHANGE COMMISSION
Washington, D.C. 20549
FORM 10-Q
(Mark One)
|
☑ |
QUARTERLY REPORT PURSUANT TO SECTION 13 OR 15(d) OF THE SECURITIES EXCHANGE ACT OF 1934 |
For the quarterly period ended March 31, 2020
OR
|
☐ |
TRANSITION REPORT PURSUANT TO SECTION 13 OR 15(d) OF THE SECURITIES EXCHANGE ACT OF 1934 |
For the transition period from ________ to _________

DASEKE, INC.
(Exact name of registrant as specified in its charter)
|
Delaware |
|
001-37509 |
|
47-3913221 |
|
|
|
|
|
|
|
15455 Dallas Parkway, Suite 550 |
|
75001 |
||
|
(Address of Principal Executive Offices) |
|
(Zip Code) |
||
|
|
|
|
|
|
|
Registrant’s Telephone Number, Including Area Code: (972) 248-0412
Not applicable (Former name, former address and former fiscal year, if changed since last report) |
||||
|
|
||||
Indicate by check mark whether the registrant (1) has filed all reports required to be filed by Section 13 or 15(d) of the Securities Exchange Act of 1934 during the preceding 12 months (or for such shorter period that the registrant was required to file such reports), and (2) has been subject to such filing requirements for the past 90 days. Yes ☑ No ☐
Indicate by check mark whether the registrant has submitted electronically every Interactive Data File required to be submitted pursuant to Rule 405 of Regulation S-T (§ 232.405 of this chapter) during the preceding 12 months (or for such shorter period that the registrant was required to submit such files).Yes ☑ No ☐
Indicate by check mark whether the registrant is a large accelerated filer, an accelerated filer, a non-accelerated filer, smaller reporting company, or an emerging growth company. See the definitions of “large accelerated filer,” “accelerated filer,” “smaller reporting company” and “emerging growth company” in Rule 12b-2 of the Exchange Act.
|
☐ Large accelerated filer |
|
|
|
☑ Accelerated filer |
|
☐ Non-accelerated filer |
|
|
|
☑ Smaller reporting company |
|
|
|
|
|
☐ Emerging growth company |
If an emerging growth company, indicate by check mark if the registrant has elected not to use the extended transition period for complying with any new or revised financial accounting standards provided pursuant to Section 13(a) of the Exchange Act. ☐
Indicate by check mark whether the registrant is a shell company (as defined in Rule 12b-2 of the Exchange Act). Yes ☐ No ☑
|
Title of each class |
Trading Symbol(s) |
Name of each exchange on which registered |
|
Common Stock, par value $0.0001 per share |
DSKE |
The NASDAQ Capital Market |
Common shares of the registrant outstanding at May 1, 2020 were 64,615,857.
DASEKE, INC.
FORM 10-Q
For the Quarterly Period Ended March 31, 2020
Cautionary Note Regarding Forward-Looking Statements
This Quarterly Report on Form 10-Q (this Report) of Daseke, Inc. (Daseke or the Company) contains forward-looking statements within the meaning of the Private Securities Litigation Reform Act of 1995. Except as otherwise indicated by the context, references in this Report to “we,” “us” and “our” are to the consolidated business of the Company. All statements in this Report, including those made by the management of the Company, other than statements of historical fact, are forward-looking statements. These forward-looking statements are based on management’s estimates, projections and assumptions as of the date hereof. Forward-looking statements may contain words such as “may,” “will,” “expect,” “anticipate,” “continue,” “estimate,” “project,” “believe,” “plan,” “should,” “could,” “would,” “forecast,” “seek,” “target,” “predict,” and “potential,” the negative of these terms, or other comparable terminology. Forward-looking statements may include statements about the Company’s goals; the Company’s financial strategy, liquidity and capital required for its business strategy and plans; the Company’s competition and government regulations; general economic conditions; and the Company’s future operating results.
These forward-looking statements are based on information available as of the date of this Report (or, in the case of forward-looking statements incorporated herein by reference, as of the date of the applicable filed document), and current expectations, forecasts and assumptions. While management believes that these forward-looking statements are reasonable as and when made, there can be no assurance that future developments affecting us will be those that the Company anticipates. Accordingly, forward-looking statements should not be relied upon as representing the Company’s views as of any subsequent date, and the Company does not undertake any obligation to update forward-looking statements to reflect events or circumstances after the date they were made, whether as a result of new information, future events or otherwise, except as may be required under applicable securities laws. Accordingly, readers are cautioned not to place undue reliance on the forward-looking statements.
Forward-looking statements are subject to risks and uncertainties (many of which are beyond the Company’s control) that could cause actual results to differ materially from the Company’s historical experience and our present expectations or projections. Important factors that could cause actual results to differ materially from those in the forward-looking statements include, but are not limited to, general economic and business risks, such as downturns in customers’ business cycles and disruptions in capital and credit markets; impact to the Company’s business and operations resulting from the COVID-19 pandemic; the Company’s ability to adequately address downward pricing and other competitive pressures; driver shortages and increases in driver compensation or owner-operator contracted rates; the Company’s ability to execute and realize all of the expected benefits of its integration, business improvement and comprehensive restructuring plans; loss of key personnel; the Company’s ability to realize all of the intended benefits from recent or future acquisitions; the Company’s ability to complete recent or future divestitures successfully; seasonality and the impact of weather and other catastrophic events; fluctuations in the price or availability of diesel fuel; increased prices for, or decreases in the availability of, new revenue equipment and decreases in the value of used revenue equipment; the Company’s ability to generate sufficient cash to service all of the Company’s indebtedness and the Company’s ability to finance its capital requirements; restrictions in its existing and future debt agreements; increases in interest rates; changes in existing laws or regulations, including environmental and worker health safety laws and regulations and those relating to tax rates or taxes in general; the impact of governmental regulations and other governmental actions related to the Company and its operations; insurance and claims expenses; and litigation and governmental proceedings. For additional information regarding known material factors that could cause the Company’s actual results to differ from its projected results, please see the Company’s filings with the Securities and Exchange Commission (the SEC), particularly the section titled “Part I. Item 1A. Risk Factors” in the Company’s Annual Report on Form 10-K, filed with the SEC on March 10, 2020, and “Part II. Item 1A. Risk Factors” in this Report.
All forward-looking statements, expressed or implied, attributed to the Company or persons acting on its behalf are expressly qualified in their entirety by this cautionary statement. This cautionary statement should also be considered in connection with any subsequent written or oral forward-looking statements that the Company or persons acting on its behalf may issue.
Part I – FINANCIAL INFORMATION
Item 1. Financial Statements (Unaudited)
DASEKE, INC. AND SUBSIDIARIES
(Unaudited)
(In millions, except share data)
|
|
|
March 31, |
|
December 31, |
||
|
|
|
2020 |
|
2019 |
||
|
ASSETS |
|
|
|
|
|
|
|
Current assets: |
|
|
|
|
|
|
|
Cash and cash equivalents |
|
$ |
107.5 |
|
$ |
95.7 |
|
Accounts receivable, net of allowance of $4.3 at March 31, 2020 and $3.5 at December 31, 2019 |
|
|
166.6 |
|
|
197.8 |
|
Drivers’ advances and other receivables |
|
|
6.9 |
|
|
8.2 |
|
Parts supplies |
|
|
3.1 |
|
|
3.5 |
|
Assets held for sale |
|
|
69.8 |
|
|
— |
|
Prepaid and other current assets |
|
|
18.4 |
|
|
21.9 |
|
Total current assets |
|
|
372.3 |
|
|
327.1 |
|
|
|
|
|
|
|
|
|
Property and equipment, net |
|
|
387.9 |
|
|
439.0 |
|
Intangible assets, net |
|
|
100.8 |
|
|
109.1 |
|
Goodwill |
|
|
139.1 |
|
|
139.9 |
|
Right-of-use assets |
|
|
108.5 |
|
|
95.9 |
|
Other long-term assets |
|
|
29.5 |
|
|
29.6 |
|
Total assets |
|
$ |
1,138.1 |
|
$ |
1,140.6 |
|
|
|
|
|
|
|
|
|
LIABILITIES AND STOCKHOLDERS’ EQUITY |
|
|
|
|
|
|
|
Current liabilities: |
|
|
|
|
|
|
|
Accounts payable |
|
$ |
17.4 |
|
$ |
20.5 |
|
Accrued expenses and other liabilities |
|
|
46.9 |
|
|
44.2 |
|
Accrued payroll, benefits and related taxes |
|
|
24.9 |
|
|
28.2 |
|
Accrued insurance and claims |
|
|
19.3 |
|
|
18.7 |
|
Current portion of long-term debt |
|
|
57.7 |
|
|
59.4 |
|
Liabilities held for sale |
|
|
13.1 |
|
|
— |
|
Other current liabilities |
|
|
49.3 |
|
|
48.8 |
|
Total current liabilities |
|
|
228.6 |
|
|
219.8 |
|
|
|
|
|
|
|
|
|
Line of credit |
|
|
— |
|
|
1.7 |
|
Long-term debt, net of current portion |
|
|
625.6 |
|
|
631.6 |
|
Deferred tax liabilities |
|
|
70.7 |
|
|
69.9 |
|
Other long-term liabilities |
|
|
92.6 |
|
|
78.9 |
|
Total liabilities |
|
|
1,017.5 |
|
|
1,001.9 |
|
|
|
|
|
|
|
|
|
Commitments and contingencies (Note 14) |
|
|
|
|
|
|
|
|
|
|
|
|
|
|
|
Stockholders’ equity: |
|
|
|
|
|
|
|
Series A convertible preferred stock, $0.0001 par value; 10,000,000 shares authorized; 650,000 |
|
|
65.0 |
|
|
65.0 |
|
Common stock, par value $0.0001 per share; 250,000,000 shares authorized, 64,598,025 and |
|
|
— |
|
|
— |
|
Additional paid-in-capital |
|
|
438.4 |
|
|
437.5 |
|
Accumulated deficit |
|
|
(381.9) |
|
|
(363.4) |
|
Accumulated other comprehensive loss |
|
|
(0.9) |
|
|
(0.4) |
|
Total stockholders’ equity |
|
|
120.6 |
|
|
138.7 |
|
Total liabilities and stockholders’ equity |
|
$ |
1,138.1 |
|
$ |
1,140.6 |
The accompanying notes are an integral part of the consolidated financial statements.
1
DASEKE, INC. AND SUBSIDIARIES
CONSOLIDATED STATEMENTS OF OPERATIONS AND COMPREHENSIVE LOSS
(Unaudited)
(In millions, except share and per share data)
|
|
|
Three Months Ended |
||||
|
|
|
March 31, |
||||
|
|
|
2020 |
|
2019 |
||
|
Revenues: |
|
|
|
|
|
|
|
Company freight |
|
$ |
180.9 |
|
$ |
206.2 |
|
Owner operator freight |
|
|
107.8 |
|
|
111.0 |
|
Brokerage |
|
|
61.7 |
|
|
71.4 |
|
Logistics |
|
|
10.1 |
|
|
12.4 |
|
Fuel surcharge |
|
|
30.5 |
|
|
32.0 |
|
Total revenue |
|
|
391.0 |
|
|
433.0 |
|
|
|
|
|
|
|
|
|
Operating expenses: |
|
|
|
|
|
|
|
Salaries, wages and employee benefits |
|
|
110.4 |
|
|
119.1 |
|
Fuel |
|
|
28.7 |
|
|
35.0 |
|
Operations and maintenance |
|
|
45.6 |
|
|
54.8 |
|
Communications |
|
|
1.0 |
|
|
1.0 |
|
Purchased freight |
|
|
134.2 |
|
|
146.6 |
|
Administrative expenses |
|
|
20.2 |
|
|
16.1 |
|
Sales and marketing |
|
|
0.7 |
|
|
1.2 |
|
Taxes and licenses |
|
|
4.5 |
|
|
4.9 |
|
Insurance and claims |
|
|
15.0 |
|
|
12.5 |
|
Depreciation and amortization |
|
|
26.3 |
|
|
41.5 |
|
Gain on disposition of property and equipment |
|
|
(1.2) |
|
|
(0.4) |
|
Impairment |
|
|
13.4 |
|
|
— |
|
Restructuring charges |
|
|
0.5 |
|
|
— |
|
Total operating expenses |
|
|
399.3 |
|
|
432.3 |
|
Income (loss) from operations |
|
|
(8.3) |
|
|
0.7 |
|
|
|
|
|
|
|
|
|
Other expense (income): |
|
|
|
|
|
|
|
Interest income |
|
|
(0.3) |
|
|
(0.2) |
|
Interest expense |
|
|
12.0 |
|
|
12.7 |
|
Other |
|
|
1.2 |
|
|
(0.6) |
|
Total other expense |
|
|
12.9 |
|
|
11.9 |
|
|
|
|
|
|
|
|
|
Loss before benefit for income taxes |
|
|
(21.2) |
|
|
(11.2) |
|
Benefit for income taxes |
|
|
(3.9) |
|
|
(1.9) |
|
Net loss |
|
|
(17.3) |
|
|
(9.3) |
|
|
|
|
|
|
|
|
|
Other comprehensive income (loss): |
|
|
|
|
|
|
|
Foreign currency translation adjustments, net of tax of $(0.2) and $0.1, respectively |
|
|
(0.5) |
|
|
0.1 |
|
Comprehensive loss |
|
|
(17.8) |
|
|
(9.2) |
|
|
|
|
|
|
|
|
|
Net loss |
|
|
(17.3) |
|
|
(9.3) |
|
Less dividends to Series A convertible preferred stockholders |
|
|
(1.2) |
|
|
(1.2) |
|
Net loss attributable to common stockholders |
|
$ |
(18.5) |
|
$ |
(10.5) |
|
|
|
|
|
|
|
|
|
Net loss per common share: |
|
|
|
|
|
|
|
Basic and Diluted |
|
$ |
(0.29) |
|
$ |
(0.16) |
|
Weighted-average common shares outstanding: |
|
|
|
|
|
|
|
Basic and Diluted |
|
|
64,598,025 |
|
|
64,469,642 |
|
|
|
|
|
|
|
|
|
Dividends declared per Series A convertible preferred share |
|
$ |
1.91 |
|
$ |
1.91 |
The accompanying notes are an integral part of the consolidated financial statements.
2
DASEKE, INC. AND SUBSIDIARIES
CONSOLIDATED STATEMENT OF CHANGES IN STOCKHOLDERS’ EQUITY
Three Months Ended March 31, 2020
(Unaudited)
(In millions, except share data)
|
|
|
Series A Convertible |
|
|
|
|
|
|
|
|
|
|
|
Accumulated |
|
|
|
|||||
|
|
|
Preferred Stock |
|
Common Stock |
|
|
|
|
|
|
Other |
|
|
|
||||||||
|
|
|
|
|
|
|
|
|
Par |
|
Additional |
|
Accumulated |
|
Comprehensive |
|
|
|
|||||
|
|
|
Shares |
|
Amount |
|
Shares |
|
Value |
|
Paid- In Capital |
|
Deficit |
|
Income (Loss) |
|
Total |
||||||
|
Balance at January 1, 2020 |
|
650,000 |
|
$ |
65.0 |
|
64,589,075 |
|
$ |
— |
|
$ |
437.5 |
|
$ |
(363.4) |
|
$ |
(0.4) |
|
$ |
138.7 |
|
Vesting of restricted stock units |
|
— |
|
|
— |
|
8,950 |
|
|
— |
|
|
— |
|
|
— |
|
|
— |
|
|
— |
|
Series A convertible preferred stock dividend |
|
— |
|
|
— |
|
— |
|
|
— |
|
|
— |
|
|
(1.2) |
|
|
— |
|
|
(1.2) |
|
Stock-based compensation expense |
|
— |
|
|
— |
|
— |
|
|
— |
|
|
0.9 |
|
|
— |
|
|
— |
|
|
0.9 |
|
Foreign currency translation adjustments |
|
— |
|
|
— |
|
— |
|
|
— |
|
|
— |
|
|
— |
|
|
(0.5) |
|
|
(0.5) |
|
Net loss |
|
— |
|
|
— |
|
— |
|
|
— |
|
|
— |
|
|
(17.3) |
|
|
— |
|
|
(17.3) |
|
Balance at March 31, 2020 |
|
650,000 |
|
$ |
65.0 |
|
64,598,025 |
|
$ |
— |
|
$ |
438.4 |
|
$ |
(381.9) |
|
$ |
(0.9) |
|
$ |
120.6 |
|
|
|
|
|
|
|
|
|
|
|
|
|
|
|
|
|
|
|
|
|
|
|
|
The accompanying notes are an integral part of the consolidated financial statements.
3
DASEKE, INC. AND SUBSIDIARIES
CONSOLIDATED STATEMENT OF CHANGES IN STOCKHOLDERS’ EQUITY
Three Months Ended March 31, 2019
(Unaudited)
(In millions, except share data)
|
|
|
Series A Convertible |
|
|
|
|
|
|
|
|
|
|
|
Accumulated |
|
|
|
|||||
|
|
|
Preferred Stock |
|
Common Stock |
|
|
|
|
|
|
Other |
|
|
|
||||||||
|
|
|
|
|
|
|
|
|
Par |
|
Additional |
|
Accumulated |
|
Comprehensive |
|
|
|
|||||
|
|
|
Shares |
|
Amount |
|
Shares |
|
Value |
|
Paid- In Capital |
|
Deficit |
|
Income (Loss) |
|
Total |
||||||
|
Balance at January 1, 2019 |
|
650,000 |
|
$ |
65.0 |
|
64,455,174 |
|
$ |
— |
|
$ |
433.9 |
|
$ |
(51.0) |
|
$ |
(0.9) |
|
$ |
447.0 |
|
Vesting of restricted stock units |
|
— |
|
|
— |
|
14,498 |
|
|
— |
|
|
— |
|
|
— |
|
|
— |
|
|
— |
|
Series A convertible preferred stock dividend |
|
— |
|
|
— |
|
— |
|
|
— |
|
|
— |
|
|
(1.2) |
|
|
— |
|
|
(1.2) |
|
Stock-based compensation expense |
|
— |
|
|
— |
|
— |
|
|
— |
|
|
1.0 |
|
|
— |
|
|
— |
|
|
1.0 |
|
Foreign currency translation adjustments |
|
— |
|
|
— |
|
— |
|
|
— |
|
|
— |
|
|
— |
|
|
0.1 |
|
|
0.1 |
|
Net loss |
|
— |
|
|
— |
|
— |
|
|
— |
|
|
— |
|
|
(9.3) |
|
|
— |
|
|
(9.3) |
|
Balance at March 31, 2019 |
|
650,000 |
|
$ |
65.0 |
|
64,469,672 |
|
$ |
— |
|
$ |
434.9 |
|
$ |
(61.5) |
|
$ |
(0.8) |
|
$ |
437.6 |
The accompanying notes are an integral part of the consolidated financial statements.
4
DASEKE, INC. AND SUBSIDIARIES
CONSOLIDATED STATEMENTS OF CASH FLOWS
(Unaudited)
(in millions)
|
|
|
Three Months Ended |
||||
|
|
|
March 31, |
||||
|
|
|
2020 |
|
2019 |
||
|
Cash flows from operating activities |
|
|
|
|
|
|
|
Net loss |
|
$ |
(17.3) |
|
$ |
(9.3) |
|
Adjustments to reconcile net loss to net cash provided by operating activities |
|
|
|
|
|
|
|
Depreciation |
|
|
24.5 |
|
|
37.2 |
|
Amortization of intangible assets |
|
|
1.8 |
|
|
4.3 |
|
Amortization of deferred financing fees |
|
|
1.1 |
|
|
0.7 |
|
Non-cash operating lease expense |
|
|
2.9 |
|
|
6.6 |
|
Stock-based compensation expense |
|
|
0.9 |
|
|
1.0 |
|
Deferred taxes |
|
|
(3.8) |
|
|
(1.9) |
|
Bad debt expense |
|
|
0.9 |
|
|
0.1 |
|
Gain on disposition of property and equipment |
|
|
(1.2) |
|
|
(0.4) |
|
Impairment |
|
|
13.4 |
|
|
— |
|
Changes in operating assets and liabilities |
|
|
|
|
|
|
|
Accounts receivable |
|
|
1.3 |
|
|
(8.9) |
|
Drivers’ advances and other receivables |
|
|
(0.2) |
|
|
(2.8) |
|
Prepaid and other current assets |
|
|
(4.0) |
|
|
1.9 |
|
Accounts payable |
|
|
2.2 |
|
|
7.5 |
|
Accrued expenses and other liabilities |
|
|
7.2 |
|
|
0.4 |
|
Net cash provided by operating activities |
|
|
29.7 |
|
|
36.4 |
|
|
|
|
|
|
|
|
|
Cash flows from investing activities |
|
|
|
|
|
|
|
Purchases of property and equipment |
|
|
(4.5) |
|
|
(3.9) |
|
Proceeds from sale of property and equipment |
|
|
5.8 |
|
|
4.6 |
|
Net cash provided by investing activities |
|
|
1.3 |
|
|
0.7 |
|
|
|
|
|
|
|
|
|
Cash flows from financing activities: |
|
|
|
|
|
|
|
Advances on line of credit |
|
|
351.0 |
|
|
314.7 |
|
Repayments on line of credit |
|
|
(352.7) |
|
|
(314.7) |
|
Principal payments on long-term debt |
|
|
(17.1) |
|
|
(19.3) |
|
Series A convertible preferred stock dividends |
|
|
(1.2) |
|
|
(1.2) |
|
Net cash used in financing activities |
|
|
(20.0) |
|
|
(20.5) |
|
|
|
|
|
|
|
|
|
Effect of exchange rates on cash and cash equivalents |
|
|
0.8 |
|
|
(0.2) |
|
|
|
|
|
|
|
|
|
Net increase in cash and cash equivalents |
|
|
11.8 |
|
|
16.4 |
|
Cash and cash equivalents – beginning of period |
|
|
95.7 |
|
|
46.0 |
|
Cash and cash equivalents – end of period |
|
$ |
107.5 |
|
$ |
62.4 |
The accompanying notes are an integral part of the consolidated financial statements.
5
DASEKE, INC. AND SUBSIDIARIES
CONSOLIDATED STATEMENTS OF CASH FLOWS – (Continued)
(Unaudited)
(in millions)
|
|
|
Three Months Ended |
||||
|
|
|
March 31, |
||||
|
|
|
2020 |
|
2019 |
||
|
Supplemental disclosure of cash flow information |
|
|
|
|
|
|
|
Cash paid for interest |
|
$ |
10.9 |
|
$ |
11.7 |
|
Cash paid for income taxes |
|
$ |
0.2 |
|
$ |
— |
|
|
|
|
|
|
|
|
|
Noncash investing and financing activities |
|
|
|
|
|
|
|
Property and equipment acquired with debt or finance lease obligations |
|
$ |
9.8 |
|
$ |
25.1 |
|
Property and equipment sold for notes receivable |
|
$ |
— |
|
$ |
0.4 |
|
Right-of-use assets acquired |
|
$ |
19.1 |
|
$ |
8.1 |
The accompanying notes are an integral part of the consolidated financial statements.
6
NOTE 1 – NATURE OF OPERATIONS AND SUMMARY OF SIGNIFICANT ACCOUNTING POLICIES
Nature of Operations
Daseke, Inc.’s (the Company or Daseke) wholly-owned subsidiary Daseke Companies, Inc., was incorporated in December 2008 and began operations on January 1, 2009. Daseke is engaged in full service open-deck trucking that specializes primarily in flatbed truckload and heavy haul transportation of specialized items throughout the United States, Canada and Mexico. The Company also provides logistical planning and warehousing services to customers. The Company is subject to regulation by the Department of Transportation, the Department of Defense, the Department of Energy, and various state regulatory authorities in the United States. The Company is also subject to regulation by the Ministries of Transportation and Communications and various provincial regulatory authorities in Canada.
Basis of Presentation
These interim consolidated financial statements have been prepared in accordance with accounting principles generally accepted in the United States (GAAP) for interim financial information and with the instructions for Form 10-Q and Article 10 of Regulation S-X. Accordingly, they do not include all of the information and footnotes required by GAAP for complete financial statements. In the opinion of management, all adjustments (consisting of normal recurring accruals) considered necessary for a fair presentation have been included. Operating results for the three months ended March 31, 2020 are not necessarily indicative of the results that may be expected for the year ended December 31, 2020.
The consolidated balance sheet as of December 31, 2019 has been derived from the audited consolidated financial statements at that date. For additional information, including the Company’s significant accounting policies, refer to the consolidated financial statements and related footnotes for the year ended December 31, 2019 as set forth in the Company’s Annual Report on Form 10-K, filed with the SEC on March 10, 2020.
Certain items have been reclassified for presentation purposes to conform to the accounting policies of the consolidated entity. These reclassifications had no material impact on income from operations, net loss and comprehensive loss, the balance sheets or statements of cash flows.
Principles of Consolidation
The consolidated financial statements include the accounts of Daseke, Inc. and its wholly-owned subsidiaries. All significant intercompany balances and transactions have been eliminated in consolidation.
Use of Estimates
The preparation of the consolidated financial statements in accordance with GAAP requires management to make estimates and assumptions that affect the reported amounts of assets and liabilities and disclosure of contingent assets and liabilities at the date of the consolidated financial statements and the reported amounts of revenues and expenses during the reporting period. Actual results could differ from those estimates.
Deferred Financing Fees
In conjunction with obtaining long-term debt, the Company incurred financing costs which are being amortized using the straight-line method, which approximates the effective interest rate method, over the terms of the obligations. As of March 31, 2020 and December 31, 2019, the balance of deferred finance charges was $10.3 million and $11.4 million, respectively, which is included as a reduction of long-term debt, net of current portion in the consolidated balance sheets. Amortization expense was $1.1 million and $0.7 million the three months ended March 31, 2020 and 2019, respectively. Amortization expense is included in interest expense in the consolidated statements of operations and comprehensive loss.
Impairment of Long-Lived Assets
Long-lived assets are reviewed for impairment at the asset group level whenever events or changes in circumstances indicate that the carrying value may not be recoverable. If the sum of the expected future undiscounted cash flow is less than the carrying amount of the asset, an impairment is indicated. A loss is then recognized for the difference, if any, between the fair value of the asset (as estimated by management using its best judgment) and the carrying value of the asset. If actual market value is less favorable than that estimated by management, additional write-downs may be required. In the three months ended March 31, 2020, the Company recognized asset impairments, which are more fully described in Note 3.
7
Fair Value Measurements
The Company follows the accounting guidance for fair value measurements of financial assets and financial liabilities and for fair value measurements of nonfinancial items that are recognized or disclosed at fair value in the financial statements on a recurring basis. Fair value guidance defines fair value as the price that would be received to sell an asset or paid to transfer a liability in an orderly transaction between market participants at the measurement date. It also establishes a framework for measuring fair value and expands disclosures about fair value measurements. The three levels of the fair value framework are as follows:
Level 1 - Quoted market prices in active markets for identical assets or liabilities.
Level 2 - Observable market-based inputs or unobservable inputs that are corroborated by market data.
Level 3 - Unobservable inputs reflecting the reporting entity’s own assumptions or external inputs from inactive markets.
A financial asset or liability’s classification within the framework is determined based on the lowest level of input that is significant to the fair value measurement.
Contingent Consideration
The contingent consideration liabilities, included in other current liabilities on the consolidated balance sheet, represent future payment obligations for certain EBITDA thresholds related to the Company’s acquisitions over a defined period of time. The fair value of the Company’s contingent consideration liabilities are determined using estimates based on discount rates that reflect the risk involved and the projected EBITDA of the acquired businesses, therefore the liabilities are classified within Level 3 of the fair value framework. The balance of contingent consideration as of March 31, 2020 and December 31, 2019 was $21.5 million and $21.5 million, respectively.
Stock-Based Compensation
Awards of equity instruments issued to employees and directors are accounted for under the fair value method of accounting and recognized in the consolidated statements of operations and comprehensive loss. Compensation cost is measured for all stock-based awards at fair value on the date of grant and recognized using the straight-line method over the service period over which the awards are expected to vest.
Fair value of all time-vested options as of the date of grant is estimated using the Black-Scholes option valuation model, which was developed for use in estimating the fair value of traded options that have no vesting restrictions and are fully transferable. Option valuation models require the input of highly subjective assumptions, including the expected stock price volatility. Since the Company does not have a sufficient history of exercise behavior, expected term is calculated using the assumption that the options will be exercised ratably from the date of vesting to the end of the contractual term for each vesting tranche of awards. The risk-free interest rate is based on the U.S. Treasury yield curve for the period of the expected term of the stock option. Expected volatility is calculated using an index of publicly traded peer companies.
Fair values of non-vested stock awards (restricted stock units) are equal to the market value of the common stock on the date of the award with compensation costs amortized over the vesting period of the award.
Segment Reporting
The Company determines its operating segments based on the information utilized by the chief operating decision maker to allocate resources and assess performance. Based on this information, the Company has determined it had 13 operating segments as of March 31, 2020 and 16 operating segments as of March 31, 2019 that are aggregated into two reportable segments: Flatbed Solutions, which delivers its services using primarily flatbed transportation equipment to meet the needs of high-volume, time-sensitive shippers, and Specialized Solutions, which delivers transportation and logistics solutions for super heavy haul, high-value customized and over-dimensional loads, many of which require engineering and customized equipment.
Loss Per Share
Basic loss per common share is calculated by dividing net loss attributable to common stockholders by the weighted average number of shares of common stock outstanding during the period. Diluted loss per share reflect the potential dilution of earnings per share that could occur if securities or other contracts to issue common stock were exercised or converted into common stock or resulted in the issuance of common stock that then shared in the Company’s loss.
For the three months ended March 31, 2020 and 2019, shares of the Company’s 7.625% Series A Convertible Cumulative Preferred Stock (Series A Preferred Stock) and outstanding stock options were not included in the computation of diluted loss per share as their effects were anti-dilutive. Additionally, for the three months ended March 31, 2020 and 2019, there was no dilutive effect from the Merger Agreement earn-out provision found in the Agreement and Plan of Merger, dated December 22, 2016, in which a wholly-owned subsidiary of Hennessy
8
Capital Acquisition Corp. II (Hennessy) merged with and into Daseke, with Daseke surviving as a direct wholly-owned subsidiary of Hennessy, (the Merger Agreement) or the outstanding warrants to purchase shares of the Company’s common stock (the common stock purchase warrants). See Note 16 for the effects of non-vested restricted stock units on basic and diluted earnings per share under the two-class method.
Common Stock Purchase Warrants
The Company accounts for the issuance of common stock purchase warrants in connection with equity offerings in accordance with the provisions of the Accounting Standards Codification (ASC) 815, Derivatives and Hedging (Topic 815). The Company classifies as equity any contract that (i) requires physical settlement or net-share settlement or (ii) gives the Company a choice of net-cash settlement or settlement in its own shares (physical settlement or net-share settlement). The Company classifies as assets or liabilities any contract that (i) requires net-cash settlement (including a requirement to net-cash settle the contract if an event occurs and if that event is outside the control of the Company) or (ii) gives the counterparty a choice of net-cash settlement or settlement in shares (physical settlement or net-share settlement). See Note 11 for additional details on the common stock purchase warrants.
The Company assessed the classification of its common stock purchase warrants and determined that such instruments meet the criteria for equity classification at the time of issuance.
Foreign Currency Gains and Losses
The functional currency for all operations except Canada is the U.S. dollar. The local currency is the functional currency for the Company’s operations in Canada. For these operations, assets and liabilities are translated at the rates of exchange on the consolidated balance sheet date, while income and expense items are translated at average rates of exchange during the period. The resulting gains or losses arising from the translation of accounts from the functional currency into U.S. dollars are included as a separate component of stockholders’ equity in accumulated other comprehensive income until a partial or complete liquidation of the Company’s net investment in the foreign operation.
From time to time, the Company’s foreign operations may enter into transactions that are denominated in a currency other than their functional currency. These transactions are initially recorded in the functional currency of the operating company based on the applicable exchange rate in effect on the date of the transaction. Monthly, these transactions are remeasured to an equivalent amount of the functional currency based on the applicable exchange rate in effect on the remeasurement date. Any adjustment required to remeasure a transaction to the equivalent amount of functional currency is recorded in the consolidated statements of operations and comprehensive loss of the foreign operating company as a component of foreign exchange gain or loss.
Revenue and Expense Recognition
The Company’s revenue and related costs are recognized when the Company satisfies its performance obligation(s) transferring goods or services to the customer and the customer obtains control of such goods and services. With respect to freight, brokerage, logistics and fuel surcharge revenue, these conditions are met, and the Company recognizes company freight, owner operator freight, brokerage and fuel surcharge revenue, over time, and logistics revenue, as the services are provided. While the Company may enter into master service agreements with its customers, a contract is not established until the customer specifically requests the Company’s services and the Company accepts.
The Company evaluates each contract for distinct performance obligations. In the Company’s business, a typical performance obligation is the transportation of a load including any highly interrelated ancillary services.
The Company predominantly estimates the standalone selling price of its services based upon observable evidence, market conditions and other relevant inputs. The Company allocates the total transaction price to each distinct performance obligation based upon the relative standalone selling prices.
The Company’s customers simultaneously receive and consume the benefits of the Company’s contracts; therefore, revenue is recognized over time. This is a faithful depiction of the satisfaction of the performance obligation, as the customer does not need to re-perform the transportation services the Company has provided to date.
Generally, the Company’s customers are billed upon delivery of the freight or monthly and remit payment according to the approved payment terms.
9
Freight Revenue
Freight revenue is generated by hauling customer freight using company owned equipment (company freight) and owner-operator equipment (owner-operator freight). Freight revenue is the product of the number of revenue-generating miles driven and the rate per mile received from customers plus accessorial charges, such as loading and unloading freight, cargo protection, fees for detained equipment or fees for route planning and supervision.
Brokerage Revenue
The Company regularly engages third-party capacity providers to haul loads. The Company is primarily responsible for fulfilling the promise to provide load transportation services, and has discretion in setting prices, along with the risk to fulfill the contract to the customer. Based upon this evaluation, the Company has determined that it is the principal and therefore, records gross revenues and expenses for brokerage services.
Logistics Revenue
Logistics revenue is generated from a range of services, including value-added warehousing, loading and unloading, vehicle maintenance and repair, preparation and packaging, fuel management, and other fleet management solutions. The Company recognizes logistics revenue as services are completed.
Fuel Surcharge
Fuel surcharge revenue compensates the Company for fuel costs above a certain cost per gallon base. Generally, the Company receives fuel surcharges on the miles for which it is compensated by customers.
The Company has designated the following preference and practical expedients:
|
· |
To not disclose remaining performance obligations when the expected performance obligation duration is one year or less. The vast majority of the Company’s services transfer control within a month of the inception of the contract with select specialized loads taking several months to allow for increased planning and permitting. |
|
· |
Recognize the incremental costs of obtaining or fulfilling a contract as an expense when incurred, as the amortization period of a potential asset would be recognized in one year or less. |
|
· |
Exclude taxes collected on behalf of government authorities from the Company’s measurement of transaction prices. Tax amounts are not included within net income or cost of sales. |
Lease Accounting
Lessee
The Company has capitalized operating and finance leases for various real estate including corporate offices, trucking facilities and terminals, warehouses, and tractor parking as well as various types of equipment including tractors, trailers, forklifts, and office equipment. New real estate lease agreements will typically have initial terms between 3 to 15 years and new equipment lease agreements will typically have initial terms of 3 to 9 years. Leases with an initial term of 12 months or less (short term leases) across all asset classes are not recorded on the balance sheet; the Company recognizes lease expense for these leases on a straight-line basis over the lease term.
Some of the Company’s leases include one or more options to renew, with renewals that can extend the lease term from 1 to 5 years. The Company’s lease terms may include options to extend or terminate the lease when it is reasonably certain that the Company will exercise that option. The exercise of lease renewal options is at the Company’s sole discretion. Certain leases also include options to purchase the leased property. The depreciable life of assets and leasehold improvements are limited by the expected lease term, unless there is a transfer of title or purchase option reasonably certain of exercise. Rights and obligations related to lease agreements the Company has signed but that have not yet commenced are not material. The Company has certain lease agreements related to its revenue equipment that contain residual value guarantees. These residual value guarantees require the Company to return the revenue equipment at the end of the lease term in a certain condition as specified by the lessor in the lease agreement.
The Company determines whether an arrangement is classified as a lease at inception. The right-of-use assets and lease liabilities relating to operating leases are included in right-of-use assets, other current liabilities, and other long-term liabilities on the Company's consolidated balance sheets. The right-of-use assets and lease liabilities relating to finance leases are included in other long-term assets, current portion
10
of long-term debt, and long-term debt, net of current portion on the Company's consolidated balance sheets. The Company's right-of-use assets represent its right to use the underlying assets for the lease term and the Company's right-of-use liabilities represent its obligation to make lease payments arising from the leases. Operating lease right-of-use assets and liabilities are recognized at commencement date based on the present value of lease payments over the lease term. The Company's capitalized operating lease agreements generally do not provide an implicit rate. The Company developed an incremental borrowing rate based on the information available at the commencement date regarding the interest rate applicable to collateralized borrowings for a period similar to the original lease period. The incremental borrowing rates were used in determining the present value of lease payments which is reflected as the lease liability.
Lessor
The Company leases tractors and trailers to certain of its owner-operators and accounts for these transactions as operating leases. These leases typically have terms of 30 to 72 months and are collateralized by a security interest in the related revenue equipment. The Company recognizes income for these leases as payments are received over the lease term, which are reported in purchased freight on the consolidated statements of operations and comprehensive loss. The Company's equipment leases may include options for the lessee to purchase the equipment at the end of the lease term or terminate the lease prior to the end of the lease term. When an asset reaches the end of its useful economic life, the Company disposes of the asset.
The Company recorded depreciation expense of $4.1 million and $4.9 million on its assets leased under operating leases for the three months ended March 31, 2020 and 2019, respectively. Lease income from lease payments related to the Company's operating leases for the three months ended March 31, 2020 and 2019, was $6.2 million and $5.4 million, respectively.
The Company has designated the following preferences and practical expedients:
|
· |
Adopt the land easement practical expedient; |
|
· |
To not separate the non-lease components of a contract from the lease component for its office equipment asset class; |
|
· |
To not apply the recognition requirements to leases with terms of twelve months or less; and |
|
· |
To apply the portfolio approach in determination of the incremental borrowing rate. |
New Accounting Pronouncements
In March 2020, the FASB issued ASU 2020-04 – Reference Rate Reform (Topic 848): Facilitation of the Effects of Reference Rate Reform on Financial Reporting. The amendments provide optional guidance for a limited time to ease the potential burden in accounting for reference rate reform. The new guidance provides optional expedients and exceptions for applying U.S. GAAP to contracts, hedging relationships and other transactions affected by reference rate reform if certain criteria are met. The amendments apply only to contracts and hedging relationships that reference LIBOR or another reference rate expected to be discontinued due to reference rate reform. These amendments are effective immediately and may be applied prospectively to contract modifications made and hedging relationships entered into or evaluated on or before December 31, 2022. The Company is currently evaluating its contracts and the optional expedients provided by the new standard.
In December 2019, the FASB issued ASU No. 2019-12 – Income Taxes (Topic 740). Simplifying the Accounting for Income Taxes, as part of its initiative to reduce complexity in the accounting standards. The amendments in ASU 2019-12 eliminate certain exceptions related to the approach for intraperiod tax allocation, the methodology for calculating income taxes in an interim period and the recognition of deferred tax liabilities for outside basis differences. ASU 2019-12 also clarifies and simplifies other aspects of the accounting for income taxes. The amendments in ASU 2019-12 will become effective for the Company on January 1, 2022. Early adoption is permitted, including adoption in any interim period. The Company is currently evaluating the impact of adopting this guidance.
In June 2016, the FASB issued ASU No. 2016-13 – Accounting for Credit Losses (Topic 326). ASU 2016-13 requires the use of an “expected loss” model on certain types of financial instruments. The ASU sets forth a “current expected credit loss” (CECL) model which requires the Company to measure all expected credit losses for financial instruments held at the reporting date based on historical experience, current conditions, and reasonable supportable forecasts. This replaces the existing incurred loss model and is applicable to the measurement of credit losses on financial assets, including trade receivables. The new standard will become effective for the Company beginning with the first quarter 2023 and is not expected to have a material impact on the Company’s consolidated financial statements.
11
NOTE 2 – LEASES
Lessee
The following table reflects the Company’s components of lease expenses for the three months ended March 31, 2020 and 2019 (in millions):
|
|
|
|
|
Three Months Ended March 31, |
||||
|
|
|
Classification |
|
2020 |
|
2019 |
||
|
Operating lease cost |
|
|
|
|
|
|
|
|
|
Revenue equipment |
|
Operations and maintenance |
|
$ |
6.4 |
|
$ |
5.8 |
|
Real estate |
|
Administrative expense |
|
|
3.8 |
|
|
4.2 |
|
Total operating lease cost |
|
|
|
$ |
10.2 |
|
$ |
10.0 |
|
|
|
|
|
|
|
|
|
|
|
Finance lease cost |
|
|
|
|
|
|
|
|
|
Amortization of right-of-use assets |
|
Depreciation and amortization |
|
$ |
1.5 |
|
$ |
1.3 |
|
Interest on lease liabilities |
|
Interest expense |
|
|
0.3 |
|
|
0.2 |
|
Total finance lease cost |
|
|
|
$ |
1.8 |
|
$ |
1.5 |
|
|
|
|
|
|
|
|
|
|
|
Total lease cost(a) |
|
|
|
$ |
12.0 |
|
$ |
11.5 |
|
(a) |
Short-term lease expense and variable lease expense are immaterial. |
The Company follows ASC 360, “Impairment or Disposal of Long-Lived Assets” guidance to determine whether right-of-use assets relating to operating and finance leases are impaired. The Company recorded impairment charges of $3.2 million to right-of-use assets relating to operating leases for the three months ended March 31, 2020 in connection with the planned divestiture of Aveda Transportation and Energy Services Inc. (Aveda). See Note 3 for details. There was no impairment charge to right-of-use assets relating to operating leases for the three months ended March 31, 2019.
The components of assets and liabilities for operating and finance leases are as follows as of March 31, 2020 and December 31, 2019 (in millions):
|
|
|
|
|
March 31, |
|
December 31, |
||
|
|
|
Classification |
|
2020 |
|
2019 |
||
|
Assets |
|
|
|
|
|
|
|
|
|
Capitalized operating lease right-of-use assets |
|
Right-of-use assets |
|
$ |
108.5 |
|
$ |
95.9 |
|
Finance lease right-of-use assets |
|
Other long-term assets |
|
|
25.3 |
|
|
25.3 |
|
Total lease assets |
|
|
|
$ |
133.8 |
|
$ |
121.2 |
|
|
|
|
|
|
|
|
|
|
|
Liabilities |
|
|
|
|
|
|
|
|
|
Capitalized operating lease liabilities: |
|
|
|
|
|
|
|
|
|
Current |
|
Other current liabilities |
|
$ |
27.8 |
|
$ |
27.3 |
|
Non-current |
|
Other long-term liabilities |
|
|
91.0 |
|
|
77.8 |
|
Total capitalized operating lease liabilities |
|
|
|
$ |
118.8 |
|
|
105.1 |
|
|
|
|
|
|
|
|
|
|
|
Finance lease liabilities: |
|
|
|
|
|
|
|
|
|
Current |
|
Current portion of long-term debt |
|
$ |
6.3 |
|
|
6.2 |
|
Non-current |
|
Long-term debt, net of current portion |
|
|
19.7 |
|
|
19.3 |
|
Total finance lease liabilities |
|
|
|
$ |
26.0 |
|
|
25.5 |
|
|
|
|
|
|
|
|
|
|
|
Total lease liabilities |
|
|
|
$ |
144.8 |
|
$ |
130.6 |
12
The following table is a summary of supplemental cash flows related to leases for the three months ended March 31, 2020 and 2019 (in millions):
|
|
|
|
|
|
|
|
|
|
|
Three Months Ended March 31, |
||||
|
|
|
2020 |
|
2019 |
||
|
Cash paid for amounts included in the measurement of lease liabilities: |
|
|
|
|
|
|
|
Operating cash flows from capitalized operating leases |
|
$ |
(9.3) |
|
$ |
(8.0) |
|
Operating cash flows from finance leases |
|
|
(0.3) |
|
|
(0.2) |
|
Financing cash flows from finance leases |
|
|
(1.7) |
|
|
(1.5) |
|
Right-of-use assets obtained in exchange for lease obligations: |
|
|
|
|
|
|
|
Capitalized operating lease right-of-use assets |
|
$ |
19.1 |
|
$ |
8.1 |
|
Finance lease right-of-use assets |
|
|
1.7 |
|
|
4.8 |
The following table is the future payments on leases as of March 31, 2020 (in millions):
|
|
|
Capitalized |
|
|
|
|
|
|
|
|
|
|
Operating |
|
Finance |
|
|
|
||
|
Year ending December 31, |
|
leases |
|
leases |
|
Total |
|||
|
2020(1) |
|
$ |
25.7 |
|
$ |
5.8 |
|
$ |
31.5 |
|
2021 |
|
|
29.7 |
|
|
7.4 |
|
|
37.1 |
|
2022 |
|
|
26.3 |
|
|
5.5 |
|
|
31.8 |
|
2023 |
|
|
20.5 |
|
|
6.0 |
|
|
26.5 |
|
2024 |
|
|
11.1 |
|
|
3.4 |
|
|
14.5 |
|
2025 |
|
|
8.0 |
|
|
1.0 |
|
|
9.0 |
|
Thereafter |
|
|
14.8 |
|
|
— |
|
|
14.8 |
|
Total lease payments |
|
|
136.1 |
|
|
29.1 |
|
|
165.2 |
|
Less: interest |
|
|
(17.3) |
|
|
(3.1) |
|
|
(20.4) |
|
Present value of lease liabilities |
|
$ |
118.8 |
|
$ |
26.0 |
|
$ |
144.8 |
|
(1) |
Nine months ending December 31, 2020 |
The following table is a summary of weighted average lease terms and discount rates for leases as of March 31, 2020 and December 31, 2019:
|
|
|
March 31, |
|
December 31, |
|
||
|
|
|
2020 |
|
2019 |
|
||
|
Weighted-average remaining lease term (years) |
|
|
|
|
|
|
|
|
Capitalized operating leases |
|
|
5.14 |
|
|
5.01 |
|
|
Finance leases |
|
|
3.76 |
|
|
3.83 |
|
|
Weighted-average discount rate |
|
|
|
|
|
|
|
|
Capitalized operating leases |
|
|
5.36 |
% |
|
5.54 |
% |
|
Finance leases |
|
|
4.48 |
% |
|
4.51 |
% |
Lessor
The following table is the future minimum receipts on leases as of March 31, 2020 (in millions):
|
Twelve months ending March 31, |
|
Amount |
|
|
2021 |
|
$ |
24.6 |
|
2022 |
|
|
18.4 |
|
2023 |
|
|
10.9 |
|
2024 |
|
|
5.7 |
|
2025 |
|
|
2.4 |
|
Thereafter |
|
|
0.7 |
|
Total minimum lease receipts |
|
$ |
62.7 |
13
NOTE 3 – PLANNED DIVESTITURE OF AVEDA
As part of the overall operational and cost improvement plan of the Company, management and the board of directors had been evaluating how the Aveda business fits into the overall business strategy. In March 2020, the Company’s board of directors approved a plan for the sale of certain Aveda terminals located in Texas and Oklahoma.
The planned divestiture does not meet the quantitative and qualitative criteria to be classified as discontinued operations. As a result, the Aveda operations will continue to be reported in the Specialized Solutions segment results until the sale is finalized.
Effective with the designation as held for sale on March 31, 2020, the Company discontinued recording depreciation on property and equipment of this business and performed an impairment analysis of long-lived assets, as required by ASC 350 and 360. As a result of the analysis, impairment charges of $13.4 million were recorded for the three months ended March 31, 2020 consisting of property and equipment of $4.0 million, right-of-use assets of $3.2 million and tradename intangible assets of $6.2 million. The Company separately classified the related assets and liabilities of the business as held for sale in the consolidated balance sheet. Included in held for sale assets is $8.1 million of revenue equipment to be sold related to closed terminals. See Note 6 and 7 for details.
The principal components of the assets and liabilities held for sale are as follows as of March 31, 2020 (in millions):
|
|
|
March 31, |
|
|
|
|
2020 |
|
|
Assets |
|
|
|
|
Accounts receivable |
|
$ |
28.3 |
|
Prepaid and other current assets |
|
|
8.8 |
|
Property and equipment, net |
|
|
30.1 |
|
Right-of-use assets |
|
|
2.6 |
|
Total assets held for sale |
|
$ |
69.8 |
|
|
|
|
|
|
Liabilities |
|
|
|
|
Accounts payable |
|
$ |
5.2 |
|
Accrued expenses and other liabilities |
|
|
9.4 |
|
Other liabilities |
|
|
4.2 |
|
Deferred tax liabilities |
|
|
(5.7) |
|
Total liabilities held for sale |
|
$ |
13.1 |
The following table reflects revenues, operating income (loss) and net loss of Aveda’s held for sale operations for the three months ended March 31, 2020 and 2019 (in millions):
|
|
|
Three Months Ended March 31, |
||||
|
|
|
2020 |
|
2019 |
||
|
|
|
|
|
|
|
|
|
Total revenue |
|
$ |
32.2 |
|
$ |
42.0 |
|
Operating income (loss) |
|
$ |
(11.9) |
|
$ |
0.1 |
|
Net loss |
|
$ |
(12.2) |
|
$ |
(0.6) |
NOTE 4 – PREPAID AND OTHER CURRENT ASSETS
The components of prepaid expenses and other current assets are as follows as of March 31, 2020 and December 31, 2019 (in millions):
|
|
|
March 31, |
|
December 31, |
||
|
|
|
2020 |
|
2019 |
||
|
Insurance |
|
$ |
8.3 |
|
$ |
10.1 |
|
Licensing, permits and tolls |
|
|
4.7 |
|
|
5.4 |
|
Other assets |
|
|
2.9 |
|
|
3.1 |
|
Other prepaids |
|
|
1.3 |
|
|
1.7 |
|
Highway and fuel taxes |
|
|
1.2 |
|
|
1.6 |
|
|
|
$ |
18.4 |
|
$ |
21.9 |
14
NOTE 5 – GOODWILL AND INTANGIBLE ASSETS
Goodwill represents the excess of the purchase price of all acquisitions over the estimated fair value of the net assets acquired. The Company performs an impairment test of goodwill annually as of October 1 or when impairment indicators arise.
The summary of changes in goodwill follows for the three months ended March 31, 2020 (in millions):
|
|
|
Flatbed |
|
Specialized |
|
Total |
|||
|
Goodwill balance at December 31, 2019 |
|
$ |
59.3 |
|
$ |
80.6 |
|
$ |
139.9 |
|
Foreign currency translation adjustment |
|
|
— |
|
|
(0.8) |
|
|
(0.8) |
|
Goodwill balance at March 31, 2020 |
|
$ |
59.3 |
|
$ |
79.8 |
|
$ |
139.1 |
Intangible assets consisted of the following as of March 31, 2020 and December 31, 2019 (in millions):
|
|
|
As of March 31, 2020 |
|
As of December 31, 2019 |
||||||||||||||
|
|
|
Intangible |
|
Accumulated |
|
Intangible |
|
Intangible |
|
Accumulated |
|
Intangible |
||||||
|
|
|
Assets |
|
Amortization |
|
Assets, net |
|
Assets |
|
Amortization |
|
Assets, net |
||||||
|
Non-competition agreements |
|
$ |
21.7 |
|
$ |
(18.8) |
|
$ |
2.9 |
|
$ |
21.7 |
|
$ |
(18.4) |
|
$ |
3.3 |
|
Customer relationships |
|
|
88.9 |
|
|
(43.6) |
|
|
45.3 |
|
|
88.9 |
|
|
(42.2) |
|
|
46.7 |
|
Trade names |
|
|
52.9 |
|
|
— |
|
|
52.9 |
|
|
59.1 |
|
|
— |
|
|
59.1 |
|
Foreign currency translation adjustment |
|
|
(0.3) |
|
|
— |
|
|
(0.3) |
|
|
— |
|
|
— |
|
|
— |
|
Total intangible assets |
|
$ |
163.2 |
|
$ |
(62.4) |
|
$ |
100.8 |
|
$ |
169.7 |
|
$ |
(60.6) |
|
$ |
109.1 |
During the first quarter of 2020, the Company recorded an impairment charge to intangible assets of $6.2 million for the trade names category of intangible assets. See Note 3 for details.
As of March 31, 2020, non-competition agreements and customer relationships had weighted average remaining useful lives of 2.6 and 9.7 years, respectively.
Amortization expense for intangible assets with definite lives was $1.8 million and $4.3 million for the three months ended March 31, 2020 and 2019, respectively.
Future estimated amortization expense is as follows (in millions):
|
|
|
Non-competition |
|
Customer |
||
|
Year ending December 31, |
|
Agreements |
|
Relationships |
||
|
2020(1) |
|
$ |
0.9 |
|
$ |
4.5 |
|
2021 |
|
|
1.0 |
|
|
5.9 |
|
2022 |
|
|
0.9 |
|
|
5.9 |
|
2023 |
|
|
0.1 |
|
|
5.9 |
|
2024 |
|
|
— |
|
|
4.5 |
|
Thereafter |
|
|
— |
|
|
18.6 |
|
Total |
|
$ |
2.9 |
|
$ |
45.3 |
|
(1) |
Nine months ending December 31, 2020 |
NOTE 6 – INTEGRATION AND RESTRUCTURING
On July 30, 2019, the Company internally announced a plan to integrate three operating segments with three other operating segments (Project Synchronize, the Plan or Phase I), which reduced the number of operating segments from 16 to 13. The Plan was implemented to streamline and reduce the Company’s cost structure, improve asset utilization and capitalize on operational synergies. Additionally, the Company announced the planned implementation of Business Improvement Plans (BIP), which is expected to increase profitability by right-sizing trailer-to-tractor ratios, yielding management capacity allocations, and improving maintenance execution. On September 4, 2019, the Company announced a comprehensive restructuring plan (Project Pivot) intended to reduce its cost base, right size its organization and management team and increase and accelerate its previously announced operational improvement goals. As part of Project Pivot, the Company executed a new management restructuring and substantial corporate cost reduction plan.
The Company implemented Project Synchronize and Project Pivot which resulted in recording of integration and restructuring costs. The integration and restructuring costs consist of assets impairments, employee-related costs, other transition and termination costs related to restructuring activities. Employee-related costs include severance, tax preparation, and relocation costs. Severance, tax preparation and relocation costs are expensed in accordance with ASC 420. Other transition and termination costs include fixed asset-related charges, contract
15
and lease termination costs, professional fees, and other miscellaneous expenditures associated with the integration or restructuring activities, which are expensed as incurred. Costs are reported in restructuring charges in the consolidated statements of operations and comprehensive loss. The obligation related to employee separation costs is included in other current liabilities in the consolidated balance sheets.
On March 10, 2020, the Company announced a plan to integrate three operating segments with three other operating segments (Phase II of the Plan), which will further reduce the number of operating segments from 13 to 10. Phase II was initially expected to be significantly completed by June 30, 2020, however, due to uncertainties and changes in focus caused by the COVID-19 pandemic, the Company now expects Phase II to be completed by December 31, 2020. The Company is in the process of determining the estimated impact of Phase II on the financial statements.
During the quarter ended March 31, 2020, the Company made the decision to close certain of the Aveda terminals and wind down those operations. The Company recorded $0.4 million of restructuring and exit costs in connection with the closure of these terminals in the three months ended March 31, 2020.
The Company recorded $0.1 million of integration and restructuring expenses in connection with Phase I, and Project Pivot in the three months ended March 31, 2020, completing Phase I of Project Synchronize.
The following table summarizes the integration and restructuring costs for Phase I of Project Synchronize and Project Pivot as of March 31, 2020 (in millions):
|
|
|
Severance |
|
|
|
|
|
||
|
|
|
and |
|
|
|
|
|
||
|
|
|
Other Payroll |
|
Other |
|
Total |
|||
|
Balance, December 31, 2019 |
|
$ |
1.8 |
|
$ |
— |
|
$ |
1.8 |
|
Specialized Solution |
|
|
|
|
|
|
|
|
|
|
Costs accrued |
|
|
— |
|
|
0.1 |
|
|
0.1 |
|
Amounts paid or charged |
|
|
— |
|
|
(0.1) |
|
|
(0.1) |
|
Specialized Solution balance at March 31, 2020 |
|
|
— |
|
|
— |
|
|
— |
|
Flatbed Solution |
|
|
|
|
|
|
|
|
|
|
Costs accrued |
|
|
— |
|
|
— |
|
|
— |
|
Amounts paid or charged |
|
|
— |
|
|
— |
|
|
— |
|
Flatbed Solution balance at March 31, 2020 |
|
|
— |
|
|
— |
|
|
— |
|
Corporate |
|
|
|
|
|
|
|
|
|
|
Costs accrued |
|
|
— |
|
|
— |
|
|
— |
|
Amounts paid or charged |
|
|
(1.1) |
|
|
— |
|
|
(1.1) |
|
Corporate balance at March 31, 2020 |
|
|
(1.1) |
|
|
— |
|
|
(1.1) |
|
Consolidated |
|
|
|
|
|
|
|
|
|
|
Costs accrued |
|
|
— |
|
|
0.1 |
|
|
0.1 |
|
Amounts paid or charged |
|
|
(1.1) |
|
|
(0.1) |
|
|
(1.2) |
|
Consolidated balance at March 31, 2020 |
|
$ |
0.7 |
|
$ |
— |
|
$ |
0.7 |
The following table summarizes the restructuring and exit costs for the Aveda closed terminals as of March 31, 2020 (in millions):
|
|
|
Severance |
|
|
|
|
|
||
|
|
|
and |
|
|
|
|
|
||
|
|
|
Other Payroll |
|
Other |
|
Total |
|||
|
Specialized Solution |
|
|
|
|
|
|
|
|
|
|
Costs accrued |
|
$ |
0.4 |
|
$ |
— |
|
$ |
0.4 |
|
Amounts paid or charged |
|
|
(0.3) |
|
|
— |
|
|
(0.3) |
|
Specialized Solution balance at March 31, 2020 |
|
$ |
0.1 |
|
$ |
— |
|
$ |
0.1 |
NOTE 7 – PROPERTY AND EQUIPMENT
In accordance with ASC 360, “Impairment or Disposal of Long-Lived Assets,” the Company reviews its definite lived long-lived assets whenever events or changes in circumstances indicate that the carrying amount of such assets may not be recoverable. If the carrying amount of an asset or group of assets exceeds its net realizable value, the asset will be written down to its fair value and the amount recognized for impairment is equal to the difference between the carrying value and the asset’s fair value.
During the first quarter of 2020, the Company recorded an impairment charge of $4.0 million to state property and equipment at fair value
16
which related to the Specialized Solutions segment. The impairment charge is included in impairment in the consolidated statements of operations and comprehensive loss. See Note 3 for details.
The components of property and equipment are as follows as of March 31, 2020 and December 31, 2019 (in millions):
|
|
|
March 31, |
|
December 31, |
||
|
|
|
2020 |
|
2019 |
||
|
Revenue equipment |
|
$ |
519.8 |
|
$ |
597.0 |
|
Assets leased and available for lease to owner-operators |
|
|
71.3 |
|
|
64.3 |
|
Buildings and improvements |
|
|
57.9 |
|
|
59.9 |
|
Furniture and fixtures, office and computer equipment and vehicles |
|
|
31.8 |
|
|
40.2 |
|
|
|
|
680.8 |
|
|
761.4 |
|
Accumulated depreciation |
|
|
(292.9) |
|
|
(322.4) |
|
|
|
$ |
387.9 |
|
$ |
439.0 |
Depreciation expense on property and equipment was $20.4 million and $24.7 million for the three months ended March 31, 2020 and 2019, respectively. Depreciation expense and accumulated depreciation on assets leased and available for lease to owner-operators was $4.1 million and $5.6 million for the three months ended March 31, 2020 and 2019, respectively.
NOTE 8 – ACCRUED EXPENSES AND OTHER LIABILITIES
The components of accrued expenses and other liabilities are as follows as of March 31, 2020 and December 31, 2019 (in millions):
|
|
|
March 31, |
|
December 31, |
||
|
|
|
2020 |
|
2019 |
||
|
Brokerage and escorts |
|
$ |
14.8 |
|
$ |
16.9 |
|
Other accrued expenses |
|
|
11.4 |
|
|
10.6 |
|
Owner-operator deposits |
|
|
9.9 |
|
|
7.1 |
|
Unvouchered payables |
|
|
7.4 |
|
|
6.1 |
|
Fuel and fuel taxes |
|
|
1.5 |
|
|
1.3 |
|
Sales and local taxes payable |
|
|
1.4 |
|
|
1.7 |
|
Interest |
|
|
0.5 |
|
|
0.5 |
|
|
|
$ |
46.9 |
|
$ |
44.2 |
NOTE 9 – LONG-TERM DEBT
Long-term debt consists of the following as of March 31, 2020 and December 31, 2019 (in millions):
|
|
|
March 31, |
|
December 31, |
||
|
|
|
2020 |
|
2019 |
||
|
Line of credit |
|
$ |
— |
|
$ |
1.7 |
|
Term loan facility |
|
|
487.3 |
|
|
488.5 |
|
Equipment term loans |
|
|
180.3 |
|
|
188.4 |
|
Finance and capital leases |
|
|
26.0 |
|
|
25.5 |
|
|
|
|
693.6 |
|
|
704.1 |
|
Less current portion |
|
|
(57.7) |
|
|
(59.4) |
|
Less unamortized debt issuance costs |
|
|
(10.3) |
|
|
(11.4) |
|
Total long-term debt |
|
$ |
625.6 |
|
$ |
633.3 |
Term Loan Facility
The Company has a $500.0 million term loan facility under a loan agreement with Credit Suisse AG, Cayman Islands Branch, as administrative agent, and the lenders party thereto (the Term Loan Facility) with a scheduled maturity date of February 27, 2024. Term loans under the Term Loan Facility are, at the Company’s election from time to time, comprised of alternate base rate loans (an ABR Borrowing) or adjusted LIBOR loans (a Eurodollar Rate Borrowing), with the applicable margins of interest being an alternate base rate (subject to a 2.00% floor) plus 4.00% per annum and LIBOR (subject to a 1.00% floor) plus 5.00% per annum. At March 31, 2020, the average interest rate on the Term Loan Facility was 6.7%.
17
The Term Loan Facility is secured by all assets of the Company, except those assets collateralizing equipment and certain real estate lenders debt and subject to certain customary exceptions.
The Term Loan Facility contains a financial covenant requiring the Company to maintain a consolidated total leverage ratio as of the last day of any fiscal quarter of less than or equal to 4.00 to 1.00, stepping down to 3.75 to 1.00 on March 31, 2021. The consolidated total leverage ratio is defined as the ratio of (i) consolidated total debt minus unrestricted cash and cash equivalents and cash and cash equivalents restricted in favor of the administrative agent and the lenders, to (ii) consolidated Adjusted EBITDA for the trailing 12 month period (with customary add-backs permitted to consolidated Adjusted EBITDA, including in respect of synergies and cost-savings reasonably identifiable and factually supportable that are anticipated to be realized in an aggregate amount not to exceed 25% of consolidated Adjusted EBITDA and subject to other customary limitations).
The Term Loan Facility permits voluntary prepayments of borrowings. In certain circumstances (subject to exceptions, exclusions and, in the case of excess cash flow, step-downs described below), the Company may also be required to make an offer to prepay the Term Loan Facility if it receives proceeds as a result of certain asset sales, debt issuances, casualty or similar events of loss, or if it has excess cash flow (defined as an annual amount calculated using a customary formula based on consolidated Adjusted EBITDA, including, among other things, deductions for (i) the amount of certain voluntary prepayments of the Term Loan Facility and (ii) the amount of certain capital expenditures, acquisitions, investments and restricted payments). The percentage of excess cash flow that must be applied as a mandatory prepayment is 50%, 25% or 0% for excess cash flow periods for the year ending December 31, 2019 and beyond, depending upon the first lien leverage ratio.
The Term Loan Facility contains (i) certain customary affirmative covenants that, among other things, require compliance with applicable laws, periodic financial reporting and notices of material events, payment of taxes and other obligations, maintenance of property and insurance, and provision of additional guarantees and collateral, and (ii) certain customary negative covenants that, among other things, restrict the incurrence of additional indebtedness, liens on property, sale and leaseback transactions, investments, mergers, consolidations, liquidations and dissolutions, asset sales, acquisitions, the payment of distributions, dividends, redemptions and repurchases of equity interests, transactions with affiliates, prepayments and redemptions of certain other indebtedness, burdensome agreements, holding company limitations, changes in fiscal year and modifications of organizational documents.
ABL Facility
The Company has a five-year, senior secured asset-based revolving line of credit with an aggregate maximum credit amount equal to $100.0 million (subject to availability under a borrowing base equal to 85% of the Company’s eligible accounts receivable, 80% of the Company’s eligible unbilled accounts receivable and 50% of parts supplies) under a credit agreement with PNC Bank, National Association, as administrative agent and the lenders party thereto. The ABL Facility’s maximum credit amount may be increased by $30.0 million pursuant to an uncommitted accordion. The ABL Facility also provides for the issuance of letters of credit subject to certain restrictions and a sublimit of $20 million, as defined in the credit agreement. The ABL Facility matures on February 27, 2022. As of March 31, 2020, the Company had a debit balance of $10.0 million which is included in cash and cash equivalents, $16.4 million in letters of credit outstanding, and could incur approximately $84.4 million of additional indebtedness under the ABL Facility.
Borrowings under the ABL Facility bear interest at rates based upon the Company’s fixed charge coverage ratio and, at the Company’s election from time to time, either a base rate plus an applicable margin or an adjusted LIBOR rate plus an applicable margin. Margins on the ABL Facility are adjusted, if necessary to the applicable rates set forth in the following table corresponding to the fixed charge coverage ratio for the trailing 12 month period on the last day of the most recently completed fiscal quarter.
|
Fixed Charge Coverage Ratio |
|
Base Rate Margins |
|
LIBOR Rate Margins |
|
|
Less than 1.25 to 1.00 |
|
2.25 |
% |
3.25 |
% |
|
Greater than or equal to 1.25 to 1.00, but less than 1.50 to 1.00 |
|
1.75 |
% |
2.75 |
% |
|
Greater than or equal to 1.50 to 1.00, but less than 1.75 to 1.00 |
|
1.25 |
% |
2.25 |
% |
|
Greater than or equal to 1.75 to 1.00 |
|
0.75 |
% |
1.75 |
% |
The ABL Facility margins are adjusted to the applicable rates set forth in the following table corresponding to the average RLOC Utilization for the trailing 12 month period on the last day of the most recently completed fiscal quarter. RLOC Utilization at a particular date shall mean an amount equal to (a)(i) outstanding amount of Revolving Advances plus (ii) the outstanding amount of the Swing Loans plus (iii) the aggregate Maximum Undrawn Amount of all outstanding Letters of Credit, divided by (b) Maximum Revolving Advance Amount, each as defined in the credit agreement.
18
|
RLOC Utilization |
|
Base Rate Margins |
|
LIBOR Rate Margins |
|
|
Less than 33.3% |
|
0.50 |
% |
1.50 |
% |
|
Greater than or equal to 33.3%, but less than 66.6% |
|
0.75 |
% |
1.75 |
% |
|
Greater than or equal to 66.6% |
|
1.00 |
% |
2.00 |
% |
At March 31, 2020, the interest rate on the ABL Facility was 3.75%.
The ABL Facility is secured by all of the Company’s U.S.-based accounts receivable, parts supplies, cash and cash equivalents excluding proceeds of Term Loan Facility, securities and deposit accounts and other general assets not included in the Term Loan Facility collateral.
The ABL Facility contains (i) a financial covenant similar to the consolidated total leverage ratio required under the Term Loan Facility requiring a leverage ratio of less than or equal to 4.00 to 1.00 for the fiscal quarter, stepping down to 3.75 to 1.00 on March 31, 2021 and (ii) during any period after a default or event of default or after excess availability falling below the greater of (x) $15.0 million and (y) 20% of the maximum credit amount, continuing until such time as no default or event of default has existed and excess availability has exceeded such amounts for a period of 60 consecutive days, a financial covenant requiring the Company to maintain a minimum consolidated fixed charge coverage ratio of 1.00x, tested on a quarterly basis. The Company’s fixed charge coverage ratio is defined as the ratio of (1) consolidated Adjusted EBITDA minus unfinanced capital expenditures, cash taxes and cash dividends or distributions, to (2) the sum of all funded debt payments for the four-quarter period then ending (with customary add-backs permitted to consolidated Adjusted EBITDA).
The ABL Facility contains affirmative and negative covenants similar to those in the Term Loan Facility, together with such additional terms as are customary for a senior secured asset-based revolving credit facility.
As of March 31, 2020, the Company was in compliance with all covenants contained in the Term Loan and ABL Facilities.
Equipment Term Loans and Mortgages
As of March 31, 2020, the Company had term loans collateralized by equipment in the aggregate amount of $177.2 million with 33 lenders (Equipment Term Loans). The Equipment Term Loans bear interest at rates ranging from 1.5% to 10.7%, require monthly payments of principal and interest and mature at various dates through January 2028. Certain of the Equipment Term Loans contain conditions, covenants, representations and warranties, events of default, and indemnification provisions applicable to the Company and certain of its subsidiaries that are customary for equipment financings, including, but not limited to, limitations on the incurrence of additional debt and the prepayment of existing indebtedness, certain payments (including dividends and other distributions to persons not party to its credit facility) and transfers of assets.
As of March 31, 2020, the Company has a bank mortgage loan with a balance of $3.1 million incurred to finance the construction of the headquarters and terminal in Redmond, Oregon. The mortgage loan is collateralized by such property and buildings. The mortgage is payable in monthly installments of $15,776, including interest at 3.7% through November 2020. The interest rate and monthly payments will be adjusted on November 1, 2020 to a rate of 2.5%, plus the three-year advance rate published by the Federal Home Loan Bank of Seattle in effect 45 days prior to November 1, 2020 (which will not be less than 3.7%). The bank mortgage loan matures November 1, 2023.
Future Payments
Future principal payments on long-term debt (see Note 2 for future payments on leases) as of March 31, 2020 are as follows (in millions):
|
Twelve months ending March 31, |
Term Loan Facility |
|
Equipment Term Loans |
|
Total |
|||
|
|
|
|
|
|
|
|
|
|
|
2021 |
$ |
5.0 |
|
$ |
46.4 |
|
$ |
51.4 |
|
2022 |
|
2.5 |
|
|
42.6 |
|
|
45.1 |
|
2023 |
|
2.5 |
|
|
33.9 |
|
|
36.4 |
|
2024 |
|
477.3 |
|
|
32.1 |
|
|
509.4 |
|
2025 |
|
— |
|
|
16.6 |
|
|
16.6 |
|
Thereafter |
|
— |
|
|
8.7 |
|
|
8.7 |
|
Total long-term debt |
$ |
487.3 |
|
$ |
180.3 |
|
$ |
667.6 |
|
|
|
|
|
|
|
|
|
|
19
NOTE 10 – INCOME TAXES
Because of the magnitude of permanent book-tax differences compared to forecasted, annual pre-tax income, the annual effective tax rate approach does not provide a reliable estimate of income tax benefit. As a result, the Company has computed its income tax benefit for the three months ended March 31, 2020 using its actual effective tax rate. The effective tax rates for the three months ended March 31, 2020 and 2019 were 18.4% and 17.3%, respectively. The difference between the Company’s effective tax rate and the federal statutory rate primarily results from state income taxes and nondeductible expenses, including the effect of the per diem pay structure for drivers. State tax rates vary among states and range from approximately 1% to 6%, although some state rates are higher and a small number of states do not impose an income tax.
There were no changes in uncertain tax positions during the three months ended March 31, 2020.
NOTE 11 – STOCKHOLDERS’ EQUITY
Common Stock
Common stock has voting rights – one vote for each share of common stock.
As of March 31, 2020, the Company has approximately 0.5 million shares of common stock reserved for future issuances of stock options and restricted stock units under the Company’s 2017 Omnibus Incentive Plan. See Note 12 for additional details about the Company’s stock-based compensation plan.
Preferred Stock
The Company has issued and outstanding 650,000 shares of Series A Preferred Stock with a redemption value of $65.0 million. The par value of Series A Preferred Stock is $0.0001 per share. Additional features of this preferred stock are as follows:
Under the Certificate of Designations, Preferences, Rights and Limitations of the Series A Preferred Stock (the Certificate of Designations), each share of Series A Preferred Stock will be convertible, at the holder’s option at any time, initially into approximately 8.6957 shares of the Company’s common stock (assuming a conversion price of approximately $11.50 per share), subject to specified adjustments as set forth in the Certificate of Designations. If any holder elects to convert its Series A Preferred Stock after the seven-year anniversary of the issue date, if the then-current Conversion Price (as defined in the Certificate of Designations) exceeds the Weighted Average Price (as defined in the Certificate of Designations) for the common stock during any ten consecutive Trading Days (as defined in the Certificate of Designations), at its option by delivery of a Notice of Conversion in accordance with Section 8(b) of the Certificate of Designations no later than five business days following such tenth consecutive Trading Day, to convert any or all of such holder’s shares of Series A Preferred Stock into, at the Company’s sole discretion, either common stock, cash or a combination of common stock and cash; provided, that the Company shall provide such converting holder notice of its election within two Trading Days of receipt of the Notice of Conversion; provided further, that in the event the Company elects to issue common stock for all or a portion of such conversion, the Conversion Rate for such conversion (subject to the limitations set forth in Section 11 of the Certificate of Designations) shall mean the quotient of the Liquidation Preference (as defined in the Certificate of Designations) divided by the average Weighted Average Price for the common stock during the 20 consecutive Trading Days commencing on the Trading Day immediately following the Trading Day on which the Company provided such notice. If the Company does not elect a settlement method prior to the deadline set forth in the Certificate of Designations, the Company shall be deemed to have elected to settle the conversion entirely in common stock. Based on the assumed conversion rate, a total of 5,652,173 shares of common stock would be issuable upon conversion of all of the currently outstanding shares of Series A Preferred Stock.
On or after the third anniversary of the initial issuance date but prior to the fifth anniversary of the initial issuance date, the Company will have the right, at its option, to give notice of its election to cause all outstanding shares of the Series A Preferred Stock to be automatically converted into shares of the Company’s common stock at the then-effective conversion rate, if the Weighted Average Price of Company’s common stock equals or exceeds 140% of the then-current conversion price for at least 20-trading days (whether or not consecutive) in a period of 30 consecutive trading days. On or after the fifth anniversary of the initial issuance date but prior to the seventh anniversary of the initial issuance date, the Company will have the right, at its option, to give notice of its election to cause all outstanding shares of the Series A Preferred Stock to be automatically converted into shares of Company’s common stock at the then-effective conversion rate, if the Weighted Average Price of Company’s common stock equals or exceeds 115% of the then-current conversion price for at least 20-trading days (whether or not consecutive) in a period of 30 consecutive trading days. On or after the seventh anniversary of the initial issuance date, the Company will have the right, at its option, to give notice of its election to cause all outstanding shares of the Series A Preferred Stock to be automatically converted into shares of Company’s common stock at the then-effective conversion rate, if the Weighted Average Price of Company’s common stock equals or exceeds the then-current conversion price for at least 10 consecutive trading days. If the Company undergoes certain fundamental changes (as more fully described in the Certificate of Designations but including, among other things, certain change-in-control transactions, recapitalizations, asset sales and liquidation events), each outstanding share of Series A Preferred Stock may, within 15 days following the effective date of such fundamental change and at the election of the holder, be converted into Company’s
20
common stock at a conversion rate (subject to certain adjustments) equal to (i) the greater of (A) the sum of the conversion rate on the effective date of such fundamental change plus the additional shares received by holders of Series A Preferred Stock following such fundamental change (as set forth in the Certificate of Designations) and (B) the quotient of (x) $100.00, divided by (y) the greater of (1) the applicable holder stock price and (2) 66 2/3% of the closing sale price of the Company’s common stock on the issue date plus (ii) the number of shares of Company’s common stock that would be issued if any and all accumulated and unpaid dividends were paid in shares of Company’s common stock.
The Series A Preferred Stock contains limitations that prevent the holders thereof from acquiring shares of the Company’s common stock upon conversion that would result in (i) the number of shares beneficially owned by such holder and its affiliates exceeding 9.99% of the total number of shares of the Company’s common stock then outstanding or (ii) the Series A Preferred Stock being converted into more than 19.99% of the shares of the Company’s common stock outstanding on the initial issue date of the Series A Preferred Stock (subject to appropriate adjustment in the event of a stock split, stock dividend, combination or other similar recapitalization) without, in the latter instance, stockholder approval of such issuance.
Additional features of the Series A Preferred Stock are as follows:
Liquidation – In the event of liquidation, holders of Series A Preferred Stock have preferential rights to liquidation payments over holders of common stock. Holders of Series A Preferred Stock shall be paid out of the assets of the Company at an amount equal to $100 per share plus all accumulated and unpaid dividends.
Dividends – Dividends on the Series A Preferred Stock are cumulative at the Dividend Rate. The “Dividend Rate” is the rate per annum of 7.625% per share of Series A Preferred Stock on the liquidation preference ($100 per share). Dividends are payable quarterly in arrears in cash or, at the Company’s election and subject to the receipt of the necessary shareholder approval (to the extent necessary), in shares of the Company’s common stock. On February 27, 2020 the Company’s board of directors declared a quarterly dividend of $1.91 per share, which was paid on March 15, 2020. On February 27, 2019 the Company’s board of directors declared a quarterly dividend of $1.91 per share, which was paid on March 15, 2019.
Voting rights – Except as required by Delaware law, holders of the Series A Preferred Stock will have no voting rights except with respect to the approval of any material and adverse amendment to the Company’s certificate of incorporation, and certain significant holders of Series A Preferred Stock may have approval rights with respect to certain key economic terms of the Series A Preferred Stock, as set forth in the Certificate of Designations.
Warrants
At March 31, 2020, there were a total of 35,040,658 warrants outstanding to purchase 17,520,329 shares of the Company’s common stock.
The Company issued warrants (the Public Warrants) to purchase its common stock which were originally issued as part of units in the initial public offering (the IPO) of Hennessy (as defined below). There are 19,959,902 Public Warrants outstanding. The Company also issued 15,080,756 warrants (the Private Placement Warrants) to the sponsor in a private placement that closed simultaneously with the consummation of the IPO.
Each warrant entitles the registered holder to purchase one-half of one share of the Company’s common stock at a price of $5.75 per one-half of one share ($11.50 per whole share), subject to adjustment. The warrants may be exercised only for a whole number of shares of the Company’s common stock. No fractional shares will be issued upon exercise of the warrants. The warrants will expire on February 27, 2022, five years after the completion of the merger with Hennessy, or earlier upon redemption or liquidation. The warrants are listed on the NASDAQ market under the symbol DSKEW.
The Company may call the Public Warrants for redemption at a price of $0.01 per warrant if, and only if, the reported last sale price of the Company’s common stock equals or exceeds $24.00 per share for any 20-trading days within a 30-trading day period ending on the third trading day prior to the date the Company sends the notice of redemption to the Public Warrant holders.
NOTE 12 – STOCK-BASED COMPENSATION
Under the 2017 Omnibus Incentive Plan (the Plan), the Company may grant awards of stock options, stock appreciation rights, restricted stock, restricted stock units, other stock-based awards and performance awards. Under the Plan, the Company is authorized to issue up to 4.5 million shares of common stock. All awards granted were authorized under the Plan. These awards generally vest annually on a pro-rata basis over a five-year period on the anniversary of each grant date. We also grant awards to our directors under the Plan. The awards granted to directors vest ratably over periods of one, two or five years annually on the anniversary of each grant date.
21
All stock-based compensation cost is measured at the grant date, based on the estimated fair value of the award, and is recognized on a straight-line basis as expense over the employees’ requisite service period. Forfeitures are recorded as a cumulative adjustment to stock-based compensation expense in the period forfeitures occur. Aggregate stock-based compensation charges, net of forfeitures, were $0.9 million and $1.0 million during the three months ended March 31, 2020 and 2019, respectively. These expenses are included as a component of salaries, wages and employee benefits on the accompanying consolidated statements of operations and comprehensive loss. As of March 31, 2020, there was $3.7 million and $4.2 million of unrecognized stock-based compensation expense related to stock options and restricted stock units, respectively. This expense will be recognized over the weighted average periods of 2.6 years for stock options and 2.2 years for restricted stock units.
Stock Options
The following table summarizes stock option grants under the Plan:
|
Grantee Type |
|
# of |
|
Issued and |
|
Vesting |
|
Weighted |
|
Weighted Average |
||
|
|
|
|
|
|
|
|
|
|
|
|
|
|
|
Director Group |
|
150,000 |
|
100,000 |
|
5 years |
|
$ |
9.98 |
|
$ |
4.36 |
|
Employee Group |
|
2,632,730 |
|
2,180,124 |
|
3-5 years |
|
$ |
8.56 |
|
$ |
3.70 |
|
Total |
|
|
|
2,280,124 |
|
|
|
|
|
|
|
|
A summary of option activity under the Plan as of March 31, 2020 and changes during the three months then ended are as follows:
|
|
|
Shares |
|
Weighted |
|
Weighted |
|
Aggregate |
||
|
Outstanding as of January 1, 2020 |
|
2,308,924 |
|
$ |
8.39 |
|
8.0 |
|
$ |
0.2 |
|
Granted |
|
— |
|
|
— |
|
|
|
|
|
|
Forfeited or expired |
|
(28,800) |
|
|
11.80 |
|
|
|
|
|
|
Outstanding as of March 31, 2020 |
|
2,280,124 |
|
$ |
8.34 |
|
7.7 |
|
$ |
— |
|
|
|
|
|
|
|
|
|
|
|
|
|
Exercisable as of March 31, 2020 |
|
945,556 |
|
$ |
9.76 |
|
7.2 |
|
$ |
— |
|
Vested and expected to vest as of March 31, 2020 |
|
2,280,124 |
|
$ |
8.34 |
|
7.7 |
|
$ |
— |
The stock options’ maximum contract term is ten years. The Company did not have any stock options granted during the three months ended March 31, 2020. The total weighted average fair value of options granted during the three months ended March 31, 2019 was $0.6 million.
Restricted Stock Units
Restricted stock units are nontransferable until vested and the holders are entitled to receive dividends with respect to the non-vested units. Prior to vesting, the grantees of restricted stock units are not entitled to vote the shares. Restricted stock unit awards vest in equal annual increments over the vesting period.
The following table summarizes restricted stock unit grants under the Plan:
|
Grantee Type |
|
# of |
|
Issued and Outstanding |
|
Vesting |
|
Weighted |
|
|
|
|
|
|
|
|
|
|
|
|
|
Director Group |
|
785,498 |
|
730,838 |
|
1-2 years |
|
$ |
2.75 |
|
Employee Group |
|
1,568,655 |
|
411,925 |
|
5 years |
|
$ |
10.59 |
|
Total |
|
|
|
1,142,763 |
|
|
|
|
|
22
A summary of restricted stock unit awards activity under the Plan as of March 31, 2020 and changes during the three months then ended are as follows:
|
|
|
Units |
|
Weighted |
|
|
|
|
|
|
|
|
|
Non-vested as of January 1, 2020 |
|
1,180,882 |
|
$ |
5.44 |
|
Granted |
|
— |
|
|
— |
|
Vested |
|
(13,805) |
|
|
14.29 |
|
Forfeited |
|
(24,314) |
|
|
10.38 |
|
Non-vested as of March 31, 2020 |
|
1,142,763 |
|
$ |
5.22 |
NOTE 13 – DEFINED CONTRIBUTION PLAN
The Company sponsors the Daseke, Inc. 401(k) Retirement Plan (the Retirement Plan). The Retirement Plan is a defined contribution plan and intended to qualify under the Internal Revenue Code provisions of Section 401(k). Under the safe harbor matching requirements, the Company had expenses of $1.4 million for each of the three months in the periods ended March 31, 2020 and 2019.
NOTE 14 – COMMITMENTS AND CONTINGENCIES
Letters of Credit
The Company had outstanding letters of credit as of March 31, 2020 totaling approximately $18.4 million, including those disclosed in Note 9. These letters of credit are related to liability and workers compensation insurance claims.
Contingencies
The Company is involved in certain claims and pending litigation arising in the normal course of business. These proceedings primarily involve claims for personal injury or property damage incurred in the transportation of freight or for personnel matters. The Company maintains liability insurance to cover liabilities arising from these matters but is responsible to pay self-insurance and deductibles on such matters up to a certain threshold before the insurance is applied.
NOTE 15 – REPORTABLE SEGMENTS
The Company evaluates the performance of the segments primarily based on their respective revenues and operating income. Accordingly, interest expense and other non-operating items are not reported in segment results. In addition, the Company has disclosed a corporate segment, which is not an operating segment and includes acquisition transaction expenses, corporate salaries, interest expense and other corporate administrative expenses and intersegment eliminations.
The Company’s operating segments also provide transportation and related services for one another. Such services are generally billed at cost, and no profit is earned. Such intersegment revenues and expenses are eliminated in the Company’s consolidated results. Intersegment revenues and expenses for the Flatbed Solutions segment totaled $1.7 million and $2.4 million for the three months ended March 31, 2020 and 2019, respectively. Intersegment revenues and expenses for the Specialized Solutions segment totaled $2.7 million and $2.5 million for the three months ended March 31, 2020 and 2019, respectively.
Certain insurance costs have been allocated to the operating segments beginning January 1, 2020, which were included in the corporate segment in 2019. Insurance costs included in the corporate segment for the three months ended March 31, 2019 were $0.8 million for the Flatbed Solutions segment and $1.0 million for the Specialized Solutions segment.
23
The following tables reflect certain financial data of the Company’s reportable segments for the three months ended March 31, 2020 and 2019 (in millions):
|
|
|
Flatbed |
|
Specialized |
|
|
|
|
|
|
||
|
|
|
Solutions |
|
Solutions |
|
Corporate/ |
|
Consolidated |
||||
|
|
|
Segment |
|
Segment |
|
Eliminations |
|
Total |
||||
|
Three Months Ended March 31, 2020 |
|
|
|
|
|
|
|
|
|
|
|
|
|
Total revenue |
|
$ |
155.2 |
|
$ |
240.4 |
|
$ |
(4.6) |
|
$ |
391.0 |
|
Company freight |
|
|
51.4 |
|
|
132.1 |
|
|
(2.6) |
|
|
180.9 |
|
Owner operator freight |
|
|
66.1 |
|
|
42.8 |
|
|
(1.1) |
|
|
107.8 |
|
Brokerage |
|
|
19.6 |
|
|
42.8 |
|
|
(0.7) |
|
|
61.7 |
|
Logistics |
|
|
0.8 |
|
|
9.1 |
|
|
0.2 |
|
|
10.1 |
|
Fuel surcharge |
|
|
17.3 |
|
|
13.6 |
|
|
(0.4) |
|
|
30.5 |
|
Operating income (loss) |
|
|
8.6 |
|
|
(6.5) |
|
|
(10.4) |
|
|
(8.3) |
|
Depreciation |
|
|
8.3 |
|
|
15.9 |
|
|
0.3 |
|
|
24.5 |
|
Amortization of intangible assets |
|
|
0.8 |
|
|
1.0 |
|
|
— |
|
|
1.8 |
|
Impairment |
|
|
— |
|
|
13.4 |
|
|
— |
|
|
13.4 |
|
Restructuring |
|
|
— |
|
|
0.5 |
|
|
— |
|
|
0.5 |
|
Non-cash operating lease expense |
|
|
0.9 |
|
|
2.0 |
|
|
— |
|
|
2.9 |
|
Interest expense |
|
|
2.5 |
|
|
3.1 |
|
|
6.4 |
|
|
12.0 |
|
Income (loss) before income tax |
|
|
6.1 |
|
|
(10.7) |
|
|
(16.6) |
|
|
(21.2) |
|
Total assets |
|
|
350.9 |
|
|
660.7 |
|
|
126.5 |
|
|
1,138.1 |
|
Capital expenditures |
|
|
7.8 |
|
|
6.5 |
|
|
— |
|
|
14.3 |
|
|
|
|
|
|
|
|
|
|
|
|
|
|
|
Three Months Ended March 31, 2019 |
|
|
|
|
|
|
|
|
|
|
|
|
|
Total revenue |
|
$ |
167.9 |
|
$ |
269.7 |
|
$ |
(4.6) |
|
$ |
433.0 |
|
Company freight |
|
|
55.2 |
|
|
153.9 |
|
|
(2.9) |
|
|
206.2 |
|
Owner operator freight |
|
|
68.5 |
|
|
43.8 |
|
|
(1.3) |
|
|
111.0 |
|
Brokerage |
|
|
25.3 |
|
|
46.1 |
|
|
— |
|
|
71.4 |
|
Logistics |
|
|
0.7 |
|
|
11.7 |
|
|
— |
|
|
12.4 |
|
Fuel surcharge |
|
|
18.2 |
|
|
14.2 |
|
|
(0.4) |
|
|
32.0 |
|
Operating income (loss) |
|
|
3.3 |
|
|
7.8 |
|
|
(10.4) |
|
|
0.7 |
|
Depreciation |
|
|
13.0 |
|
|
24.1 |
|
|
0.1 |
|
|
37.2 |
|
Amortization of intangible assets |
|
|
1.7 |
|
|
2.6 |
|
|
— |
|
|
4.3 |
|
Non-cash operating lease expense |
|
|
2.4 |
|
|
4.1 |
|
|
0.1 |
|
|
6.6 |
|
Interest expense |
|
|
2.6 |
|
|
3.3 |
|
|
6.8 |
|
|
12.7 |
|
Income (loss) before income tax |
|
|
0.9 |
|
|
5.0 |
|
|
(17.1) |
|
|
(11.2) |
|
Total assets |
|
|
497.7 |
|
|
935.5 |
|
|
66.6 |
|
|
1,499.8 |
|
Capital expenditures |
|
|
14.7 |
|
|
13.7 |
|
|
0.6 |
|
|
29.0 |
NOTE 16 –LOSS PER SHARE
|
|
|
Three Months Ended |
||||
|
|
|
March 31, |
||||
|
(in millions, except per share data) |
|
2020 |
|
2019 |
||
|
|
|
|
|
|
|
|
|
Numerator: |
|
|
|
|
|
|
|
Net loss |
|
$ |
(17.3) |
|
$ |
(9.3) |
|
Less Series A preferred dividends |
|
|
(1.2) |
|
|
(1.2) |
|
Net loss attributable to common stockholders |
|
$ |
(18.5) |
|
$ |
(10.5) |
|
|
|
|
|
|
|
|
|
Denominator: |
|
|
|
|
|
|
|
Weighted-average shares outstanding |
|
|
64.6 |
|
|
64.5 |
|
Weighted average non-vested participating restricted stock units |
|
|
— |
|
|
— |
|
Denominator for basic and diluted EPS – weighted-average shares |
|
|
64.6 |
|
|
64.5 |
|
|
|
|
|
|
|
|
|
Basic and diluted loss per share |
|
$ |
(0.29) |
|
$ |
(0.16) |
24
Item 2. Management’s Discussion and Analysis of Financial Condition and Results of Operations
Overview
Introductory Note
Daseke is a leading provider and consolidator of transportation and logistics solutions focused exclusively on flatbed and specialized (open-deck) freight in North America. The Company believes it provides one of the most comprehensive transportation and logistics solution offerings in the open-deck industry. The Company delivers a diverse offering of transportation and logistics solutions to approximately 6,300 customers across the continental United States, Canada and Mexico through two reportable segments: Flatbed Solutions and Specialized Solutions. The Flatbed Solutions segment focuses on delivering transportation and logistics solutions that principally require the use of flatbed and retractable-sided transportation equipment, and the Specialized Solutions segment focuses on delivering transportation and logistics solutions that require the use of specialized trailering transportation equipment.
Both of the Company’s reportable segments operate highly flexible business models comprised of company-owned tractors and trailers and asset-light operations (which consist of owner-operator transportation, freight brokerage and logistics). The Company’s asset-based operations have the benefit of providing shippers with certainty of delivery and continuity of operations. Alternatively, the Company’s asset-light operations offer flexibility and scalability to meet customers’ dynamic needs and have lower capital expenditure requirements and fixed costs.
First Quarter Operational Overview
|
· |
Total revenue of $391.0 million, a decrease of 9.7%, company freight of $180.9 million, a decrease of 12.3%, owner operator freight of $107.8 million, a decrease of 2.9% and brokerage freight of $61.7 million, a decrease of 13.6% compared to first quarter of 2019; |
|
· |
Rate per mile for the three months ended March 31, 2020 was $1.86 for Flatbed Solutions segment and $3.24 for Specialized Solutions segment; |
|
· |
Asset impairment charges totaled $13.4 million for the three months ended March 31, 2020 |
|
· |
Operating loss of $8.3 million, compared with operating income of $0.7 million in first quarter of 2019; |
|
· |
Net loss of $17.3 million, or $0.29 per basic and diluted share, compared with net loss of $9.3 million, or $0.16 per basic and diluted share, in the first quarter of 2019; |
|
· |
Total liquidity available at March 31, 2020 increased by $32.3 million to $285.8 million from $253.5 million at December 31, 2019; and |
|
· |
Material debt at March 31, 2020 decreased by $10.5 million to $693.6 million from $704.1 at December 31, 2019. |
Recent Developments
On July 30, 2019, the Company internally announced a plan to integrate three operating segments with three other operating segments, Project Synchronize (Phase I or the Plan), which reduced the number of operating segments from 16 to 13. As a result of the Plan, Builders Transportation merged into Hornady Transportation, Moore Freight Service into E.W. Wylie, and the Schilli Companies into Lone Star Transportation. The Plan was implemented to streamline and reduce the Company’s cost structure, improve asset utilization and capitalize on operational synergies. Additionally, the Company announced the implementation of Business Improvement Plans, which increased profitability by yield management capacity allocation, right-sizing trailer-to-tractor ratios, and improving maintenance execution.
On September 4, 2019, the Company announced a comprehensive restructuring plan (Project Pivot) to reduce its cost base, right size its organization and management team and increase and accelerate its previously announced operational improvement goals.
On March 10, 2020, the Company announced a plan to integrate three operating segments with three other operating segments (Phase II of the Plan), which will further reduce the number of operating segments from 13 to 10.
25
Outlook
The novel coronavirus, or COVID-19, which surfaced in late 2019 and declared a pandemic by the World Health Organization in March 2020, continues to spread throughout the United States and around the world. In response to the COVID-19 pandemic, the governments of many countries, states, cities and other geographic regions have taken and are continuing to take preventative or reactive actions, such as imposing restrictions on travel and business operations, increasing border and port controls and closures throughout the United States and other parts of the world, and advising or requiring individuals to limit or forego time outside of their homes. The uncertainty regarding the impact of the COVID-19 pandemic, and various governmental actions taken to mitigate its impact, have resulted in a severely depressed economic environment.
As an essential business under the guidelines issued by each of the Company’s states of operations, the Company has been allowed to continue to operate its business through the COVID-19 pandemic. The Company has permitted some personnel to work from home and has taken additional precautions to ensure the safety of its workforce, customers and the communities in which it operates. In general, the Company has experienced limited operational impacts, in the first quarter of 2020, as a result of COVID-19 directly. A substantial majority of its operating sites have remained open and operating, although some of the nation’s ports that the Company serves have experienced reduced hours of operation and reduced volumes.
For the three months ended March 31, 2020, the COVID-19 pandemic and associated impacts on economic activity had a limited adverse effect on the Company’s results of operations and financial condition. However, the last half of March saw demand decline, as sectors of the economy began to shut down. The Company expects that its results of operations and financial condition will be more significantly impacted in the second quarter of 2020 and in subsequent periods, as levels of activity in the Company’s business have historically been positively correlated to broad measures of economic activity and to measures of industrial production since many of the Company’s customers are in the manufacturing and industrial segments. In particular, shelter-in-place mandates, the closing of manufacturing facilities and the overall depressed economic environment have significantly affected demand for many of the Company’s customers, including those that manufacture aircraft parts and those in the energy sector.
The Company believes that a significant portion of its cost structure is variable, and the Company has taken and will continue to take aggressive actions to adjust its expenses to reflect changes in demand for its services. These actions have included reduced use of contractors, reduced employee hours, furloughs, layoffs and voluntary use of paid time off, consistent with local regulations. Although the Company does not expect to be able to fully offset the effects of significantly reduced volumes on its results of operations, the actions that the Company is taking, combined with the variable components of its cost structure, should partially mitigate the impact of the pandemic on its results of operations. The Company also expects to reduce its net capital expenditures this year. Conversely, however, the Company is taking additional measures and incurring additional expense to protect the health and safety of its workforce and its customers. In addition, the Company could incur restructuring and other costs as it modifies and right-sizes its operations for declines and/or surges in demand, and may incur incremental interest expense this year as a result of steps it may take in order to further strengthen its liquidity.
We currently expect the COVID-19 pandemic to negatively impact the Company for the quarter ended June 30, 2020 materially more than it impacted the quarter ended March 31, 2020. Accordingly, we believe the Company’s first quarter of 2020 results and operating trends will not provide any meaningful indication as to what our financial results may be in the second quarter or remainder of this year. The effect of the COVID-19 pandemic may remain prevalent for a significant period of time and may continue to adversely affect the Company’s business, results of operations and financial condition even after the COVID-19 pandemic has subsided and “stay at home” mandates have been lifted. The extent to which the COVID-19 pandemic impacts the Company will depend on numerous evolving factors and future developments that we are not able to predict, including: the severity and duration of the pandemic; governmental, business and other actions in response to the pandemic (which could include limitations on the Company’s operations or mandates to provide services in a specified manner); the impact of the pandemic on economic activity; the response of the overall economy and the financial markets; the extent and duration of the effect on consumer confidence and spending; the health of and the effect on our workforce and our ability to meet staffing needs; any impairment in the value of our tangible or intangible assets which could be recorded as a result of a weaker economic conditions; and the potential effects on our internal controls, including those over financial reporting, as a result of changes in working environments, such as shelter-in-place and similar orders that are applicable to our employees and business partners, among others. There are no comparable recent events that provide guidance as to the effect the COVID-19 global pandemic may have, and as a result, the ultimate impact of the pandemic is highly uncertain and subject to change. See “Part II. Item 1A. Risk Factors” in this Report for more information regarding risks relating to the COVID-19 pandemic.
How The Company Evaluates Its Operations
The Company uses a number of primary indicators to monitor its revenue and expense performance and efficiency, including Adjusted EBITDA, Free Cash Flow, Adjusted Operating Ratio and Adjusted Net Income (Loss), and its key drivers of revenue quality, growth, expense control and operating efficiency. Adjusted EBITDA, Free Cash Flow, Adjusted Operating Ratio and Adjusted Net Income (Loss) are not recognized measures under GAAP and should not be considered alternatives to, or more meaningful than, net income (loss), cash flows from operating activities, operating income, operating ratio, operating margin or any other measure derived in accordance with GAAP.
26
See “Non-GAAP Financial Measures” for more information on the Company’s use of these non-GAAP measures, as well as a description of the computation and reconciliation of the Company’s Adjusted EBITDA, Free Cash Flow, and Adjusted Net Income (Loss) to net income (loss) and Adjusted Operating Ratio to operating ratio.
Revenue
The Company records four types of revenue: freight (company and owner operator), brokerage, logistics and fuel surcharge. Freight revenue is generated by hauling freight for the Company’s customers using its trucks or its owner-operators’ equipment. Generally, the Company’s customers pay for its services based on the number of miles in the most direct route between pick-up and delivery locations and other ancillary services the Company provides. Freight revenue is the product of the number of revenue-generating miles driven and the rate per mile the Company receives from customers plus accessorial charges, such as loading and unloading freight for its customers, cargo protection, fees for detaining its equipment or fees for route planning and supervision. Freight revenue is affected by fluctuations in North American economic activity as well as changes in specific customer demand, the level of capacity in the industry and driver availability.
The Company’s brokerage revenue is generated by its use of third-party carriers when it needs capacity to move its customers’ loads. The main factor that affects brokerage revenue is the availability of the Company’s drivers and owner-operators (and hence the need for third-party carriers) and the rate for the load. Brokerage revenue is also affected by fluctuations in North American economic activity as well as changes in the level of capacity in the industry and driver availability.
Logistics revenue is generated from a range of services, including value-added warehousing, loading and unloading, vehicle maintenance and repair, preparation and packaging, fuel management, and other fleet management solutions. Logistics revenue is primarily driven by specific customer requirements for additional services and may fluctuate depending on customers’ utilization of these services due to changes in cargo specifications, delivery staging and fluctuations in North American economic activity.
Fuel surcharges are designed to compensate the Company for fuel costs above a certain cost per gallon base. Generally, the Company receives fuel surcharges on the miles for which it is compensated by customers. However, the Company continues to have exposure to increasing fuel costs related to empty miles, fuel efficiency due to engine idle time and other factors and to the extent the surcharge paid by the customer is insufficient. The main factors that affect fuel surcharge revenue are the price of diesel fuel and the number of loaded miles. In general, a declining energy and fuel price environment negatively affects the Company’s fuel surcharge revenues, and conversely, an environment with rising fuel and energy prices benefits its fuel surcharge revenues. Although the Company’s surcharge programs vary by customer, they typically involve a computation based on the change in national or regional fuel prices. The Company’s fuel surcharges are billed on a delayed basis, meaning it typically bills customers in the current week based on a previous week’s applicable index. Therefore, in times of increasing fuel prices, the Company does not recover as much as it is currently paying for fuel. In periods of declining prices, the opposite is true. Also, its fuel surcharge programs typically require a specified minimum change in fuel cost to prompt a change in fuel surcharge revenue. Therefore, many of these programs have a time lag between when fuel costs change and when the change is reflected in fuel surcharge revenue.
Expenses
The Company’s most significant expenses vary with miles traveled and include driver wages, services purchased from owner-operators and other transportation providers (which are recorded on the “Purchased freight” line of the Company’s consolidated statements of operations and comprehensive loss) and fuel. Driver-related expenses vary with miles traveled, however the Company currently expects its expenses relating to driver wages to remain stable in the near-term as a result of driver wage increases implemented in the second half of 2018 to address the shortage of qualified drivers in the general trucking industry, compared to demand at that time. The expectation of stable driver wages paid per mile are due to current market conditions caused by shippers’ downward pressure on rates resulting in some easing of capacity in the industry.
Maintenance and tire expenses and cost of insurance and claims generally vary with the miles the Company travels but also have a controllable component based on safety improvements, fleet age, efficiency and other factors. The Company’s primary fixed costs are depreciation of long-term assets (such as tractors, trailers and terminals), interest expense, rent and non-driver compensation.
27
The Company’s fuel surcharge programs help to offset increases in fuel prices but typically do not offset empty miles, idle time and out of route miles driven. As discussed above under “Revenue,” its fuel surcharge programs have a time lag between when fuel costs change and when the change is reflected in fuel surcharge revenue. Due to this time lag, the Company’s fuel expense, net of fuel surcharge, negatively impacts its operating income during periods of sharply rising fuel costs and positively impacts its operating income during periods of falling fuel costs. In general, due to the fuel surcharge programs, its operating income is less negatively affected by an environment with higher, stable fuel prices than an environment with lower fuel prices. In addition to its fuel surcharge programs, the Company believes the most effective protection against fuel cost increases is to maintain a fuel-efficient fleet by incorporating fuel efficiency measures. Also, the Company has arrangements with some of its significant fuel suppliers to buy the majority of its fuel at contracted pricing schedules that fluctuate with the market price of diesel fuel. The Company has not used derivatives as a hedge against higher fuel costs in the past but continues to evaluate this possibility.
28
Results of Operations
The following table sets forth items derived from the Company’s consolidated statements of operations and comprehensive loss for the three months ended March 31, 2020 and 2019 in dollars and as a percentage of total revenue and the increase or decrease in the dollar amounts of those items.
|
|
|
Three Months Ended March 31, |
|
|
|
|
|
||||||||
|
|
|
2020 |
|
2019 |
|
Increase (Decrease) |
|||||||||
|
(Dollars in millions) |
|
$ |
|
% |
|
$ |
|
% |
|
$ |
|
% |
|||
|
|
|
|
|
|
|
|
|
|
|
|
|
|
|
|
|
|
REVENUE: |
|
|
|
|
|
|
|
|
|
|
|
|
|
|
|
|
Company freight |
|
$ |
180.9 |
|
46.3 |
|
$ |
206.2 |
|
47.6 |
|
$ |
(25.3) |
|
(12.3) |
|
Owner operator freight |
|
|
107.8 |
|
27.6 |
|
|
111.0 |
|
25.6 |
|
|
(3.2) |
|
(2.9) |
|
Brokerage |
|
|
61.7 |
|
15.8 |
|
|
71.4 |
|
16.5 |
|
|
(9.7) |
|
(13.6) |
|
Logistics |
|
|
10.1 |
|
2.6 |
|
|
12.4 |
|
2.9 |
|
|
(2.3) |
|
(18.5) |
|
Fuel surcharge |
|
|
30.5 |
|
7.8 |
|
|
32.0 |
|
7.4 |
|
|
(1.5) |
|
(4.7) |
|
Total revenue |
|
|
391.0 |
|
100.0 |
|
|
433.0 |
|
100.0 |
|
|
(42.0) |
|
(9.7) |
|
|
|
|
|
|
|
|
|
|
|
|
|
|
|
|
|
|
OPERATING EXPENSES: |
|
|
|
|
|
|
|
|
|
|
|
|
|
|
|
|
Salaries, wages and employee benefits |
|
|
110.4 |
|
28.2 |
|
|
119.1 |
|
27.5 |
|
|
(8.7) |
|
(7.3) |
|
Fuel |
|
|
28.7 |
|
7.3 |
|
|
35.0 |
|
8.1 |
|
|
(6.3) |
|
(18.0) |
|
Operations and maintenance |
|
|
45.6 |
|
11.7 |
|
|
54.8 |
|
12.7 |
|
|
(9.2) |
|
(16.8) |
|
Communications |
|
|
1.0 |
|
0.3 |
|
|
1.0 |
|
0.2 |
|
|
— |
|
- |
|
Purchased freight |
|
|
134.2 |
|
34.3 |
|
|
146.6 |
|
33.9 |
|
|
(12.4) |
|
(8.5) |
|
Administrative expenses |
|
|
20.2 |
|
5.2 |
|
|
16.1 |
|
3.7 |
|
|
4.1 |
|
25.5 |
|
Sales and marketing |
|
|
0.7 |
|
0.2 |
|
|
1.2 |
|
0.3 |
|
|
(0.5) |
|
(41.7) |
|
Taxes and licenses |
|
|
4.5 |
|
1.2 |
|
|
4.9 |
|
1.1 |
|
|
(0.4) |
|
(8.2) |
|
Insurance and claims |
|
|
15.0 |
|
3.8 |
|
|
12.5 |
|
2.9 |
|
|
2.5 |
|
20.0 |
|
Depreciation and amortization |
|
|
26.3 |
|
6.7 |
|
|
41.5 |
|
9.6 |
|
|
(15.2) |
|
(36.6) |
|
Gain on disposition of property and equipment |
|
|
(1.2) |
|
(0.3) |
|
|
(0.4) |
|
(0.1) |
|
|
(0.8) |
|
200.0 |
|
Impairment |
|
|
13.4 |
|
3.4 |
|
|
— |
|
— |
|
|
13.4 |
|
* |
|
Restructuring charges |
|
|
0.5 |
|
0.1 |
|
|
— |
|
— |
|
|
0.5 |
|
* |
|
Total operating expenses |
|
|
399.3 |
|
102.1 |
|
|
432.3 |
|
99.8 |
|
|
(33.0) |
|
(7.6) |
|
Operating ratio |
|
|
102.1% |
|
|
|
|
99.8% |
|
|
|
|
|
|
|
|
Adjusted operating ratio(1) |
|
|
97.2% |
|
|
|
|
97.3% |
|
|
|
|
|
|
|
|
INCOME (LOSS) FROM OPERATIONS |
|
|
(8.3) |
|
(2.1) |
|
|
0.7 |
|
0.2 |
|
|
(9.0) |
|
(1,285.7) |
|
|
|
|
|
|
|
|
|
|
|
|
|
|
|
|
|
|
Other expense (income): |
|
|
|
|
|
|
|
|
|
|
|
|
|
|
|
|
Interest income |
|
|
(0.3) |
|
(0.1) |
|
|
(0.2) |
|
— |
|
|
(0.1) |
|
50.0 |
|
Interest expense |
|
|
12.0 |
|
3.1 |
|
|
12.7 |
|
2.9 |
|
|
(0.7) |
|
(5.5) |
|
Other |
|
|
1.2 |
|
0.3 |
|
|
(0.6) |
|
(0.1) |
|
|
1.8 |
|
(300.0) |
|
Total other expense |
|
|
12.9 |
|
3.3 |
|
|
11.9 |
|
2.7 |
|
|
1.0 |
|
8.4 |
|
|
|
|
|
|
|
|
|
|
|
|
|
|
|
|
|
|
Income (loss) before benefit for income taxes |
|
|
(21.2) |
|
(5.4) |
|
|
(11.2) |
|
(2.6) |
|
|
(10.0) |
|
89.3 |
|
Benefit for income taxes |
|
|
(3.9) |
|
(1.0) |
|
|
(1.9) |
|
(0.4) |
|
|
(2.0) |
|
105.3 |
|
Net loss |
|
$ |
(17.3) |
|
(4.4) |
|
$ |
(9.3) |
|
(2.1) |
|
$ |
(8.0) |
|
86.0 |
|
|
|
|
|
|
|
|
|
|
|
|
|
|
|
|
|
|
OPERATING STATISTICS: |
|
|
|
|
|
|
|
|
|
|
|
|
|
|
|
|
Company miles |
|
|
67.3 |
|
|
|
|
68.8 |
|
|
|
|
(1.5) |
|
(2.2) |
|
Owner operator miles |
|
|
49.9 |
|
|
|
|
48.4 |
|
|
|
|
1.5 |
|
3.1 |
|
Total miles (in millions)(2) |
|
|
117.2 |
|
|
|
|
117.2 |
|
|
|
|
— |
|
— |
|
|
|
|
|
|
|
|
|
|
|
|
|
|
|
|
|
|
Company-operated tractors, as of quarter-end |
|
|
3,558 |
|
|
|
|
3,858 |
|
|
|
|
(300) |
|
(7.8) |
|
Owner-operated tractors, as of quarter-end |
|
|
2,193 |
|
|
|
|
2,290 |
|
|
|
|
(97) |
|
(4.2) |
|
Number of trailers, as of quarter-end |
|
|
12,704 |
|
|
|
|
13,646 |
|
|
|
|
(942) |
|
(6.9) |
|
|
|
|
|
|
|
|
|
|
|
|
|
|
|
|
|
|
Company-operated tractors, average for the quarter |
|
|
3,558 |
|
|
|
|
3,877 |
|
|
|
|
(319) |
|
(8.2) |
|
Owner-operated tractors, average for the quarter |
|
|
2,244 |
|
|
|
|
2,261 |
|
|
|
|
(17) |
|
(0.8) |
|
Total tractors, average for the quarter |
|
|
5,802 |
|
|
|
|
6,138 |
|
|
|
|
(336) |
|
(5.5) |
29
*indicates not meaningful.
|
(1) |
Adjusted Operating Ratio is not a recognized measure under GAAP. For a definition of Adjusted Operating Ratio and reconciliation of Adjusted Operating Ratio to operating ratio, see “Non-GAAP Financial Measures” below. |
|
(2) |
Miles are estimated based on information received as the date of filing. Miles may change quarter to quarter when final information is received from each operating segment. |
30
The following table sets forth the Company’s Specialized Solutions segment’s revenue, operating expenses, operating ratio, Adjusted Operating Ratio and operating income for the three months ended March 31, 2020 and 2019 in dollars and as a percentage of its Specialized Solutions segment’s total revenue and the increase or decrease in the dollar amounts of those items. The following table also sets forth certain operating statistics for the Company’s Specialized Solutions segment for the three months ended March 31, 2020 and 2019.
SPECIALIZED SOLUTIONS
|
|
|
Three Months Ended March 31, |
|
|
|
|
|
||||||||
|
|
|
2020 |
|
2019 |
|
Increase (Decrease) |
|||||||||
|
(Dollars in millions) |
|
$ |
|
% |
|
$ |
|
% |
|
$ |
|
% |
|||
|
|
|
|
|
|
|
|
|
|
|
|
|
|
|
|
|
|
REVENUE(1): |
|
|
|
|
|
|
|
|
|
|
|
|
|
|
|
|
Company freight |
|
$ |
132.1 |
|
55.0 |
|
$ |
153.9 |
|
57.1 |
|
$ |
(21.8) |
|
(14.2) |
|
Owner operator freight |
|
|
42.8 |
|
17.8 |
|
|
43.8 |
|
16.2 |
|
|
(1.0) |
|
(2.3) |
|
Brokerage |
|
|
42.8 |
|
17.8 |
|
|
46.1 |
|
17.1 |
|
|
(3.3) |
|
(7.2) |
|
Logistics |
|
|
9.1 |
|
3.8 |
|
|
11.7 |
|
4.3 |
|
|
(2.6) |
|
(22.2) |
|
Fuel surcharge |
|
|
13.6 |
|
5.7 |
|
|
14.2 |
|
5.3 |
|
|
(0.6) |
|
(4.2) |
|
Total revenue |
|
|
240.4 |
|
100.0 |
|
|
269.7 |
|
100.0 |
|
|
(29.3) |
|
(10.9) |
|
|
|
|
|
|
|
|
|
|
|
|
|
|
|
|
|
|
OPERATING EXPENSES(1): |
|
|
|
|
|
|
|
|
|
|
|
|
|
|
|
|
Salaries, wages and employee benefits |
|
|
74.2 |
|
30.9 |
|
|
81.0 |
|
30.0 |
|
|
(6.8) |
|
(8.4) |
|
Fuel |
|
|
18.3 |
|
7.6 |
|
|
22.5 |
|
8.3 |
|
|
(4.2) |
|
(18.7) |
|
Operations and maintenance |
|
|
34.7 |
|
14.4 |
|
|
40.4 |
|
15.0 |
|
|
(5.7) |
|
(14.1) |
|
Purchased freight |
|
|
68.5 |
|
28.5 |
|
|
74.0 |
|
27.4 |
|
|
(5.5) |
|
(7.4) |
|
Depreciation and amortization |
|
|
16.9 |
|
7.0 |
|
|
26.7 |
|
9.9 |
|
|
(9.8) |
|
(36.7) |
|
Impairment |
|
|
13.4 |
|
5.6 |
|
|
— |
|
— |
|
|
13.4 |
|
* |
|
Restructuring |
|
|
0.5 |
|
0.2 |
|
|
— |
|
— |
|
|
0.5 |
|
* |
|
Other operating expenses |
|
|
20.4 |
|
8.5 |
|
|
17.3 |
|
6.4 |
|
|
3.1 |
|
17.9 |
|
Total operating expenses |
|
|
246.9 |
|
102.7 |
|
|
261.9 |
|
97.1 |
|
|
(15.0) |
|
(5.7) |
|
Operating ratio |
|
|
102.7% |
|
|
|
|
97.1% |
|
|
|
|
|
|
|
|
Adjusted operating ratio(2) |
|
|
96.2% |
|
|
|
|
93.8% |
|
|
|
|
|
|
|
|
INCOME (LOSS) FROM OPERATIONS |
|
$ |
(6.5) |
|
(2.7) |
|
$ |
7.8 |
|
2.9 |
|
$ |
(14.3) |
|
(183.3) |
|
|
|
|
|
|
|
|
|
|
|
|
|
|
|
|
|
|
OPERATING STATISTICS: |
|
|
|
|
|
|
|
|
|
|
|
|
|
|
|
|
Company miles |
|
|
40.7 |
|
|
|
|
41.4 |
|
|
|
|
(0.7) |
|
(1.7) |
|
Owner operator miles |
|
|
13.3 |
|
|
|
|
12.3 |
|
|
|
|
1.0 |
|
8.1 |
|
Total miles (in millions)(3) |
|
|
54.0 |
|
|
|
|
53.7 |
|
|
|
|
0.3 |
|
0.6 |
|
|
|
|
|
|
|
|
|
|
|
|
|
|
|
|
|
|
Company-operated tractors, at quarter-end |
|
|
2,341 |
|
|
|
|
2,508 |
|
|
|
|
(167) |
|
(6.7) |
|
Owner-operated tractors, at quarter-end |
|
|
676 |
|
|
|
|
663 |
|
|
|
|
13 |
|
2.0 |
|
Number of trailers, at quarter-end |
|
|
8,110 |
|
|
|
|
8,473 |
|
|
|
|
(363) |
|
(4.3) |
|
|
|
|
|
|
|
|
|
|
|
|
|
|
|
|
|
|
Company-operated tractors, average for the quarter |
|
|
2,344 |
|
|
|
|
2,506 |
|
|
|
|
(162) |
|
(6.5) |
|
Owner-operated tractors, average for the quarter |
|
|
680 |
|
|
|
|
656 |
|
|
|
|
24 |
|
3.7 |
|
Total tractors, average for the quarter |
|
|
3,024 |
|
|
|
|
3,162 |
|
|
|
|
(138) |
|
|
*indicates not meaningful.
|
(1) |
Includes intersegment revenues and expenses, as applicable, which are eliminated in the Company’s consolidated results. |
|
(2) |
Adjusted Operating Ratio is not a recognized measure under GAAP. For a definition of Adjusted Operating Ratio and reconciliation of Adjusted Operating Ratio to operating ratio, see “Non-GAAP Financial Measures” below. |
|
(3) |
Miles are estimated based on information received as the date of filing. Miles may change quarter to quarter when final information is received from each operating segment. |
31
The following table sets forth the Company’s Flatbed Solutions segment’s revenue, operating expenses, operating ratio, Adjusted Operating Ratio and operating income for the three months ended March 31, 2020 and 2019 in dollars and as a percentage of its Flatbed Solutions segment’s total revenue and the increase or decrease in the dollar amounts of those items. The following table also sets forth certain operating statistics for the Company’s Flatbed Solutions segment for the three months ended March 31, 2020 and 2019.
FLATBED SOLUTIONS
|
|
|
Three Months Ended March 31, |
|
|
|
|
|
||||||||
|
|
|
2020 |
|
2019 |
|
Increase (Decrease) |
|||||||||
|
(Dollars in millions) |
|
$ |
|
% |
|
$ |
|
% |
|
$ |
|
% |
|||
|
|
|
|
|
|
|
|
|
|
|
|
|
|
|
|
|
|
REVENUE(1): |
|
|
|
|
|
|
|
|
|
|
|
|
|
|
|
|
Company freight |
|
$ |
51.4 |
|
33.1 |
|
$ |
55.2 |
|
32.9 |
|
$ |
(3.8) |
|
(6.9) |
|
Owner operator freight |
|
|
66.1 |
|
42.6 |
|
|
68.5 |
|
40.8 |
|
|
(2.4) |
|
(3.5) |
|
Brokerage |
|
|
19.6 |
|
12.6 |
|
|
25.3 |
|
15.1 |
|
|
(5.7) |
|
(22.5) |
|
Logistics |
|
|
0.8 |
|
0.5 |
|
|
0.7 |
|
0.4 |
|
|
0.1 |
|
14.3 |
|
Fuel surcharge |
|
|
17.3 |
|
11.2 |
|
|
18.2 |
|
10.8 |
|
|
(0.9) |
|
(4.9) |
|
Total revenue |
|
|
155.2 |
|
100.0 |
|
|
167.9 |
|
100.0 |
|
|
(12.7) |
|
(7.6) |
|
|
|
|
|
|
|
|
|
|
|
|
|
|
|
|
|
|
OPERATING EXPENSES(1): |
|
|
|
|
|
|
|
|
|
|
|
|
|
|
|
|
Salaries, wages and employee benefits |
|
|
33.4 |
|
21.5 |
|
|
34.4 |
|
20.5 |
|
|
(1.0) |
|
(2.9) |
|
Fuel |
|
|
10.4 |
|
6.7 |
|
|
12.5 |
|
7.4 |
|
|
(2.1) |
|
(16.8) |
|
Operations and maintenance |
|
|
10.7 |
|
6.9 |
|
|
14.2 |
|
8.5 |
|
|
(3.5) |
|
(24.6) |
|
Purchased freight |
|
|
70.5 |
|
45.4 |
|
|
77.2 |
|
46.0 |
|
|
(6.7) |
|
(8.7) |
|
Depreciation and amortization |
|
|
9.1 |
|
5.9 |
|
|
14.7 |
|
8.8 |
|
|
(5.6) |
|
(38.1) |
|
Other operating expenses |
|
|
12.5 |
|
8.1 |
|
|
11.6 |
|
6.9 |
|
|
0.9 |
|
7.8 |
|
Total operating expenses |
|
|
146.6 |
|
94.5 |
|
|
164.6 |
|
98.0 |
|
|
(18.0) |
|
(10.9) |
|
Operating ratio |
|
|
94.5% |
|
|
|
|
98.0% |
|
|
|
|
|
|
|
|
Adjusted operating ratio(2) |
|
|
93.9% |
|
|
|
|
96.7% |
|
|
|
|
|
|
|
|
INCOME (LOSS) FROM OPERATIONS |
|
$ |
8.6 |
|
5.5 |
|
$ |
3.3 |
|
2.0 |
|
$ |
5.3 |
|
160.6 |
|
|
|
|
|
|
|
|
|
|
|
|
|
|
|
|
|
|
OPERATING STATISTICS: |
|
|
|
|
|
|
|
|
|
|
|
|
|
|
|
|
Company miles |
|
|
26.6 |
|
|
|
|
27.4 |
|
|
|
|
(0.8) |
|
(2.9) |
|
Owner operator miles |
|
|
36.6 |
|
|
|
|
36.1 |
|
|
|
|
0.5 |
|
1.4 |
|
Total miles (in millions)(3) |
|
|
63.2 |
|
|
|
|
63.5 |
|
|
|
|
(0.3) |
|
(0.5) |
|
|
|
|
|
|
|
|
|
|
|
|
|
|
|
|
|
|
Company-operated tractors, at quarter-end |
|
|
1,217 |
|
|
|
|
1,350 |
|
|
|
|
(133) |
|
(9.9) |
|
Owner-operated tractors, at quarter-end |
|
|
1,517 |
|
|
|
|
1,627 |
|
|
|
|
(110) |
|
(6.8) |
|
Number of trailers, at quarter-end |
|
|
4,594 |
|
|
|
|
5,173 |
|
|
|
|
(579) |
|
(11.2) |
|
|
|
|
|
|
|
|
|
|
|
|
|
|
|
|
|
|
Company-operated tractors, average for the quarter |
|
|
1,214 |
|
|
|
|
1,371 |
|
|
|
|
(157) |
|
(11.5) |
|
Owner-operated tractors, average for the quarter |
|
|
1,564 |
|
|
|
|
1,605 |
|
|
|
|
(41) |
|
(2.6) |
|
Total tractors, average for the quarter |
|
|
2,778 |
|
|
|
|
2,976 |
|
|
|
|
(198) |
|
(6.7) |
*indicates not meaningful.
|
(1) |
Includes intersegment revenues and expenses, as applicable, which are eliminated in the Company’s consolidated results. |
|
(2) |
Adjusted Operating Ratio is not a recognized measure under GAAP. For a definition of Adjusted Operating Ratio and reconciliation of Adjusted Operating Ratio to operating ratio, see “Non-GAAP Financial Measures” below. |
|
(3) |
Miles are estimated based on information received as the date of filing. Miles may change quarter to quarter when final information is received from each operating segment. |
32
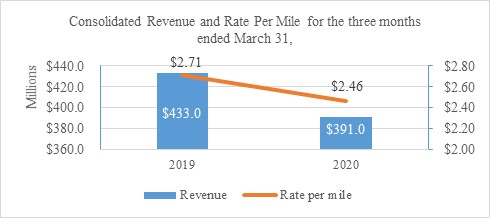
Revenue. Total revenue decreased 9.7% to $391.0 million for the three months ended March 31, 2020 from $433.0 million for the three months ended March 31, 2019, primarily due to the decrease in rate per mile in both the Flatbed Solutions segment and Specialized Solutions segment. The decrease in total revenue was due primarily to decreases in company freight, owner operator freight and brokerage revenue. Company freight revenue decreased $25.3 million, or 12.3%, from $206.2 million for the three months ended March 31, 2019 to $180.9 million for the three months ended March 31, 2020. Owner operator freight revenue decreased $3.2 million, or 2.9%, from $111.0 million for the three months ended March 31, 2019 to $107.8 million for the three months ended March 31, 2020. Brokerage revenue decreased $9.7 million, or 13.6%, from $71.4 million for the three months ended March 31, 2019 to $61.7 million for the three months ended March 31, 2020 due to a decrease in customer volumes. The decreases in company freight and owner operator freight revenue were primarily a result of a 9.2% decrease in rate per mile. The miles mix shifted with an increase in owner operator miles to offset a decrease in company miles due to downsizing of the Company-operated tractors. Logistics decreased $2.3 million, or 18.5%, from $12.4 million for the three months ended March 31, 2019 to $10.1 million for the three months ended March 31, 2020 as a result of decreases in logistics activities. Fuel surcharges, decreased $1.5 million, or 4.7%, from $32.0 million for the three months ended March 31, 2019 to $30.5 million for the three months ended March 31, 2020.
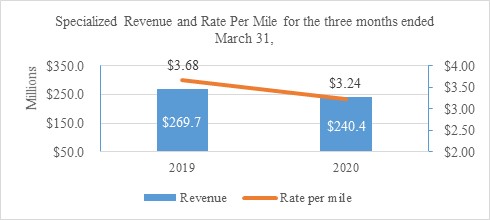
The Company’s Specialized Solutions segment’s revenue was $240.4 million for the three months ended March 31, 2020 as compared to $269.7 million for the three months ended March 31, 2019, a decrease of 10.9%, which was primarily due to the decrease in company freight, brokerage and logistics revenue. Company freight revenue decreased $21.8 million, or 14.2%, from $153.9 million for the three months ended March 31, 2019 to $132.1 million for the three months ended March 31, 2020. Owner operator freight revenue decreased from $43.8 million for the three months ended March 31, 2019 to $42.8 for the three months ended March 31, 2020. Brokerage revenue decreased $3.3 million, or 7.2%, from $46.1 million for the three months ended March 31, 2019 to $42.8 million for the three months ended March 31, 2020. The decrease in overall freight revenue was primarily a result of a 12.0% decrease in rate per mile offset by a 0.6% increase in total miles driven compared to the same period in 2019. The miles mix shifted with an increase in owner operator miles to offset a decrease in company miles due to downsizing of the Company-operated tractors. Logistics decreased 22.2% to $9.1 million from $11.7 million compared to the same period in 2019 as a result of decreases in logistics activities. Fuel surcharges decreased 4.2% compared to the same period in 2019.
33
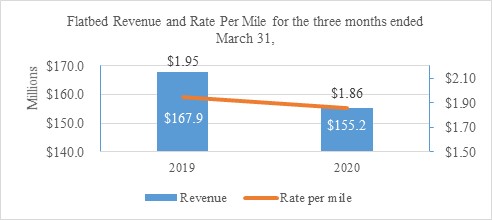
The Company’s Flatbed Solutions segment’s revenue was $155.2 million for the three months ended March 31, 2020 as compared to $167.9 million for the three months ended March 31, 2019, a decrease of 7.6%, which was primarily due to a decrease in rate per mile. Company freight revenue decreased $3.8 million, or 6.9%, from $55.2 million for the three months ended March 31, 2019 to $51.4 million for the three months ended March 31, 2020. Owner operator freight revenue decreased $2.4 million, or 3.5%, from $68.5 million for the three months ended March 31, 2019 to $66.1 million for the three months ended March 31, 2020. Brokerage revenue decreased $5.7 million, or 22.5%, from $25.3 million for the three months ended March 31, 2019 to $19.6 million for the three months ended March 31, 2020. The decreases in company freight and owner operator freight was a result of a 4.6% decrease in rate per mile and a 0.5% decrease in total miles driven compared to the same period in 2019. The miles mix shifted with an increase in owner operator miles to offset a decrease in company miles due to downsizing of the Company-operated tractors. Fuel surcharges decreased $0.9 million, or 4.9%, from $18.2 million for the three months ended March 31, 2019 to $17.3 million for the three months ended March 31, 2020.
Salaries, Wages and Employee Benefits. Salaries, wages and employee benefits expense, which consists of compensation for all employees, is primarily affected by the number of miles driven by Company drivers, the rate per mile paid to Company drivers, employee benefits including, but not limited to, health care and workers’ compensation, and to a lesser extent, the number of, and compensation and benefits paid to, non-driver employees. In general, the Specialized Solutions segment drivers receive a higher driver pay per total mile than Flatbed Solutions segment drivers due to the former requiring a higher level of training and expertise.
Salaries, wages and employee benefits expense decreased 7.3% to $110.4 million for the three months ended March 31, 2020 from $119.1 million for the three months ended March 31, 2019. The decrease in salaries, wages and employee benefits expense was primarily due to decreased employee headcount related to Project Pivot and Project Synchronize and driver pay due to the decrease in company miles compared to the same period in 2019. Salaries, wages and employee benefits expense, as a percentage of consolidated revenue (excluding brokerage revenue), increased 0.6% for the three months ended March 31, 2020 as compared to the same period in 2019.
The Company’s Specialized Solutions segment had a $6.8 million, or 8.4%, decrease in salaries, wages and employee benefits expense for the three months ended March 31, 2020 compared to the three months ended March 31, 2019, primarily as a result of the decreased employee headcount related to Project Synchronize and driver pay due to the decrease in company miles compared to the same period in 2019. Salaries, wages and employee benefits expense, as a percentage of Specialized Solutions revenue (excluding brokerage revenue), increased 1.3% for the three months ended March 31, 2020 as compared to the same period in 2019.
The Company’s Flatbed Solutions segment had a $1.0 million, or 2.9%, decrease in salaries, wages and employee benefits expense for the three months ended March 31, 2020 compared to the three months ended March 31, 2019, primarily as a result of the decreased employee headcount related to Project Synchronize and driver pay due to the decrease in company miles compared to the same period in 2019. Salaries, wages and employee benefits expense, as a percentage of Flatbed Solutions revenue (excluding brokerage revenue), increased 0.5% for the three months ended March 31, 2020 as compared to the same period in 2019.
Fuel. Fuel expense consists primarily of diesel fuel expense for company-owned tractors and fuel taxes. The primary factors affecting fuel expense are the cost of diesel fuel, the miles per gallon realized with company equipment and the number of miles driven by Company drivers.
34
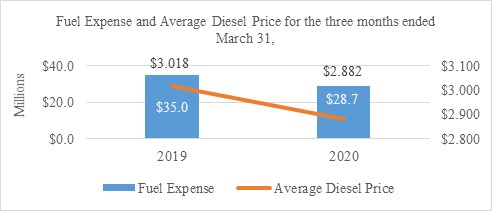
Total fuel expense decreased $6.3 million, or 18.0%, to $28.7 million for the three months ended March 31, 2020 from $35.0 million for the three months ended March 31, 2019. This decrease was primarily due to a 4.5% decrease in average diesel prices period over period. The U.S. national average diesel fuel price, as published by the U.S. Department of Energy, was $2.882 for the three months ended March 31, 2020, compared to $3.018 for the same period in 2019. Total Company miles driven decreased 2.2% for the three months ended March 31, 2020 as compared to the three months ended March 31, 2019.
The Company’s Specialized Solutions segment’s fuel expense decreased 18.7% to $18.3 million for the three months ended March 31, 2020 from $22.5 million for the three months ended March 31, 2019, primarily as a result of a decrease in average diesel price and a decrease of 1.7% in Company miles driven for the three months ended March 31, 2020 as compared to the three months ended March 31, 2019.
The Company’s Flatbed Solutions segment’s fuel expense decreased 16.8% to $10.4 million for the three months ended March 31, 2020 from $12.5 million for the three months ended March 31, 2019, primarily as a result of a decrease in average diesel price and a decrease of 2.9% in Company miles driven for the three months ended March 31, 2020 as compared to the three months ended March 31, 2019.
Operations and Maintenance. Operations and maintenance expense consists primarily of ordinary vehicle repairs and maintenance, costs associated with preparing tractors and trailers for sale or trade-in, driver recruiting, training and safety costs, permitting and pilot car fees and other general operations expenses. Operations and maintenance expense is primarily affected by the age of company-owned tractors and trailers, the number of miles driven in a period and driver turnover.
Operations and maintenance expense decreased 16.8% to $45.6 million for the three months ended March 31, 2020 from $54.8 million for the three months ended March 31, 2019 due to a decrease of $2.5 million in maintenance and $5.9 million in other operations expenses. Operations and maintenance expense, as a percentage of consolidated revenue (excluding brokerage revenue), decreased 1.3% for the three months ended March 31, 2020 as compared to the same period in 2019 due to a reduction in tractors and trailers in the Company’s fleet.
The Company’s Specialized Solutions segment’s operations and maintenance expense decreased $5.7 million, or 14.1%, for the three months ended March 31, 2020 as compared to the three months ended March 31, 2019 as a result of a decrease of $4.1 million in other operations expenses and a decrease of $0.9 million in maintenance expense due to a reduction of tractors and trailers in the Company’s fleet. Operations and maintenance expense, as a percentage of Specialized Solutions revenue (excluding brokerage revenue), decreased 0.5% for the three months ended March 31, 2020 as compared to the same period in 2019.
The Company’s Flatbed Solutions segment’s operations and maintenance expense decreased $3.5 million, or 24.6%, for the three months ended March 31, 2020 as compared to the three months ended March 31, 2019, primarily as a result of a decrease of $1.6 million in maintenance expense due to a reduction of tractors and trailers in the Company’s fleet. Operations and maintenance expense, as a percentage of Flatbed Solutions revenue (excluding brokerage revenue), decreased 2.1% for the three months ended March 31, 2020 as compared to the same period in 2019.
Purchased Freight. Purchased freight expense consists of the payments to owner-operators, including fuel surcharge reimbursements, and payments to third-party capacity providers that haul loads brokered to them. Purchased freight expense generally takes into account changes in diesel fuel prices, resulting in lower payments during periods of declining fuel prices.
Total purchased freight expense decreased $12.4 million or 8.5% from $146.6 million during the three months ended March 31, 2019 to $134.2 million during the three months ended March 31, 2020. Purchased freight expense from owner-operators increased 6.0% from $84.5 million during the three months ended March 31, 2019 to $89.6 million during the three months ended March 31, 2020 as a result of a 3.2% increase in owner operator miles driven. Purchased freight expense from third-party capacity providers decreased 19.1% from $52.2 million during the three months ended March 31, 2019 to $42.3 million during the three months ended March 31, 2020, as a result of lower rates and decreased utilization of third-party capacity providers. Purchased freight expense, as a percentage of consolidated revenue, increased 0.5% for the three months ended March 31, 2020 as compared to the same period in 2019.
35
The Company’s Specialized Solutions segment’s purchased freight expense decreased 7.4% to $68.5 million during the three months ended March 31, 2020 from $74.0 million during the three months ended March 31, 2019. Purchased freight expense from owner-operators increased 17.1% from $27.7 million during the three months ended March 31, 2019 to $32.4 million during the three months ended March 31, 2020, primarily as a result of an increase in the utilization of owner operators. Purchased freight expense from third-party capacity providers decreased 23.2% from $33.5 million during the three months ended March 31, 2019 to $25.8 million during the three months ended March 31, 2020, as a result of a decrease in utilization of third-party capacity providers. Purchased freight expense, as a percentage of Specialized Solutions revenue, increased 1.1% for the three months ended March 31, 2020 as compared to the same period in 2019.
The Company’s Flatbed Solutions segment’s purchased freight expense decreased 8.7% to $70.5 million for the three months ended March 31, 2020 from $77.2 million for the three months ended March 31, 2019. Purchased freight expense from owner-operators increased 0.6% to $57.2 million for the three months ended March 31, 2020 from $56.9 million for the three months ended March 31, 2019, as a result of a 2.7% increase in owner operators’ miles driven. Purchased freight expense from third-party capacity providers decreased 27.0% from $22.9 million during the three months ended March 31, 2019 to $16.7 million during the three months ended March 31, 2020, primarily as a result of decreased utilization of third-party capacity providers. Purchased freight expense, as a percentage of Flatbed Solutions revenue, decreased 0.5% for the three months ended March 31, 2020 as compared to the same period in 2019.
Depreciation and Amortization. Depreciation and amortization expense consists primarily of depreciation for company-owned tractors and trailers and amortization of those financed with finance leases. The primary factors affecting these expense items include the size and age of company-owned tractors and trailers and the cost of new equipment. Amortization of intangible assets is also included in this expense.
Depreciation and amortization expense decreased $15.2 million or 36.6% to $26.3 million during the three months ended March 31, 2020 from $41.5 million during the three months ended March 31, 2019 as a result of a 8.2% decrease in average tractor count in the Company’s fleet and further reduced by the impact of $97.6 million of impairments recorded in the third quarter of 2019 to reduce asset carrying values to fair value.
The Company’s Specialized Solutions segment’s depreciation and amortization expense decreased $9.8 million or 36.7% for the three months ended March 31, 2020 as compared to the three months ended March 31, 2019 as a result of a 6.5% decrease in average tractor count in the segment’s fleet and further reduced by the impact of $58.6 million of impairments recorded in the third quarter of 2019 to reduce asset carrying values to fair value.
The Company’s Flatbed Solutions segment’s depreciation and amortization expense decreased $5.6 million or 38.1% for the three months ended March 31, 2020 as compared to the three months ended March 31, 2019 as a result of a 11.5% decrease in average tractor count in the segment’s fleet and further reduced by the impact of a $39.0 million of impairments recorded in the third quarter of 2019 to reduce asset carrying values to fair value.
Taxes and Licenses. Operating taxes and licenses expense primarily represents the costs of taxes and licenses associated with the Company’s fleet of equipment and will vary according to the size of its equipment fleet. Taxes and license expense decreased $0.4 million for the three months ended March 31, 2020. Operating taxes and license expense, as a percentage of revenue, was 1.2% and 1.1% for the three months ended March 31, 2020 and 2019, respectively.
Insurance and Claims. Insurance and claims expense consists of insurance premiums and the accruals the Company makes for estimated payments and expenses for claims for bodily injury, property damage, cargo damage and other casualty events. The primary factor affecting the Company’s insurance and claims expense is seasonality (the Company typically experiences higher accident frequency in winter months), the frequency and severity of accidents, trends in the development factors used in its accruals and developments in large, prior-year claims. The frequency of accidents tends to increase with the miles the Company travels. Insurance and claims expense increased 20.0% to $15.0 million during the three months ended March 31, 2020 from $12.5 million during the three months ended March 31, 2019 due to increases in insurance premiums. Insurance and claims, as a percentage of revenue, increased 0.9% for the three months ended March 31, 2020 compared to the three months ended March 31, 2019.
Impairment. Impairment charges of $13.4 million were recognized in the three months ended March 31, 2020 related to Aveda’s intangible assets, property and equipment and right-of-use assets.
Restructuring Costs. Restructuring costs of $0.5 million were recognized in the three months ended March 31, 2020 in connection with Phase I of Project Synchronize, which was completed in the first quarter of 2020, and the closure of certain Aveda terminals.
Operating Income (Loss). Operating loss was $8.3 million, or 2.1% of revenue, for the three months ended March 31, 2020 compared to operating income $0.7 million, or 0.2% of revenue, for the three months ended March 31, 2019, primarily as a result of impairment and restructuring charges. Excluding these charges operating income was $5.6 million or 1.4% of revenue, an increase of $4.9 million compared to the three months ended March 31, 2019 due to a decrease in fuel expense, maintenance expense and depreciation and amortization.
36
The Company’s Specialized Solutions segment’s operating loss was $6.5 million, or 2.7% of revenue, for the three months ended March 31, 2020 compared to operating income of $7.8 million, or 2.9% of revenue, for the three months ended March 31, 2019, primarily as a result of impairment and restructuring charges. Excluding these charges operating income was $7.4 million or 3.1% of revenue. The change in operating income as a percent of revenue is primarily a result of a decrease in fuel expense, maintenance expense and depreciation and amortization.
The Company’s Flatbed Solutions segment’s operating income was $8.6 million, or 5.5% of revenue, for the three months ended March 31, 2020 compared to operating income $3.3 million, or 2.0% of revenue, for the three months ended March 31, 2019, the increase primarily as a result of decreases in salaries and wages, fuel expense, maintenance expense and depreciation and amortization.
Interest Expense. Interest expense consists of cash interest, amortization of debt issuance costs, fees and prepayment penalties. Interest expense decreased 5.5% to $12.0 million during the three months ended March 31, 2020 from $12.7 million during the three months ended March 31, 2019. This decrease was primarily attributable to lower interest rates on the Term Loan Facility and decreases in equipment term loan and finance lease outstanding balances.
Income Tax. Benefit for income taxes increased from $1.9 million for the three months ended March 31, 2019 to $3.9 million for the three months ended March 31, 2020. The increase is primarily the result of the tax impact of impairment charges of $13.4 million. The effective tax rate was 18.4% for the three months ended March 31, 2020, compared to 17.3% for the three months ended March 31, 2019. The effective income tax rate varies from the federal statutory rate primarily due to state income taxes and the impact of nondeductible permanent differences, including driver per diems and transaction expenses.
37
Non-GAAP Financial Measures
Adjusted EBITDA, Free Cash Flow, Adjusted Operating Ratio and Adjusted Net Income (Loss)
Adjusted EBITDA, Free Cash Flow, Adjusted Operating Ratio and Adjusted Net Income (Loss) are not recognized measures under GAAP. The Company uses these non-GAAP measures as supplements to its GAAP results in evaluating certain aspects of its business, as described below.
Adjusted EBITDA
The Company defines Adjusted EBITDA as net income (loss) plus (i) depreciation and amortization, (ii) interest expense, and other fees and charges associated with financings, net of interest income, (iii) income taxes, (iv) acquisition-related transaction expenses (including due diligence costs, legal, accounting and other advisory fees and costs, retention and severance payments and financing fees and expenses), (v) business transformation costs, (vi) non-cash impairment, (vii) restructuring charges, and (viii) non-cash stock and equity-compensation expense.
The Company’s board of directors and executive management team use Adjusted EBITDA as a key measure of its performance and for business planning. Adjusted EBITDA assists them in comparing its operating performance over various reporting periods on a consistent basis because it removes from the Company’s operating results the impact of items that, in their opinion, do not reflect the Company’s core operating performance. Adjusted EBITDA also allows the Company to more effectively evaluate its operating performance by allowing it to compare the results of operations against its peers without regard to its or its peers’ financing method or capital structure. The Company’s method of computing Adjusted EBITDA is substantially consistent with that used in its debt covenants and also is routinely reviewed by its management for that purpose.
The Company believes its presentation of Adjusted EBITDA is useful because it provides investors and industry analysts the same information that the Company uses internally for purposes of assessing its core operating performance. However, Adjusted EBITDA is not a substitute for, or more meaningful than, net income (loss), cash flows from operating activities, operating income or any other measure prescribed by GAAP, and there are limitations to using non-GAAP measures such as Adjusted EBITDA. Certain items excluded from Adjusted EBITDA are significant components in understanding and assessing a company’s financial performance, such as a company’s cost of capital, tax structure and the historic costs of depreciable assets. Also, other companies in its industry may define Adjusted EBITDA differently than the Company does, and as a result, it may be difficult to use Adjusted EBITDA or similarly named non-GAAP measures that other companies may use to compare the performance of those companies to its performance. Because of these limitations, Adjusted EBITDA should not be considered a measure of the income generated by the Company’s business or discretionary cash available to it to invest in the growth of its business. The Company’s management compensates for these limitations by relying primarily on the Company’s GAAP results and using Adjusted EBITDA supplementally.
A reconciliation of Adjusted EBITDA to net loss for the three months ended March 31, 2020 and 2019 is as follows:
|
|
|
Three Months Ended March 31, |
||||
|
(Dollars in millions) |
|
2020 |
|
2019 |
||
|
|
|
|
|
|
|
|
|
Net loss |
|
$ |
(17.3) |
|
$ |
(9.3) |
|
Depreciation and amortization |
|
|
26.3 |
|
|
41.5 |
|
Interest income |
|
|
(0.3) |
|
|
(0.2) |
|
Interest expense |
|
|
12.0 |
|
|
12.7 |
|
Income tax benefit |
|
|
(3.9) |
|
|
(1.9) |
|
Business transformation costs |
|
|
3.4 |
|
|
— |
|
Impairment |
|
|
13.4 |
|
|
— |
|
Restructuring |
|
|
0.5 |
|
|
— |
|
Stock based compensation |
|
|
0.9 |
|
|
1.0 |
|
Adjusted EBITDA |
|
$ |
35.0 |
|
$ |
43.8 |
38
Free Cash Flow
The Company defines Free Cash Flow as net cash provided by operating activities less purchases of property and equipment, plus proceeds from sale of property and equipment as such amounts are shown on the face of the Statement of Cash Flows. The Company’s board of directors and executive management team use Free Cash Flow to assess the Company’s liquidity and ability to repay maturing debt, fund operations and make additional investments. The Company believes Free Cash Flow provides useful information to investors because it is an important indicator of the Company’s liquidity, including its ability to reduce net debt, make strategic investments, pay dividends to common shareholders and repurchase stock. The Company’s measure of Free Cash Flow may not be directly comparable to similar measures reported by other companies. Furthermore, Free Cash Flow is not a substitute for, or more meaningful than, net cash provided by operating activities nor any other measure prescribed by GAAP, and there are limitations to using non-GAAP measures such as Free Cash Flow. Accordingly, Free Cash Flow should not be considered a measure of the income generated by the Company’s business or discretionary cash available to the Company to invest in the growth of its business. The Company’s management compensates for these limitations by relying primarily on the Company’s GAAP results and using Free Cash Flow supplementally.
A reconciliation of Free Cash Flow to cash flows from operating activities for the three months ended March 31, 2020 and 2019 is as follows:
|
|
|
Three Months Ended March 31, |
||||
|
(Dollars in millions) |
|
2020 |
|
2019 |
||
|
Net cash provided by operating activities |
|
$ |
29.7 |
|
$ |
36.4 |
|
Purchases of property and equipment |
|
|
(4.5) |
|
|
(3.9) |
|
Proceeds from sale of property and equipment |
|
|
5.8 |
|
|
4.6 |
|
Free Cash Flow |
|
$ |
31.0 |
|
$ |
37.1 |
Adjusted Operating Ratio
The Company uses Adjusted Operating Ratio as a supplement to its GAAP results in evaluating certain aspects of its business, as described below. The Company defines Adjusted Operating Ratio as (a) total operating expenses (i) less, acquisition-related transaction expenses, non-cash impairment charges, unusual or non-regularly recurring expenses or recoveries, (ii) less, business transformation costs, and (iii) further adjusted for the net impact of the step-up in basis (such as increased depreciation and amortization expense) and amortization of identifiable intangible assets resulting from acquisitions, as a percentage of (b) total revenue.
The Company’s board of directors and executive management team view Adjusted Operating Ratio, and its key drivers of revenue quality, growth, expense control and operating efficiency, as a very important measure of the Company’s performance. The Company believes excluding acquisition-related transaction expenses, additional depreciation and amortization expenses as a result of acquisitions, unusual or non-regularly recurring expenses or recoveries and non-cash impairment enhances the comparability of its performance between periods.
The Company believes its presentation of Adjusted Operating Ratio is useful because it provides investors and industry analysts the same information that it uses internally for purposes of assessing its core operating profitability. However, Adjusted Operating Ratio is not a substitute for, or more meaningful than, operating ratio, operating margin or any other measure derived solely from GAAP measures, and there are limitations to using non-GAAP measures such as Adjusted Operating Ratio. Although the Company believes that Adjusted Operating Ratio can make an evaluation of its operating performance more accurately because it removes items that, in its opinion, do not reflect its core operations, other companies in its industry may define adjusted operating ratio differently than it does. As a result, it may be difficult to use Adjusted Operating Ratio or similarly named non-GAAP measures that other companies may use to compare the performance of those companies to the Company’s performance. The Company’s management compensates for these limitations by relying primarily on GAAP measures and using Adjusted Operating Ratio supplementally.
39
A reconciliation of Adjusted Operating Ratio to operating ratio for each of the three months ended March 31, 2020 and 2019 is as follows:
|
|
|
Three Months Ended March 31, |
||||
|
(Dollars in millions) |
|
2020 |
|
2019 |
||
|
|
|
|
|
|
|
|
|
Revenue |
|
$ |
391.0 |
|
$ |
433.0 |
|
Salaries, wages and employee benefits |
|
|
110.4 |
|
|
119.1 |
|
Fuel |
|
|
28.7 |
|
|
35.0 |
|
Operations and maintenance |
|
|
45.6 |
|
|
54.8 |
|
Purchased freight |
|
|
134.2 |
|
|
146.6 |
|
Depreciation and amortization |
|
|
26.3 |
|
|
41.5 |
|
Impairment |
|
|
13.4 |
|
|
— |
|
Restructuring |
|
|
0.5 |
|
|
— |
|
Other operating expenses |
|
|
40.2 |
|
|
35.3 |
|
Operating expenses |
|
|
399.3 |
|
|
432.3 |
|
Operating ratio |
|
|
102.1% |
|
|
99.8% |
|
Business transformation costs |
|
|
3.4 |
|
|
— |
|
Impairment |
|
|
13.4 |
|
|
— |
|
Restructuring |
|
|
0.5 |
|
|
— |
|
Amortization of intangible assets |
|
|
1.8 |
|
|
4.3 |
|
Net impact of step-up in basis of acquired assets |
|
|
— |
|
|
6.8 |
|
Adjusted operating expenses |
|
$ |
380.2 |
|
$ |
421.2 |
|
Adjusted operating ratio |
|
|
97.2% |
|
|
97.3% |
A reconciliation of the Company’s Specialized Solutions segment’s Adjusted Operating Ratio to operating ratio for the three months ended March 31, 2020 and 2019 is as follows:
|
|
|
Three Months Ended March 31, |
||||
|
(Dollars in millions) |
|
2020 |
|
2019 |
||
|
|
|
|
|
|
|
|
|
Revenue(1) |
|
$ |
240.4 |
|
$ |
269.7 |
|
Salaries, wages and employee benefits |
|
|
74.2 |
|
|
81.0 |
|
Fuel |
|
|
18.3 |
|
|
22.5 |
|
Operations and maintenance |
|
|
34.7 |
|
|
40.4 |
|
Purchased freight |
|
|
68.5 |
|
|
74.0 |
|
Depreciation and amortization |
|
|
16.9 |
|
|
26.7 |
|
Impairment |
|
|
13.4 |
|
|
— |
|
Restructuring |
|
|
0.5 |
|
|
— |
|
Other operating expenses |
|
|
20.4 |
|
|
17.3 |
|
Operating expenses |
|
|
246.9 |
|
|
261.9 |
|
Operating ratio |
|
|
102.7% |
|
|
97.1% |
|
Business transformation costs |
|
|
0.7 |
|
|
— |
|
Impairment |
|
|
13.4 |
|
|
— |
|
Restructuring |
|
|
0.5 |
|
|
— |
|
Amortization of intangible assets |
|
|
1.0 |
|
|
2.6 |
|
Net impact of step-up in basis of acquired assets |
|
|
— |
|
|
6.3 |
|
Adjusted operating expenses |
|
$ |
231.3 |
|
$ |
253.0 |
|
Adjusted operating ratio |
|
|
96.2% |
|
|
93.8% |
|
(1) |
Includes intersegment revenues and expenses, as applicable, which are eliminated in the Company’s consolidated results. |
40
A reconciliation of the Company’s Flatbed Solutions segment’s Adjusted Operating Ratio to operating ratio for the three months ended March 31, 2020 and 2019 is as follows:
|
|
|
Three Months Ended March 31, |
||||
|
(Dollars in millions) |
|
2020 |
|
2019 |
||
|
|
|
|
|
|
|
|
|
Revenue(1) |
|
$ |
155.2 |
|
$ |
167.9 |
|
Salaries, wages and employee benefits |
|
|
33.4 |
|
|
34.4 |
|
Fuel |
|
|
10.4 |
|
|
12.5 |
|
Operations and maintenance |
|
|
10.7 |
|
|
14.2 |
|
Purchased freight |
|
|
70.5 |
|
|
77.2 |
|
Depreciation and amortization |
|
|
9.1 |
|
|
14.7 |
|
Other operating expenses |
|
|
12.5 |
|
|
11.6 |
|
Operating expenses |
|
|
146.6 |
|
|
164.6 |
|
Operating ratio |
|
|
94.5% |
|
|
98.0% |
|
Business transformation costs |
|
|
0.1 |
|
|
— |
|
Amortization of intangible assets |
|
|
0.8 |
|
|
1.7 |
|
Net impact of step-up in basis of acquired assets |
|
|
— |
|
|
0.5 |
|
Adjusted operating expenses |
|
$ |
145.7 |
|
$ |
162.4 |
|
Adjusted operating ratio |
|
|
93.9% |
|
|
96.7% |
|
(1) |
Includes intersegment revenues and expenses, as applicable, which are eliminated in the Company’s consolidated results. |
Adjusted Net Income (Loss)
The Company defines Adjusted Net Income (Loss) as net income (loss) adjusted for acquisition related transaction expenses, business transformation costs, non-cash impairments, restructuring charges, amortization of intangible assets, the net impact of step-up in basis of acquired assets and unusual or non-regularly recurring expenses or recoveries.
The Company’s board of directors and executive management team use Adjusted Net Income (Loss) as a key measure of its performance and for business planning. Adjusted Net Income (Loss) assists them in comparing its operating performance over various reporting periods on a consistent basis because it removes from operating results the impact of items that, in its opinion, do not reflect the Company’s core operating performance. Adjusted Net Income (Loss) also allows the Company to more effectively evaluate its operating performance by allowing it to compare the results of operations against its peers without regard to its or its peers’ acquisition related items, such as acquisition-related transaction expenses, non-cash impairments, amortization of intangible assets and the net impact of the step up in basis of acquired assets, as well as removing the impact of unusual or non-regularly recurring expenses or recoveries.
The Company believes its presentation of Adjusted Net Income (Loss) is useful because it provides investors and industry analysts the same information that it uses internally for purposes of assessing its core operating performance. However, Adjusted Net Income (Loss) is not a substitute for, or more meaningful than, net income (loss) or any other measure derived solely from GAAP measures, and there are limitations to using non-GAAP measures such as Adjusted Net Income (Loss). Although the Company believes that Adjusted Net Income (Loss) can make an evaluation of its operating performance more consistent because it removes items that, in its opinion, do not reflect its core operations, other companies in its industry may define Adjusted Net Income (Loss) differently than it does. As a result, it may be difficult to use Adjusted Net Income (Loss) or similarly named non-GAAP measures that other companies may use to compare the performance of those companies to the Company’s performance. The Company’s management compensates for these limitations by relying primarily on its GAAP results and using Adjusted Net Income (Loss) supplementally.
41
A reconciliation of Adjusted Net Income (Loss) to net loss for the three months ended March 31, 2020 and 2019 is as follows:
|
|
|
Three Months Ended March 31, |
||||
|
(Dollars in millions) |
|
2020 |
|
2019 |
||
|
|
|
|
|
|
|
|
|
Net loss |
|
$ |
(17.3) |
|
$ |
(9.3) |
|
Business transformation costs |
|
|
3.4 |
|
|
— |
|
Impairment |
|
|
13.4 |
|
|
— |
|
Restructuring |
|
|
0.5 |
|
|
— |
|
Amortization of intangible assets |
|
|
1.8 |
|
|
4.3 |
|
Net impact of step-up in basis of acquired assets |
|
|
— |
|
|
6.8 |
|
Tax impact of impairments |
|
|
(2.6) |
|
|
— |
|
Adjusted net income (loss) |
|
$ |
(0.8) |
|
$ |
1.8 |
Liquidity and Capital Resources
The Company had the following sources of liquidity available at March 31, 2020 and December 31, 2019.
|
(Dollars in millions) |
|
March 31, 2020 |
|
December 31, 2019 |
||
|
|
|
|
|
|
|
|
|
Cash |
|
$ |
107.5 |
|
$ |
95.7 |
|
Working capital surplus |
|
|
93.9 |
|
|
71.0 |
|
Availability under line of credit |
|
|
84.4 |
|
|
86.8 |
|
Total |
|
$ |
285.8 |
|
$ |
253.5 |
The Company’s primary sources of liquidity have been provided by operations, issuances of capital stock and borrowings under its credit facilities. Cash increased by $11.8 million during the three months ended March 31, 2020 as compared to December 31, 2019. This increase primarily resulted from net cash provided by operating activities. See below for more information.
As of March 31, 2020 and December 31, 2019, the Company had a working capital surplus of $93.9 million and $71.0 million, respectively. The increase in working capital surplus is due primarily to net assets held for sale of $56.7 million, offset by decreased accounts receivable of $31.2 million and decreased accounts payable and accrued liabilities of $2.6 million.
As of March 31, 2020, the Company had no borrowings on its $100.0 million asset-based revolving line of credit (ABL Facility) and $16.4 million in outstanding letters of credit (discussed below), leaving $84.4 million available under the ABL Facility.
The Company has from time to time considered the possibility of a private offering of securities, which would not be registered under the Securities Act of 1933, as amended (the Securities Act), and which would be offered only to qualified institutional buyers pursuant to Rule 144A under the Securities Act and to persons outside the United States pursuant to Regulation S under the Securities Act. The proceeds of such an offering may be used for general corporate purposes, including the repayment of all or a portion of the Company’s term loan credit facility, repayment of outstanding balances on the ABL facility and to support the Company’s acquisition strategy. Also, in connection with such offering, the Company’s credit facilities may be amended or refinanced. There can be no assurance that the Company will conduct or complete such an offering.
The Company’s business requires substantial amounts of cash for operating expenses, including salaries and wages paid to employees, contract payments to independent contractors, insurance and claims payments, tax payments, and others. The Company also uses large amounts of cash and credit for the following activities:
42
Capital Expenditures
The Company follows a dual strategy of both owning assets and employing asset-light activities, the latter of which reduces the capital expenditures required to operate the business. Asset-light activities are conducted utilizing tractors and trailers provided by owner-operators and third-party carriers for significant portions of our flatbed and specialized services. Company-owned asset expenditures require substantial cash and financing (including finance and operating leases) to maintain a modern tractor fleet, refresh the trailer fleet, fund replacement and or growth in the revenue equipment fleet, and for the acquisition of real property and improvements to existing terminals and facilities. The Company had net cash capital receipts of approximately $1.3 million and financed $9.8 million of non-cash capital expenditures for the three months ended March 31, 2020. The Company had the following capital assets activity in 2019 and 2018:
|
|
|
Three Months Ended March 31, |
||||
|
(Dollars in millions) |
|
2020 |
|
2019 |
||
|
|
|
|
|
|
|
|
|
Net cash capital receipts |
|
$ |
(1.3) |
|
$ |
(0.7) |
|
Total financed capital expenditures |
|
|
9.8 |
|
|
25.1 |
|
Property and equipment sold for notes receivable |
|
|
— |
|
|
(0.4) |
|
Total net capital assets additions |
|
$ |
8.5 |
|
$ |
24.0 |
The decrease in total net capital assets additions is due to timing of the Company’s replacement cycle for revenue equipment.
Additionally, the Company entered into operating leases for revenue equipment with terms of 2 to 5 years and real property with terms of 3 to 4 years having asset values at lease inception of $18.8 million and $0.3 million, respectively, for the three months ended March 31, 2020.
ABL and Term Loan Facilities and Equipment Financing Agreements
As of March 31, 2020, the Company had (i) a $500.0 million senior secured term loan credit facility, consisting of a $250.0 million term loan, a $150 million tack-on loan and $100.0 million of term loans funded under a delayed draw term loan facility, and (ii) an asset-based senior secured revolving credit facility with an aggregate maximum credit amount equal to $100.0 million (subject to availability under a borrowing base). The delayed draw term loans were used to support the Company’s acquisition activities. See Note 9 of Notes to Consolidated Financial Statements for more information regarding the Term Loan Facility and the ABL Facility.
The Company had $177.2 million of term loans and $26.0 million of finance leases collateralized primarily by revenue equipment, with terms of 48 to 60 months. Certain of the term loans contain conditions, covenants, representations and warranties, events of default, and indemnification provisions applicable to the Company and certain of its subsidiaries that are customary for equipment financings, including, but not limited to, limitations on the incurrence of additional debt and the prepayment of existing indebtedness, certain payments (including dividends and other distributions to persons not party to its ABL Facility) and transfers of assets.
The Company believes it can finance its expected cash needs, including debt repayment, in the short-term with cash flows from operations and borrowings available under the ABL Facility. The Company expects that the ABL Facility will provide sufficient credit availability to support its ongoing operations, fund debt service requirements, capital expenditures, and working capital needs. Over the long-term, the Company will continue to have significant capital requirements, and expects to devote substantial financial resources to grow its operations and fund its acquisition activities. As a result of these funding requirements, the Company likely will need to sell additional equity or debt securities or seek additional financing through additional borrowings, lease financing or equity capital, though it is not likely that the Company will issue any common stock in the near term. The availability of financing or equity capital will depend upon the Company’s financial condition and results of operations as well as prevailing market conditions. If such additional borrowings, lease financing or equity capital is not available at the time it needs to incur such expenditures, the Company may be required to extend the maturity of then outstanding indebtedness, rely on alternative financing arrangements or engage in asset sales.
Letters of credit – Under the terms of the ABL Facility, lenders may issue up to $20 million of standby letters of credit on our behalf. Outstanding letters of credit reduce the availability on the $100 million ABL Facility. Standby letters of credit are generally issued for the benefit of regulatory authorities, insurance companies and state departments of insurance for the purpose of satisfying certain collateral requirements, primarily related to automobile, workers’ compensation, and general insurance liabilities.
Business combinations – The Company’s strategy has historically been to consolidate the open-deck transportation industry and it has used significant amounts of capital to acquire 20 businesses since Daseke Companies, Inc.’s inception in 2008. During 2019, the Company began to focus on organic growth, increasing free cash flow and margins, but will continue to evaluate potential tuck-in transactions of its subsidiaries and any other sources of growth it considers in the best interest of the Company.
43
Material Debt
Overview
As of March 31, 2020, the Company had the following material debt:
|
· |
the Term Loan Facility and the ABL Facility; |
|
· |
secured equipment loans and finance lease agreements; and |
|
· |
bank mortgage secured by real estate. |
The amounts outstanding under such agreements were as follows as of March 31, 2020 (in millions):
|
Term Loan Facility |
|
$ |
487.3 |
|
Mortgages |
|
|
3.1 |
|
Equipment term loans |
|
|
177.2 |
|
Finance lease obligations |
|
|
26.0 |
|
Total long-term debt and capital leases |
|
|
693.6 |
|
Less: current portion |
|
|
(57.7) |
|
Long-term debt and finance leases obligations, less current portion |
|
$ |
635.9 |
See Note 2 and Note 9 of the Notes to Consolidated Financial Statements included herein for information regarding the Company’s material debt and finance lease obligations, respectively.
Off-Balance Sheet Arrangements
Information about the Company’s standby letters of credit and 17,520,329 shares of common stock issuable upon exercise of outstanding warrants is included in Note 14 and Note 11, respectively, of Notes to Consolidated Financial Statements included herein. See also Liquidity and Capital Resources above.
Cash Flows
The Company’s summary statements of cash flows information for the three months ended March 31, 2020 and 2019 is set forth in the table below:
|
|
|
Three Months Ended March 31, |
||||
|
(Dollars in millions) |
|
2020 |
|
2019 |
||
|
|
|
|
|
|
|
|
|
Net cash provided by operating activities |
|
$ |
29.7 |
|
$ |
36.4 |
|
Net cash provided by investing activities |
|
$ |
1.3 |
|
$ |
0.7 |
|
Net cash used in financing activities |
|
$ |
(20.0) |
|
$ |
(20.5) |
Operating Activities. Cash provided by the Company’s operating activities consists of net income or loss adjusted for certain non-cash items, including depreciation and amortization, deferred interest, gain/loss on disposal of property and equipment, deferred income taxes, impairments, restructuring charges, non-cash operating lease expense, stock-based compensation, bad debt expense and the effect of changes in working capital and other activities.
Cash provided by operating activities was $29.7 million during the three months ended March 31, 2020 and consisted of $17.3 million of net loss plus $40.5 million of non-cash items, consisting primarily of depreciation, amortization, non-cash operating lease expense, impairment and stock-based compensation, plus $6.5 million of net cash provided by working capital and other activities. Cash provided by working capital and other activities during the three months ended March 31, 2020 reflect an increase of $1.3 million in accounts receivable, $2.2 million in accounts payable and $7.2 million in accrued expenses and other liabilities; offset by a $4.0 million decrease in prepaid and other current assets and $0.2 million in drivers’ advances and other receivables. Cash provided by operating activities was $36.4 million during the three months ended March 31, 2019 and consisted of $9.3 million of net loss plus $47.6 million of non-cash items, consisting primarily of depreciation, amortization, non-cash operating lease expense, deferred taxes and stock-based compensation, plus $1.9 million of net cash used for working capital and other activities. Cash used for working capital and other activities during the three months ended March 31, 2019 reflect decreases of a $8.9 million in accounts receivable and $2.8 million in drivers’ advances and other receivables, offset by a $1.9 million increase in prepaid and other current assets, and a $7.9 million increase in accounts payable and accrued expenses.
The $6.7 million decrease in cash provided by operating activities during the three months ended March 31, 2020, as compared with the three months ended March 31, 2019, was primarily the result of an $8.0 million increase in net loss, reduced by decreases of $12.7 million
44
in depreciation, $2.5 million in amortization of intangible assets, $3.7 million in non-cash operating lease expense, $1.9 million in deferred taxes, a $0.8 million increased in gain on disposition and $0.1 million in stock-based compensation expense, increased by $0.4 million in amortization of deferred financing fees, $13.4 million in impairment and $0.8 million in bad debt expense. Net cash provided by working capital increased $8.4 million.
Investing Activities. Cash flows from investing activities increased from $0.7 million provided by investing activities for the three months ended March 31, 2019 to $1.3 million provided by investing activities for the three months ended March 31, 2020 reflecting an increase of $0.6 million in cash equipment purchases and an increase of $1.2 million in cash receipts from sales of revenue equipment for the three months ended March 30, 2020.
Total net cash capital expenditures (receipts) for the three months ended March 31, 2020 and 2019 are shown below:
|
|
|
Three Months Ended March 31, |
||||
|
(Dollars in millions) |
|
2020 |
|
2019 |
||
|
|
|
|
|
|
|
|
|
Revenue equipment (tractors, trailers and trailer accessories) |
|
$ |
4.0 |
|
$ |
1.4 |
|
Buildings and building improvements |
|
|
0.1 |
|
|
1.0 |
|
Other |
|
|
0.4 |
|
|
1.5 |
|
Total cash capital expenditures |
|
|
4.5 |
|
|
3.9 |
|
Less: Proceeds from sales of property and equipment |
|
|
5.8 |
|
|
4.6 |
|
Net cash capital expenditures (receipts) |
|
$ |
(1.3) |
|
$ |
(0.7) |
Financing Activities. Cash flows from financing activities decreased from $20.5 million used in financing activities for the three months ended March 31, 2019 to $20.0 million used in financing activities for the three months ended March 31, 2020. This decrease was primarily a result of net debt proceeds of $0.5 million.
Inflation
Inflation can have an impact on the Company’s operating costs. A prolonged period of inflation could cause interest rates, fuel, wages and other costs to increase, which would adversely affect the Company’s results of operations unless freight rates correspondingly increase. The Company attempts to limit the effects of inflation through increases in freight rates, certain cost control efforts and limiting the effects of fuel prices through fuel surcharges and measures intended to reduce the consumption of fuel. Over the past three fiscal years, the effect of inflation has been immaterial.
Seasonality
In the transportation industry, results of operations generally show a seasonal pattern. The Company’s productivity decreases during the winter season because inclement weather impedes operations, end-users reduce their activity and certain shippers reduce their shipments during winter. At the same time, operating expenses increase and fuel efficiency decreases because of engine idling and harsh weather creating higher accident frequency, increased claims and higher equipment repair expenditures. The Company also may suffer from weather-related or other events such as tornadoes, hurricanes, blizzards, ice storms, floods, fires, earthquakes and explosions. These events may disrupt fuel supplies, increase fuel costs, disrupt freight shipments or routes, affect regional economies, destroy the Company’s assets, increase insurance costs or adversely affect the business or financial condition of its customers, any of which could adversely affect the Company’s results of operations or make such results more volatile.
Critical Accounting Policies
The Company’s significant accounting policies are described in Note 1 of Notes to Consolidated Financial Statements in the Company’s Annual Report on Form 10-K filed on March 10, 2020. The Company considers certain of these accounting policies to be “critical” to the portrayal of the Company’s financial position and results of operations, as they require the application of significant judgment by management. As a result, they are subject to an inherent degree of uncertainty. The Company identifies and discusses these “critical” accounting policies in the Management’s Discussion and Analysis of Financial Condition and Results of Operations section of the Company’s Annual Report on Form 10-K filed on March 10, 2020. Management bases its estimates and judgments on historical experience and on various other factors that management believes to be reasonable under the circumstances, the results of which form the basis for making judgments about the carrying values of assets and liabilities that are not readily apparent from other sources. Actual results may differ from these estimates under different assumptions or conditions. On an ongoing basis, management evaluates its estimates and judgments, including those considered “critical.” Management has discussed the development, selection and evaluation of accounting estimates, including those deemed “critical,” and the associated disclosures in this Quarterly Report on Form 10-Q with the Audit Committee of the Company’s board of directors.
45
Item 3. Quantitative and Qualitative Disclosures About Market Risk
There have been no material changes in the Company’s market risk since December 31, 2019. For further information on the Company’s market risk, refer to “Item 7A. Quantitative and Qualitative Disclosures About Market Risk” in the Company’s Annual Report on Form 10-K filed on March 10, 2020.
Item 4. Controls and Procedures
Evaluation of Disclosure Controls and Procedures
As of the end of the period covered by this Quarterly Report on Form 10-Q, the Company’s management conducted an evaluation, under the supervision and with the participation of the principal executive and financial officer, of the effectiveness of the design and operation of the Company’s disclosure controls and procedures (as defined in Rule 13a-15(e) of the Securities and Exchange Act of 1934 (the Exchange Act)). Based on this evaluation, the principal executive and financial officer concluded, as of the end of the period, our disclosure controls and procedures were not effective as of March 31, 2020 due to material weaknesses in internal control over financial reporting that were disclosed in our Annual Report on Form 10-K for the fiscal year ended December 31, 2019.
Management’s Remediation
As previously described in Item 9A of our Annual Report on Form 10-K for the year ended December 31, 2019, we began implementing remediation plans to address the material weaknesses. The weaknesses will not be considered remediated, until the applicable controls operate for a sufficient period of time and management has concluded, through testing, that these controls are operating effectively. We expect that the remediation of these material weaknesses will be completed by the end of fiscal 2020.
Changes in Internal Control over Financial Reporting
Except as noted above, there have been no changes in our internal control over financial reporting (as defined in Rules 13a-15(f) or 15d-15(f) of the Exchange Act) that occurred during the first quarter of fiscal 2020 that have materially affected, or are reasonably likely to materially affect, the Company’s internal control over financial reporting.
46
The Company and its subsidiaries are involved in litigation and claims primarily arising in the normal course of business, which include claims for personal injury or property damage incurred in the transportation of freight. Based on its knowledge of the facts and, in certain cases, advice of outside counsel, the Company believes the resolution of claims and pending litigation will not have a material adverse effect on the Company’s financial position, results of operations or cash flows.
Other than the risk factor included below, there have been no material changes in the risks facing the Company as described in the Company’s Annual Report on Form 10-K for the year ended December 31, 2020.
The COVID-19 pandemic, and various governmental actions taken to mitigate its impact, have affected and may materially adversely affect, and any future outbreak of any other highly infectious or contagious diseases may materially adversely affect, our operations, financial performance and condition, operating results and cash flows.
The COVID-19 pandemic, and various governmental actions taken to mitigate its impact, has affected, and may materially adversely affect, our operations, financial performance and condition, operating results and cash flows. The severity, magnitude and duration of the current COVID-19 pandemic is uncertain, rapidly changing and hard to predict. Thus far in 2020, the COVID-19 pandemic has significantly impacted economic activity and markets around the world, and COVID-19 or another similar outbreak could negatively impact our business in numerous ways, including, but not limited to, the following:
|
· |
our revenue may be reduced to the extent the pandemic results in an economic downturn or recession, as many experts predict, which leads to a decrease in demand for our services or the transportation markets in general; |
|
· |
our operations may be disrupted or impaired, if a significant portion of our drivers or other employees are unable to work due to illness; |
|
· |
the pandemic has increased volatility and caused negative pressure in the capital markets; as a result, we may experience difficulty accessing the capital or financing needed to fund our operations, which have substantial capital requirements, on satisfactory terms or at all; |
|
· |
we may experience liquidity challenges, including impacts related to delayed customer payments and payment defaults associated with customer liquidity issues and bankruptcies; |
|
· |
customers, suppliers and other third parties may argue that their non-performance under our contracts with them is permitted as a result of force majeure or other reasons; |
|
· |
we may experience workforce rightsizing-related issues and incur severance payments as a result of adjusting our workforce to market conditions, and we may subsequently experience retention issues and driver shortages when market conditions improve; |
|
· |
our management may be distracted as they are focused on mitigating the effects of COVID-19 on our business operations while protecting the health of our workforce and customers, which has required, and will continue to require, a large investment of time and resources; and |
|
· |
we may be at greater risk for cybersecurity issues, as digital technologies may become more vulnerable and experience a higher rate of cyberattacks in the current environment of remote connectivity. |
47
To the extent the COVID-19 pandemic adversely affects our business and financial results, it may also have the effect of heightening many of the other risks set forth in “Part I. Item 1A. Risk Factors” in our Annual Report on Form 10-K for the year ended December 31, 2019, such as those relating to our financial performance and debt obligations. The rapid development and fluidity of this situation precludes any prediction as to the ultimate adverse impact of COVID-19 on our business. The extent to which the COVID-19 pandemic impacts the Company will depend on numerous evolving factors and future developments that we are not able to predict, including: the severity and duration of the pandemic; governmental, business and other actions in response to the pandemic (which could include limitations on the Company’s operations or mandates to provide services in a specified manner); the impact of the pandemic on economic activity; the response of the overall economy and the financial markets; the extent and duration of the effect on consumer confidence and spending; the health of and the effect on our workforce and our ability to meet staffing needs; any impairment in the value of our tangible or intangible assets which could be recorded as a result of a weaker economic conditions; and the potential effects on our internal controls, including those over financial reporting, as a result of changes in working environments, such as shelter-in-place and similar orders that are applicable to our employees and business partners, among others. There are no comparable recent events that provide guidance as to the effect the COVID-19 global pandemic may have, and as a result, the ultimate impact of the pandemic is highly uncertain and subject to change.
48
|
Exhibit No. |
Exhibit |
|
3.1 |
|
|
|
|
|
3.2 |
|
|
|
|
|
3.3 |
|
|
|
|
|
31.1* |
Chief Executive Officer certification under Section 302 of Sarbanes-Oxley Act of 2002. |
|
|
|
|
31.2* |
Chief Financial Officer certification under Section 302 of Sarbanes-Oxley Act of 2002. |
|
|
|
|
32.1** |
Chief Executive Officer certification under Section 906 of Sarbanes-Oxley Act of 2002. |
|
|
|
|
32.2** |
Chief Financial Officer certification under Section 906 of Sarbanes-Oxley Act of 2002. |
|
|
|
|
101.INS* |
XBRL Instance Document. |
|
|
|
|
101.SCH* |
XBRL Taxonomy Extension Schema Document. |
|
|
|
|
101.CAL* |
XBRL Taxonomy Extension Calculation Linkbase Document. |
|
|
|
|
101.DEF* |
XBRL Taxonomy Extension Definition Linkbase Document. |
|
|
|
|
101.LAB* |
XBRL Taxonomy Extension Label Linkbase Document. |
|
|
|
|
101.PRE* |
XBRL Taxonomy Extension Presentation Linkbase Document. |
_____________________________
|
* |
Filed herewith. |
|
** |
Furnished herewith. |
|
+ |
Management contract or compensatory plan or arrangement. |
49
Pursuant to the requirements of the Securities Exchange Act of 1934, the registrant has duly caused this report to be signed on its behalf by the undersigned thereunto duly authorized.
|
Date: May 7, 2020 |
DASEKE, INC. |
|
|
|
|
|
|
|
By: |
/s/ Christopher Easter |
|
|
Name: |
Christopher Easter |
|
|
Title: |
Chief Executive Officer, Chief Operating Officer and Director |
|
|
|
(On behalf of the Registrant and as the Registrant’s Principal Executive |
|
|
|
Officer) |
50