Attached files
| file | filename |
|---|---|
| 8-K - FORM 8-K - TUESDAY MORNING CORP/DE | tm2035026-2_8k.htm |
Exhibit 99.1

Post - Restructuring Investment Opportunity October 2020 CONFIDENTIAL
2 CONFIDENTIAL Information Regarding Disclosures Tuesday Morning Corporation (“ TUESQ ” or the “Company”) is offering equity securities (collectively, the “Securities”) in a proposed private placement (the “Offering”). The Securities have not and will not be registered under the Securities Act of 1933, as a men ded (the “Act”), or under any state securities laws nor has the Securities and Exchange Commission (the “Commission”) or any stat e regulatory authority endorsed the Offering. Any representation to the contrary is a criminal offense. Although TUESQ is exp ect ed to agree to file, within a certain period of time upon completion of the Offering, a registration statement with the Commission wit h respect to the Securities being offered, there can be no assurance that such registration statement will be declared effective by the Commission or that any investor will have an opportunity to sell its Securities pursuant thereto. In the Offering, Securities will be offered only to Qualified Institutional Buyers (as defined in Rule 144A under the Act) an d a limited number of institutional “accredited investors” (as such term is defined in Regulation D under the Act) who are able to evalua te the merits and risks, including illiquidity of the investment. In making an investment decision, investors must rely upon their own examination of the Company and the terms of the Offering , including the merits and risks involved. The acquisition of Securities, if offered, should be considered only by persons who ca n bear the economic risk of their investment for an indefinite period of time and can afford a total loss of their investment. Each pr ospective investor in the Offering should, prior to purchasing any Securities, consult its own attorney and business advisor as to the leg al, business, tax and related matters concerning its investment and is urged to ask questions of, and receive answers from, the Company, Piper Sandler & Co. and Stifel , Nicolaus & Company concerning the terms and conditions of the Offering and request any additional information they may consider necessary in making an informed investment decision. This presentation does not constitute an offer to sell or a solicitation of an offer to purchase any securities of any nature wh atsoever, nor do the contents of the presentation constitute legal, tax or business advice. The presentation and the Offering shall be kept confidential. The recipient agrees not to disclose to any third party any in for mation contained herein, or any terms, conditions or other facts with respect to the Offering including, without limitation, that th e C ompany is or may be contemplating the Offering. Information included herewith has been obtained from the Company and other sources believed to be reliable, but the accuracy or completeness of such information is not guaranteed by, and should not be construed as a representation by, Piper Sandler & Co ., Stifel , Nicolaus & Company or the Company. Any representations and warranties will be contained only in a definitive agreement signed by the investor(s) and the Company. The Company is subject to the informational requirements of the Securities Exchan ge Act of 1934, as amended, and files reports, proxy statements and other information with the Commission . These reports are available at www.sec.gov , and include the Company’s Annual Report on Form 10 - K for the year ended June 30, 2020 and the Company’s Current Report on Form 8 - K filed on July 13, 2020.
I. Executive Summary II. Key Investment Highlights III. Pro Forma Business Plan Table of Contents

I. Executive Summary
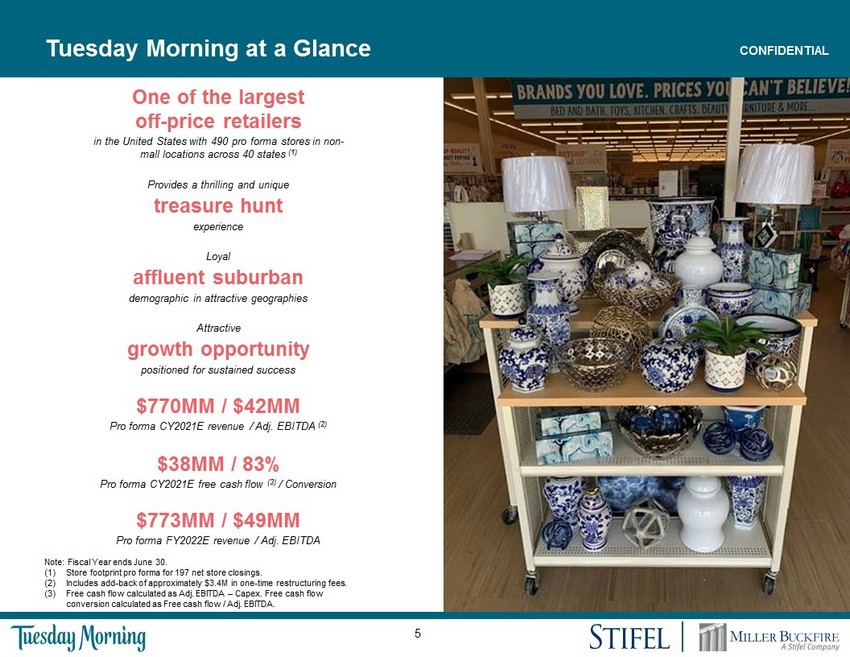
5 CONFIDENTIAL Tuesday Morning at a Glance Note: Fiscal Year ends June 30. (1) Store footprint pro forma for 197 net store closings. (2) Includes add - back of approximately $3.4M in one - time restructuring fees. (3) Free cash flow calculated as Adj. EBITDA – Capex. Free cash flow conversion calculated as Free cash flow / Adj. EBITDA. One of the largest off - price retailers in the United States with 490 pro forma stores in non - mall locations across 40 states (1) Provides a thrilling and unique treasure hunt experience Loyal a ffluent suburban demographic in attractive geographies $773MM / $49MM Pro forma FY2022E revenue / Adj. EBITDA $770MM / $42MM Pro forma CY2021E revenue / Adj. EBITDA (2) $38MM / 83% Pro forma CY2021E free c ash flow (3) / Conversion Attractive growth opportunity p ositioned for sustained success

6 CONFIDENTIAL II. Key Investment Highlights
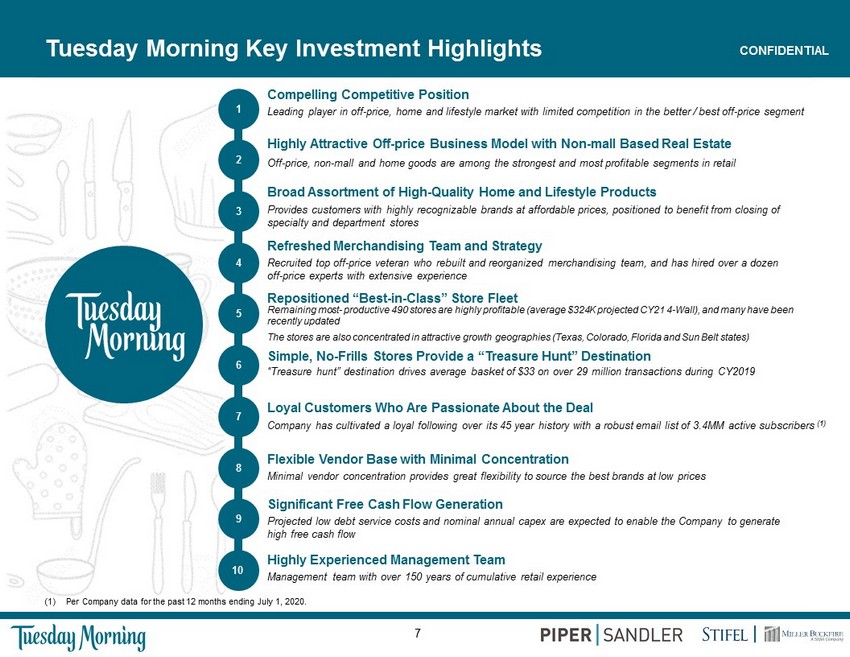
7 CONFIDENTIAL Tuesday Morning Key Investment Highlights 2 3 4 5 6 7 8 Broad Assortment of High - Quality Home and Lifestyle Products Provides customers with highly recognizable brands at affordable prices, positioned to benefit from closing of specialty and department stores 1 Compelling Competitive Position Leading player in off - price, home and lifestyle market with limited competition in the better / best off - price segment Highly Attractive Off - price Business Model with Non - mall Based Real Estate Off - price, non - mall and home goods are among the strongest and most profitable segments in retail Refreshed Merchandising Team and Strategy Recruited top off - price veteran who rebuilt and reorganized merchandising team, and has hired over a dozen off - price experts with extensive experience Flexible Vendor Base with Minimal Concentration Minimal vendor concentration provides great flexibility to source the best brands at low prices Simple, No - Frills Stores Provide a “Treasure Hunt” Destination “Treasure hunt” destination drives average basket of $33 on over 29 million transactions during CY2019 Loyal Customers Who Are Passionate About the Deal Company has cultivated a loyal following over its 45 year history with a robust email list of 3.4MM active subscribers (1) Highly Experienced Management Team Management team with over 150 years of cumulative retail experience Repositioned “Best - in - Class” Store Fleet Remaining most - productive 490 stores are highly profitable ( average $324K projected CY21 4 - Wall), and many have been recently updated The stores are also concentrated in attractive growth geographies (Texas, Colorado, Florida and Sun Belt states ) 9 (1) Per Company data for the past 12 months ending July 1, 2020. Significant Free Cash Flow Generation Projected low debt service costs and nominal annual capex are expected to enable the Company to generate high free cash flow 10
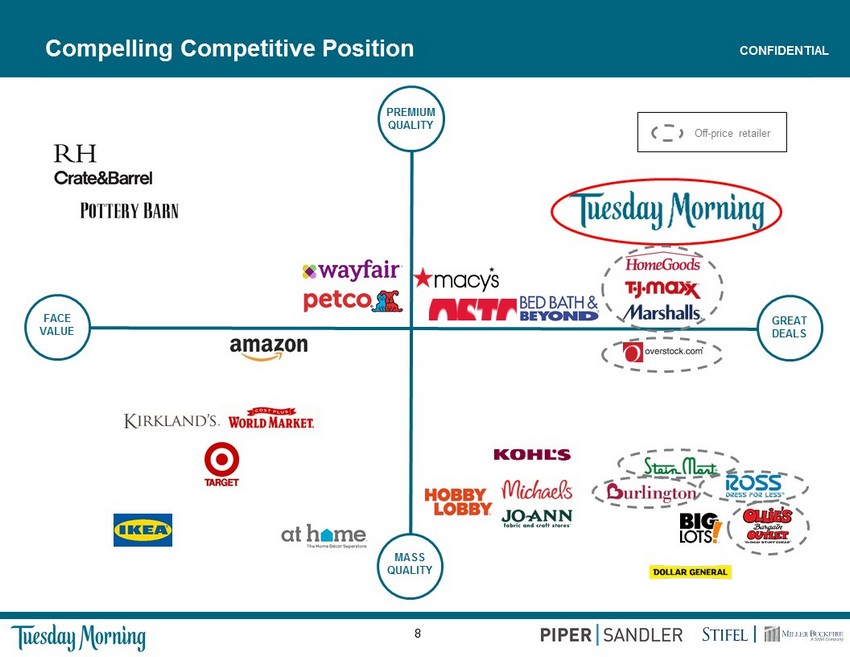
8 CONFIDENTIAL Compelling Competitive Position PREMIUM QUALITY MASS QUALITY FACE VALUE GREAT DEALS Off - price retailer
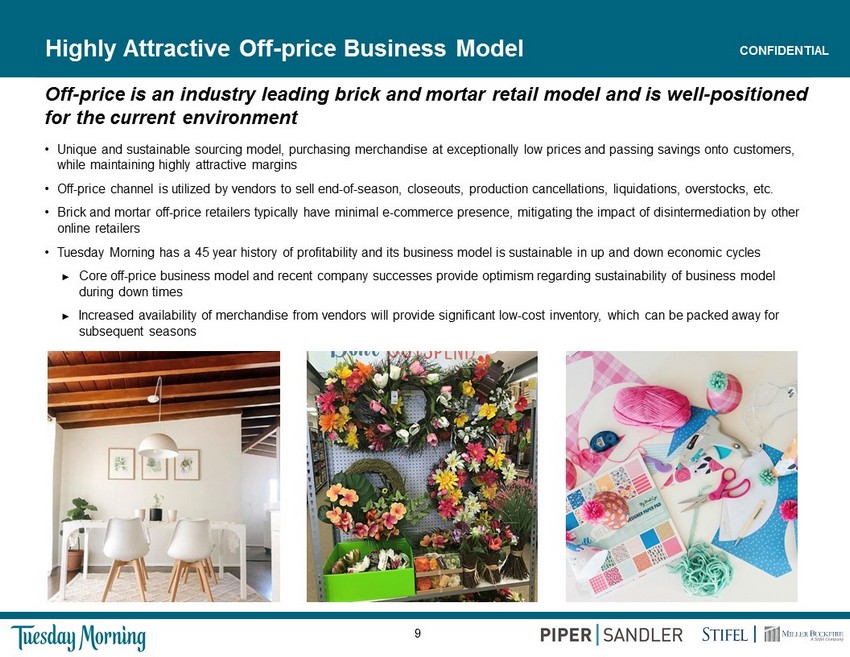
9 CONFIDENTIAL Highly Attractive Off - price Business Model Off - price is an industry leading brick and mortar retail model and is well - positioned for the current environment • Unique and sustainable sourcing model, purchasing merchandise at exceptionally low prices and passing savings onto customers, while maintaining highly attractive margins • Off - price channel is utilized by vendors to sell end - of - season, closeouts, production cancellations, liquidations, overstocks, etc. • Brick and mortar off - price retailers typically have minimal e - commerce presence, mitigating the impact of disintermediation by other online retailers • Tuesday Morning has a 45 year history of profitability and its business model is sustainable in up and down economic cycles ► Core off - price business model and r ecent company successes provide optimism regarding sustainability of business model during down times ► Increased availability of merchandise from vendors will provide significant low - cost inventory, which can be packed away for subsequent seasons
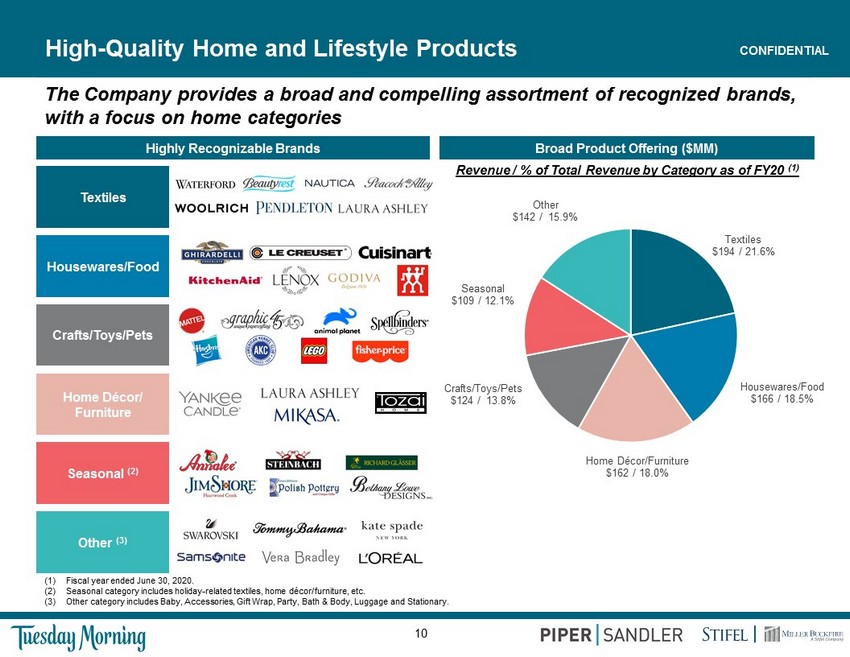
10 CONFIDENTIAL High - Quality Home and Lifestyle Products (1) Fiscal year ended June 30, 2020. (2) Seasonal category includes holiday - related textiles, home décor/furniture , etc. (3) Other category includes Baby, Accessories, Gift Wrap, Party, Bath & Body, Luggage and Stationary. The Company provides a broad and compelling assortment of recognized brands, with a focus on home categories Broad Product Offering ($MM) Revenue / % of Total Revenue by Category as of FY20 (1) Highly Recognizable Brands Textiles Crafts/Toys/Pets Home Décor/ Furniture Seasonal (2) Other (3) Housewares/Food Textiles $194 / 21.6% Housewares/Food $166 / 18.5% Home Décor/Furniture $162 / 18.0% Crafts/Toys/Pets $124 / 13.8% Seasonal $109 / 12.1% Other $142 / 15.9%
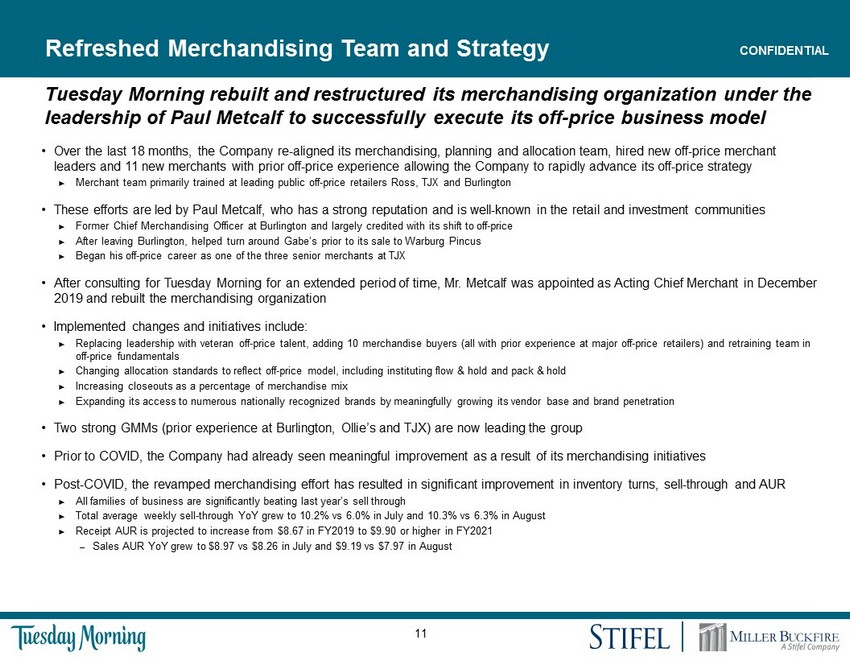
11 CONFIDENTIAL Refreshed Merchandising Team and Strategy Tuesday Morning rebuilt and restructured its merchandising organization under the leadership of Paul Metcalf to successfully execute its off - price business model • Over the last 18 months, the Company re - aligned its merchandising, planning and allocation team, hired new off - price merchant leaders and 11 new merchants with prior off - price experience allowing the Company to rapidly advance its off - price strategy ► Merchant team primarily trained at leading public off - price retailers Ross , TJX and Burlington • These efforts are led by Paul Metcalf, who has a strong reputation and is well - known in the retail and investment communities ► Former Chief Merchandising Officer at Burlington and largely credited with its shift to off - price ► After leaving Burlington, helped turn around Gabe’s prior to its sale to Warburg Pincus ► Began his off - price career as one of the three senior merchants at TJX • After consulting for Tuesday Morning for an extended period of time, Mr. Metcalf was appointed as Acting Chief Merchant in De cem ber 2019 and rebuilt the merchandising organization • Implemented changes and initiatives include: ► Replacing leadership with veteran off - price talent, adding 10 merchandise buyers (all with prior experience at major off - price retailers) and retraining team in off - price fundamentals ► Changing allocation standards to reflect off - price model, including instituting flow & hold and pack & hold ► Increasing closeouts as a percentage of merchandise mix ► Expanding its access to numerous nationally recognized brands by meaningfully growing its vendor base and brand penetration • Two strong GMMs (prior experience at Burlington, Ollie’s and TJX) are now leading the group • Prior to COVID, the Company had already seen meaningful improvement as a result of its merchandising initiatives • Post - COVID, the revamped merchandising effort has resulted in significant improvement in inventory turns, sell - through and AUR ► All families of business are significantly beating last year’s sell through ► Total average weekly sell - through YoY grew to 10.2% vs 6.0% in July and 10.3% vs 6.3% in August ► Receipt AUR is projected to increase from $8.67 in FY2019 to $9.90 or higher in FY2021 – Sales AUR YoY grew to $8.97 vs $8.26 in July and $9.19 vs $7.97 in August
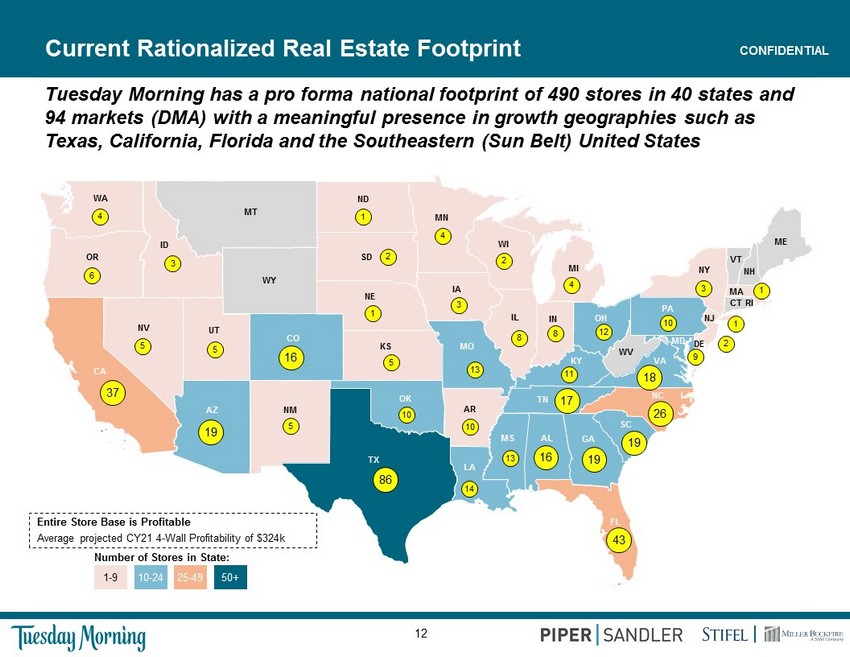
12 CONFIDENTIAL Current Rationalized Real Estate Footprint Tuesday Morning has a pro forma national footprint of 490 stores in 40 states and 94 markets (DMA) with a meaningful presence in growth geographies such as Texas, California, Florida and the Southeastern (Sun Belt) United States CT VT NH ME RI WV SD WY MT NY MA VA MD TN SC NC NE KY ID IL NM NJ WI MN ND CO KS IA MI PA DE UT NV WA OR CA FL LA MS GA AL AR MO OH IN OK TX AZ 1 - 9 10 - 24 25 - 49 50+ 4 6 37 5 5 5 10 5 1 3 4 1 13 8 2 4 8 12 11 10 14 13 10 3 1 1 2 9 3 Number of Stores in State: 2 Entire Store Base is Profitable Average projected CY21 4 - Wall Profitability of $324k 86 43 26 1 6 19 19 19 16 17 18
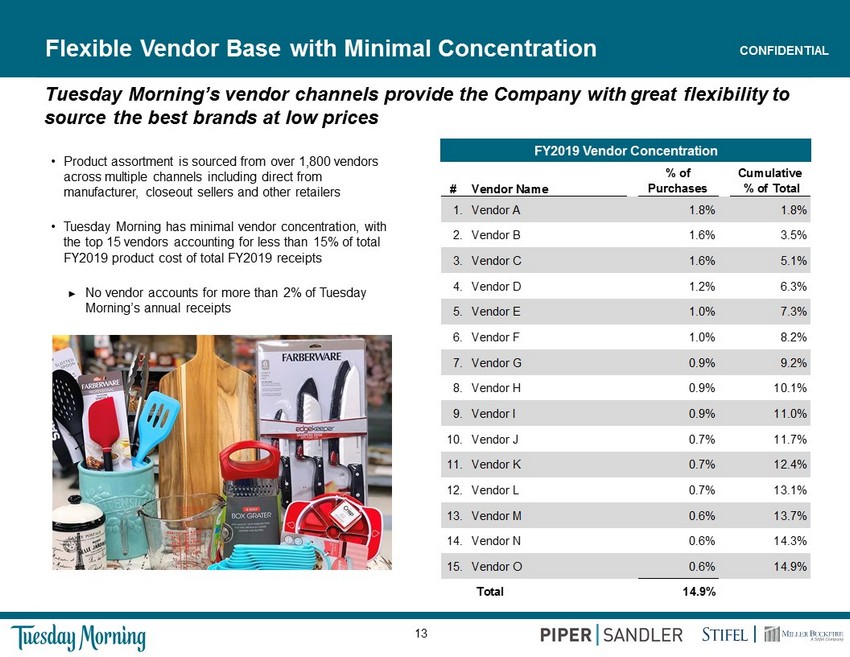
13 CONFIDENTIAL FY2019 Vendor Concentration Flexible Vendor Base with Minimal Concentration • Product assortment is sourced from over 1,800 vendors across multiple channels including direct from manufacturer, closeout sellers and other retailers • Tuesday Morning has minimal vendor concentration, with the top 15 vendors accounting for less than 15 % of total FY2019 product cost of total FY2019 receipts ► No vendor accounts for more than 2% of Tuesday Morning’s annual receipts # Vendor Name % of Purchases Cumulative % of Total 1. Vendor A 1.8% 1.8% 2. Vendor B 1.6% 3.5% 3. Vendor C 1.6% 5.1% 4. Vendor D 1.2% 6.3% 5. Vendor E 1.0% 7.3% 6. Vendor F 1.0% 8.2% 7. Vendor G 0.9% 9.2% 8. Vendor H 0.9% 10.1% 9. Vendor I 0.9% 11.0% 10. Vendor J 0.7% 11.7% 11. Vendor K 0.7% 12.4% 12. Vendor L 0.7% 13.1% 13. Vendor M 0.6% 13.7% 14. Vendor N 0.6% 14.3% 15. Vendor O 0.6% 14.9% Total 14.9% Tuesday Morning’s vendor channels provide the Company with great flexibility to source the best brands at low prices
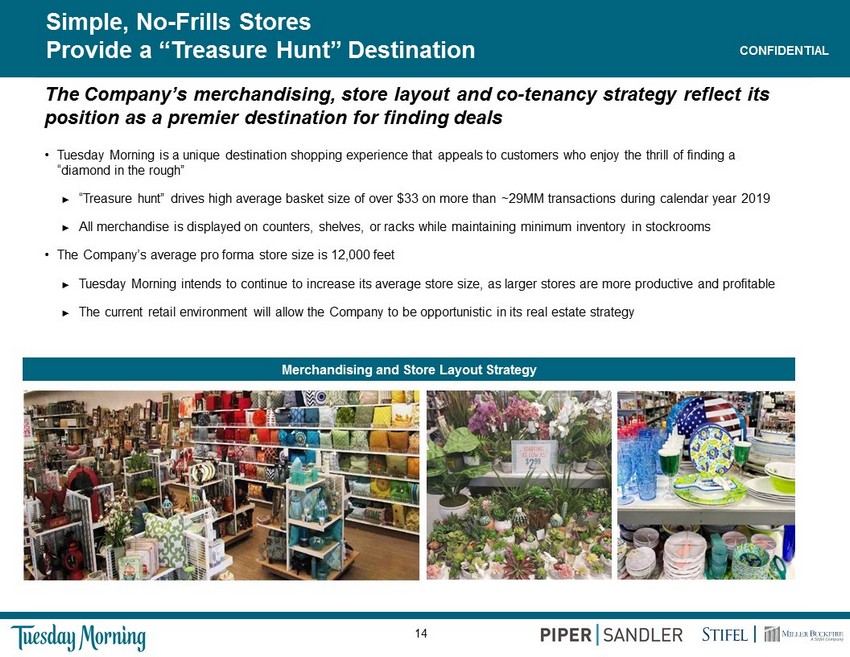
14 CONFIDENTIAL Simple , No - Frills Stores Provide a “Treasure Hunt” Destination The Company’s merchandising, store layout and co - tenancy strategy reflect its position as a premier destination for finding deals • Tuesday Morning is a unique destination shopping experience that appeals to customers who enjoy the thrill of finding a “diamond in the rough” ► “Treasure hunt” drives high average basket size of over $33 on more than ~29MM transactions during calendar year 2019 ► All merchandise is displayed on counters, shelves, or racks while maintaining minimum inventory in stockrooms • The Company’s average pro forma store size is 12,000 feet ► Tuesday Morning intends to continue to increase its average store size, as larger stores are more productive and profitable ► The current retail environment will allow the Company to be opportunistic in its real estate strategy Merchandising and Store Layout Strategy
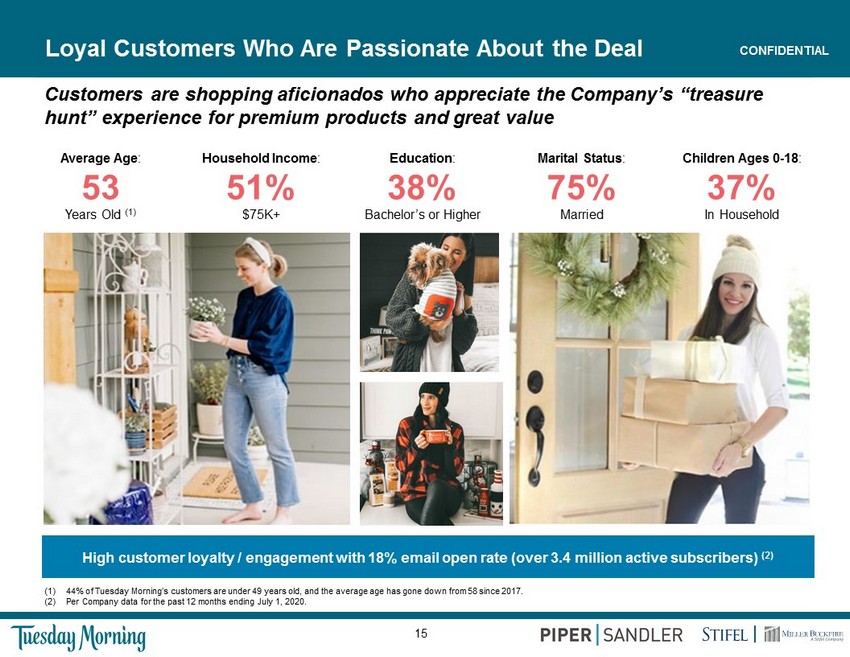
15 CONFIDENTIAL Loyal Customers Who Are Passionate About the Deal Customers are s hopping a ficionados w ho a ppreciate the Company’s “treasure hunt” experience for premium products and great value Average Age : 53 Years Old (1) Household Income : 51% $75K+ Marital Status : 75 % Married Children Ages 0 - 18 : 37% I n Household Education : 38% Bachelor’s or Higher (1) 44% of Tuesday Morning’s customers are under 49 years old, and the average age has gone down from 58 since 2017. (2) Per Company data for the past 12 months ending July 1, 2020. High customer loyalty / engagement with 18% email open rate (over 3.4 million active subscribers) (2)
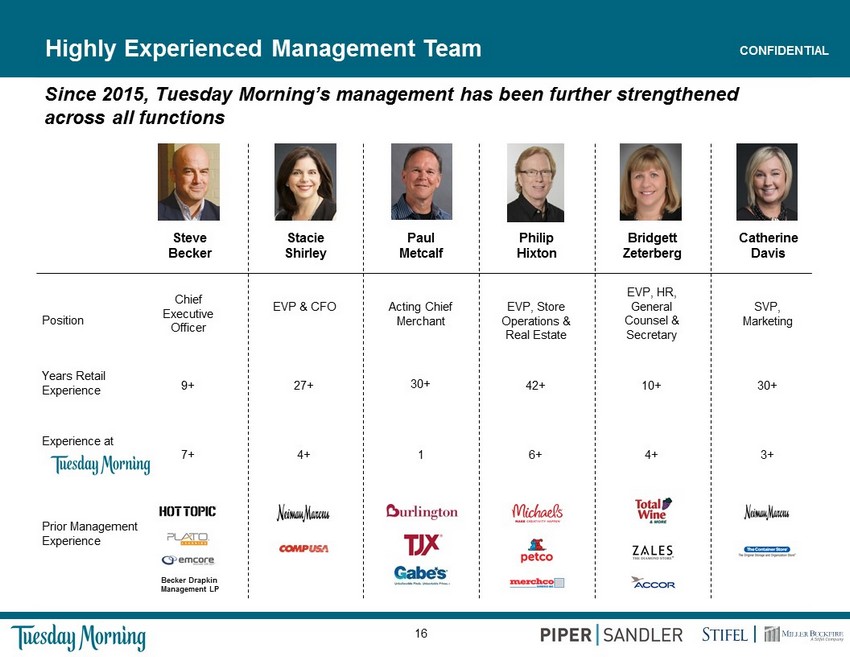
16 CONFIDENTIAL Since 2015, Tuesday Morning’s management has been further strengthened across all functions Highly Experienced Management Team Position Prior Management Experience Experience at Years Retail Experience EVP & CFO 27+ 4 + Stacie Shirley EVP, Store Operations & Real Estate 42+ 6+ Philip Hixton SVP, Marketing 30+ 3+ Catherine Davis EVP , HR, General Counsel & Secretary 10 + 4+ Bridgett Zeterberg Chief Executive Officer 9+ 7 + Steve Becker Becker Drapkin Management LP Acting Chief Merchant 30+ 1 Paul Metcalf
17 CONFIDENTIAL III. Pro Forma Business Plan
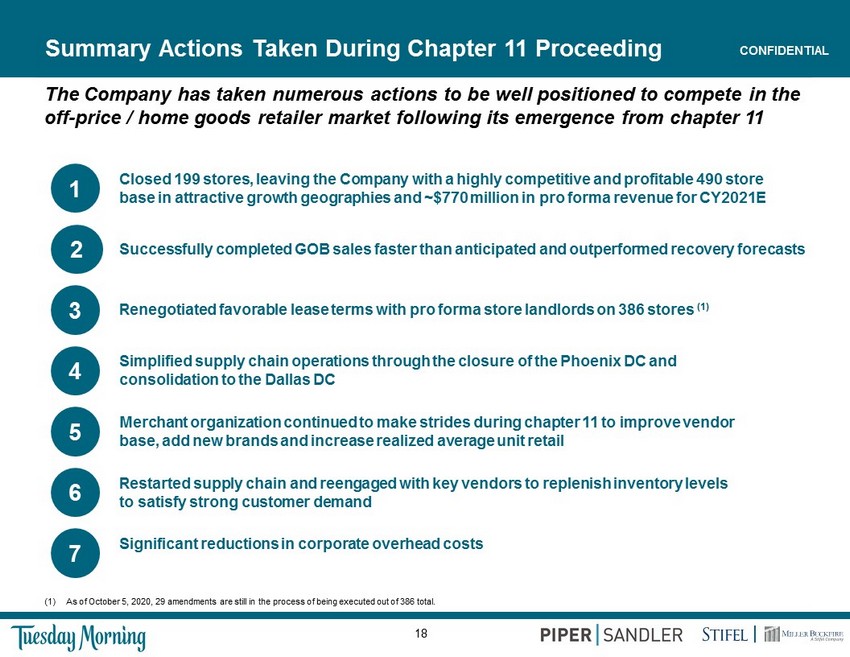
18 CONFIDENTIAL Renegotiated favorable lease terms with pro forma store landlords on 386 stores (1) 3 Summary Actions Taken During Chapter 11 Proceeding The Company has taken numerous actions to be well positioned to compete in the off - price / home goods retailer market following its emergence from c hapter 11 Simplified supply chain operations through the closure of the Phoenix DC and consolidation to the Dallas DC 4 Closed 199 stores, leaving the Company with a highly competitive and profitable 490 store base in attractive growth geographies and ~$770 million in pro forma revenue for CY2021E 1 Restarted supply chain and reengaged with key vendors to replenish inventory levels to satisfy strong customer demand 6 Significant reductions in corporate overhead costs 7 Merchant organization continued to make strides during chapter 11 to improve vendor base, add new brands and increase realized average unit retail 5 Successfully completed GOB sales faster than anticipated and outperformed recovery forecasts 2 (1) As of October 5, 2020, 29 amendments are still in the process of being executed out of 386 total.
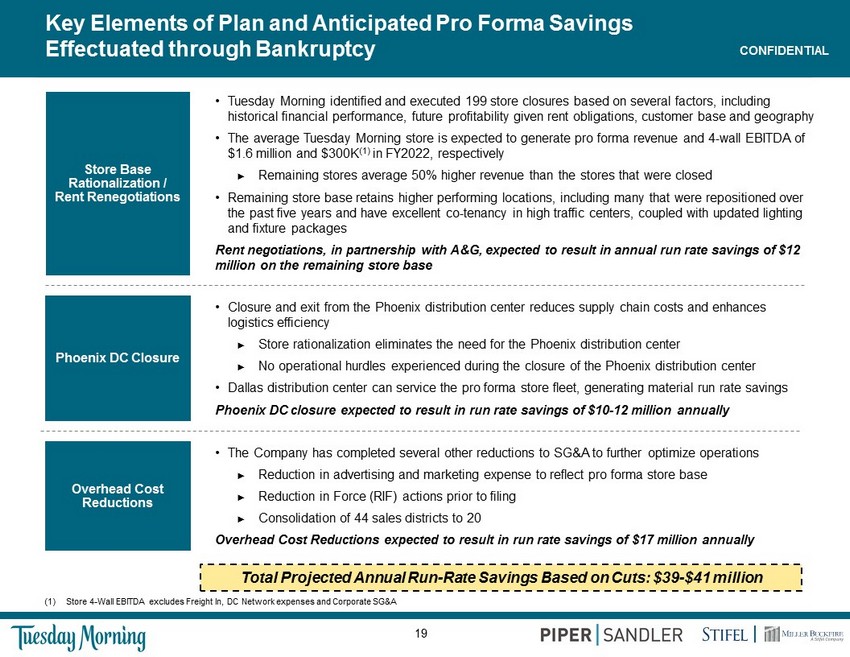
19 CONFIDENTIAL Key Elements of Plan and Anticipated Pro Forma Savings Effectuated through Bankruptcy • Tuesday Morning identified and executed 199 store closures based on several factors, including historical financial performance, future profitability given rent obligations, customer base and geography • The average Tuesday Morning store is expected to generate pro forma revenue and 4 - wall EBITDA of $ 1.6 million and $ 300K (1) in FY2022 , respectively ► Remaining stores average 50% higher revenue than the stores that were closed • Remaining store base retains higher performing locations, including many that were repositioned over the past five years and have excellent co - tenancy in high traffic centers, coupled with updated lighting and fixture packages Rent negotiations, in partnership with A&G, expected to result in annual run rate savings of $12 million on the remaining store base • The Company has completed several other reductions to SG&A to further optimize operations ► Reduction in advertising and marketing expense to reflect pro forma store base ► Reduction in Force (RIF) actions prior to filing ► Consolidation of 44 sales districts to 20 Overhead Cost Reductions expected to result in run rate savings of $17 million annually Store Base Rationalization / Rent Renegotiations Overhead Cost Reductions Phoenix DC Closure • Closure and exit from the Phoenix distribution center reduces supply chain costs and enhances logistics efficiency ► Store rationalization eliminates the need for the Phoenix distribution center ► No operational hurdles experienced during the closure of the Phoenix distribution center • Dallas distribution center can service the pro forma store fleet, generating material run rate savings Phoenix DC closure expected to result in run rate savings of $ 10 - 12 million annually Total Projected Annual Run - Rate Savings Based on Cuts: $39 - $41 million (1) Store 4 - Wall EBITDA excludes Freight In, DC Network expenses and Corporate SG&A
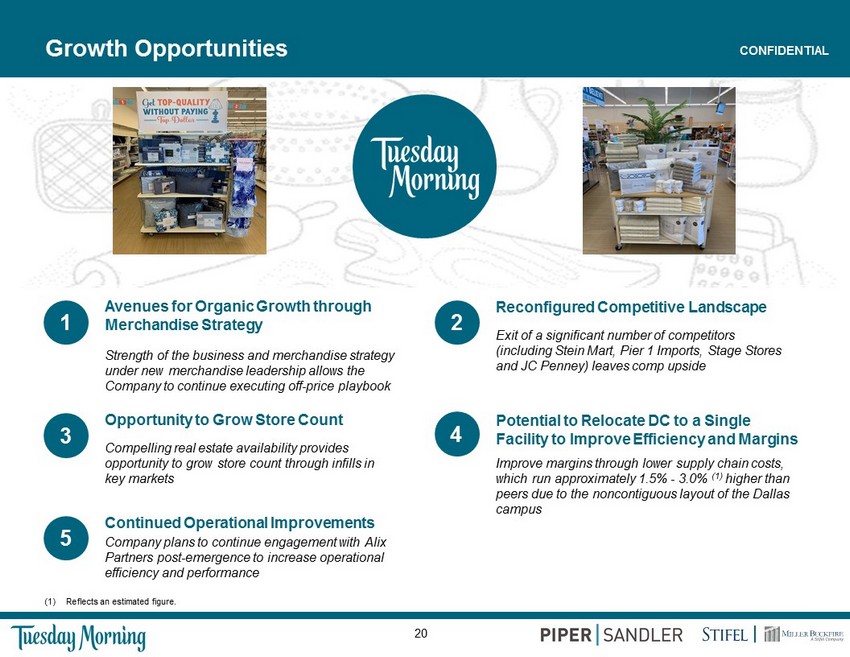
20 CONFIDENTIAL Growth Opportunities 2 3 4 Avenues for Organic Growth through Merchandise Strategy Strength of the business and merchandise strategy under new merchandise leadership allows the Company to continue executing off - price playbook 1 Reconfigured Competitive Landscape Exit of a significant number of competitors (including Stein Mart, Pier 1 Imports, Stage Stores and JC Penney) leaves comp upside Opportunity to Grow Store Count C ompelling real estate availability provides opportunity to grow store count through infills in key markets Potential to Relocate DC to a Single Facility to Improve Efficiency and Margins Improve margins through lower supply chain costs, which run approximately 1.5% - 3.0% (1) higher than peers due to the noncontiguous layout of the Dallas campus (1) Reflects an estimated figure. 5 Continued Operational Improvements Company plans to continue engagement with Alix Partners post - emergence to increase operational efficiency and performance
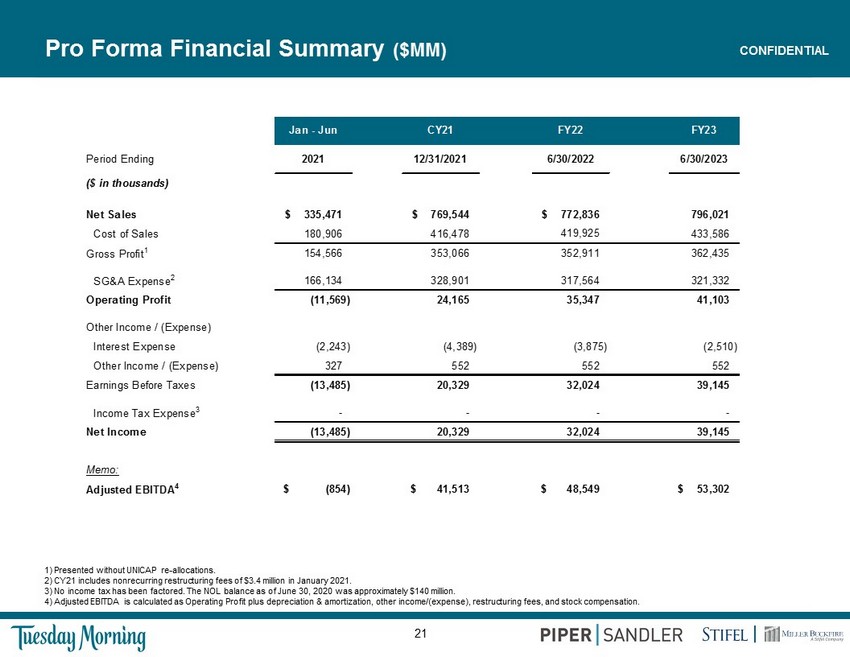
21 CONFIDENTIAL Pro Forma Financial Summary ($MM) 1) Presented without UNICAP re - allocations. 2) CY21 includes nonrecurring restructuring fees of $3.4 million in January 2021. 3) No income tax has been factored. The NOL balance as of June 30, 2020 was approximately $140 million. 4) Adjusted EBITDA is calculated as Operating Profit plus depreciation & amortization, other income/(expense), restructuring fee s, and stock compensation. Jan - Jun CY21 FY22 FY23 Period Ending 2021 12/31/2021 6/30/2022 6/30/2023 ($ in thousands) Net Sales $ 335,471 $ 769,544 $ 772,836 796,021 Cost of Sales 180,906 416,478 433,586 Gross Profit 1 154,566 353,066 352,911 362,435 SG&A Expense 2 166,134 328,901 317,564 321,332 Operating Profit (11,569) 24,165 35,347 41,103 Other Income / (Expense) Interest Expense (2,243) (4,389) (3,875) (2,510) Other Income / (Expense) 327 552 552 552 Earnings Before Taxes (13,485) 20,329 32,024 39,145 Income Tax Expense 3 - - - - Net Income (13,485) 20,329 32,024 39,145 Memo: Adjusted EBITDA 4 $ (854) $ 41,513 $ 48,549 $ 53,302 419,925

22 CONFIDENTIAL Appendix
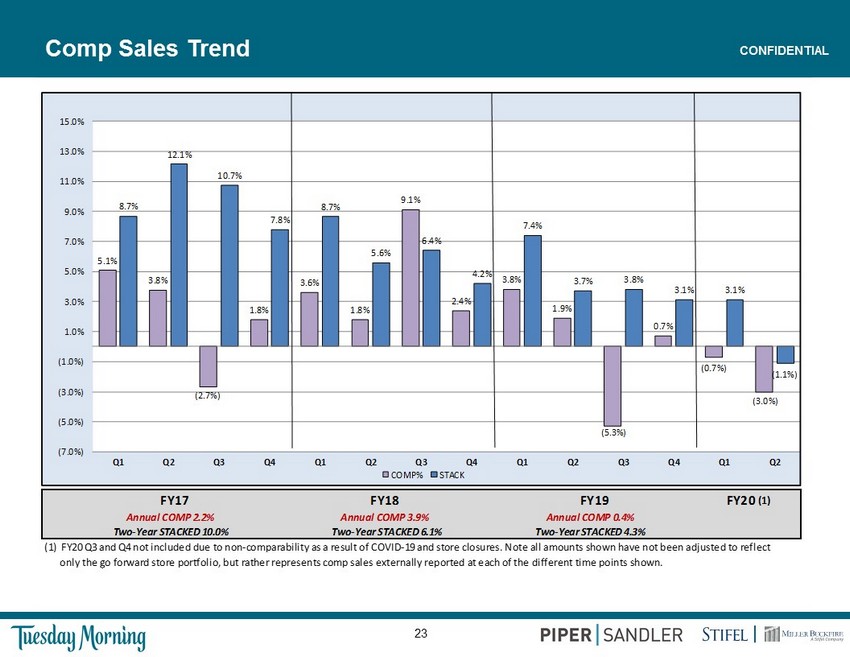
23 CONFIDENTIAL Comp Sales Trend FY17 FY18 FY20 (1) Annual COMP 2.2% Annual COMP 3.9% Annual COMP 0.4% Two-Year STACKED 10.0% Two-Year STACKED 6.1% Two-Year STACKED 4.3% (1) FY20 Q3 and Q4 not included due to non-comparability as a result of COVID-19 and store closures. Note all amounts shown have not been adjusted to reflect only the go forward store portfolio, but rather represents comp sales externally reported at each of the different time points shown. FY19 5.1% 3.8% (2.7%) 1.8% 3.6% 1.8% 9.1% 2.4% 3.8% 1.9% (5.3%) 0.7% (0.7%) (3.0%) 8.7% 12.1% 10.7% 7.8% 8.7% 5.6% 6.4% 4.2% 7.4% 3.7% 3.8% 3.1% 3.1% (1.1%) (7.0%) (5.0%) (3.0%) (1.0%) 1.0% 3.0% 5.0% 7.0% 9.0% 11.0% 13.0% 15.0% Q1 Q2 Q3 Q4 Q1 Q2 Q3 Q4 Q1 Q2 Q3 Q4 Q1 Q2 COMP% STACK
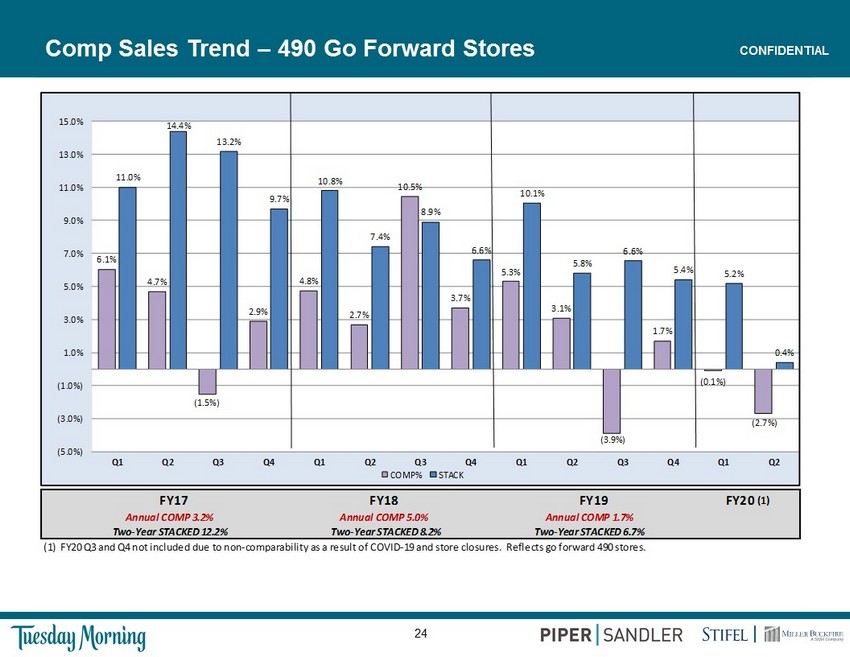
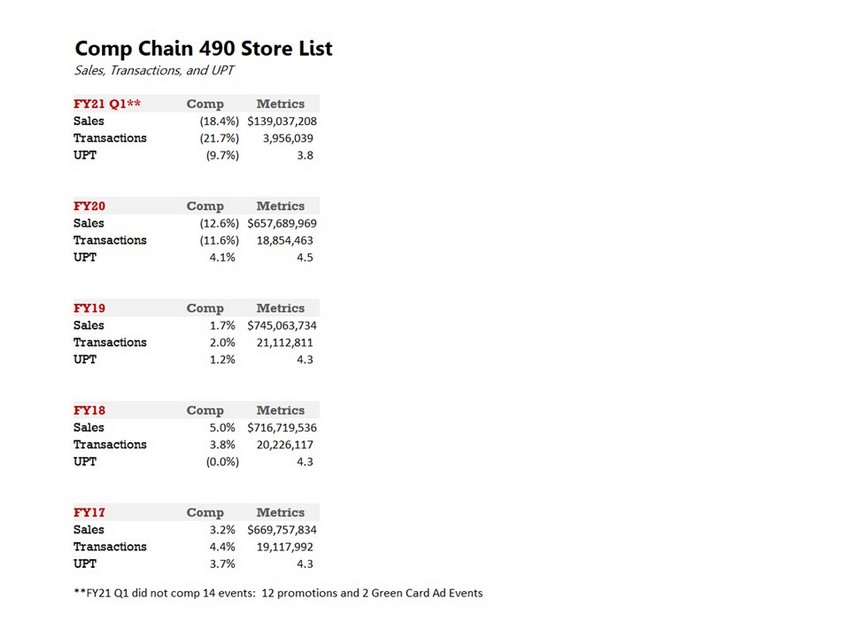
24 CONFIDENTIAL Comp Sales Trend – 490 Go Forward Stores FY17 FY18 FY20 (1) Annual COMP 3.2% Annual COMP 5.0% Annual COMP 1.7% Two-Year STACKED 12.2% Two-Year STACKED 8.2% Two-Year STACKED 6.7% (1) FY20 Q3 and Q4 not included due to non-comparability as a result of COVID-19 and store closures. Reflects go forward 490 stores. FY19 6.1% 4.7% (1.5%) 2.9% 4.8% 2.7% 10.5% 3.7% 5.3% 3.1% (3.9%) 1.7% (0.1%) (2.7%) 11.0% 14.4% 13.2% 9.7% 10.8% 7.4% 8.9% 6.6% 10.1% 5.8% 6.6% 5.4% 5.2% 0.4% (5.0%) (3.0%) (1.0%) 1.0% 3.0% 5.0% 7.0% 9.0% 11.0% 13.0% 15.0% Q1 Q2 Q3 Q4 Q1 Q2 Q3 Q4 Q1 Q2 Q3 Q4 Q1 Q2 COMP% STACK
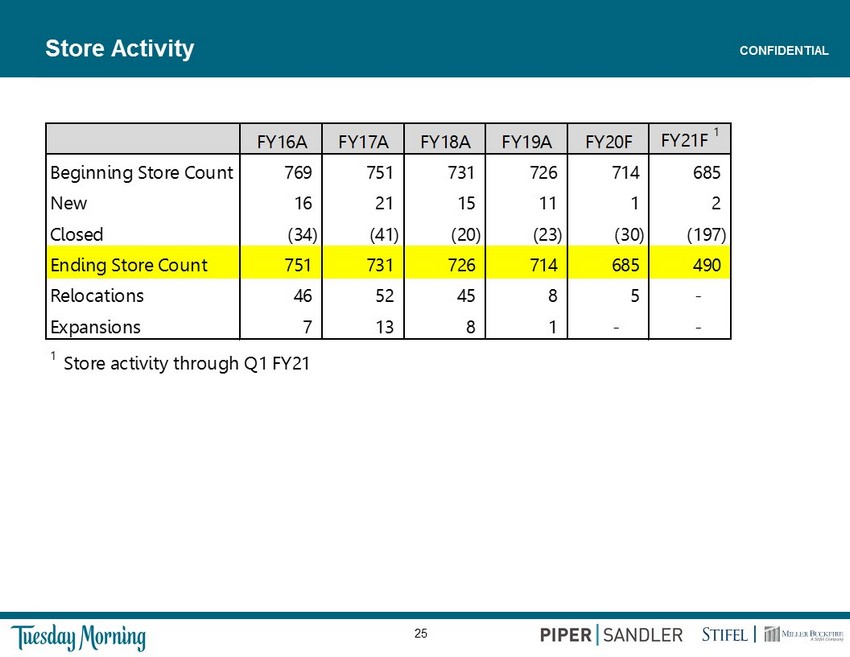
25 CONFIDENTIAL Store Activity FY16A FY17A FY18A FY19A FY20F FY21F 1 Beginning Store Count 769 751 731 726 714 685 New 16 21 15 11 1 2 Closed (34) (41) (20) (23) (30) (197) Ending Store Count 751 731 726 714 685 490 Relocations 46 52 45 8 5 - Expansions 7 13 8 1 - - 1 Store activity through Q1 FY21
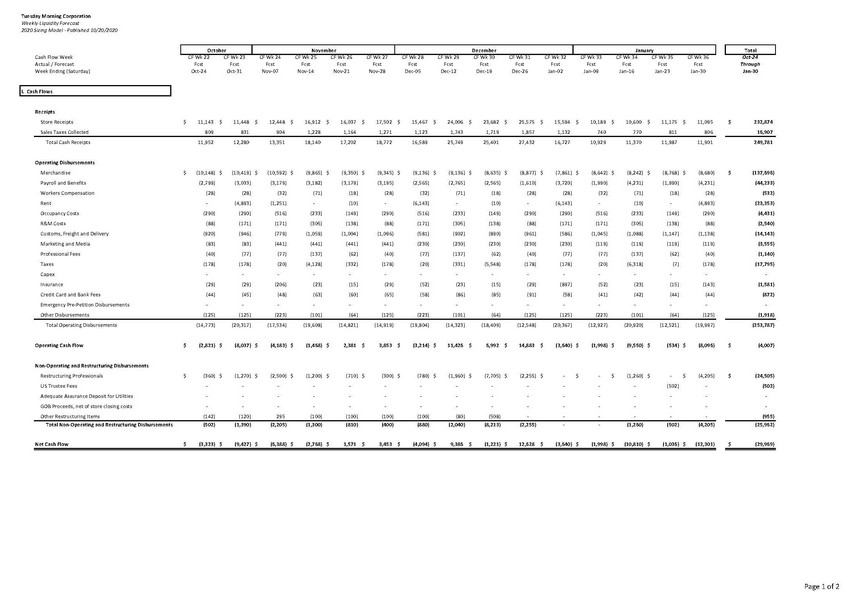 |
October November December January Receipts Store Receipts $ 11,279 $ 11,458 $ 12,445 $ 16,912 $ 16,037 $ 17,502 $ 15,467 $ 24,006 $ 23,682 $ 25,575 $ 15,594 $ 9,858 $ 10,600 $ 210,415 Sales Taxes Collected 819 832 904 1,228 1,164 1,271 1,123 1,743 1,719 1,857 1,132 716 770 15,276 Total Cash Receipts 12,098 12,289 13,349 18,140 17,202 18,772 16,589 25,749 25,401 27,432 16,727 10,574 11,370 225,691 Operating Disbursements Merchandise $ (10,146) $ (10,848) $ (10,950) $ (9,665) $ (8,055) $ (9,558) $ (9,405) $ (9,369) $ (8,858) $ (9,146) $ (8,395) $ (9,100) $ (8,885) $ (122,380) Payroll and Benefits (2,799) (3,033) (3,179) (3,182) (3,179) (3,195) (2,565) (2,765) (2,565) (1,610) (3,720) (1,990) (4,231) (38,012) Workers Compensation (28) (28) (32) (71) (18) (28) (32) (71) (18) (28) (28) (32) (71) (486) Rent - (4,893) (1,251) - (10) (4,893) (1,251) - (10) - (4,893) (1,251) (10) (18,460) Occupancy Costs (290) (290) (516) (233) (149) (290) (516) (233) (149) (290) (290) (516) (233) (3,992) R&M Costs (88) (171) (171) (305) (138) (88) (171) (305) (138) (88) (171) (171) (305) (2,314) Customs, Freight and Delivery (1,044) (1,061) (879) (1,194) (1,132) (1,236) (659) (1,023) (1,009) (1,089) (664) (1,011) (1,088) (13,088) Marketing and Media (83) (83) (441) (441) (441) (441) (230) (230) (230) (230) (230) (119) (119) (3,317) Professional Fees (40) (77) (77) (137) (62) (40) (77) (137) (62) (40) (77) (77) (137) (1,038) Taxes (178) (178) (20) (1,092) (3,376) (178) (20) (331) (5,548) (178) (178) (20) (1,527) (12,826) Capex - - - - - - - - - - - - - - Insurance (29) (29) (206) (23) (15) (29) (52) (23) (15) (529) (397) (52) (23) (1,422) Credit Card and Bank Fees (44) (45) (48) (63) (60) (65) (58) (86) (85) (91) (58) (39) (42) (784) Emergency Pre-Petition Disbursements - - - - - - - - - - - - - - Other Disbursements (125) (125) (223) (101) (64) (125) (223) (101) (64) (125) (125) (223) (101) (1,728) Total Operating Disbursements (14,895) (20,862) (17,991) (16,507) (16,698) (20,165) (15,258) (14,675) (18,750) (13,445) (19,227) (14,601) (16,773) (219,848) Operating Cash Flow $ (2,797) $ (8,572) $ (4,642) $ 1,633 $ 504 $ (1,393) $ 1,332 $ 11,074 $ 6,651 $ 13,986 $ (2,501) $ (4,027) $ (5,403) $ 5,844 Non-Operating and Restructuring Disbursements Restructuring Professionals $ (1,232) $ (934) $ (2,500) $ (1,760) $ (710) $ (300) $ (780) $ (1,960) $ (7,705) $ (2,255) $ - $ - $ (1,260) $ (21,396) US Trustee Fees (502) - - - - - - - - - - - - (502) Adequate Assurance Deposit for Utilities - - - - - - - - - - - - - - GOB Proceeds, net of store closing costs - - - - - - - - - - - - - - Other Restructuring Items (92) (120) 295 (120) (100) (100) (100) (100) (524) (64) - - - (1,025) Total Non-Operating and Restructuring Disbursements (1,826) (1,054) (2,205) (1,880) (810) (400) (880) (2,060) (8,229) (2,319) - - (1,260) (22,923) Net Cash Flow $ (4,624) $ (9,626) $ (6,847) $ (247) $ (306) $ (1,793) $ 452 $ 9,014 $ (1,578) $ 11,667 $ (2,501) $ (4,027) $ (6,663) $ (17,079) |
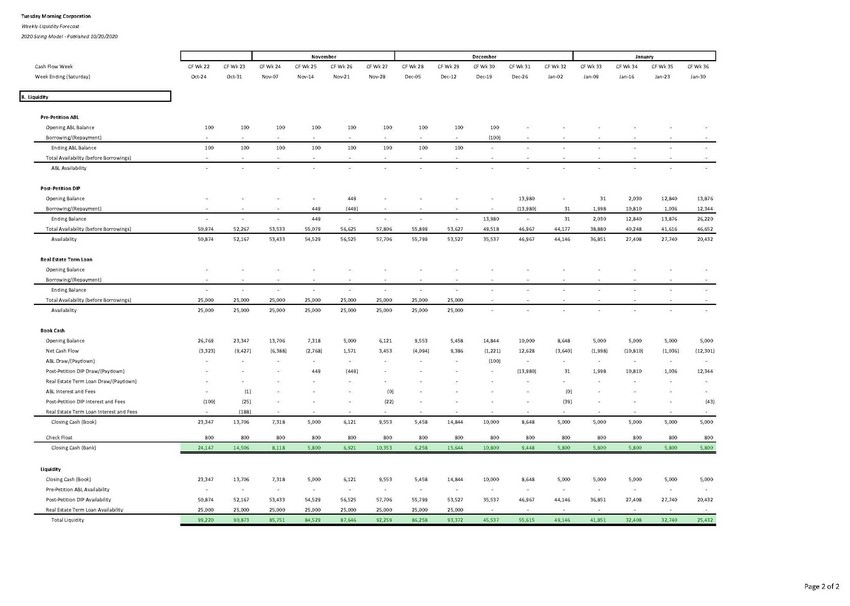 |
CF Wk 1 CF Wk 2 CF Wk 3 CF Wk 4 CF Wk 5 CF Wk 6 CF Wk 7 CF Wk 8 CF Wk 9 CF Wk 10 CF Wk 11 CF Wk 12 CF Wk 13 Oct-24 Oct-31 Nov-07 Nov-14 Nov-21 Nov-28 Dec-05 Dec-12 Dec-19 Dec-26 Jan-02 Jan-09 Jan-16 II. Liquidity Pre-Petition ABL Opening ABL Balance 100 100 100 100 100 100 100 100 100 100 100 100 100 Borrowing/(Repayment) - - - - - - - - - - - - - Ending ABL Balance 100 100 100 100 100 100 100 100 100 100 100 100 100 Total Availability (before Borrowings) - - - - - - - - - - - - - ABL Availability - - - - - - - - - - - - - Post-Petition DIP 50,974 52,267 53,533 55,079 56,625 57,806 55,899 53,627 51,356 49,084 46,632 48,880 50,248 50,874 52,167 53,433 54,979 56,525 57,706 55,799 53,527 51,256 48,984 46,532 48,780 50,148 Total Availability (before Borrowings) Post-Petition ABL Availability Real Estate Term Loan 25,000 25,000 25,000 25,000 25,000 25,000 25,000 25,000 25,000 25,000 25,000 25,000 25,000 25,000 25,000 25,000 25,000 25,000 25,000 25,000 25,000 25,000 25,000 25,000 25,000 25,000 Total Availability (before Borrowings) Availability Book Cash |
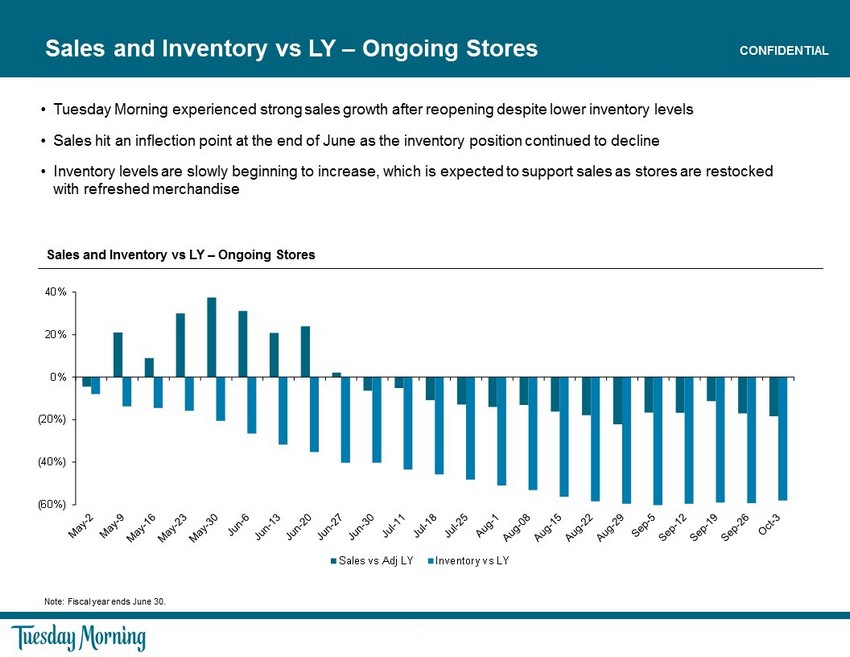
CONFIDENTIAL Sales and Inventory vs LY – Ongoing Stores Note: Fiscal year ends June 30 . • Tuesday Morning experienced strong sales growth after reopening despite lower inventory levels • Sales hit an inflection point at the end of June as the inventory position continued to decline • Inventory levels are slowly beginning to increase, which is expected to support sales as stores are restocked with refreshed merchandise Sales and Inventory vs LY – Ongoing Stores (60%) (40%) (20%) 0% 20% 40% Sales vs Adj LY Inventory vs LY

Confidential Information Presentation September 2020 CONFIDENTIAL
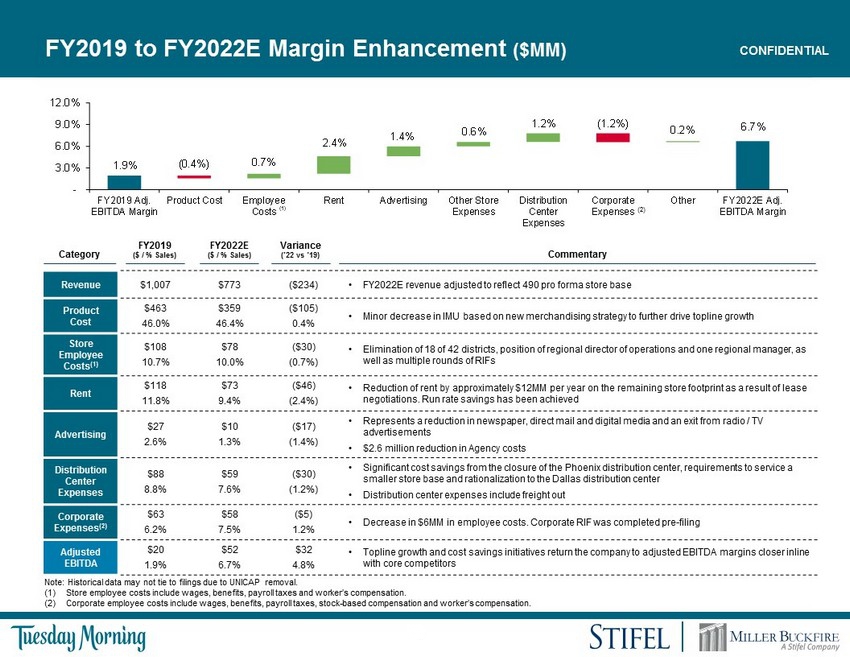
3 CONFIDENTIAL 1.9% 6.7% ( 0.4% ) 0.7% 2.4% 1.4% 0.6% 1.2% (1.2%) 0.2% - 3.0% 6.0% 9.0% 12.0% FY2019 Adj. EBITDA Margin Product Cost Employee Costs Rent Advertising Other Store Expenses Distribution Center Expenses Corporate Expenses Other FY2022E Adj. EBITDA Margin FY2019 to FY2022E Margin Enhancement ($MM) Revenue $1,007 $773 ($234) • FY2022E revenue adjusted to reflect 490 pro forma store base Product Cost $463 46.0% $359 46.4% ($105) 0.4% • Minor decrease in IMU based on new merchandising strategy to further drive topline growth Store Employee Costs (1) $108 10.7% $78 10.0% ($30) (0.7%) • Elimination of 18 of 42 districts, position of regional director of operations and one regional manager, as well as multiple rounds of RIFs Rent $118 11.8% $73 9.4% ($46) (2.4%) • Reduction of rent by approximately $12MM per year on the remaining store footprint as a result of lease negotiations. Run rate savings has been achieved Advertising $27 2.6% $10 1.3% ($17) (1.4%) • Represents a reduction in newspaper, direct mail and digital media and an exit from radio / TV advertisements • $2.6 million reduction in Agency costs Distribution Center Expenses $88 8.8% $59 7.6% ($30) (1.2%) • Significant cost savings from the closure of the Phoenix distribution center, requirements to service a smaller store base and rationalization to the Dallas distribution center • Distribution center expenses include freight out Corporate Expenses (2) $63 6.2% $58 7.5% ($5) 1.2% • Decrease in $6MM in employee costs. Corporate RIF was completed pre - filing Adjusted EBITDA $20 1.9% $52 6.7% $32 4.8% • Topline growth and cost savings initiatives return the company to adjusted EBITDA margins closer inline with core competitors Category Commentary FY2022E ($ / % Sales) FY2019 ($ / % Sales) Variance (’22 vs ‘19) Note: Historical data may not tie to filings due to UNICAP removal . (1) Store employee costs include wages, benefits, payroll taxes and worker’s compensation. (2) Corporate employee costs include wages, benefits, payroll taxes, stock - based compensation and worker’s compensation. (1) (2)