Attached files
| file | filename |
|---|---|
| EX-32.2 - Surna Inc. | ex32-2.htm |
| EX-32.1 - Surna Inc. | ex32-1.htm |
| EX-31.2 - Surna Inc. | ex31-2.htm |
| EX-31.1 - Surna Inc. | ex31-1.htm |
UNITED STATES
SECURITIES AND EXCHANGE COMMISSION
Washington, D.C. 20549
FORM 10-Q
[X] QUARTERLY REPORT PURSUANT TO SECTION 13 OR 15(d) OF THE SECURITIES EXCHANGE ACT OF 1934
FOR THE QUARTERLY PERIOD ENDED SEPTEMBER 30, 2020
OR
[ ] TRANSITION REPORT PURSUANT TO SECTION 13 OR 15(d) OF THE SECURITIES EXCHANGE ACT OF 1934
Commission File Number: 000-54286
SURNA INC.
(Exact name of registrant as specified in its charter)
| Nevada | 27-3911608 | |
(State or other jurisdiction of incorporation or organization) |
(I.R.S. Employer Identification No.) |
| 1780 55th Street, Boulder, Colorado | 80301 | |
| (Address of principal executive offices) | (Zip code) |
(303) 993-5271
(Registrant’s telephone number, including area code)
Indicate by check mark whether the issuer (1) has filed all reports required to be filed by Section 13 or 15(d) of the Exchange Act during the preceding 12 months (or for such shorter period that the registrant was required to file such reports), and (2) has been subject to such filing requirements for the last 90 days. YES [X] NO [ ]
Indicate by check mark whether the registrant has submitted electronically every Interactive Data File required to be submitted pursuant to Rule 405 of Regulation S-T (§ 232.405 of this chapter) during the preceding 12 months (or for such shorter period that the registrant was required to submit such files). YES [X] NO [ ]
Indicate by check mark whether the registrant is a large accelerated filer, an accelerated filer, a non-accelerated filer, a smaller reporting company, or an emerging growth company. See the definitions of “large accelerated filer, “accelerated filer,” “non-accelerated filer,” “smaller reporting company,” and “emerging growth company” in Rule 12b-2 of the Exchange Act.
| Large Accelerated Filer | [ ] | Accelerated Filer | [ ] |
| Non-accelerated Filer | [X] | Smaller Reporting Company | [X] |
| Emerging Growth Company | [ ] | ||
If an emerging growth company, indicate by check mark if the registrant has elected not to use the extended transition period for complying with any new or revised financial accounting standards provided pursuant to Section 13(a) of the Exchange Act. [ ]
Indicate by check mark whether the registrant is a shell company (as defined in Rule 12b-2 of the Exchange Act). YES [ ] NO [X]
Securities registered pursuant to Section 12(b) of the Exchange Act:
| Title of each class | Trading Symbol(s) | Name of each exchange on which registered | ||
| N/A | N/A | N/A |
As of November 11, 2020, the number of outstanding shares of common stock of the registrant was 236,526,638.
Surna Inc.
Quarterly Report on Form 10-Q
For the Quarterly Period Ended September 30, 2020
Table of Contents
| i |
In this Quarterly Report on Form 10-Q, unless otherwise indicated, the “Company”, “we”, “us” or “our” refer to Surna Inc. and, where appropriate, its wholly owned subsidiary.
This Quarterly Report on Form 10-Q, including “Management’s Discussion and Analysis of Financial Condition and Results of Operations” in Item 2, contains forward-looking statements that involve substantial risks and uncertainties. These forward-looking statements are not historical facts, but are based on current management expectations that involve substantial risks, uncertainties, and other factors, some of which are beyond our control and difficult to predict and could cause actual results to differ materially from those expressed in, or implied by, these forward-looking statements. Forward-looking statements relate to future events or our future financial performance. We generally identify forward-looking statements by terminology such as “may,” “will,” “should,” “expects,” “plans,” “anticipates,” “could,” “intends,” “target,” “projects,” “contemplates,” “believes,” “estimates,” “predicts,” “potential,” or “continue” or the negative of these terms or other similar words. All statements, other than statements of historical fact, are statements that could be deemed forward-looking statements including, but not limited to, any projections of revenue, gross profit, earnings or loss, tax provisions, cash flows or other financial items; any statements of the plans, strategies or objectives of management for future operations; any statements regarding current or future macroeconomic or industry-specific trends or events and the impact of those trends and events on us or our financial performance; any statements regarding pending investigations, legal claims or tax disputes; any statements of expectation or belief; and any statements of assumptions underlying any of the foregoing.
These forward-looking statements are subject to known and unknown risks, uncertainties, assumptions and other factors that could cause our actual results of operations, financial condition, liquidity, performance, prospects, opportunities, achievements or industry results, as well as those of the markets we serve or intend to serve, to differ materially from those expressed in, or suggested by, these forward-looking statements. These forward-looking statements are based on assumptions regarding our present and future business strategies and the environment in which we operate. Important factors that could cause those differences include, but are not limited to:
| ● | our business prospects and the prospects of our existing and prospective customers; | |
| ● | the impact on our business and that of our customers of the current and future response by the government and business to the COVID-19 pandemic, including what is necessary to protect our staff and the staff of our customers in the conduct of our business; | |
| ● | the overall impact of the COVID-19 pandemic on the business climate in our industry and the willingness of our customers to undertake projects in light of economic uncertainties; | |
| ● | our overall financial condition, including our reduced revenue and business disruption, due to the COVID-19 pandemic business and economic response and its consequences; | |
| ● | the inherent uncertainty of product development; | |
| ● | regulatory, legislative and judicial developments, especially those related to changes in, and the enforcement of, cannabis laws; | |
| ● | increasing competitive pressures in our industry; | |
| ● | our relationships with our customers and suppliers; | |
| ● | general economic conditions or conditions that may adversely affect demand for the products offered by us in the markets in which we operate; | |
| ● | changes in our business strategy or development plans, including our expected level of capital expenses and working capital; | |
| ● | our ability to attract and retain qualified personnel; | |
| ● | our ability to raise equity and debt capital to fund our operations and growth strategy, including possible acquisitions; | |
| ● | our ability to identify, complete and integrate potential strategic acquisitions; | |
| ● | future revenue being lower than expected; | |
| ● | our ability to convert our backlog into revenue in a timely manner, or at all; and | |
| ● | our intention not to pay dividends. |
Although we believe that the assumptions on which these forward-looking statements are based are reasonable, any of those assumptions could prove to be inaccurate, and as a result, the forward-looking statements based on those assumptions also could be inaccurate. In light of these and other uncertainties, the inclusion of a projection or forward-looking statement in this Quarterly Report on Form 10-Q should not be regarded as a representation by us that our plans and objectives will be achieved. These risks and uncertainties include those described or identified in “Item 1A – Risk Factors” in our Annual Report on Form 10-K for the year ended December 31, 2019, as updated from time to time in the Company’s filings with the U.S. Securities and Exchange Commission (the “SEC”). You should not place undue reliance on these forward-looking statements, which apply only as of the date of this Quarterly Report on Form 10-Q. Except as required by the federal securities laws, we undertake no obligation to revise or update any forward-looking statements, whether as a result of new information, future events or otherwise, to reflect events or circumstances occurring after the date of this Quarterly Report on Form 10-Q. The forward-looking statements and projections contained in this Quarterly Report on Form 10-Q are excluded from the safe harbor protection provided by Section 27A of the Securities Act of 1933, as amended (the “Securities Act”).
| ii |
PART I — FINANCIAL INFORMATION
Condensed Consolidated Balance Sheets
| September 30, | December 31, | |||||||
| 2020 | 2019 | |||||||
| (Unaudited) | ||||||||
| ASSETS | ||||||||
| Current Assets | ||||||||
| Cash and cash equivalents | $ | 2,072,312 | $ | 922,177 | ||||
| Accounts receivable (net of allowance for doubtful accounts of $164,823 and $151,673, respectively) | 97,257 | 138,357 | ||||||
| Inventory, net | 521,650 | 1,231,243 | ||||||
| Prepaid expenses and other | 757,498 | 269,491 | ||||||
| Total Current Assets | 3,448,717 | 2,561,268 | ||||||
| Noncurrent Assets | ||||||||
| Property and equipment, net | 176,823 | 257,923 | ||||||
| Goodwill | 631,064 | 631,064 | ||||||
| Intangible assets, net | 7,371 | 11,930 | ||||||
| Deposits | - | 51,000 | ||||||
| Operating lease right-of-use asset | 392,263 | 534,133 | ||||||
| Total Noncurrent Assets | 1,207,521 | 1,486,050 | ||||||
| TOTAL ASSETS | $ | 4,656,238 | $ | 4,047,318 | ||||
| LIABILITIES AND SHAREHOLDERS’ EQUITY (DEFICIT) | ||||||||
| CURRENT LIABILITIES | ||||||||
| Accounts payable and accrued liabilities | $ | 1,397,770 | $ | 1,832,959 | ||||
| Deferred revenue | 3,489,302 | 1,444,472 | ||||||
| Accrued equity compensation | 101,472 | 503,466 | ||||||
| Current portion of operating lease liability | 253,392 | 217,843 | ||||||
| Total Current Liabilities | 5,241,936 | 3,998,740 | ||||||
| NONCURRENT LIABILITIES | ||||||||
| Note payable and accrued interest | 556,444 | - | ||||||
| Other liabilities | 41,396 | - | ||||||
| Operating lease liability, net of current portion | 238,139 | 404,209 | ||||||
| Total Noncurrent Liabilities | 835,979 | 404,209 | ||||||
| TOTAL LIABILITIES | 6,077,915 | 4,402,949 | ||||||
| Commitments and Contingencies (Note 7) | - | - | ||||||
| SHAREHOLDERS’ EQUITY (DEFICIT) | ||||||||
| Preferred stock, $0.00001 par value; 150,000,000 shares authorized; 42,030,331 shares issued and outstanding | 420 | 420 | ||||||
| Common stock, $0.00001 par value; 350,000,000 shares authorized; 236,526,638 and 228,216,638 shares issued and outstanding, respectively | 2,366 | 2,283 | ||||||
| Additional paid in capital | 26,082,733 | 25,326,593 | ||||||
| Accumulated deficit | (27,507,196 | ) | (25,684,927 | ) | ||||
| Total Shareholders’ Equity (Deficit) | (1,421,677 | ) | (355,631 | ) | ||||
| TOTAL LIABILITIES AND SHAREHOLDERS’ EQUITY (DEFICIT) | $ | 4,656,238 | $ | 4,047,318 | ||||
The accompanying notes are an integral part of these condensed consolidated financial statements.
| 1 |
Condensed Consolidated Statements of Operations
(Unaudited)
| For the Three Months Ended September 30, | For the Nine Months Ended September 30, | |||||||||||||||
| 2020 | 2019 | 2020 | 2019 | |||||||||||||
| Revenue, net | $ | 1,634,669 | $ | 5,524,105 | $ | 5,127,018 | $ | 11,505,728 | ||||||||
| Cost of revenue | 1,108,758 | 3,943,758 | 3,869,758 | 7,987,516 | ||||||||||||
| Gross profit | 525,911 | 1,580,347 | 1,257,260 | 3,518,212 | ||||||||||||
| Operating expenses: | ||||||||||||||||
| Advertising and marketing expenses | 89,695 | 123,566 | 333,669 | 415,479 | ||||||||||||
| Product development costs | 84,433 | 98,145 | 304,229 | 326,659 | ||||||||||||
| Selling, general and administrative expenses | 634,447 | 1,081,294 | 2,453,976 | 3,284,485 | ||||||||||||
| Total operating expenses | 808,575 | 1,303,005 | 3,091,874 | 4,026,623 | ||||||||||||
| Operating income (loss) | (282,664 | ) | 277,342 | (1,834,614 | ) | (508,411 | ) | |||||||||
| Other (expense) income: | ||||||||||||||||
| Other (expense) income, net | 13,621 | (55,319 | ) | 29,018 | (30,146 | ) | ||||||||||
| Interest expense | (1,396 | ) | - | (16,673 | ) | - | ||||||||||
| Total other (expense) income | 12,225 | (55,319 | ) | 12,345 | (30,146 | ) | ||||||||||
| Income (loss) before provision for income taxes | (270,439 | ) | 222,023 | (1,822,269 | ) | (538,557 | ) | |||||||||
| Income taxes | - | - | - | - | ||||||||||||
| Net income (loss) | $ | (270,439 | ) | $ | 222,023 | $ | (1,822,269 | ) | $ | (538,557 | ) | |||||
| Income (loss) per common share – basic and dilutive | $ | (0.00 | ) | $ | 0.00 | $ | (0.01 | ) | $ | (0.00 | ) | |||||
| Weighted average number of common shares outstanding, basic | 236,526,638 | 227,918,377 | 234,711,893 | 227,475,335 | ||||||||||||
| Weighted average number of common shares outstanding, dilutive | 236,526,638 | 237,028,377 | 234,711,893 | 227,475,335 | ||||||||||||
The accompanying notes are an integral part of these condensed consolidated financial statements.
| 2 |
Condensed Consolidated Statements of Changes in Shareholders’ Equity (Deficit)
For the Three and Nine Months Ended September 30, 2020 and 2019
(Unaudited)
| Preferred Stock | Common Stock | |||||||||||||||||||||||||||||||
| Number of Shares | Amount | Number of Shares | Number of Shares to be Issued | Amount | Additional Paid in Capital | Accumulated Deficit | Shareholders’ Equity | |||||||||||||||||||||||||
| Balance June 30, 2020 | 42,030,331 | 420 | 236,526,638 | - | 2,366 | 26,058,307 | (27,236,757 | ) | (1,175,664 | ) | ||||||||||||||||||||||
| Fair value of vested stock options granted to employees and directors | - | - | - | - | - | 24,426 | - | 24,426 | ||||||||||||||||||||||||
| Net loss | - | - | - | - | - | - | (270,439 | ) | (270,439 | ) | ||||||||||||||||||||||
| Balance September 30, 2020 | 42,030,331 | $ | 420 | 236,526,638 | - | $ | 2,366 | $ | 26,082,733 | $ | (27,507,196 | ) | $ | (1,421,677 | ) | |||||||||||||||||
| Preferred Stock | Common Stock | |||||||||||||||||||||||||||||||
| Number of Shares | Amount | Number of Shares | Number of Shares to be Issued | Amount | Additional Paid in Capital | Accumulated Deficit | Shareholders’ Equity | |||||||||||||||||||||||||
| Balance December 31, 2019 | 42,030,331 | 420 | 228,216,638 | 1,560,000 | $ | 2,283 | $ | 25,326,593 | $ | (25,684,927 | ) | $ | (355,631 | ) | ||||||||||||||||||
| Common shares issued or to be issued on settlement of restricted stock units and award of stock bonuses | - | - | 8,310,000 | (1,560,000 | ) | 83 | (83 | ) | - | - | ||||||||||||||||||||||
| Fair value of vested restricted stock units awarded to employees | - | - | - | - | - | 25,163 | - | 25,163 | ||||||||||||||||||||||||
| Fair value of vested stock options accrued in 2019 and issued to employees and directors in 2020 | 503,466 | 503,466 | ||||||||||||||||||||||||||||||
| Fair value of vested stock options granted to employees and directors | - | - | - | - | - | 227,594 | - | 227,594 | ||||||||||||||||||||||||
| Net loss | - | - | - | - | - | - | (1,822,269 | ) | (1,822,269 | ) | ||||||||||||||||||||||
| Balance September 30, 2020 | 42,030,331 | $ | 420 | 236,526,638 | - | $ | 2,366 | $ | 26,082,733 | $ | (27,507,196 | ) | $ | (1,421,677 | ) | |||||||||||||||||
| Preferred Stock | Common Stock | |||||||||||||||||||||||||||||||
| Number of Shares | Amount | Number of Shares | Number of Shares to be Issued | Amount | Additional Paid in Capital | Accumulated Deficit | Shareholders’ (Deficit) Equity | |||||||||||||||||||||||||
| Balance June 30, 2019 | 42,030,331 | $ | 420 | 227,656,638 | - | $ | 2,277 | $ | 25,101,010 | $ | (25,106,941 | ) | $ | (3,234 | ) | |||||||||||||||||
| Common shares issued on settlement of restricted stock units and award of stock bonuses | - | - | 560,000 | - | 6 | (6 | ) | - | - | |||||||||||||||||||||||
| Fair value of vested restricted stock units awarded to employees | - | - | - | - | - | 48,427 | - | 48,427 | ||||||||||||||||||||||||
| Fair value of vested stock options granted to employees and consultants | - | - | - | - | - | 57,705 | - | 57,705 | ||||||||||||||||||||||||
| Fair value of vested incentive stock bonuses awarded to employees | - | - | - | - | - | 6,821 | - | 6,821 | ||||||||||||||||||||||||
| Net income | - | - | - | - | - | - | 222,023 | 222,023 | ||||||||||||||||||||||||
| Balance September 30, 2019 | 42,030,331 | $ | 420 | 228,216,638 | - | $ | 2,283 | $ | 25,213,957 | $ | (24,884,918 | ) | $ | 331,742 | ||||||||||||||||||
| Preferred Stock | Common Stock | |||||||||||||||||||||||||||||||
| Number of Shares | Amount | Number of Shares | Number of Shares to be Issued | Amount | Additional Paid in Capital | Accumulated Deficit | Shareholders’ Equity | |||||||||||||||||||||||||
| Balance December 31, 2018 | 42,030,331 | $ | 420 | 224,989,794 | 1,000,000 | $ | 2,250 | $ | 24,538,027 | $ | (24,346,361 | ) | $ | 194,336 | ||||||||||||||||||
| Common shares issued on settlement of restricted stock units and award of stock bonuses, vested restricted stock units canceled | - | - | 2,240,000 | (1,000,000 | ) | 23 | (23 | ) | - | - | ||||||||||||||||||||||
| Common shares issued as compensation for services | - | - | 986,844 | - | 10 | 74,990 | - | 75,000 | ||||||||||||||||||||||||
| Fair value of vested restricted stock units awarded to employees | - | - | - | - | - | 230,796 | - | 230,796 | ||||||||||||||||||||||||
| Fair value of vested stock options granted to employees and consultants | - | - | - | - | - | 332,779 | - | 332,779 | ||||||||||||||||||||||||
| Fair value of vested incentive stock bonuses awarded to employees | - | - | - | - | - | 37,388 | - | 37,388 | ||||||||||||||||||||||||
| Net loss | - | - | - | - | - | - | (538,557 | ) | (538,557 | ) | ||||||||||||||||||||||
| Balance September 30, 2019 | 42,030,331 | $ | 420 | 228,216,638 | - | $ | 2,283 | $ | 25,213,957 | $ | (24,884,918 | ) | $ | 331,742 | ||||||||||||||||||
The accompanying notes are an integral part of these condensed consolidated financial statements.
| 3 |
Condensed Consolidated Statements of Cash Flows
(Unaudited)
For the Nine Months Ended September 30, | ||||||||
| 2020 | 2019 | |||||||
| Cash Flows From Operating Activities: | ||||||||
| Net loss | $ | (1,822,269 | ) | $ | (538,557 | ) | ||
| Adjustments to reconcile net loss to net cash provided by (used in) operating activities: | ||||||||
| Depreciation and intangible asset amortization expense | 90,867 | 129,723 | ||||||
| Share-based compensation | 252,757 | 675,963 | ||||||
| Provision for doubtful accounts | 13,150 | 43,130 | ||||||
| Provision for excess and obsolete inventory | (5,117 | ) | (213,556 | ) | ||||
| Loss on disposal of assets | 4,124 | 115,359 | ||||||
| Changes in operating assets and liabilities: | ||||||||
| Accounts receivable | 27,950 | 60,436 | ||||||
| Inventory | 714,709 | 213,271 | ||||||
| Prepaid expenses and other | (488,007 | ) | (568,031 | ) | ||||
| Operating lease right-of-use asset | 62,350 | - | ||||||
| Accounts payable and accrued liabilities | (397,181 | ) | 213,044 | |||||
| Deferred revenue | 2,044,830 | 1,633,195 | ||||||
| Operating lease liability, net | - | (13,856 | ) | |||||
| Accrued equity compensation | 101,472 | - | ||||||
| Net cash provided by operating activities | 599,635 | 1,750,121 | ||||||
| Cash Flows From Investing Activities | ||||||||
| Purchases of property and equipment | (3,500 | ) | (3,043 | ) | ||||
| Net cash used in investing activities | (3,500 | ) | (3,043 | ) | ||||
| Cash Flows From Financing Activities | ||||||||
| Proceeds from issuance of note payable | 554,000 | - | ||||||
| Net cash provided by financing activities | 554,000 | - | ||||||
| Net increase in cash | 1,150,135 | 1,747,078 | ||||||
| Cash, beginning of period | 922,177 | 253,387 | ||||||
| Cash, end of period | $ | 2,072,312 | $ | 2,000,465 | ||||
| Non-cash investing and financing activities: | ||||||||
| Interest paid | $ | - | $ | - | ||||
| Income taxes paid | $ | - | $ | - | ||||
The accompanying notes are an integral part of these condensed consolidated financial statements.
| 4 |
Notes to Condensed Consolidated Financial Statements
(Unaudited)
Note 1 – General
Description of Business
Surna Inc. (the “Company”) was incorporated in Nevada on October 15, 2009. The Company designs, engineers and sells cultivation technologies for controlled environment agriculture including: (i) liquid-based process cooling systems and other climate control systems, (ii) air handling equipment and systems, (iii) a full-service engineering package for designing and engineering commercial scale thermodynamic systems specific to cannabis cultivation facilities, and (iv) automation and control devices, systems and technologies used for environmental, lighting and climate control. Our customers include commercial, state- and provincial-regulated cannabis growers in the U.S. and Canada as well as other international locations, including those growers building new facilities and those expanding or retrofitting existing facilities. Currently, our revenue stream is derived primarily from supplying our products, services and technologies to commercial indoor and hybrid sealed greenhouse facilities ranging from several thousand to more than 100,000 square feet. Headquartered in Boulder, Colorado, we leverage our experience in this space to bring value-added climate control solutions to our customers that help improve their overall crop quality and yield, optimize energy and water efficiency, and satisfy the evolving state and local codes, permitting and regulatory requirements. Although our customers do, we neither produce nor sell cannabis or its related products.
Impact of the COVID-19 Pandemic on Our Business
The impact of the government and the business economic response to the COVID-19 pandemic has affected demand across the majority of our markets and disrupted work on projects. The COVID-19 pandemic is expected to have continued adverse effects on our sales, project implementation, operating margins, and working capital. As of the date of this filing, uncertainty continues to exist concerning the magnitude and duration of the economic impact of the COVID-19 pandemic.
In response to the COVID-19 pandemic, in late March 2020 the Company downsized operations to preserve cash resources, implementing workforce reductions, reductions of salaried employee compensation (including all executives and the CEO) and reduction of hours worked, cutting costs and focusing its operations on customer-centric sales and project management activities.
Following the receipt of loan funds in April 2020, the Company reinstated all staff who previously had been placed on furlough. Staff receiving salaries of $100,000 per year or less were restored to their full salaries. All executives, including the CEO, had their compensation reduced to the greater of $100,000 per year or 75% of their previous salary level. The Company re-engaged its staff so as to be able to fulfill its current customer contracts and any new sales orders and to continue its marketing and selling efforts. Over the course of the Summer 2020, the Company took further steps to adjust its work force by furloughing several employees, making temporary hourly and salary reduction adjustments, and then, in late September 2020, in light of our then sales efforts, reinstating continuing hourly employees to full-time status and restoring the salaries of continuing salaried employees.
Due to the speed with which the COVID-19 pandemic developed and the resulting uncertainties, including the depth and duration of the disruptions to customers and suppliers, its future effect on our business, on our results of operations, and on our financial condition, we cannot predict the overall effect on our business over the longer term. Despite this uncertainty, we have undertaken various plans to reduce costs so as to mitigate the impact of the COVID-19 pandemic to the best of our ability, although they may not be sufficient in the long-run for us to avoid reduced sales, increased losses and reduced operating cash flows.
Refer to Risk Factors, included in Part II, Item 1A of this Quarterly Report on Form 10-Q below, for further discussion of the possible impact of the COVID-19 pandemic on our business.
| 5 |
Surna Inc.
Notes to Condensed Consolidated Financial Statements
(Unaudited)
Financial Statement Presentation
The accompanying unaudited condensed consolidated financial statements of the Company have been prepared in conformity with accounting principles generally accepted in the United States of America (“GAAP”) for interim financial information and with the instructions to Form 10-Q and Rule 10-01 of Regulation S-X. Pursuant to these rules and regulations, certain information and note disclosures, normally included in financial statements prepared in accordance with GAAP, have been condensed or omitted. In the opinion of management, all adjustments (consisting of normal recurring items) considered necessary for a fair presentation have been included. Operating results for the nine months ended September 30, 2020 are not necessarily indicative of the results that may be expected for the fiscal year ending December 31, 2020. The balance sheet as of December 31, 2019 has been derived from the audited financial statements at that date but does not include all the information and footnotes required by GAAP for complete financial statements. For further information, refer to the consolidated financial statements and notes thereto contained in the Annual Report on Form 10-K for the year ended December 31, 2019. The notes to the unaudited condensed consolidated financial statements are presented on a going concern basis.
Basis of Consolidation
The condensed consolidated financial statements include the accounts of the Company and its controlled and wholly owned subsidiary, Hydro Innovations, LLC (“Hydro”). Intercompany transactions, profit, and balances are eliminated in consolidation.
Going Concern
The accompanying condensed consolidated financial statements have been prepared assuming that the Company will continue as a going concern, which contemplates the realization of assets and the satisfaction of liabilities in the normal course of business. The Company has experienced recurring losses since its inception. Since inception, the Company has financed its activities principally through debt and equity financing, customer deposits and revenues from completed contracts. Management expects to incur additional losses and cash outflows in the foreseeable future in connection with its operating activities. Management believes that the economic dislocations in the overall economy, in the near term, will adversely impact our revenues, losses and cash flows. There can be no assurance that the Company will be able to raise debt or equity financing in sufficient amounts, when and if needed, on acceptable terms or at all. If results of operations for 2020 do not meet management’s expectations, or additional capital is not available, management believes it has the ability to reduce certain expenditures, although these reductions may not be sufficient to be able to continue the Company’s operations. The precise amount and timing of the funding needs cannot be determined accurately at this time, and will depend on a number of factors, including the overall economy, market demand for the Company’s products and services, the quality of product development efforts, management of working capital, and continuation of normal payment terms and conditions for purchase of the Company’s products. The Company believes its cash balances and cash flow from operations will be insufficient to fund its operations for the next 12 months. If the Company is unable to substantially increase revenues, reduce expenditures, or otherwise generate cash flows from operations, then the Company will need to raise additional funding to continue as a going concern. The foregoing factors raise substantial doubt about the Company’s ability to continue as a going concern for a period of one year from the date the financial statements are issued. These condensed consolidated financial statements do not include any adjustment that might result from the outcome of this uncertainty.
Use of Estimates
Management makes estimates and assumptions that affect the reported amounts of assets and liabilities and the disclosure of contingent assets and liabilities at the date of the financial statements and that affect the reported amounts of revenue and expenses during the reporting period. The Company bases its estimates on historical experience and on various other assumptions that it believes to be reasonable under the circumstances, the results of which form the basis for making judgments about the carrying values of assets and liabilities that are not readily apparent from other sources. Actual results could differ from those estimates. Key estimates include: allocation of transaction prices to performance obligations under contracts with customers, standalone selling prices, timing of expected revenue recognition on remaining performance obligations under contracts with customers, valuation of intangible assets, valuation of equity-based compensation, valuation of deferred tax assets and liabilities, warranty accruals, accounts receivable and inventory allowances, and legal contingencies.
| 6 |
Surna Inc.
Notes to Condensed Consolidated Financial Statements
(Unaudited)
Income (Loss) Per Common Share
Basic income (loss) per common share is computed by dividing net income (loss) attributable to common stockholders by the weighted-average number of common shares outstanding during the period without consideration of common stock equivalents. Diluted net income (loss) per common share is computed by dividing net income (loss) by the weighted-average number of common shares outstanding and potentially dilutive common stock equivalents, including stock options, warrants and restricted stock units and other equity-based awards, except in cases where the effect of the common stock equivalents would be antidilutive. Potential common stock equivalents consist of common stock issuable upon exercise of stock options and warrants and the vesting of restricted stock units using the treasury method.
During the three and nine months ended September 30, 2020 and 2019, there were warrants and options outstanding to purchase Company common stock and restricted stock units that were convertible into shares of the Company’s common stock. During the three month period ended September 30, 2020 and the nine month periods ended September 30, 2020 and 2019, the Company incurred a net loss and consequently the common share equivalents of these potentially dilutive equity instruments have not been included in the calculations of loss per share because such inclusion would have been anti-dilutive. As of September 30, 2020, and 2019, there were respectively, 44,007,500 and 61,054,000, potentially dilutive equity instruments outstanding in respect of warrants and options outstanding to purchase Company common stock and restricted stock units that were convertible into shares of the Company’s common stock.
Goodwill
The Company recorded goodwill in connection with its acquisition of Hydro Innovations, LLC in July 2014. Goodwill is reviewed for impairment annually or more frequently when events or changes in circumstances indicate that fair value of the reporting unit has been reduced to less than its carrying value. The Company performs a quantitative impairment test annually on December 31 by comparing the fair value of the reporting unit with its carrying amount, including goodwill. If the fair value of the reporting unit exceeds its carrying amount, goodwill is considered not impaired. An impairment charge would be recognized for the amount by which the carrying amount exceeds the reporting unit’s fair value. The Company determined that it has one reporting unit.
During the nine months ended September 30, 2020, the Company concluded that the projected impact of the COVID-19 pandemic on its sales, contract completion and revenues in the near term, together with the volatility in its share price represented potential indicators of impairment. Accordingly, the Company performed an interim impairment analysis at September 30, 2020, and concluded that no impairment relating to goodwill existed at September 30, 2020.
Revenue Recognition
On January 1, 2018, the Company adopted Accounting Standards Update (“ASU”) 2014-09 (Topic 606), Revenue from Contracts with Customers and all the related amendments (“ASC 606” or the “revenue standard”) to all contracts and elected the modified retrospective method.
Under the revenue standard, a performance obligation is a promise in a contract with a customer to transfer a distinct good or service to the customer. Most of the Company’s contracts contain multiple performance obligations that include engineering and technical services as well as the delivery of a diverse range of climate control system equipment and components, which can span multiple phases of a customer’s project life-cycle from facility design and construction to equipment delivery and system installation and start-up.
A contract’s transaction price is allocated to each distinct performance obligation and recognized as revenue when, or as, the performance obligation is satisfied. When there are multiple performance obligations within a contract, the Company allocates the transaction price to each performance obligation based on standalone selling price. When estimating the selling price, the Company uses various observable inputs. The best observable input is the Company’s actual selling price for the same good or service, however, this input is generally not available for the Company’s contracts containing multiple performance obligations. For engineering services, the Company estimates the standalone selling price by reference to certain physical characteristics of the project, such as facility size and mechanical systems involved, which are indicative of the scope and complexity of the mechanical engineering services to be provided. For equipment sales, the standalone selling price is determined by forecasting the expected costs of the equipment and then adding an appropriate margin, based on a range of acceptable margins established by management. Depending on the nature of the performance obligations, the Company may use a combination of different methods and observable inputs if certain performance obligations have highly variable or uncertain standalone selling prices. Once the selling prices are determined, the Company applies the relative values to the total contract consideration and estimates the amount of the transaction price to be recognized as each performance obligation is fulfilled.
| 7 |
Surna Inc.
Notes to Condensed Consolidated Financial Statements
(Unaudited)
The Company recognizes revenue for the sale of goods when control transfers to the customer, which primarily occurs at the time of shipment. The Company’s historical rates of return are insignificant as a percentage of sales and, as a result, the Company does not record a reserve for returns at the time the Company recognizes revenue. The Company has elected to exclude from the measurement of the transaction price all taxes (e.g., sales, use, value added, and certain excise taxes) that are assessed by a governmental authority in connection with a specific revenue-producing transaction and collected by the Company from the customer. Accordingly, the Company recognizes revenue net of sales taxes. The revenue and cost for freight and shipping is recorded when control over the sale of goods passes to the Company’s customers.
The Company also has performance obligations to perform certain engineering services that are satisfied over a period of time. Revenue is recognized from this type of performance obligation as services are rendered based on the percentage completion towards certain specified milestones.
The Company offers assurance-type warranties for its products and products manufactured by others to meet specifications defined by the contracts with customers and does not have any material separate performance obligations related to these warranties. The Company maintains a warranty reserve based on historical warranty costs.
Applying the practical expedient in ASC 606-10-32-18, which the Company has elected, the Company does not adjust the promised amount of consideration for the effects of a significant financing component since the Company expects, at contract inception, that the period between when the Company transfers a promised good or service to a customer and when the customer pays for that good or service will be one year or less. Accordingly, the remaining performance obligations related to customer contracts does not consider the effects of the time value of money.
Applying the practical expedient in ASC 340-40-25-4, the Company recognizes the incremental costs of obtaining contracts as an expense when incurred since the amortization period of the assets that the Company otherwise would have recognized is one year or less. These costs include certain sales commissions and incentives, which are included in selling, general and administrative expenses, and are payable only when associated revenue has been collected and earned by the Company.
The Company does not have material amounts of contract assets since revenue is recognized as control of goods is transferred or as services are performed. Contract liabilities consist of advance payments and deferred revenue.
For the three and nine months ended September 30, 2020, the Company recognized revenue of $9,141 and $1,074,016, respectively, related to the deferred revenue at January 1, 2020. For the three and nine months ended September 30, 2019, the Company recognized revenue of $3,242 and $473,682, respectively, related to the deferred revenue at January 1, 2019.
Remaining performance obligations, or backlog, represents the aggregate amount of the transaction price allocated to the remaining obligations that the Company has not performed under its customer contracts. The Company has elected not to use the optional exemption in ASC 606-10-50-14, which exempts an entity from such disclosures if a performance obligation is part of a contract with an original expected duration of one year or less. Accordingly, the information disclosed about remaining performance obligations includes all customer contracts, including those with an expected duration of one year or less.
| 8 |
Surna Inc.
Notes to Condensed Consolidated Financial Statements
(Unaudited)
Industry uncertainty, project financing concerns, and the licensing and qualification of our prospective customers, which are out of the Company’s control, make it difficult for the Company to predict when it will recognize revenue on its remaining performance obligations. There are risks that the Company may not realize the full contract value on customer projects in a timely manner or at all, and completion of a customer’s cultivation facility project is dependent upon the customer’s ability to secure funding and real estate, obtain a license and then build their cultivation facility so they can take possession of the equipment. Accordingly, the time it takes for customers to complete a project, which corresponds to when the Company is able to recognize revenue, is driven by numerous factors including: (i) the large number of first-time participants interested in the indoor cannabis cultivation business; (ii) the complexities and uncertainties involved in obtaining state and local licensure and permitting; (iii) local and state government delays in approving licenses and permits due to lack of staff or the large number of pending applications, especially in states where there is no cap on the number of cultivators; (iv) the customer’s need to obtain cultivation facility financing; (v) the time needed, and coordination required, for our customers to acquire real estate and properly design and build the facility (to the stage when climate control systems can be installed); (vi) the large price tag and technical complexities of the climate control and air sanitation system; (vii) the availability of power; and (viii) delays that are typical in completing any construction project.
As of September 30, 2020, the Company’s remaining performance obligations, or backlog, was $8,198,000, of which $2,870,000, or 35%, was attributable to customer contracts for which the Company has only received an initial advance payment to cover the allocated value of the Company’s engineering services (“engineering only paid contracts”). There is the risk that the equipment portion of these engineering only paid contracts will not be completed or will be delayed. The reasons include the customer being dissatisfied with the quality or timeliness of the Company’s engineering services, delay or abandonment of the project because of the customer’s inability to obtain project financing or licensing, or other reasons such as a challenging business climate including an overall post-COVID-19 economic downturn, or change in business direction. After the customer has made an advance payment for a portion of the equipment to be delivered under the contract (“partial equipment paid contracts”), the Company is typically better able to estimate the timing of revenue recognition since the risks and delays associated with licensing, permitting and project funding are typically mitigated once the initial equipment payment is received. There is significant uncertainty regarding the timing of the Company’s recognition of revenue on its remaining performance obligations, and there is no certainty that these will result in actual revenues. The backlog at September 30, 2020, includes booked sales orders of $673,000 from several customers that the Company does not expect to be realized until 2022, if at all. Given the present economic uncertainty arising from the impact of the novel coronavirus COVID-19, the Company believes that several of its current contracts may be delayed or canceled.
The remaining performance obligations expected to be recognized through 2022 are as follows:
| 2020 | 2021 | 2022 | Total | |||||||||||||
| Remaining performance obligations related to engineering only paid contracts | $ | 24,000 | $ | 2,287,000 | $ | 559,000 | $ | 2,870,000 | ||||||||
| Remaining performance obligations related to partial equipment paid contracts | 3,453,000 | 1,761,000 | 114,000 | $ | 5,328,000 | |||||||||||
| Total remaining performance obligations | $ | 3,477,000 | $ | 4,048,000 | $ | 673,000 | $ | 8,198,000 | ||||||||
The following table sets forth the Company’s revenue by source:
| For the Three Months Ended September 30, | For the Nine Months Ended September 30, | |||||||||||||||
| 2020 | 2019 | 2020 | 2019 | |||||||||||||
| Equipment and systems sales | $ | 1,481,961 | $ | 5,103,984 | $ | 4,575,855 | $ | 10,344,788 | ||||||||
| Engineering and other services | 114,160 | 355,475 | 402,837 | 951,270 | ||||||||||||
| Shipping and handling | 38,548 | 64,646 | 148,326 | 209,670 | ||||||||||||
| Total revenue | $ | 1,634,669 | $ | 5,524,105 | $ | 5,127,018 | $ | 11,505,728 | ||||||||
| 9 |
Surna Inc.
Notes to Condensed Consolidated Financial Statements
(Unaudited)
Accounting for Share-Based Compensation
The Company recognizes the cost resulting from all share-based compensation arrangements, including stock options, restricted stock awards and restricted stock units that the Company grants under its equity incentive plan in its condensed consolidated financial statements based on their grant date fair value. The expense is recognized over the requisite service period or performance period of the award. Awards with a graded vesting period based on service are expensed on a straight-line basis for the entire award. Awards with performance-based vesting conditions, which require the achievement of a specific company financial performance goal at the end of the performance period and required service period, are recognized over the performance period. Each reporting period, the Company reassesses the probability of achieving the respective performance goal. If the goals are not expected to be met, no compensation cost is recognized and any previously recognized amount recorded is reversed. If the award contains market-based vesting conditions, the compensation cost is based on the grant date fair value and expected achievement of market condition and is not subsequently reversed if it is later determined that the condition is not likely to be met or is expected to be lower than initially expected.
The grant date fair value of stock options is based on the Black-Scholes Option Pricing Model (the “Black-Scholes Model”). The Black-Scholes Model requires judgmental assumptions including volatility and expected term, both based on historical experience. The risk-free interest rate is based on U.S. Treasury interest rates whose term is consistent with the expected term of the option. The Company determines the assumptions used in the valuation of option awards as of the date of grant. Differences in the expected stock price volatility, expected term or risk-free interest rate may necessitate distinct valuation assumptions at those grant dates. As such, the Company may use different assumptions for options granted throughout the year. During the nine months ended September 30, 2020, the valuation assumptions used to determine the fair value of each option award on the date of grant were: expected stock price volatility ranged from 121.64% to 122.48%; expected term in years 5 and risk-free interest rate ranged from .2% to 1.67%.
The grant date fair value of restricted stock and restricted stock units is based on the closing price of the underlying stock on the date of the grant.
The Company has elected to reduce share-based compensation expense for forfeitures as the forfeitures occur since the Company does not have historical data or other factors to appropriately estimate the expected employee terminations and to evaluate whether particular groups of employees have significantly different forfeiture expectations.
In June 2018, the Financial Accounting Standards Board (“FASB”) adopted ASU 2018-07, Compensation — Stock Compensation (Topic 718) — Improvements to Nonemployee Share-Based Payment Accounting, which expanded the scope of Topic 718 to include all share-based payment transactions for acquiring goods and services from nonemployees. ASU 2018-07 specifies that Topic 718 applies to all share-based payment transactions in which the grantor acquires goods and services to be used or consumed in its own operations by issuing share-based payment awards. ASU 2018-07 also clarifies that Topic 718 does not apply to share-based payments used to effectively provide (1) financing to the issuer, or (2) awards granted in conjunction with selling goods or services to customers as part of a contract accounted for under ASC 606. ASU 2018-07 is effective for the Company’s fiscal year beginning January 1, 2019. While the Company grants stock options to nonemployees, the adoption of ASU 2018-07 has not had a material impact on its consolidated results of operations, cash flows and financial position.
| 10 |
Surna Inc.
Notes to Condensed Consolidated Financial Statements
(Unaudited)
The following is a summary of share-based compensation expenses included in the condensed consolidated statements of operations for the three and nine months ended September 30, 2020 and 2019:
| For the Three Months Ended September 30, | For the Nine Months Ended September 30, | |||||||||||||||
| 2020 | 2019 | 2020 | 2019 | |||||||||||||
| Share-based compensation expense included in: | ||||||||||||||||
| Cost of revenue | $ | 6,833 | $ | 2,801 | $ | 23,949 | $ | 7,964 | ||||||||
| Advertising and marketing expenses | 2,500 | 840 | 7,500 | 2,520 | ||||||||||||
| Product development costs | 5,444 | 420 | 16,332 | 1,260 | ||||||||||||
| Selling, general and administrative expenses | 41,221 | 108,892 | 306,448 | 664,219 | ||||||||||||
| Total share-based compensation expense included in consolidated statement of operations | $ | 55,998 | $ | 112,953 | $ | 354,229 | $ | 675,963 | ||||||||
Included in the expense for the three and nine months ended September 30, 2020, is an accrual for $31,575 and $101,472, respectively, in respect of the 2020 Annual Employee Incentive Compensation Plan.
Concentrations
Two customers accounted for 39% and 30% of the Company’s revenue for the three months ended September 30, 2020 and three customers accounted for 18%, 17% and 11% of the Company’s revenue for the nine months ended September 30, 2020. One customer accounted for 70% and 57% of the Company’s revenue for the three and nine months ended September 30, 2019, respectively.
Four customers accounted for 32%, 23%, 21% and 10% of the Company’s accounts receivable for the nine months ended September 30, 2020. For the nine months ended September 30, 2019, three customers accounted for 50%, 19% and 12% of the Company’s accounts receivable.
Recently Issued Accounting Pronouncements
In March 2020, the FAS issued ASU No. 2020-04 “Reference Reform (Topic 848) Facilitation of the Effects of Reference Rate Reform on Financial Reporting” (“ASU 2020-04”). ASU 2020-04 provides optional guidance for a limited period of time to ease the potential burden in accounting for (or recognizing the effects of) reference rate reform on financial reporting. The amendments are effective for the Company as of March 12, 2020 through December 31, 2022. The Company does not expect this ASU to have a material impact on its consolidated results of operations, cash flows and financial position.
In January 2020, the FASB issued ASU No. 2020-01, Investments—Equity Securities (Topic 321), Investments—Equity Method and Joint Ventures (Topic 323), and Derivatives and Hedging (Topic 815)—Clarifying the Interactions between Topic 321, Topic 323, and Topic 815 (a consensus of the Emerging Issues Task Force). This update clarifies whether an entity should consider observable transactions that require it to either apply or discontinue the equity method of accounting for the purposes of applying the measurement alternative and how to account for certain forward contracts and purchased options to purchase securities. For public entities, this guidance is effective for fiscal years beginning after December 15, 2020. The Company does not expect this ASU to have a material impact on its consolidated results of operations, cash flows and financial position.
In December 2019, the FASB issued ASU 2019-12, Income Taxes (Topic 740) – Simplifying the Accounting for Income Taxes, which simplifies the accounting for income taxes by removing certain exceptions to the general principles in Topic 740. The amendments also improve consistent application of and simplify GAAP for other areas of Topic 740 by clarifying and amending existing guidance. ASU 2019-12 is effective for fiscal years beginning after December 15, 2020. Early adoption is permitted. The Company does not expect this ASU to have a material impact on its consolidated results of operations, cash flows and financial position.
In August 2018, the FASB issued ASU 2018-13, Fair Value Measurement (Topic 820) – Disclosure Framework – Changes to the Disclosure Requirements for Fair Value Measurement, which modifies the disclosure requirements on fair value measurements in Topic 820. The amendment will be effective for reporting periods beginning after December 15, 2019, and early adoption is permitted. The adoption of this ASU has not had a material impact on the Company’s consolidated results of operations, cash flows and financial position.
| 11 |
Surna Inc.
Notes to Condensed Consolidated Financial Statements
(Unaudited)
In June 2016, the FASB issued ASU 2016-13, Financial Instruments – Credit Losses (Topic 326): Measurement of Credit Losses on Financial Instruments. ASU 2016-13 replaces the incurred loss impairment methodology with a methodology that reflects expected credit losses and requires consideration of a broader range of reasonable and supportable information to inform credit loss estimates. For trade and other receivables, loans and other financial instruments, the Company will be required to use a forward-looking expected loss model rather than the incurred loss model for recognizing credit losses which reflects losses that are probable. In November 2018, the FASB issued ASU 2018-19, Codification Improvements to Topic 326, Financial Instruments – Credit Losses, which clarifies that receivables arising from operating leases are not within the scope of Subtopic 326-20, but, instead, the impairment of receivables arising from operating leases are accounted for in accordance with Topic 842, Leases. In November 2019, the FASB issued ASU 2019-11, Codification Improvements to Topic 326, Financial Instruments – Credit Losses, to clarify, correct errors in, or improve the codification of Topic 326 and make the codification easier to understand and easier to apply by eliminating inconsistencies and providing clarifications. ASU 2016-13 is effective for fiscal years beginning after December 15, 2019. Entities may early adopt the amendments within this ASU but not prior to the fiscal years beginning after December 15, 2018. The adoption of this ASU has not had a material impact on the Company’s consolidated results of operations, cash flows and financial position.
Other accounting standards that have been issued or proposed by FASB that do not require adoption until a future date are not expected to have a material impact on the financial statements upon adoption. The Company does not discuss recent pronouncements that are not anticipated to have an impact on or are unrelated to its financial condition, results of operations, cash flows or disclosures.
Note 2 – Leases
In February 2016 the FASB issued ASU 2016-02, Leases (Topic 842)(“ASC 842” or the “new lease standard”). The Company adopted ASC 842 as of January 1, 2019, using the effective date method.
The new standard provides a number of optional practical expedients in transition. The Company has elected to apply the “package of practical expedients” which allow the Company to not reassess: (i) whether existing or expired arrangements contain a lease, (ii) the lease classification of existing or expired leases, or (iii) whether previous initial direct costs would qualify for capitalization under the new lease standard. The Company has also elected to apply the short-term lease exemption for all leases with an original term of less than 12 months, for purposes of applying the recognition and measurements requirements in the new lease standard.
Upon adoption, the Company recognized its lease for manufacturing and office space (the “Facility Lease”) on the balance sheet as an operating lease right-of-use asset in the amount of $714,416 and as a lease liability of $822,374. The Facility Lease commenced September 29, 2017 and continues through August 31, 2022. The Company has the option to renew the Facility Lease for an additional five years. However, the renewal option to extend the Facility Lease is not included in the right-of-use asset or lease liability as the option is not reasonably certain of exercise. The Company regularly evaluates the renewal option and when it is reasonably certain of exercise, the Company will include the renewal period in its lease term.
Beginning September 1, 2018, and each subsequent September 1 during the term, the monthly rent under the Facility Lease will increase by 3%. Total rent under the current building lease is charged to expense over the term of the lease on a straight-line basis, resulting in the same monthly rent expense throughout the lease. The difference between the rent expense amount and the actual rent paid is recorded to operating lease liability on the Company’s condensed consolidated balance sheets.
Under the Facility Lease, the landlord agreed to pay the Company or the Company’s contractors for tenant improvements made by the Company not to exceed $100,000, which were used for normal tenant improvements. The Company determined that these improvements were not specialized and could be utilized by a subsequent tenant and, as such, the improvements were considered assets of the lessor. As of January 1, 2019, the unamortized amount of tenant improvement allowance of $81,481 was treated as a reduction in measuring the right-of-use asset.
| 12 |
Surna Inc.
Notes to Condensed Consolidated Financial Statements
(Unaudited)
Under the Facility Lease, the Company pays the actual amounts for property taxes and insurance, excludes such payments from lease contract consideration, and records such payments as incurred. The Company also pays the landlord for common area maintenance, which is considered a non-lease component. For the Facility Lease, the Company has not elected the accounting policy to include both the lease and non-lease components as a single component and account for it as the lease.
In determining the right-of-use asset and lease liability, the Company applied a discount rate to the minimum lease payments under the Facility Lease. ASC 842 requires the Company to use the rate of interest that the Company would have to pay to borrow on a collateralized basis over a similar term an amount equal to the lease payments in a similar economic environment. Since the discount rate is not implicit in the lease agreement, we utilized an estimated incremental borrowing rate provided by the Company’s depository bank.
The lease cost, cash flows and other information related to the Facility Lease were as follows:
| For the Nine Months Ended September 30, | ||||
| 2020 | ||||
| Operating lease cost | $ | 162,667 | ||
| Operating cash outflow from operating lease | $ | 98,716 | ||
| As of September 30, 2020 | ||||
| Operating lease right-of-use assset | $ | 392,263 | ||
| Operating lease liability, current | $ | 253,392 | ||
| Operating lease liability, long-term | $ | 238,139 | ||
| Remaining lease term | 1.9 years | |||
| Discount rate | 5.00 | % | ||
Future annual minimum lease payments on the Facility Lease as of September 30, 2020 were as follows:
| 2020 (excluding the nine months ended September 30, 2020) | $ | 62,218 | ||
| 2021 | 281,864 | |||
| 2022 | 170,891 | |||
| Total minimum lease payments | 514,973 | |||
| Less imputed interest | (23,442 | ) | ||
| Present value of minimum lease payments | $ | 491,531 |
During the nine months ended September 30, 2020, the Company entered into an agreement with its landlord to apply its rent deposit of $52,600 to rent payments due during the period. The deposit required on the lease will be reduced to approximately $32,000 and will be payable in 12 monthly installments from January through December of 2021. Further, the landlord also agreed to defer payment of fifty percent of the three months of lease payments (base rent only) for the period July to September 2020. The deferred lease payments amount to approximately $30,000 and will be payable in 12 monthly installments from January to December 2021.
| 13 |
Surna Inc.
Notes to Condensed Consolidated Financial Statements
(Unaudited)
Note 3 – Inventory
Inventory consisted of the following:
| September 30, | December 31, | |||||||
| 2020 | 2019 | |||||||
| Finished goods | $ | 346,553 | $ | 1,041,369 | ||||
| Work in progress | 5,785 | 3,851 | ||||||
| Raw materials | 235,571 | 257,399 | ||||||
| Allowance for excess & obsolete inventory | (66,259 | ) | (71,376 | ) | ||||
| Inventory, net | $ | 521,650 | $ | 1,231,243 | ||||
Overhead expenses of $19,262 and $31,831 were included in the inventory balance as of September 30, 2020, and December 31, 2019, respectively.
Advance payments on inventory purchases are recorded in prepaid expenses until title for such inventory passes to the Company. Prepaid expenses included approximately $681,000 and $164,000 in advance payments for inventory for the periods ended September 30, 2020, and December 31, 2019, respectively.
Note 4 – Property and Equipment
Property and equipment consisted of the following:
| September 30, | December 31, | |||||||
| 2020 | 2019 | |||||||
| Furniture and equipment | $ | 398,422 | $ | 389,090 | ||||
| Vehicles | 15,000 | 15,000 | ||||||
| Leasehold improvements | 215,193 | 215,193 | ||||||
| 628,615 | 619,283 | |||||||
| Accumulated depreciation | (451,792 | ) | (361,360 | ) | ||||
| Property and equipment, net | $ | 176,823 | $ | 257,923 | ||||
Depreciation expense was $90,432 and $110,254 for the nine months ended September 30, 2020, and December 31, 2019, respectively. For the nine months ended September 30, 2020, $4,118 was allocated to cost of sales and $1,029 was allocated to inventory with the remainder recorded as selling, general and administrative expense. For the nine months ended December 31, 2019, $4,206 was allocated to cost of sales and $1,051 was allocated to inventory with the remainder recorded as selling, general and administrative expense.
| 14 |
Surna Inc.
Notes to Condensed Consolidated Financial Statements
(Unaudited)
Note 5 – Accounts Payable and Accrued Liabilities
Accounts payable and accrued liabilities consisted of the following:
| September 30, | December 31, | |||||||
| 2020 | 2019 | |||||||
| Accounts payable | $ | 697,847 | $ | 1,299,015 | ||||
| Sales commissions payable | 33,523 | 69,532 | ||||||
| Accrued payroll liabilities | 424,890 | 169,052 | ||||||
| Product warranty accrual | 181,401 | 185,234 | ||||||
| Other accrued expenses | 60,109 | 110,127 | ||||||
| Total | $ | 1,397,770 | $ | 1,832,959 | ||||
Note 6 – Note Payable and Accrued Interest
On April 22, 2020, the Company entered into a note payable with its current bank in the principal amount of $554,000, for working capital purposes.
The loan amount bears interest at 1% and was initially due on April 20, 2022. Subsequently, the term of the loan may now potentially be extended to April 20, 2025. The loan may be repaid in advance without penalty. The loan is also potentially forgivable in full provided proceeds are used for payment of payroll expenses, rent, utilities and mortgage interest and certain other terms and conditions are met. The loan has typical default provisions, including for change of ownership, general lender insecurity as to repayment, non-payment of amounts due, defaults on other debt instruments, insolvency, dissolution or termination of the business as a going concern and bankruptcy.
During the three and nine months ended September 30, 2020, interest of $1,397 and $2,444 was accrued respectively, in respect of this note payable.
Note 7 – Commitments and Contingencies
Litigation
As of December 31, 2019, there were 6,750,000 restricted stock units that had not been settled due to a dispute with a former employee over the required withholding taxes to be paid to the Company for remittance to the appropriate tax authorities. The Company commenced an arbitration action against the former employee regarding the dispute. The former employee also made claims in the arbitration action against the Company for unpaid wages. As stated in a pleading in the arbitration, on March 9, 2020, the Company issued the former employee 6,750,000 shares of the Company’s common stock in settlement of these restricted stock units after taking measures to mitigate the Company’s exposure to penalties and liability for the failure to properly withhold income taxes The Arbitrator issued an interim award of approximately $10,000 in the Company’s favor and a finding against the former employee. Effective June 9, 2020, the Arbitrator issued his final award in the Company’s favor in the Colorado arbitration. The Arbitrator found against the former employee and awarded the Company costs of $33,985, with interest at 8% per year. Effective July 22, 2020, the Colorado Court confirmed the Arbitration award and entered a final judgement in favor of the Company and against the former employee. The Company is pursuing collection of this debt. This former employee continues to pursue separate litigation against the Company for recovery of alleged consulting fees owed to him for the 2015 calendar year prior to his appointment as an executive officer of the Company and discovery is ongoing in this case and the parties have filed dispositive motions that they are in the process of briefing.
From time to time, in the normal course of its operations, the Company is subject to litigation matters and claims. Litigation can be expensive and disruptive to normal business operations. Moreover, the results of complex legal proceedings are difficult to predict, and the Company’s view of these matters may change in the future as the litigation and events related thereto unfold. The Company expenses legal fees as incurred. The Company records a liability for contingent losses when it is both probable that a liability has been incurred and the amount of the loss can be reasonably estimated. An unfavorable outcome to any legal matter, if material, could have an adverse effect on the Company’s operations or its financial position, liquidity or results of operations.
| 15 |
Surna Inc.
Notes to Condensed Consolidated Financial Statements
(Unaudited)
Leases
The Company has a lease agreement for its manufacturing and office space. See Note 2.
Other Commitments
In the ordinary course of business, the Company enters into commitments to purchase inventory and may also provide indemnifications of varying scope and terms to customers, vendors, lessors, business partners, and other parties with respect to certain matters, including, but not limited to, losses arising out of the Company’s breach of such agreements, services to be provided by the Company, or from intellectual property infringement claims made by third parties. In addition, the Company has entered into indemnification agreements with its directors and certain of its officers and employees that will require the Company to, among other things, indemnify them against certain liabilities that may arise by reason of their status or service as directors, officers, or employees. The Company maintains director and officer insurance, which may cover certain liabilities arising from its obligation to indemnify its directors and certain of its officers and employees, and former officers, directors, and employees of acquired companies, in certain circumstances.
Note 8 – Equity Incentive Plan
Under the Company’s 2017 Equity Incentive Plan, as may be modified and amended by the Company from time to time (the “2017 Equity Plan”), the Board of Directors (the “Board”) (or the compensation committee of the Board, if one is established) may award stock options, stock appreciation rights (“SARs”), restricted stock awards (“RSAs”), restricted stock unit awards (“RSUs”), shares granted as a bonus or in lieu of another award, and other stock-based performance awards. The 2017 Equity Plan allocates 50,000,000 shares of the Company’s common stock (“Plan Shares”) for issuance of equity awards under the 2017 Equity Plan. If any shares subject to an award are forfeited, expire, or otherwise terminate without issuance of such shares, the shares will, to the extent of such forfeiture, expiration, or termination, again be available for awards under the 2017 Equity Plan.
During the nine months ended September 30, 2020, the Company issued shares of its common stock under the 2017 Equity Plan as follows:
| ● | 1,000,000 shares to an employee in settlement of certain RSUs that vested December 31, 2019; | |
| ● | 560,000 shares pursuant to a special incentive stock bonus approved by the Board for the period ended December 31, 2019; and | |
| ● | 6,750,000 shares in settlement of restricted stock units to a former employee after taking measures to mitigate the Company’s exposure to penalties and liability for the failure to properly withhold income taxes.as further discussed in Note 7 – Commitments and Contingencies, Litigation above. |
As of September 30, 2020, awards related to 21,711,000 shares remain outstanding.
The total unrecognized compensation expense for unvested non-qualified stock options at September 30, 2020, was $30,839, which will be recognized over approximately 6 months.
| 16 |
Surna Inc.
Notes to Condensed Consolidated Financial Statements
(Unaudited)
Non-Qualified Stock Options
A summary of the non-qualified stock options granted to employees and consultants under the 2017 Equity Plan during the nine months ended September 30, 2020, are presented in the table below:
| Number of Options | Weighted Average Exercise Price | Weighted Average Remaining Contractual Term | Aggregate Intrinsic Value | |||||||||||||
| Outstanding, December 31, 2019 | 10,135,000 | $ | 0.096 | 7.7 | $ | - | ||||||||||
| Granted | 6,616,900 | $ | 0.070 | 10.0 | ||||||||||||
| Exercised | - | |||||||||||||||
| Forfeited | - | |||||||||||||||
| Expired | (2,440,900 | ) | $ | 0.100 | 4.4 | |||||||||||
| Outstanding, September 30, 2020 | 14,311,000 | $ | 0.084 | 8.5 | $ | - | ||||||||||
| Exercisable, September 30, 2020 | 12,311,000 | $ | 0.083 | 8.5 | $ | - | ||||||||||
| Outstanding vested and expected to vest, September 30, 2020 | 14,311,000 | $ | 0.084 | 8.5 | $ | - | ||||||||||
During the three and nine months ended September 30, 2020, 1,812,100 and 2,440,900 non-qualified stock options expired unexercised, respectively, following the departure of seven former employees.
A summary of non-vested non-qualified stock options activity for employees and consultants under the 2017 Equity Plan for the nine months ended September 30, 2020, are presented in the table below:
| Number of Options | Weighted Average Grant-Date Fair Value | Aggregate Intrinsic Value | Grant-Date Fair Value | |||||||||||||
| Nonvested, December 31, 2019 | 2,000,000 | $ | 0.075 | $ | - | $ | 149,534 | |||||||||
| Granted | 6,616,900 | $ | 0.059 | $ | 387,199 | |||||||||||
| Vested | (6,616,900 | ) | $ | 0.059 | $ | 387,199 | ||||||||||
| Forfeited | - | $ | - | |||||||||||||
| Expired | - | $ | - | |||||||||||||
| Nonvested, September 30, 2020 | 2,000,000 | $ | 0.075 | $ | - | $ | 149,534 | |||||||||
For the nine months ended September 30, 2020 and 2019, the Company recorded $171,624 and $332,779 as compensation expense related to vested options issued to employees and consultants, net of forfeitures, respectively.
During the nine months ended September 30, 2020, the Company issued 6,616,900 stock options to employees and consultants valued at $269,340 in respect of the 2019 annual equity incentive award that had been accrued for in full in the Company’s financial statements at December 31, 2019.
A summary of the non-qualified stock options granted to directors under the 2017 Equity Plan during the nine months ended September 30, 2020, are presented in the table below:
| Number of Options | Weighted Average Exercise Price | Weighted Average Remaining Contractual Term | Aggregate Intrinsic Value ($000) | |||||||||||||
| Outstanding, December 31, 2019 | 900,000 | $ | 0.135 | 7.6 | $ | - | ||||||||||
| Granted | 6,500,000 | $ | 0.057 | 8.5 | ||||||||||||
| Exercised | - | - | ||||||||||||||
| Forfeited/Cancelled | - | - | ||||||||||||||
| Expired | - | - | ||||||||||||||
| Outstanding, September 30, 2020 | 7,400,000 | $ | 0.067 | 7.7 | $ | - | ||||||||||
| Exerciseable, September 30, 2020 | 6,400,000 | $ | 0.070 | 8.0 | $ | - | ||||||||||
| 17 |
Surna Inc.
Notes to Condensed Consolidated Financial Statements
(Unaudited)
A summary of non-vested non-qualified stock options activity for directors under the 2017 Equity Plan for the nine months ended September 30, 2020, are presented in the table below:
| Number of Options | Weighted Average Grant-Date Fair Value | Aggregate Intrinsic Value | Grant-Date Fair Value | |||||||||||
| Nonvested, December 31, 2019 | ||||||||||||||
| Granted | 6,500,000 | 0.057 | $ | 373,000 | ||||||||||
| Vested | (5,500,000 | ) | 0.063 | $ | 344,000 | |||||||||
| Forfeited | - | - | $ | - | ||||||||||
| Expired | - | - | $ | - | ||||||||||
| Nonvested, September 30, 2020 | 1,000,000 | 0.029 | $ | 29,000 | ||||||||||
During the nine months ended September 30, 2020 and 2019, the Company incurred $55,970 and $0, respectively, as compensation expense related to 1,500,000 and 0 vested options, respectively, issued to directors.
Effective January 2, 2020, the Company issued 4,000,000 fully vested stock options to directors valued at $234,126 in respect of a 2019 special equity award that had been accrued for in full in the Company’s financial statements at December 31, 2019.
Further on January 2, 2020, the Company issued an additional 500,000 fully vested, non-qualified stock options under the 2017 Equity Plan valued at $29,266 to directors. The options have a term of 5 years and have an exercise price equal to the closing price of the Company’s common stock on The OTC Markets on the day immediately preceding the grant date of $.0.07.
Effective June 24, 2020, the Company issued 2,000,000 non-qualified stock options under the 2017 Equity Plan, valued at $39,600, to newly appointed directors. The options vested 50% upon grant and 50% on April 1, 2021, if the Director remains on the Board up to that time. The options have a term of 5 years and have an exercise price equal to the closing price of the Company’s common stock on The OTC Markets on the day immediately preceding the grant date of $.029.
Restricted Stock Units
A summary of the RSUs awarded to employees, directors and consultants under the 2017 Equity Plan during the nine months ended September 30, 2020, are presented in the table below:
| Number of Units | Weighted Average Grant-Date Fair Value | Aggregate Intrinsic Value | ||||||||||
| Outstanding, December 31, 2019 | 7,550,000 | $ | 0.128 | $ | - | |||||||
| Granted | - | - | ||||||||||
| Vested and settled with share issuance | (6,750,000 | ) | $ | 0.121 | ||||||||
| Forfeited/canceled | (800,000 | ) | $ | 0.184 | ||||||||
| Outstanding, September 30, 2020 | - | $ | - | |||||||||
For the nine months ended September 30, 2020 and 2019, the Company recorded $25,163 and $230,796, respectively, as compensation expense related to vested RSUs issued to employees, directors and consultants. The total intrinsic value of RSUs vested and settled with share issuance was $199,125 for the nine months ended September 30, 2020.
Effective April 30, 2020, 800,000 RSUs vested. However, the holder elected to cancel the RSUs.
| 18 |
Surna Inc.
Notes to Condensed Consolidated Financial Statements
(Unaudited)
Note 9 – Warrants
Effective June 18, 2020, 500,000 warrants expired unexercised. The warrants were issued on June 19, 2017 with an exercise price of $0.35.
The following table summarizes information with respect to outstanding warrants to purchase common stock during the nine months ended September 30, 2020:
| Weighted | Weighted | |||||||||||||||
| Average | Average | Aggregate | ||||||||||||||
| Warrants | Exercise | Remaining Life | Intrincic | |||||||||||||
| Outstanding | Price | In Months | Value | |||||||||||||
| Outstanding at December 31, 2019 | 39,109,000 | $ | 0.24 | 9 | $ | 0 | ||||||||||
| Issued | - | - | - | - | ||||||||||||
| Exercised | - | - | - | - | ||||||||||||
| Expired | (16,812,500 | ) | $ | (0.26 | ) | - | $ | 0 | ||||||||
| Outstanding at September 30, 2020 | 22,296,500 | $ | 0.22 | 5 | $ | 0 | ||||||||||
The following table summarized information about warrants outstanding at September 30, 2020.
| Weighted Average Life of | ||||||||||
| Warrants | Outstanding Warrants | |||||||||
| Exercise price | Outstanding | In Months | ||||||||
| 0.2 | 14,734,000 | 3 | ||||||||
| 0.25 | 7,562,500 | 9 | ||||||||
| 22,296,500 | 5 | |||||||||
Note 10 – Income Taxes
As of September 30, 2020, the Company had U.S. federal and state net operating losses (“NOLs”) of approximately $18,177,000, which will expire, if not utilized, in the years 2034 through 2037, however, NOLs generated subsequent to December 31, 2017 do not expire but may only be used against taxable income to 80%. However, in response to the novel coronavirus COVID-19, the Coronavirus Aid, Relief, and Economic Security Act temporarily repealed the 80% limitation for NOLs arising in 2018, 2019 and 2020. Pursuant to Section 382 of the Internal Revenue Code of 1986, as amended, use of the Company’s NOLs carryforwards may be limited in the event of cumulative changes in ownership of more than 50% within a three-year period.
The Company must assess the likelihood that its net deferred tax assets will be recovered from future taxable income, and to the extent the Company believes that recovery is not likely, the Company establishes a valuation allowance. Management’s judgment is required in determining the Company’s provision for income taxes, deferred tax assets and liabilities, and any valuation allowance recorded against the net deferred tax assets. The Company recorded a full valuation allowance as of September 30, 2020, and December 31, 2019. Based on the available evidence, the Company believes it is more likely than not that it will not be able to utilize its net deferred tax assets in the foreseeable future.
Note 11 – Subsequent Events
In accordance with ASC 855, Subsequent Events, the Company has evaluated all subsequent events through the date the financial statements were available to be issued. No material subsequent events occurred after September 30, 2020, other than as set out below:
On October 28, 2020, the Company applied to the lender of its $554,000 loan for forgiveness of the full amount of the principal under the loan terms. Final determination of the amount to be forgiven, if any, is expected in the first quarter of fiscal year 2021.
| 19 |
ITEM 2. MANAGEMENT’S DISCUSSION AND ANALYSIS OF FINANCIAL CONDITION AND RESULTS OF OPERATIONS
The following discussion should be read in conjunction with our unaudited condensed consolidated financial statements and related notes included elsewhere in this Quarterly Report, which include additional information about our accounting policies, practices, and the transactions underlying our financial results, as well as with our audited consolidated financial statements included in our Annual Report on Form 10-K for the year ended December 31, 2019, as filed with the SEC. In addition to historical information, the following discussion and other parts of this Quarterly Report contain forward-looking information that involves risks and uncertainties. Our actual results could differ materially from those anticipated by such forward-looking information due to the factors discussed under “Cautionary Statements” appearing elsewhere herein and the risks and uncertainties described or identified in “Item 1A – Risk Factors” in our Annual Report on Form 10-K for the year ended December 31, 2019, as updated from time to time in the Company’s filings with the SEC, and Part II, Item 1A of this Quarterly Report entitled “Risk Factors.”
Non-GAAP Financial Measures
To supplement our financial results on U.S. generally accepted accounting principles (“GAAP”) basis, we use non-GAAP measures including net bookings, backlog, as well as adjusted net income (loss) which reflects adjustments for certain non-cash expenses such as stock-based compensation, certain debt-related items and depreciation expense. We believe these non-GAAP measures are helpful in understanding our past performance and are intended to aid in evaluating our potential future results. The presentation of these non-GAAP measures should be considered in addition to our GAAP results and are not intended to be considered in isolation or as a substitute for financial information prepared or presented in accordance with GAAP. We believe these non-GAAP financial measures reflect an additional way to view aspects of our operations that, when viewed with our GAAP results, provide a more complete understanding of factors and trends affecting our business. For purposes of this Quarterly Report, (i) “adjusted net income (loss)” and “adjusted operating income (loss)” mean GAAP net income (loss) and operating income (loss), respectively, after adjustment for non-cash equity compensation expense, debt-related items and depreciation expense, and (ii) “net bookings” means new sales contracts executed during the quarter for which we received an initial deposit, net of any adjustments including cancellations and change orders during the quarter.
Our backlog, remaining performance obligations and net bookings may not be indicative of future operating results, and our customers may attempt to renegotiate or terminate their contracts for a number of reasons, including delays in or inability to obtain project financing or licensing or abandonment of the project entirely. Accordingly, there can be no assurance that contracts included in the backlog or remaining performance obligations will actually generate revenues or when the actual revenues will be generated.
Overview
We design, engineer and sell cultivation technologies for controlled environment agriculture including: (i) liquid-based process cooling systems and other climate control systems, (ii) air handling equipment and systems, (iii) a full-service engineering package for designing and engineering commercial scale thermodynamic systems specific to cannabis cultivation facilities, and (iv) automation and control devices, systems and technologies used for environmental, lighting and climate control. Our customers include commercial, state- and provincial-regulated cannabis growers in the U.S. and Canada as well as other international locations, including those growers building new facilities and those expanding or retrofitting existing facilities. Currently, our revenue stream is derived primarily from supplying our products, services and technologies to commercial indoor and hybrid sealed greenhouse facilities ranging from several thousand to more than 100,000 square feet.
Headquartered in Boulder, Colorado, we leverage our experience in this space to bring value-added climate control solutions to our customers that help improve their overall crop quality and yield, optimize energy and water efficiency, and satisfy the evolving state and local codes, permitting and regulatory requirements. Although our customers do, we neither produce nor sell cannabis or any of its related products.
Shares of our common stock are traded on the OTC Markets under the ticker symbol “SRNA.”
| 20 |
Impact of the COVID-19 Pandemic on Our Business
The impact of the government and the business economic response to the COVID-19 pandemic has affected demand across the majority of our markets and disrupted work on projects. The COVID-19 pandemic is expected to have continued adverse effects on our sales, project implementation, operating margins, and working capital. As of the date of this filing, uncertainty continues to exist concerning the magnitude and duration of the economic impact of the COVID-19 pandemic.
In response to the COVID-19 pandemic, in late March 2020 the Company downsized operations to preserve cash resources, implementing workforce reductions, reductions of salaried employee compensation (including all executives and the CEO) and reduction of hours worked, cutting costs and focusing its operations on customer-centric sales and project management activities.
Following the receipt of loan funds in April 2020, the Company reinstated all staff who previously had been placed on furlough. Staff receiving salaries of $100,000 per year or less were restored to their full salaries. All executives, including the CEO, had their compensation reduced to the greater of $100,000 per year or 75% of their previous salary level. The Company re-engaged its staff so as to be able to fulfill its current customer contracts and any new sales orders and to continue its marketing and selling efforts. Over the course of the Summer 2020, the Company took further steps to adjust its work force by furloughing several employees, making temporary hourly and salary reduction adjustments, and then, in late September 2020, in light of our then sales efforts, reinstating continuing hourly employees to full-time status and restoring the salaries of continuing salaried employees.
Due to the speed with which the COVID-19 pandemic developed and the resulting uncertainties, including the depth and duration of the disruptions to customers and suppliers, its future effect on our business, on our results of operations, and on our financial condition, we cannot predict the overall effect on our business over the longer term. Despite this uncertainty, we have undertaken various plans to reduce costs so as to mitigate the impact of the COVID-19 pandemic to the best of our ability, although they may not be sufficient in the long-run for us to avoid reduced sales, increased losses and reduced operating cash flows.
Refer to Risk Factors, included in Part II, Item 1A of this Quarterly Report on Form 10-Q below, for further discussion of the possible impact of the COVID-19 pandemic on our business.
Our Growth Strategy
We believe there are fundamentally three ways to grow a business: (i) increase the number of customers, (ii) increase the average revenue per order, or (iii) increase the frequency of orders. Our growth strategy is threefold:
1. Sell proverbial “Chevys.” In addition to “Cadillac” -level products, sell “Chevy” or equivalent products to satisfy a wider range of points along the demand curve. Anticipated result: Increase the number of customers.
We have a sales and marketing program that generates many prospective customer relationships. However, our limited range of higher cost products, mostly chilled water systems, reduces the number of customer prospects who can afford to buy from us. In 2018 we started an aggressive effort to broaden our product and service offerings to provide a wider range of HVAC technical solutions (see chart below). In 2018 we began to offer stamped mechanical plan sets and our first 4-pipe chilled water systems. In 2019 we broadened our engineering services to include full MEP (Mechanical, Electrical, and Plumbing) design services. We also began to offer our SentryIQ Controls System. And in 2020 we added new products to include: split system DX (direct expansion) with integrated dehumidification, packaged DX systems with modulating hot gas reheat, heat recovery chiller/boiler for 4-pipe systems, and we recently added our StrataAir™ racking airflow solution to address customer needs for multi-level cultivation facilities. These various systems provide solutions to answer a broader range of technical and cost constraints and we will continue to develop and offer new solutions to our customers’ problems, so that a broader group of growers can take advantage of our engineering expertise and capabilities. We believe these new products and services will increase our addressable market and increase sales, further leveraging our investment in sales and marketing.
| 21 |
The success of our product development initiative can be seen in the following table, which documents the number of commercial-scale projects (over $100,000 sales) that have included one or more of our new products:
| Year | Percent using New Products | |
| 2018 | 35% | |
| 2019 | 76% | |
| 2020 | (through Q3): 100% |
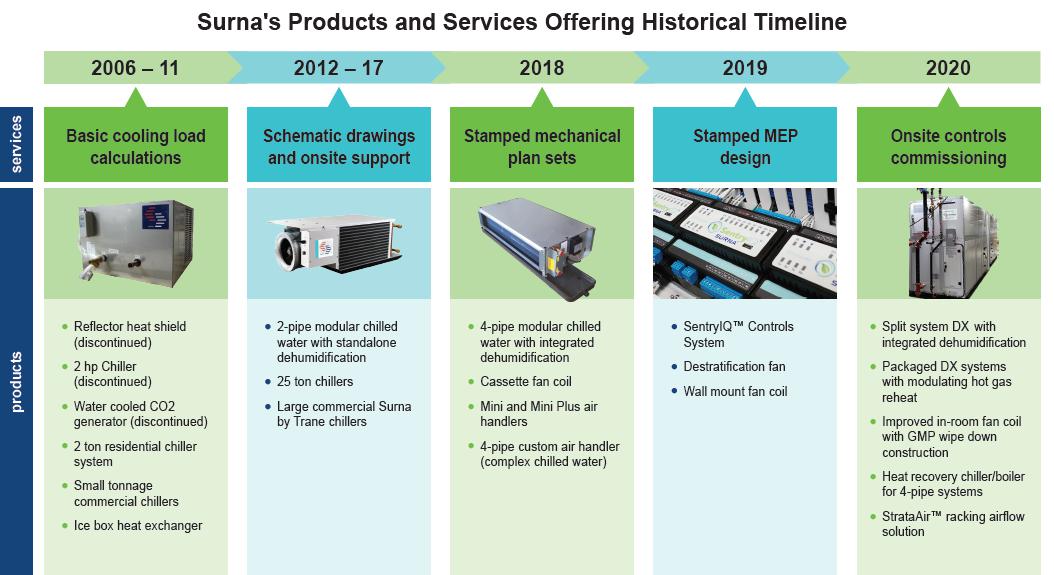
2. Sell proverbial “steering wheels.” Sell our customers the automated facilities control systems they need—directly. Anticipated result: Increase average order size.
Growing live plants indoors in a controlled environment is a technically demanding business, and a failed crop can cost a grower significant foregone revenue. We believe our licensed professional engineers are some of the industry’s leading experts in the design of such facilities, and we seek to extend that leadership into more advanced technology products.
Last year we introduced our SentryIQ™ control system. If our climate control design and products are the proverbial car, then SentryIQ™ is the proverbial steering wheel—one is needed to direct the car where to go. Before SentryIQ™, we had to send our customers elsewhere for controls to regulate their cultivation environments, but we now have the ability to capture that revenue. To date, we have signed nine contracts for controls systems with an aggregate value of approximately $1,200,000.
Our next step down this technology and innovation road will be the eventual development of the equivalent of a self-driving car. Growers will tell the control system what they want to achieve, and the system will sense the environment and direct the climate control system to achieve the grower’s goals. These systems will be able to integrate data analytics—and eventually deploy artificial intelligence—to optimize multiple variables to maximize the grower’s profits. While we are in the early stages of development of these technology-driven systems, we believe it is important for us to become a player in this market because it expands our addressable market for both sensors and software while offering the possibility of higher margins and recurring revenue over time.
3. Add more proverbial “dealers.” Engage in one or more strategic relationships with other technology leaders that serve our industry. Anticipated result: Increase the number of customers.
Strategic relationships might include referral marketing agreements, co-development of unique integrated solutions with best-in-class partners, and acquisitions. To extend the automotive analogy, engaging in these types of relationships is like adding more dealers to sell our products, at little cost to us. During Q1 2020 we joined the GroAdvisor group (www.groadvisorworldwide.com) and began joint marketing initiatives with the group. GroAdvisor is a group of seven companies each with expertise in selected technologies necessary to build a cultivation facility such as lighting, buildings, modular grow rooms, fertigation, etc. Surna provides its expertise in environmental controls to the group and its prospective customers.
| 22 |
If some of these strategic alliances are successful in driving top-line revenue for us and our partners, over time these relationships could develop into more exclusive arrangements or evolve into possible acquisitions or a source of strategic capital for us. There can be no assurance that we will be able to successfully execute any of these strategic initiatives. Efforts will be primarily focused on working with new strategic partners to co-market each other’s products and services and possibly jointly develop new and improved products and services with cannabis-specific applications, as opposed to exclusively seeking acquisitions.
Our business plan has six key objectives in mind:
| 1. | Reduce prior reliance on new build facility projects which generate inconsistent revenue and cash flow; | |
| 2. | Increase emphasis on retrofit and expansion projects, especially from multi-facility operators, which typically provide a more predictable and accelerated completion and revenue stream; | |
| 3. | Establish revenue from “lifecycle” operational and facility management offerings; | |
| 4. | Increase our gross margin by shifting our focus to value-added technology services and proprietary, customized equipment; | |
| 5. | Operate with disciplined expense, cash and working capital management; and | |
| 6. | Become financially self-sustaining by attempting to achieve operating cash flow breakeven and profitability. |
Our Commercial-Scale Projects
During the first nine months of 2020, we entered into sales contracts for five new build projects and one expansion project, each with a contract value over $100,000, which we refer to as commercial-scale projects. These new contracts totaled $4,892,000, which consisted of $4,354,000 for new build projects (89%) and $538,000 for an expansion project (11%).
Our Bookings, Backlog and Revenue
During the three months ended September 30, 2020, we executed new sales contracts with a total contract value of $4,374,000. However, during this same period, we cancelled three sales contracts with a total remaining contract value of $133,000. These cancellations were based on discussions with customers who abandoned their projects. After adjustments for these cancellations, our net bookings in the three months ended September 30, 2020 were $4,241,000, representing an increase of $5,842,000 (or 518%) from net bookings of $(1,601,000) in the second quarter of 2020.
So far in 2020, we have received a number of contract terminations. We believe these have resulted, in large part, from uncertainty due to the impact of the COVID19 pandemic and disruption in the capital markets, that together have contributed to a slowdown in new construction for cultivation facilities. However, retail sales of cannabis products have continued their strong growth during 2020 and appear to be continuing. This gives us optimism that cultivation facilities will continue to be built to meet the growing demand for cannabis products.
As the cultivation facility market matures and grows, we believe more competitors are and will be entering the market. We believe this competition will likely come from: (i) large equipment providers who are more aggressively pursuing the cannabis market, and (ii) local and national engineering firms who have elected to enter the market which they had previously chosen not to serve because of the nature of the industry.
| 23 |
Our backlog at September 30, 2020 was $8,198,000, an increase of $2,606,000, or 29%, from June 30, 2020. The increase in backlog is the result of our higher net bookings in the third quarter. Our backlog at September 30, 2020 includes booked sales orders of $673,000 (8% of the total backlog) from several customers that we do not expect to be realized until 2022, if at all. We believe the sales orders in this portion of our backlog may be abandoned by our customers or ultimately cancelled.
The following table sets forth: (i) our beginning backlog (the remaining contract value of outstanding sales contracts for which we have received an initial deposit as of the previous period), (ii) our net bookings for the period (new sales contracts executed during the period for which we received an initial deposit, net of any adjustments including cancelations and change orders during the period), (iii) our recognized revenue for the period, and (iv) our ending backlog for the period (the sum of the beginning backlog and net bookings, less recognized revenue).
| For the quarter ended | ||||||||||||||||||||
| September 30, 2019 | December 31, 2019 | March 31, 2020 | June 30, 2020 | September 30, 2020 | ||||||||||||||||
| Backlog, beginning balance | $ | 13,023,000 | $ | 10,143,000 | $ | 9,558,000 | $ | 8,875,000 | $ | 5,592,000 | ||||||||||
| Net bookings, current period | $ | 2,644,000 | $ | 3,134,000 | $ | 1,127,000 | $ | (1,601,000 | ) | $ | 4,241,000 | |||||||||
| Recognized revenue, current period | $ | 5,524,000 | $ | 3,719,000 | $ | 1,810,000 | $ | 1,682,000 | $ | 1,635,000 | ||||||||||
| Backlog, ending balance | $ | 10,143,000 | $ | 9,558,000 | $ | 8,875,000 | $ | 5,592,000 | $ | 8,198,000 | ||||||||||
The completion of a customer’s new build facility project is dependent upon the customer’s ability to secure funding and real estate, obtain a license and then build their cultivation facility so they can take possession of the equipment. Accordingly, the time it takes for these customers to complete a new build project, which corresponds to when we are able to recognize revenue, is driven by numerous factors including: (i) the large number of first-time participants interested in the indoor cannabis cultivation business; (ii) the complexities and uncertainties involved in obtaining state and local licensure and permitting; (iii) local and state government delays in approving licenses and permits due to lack of staff or the large number of pending applications, especially in states where there is no cap on the number of cultivators; (iv) the customer’s need to obtain cultivation facility financing; (v) the time needed, and coordination required, for our customers to acquire real estate and properly design and build the facility (to the stage when climate control systems can be installed); (vi) the large price tag and technical complexities of the climate control and air sanitation system; (vii) the availability of power; and (viii) delays that are typical in completing any construction project.
As has historically been the case for the Company at each quarter-end, there remains significant uncertainty regarding the timing of revenue recognition of our backlog. As of September 30, 2020, 35% of our backlog was attributable to customer contracts for which we have only received an initial advance payment to cover our engineering services (“engineering only paid contracts”). There are always risks that the equipment portion of our engineering only paid contracts will not be completed or will be delayed, which could occur if the customer is dissatisfied with the quality or timeliness of our engineering services, there is a delay or abandonment of the project due to the customer’s inability to obtain project financing or licensing, or the customer determines not to proceed with the project due to economic factors, such as declining cannabis wholesale prices in the state.
In contrast, after the customer has made an advance payment for a portion of the equipment to be delivered under the contract (“partial equipment paid contracts”), we typically are better able to estimate the timing of revenue recognition since the risks and delays associated with licensing, permitting and project funding are typically mitigated once the initial equipment payment is received. As of September 30, 2020, 65% of our backlog was attributable to partial equipment paid contracts.
We have provided an estimate in our condensed consolidated financial statements for when we expect to recognize revenue on our remaining performance obligations (i.e., our Q3 2020 backlog), using separate time bands, with respect to engineering only paid contracts and partial equipment paid contracts. We estimate that we will recognize approximately 42% of our Q3 2020 backlog during the remainder of 2020, or $3.5 million. However, there continues to be significant uncertainty regarding the timing of our recognition of revenue on our Q3 2020 backlog. Refer to the Revenue Recognition section of note 1 in our condensed consolidated financial statements, included as part of this Quarterly Report for additional information on our estimate of future revenue recognition on our remaining performance obligations.
| 24 |
Our backlog, remaining performance obligations and net bookings may not be indicative of future operating results, and our customers may attempt to renegotiate or terminate their contracts for a number of reasons, including delays in or inability to obtain project financing or licensing or abandonment of the project entirely. Accordingly, there can be no assurance that contracts included in backlog or remaining performance obligations will actually generate revenues or when the actual revenues will be generated. Net bookings and backlog are considered non-GAAP financial measures, and therefore, they should be considered in addition to, rather than as a substitute for, our GAAP measures for recognized revenue, deferred revenue and remaining performance obligations. Further, we can provide no assurance as to the profitability of our contracts reflected in remaining performance obligations, backlog and net bookings.
Results of Operations
Comparison of Three Months Ended September 30, 2020 and 2019
Revenues and Cost of Goods Sold
Revenue for the three months ended September 30, 2020 was $1,635,000, compared to $5,524,000 for the three months ended September 30, 2019, representing a decrease of $3,889,000, or 70%.
Cost of revenue decreased by $2,835,000, or 72%, from $3,944,000 for the three months ended September 30, 2019 to $1,109,000 for the three months ended September 30, 2020.
The gross profit for the three months ended September 30, 2020 was $526,000 compared to $1,580,000 for the three months ended September 30, 2019, a decrease of 67%. Gross profit margin increased by 3 percentage points from 29% for the three months ended September 30, 2019 to 32% for the three months ended September 30, 2020 primarily due to a decrease in variable costs as a percent of revenue offset by our fixed cost base as described below.
Our fixed costs (which include engineering, service, manufacturing and project management salaries and benefits and manufacturing overhead) totaled $281,000, or 17% of total revenue, for the three months ended September 30, 2020 as compared to $332,000, or 6% of total revenue, for the three months ended September 30, 2019. The decrease of $51,000 was primarily due to a decrease in salaries and benefits (including stock-based compensation) of $54,000.
Our variable costs (which include the cost of equipment, outside engineering costs, shipping and handling, travel and warranty costs) totaled $827,000, or 51% of total revenue, in the three months ended September 30, 2020 as compared to $3,612,000, or 65% of total revenue, in the three months ended September 30, 2019. The decrease in variable costs was primarily due to lower equipment costs as a result of lower revenue of $2,386,000. Other factors included: (i) a decrease in excess and obsolete inventory of $203,000 due to the reversal of the reserve recorded in Q2. The reserve recorded in Q2 was related to the delay of one customer’s project which was subsequently delivered in Q3, (ii) a decrease in outside engineering services of $108,000, (iii) a decrease in warranty costs of $66,000, partially the result of a credit from a vendor for costs incurred in 2019, and (iv) a decrease in travel to customer facilities of $12,000.
We continue to focus on gross margin improvement through a combination of, among other things, more disciplined pricing, better absorption of our fixed costs as we convert our increased bookings into revenue, and the implementation over time of lower-cost supplier alternatives.
Operating Expenses
Operating expenses decreased to $809,000 for the three months ended September 30, 2020 from $1,303,000 for the three months ended September 30, 2019, a decrease of $494,000, or 38%. The operating expense decrease consisted of: (i) a decrease in selling, general and administrative expenses (“SG&A expenses”) of $447,000, (ii) a decrease in advertising and marketing expenses of $34,000, and (iii) a decrease in product development expense of $14,000.
| 25 |
The decrease in SG&A expenses for the three months ended September 30, 2020 compared to the three months ended September 30, 2019, was due primarily to: (i) a decrease of $100,000 in commissions, (ii) a decrease of $67,000 in stock-based compensation expense to employees, consultants and directors, (iii) a decrease of $65,000 in accounting, consulting, investor relations and other professional fees, (iv) a decrease in loss on asset disposal of $57,000, (v) a decrease of $50,000 in salaries, benefits and other employee related expenses, (vi) a decrease in travel of $47,000 (vii) a decrease in bad debt expense of $26,000, and (viii) a decrease of $23,000 in board fees.
The decrease in marketing expenses was primarily due to (i) a decrease in expenses related to trade shows of $53,000, (ii) a decrease in salaries and benefits (including stock-based compensation) of $8,000, offset by (ii) an increase in web development, outside marketing services and other marketing expenses of $29,000.
The decrease in product development costs was primarily due to a decrease in salaries and benefits (including stock compensation) of $17,000.
Operating Income (Loss)
We had an operating loss of $283,000 for the three months ended September 30, 2020, as compared to operating income of $277,000 for the three months ended September 30, 2019, a decrease of $560,000, or 202%. The operating loss for the three months ended September 30, 2020 included $56,000 of non-cash, stock-based compensation and $28,000 of depreciation expense, compared to $113,000 of non-cash, stock-based compensation and $30,000 of depreciation expense for the three months ended September 30, 2019. Excluding these non-cash items, our operating loss increased by $619,000, or 147%.
Other Income (Expense)
We had other income (net) of $12,000 for the three months ended September 30, 2020 compared to other expense (net) of $55,000 for the three months ended September 30, 2019. The expense in 2019 was for a one-time charge related to certain leased equipment which has since ceased.
Net Income (Loss)
Overall, we had net loss of $270,000 for the three months ended September 30, 2020, as compared to net income of $222,000 for the three months ended September 30, 2019, an increase of $492,000, or 222%. The net loss for the three months ended September 30, 2020 included $56,000 of non-cash, stock-based compensation and $28,000 of depreciation expense, compared to $113,000 of non-cash, stock-based compensation and $30,000 of depreciation expense for the three months ended September 30, 2019. Excluding these non-cash items, our net loss increased by $552,000, or 151%.
Comparison of Nine Months Ended September 30, 2020 and 2019
Revenues and Cost of Goods Sold
Revenue for the nine months ended September 30, 2020 was $5,127,000, compared to $11,506,000 for the nine months ended September 30, 2019, representing a decrease of $6,379,000, or 55%.
Cost of revenue decreased by $4,118,000, or 52%, from $7,988,000 for the nine months ended September 30, 2019 to $3,870,000 for the nine months ended September 30, 2020.
The gross profit for the nine months ended September 30, 2020 was $1,257,000 compared to $3,518,000 for the nine months ended September 30, 2019, a decrease of 64%. Gross profit margin decreased by 6 percentage points from 31% for the nine months ended September 30, 2019 to 25% for the nine months ended September 30, 2020 primarily due to our fixed cost base offset by a decrease in variable costs as a percent of revenue as described below.
| 26 |
Our fixed costs (which include engineering, service, manufacturing and project management salaries and benefits and manufacturing overhead) totaled $864,000, or 17% of total revenue, for the nine months ended September 30, 2020 as compared to $1,009,000, or 9% of total revenue, for the nine months ended September 30, 2019. The decrease of $146,000 was primarily due to a decrease in salaries and benefits (including stock-based compensation) of $162,000, offset by an increase in fixed overhead of $16,000.
Our variable costs (which include the cost of equipment, outside engineering costs, shipping and handling, travel and warranty costs) totaled $3,006,000, or 59% of total revenue, in the nine months ended September 30, 2020 as compared to $6,978,000, or 61% of total revenue, in the nine months ended September 30, 2019. The decrease in variable costs was primarily due to lower equipment costs, of $3,599,000, as a result of lower revenue and a slightly higher margin on equipment sales. Other factors included: (i) a decrease in warranty of $158,000 which was partially the result of a reimbursement from a customer and a credit from a vendor for costs incurred in 2019 related to a failure later deemed to be non-warranty, (ii) a decrease in outside engineering costs of $128,000, (iii) a decrease of $72,000 in shipping and handling, (iv) a decrease of $36,000 in travel for client visits, offset by (v) an increase in project management consulting of $24,000.
We continue to focus on gross margin improvement through a combination of, among other things, more disciplined pricing, better absorption of our fixed costs as we convert our increased bookings into revenue, and the implementation over time of lower-cost supplier alternatives.
Operating Expenses
Operating expenses decreased to $3,092,000 for the nine months ended September 30, 2020, from $4,027,000 for the nine months ended September 30, 2019, a decrease of $935,000, or 23%. The operating expense decrease consisted of: (i) a decrease in selling, general and administrative expenses (“SG&A expenses”) of $831,000, (ii) a decrease in advertising and marketing expenses of $82,000 and (iii) a decrease in product development expense of $22,000.
The decrease in SG&A expenses for the nine months ended September 30, 2020, compared to the nine months ended September 30, 2019, was due primarily to: (i) a decrease of $343,000 in stock-based compensation expense to employees, consultants and directors, (ii) a decrease in commissions of $166,000, (iii) a decrease of $111,000 for loss on asset disposal, (iv) a decrease in accounting, consulting, investor relations and other professional fees of $86,000, (v) a decrease of $79,000 in travel, (vi) a decrease in board fees of $47,000, (vii) a decrease of $39,000 in bad debt expense, (viii) a decrease of $39,000 in depreciation, offset by (ix) an increase in salaries, benefits and other employee related costs of $80,000.
The decrease in marketing expenses was primarily due to a decrease in expenses related to trade shows of $125,000, offset by an increase in web development, outside marketing services and other marketing expenses of $42,000.
The decrease in product development costs was primarily due to a decrease in materials costs of $50,000 offset by an increase in salaries and benefits (including stock-based compensation) of $29,000.
Operating Income (Loss)
We had operating loss of $1,835,000 for the nine months ended September 30, 2020, as compared to an operating loss of $508,000 for the nine months ended September 30, 2019, an increase of $1,326,000, or 261%. The operating loss for the nine months ended September 30, 2020 included $354,000 of non-cash, stock-based compensation and $86,000 of depreciation expense, compared to $661,000 of non-cash, stock-based compensation and $124,000 of depreciation expense for the nine months ended September 30, 2019. Excluding these non-cash items, our operating loss increased by $1,672,000, or 604%.
| 27 |
Other Income (Expense)
We had other income (net) of $12,000 for the nine months ended September 30, 2020 compared to other expense (net) of $30,000 for the nine months ended September 30, 2019. Other expense for the nine months ended September 30, 2019 consisted of expenses related to a one-time charge for certain leased equipment which has since ceased.
Net Income (Loss)
Overall, we had net loss of $1,822,000 for the nine months ended September 30, 2020 as compared to a net loss of $539,000 for the nine months ended September 30, 2019, an increase of $1,283,000, or 238%. The net loss for the nine months ended September 30, 2020 included $354,000 of non-cash, stock-based compensation and $86,000 of depreciation expense, compared to $661,000 of non-cash, stock-based compensation and $124,000 of depreciation expense for the nine months ended September 30, 2019. Excluding these non-cash items, our net loss increased by $1,629,000, or 660%.
Financial Condition, Liquidity and Capital Resources
Cash and Cash Equivalents
As of September 30, 2020, we had cash and cash equivalents of $2,072,000, compared to cash and cash equivalents of $922,000 as of December 31, 2019, an increase of 125%. The $1,150,000 increase in cash and cash equivalents during the nine months ended September 30, 2020, was the result of cash provided by our operating activities of $600,000 together with proceeds from the issuance of a note payable of $554,000. Our cash is held in bank depository accounts in certain financial institutions. During the nine months ended September 30, 2020, we held deposits in financial institutions that exceeded the federally insured amount.
As of September 30, 2020, we had accounts receivable (net of allowance for doubtful accounts) of $97,000, inventory (net of excess and obsolete allowance) of $522,000, and prepaid expenses of $757,000 (including $681,000 in advance payments on inventory purchases). While we typically require advance payment before we commence engineering services or ship equipment to our customers, we have made exceptions requiring us to record accounts receivable, which carry a risk of non-collectability especially since most of our customers are funded on an as-needed basis to complete facility construction. We expect our exposure to accounts receivable risk to increase as we pursue larger projects.
As of September 30, 2020, we had a note payable of $554,000, total accounts payable and accrued expenses of $1,398,000, deferred revenue of $3,489,000, accrued equity compensation of $101,000 and the current portion of operating lease liability of $253,000. As of September 30, 2020, we had a working capital deficit of $1,793,000, compared to a working capital deficit of $1,437,000 as of December 31, 2019. The increase in our working capital deficit was primarily related to (i) an increase in deferred revenue (which represents cash received from customers in advance of the performance of services or the delivery of equipment) of $2,045,000, (ii) a decrease in inventory (net of reserve for excess and obsolete inventory of $710,000, (iii) a decrease in accounts receivable of $41,000, offset by (iv) an increase in cash of $1,150,000, (v) an increase in prepaid and other expenses of $488,000, (vi) a decrease in accounts payable and accrued liabilities of $441,000 and, (vii) a decrease in accrued equity compensation of $402,000.
We have never declared or paid any cash dividends on our common stock. We currently intend to retain all available funds and any future earnings for use in the operation and expansion of our business and do not anticipate paying any cash dividends in the foreseeable future.
| 28 |
Summary of Cash Flows
The following summarizes our approximate cash flows for the nine months ended September 30, 2020 and 2019:
For the Nine Months Ended September 30, | ||||||||
| 2020 | 2019 | |||||||
| Net cash provided by operating activities | $ | 600,000 | $ | 1,750,000 | ||||
| Net cash used in investing activities | (4,000 | ) | (3,000 | ) | ||||
| Net cash provided by financing activities | 554,000 | - | ||||||
| Net increase in cash | $ | 1,150,000 | $ | 1,747,000 | ||||
Operating Activities
We incurred a net loss for the nine months ended September 30, 2020 of $1,822,000 and have an accumulated deficit of $27,507,000 as of September 30, 2020.
Cash provided by operations for the nine months ended September 30, 2020 was $600,000 compared to cash provided by operations of $1,750,000 for the nine months ended September 30, 2019, a decrease of $1,150,000.
The decrease in cash provided by operating activities during the nine months ended September 30, 2020 was primarily attributable to: (i) an increase in net loss of $1,283,000, and (ii) a decrease of $395,000 in non-cash operating charges, offset by a $528,000 increase in cash used to fund working capital.
The significant changes in working capital related to a $2,045,000 increase in deferred revenue, a $715,000 decrease in inventory, a $488,000 increase in prepaid and other expenses, a $397,000 decrease in accounts payable and accrued expenses and a $101,000 increase in accrued equity compensation.
The significant change in non-cash operating charges related to a $423,000 decrease in the equity compensation issued, a $208,000 increase in the provision for excess and obsolete inventory, and a $111,000 decrease for loss on asset disposal.
Investing Activities
The cash used in investing activities for the nine months ended September 30, 2020 was related to the purchase of property and equipment.
Financing Activities
On April 22, 2020, the Company entered into a note payable with its current bank in the principal amount of $554,000, for working capital purposes. The Company undertook no financing activities during the nine months ended September 30, 2019.
Going Concern
Our condensed consolidated financial statements for the quarter ended September 30, 2020, have been presented on a going concern basis, which contemplates the realization of assets and the satisfaction of liabilities in the normal course of business. Our independent registered public accounting firm included in its audit opinion on our consolidated financial statements for the year ended December 31, 2019, a statement that there is substantial doubt as to our ability to continue as a going concern, and our consolidated financial statements for the year ended December 31, 2019 were prepared assuming that we would continue as a going concern. We have determined that our ability to continue as a going concern is dependent on raising additional capital to fund our operations and ultimately on generating future profitable operations. There can be no assurance that we will be able to raise sufficient additional capital or eventually have positive cash flow from operations to address all of our cash flow needs. If we are not able to generate positive cash flow from operations or find alternative sources of cash, our business and shareholders will be materially and adversely affected. The foregoing factors raise substantial doubt about our ability to continue as a going concern for a period of one year from the date our condensed consolidated financial statements for the quarter ended September 30, 2020, are issued. Our condensed consolidated financial statements do not include any adjustment that might result from the outcome of this uncertainty.
| 29 |
Capital Raising
We believe our cash balances and cash flow from operations will be insufficient to fund our operations for the next 12 months. If we are unable to substantially increase revenues or otherwise generate cash flows from operations, we will need to raise additional funding to continue as a going concern. Based on management’s estimate for our operational cash requirements, we will need to raise financing in the next six months in order to continue our operations and achieve our growth targets. There can be no assurance that we will be able to raise the necessary financing, when and if needed, on acceptable terms or at all. If our operating results do not meet management’s expectations, or additional capital is not available, management believes it has the ability to reduce certain expenditures, although these reductions may not be sufficient to be able to continue the Company’s operations. The precise amount and timing of our financing needs cannot be determined accurately at this time, and will depend on a number of factors, including the market demand for our products and services, management of working capital, and continuation of normal payment terms and conditions for purchase of our products and services.
While we made substantial improvement to our results in 2019, there is significant work ahead for us to execute on our growth plan and achieve fiscal self-sustainability. Historically, we have not been able to generate consistent revenues quarter-over-quarter. While we are pursuing new business opportunities with multi-facility operators and expansion projects, as well as broadening our product line, there is no assurance we will be successful booking any sales related to these opportunities and converting such bookings into cash and revenue. We also may not be able to achieve our growth and financial goals until 2021 or later, if at all. Additionally, we also have to factor in the economic consequences of the COVID-19 pandemic and the dislocation caused by the lock down and reduced commercial activity now being experienced in the United States and Canadian economies.
Inflation
In the opinion of management, inflation has not and will not have a material effect on our operations in the immediate future. Management will continue to monitor inflation and evaluate the possible future effects of inflation on our business and operations.
Contractual Payment Obligations
As of September 30, 2020, our contractual payment obligations consisted of a building lease. On January 2, 2018, the leased space was expanded to 18,600 square feet and the monthly rental rate increased to $18,979 and beginning September 1, 2018, the monthly rent will increase by 3% each year through the end of the lease. Refer to Note 2 – Leases of the notes to the condensed consolidated financial statements, included as part of this Quarterly Report for a discussion of building lease.
During the nine months ended September 30, 2020, the Company entered into an agreement with its landlord to apply its rent deposit of $52,600 to rent payments due during the period. The deposit required on the lease will be reduced to approximately $32,000 and will be payable in 12 monthly installments from January through December of 2021. Further, the landlord also agreed to defer payment of fifty percent of the three months of lease payments (base rent only) for the period July to September 2020. The deferred lease payments amount to approximately $30,000 and will be payable in 12 monthly installments from January to December 2021.
Commitments and Contingencies
Refer to Note 7 – Commitments and Contingencies of the notes to the condensed consolidated financial statements, included as part of this Quarterly Report for a discussion of commitments and contingencies.
| 30 |
Off-Balance Sheet Arrangements
We are required to disclose any off-balance sheet arrangements that have or are reasonably likely to have a current or future effect on our financial condition, changes in financial condition, revenues or expenses, results of operations, liquidity, capital expenditures, or capital resources that are material to investors. As of September 30, 2020, we had no off-balance sheet arrangements. During the nine months ended September 30, 2020, we did not engage in any off-balance sheet financing activities other than those included in the “Contractual Payment Obligations” discussed above and those reflected in Note 6 of our condensed consolidated financial statements.
Recent Developments
Refer to Note 11 - Subsequent Events of the notes to condensed consolidated financial statements, included as part of this Quarterly Report for certain significant events occurring since September 30, 2020.
Critical Accounting Estimates
This discussion and analysis of our financial condition and results of operations is based upon our condensed consolidated financial statements, which have been prepared in conformity with accounting principles generally accepted in the United States of America. Certain accounting policies are particularly important to the understanding of our financial position and results of operations and require the application of significant judgment by our management or can be materially affected by changes from period to period in economic factors or conditions that are outside of our control. As a result, they are subject to an inherent degree of uncertainty. In applying these policies, management uses their judgment to determine the appropriate assumptions to be used in the determination of certain estimates. Those estimates are based on our historical operations, our future business plans and projected financial results, the terms of existing contracts, observance of trends in the industry, information provided by our customers, and information available from other outside sources, as appropriate. Actual results could materially differ from those estimates. Key estimates include: allocation of transaction prices to performance obligations under contracts with customers, standalone selling prices, timing of expected revenue recognition on remaining performance obligations under contracts with customers, valuation of intangible assets, valuation of equity-based compensation, valuation of deferred tax assets and liabilities, warranty accruals, accounts receivable and inventory allowances, and legal contingencies.
ITEM 3. QUANTITATIVE AND QUALITATIVE DISCLOSURES ABOUT MARKET RISK
We are a smaller reporting company, as defined by Rule 12b-2 of the Exchange Act, therefore are not required to provide the information under this item.
ITEM 4. CONTROLS AND PROCEDURES
Evaluation of Disclosure Controls and Procedures
Our management, with the participation of our Chief Executive Officer and our Principal Financial and Accounting Officer, which positions are currently held by the same person, has evaluated the effectiveness of our disclosure controls and procedures (as defined in Rules 13a-15(e) and 15d-15(e) under the Exchange Act), as of the end of the period covered by this Quarterly Report on Form 10-Q. Based on this evaluation, our Chief Executive Officer and Principal Financial and Accounting Officer concluded that as a result of material weakness in our internal control over financial reporting as described in Item 9A of our Annual Report on Form 10-K for the year ended December 31, 2019 filed with the SEC, our disclosure controls and procedures were not effective as of September 30, 2020.
We did not maintain effective controls over certain aspects of the financial reporting process because: (i) we lack a sufficient complement of personnel with a level of accounting expertise and an adequate supervisory review structure that is commensurate with our financial reporting requirements, (ii) there is inadequate segregation of duties due to the limitation on the number of our accounting personnel, and (iii) we have insufficient controls and processes in place to adequately verify the accuracy and completeness of spreadsheets that we use for a variety of purposes including revenue, taxes, stock-based compensation and other areas, and place significant reliance on, for our financial reporting.
| 31 |
We intend to take appropriate and reasonable steps to make the necessary improvements to remediate these deficiencies. We are committed to continuing to improve our financial organization including, without limitation, expanding our accounting staff and improving our systems and controls to reduce our reliance on the manual nature of our existing systems. However, due to our size and our financial resources, remediating the several identified weaknesses has not been possible and may not be economically feasible now or in the future.
Changes in Internal Control over Financial Reporting
There were no changes identified in connection with our internal control over financial reporting during the three months ended September 30, 2020, that have materially affected, or are reasonably likely to materially affect, our internal control over financial reporting.
As of December 31, 2019, there were 6,750,000 restricted stock units that had not been settled due to a dispute with a former employee over the required withholding taxes to be paid to the Company for remittance to the appropriate tax authorities. The Company commenced an arbitration action against the former employee regarding the dispute. The former employee also made claims in the arbitration action against the Company for unpaid wages. As stated in a pleading in the arbitration, on March 9, 2020, the Company issued the former employee 6,750,000 shares of the Company’s common stock in settlement of these restricted stock units after taking measures to mitigate the Company’s exposure to penalties and liability for the failure to properly withhold income taxes The Arbitrator issued an interim award of approximately $10,000 in the Company’s favor and a finding against the former employee. Effective June 9, 2020, the Arbitrator issued his final award in the Company’s favor, in the Colorado arbitration. The Arbitrator found against the former employee and awarded the Company costs of $33,985, with interest at 8% per year. Effective July 22, 2020, the Colorado Court confirmed the Arbitration award and entered a final judgement in favor of the Company and against the former employee. The Company is pursuing collection of this debt. This former employee continues to pursue separate litigation against the Company for recovery of alleged consulting fees owed to him for the 2015 calendar year prior to his appointment as an executive officer of the Company and discovery is ongoing in this case and the parties have filed dispositive motions that they are in the process of briefing.
Other than as set forth in the preceding paragraph, we are not currently a party to any material legal proceedings, nor are we aware of any pending or threatened litigation that would have a material adverse effect on our business, operating results, cash flows, or financial condition should such litigation be resolved unfavorably. We have and will continue to have commercial disputes arising in the ordinary course of our business.
In addition to the information set forth in this Form 10-Q, you should also carefully review and consider the risk factors contained in our other reports and periodic filings with the SEC, including, without limitation, the risk factors and uncertainties contained under the caption “Item 1A—Risk Factors” in our Annual Report on Form 10-K for the year ended December 31, 2019 that could materially and adversely affect our business, financial condition, and results of operations. The risk factors discussed in that Form 10-K do not identify all risks that we face because our business operations could also be affected by additional factors that are not known to us or that we currently consider to be immaterial to our operations. There have been no material changes in the significant factors that may affect our business and operations as described in “Item 1A—Risk Factors” of the Annual Report on 10-K for the year ended December 31, 2019 other than as set out below:
| 32 |
The COVID-19 pandemic has adversely impacted, and may continue to adversely impact, the Company’s operations and financial results.
The COVID-19 pandemic has resulted in significant economic uncertainty and disruption. The extent to which our business and financial results are impacted will depend on numerous evolving factors which are uncertain and cannot be predicted, including: the duration and scope of the pandemic; governmental, business and individuals’ actions taken in response; the effect on our customers and customers’ demand for our services and products; the effect on our suppliers and disruptions to the global supply chain; our ability to sell and manufacture our products; disruptions to our operations resulting from the illness of any of our employees; restrictions or disruptions to transportation, including reduced availability of ground or air transport; the ability of our customers to pay for our products; and any closures of our facilities, our suppliers’ facilities, and our customers’ facilities. The effects of the COVID-19 pandemic have resulted and will result in additional expenses and lost or delayed revenue. We have been experiencing disruptions to our business as we implement modifications to travel, work locations and cancellation of events, among other modifications. In addition, the change in macroeconomic conditions may impact the proper functioning of financial and capital markets, foreign currency exchange rates, commodity and energy prices, and interest rates. Even after the COVID-19 pandemic subsides, we may continue to experience adverse impacts to our business and financial results due to any economic recession or depression that occurs, and due to any major public health crises that may occur in the future.
Although our current accounting estimates contemplate current and expected future conditions, as applicable, it is reasonably possible that actual conditions could differ from our expectations, which could materially affect our results of operations and financial position. In particular, a number of estimates have been and will continue to be affected by the ongoing COVID-19 pandemic. The severity, magnitude and duration, as well as the economic consequences of the COVID-19 pandemic, are uncertain, rapidly changing and difficult to predict. As a result, our accounting estimates and assumptions may change over time in response to COVID-19. Such changes could result in future impairments of goodwill, intangible assets, long-lived assets, incremental credit losses on accounts receivable, or excess and obsolete inventory. Any of these events could amplify the other risks and uncertainties described in our Annual Report on Form 10-K for the fiscal year ended December 31, 2019, and could have an adverse effect on our business and financial results.
Item 2. Unregistered Sales of Equity Securities and Use of Proceeds
None.
Item 3. Defaults upon Senior Securities
None.
Item 4. Mine Safety Disclosures
Not applicable
The documents listed in the Exhibit Index of this Form 10-Q are incorporated by reference or are filed with this Form 10-Q, in each case as indicated therein (numbered in accordance with Item 601 of Regulation S-K).
| 33 |
Pursuant to the requirements of Section 13 or 15(d) of the Securities Exchange Act of 1934, the registrant has duly caused this report to be signed on its behalf by the undersigned, thereunto duly authorized.
| SURNA INC. | ||
| (the “Registrant”) | ||
| Dated: November 12, 2020 | By: | /s/ Anthony K. McDonald |
| Anthony K. McDonald | ||
| Chief Executive Officer and President | ||
| (Principal Executive Officer) | ||
| Dated: November 12, 2020 | By: | /s/ Anthony K. McDonald |
| Anthony K. McDonald | ||
| Principal Financial and Accounting Officer |
| 34 |
| Exhibit | ||
| Number | Description of Exhibit | |
| 31.1 * | Certification of Principal Executive Officer, pursuant to 18 U.S.C. Section 1350 as adopted pursuant to Section 302 of the Sarbanes-Oxley Act of 2002. | |
| 31.2 * | Certification of Principal Financial and Accounting Officer, pursuant to 18 U.S.C. Section 1350 as adopted pursuant to Section 302 of the Sarbanes-Oxley Act of 2002. | |
| 32.1** | Certification of Principal Executive Officer, pursuant to 18 U.S.C. Section 1350 as adopted pursuant to Section 906 of the Sarbanes-Oxley Act of 2002. | |
| 32.2** | Certification of Principal Financial and Accounting, pursuant to 18 U.S.C. Section 1350 as adopted pursuant to Section 906 of the Sarbanes-Oxley Act of 2002. | |
| 101.INS* | XBRL Instance Document | |
| 101.SCH* | XBRL Taxonomy Schema | |
| 101.CAL* | XBRL Taxonomy Calculation Linkbase | |
| 101.DEF* | XBRL Taxonomy Definition Linkbase | |
| 101.LAB* | XBRL Taxonomy Label Linkbase | |
| 101.PRE* | XBRL Taxonomy Presentation Linkbase |
| * | Filed herewith. |
| ** | Furnished herewith. |
| 35 |