Attached files
| file | filename |
|---|---|
| EX-99.1 - EX-99.1 - MERIT MEDICAL SYSTEMS INC | mmsi-20201110xex99d1.htm |
| 8-K - 8-K - MERIT MEDICAL SYSTEMS INC | mmsi-20201110x8k.htm |
Exhibit 99.2
| 1 Investor Call November 10, 2020 Foundations for Growth |

| 2 CAUTIONARY STATEMENT REGARDING FORWARD-LOOKING STATEMENTS This presentation and any accompanying management commentary include “forward-looking statements,” as defined within applicable securities laws and regulations. All statements in this presentation, other than statements of historical fact, are “forward-looking statements”, including without limitation estimates and statements regarding Merit's forecasted plans, net sales, net income or loss (GAAP and non-GAAP), gross and operating margins (GAAP and non-GAAP), earnings per share (GAAP and non-GAAP), free cash flow, compound annual growth rate, effective tax rate and other financial results, the potential impact, scope and duration of, and Merit’s response to, the coronavirus (COVID-19) pandemic, consolidation of Merit’s facilities or other expense reduction initiatives, future growth and profit expectations, the consequences of existing or future regulatory approvals, or the development and commercialization of new products. In some cases, forward-looking statements can be identified by the use of terminology such as “may,” “will,” “likely,” “expects,” “plans,” “anticipates,” “intends,” “believes,” “estimates,” “projects,” ”forecast,” “potential,” “plan,” or other comparable terminology. Merit’s future financial and operating results and condition, as well as any forward-looking statements, are subject to inherent risks and uncertainties such as those described in its Annual Report on Form 10-K for the year ended December 31, 2019 (as amended by Amendment No. 1 to Annual Report on Form 10-K/A, the “2019 Annual Report”), its subsequent Quarterly Reports on Form 10-Q, and other filings with the U.S. Securities and Exchange Commission. Such risks and uncertainties include inherent risks and uncertainties relating to Merit’s internal models or the projections in this presentation; risks and uncertainties associated with the COVID-19 pandemic and Merit’s response thereto; risks relating to Merit’s potential inability to successfully manage growth through acquisitions generally, including the inability to effectively integrate acquired operations or products or commercialize technology developed internally or acquired through completed, proposed or future transactions; negative changes in economic and industry conditions in the United States or other countries; expenditures relating to research, development, testing and regulatory approval or clearance of Merit’s products and risks that such products may not be developed successfully or approved for commercial use; governmental scrutiny and regulation of the medical device industry, including governmental inquiries, investigations and proceedings involving Merit; litigation and other judicial proceedings affecting Merit; restrictions on Merit’s liquidity or business operations resulting from its debt agreements; infringement of Merit’s technology or the assertion that Merit’s technology infringes the rights of other parties; actions of activist shareholders; product recalls and product liability claims; changes in customer purchasing patterns or the mix of products Merit sells; risks and uncertainties associated with Merit’s information technology systems, including the potential for breaches of security and evolving regulations regarding privacy and data protection; increases in the prices of commodity components; the potential of fines, penalties or other adverse consequences if Merit’s employees or agents violate the U.S. Foreign Corrupt Practices Act or other laws or regulations; laws and regulations targeting fraud and abuse in the healthcare industry; potential for significant adverse changes in governing regulations, including reforms to the procedures for approval or clearance of Merit’s products by the U.S. Food & Drug Administration or comparable regulatory authorities in other jurisdictions; changes in tax laws and regulations in the United States or other countries; termination or interruption of relationships with Merit’s suppliers, or failure of such suppliers to perform; fluctuations in exchange rates; concentration of a substantial portion of Merit’s revenues among a few products and procedures; development of new products and technology that could render Merit’s existing or future products obsolete; market acceptance of new products; volatility in the market price of Merit’s common stock; modification or limitation of governmental or private insurance reimbursement policies; changes in healthcare policies or markets related to healthcare reform initiatives; failure to comply with applicable environmental laws; changes in key personnel; work stoppage or transportation risks; introduction of products in a timely fashion; price and product competition; availability of labor and materials; fluctuations in and obsolescence of inventory; and other factors referenced in the 2019 Annual Report and other materials filed with the Securities and Exchange Commission. All forward-looking statements in this presentation or subsequent forward-looking statements attributable to Merit or persons acting on its behalf are expressly qualified in their entirety by these cautionary statements. Actual results will likely differ, and may differ materially, from those projected or assumed in the forward-looking statements. Financial estimates are subject to change and are not intended to be relied upon as predictions of future operating results. All forward-looking statements, including financial estimates, included in this presentation are made as of the date of this presentation, and are based on information available to Merit as of such date, and Merit assumes no obligation to update or disclose revisions to any forward-looking statement, except as required by law or regulation. 2 |
| 3 NON-GAAP FINANCIAL MEASURES Although Merit’s financial statements are prepared in accordance with accounting principles generally accepted in the United States of America (“GAAP”), Merit’s management believes that certain non-GAAP financial measures provide investors with useful information regarding the underlying business trends and performance of Merit’s ongoing operations and can be useful for period-over-period comparisons of such operations. Certain financial measures included in this presentation, or which may be referenced in management’s discussion of Merit’s historical and future operations and financial results, have not been calculated in accordance with GAAP, and, therefore, are referenced as non-GAAP financial measures. Readers should consider non-GAAP measures used in this presentation in addition to, not as a substitute for, financial reporting measures prepared in accordance with GAAP. These non-GAAP financial measures generally exclude some, but not all, items that may affect Merit's net income. In addition, they are subject to inherent limitations as they reflect the exercise of judgment by management about which items are excluded. Additionally, non-GAAP financial measures used in this presentation may not be comparable with similarly titled measures of other companies. Merit urges investors and potential investors to review the reconciliations of its non-GAAP financial measures to the comparable GAAP financial measures, and not to rely on any single financial measure to evaluate Merit’s business or results of operations. Please refer to “Notes to Non-GAAP Financial Measures” at the end of these materials for more information. TRADEMARKS Unless noted otherwise, trademarks used in this presentation are the property of Merit Medical Systems, Inc., in the United States and other jurisdictions. 3 |
| 4 During the call, we will share additional color in three areas: Process to-date to develop our “Foundations for Growth” Program Projected financial profile of Merit at the end of 2023 Assumptions supporting the forecasted improvement in profitability and cash flow generation Formal announcement of Merit Medical's financial targets for the three-year period ending December 31, 2023 Open the call for questions Note: The slide presentation prepared for this call has been furnished to the SEC and is available on the IR portion of Merit’s website Objectives of today's call |
| 5 Intro – process update Merit's recent activities at a glance Strong Q3 results reported on October 28th We are dedicated to deliver short- and long-term improvement of our financials – and have several initiatives well underway • On track to complete transfer of 14 product lines to our facilities in Mexico and Texas, US • Completed the closure of our Malvern and West Jordan manufacturing operations • Closure of our pack business in Australia to be completed by end of year • Closure of our Temecula site, with production moved to Texas, US • Continued focus and emphasis on R&D and product introductions Today we formally announce our incremental efforts to further embark on this journey as a company: Foundations for Growth 5 |
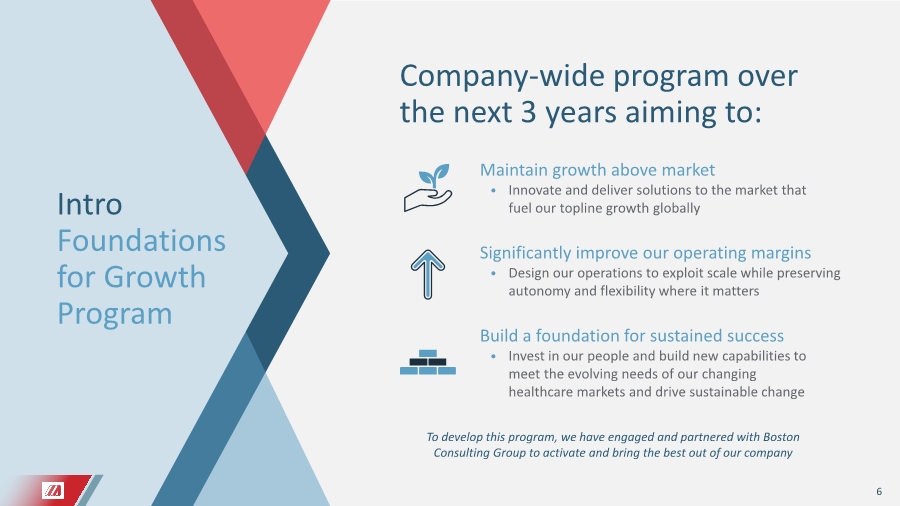
| 6 To develop this program, we have engaged and partnered with Boston Consulting Group to activate and bring the best out of our company Build a foundation for sustained success • Invest in our people and build new capabilities to meet the evolving needs of our changing healthcare markets and drive sustainable change Company-wide program over the next 3 years aiming to: Intro Foundations for Growth Program Maintain growth above market • Innovate and deliver solutions to the market that fuel our topline growth globally Significantly improve our operating margins • Design our operations to exploit scale while preserving autonomy and flexibility where it matters |
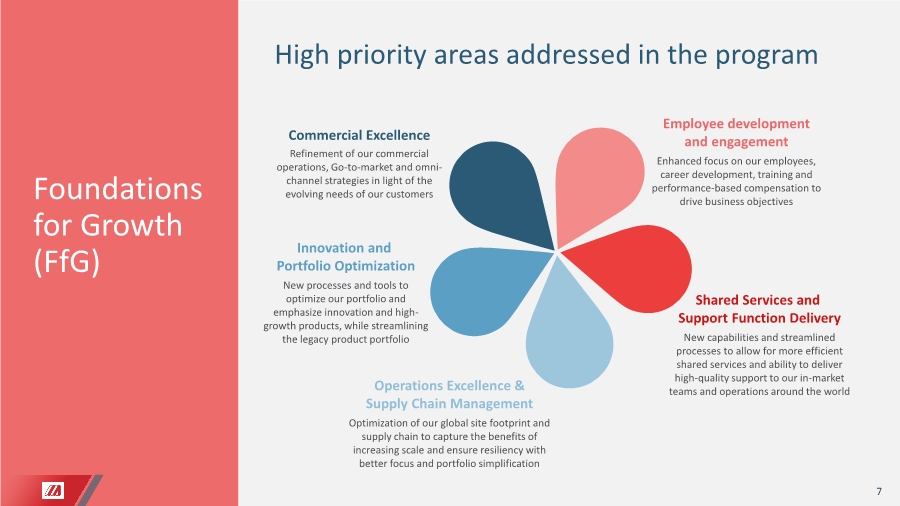
| 7 Commercial Excellence Refinement of our commercial operations, Go-to-market and omni- channel strategies in light of the evolving needs of our customers Foundations for Growth (FfG) Innovation and Portfolio Optimization New processes and tools to optimize our portfolio and emphasize innovation and high- growth products, while streamlining the legacy product portfolio Operations Excellence & Supply Chain Management Optimization of our global site footprint and supply chain to capture the benefits of increasing scale and ensure resiliency with better focus and portfolio simplification Employee development and engagement Enhanced focus on our employees, career development, training and performance-based compensation to drive business objectives Shared Services and Support Function Delivery New capabilities and streamlined processes to allow for more efficient shared services and ability to deliver high-quality support to our in-market teams and operations around the world High priority areas addressed in the program |
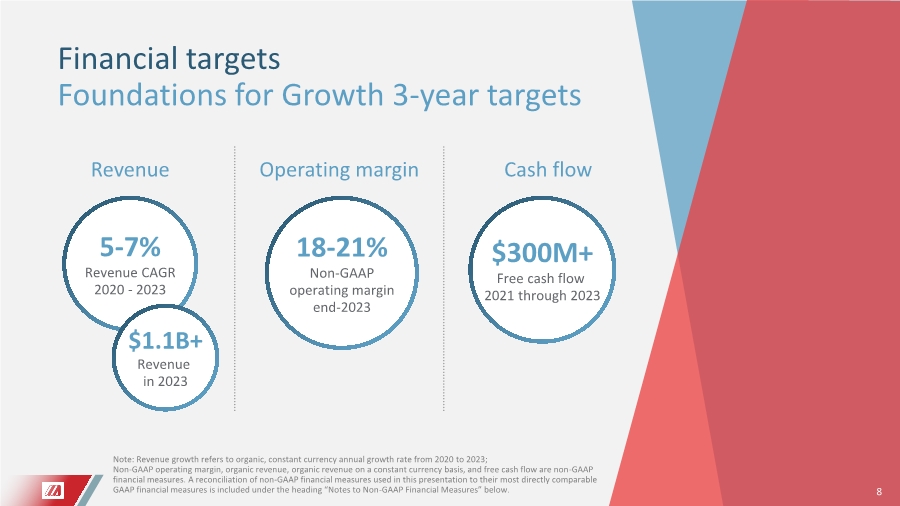
| 8 Financial targets Foundations for Growth 3-year targets 5-7% Revenue CAGR 2020 - 2023 Revenue 18-21% Non-GAAP operating margin end-2023 Operating margin Cash flow $300M+ Free cash flow 2021 through 2023 $1.1B+ Revenue in 2023 Note: Revenue growth refers to organic, constant currency annual growth rate from 2020 to 2023; Non-GAAP operating margin, organic revenue, organic revenue on a constant currency basis, and free cash flow are non-GAAP financial measures. A reconciliation of non-GAAP financial measures used in this presentation to their most directly comparable GAAP financial measures is included under the heading “Notes to Non-GAAP Financial Measures” below. 8 |
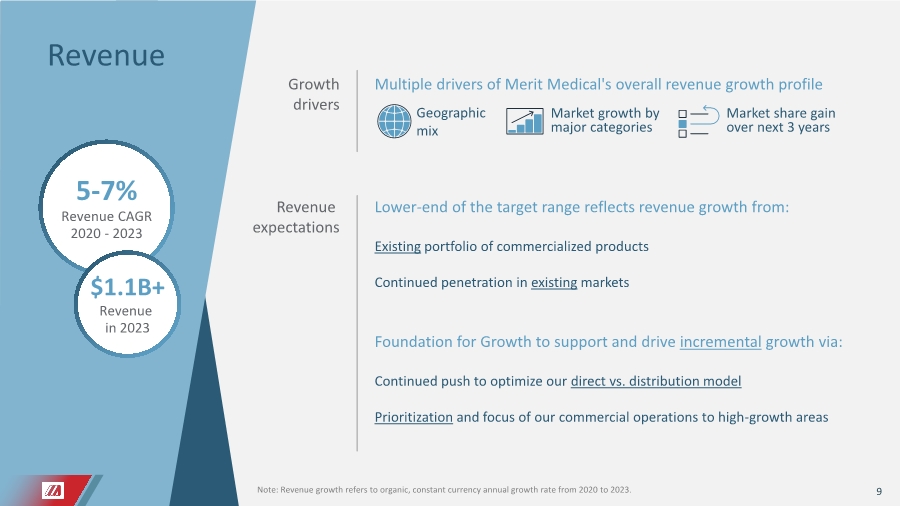
| 9 Revenue Note: Revenue growth refers to organic, constant currency annual growth rate from 2020 to 2023. 5-7% Revenue CAGR 2020 - 2023 $1.1B+ Revenue in 2023 Geographic mix Market growth by major categories Market share gain over next 3 years Growth drivers Revenue expectations Lower-end of the target range reflects revenue growth from: Existing portfolio of commercialized products Continued penetration in existing markets Foundation for Growth to support and drive incremental growth via: Continued push to optimize our direct vs. distribution model Prioritization and focus of our commercial operations to high-growth areas Multiple drivers of Merit Medical's overall revenue growth profile |
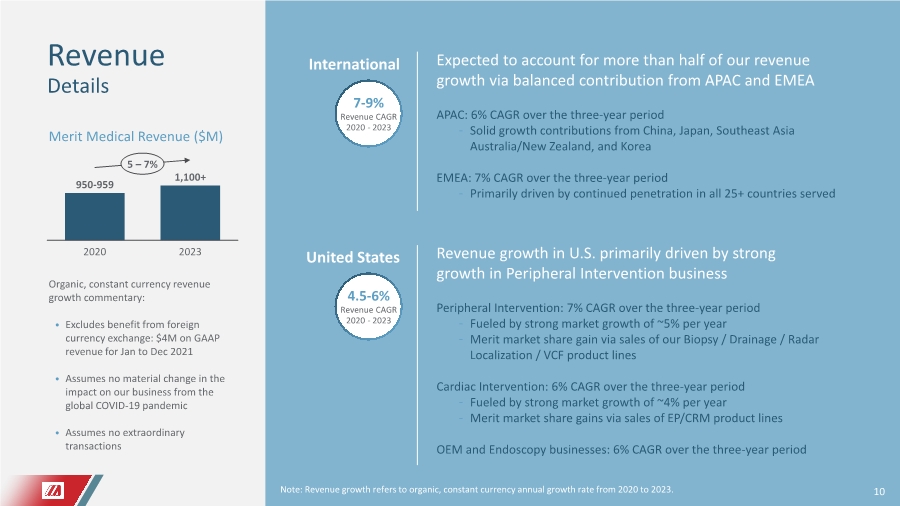
| 10 Organic, constant currency revenue growth commentary: • Excludes benefit from foreign currency exchange: $4M on GAAP revenue for Jan to Dec 2021 • Assumes no material change in the impact on our business from the global COVID-19 pandemic • Assumes no extraordinary transactions 2020 2023 1,100+ 950-959 5 – 7% Merit Medical Revenue ($M) Revenue Details International Expected to account for more than half of our revenue growth via balanced contribution from APAC and EMEA 7-9% Revenue CAGR 2020 - 2023 APAC: 6% CAGR over the three-year period – Solid growth contributions from China, Japan, Southeast Asia Australia/New Zealand, and Korea EMEA: 7% CAGR over the three-year period – Primarily driven by continued penetration in all 25+ countries served United States Revenue growth in U.S. primarily driven by strong growth in Peripheral Intervention business 4.5-6% Revenue CAGR 2020 - 2023 Peripheral Intervention: 7% CAGR over the three-year period – Fueled by strong market growth of ~5% per year – Merit market share gain via sales of our Biopsy / Drainage / Radar Localization / VCF product lines Cardiac Intervention: 6% CAGR over the three-year period – Fueled by strong market growth of ~4% per year – Merit market share gains via sales of EP/CRM product lines OEM and Endoscopy businesses: 6% CAGR over the three-year period Note: Revenue growth refers to organic, constant currency annual growth rate from 2020 to 2023. 10 |
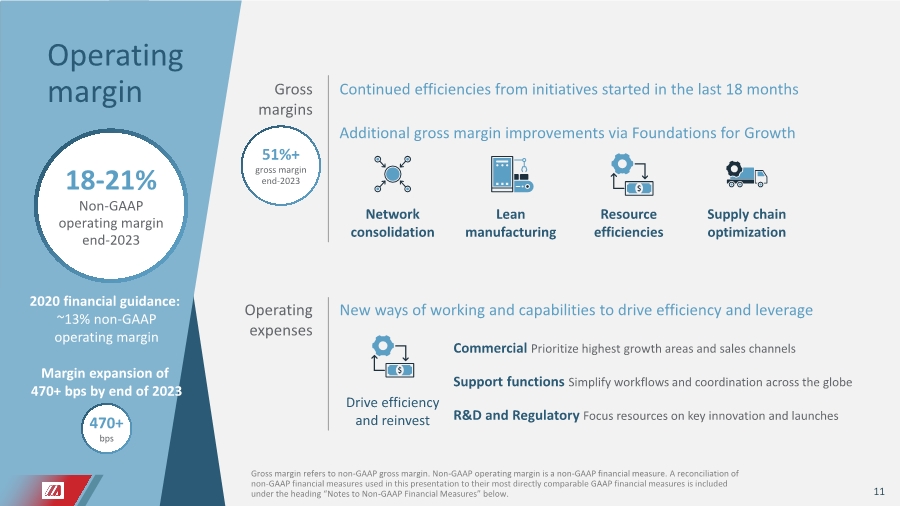
| 11 Operating margin 18-21% Non-GAAP operating margin end-2023 Gross margins Operating expenses Continued efficiencies from initiatives started in the last 18 months New ways of working and capabilities to drive efficiency and leverage 2020 financial guidance: ~13% non-GAAP operating margin Margin expansion of 470+ bps by end of 2023 51%+ gross margin end-2023 470+ bps Additional gross margin improvements via Foundations for Growth Network consolidation Lean manufacturing Resource efficiencies Supply chain optimization Commercial Prioritize highest growth areas and sales channels Support functions Simplify workflows and coordination across the globe R&D and Regulatory Focus resources on key innovation and launches Drive efficiency and reinvest Gross margin refers to non-GAAP gross margin. Non-GAAP operating margin is a non-GAAP financial measure. A reconciliation of non-GAAP financial measures used in this presentation to their most directly comparable GAAP financial measures is included under the heading “Notes to Non-GAAP Financial Measures” below. |
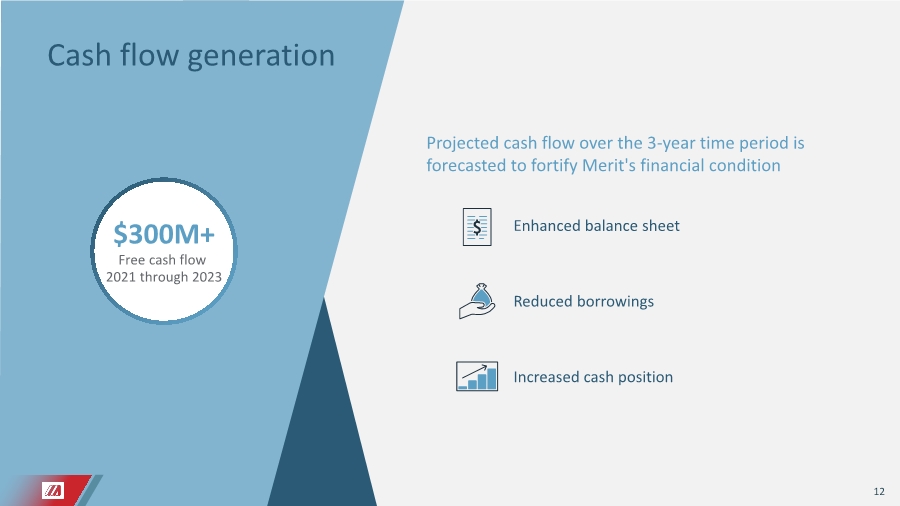
| 12 $300M+ Free cash flow 2021 through 2023 Cash flow generation Projected cash flow over the 3-year time period is forecasted to fortify Merit's financial condition Enhanced balance sheet Reduced borrowings Increased cash position |
| 13 Questions & Answers 13 |

| 14 Appendix 14 |

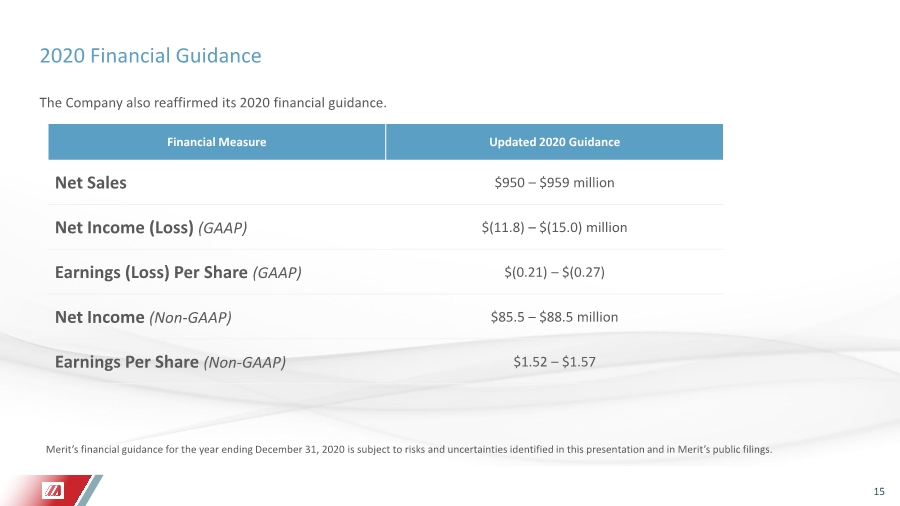
| 15 2020 Financial Guidance The Company also reaffirmed its 2020 financial guidance. Merit’s financial guidance for the year ending December 31, 2020 is subject to risks and uncertainties identified in this presentation and in Merit’s public filings. Financial Measure Updated 2020 Guidance Net Sales $950 – $959 million Net Income (Loss) (GAAP) $(11.8) – $(15.0) million Earnings (Loss) Per Share (GAAP) $(0.21) – $(0.27) Net Income (Non-GAAP) $85.5 – $88.5 million Earnings Per Share (Non-GAAP) $1.52 – $1.57 |
| 16 Notes to non-GAAP financial measures For additional details, please see the accompanying press release and forward-looking statement disclosure. These presentation materials and associated commentary from Merit’s management, as well as the press release issued today, reference non-GAAP financial measures, including: • organic revenue, • organic revenue on a constant currency basis, • non-GAAP gross margin, • non-GAAP operating margin, and • free cash flow. Merit’s management team uses these non-GAAP financial measures to evaluate Merit’s profitability and efficiency, to compare operating results to prior periods, to evaluate changes in the operating results of its operating segments, and to measure and allocate financial resources internally. However, Merit’s management does not consider such non-GAAP measures in isolation or as an alternative to measures determined in accordance with GAAP. Readers should consider non-GAAP measures used in this presentation in addition to, not as a substitute for, financial reporting measures prepared in accordance with GAAP. These non-GAAP financial measures generally exclude some, but not all, items that may affect Merit’s net income. In addition, they are subject to inherent limitations as they reflect the exercise of judgment by management about which items are excluded. Merit believes it is useful to exclude such items in the calculation of non-GAAP gross margin and non-GAAP operating margin because such amounts in any specific period may not directly correlate to the underlying performance of Merit’s business operations and can vary significantly between periods as a result of factors such as acquisition transactions, non-cash expenses related to amortization or write-off of previously acquired tangible and intangible assets, severance expenses, expenses resulting from non-ordinary course litigation or administrative proceedings and resulting settlements, and corporate transformation expenses. Merit may incur similar types of expenses in the future, and the non-GAAP financial information included in this presentation should not be viewed as a statement or indication that these types of expenses will not recur. Additionally, the non-GAAP financial measures used in this presentation may not be comparable with similarly titled measures of other companies. Merit urges investors and potential investors to review the reconciliations of its non-GAAP financial measures to the comparable GAAP financial measures, and not to rely on any single financial measure to evaluate Merit’s business or results of operations. |
| 17 Notes to non-GAAP financial measures (cont.) Organic Revenue and Organic Revenue on a Constant Currency Basis Merit’s organic revenue is defined as GAAP revenue adjusted for revenue from acquisitions or divestitures. Organic revenue on a constant currency basis is defined as organic revenue adjusted to eliminate the foreign exchange impact related to that organic revenue for the relevant period, using the applicable average foreign exchange rates in effect for the comparable prior-year periods presented. In the case of this presentation, the comparable baseline year is the year ending December 31, 2020. The compound annual growth rate (CAGR) calculation excludes a forecasted $4 million benefit from foreign exchange fluctuations for the year ending December 31, 2021. Non-GAAP Gross Margin Non-GAAP gross margin is calculated by reducing GAAP cost of sales by amounts recorded for amortization of intangible assets. Non-GAAP Operating Margin Non-GAAP operating margin is calculated by adjusting GAAP operating income for certain items which are deemed by Merit’s management to be outside of core operations and vary in amount and frequency among periods, such as expenses related to new acquisitions, non-cash expenses related to amortization or write-off of previously acquired tangible and intangible assets, severance expenses, performance-based stock compensation expenses, corporate transformation expenses, expenses resulting from non-ordinary course litigation or administrative proceedings and resulting settlements, governmental proceedings or changes in industry regulations, as well as other items that could arise but which are not currently anticipated by management. Free Cash Flow Free cash flow is defined as cash flow from operations calculated in accordance with GAAP less capital expenditures calculated in accordance with GAAP, as set forth in the consolidated statement of cash flows. |
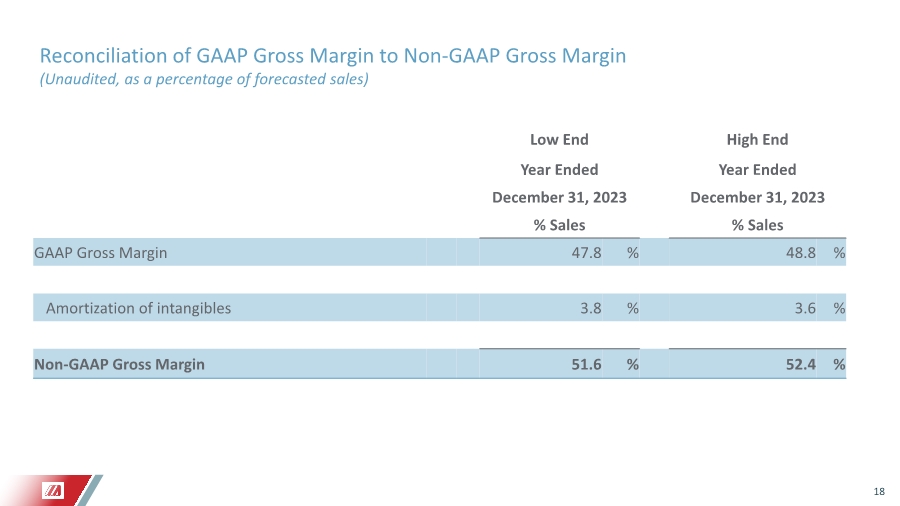
| 18 Reconciliation of GAAP Gross Margin to Non-GAAP Gross Margin (Unaudited, as a percentage of forecasted sales) Low End High End Year Ended Year Ended December 31, 2023 December 31, 2023 % Sales % Sales GAAP Gross Margin 47.8 % 48.8 % Amortization of intangibles 3.8 % 3.6 % Non-GAAP Gross Margin 51.6 % 52.4 % |
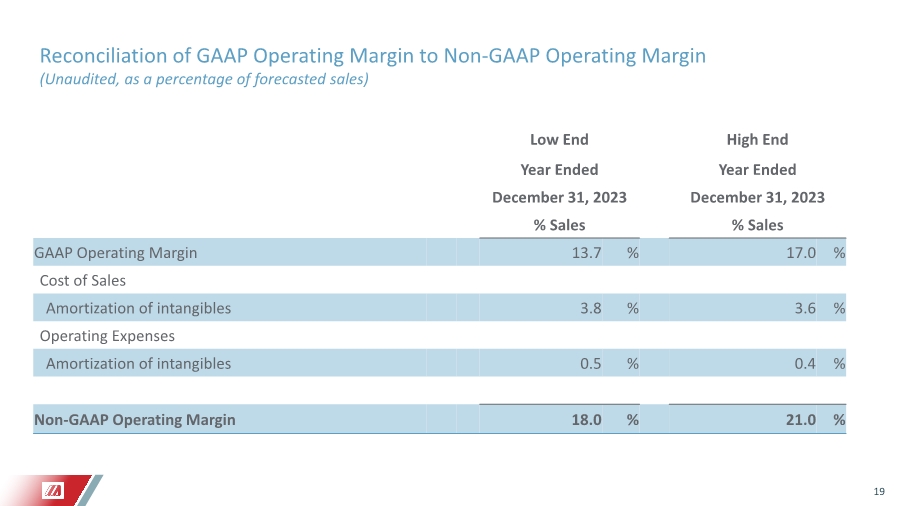
| 19 Reconciliation of GAAP Operating Margin to Non-GAAP Operating Margin (Unaudited, as a percentage of forecasted sales) Low End High End Year Ended Year Ended December 31, 2023 December 31, 2023 % Sales % Sales GAAP Operating Margin 13.7 % 17.0 % Cost of Sales Amortization of intangibles 3.8 % 3.6 % Operating Expenses Amortization of intangibles 0.5 % 0.4 % Non-GAAP Operating Margin 18.0 % 21.0 % |
|