Attached files
| file | filename |
|---|---|
| EX-21 - EX-21 - MERIT MEDICAL SYSTEMS INC | a09-35848_1ex21.htm |
| EX-31.2 - EX-31.2 - MERIT MEDICAL SYSTEMS INC | a09-35848_1ex31d2.htm |
| EX-32.1 - EX-32.1 - MERIT MEDICAL SYSTEMS INC | a09-35848_1ex32d1.htm |
| EX-32.2 - EX-32.2 - MERIT MEDICAL SYSTEMS INC | a09-35848_1ex32d2.htm |
| EX-23.1 - EX-23.1 - MERIT MEDICAL SYSTEMS INC | a09-35848_1ex23d1.htm |
| EX-31.1 - EX-31.1 - MERIT MEDICAL SYSTEMS INC | a09-35848_1ex31d1.htm |
UNITED
STATES
SECURITIES AND EXCHANGE COMMISSION
Washington, D.C. 20549
FORM 10-K
(Mark One)
x Annual report pursuant to Section 13 or 15(d) of the Securities Exchange Act of 1934 for the fiscal year ended December 31, 2009,
or
o Transition report pursuant to Section 13 or 15(d) of the Securities Exchange Act of 1934.
MERIT MEDICAL SYSTEMS, INC.
(Exact name of registrant as specified in its charter)
|
Utah |
|
0-18592 |
|
87-0447695 |
|
(State or other jurisdiction |
|
(Commission File No.) |
|
(IRS Employer |
|
of incorporation) |
|
|
|
Identification No.) |
1600 West Merit Parkway
South Jordan, Utah 84095
(Address of principal executive offices, including zip code)
Registrant’s telephone number, including area code: (801) 253-1600
Securities registered pursuant to Section 12(b) of the Act: Common Stock, No Par Value
Securities registered pursuant to Section 12(g) of the Act: None
Indicate by check mark if the registrant is a well-known seasoned issuer, as defined in Rule 405 of the Securities Act. Yes o No x
Indicate by check mark if the registrant is not required to file reports pursuant to Section 13 or Section 15(d) of the Act. Yes o No x
Indicate by check mark whether the registrant (1) has filed all reports required to be filed by Section 13 or 15(d) of the Securities Exchange Act of 1934 during the preceding 12 months (or for such shorter period that the registrant was required to file such reports), and (2) has been subject to such filing requirements for the past 90 days. Yes x No o
Indicate by check mark whether the registrant has submitted electronically and posted on its corporate web site, if any, every Interactive Data File required to be submitted and posted pursuant to Rule 405 of Regulation S-T (§ 229.405 of this chapter) during the preceding 12 months (or for such shorter period that the registrant was required to submit and post such files). Yes o No o
Indicate by check mark if disclosure of delinquent filers pursuant to Item 405 of Regulation S-K is not contained herein, and will not be contained, to the best of the registrant’s knowledge, in definitive proxy or information statements incorporated by reference in Part III of this Form 10-K or any amendment to this Form 10-K. x
Indicate by check mark whether the registrant is a large accelerated filer, an accelerated filer or a non-accelerated filer, or a smaller reporting company. See the definitions of “large accelerated filer,” “accelerated filer,” and “smaller reporting company” in Rule 12b-2 of the Exchange Act.:
|
Large accelerated filer o |
|
Accelerated filer x |
|
|
|
|
|
Non-accelerated filer o |
|
Smaller reporting company o |
Indicate by check mark whether the registrant is a shell company (as defined in Rule 12b-2 of the Exchange Act). Yes o No x
The aggregate market value of the registrant’s common stock held by non-affiliates of the registrant, on June 30, 2009, which is the last day of the registrant’s most recently completed second fiscal quarter (based upon the closing sale price of the registrant’s common stock on the NASDAQ National Market System on June 30, 2009), was approximately $425,936,800. Shares of common stock held by each officer and director of the registrant and by each person who may be deemed to be an affiliate have been excluded.
As of March 5, 2010, the registrant had 28,180,527shares of the registrant’s common stock outstanding.
DOCUMENTS INCORPORATED BY REFERENCE
Portions of the following document are incorporated by reference in Part III of this Report: the registrant’s definitive proxy statement relating to the Annual Meeting of Shareholders scheduled for May 26, 2010.
|
|
1 |
|
|
|
|
|
|
1 |
||
|
|
|
|
|
10 |
||
|
|
|
|
|
14 |
||
|
|
|
|
|
14 |
||
|
|
|
|
|
15 |
||
|
|
|
|
|
Item 4. |
[Reserved] |
|
|
|
|
|
|
|
16 |
|
|
|
|
|
|
16 |
||
|
|
|
|
|
19 |
||
|
|
|
|
|
Management’s Discussion and Analysis of Financial Condition and Results of Operations |
20 |
|
|
|
|
|
|
24 |
||
|
|
|
|
|
25 |
||
|
|
|
|
|
Changes in and Disagreements With Accountants on Accounting and Financial Disclosure |
53 |
|
|
|
|
|
|
53 |
||
|
|
|
|
|
56 |
||
|
|
|
|
|
|
56 |
|
|
|
|
|
|
56 |
||
|
|
|
|
|
|
56 |
|
|
|
|
|
|
56 |
||
|
|
|
|
|
|
60 |
|
Unless otherwise indicated in this report, “Merit,” “we,” “us,” “our,” and similar terms refer to Merit Medical Systems, Inc. and our consolidated subsidiaries.
DISCLOSURE REGARDING FORWARD-LOOKING STATEMENTS
This report includes “forward-looking statements” within the meaning of Section 27A of the Securities Act of 1933, as amended (the “Securities Act”), and Section 21E of the Securities Exchange Act of 1934, as amended (the “Exchange Act”). All statements other than statements of historical fact are “forward-looking statements” for purposes of these provisions, including any projections of earnings, revenues or other financial items, any statements of the plans and objectives of management for future operations, any statements concerning proposed new products or services, any statements regarding future economic conditions or performance, and any statements of assumptions underlying any of the foregoing. All forward-looking statements included in this report are made as of the date hereof and are based on information available to us as of such date. We assume no obligation to update any forward-looking statement. In some cases, forward-looking statements can be identified by the use of terminology such as “may,” “will,” “expects,” “plans,” “anticipates,” “intends,” “believes,” “estimates,” “potential,” or “continue,” or the negative thereof or other comparable terminology. Although we believe that the expectations reflected in the forward-looking statements contained herein are reasonable, there can be no assurance that such expectations or any of the forward-looking statements will prove to be correct, and actual results could differ materially from those projected or assumed in the forward-looking statements. Future financial condition and results of operations, as well as any forward-looking statements, are subject to inherent risks and uncertainties, including risks relating to the integration of the business, assets and operations we acquired in transactions we completed with Alveolus, Inc. (“Alveolus”) and Biosearch Medical Products, Inc., a wholly-owned subsidiary of Hydromer, Inc. (“Biosearch”), Hatch Medical, L.L.C. (“Hatch”) and Vysera BioMedical Limited (“Vysera”); challenges associated with our efforts to pursue new market opportunities, including opportunities in the gastroenterology and pulmonary markets; infringement of Merit’s technology or the assertion that Merit’s technology infringes the rights of other parties; product recalls and product liability claims; infringement of our technology or the assertion that our technology infringes the rights of other parties; product recalls and product liability claims; downturn of the national economy and its effect on our revenues, collections and supplier relations; termination of supplier relationships, or failure of suppliers to perform; inability to successfully manage growth through acquisitions; delays in obtaining regulatory approvals, or the failure to maintain such approvals; concentration of our revenues among a few products and procedures; development of new products and technologies that could render our products obsolete; market acceptance of new products; delayed introduction of products; price and product competition; availability of labor and materials; cost increases; fluctuations in and obsolescence of inventory; volatility of the market price of our common stock (the “Common Stock”); foreign currency fluctuations; changes in key personnel; work stoppage or transportation risks; modification or limitation of governmental or private insurance reimbursement; changes in health care markets related to health care reform initiatives; failure to comply with environmental laws and regulations and other factors referenced in our press releases and reports filed with the Securities and Exchange Commission (the “SEC”). All subsequent forward-looking statements attributable to us or persons acting on our behalf are expressly qualified in their entirety by these cautionary statements. Additional factors that may have a direct bearing on our operating results are described under Item 1A. “Risk Factors” beginning on page 10.
GENERAL
Merit Medical Systems, Inc. designs, develops, manufactures and markets single-use medical products for interventional and diagnostic procedures. Our focus is divided into four markets: cardiology, radiology, gastroenterology and pulmonary. We are able to introduce new products and capture significant market share because of our expertise in product design, our proprietary technology and our skills in injection and insert molding. Our innovative products are designed to enable physicians and other healthcare professionals perform interventional and diagnostic procedures with enhanced patient care and efficiency.
Our broad offering of cardiology and radiology medical device products assists in diagnosing and treating coronary artery disease, peripheral vascular disease and other non-vascular diseases. Our innovative products aid in conducting dialysis treatment for kidney failure, performing drainage procedures and clearing clots, as well as removing foreign objects from the vasculature, providing access into vasculature and recording hemo-dynamic pressure. These products, which are distributed through our direct sales force and through distributors, include inflation devices, snares, non-vascular stents, aspiration extraction catheters, angiographic catheters, dialysis catheters, micro catheters, sheath introducers and micro access products, standard and hydrophilic coated guide wires, transducers and pressure monitoring accessories, needles, safety products, therapeutic infusion catheters and accessories, drainage catheters, waste
management systems, high pressure tubing and contrast management systems, pressure infusion bags, syringes, safety scalpels, coagulation probes, kits and procedure trays.
Our gastroenterology and pulmonary medical device products assist physicians, nurses and technicians in the palliative treatment of expanding esophageal, tracheobronchial and biliary strictures caused by malignant tumors. These products, which are distributed through our direct sales force as well as through distributors, include esophageal and tracheobronchial stents pre-loaded on a catheter-based delivery system, guide wires and sizing devices. Our esophageal stent helps occlude esophageal tracheal fistula. Our newest division, Merit Endotek™, creates, develops, manufactures and distributes our new line of gastroenterology and pulmonary medical device products.
Our Original Equipment Manufacturers division (“OEM”) is engaged in efforts to expand the markets in which Merit products are distributed. We sell molded components, sub-assembled goods, and bulk non-sterile goods, which are combined with other components and/or goods from other companies and then sold under a Merit or non-Merit label. Our OEM division sells products in international and domestic markets.
During the first quarter of 2009, we entered into an asset purchase agreement and supply agreement with Biosearch, pursuant to which we purchased a bipolar coagulation probe and grafted biliary stents. During the first quarter of 2009, we also entered into an asset purchase agreement with Alveolus, pursuant to which, among other things, we purchased substantially all of Alveolus’ assets. The assets acquired relate to Alveolus’ non-vascular interventional stent business for esophageal, tracheobronchial and biliary stenting procedures.
During the second quarter of 2009, we entered into an asset purchase agreement with Hatch, pursuant to which we purchased assets associated with the EN Snare® foreign body retrieval system.
During the fourth quarter of 2009, we entered into an exclusive license, development and supply agreement with Vysera, pursuant to which Vysera granted to us an exclusive license to use, modify and sell certain valve technology and biomaterial coating technology for medical devices (the “Vysera Technology”) and other intellectual property associated with the Vysera Technology, and to develop and market improvements to the Vysera Technology.
Merit Medical Systems, Inc. was organized in July 1987 as a Utah corporation. We also conduct our operations through a number of domestic and foreign subsidiaries. Our principal offices are located at 1600 West Merit Parkway, South Jordan, Utah, 84095, and our telephone number is (801) 253-1600. See Item 2. “Properties.” We maintain an Internet website at www.merit.com.
PRODUCTS
We develop, manufacture and market innovative products that offer a high level of quality, value, and safety to our customers, as well as the patients they serve. In response to feedback from health care professionals, we have devoted our focus to four primary areas, cardiology, radiology, pulmonary and gastroenterology. We have expanded our product offerings into other parts of radiology, including interventional nephrology, CT and ultrasound labs. Our products are also used in other clinical areas such as pain management centers, vein clinics, endovascular surgery, and thoracic surgery, as well as in other areas of the health care industry.
The competitive advantages of our products are enhanced by the extensive experience of our management team in the health care industry; our experienced direct sales force and distributors; our ability to combine and customize devices, kits, and trays at the request of our customers; and our dedication to offering “stick to stitch” solutions in the markets we serve worldwide.
Cardiology and Radiology Products
Interventional cardiology is a branch of the medical specialty of cardiology that deals specifically with the catheter-based diagnosis and treatment of heart diseases. A large number of procedures can be performed by catheterization, and more commonly involve the insertion of a sheath into the femoral, radial, or brachial artery. Fluoroscopy (real-time moving X-ray images) and computed tomography or three-dimensional computer generated images are most often used to visualize the vessels and chambers of the heart during these diagnostic and interventional procedures. Percutaneous Coronary Interventions (“PCI”) are used to treat coronary atherosclerosis and the resulting narrowing of the arteries of the heart. Interventional Radiology is related to the minimally invasive treatment of disease in other peripheral vessels and organs of the body and Percutaneous Peripheral Intervention (“PPI”) is used to treat similar disease conditions outside the heart.
Inflation Devices. During PCI and PPI procedures, balloons and/or stents are placed within the vasculature. The balloons must be carefully placed, inflated, and deflated within the vessel in order to achieve optimal results without injury to the patient. For almost two decades, we have offered an extensive, innovative line of inflation devices that accurately measure pressures during balloon and stent deployment. Products like our IntelliSystem® and Monarch® (state of the art digital inflation systems), as well as the Basix™ COMPAK inflation device, offer the clinician a wide range of features and prices, along with the quality and ergonomic superiority for which we are known.
Hemostasis Valves. We have developed a complete line of technically sophisticated, clinically acclaimed hemostasis valves and angioplasty accessories. Hemostasis valves connect to catheters and allow passage of additional guide wires, balloon catheters, and other devices into the vasculature while reducing the amount of blood loss during the procedures.
Vascular Retrieval Devices. An increase in vascular procedures influenced our acquisition of the EN Snare® endovascular system from Hatch in 2009. Primary target markets for our snare technology are cardiology, interventional radiology and vascular surgery. The EN Snare® is intended for use in the cardiovascular system or hollow viscous to retrieve and manipulate foreign objects. The EN Snare® is designed with three loops to increase the probability of foreign body capture and is offered in seven sizes to accommodate a broad range of vessels throughout the body.
Vascular Access Products. We offer a broad line of devices used to gain and maintain vascular access while protecting the clinician from accidental cuts and needle-sticks during the procedure. These effective and useful devices and kits include the Futura® Safety Scalpel and an improved line of angiography needles (Merit Advance®), as well as the SecureLoc™ Angiographic Needle. In addition, we offer an extensive line of sheath introducers (Prelude®) and mini access kits (MAK™ and S-MAK™), which are designed to allow the clinician smooth, less traumatic, and convenient access to the patient’s vasculature. In 2009, we launched an innovative line extension to the Merit Advance® needle offering including several sizes of 21 gauge, echo-enhanced needles. We also added stand-alone Prelude® dilators to complement our sheath introducer line.
Diagnostic Catheters, Guide Wires, and Torque Devices. We offer diagnostic catheters and guide wires for use during both cardiology and radiology angiographic procedures. Merit’s diagnostic catheter offering includes our new Impress® line of diagnostic radiology catheters as well as the Performa® and Softouch® brands for both cardiology and peripheral catheters. These catheters offer interventional radiologists and cardiologists superior performance during a variety of angiography procedures. Additionally, our diagnostic guide wires are used to traverse vascular anatomy and aid in placing catheters and other devices. Our precoated, high performance InQwire® guide wires are lubricious and are available in a wide range of configurations to meet clinicians’ diagnostic needs. The Merit H2O® hydrophilic guide wire provides enhanced maneuverability through tortuous anatomy. We also offer a line of torque devices (guide wire steering tools) that can be used on both standard and hydrophilic guide wires in both large and small diameters and are often included as a component in our angioplasty packs.
Angiography and Angioplasty Accessories. Since the introduction of the CCS™ disposable coronary control syringe line in 1988, we have continued to develop innovative, problem-solving devices, accessories, kits and procedure trays for use during minimally invasive diagnosis and treatment of coronary artery and peripheral disease. In 2009, we complemented the syringe offering with several new product line extensions and enhancements, including sword-handled Medallions, a new 10ml VacLok® and clear-handled syringes. Additionally, we offer an extensive line of kits containing manifolds, syringes, tubing, and disposable pressure transducers (MeriTrans®) for measurement of pressures within the vessels and chambers of the heart. We also provide devices, kits, and procedure trays used to effectively and safely manage fluids, contrast media, and waste during angiography and interventional procedures. For example, in 2009, we introduced a new Miser II™ contrast management system to complement our comprehensive line of fluid management products used in angiography procedures.
Safety and Waste Management Systems. We offer a variety of safety-related products and kits. Our ShortStop® and ShortStop Advantage® temporary sharps holders address the potential safety issues associated with accidental needle sticks. Our extensive line of color-coded Medallion® specialty syringes and the PAL™ medication labeling system (which complies with the latest patient safety initiatives of the Joint Commission on Accreditation of Healthcare Organization (“JCAHO”)) help minimize mix-ups in administering medication. We also offer waste management products to help avoid accidental exposure to contaminated fluids. These include our OSHA-compliant waste disposal basins, including the BackStop®, BackStop Plus™, MiniStop™, MiniStop+™ and DugOut®. In 2009, we added the Grandstand® to the temporary sharps family of products. These products have been designed to complement other Merit devices and are included in many of our kits and procedure trays in order to make the clinical setting safer for both clinicians and the patients.
Drainage Catheters and Accessories. We have a broad line of catheters for nephrostomy, abscess, and other drainage procedures. Our ReSolve® non-locking and locking drainage catheter line has been expanded every year since the product family was introduced in 2006. These catheters’ unique, convenient locking mechanisms are appreciated by clinicians and patients who often comment on the enhanced comfort that the catheter provides them. We also offer a range of catheter fixation devices including the Revolution™ catheter fixation device which was designed to be cost-effective, to save time, and to enhance patient comfort. We also provide a wide selection of accessories that complement our drainage catheters, including tubing sets and drainage bags. For non-vascular applications we offer mini access kits (MAK-NV™). This popular device was designed for easy visualization and quick access into the drainage area. For enhanced visibility, the device features an echo-enhanced needle and radiopaque marker tip on the introducer.
Paracentesis and Pericardiocentesis Catheters. Paracentesis is a procedure to remove fluid that has accumulated in the abdominal cavity (peritoneal fluid). Our One-StepTM centesis catheter and our Safety Paracentesis Procedure Tray are designed to provide clinicians with a safe, convenient, and cost-effective alternative for paracentesis procedures. In 2009, we expanded and improved the One-Step™ product line to include a slip-version of the device that we believe will make our products more competitive in the paracentesis market. Pericardiocentesis is a procedure in which fluid is aspirated from the pericardium (the sac enveloping the heart). Our pericardiocentesis kit is designed as an organized, ready-to-use, convenient tray to assist the clinician in draining fluid quickly from the pericardial sac.
Therapeutic Infusion Catheters. We offer an extensive line of therapeutic thrombolytic infusion systems featuring the Fountain® Infusion Systems and the Mistique® Infusion Catheters. These technically advanced catheters are used to treat thrombus (blood clot) formation in the peripheral vessels of the body.
Multipurpose Microcatheters. In 2009, we introduced a multipurpose microcatheter for the controlled and selected infusion of diagnostic media or the delivery of interventional devices or therapeutic pharmaceuticals into selected blood vessels. These specialty catheters are used to deliver various embolic agents including alcohol, glue, metallic coils, poly-vinyl alcohol particles, encapsulated chemo-microsphere, and gel foam that can block blood vessels (e.g. for the purpose of stopping bleeding) to tissues or organs including uterine artery embolization for percutaneous treatment of uterine fibroids. These hydrophilic-coated microcatheters are used in both peripheral and coronary vasculature.
Products for Dialysis and Interventional Nephrology. In 2007, we acquired the ProGuide™ chronic dialysis catheter product line from Datascope Corporation, a New Jersey corporation (“Datascope”). The ProGuide™ is considered a “workhorse” catheter for chronic dialysis and provides a platform for additional Merit products in the dialysis and interventional nephrology market. For example, the new Prelude® Short Sheath provides vascular access to dialysis grafts, along with our extensive line of micro access devices such as the MAK™ and S-MAK™ line of mini access kits. We also offer a wide range of guide wires, diagnostic catheters, therapeutic infusion systems, and safety products that can be used during dialysis-related procedures. In 2009, we launched the OuTake™ Catheter Extractor. This novel device is used to remove tunneled chronic dialysis catheters from dialysis patients. Also in 2009, we continued to add to our offering of unique products for the dialysis and interventional nephrology market with a curved introducer needle to aid clinicians who choose to place a tunneled dialysis catheter over a wire with a single stick. The Slip-Not® Suture Retention Device provides a unique and effective method for securing a purse-string suture that controls bleeding after an arteriovenous (“AV”) fistula intervention. In addition, we offer the Impress® 30cm angiographic catheters which can be used by interventional nephrologists. Our dialysis and interventional nephrology products are designed to provide comprehensive coverage for completing AV fistula interventions.
Obesity-Related Products. Patient obesity presents an ever-growing challenge to clinicians and patients during vascular access, angiography, and interventional procedures. Our KanguruWeb® abdominal retraction device is designed to address this challenge. This device allows easier vessel access to clinicians while maintaining patient comfort and dignity during interventional cardiology and radiology procedures. In addition, we offer longer angiography and anesthesia needles, as well as mini access kits for improved vascular access of obese patients.
Gastroenterology and Pulmonary Products
Non-Vascular Stents. Our core pulmonary products include the AERO® and AERO DV® Fully Covered Tracheobronchial Stent and offer our customers a patented, self-expanding metal stent used to improve patency of the airways—both tracheal and bronchial—and to offer palliation to patients suffering from the effects of cancer. Our gastroenterology products, the Alimaxx-ES® Fully Covered Esophageal Stent System and the Alimaxx-B® Biliary Stent System are used to palliate symptoms associated with malignant tumors affecting the esophagus and the biliary duct. Additionally, we sell a plastic biliary stent to restore patency and relieve symptoms associated with strictures and blockages within the biliary system. These stents are often used to “stage” treatment of malignant tumors such as pancreatic cancer and other serious conditions. We also sell ancillary products, namely, the AEROSIZER®
tracheobronchial stent sizing device used in interventional pulmonary procedures and the MAXXWIRE®, which is a line of specialty guide wires which have pulmonary applications.
Bi-polar probes. Bi-polar probes are used by physicians as one means of controlling bleeding within a variety of non-vascular systems. These products are currently sold on an OEM basis to customers who further sell them to a large number of gastroenterologists and pulmonologists.
Specialty Procedure Products
In addition to the procedures and devices detailed above, interventional radiology (also referred to as the special procedures or specials lab) performs a variety of additional minimally invasive diagnostic and interventional procedures. We offer a variety of devices and accessories used during these procedures.
Discography Products. Discography is a technique used to determine whether a disc is the source of pain in patients with back or neck pain. During discography, contrast medium is injected into the disc and the patient’s response to the injection is noted. Due to their quality and accuracy, our digital inflation devices (IntelliSystem® and Monarch®) are used in many pain management clinics.
Pressure Sensors. Our sensor division manufactures and sells microelectromechanical systems sensor components focusing on piezoresistive pressure sensors in various forms, including bare silicon die, die mounted on ceramic substrates, and custom assemblies for specific customers.
MARKETING AND SALES
Target Market/Industry. Our target markets include diagnostic and interventional cardiology, interventional radiology, gastroenterology, pulmonology, vascular surgery, interventional nephrology, cardiothoracic surgery, pain management, and thoracic surgery.
According to government statistics, cardiovascular disease continues to be a leading cause of death and a significant health problem in the United States. Treatment options range from dietary changes to surgery, depending on the nature of the specific disease or disorder. Endovascular techniques, including angioplasty, stenting, and endoluminal stent grafts, continue to represent important therapeutic options for the treatment of vascular disease. We derive a large percentage of our revenues from sales of products used during percutaneous (through the skin) diagnostic and interventional procedures such as angiography, angioplasty, and stent placement, and we intend to pursue additional sales growth by building on our existing market position in both catheter technology and accessory products.
In addition to products used in the treatment of coronary and peripheral vascular disease, we continue our efforts to develop and distribute other devices used in the major markets we serve. For example, we have developed and are distributing products used for percutaneous drainage. Prior to the widespread use of CT or ultrasound imaging, surgery was necessary to drain internal fluid from body cavities and organs. Now percutaneous drainage is frequently prescribed as the treatment of choice for many types of fluid collections. Our family of drainage catheters and associated devices are used by physicians in the interventional radiology, vascular surgery, and the cardiology catheter lab for the percutaneous drainage collection of simple serous fluid to viscous fluid (blood, or infected secretion) within the body.
We also service the growing interventional nephrology market. Dialysis, or cleaning of the blood, is necessary in conditions such as acute renal failure, chronic renal failure and end-stage renal disease, or ESRD. The kidneys remove excess water and chemical wastes from blood, permitting clean blood to return to the circulatory system. When the kidneys malfunction, waste substances are not properly excreted, creating an abnormal buildup of wastes in the bloodstream. Dialysis machines are used to treat this condition. Dialysis catheters, which connect the patient to the dialysis machine, are used at various stages in the treatment of dialysis patients. In the past few years, we have added catheters and other accessories to our dialysis-related product offering.
We believe our move into the areas of gastroenterology and pulmonology, as well as thoracic surgery, will open new opportunities to provide not only existing Merit products, such as inflation devices, syringes, centesis catheters, and procedure kits to those markets, but also to provide additional offerings built upon our non-vascular stent technology.
In general, our target markets are characterized by rapid change resulting from technological advances and scientific discoveries. We plan to continue to develop and launch innovative products to support clinical trends designed to address the demands of those markets.
Market Strategy. Our marketing strategy is focused on identifying and introducing a regular flow of highly profitable differentiated products that meet customer needs. In order to stay abreast of customer needs, we seek suggestions from hospital personnel working with our products in cardiology and radiology applications, as well as gastroenterology, pulmonology, and thoracic surgery. Suggestions for new products and product improvements may come from engineers, sales people, physicians and technicians who perform the clinical procedures.
When we determine that a product suggestion demonstrates a sustainable competitive advantage, meets customer needs, fits strategically and technologically with our business, and has a good potential financial return, we generally assemble a “project team” comprised of individuals from our sales, marketing, engineering, manufacturing, legal, and quality assurance departments. This team works to identify the customer requirements, integrate the design, compile necessary documentation and testing, and prepare the product for market introduction. We believe that one of our marketing strengths is our capacity to rapidly conceive, design, develop, and introduce new products.
U. S. Sales. Sales of our products in the United States accounted for 66%, 68% and 68% of our total sales for the years ended December 31, 2009, 2008 and 2007, respectively. Our direct sales force currently consists of an Executive Vice President of Marketing and Sales, a Vice President of U. S. Sales, ten regional sales managers and 85 direct sales representatives and clinical specialists located in major metropolitan areas throughout the United States. In addition, we have developed another sales force in the United States for Merit Endotek™, consisting of a Vice President of Sales, two regional sales managers and 11 direct sales representatives. We consider training to be a critical factor in the success of our direct sales force. Our sales people are trained by our personnel at our facilities, by a senior sales person in their respective territories, at regular national and regional sales meetings, by consulting cardiologists, radiologists, endoscopists, and thoracic surgeons and by observation of procedures in laboratories and operating rooms throughout the U.S.
International Sales. Approximately 174 independent dealer organizations and packers distribute our products worldwide, including territories in Europe, Africa, the Middle East, Asia, South and Central America, and Canada. We have a Vice President for International Sales, based in South Jordan, Utah, who oversees Asia, South and Central America, Australia and Canada. We also have a Vice President of European Sales who oversees Europe, the Middle East and Africa. Approximately 30 direct sales representatives and country managers presently sell our products in Germany, France, the United Kingdom, Belgium, The Netherlands, Denmark, Sweden, Finland, Ireland and Austria. In 2009, our international sales grew approximately 19% over our total sales for the year ended December 31, 2008 and accounted for approximately 34% of total sales. Our new Merit Endotek division, has a small, but growing, presence in international markets. With the recent and planned additions to our product lines, we believe that our international sales will continue to increase.
We require our international dealers to inventory products and sell directly to customers within defined sales territories. Each of our products must be approved for sale under the laws of the country in which it is sold. International dealers are responsible for compliance with all applicable laws and regulations in their respective countries.
OEM Sales. We currently have a worldwide OEM division that sells molded components, sub-assembled goods, and bulk non-sterile goods which may be combined with other components and/or goods from other companies and then sold under a Merit or non-Merit label.
CUSTOMERS
We provide products to hospitals and clinic-based cardiologists, radiologists, anesthesiologists, physiatrists (pain management physicians), neurologists, nephrologists, vascular surgeons, interventional gastroenterologists and pulmonologists, thoracic surgeons, technicians and nurses. Hospitals and acute care facilities in the United States purchase our products through our direct sales forces, distributors, OEM partners, custom packagers and packers who assemble and combine our products in custom kits and packs. Outside the United States, hospitals and acute care facilities purchase our products through our direct sales force, or in the absence of a sales force, through independent distributors or OEM partners.
In 2009, our U.S. domestic sales force completed approximately 43% of our sales directly to U.S. hospitals and approximately 13% of our sales through other channels such as U.S. custom packagers and distributors. Approximately 34% of our sales were made by our direct European sales force, international distributors, and our OEM sales force. Sales to our single largest customer, an OEM partner, accounted for approximately 6% of total sales during the year ended December 31, 2009. We generally manufacture products for other medical device companies through our OEM division. During the year ended December 31, 2009, OEM sales represented approximately 14% of our total sales. Our new Merit Endotek division, which was in existence for less than the full year, represented approximately 3% of total sales.
RESEARCH AND DEVELOPMENT
In 2009, we continued to innovate in the treatment of cardiovascular disease by offering our customers a number of new products, improvements to existing products and line extensions. Additionally, we expanded our product offerings by entering the gastrointestinal and pulmonary markets through the acquisition of Alveolus. We subsequently retained key research and development personnel and have since added new sizes of non-vascular stents to the esophageal product line previously developed by Alveolus. Furthermore, we have initiated multiple projects to expand Merit Endotek’s products scheduled for release in 2010 through 2012.
Our research and development expenses were approximately $11.2 million, $9.2 million, and $8.7 million in 2009, 2008 and 2007, respectively. Our future growth continues to be fueled with multiple product ideas guided by our Chief Executive Officer, our Vice President of Engineering and our sales and marketing teams, as well as by collaboration with physicians with whom we have long-term relationships. We have research and development facilities in South Jordan, Utah; Angleton and Dallas, Texas; Howell, New Jersey; Galway, Ireland; and Venlo, The Netherlands.
MANUFACTURING
We manufacture many of our products utilizing our proprietary technology and our expertise in plastic injection and insert molding. We generally contract with third parties for the tooling of molds, but we design and own all of our molds. We utilize our experience in injection and insert molding technologies in the manufacture of most of the custom components used in our products.
We either assemble the electronic monitors and sensors used in our IntelliSystem® and Monarch® inflation devices from standard electronic components or we purchase them from third-party suppliers. Merit Sensor Systems, Inc., a wholly-owned subsidiary of Merit Medical Systems, Inc. (“Merit Sensor Systems”), develops and markets silicon sensors. It is presently supplying all of the sensors we utilize in our digital inflation devices.
Our products are manufactured at several factories, including facilities located in South Jordan and Murray, Utah; Galway, Ireland; Venlo, The Netherlands; Angleton, Texas; and Chester, Virginia. See Item 2. “Properties.” We also manufacture at a contract manufacturing facility in Mexico.
We have distribution centers located in South Jordan, Utah; Angleton, Texas; Chester, Virginia; and Maastricht, The Netherlands.
We believe that our variety of suppliers for raw materials and components necessary for the manufacture of our products, as well as our long-term relationships with such suppliers, promote stability in our manufacturing process. Historically, we have not been materially affected by interruptions with such suppliers. Furthermore, we seek to develop relationships with potential back-up suppliers for materials and components in the event of supply interruptions.
COMPETITION
We compete in several global markets, including diagnostic and interventional cardiology, interventional radiology, vascular surgery, interventional nephrology, cardiothoracic surgery, interventional gastroenterology and pulmonology, anesthesiology and pain management. These markets encompass a large number of suppliers of varying sizes.
In the interventional cardiology and radiology markets, as well as the gastroenterology and pulmonary markets, we compete with large international, multi-divisional medical supply companies such as Cordis Corporation (Johnson & Johnson), Boston Scientific Corporation, Medtronic, C.R. Bard, Abbott, and Terumo. Medium-size companies we compete with include Cook, Arrow, AngioDynamics, Vascular Solutions, B. Braun, Olympus, Navilyst, Edwards Lifescience, and ICU Medical. Many of our competitors have substantially greater financial, technical, and marketing resources than we do.
The principal competitive factors in the markets in which our products are sold are quality, price, value, device feature, customer service, breadth of line, and customer relationships. We believe that our products have achieved market acceptance due to the quality of materials and workmanship of our products, innovative design, our willingness to customize to fit customer needs, and our prompt attention to customer requests. Our products are priced competitively, but generally not below prices for competing products. One of our primary competitive strengths is our relative stability in the marketplace; a comprehensive, broad line of ancillary products; and our history of introducing a variety of new products and product line extensions to the market on a regular basis.
Based on available industry data, with respect to the number of procedures performed, we believe we are the leading provider of digital inflation technology in the world. In addition, we believe we are the world market leader for inflation devices, hemostasis devices and torque devices. We believe that we are one of two market leaders in the United States for control syringes, waste-disposal systems, tubing, and manifold kits. We anticipate the recent and planned additions to our product lines will enable us to compete even more effectively in both the U.S. and international markets. There is no assurance that we will be able to maintain our existing competitive advantages or compete successfully in the future.
We derive a substantial majority of our revenues from sales of products used in diagnostic angiography and interventional cardiology and radiology stent procedures. Medical professionals are starting to use new diagnostic methods and interventional procedures and devices, as well as drugs for the treatment and prevention of cardiovascular disease. These new methods, procedures and devices may render some of our products obsolete or limit the markets for our products. However, with the advent of vascular stents and other procedures, we have experienced continued growth in sales of our products.
PATENTS, LICENSES, TRADEMARKS AND COPYRIGHTS
We consider our proprietary technology to be important in the development and manufacture of our products. We seek to protect our technology through a combination of patents, trademarks, trade secrets, copyrights, confidentiality agreements and non-compete agreements. We generally seek patent protection of our technology in the United States and certain foreign countries where such protection appears to be advantageous.
As of December 31, 2009, we either owned or had licenses to use more than 100 U.S. patents. Additionally, we either owned or had exclusive rights to 66 pending U.S. patent applications. We owned 66 international patents, and either owned or had exclusive rights to 60 pending international patent applications. We also operate under licenses from other owners of certain patents, patent applications, technology, trade secrets, know-how, copyrights and trademarks.
We believe that our patents and pending patent applications are materially important to our business, but we do not believe that our business is dependent upon securing such patents. We believe that no single patent, patent application, technology, trade secret, know-how, copyright, trademark, or license is material in relation to our business as a whole.
Certain U.S. patents related to the digital display in our inflation devices expired in 2009 and other patent rights are scheduled to expire thereafter. We expect that related patents will continue to be valuable, in part because of proprietary innovations made since the issuance of our first patent. In 1992, we were granted a license to use patented technology that we incorporated into our inflation devices. In return, we paid a 5.75% ongoing royalty to the licensor, not to exceed $450,000 annually. Royalties paid for such license in each of 2008 and 2007 were $450,000. The license agreement terminated in August 2008 and we did not pay royalties under that license during 2009.
We have also registered or applied for registration of several trade names or trademarks. See “Products” above. We have received 154 U.S. and foreign trademark registrations, and other U.S. and foreign trademark applications are currently pending. We have registered copyrights relating to certain software used in our electronic inflation devices.
REGULATION
We face comprehensive governmental regulation both within and outside the United States relating to the development, manufacture, sale and distribution of our products. A number of factors substantially increase the time, difficulty and costs incurred in obtaining and maintaining the approval to market newly developed and existing products. These include detailed inspection of and controls over research and laboratory procedures, clinical investigations, manufacturing, marketing, sampling, distribution, recordkeeping, storage and disposal practices and various post-market requirements. Governmental regulatory actions can result in the seizure or recall of products, suspension or revocation of the authority necessary for their production and sale, and civil or criminal sanctions.
Under the Federal Food, Drug and Cosmetic Act, (the “Food, Drug and Cosmetic Act”) and through its own rules, the U.S. Food and Drug Administration (“FDA”) regulates the development, testing, packaging, labeling, and marketing of medical devices and manufacturing procedures relating to these devices. In general, the FDA requires that manufacturers adhere to certain standards designed to ensure the safety and effectiveness of medical devices. We employ a Chief Regulatory Officer and a Vice President of Quality Systems who are responsible to promote our compliance with applicable FDA regulations.
The FDA’s Quality Systems Regulations define the requirements for our manufacturing processes, require the maintenance of certain records, and provide for unscheduled inspections of our facilities. We must also comply with certain requirements of state, local, and foreign governments in the manufacture and marketing of our products.
New medical devices may also be subject to either the Section 510(k) Pre-Market Notification regulations or the Pre-Market Approval (“PMA”) regulations promulgated by the FDA and similar regulatory requirements in foreign countries. New products in either category require extensive documentation, careful engineering, and manufacturing controls to ensure quality. Products needing PMA approval require extensive pre-clinical and clinical testing and approval by the FDA prior to marketing. Products subject to Section 510(k) of the Food Drug and Cosmetic Act require FDA clearance prior to marketing. To date, our products have required only compliance with Section 510(k). Most of our products are subject to foreign regulatory approvals before they may be marketed abroad. We place the “CE” mark on devices sold in Europe. The CE mark represents that a product has met EU health, safety, and environmental requirements. We have received ISO 13485 certification for our facilities in Utah, Texas, Virginia and Ireland. We have also received ISO 9001:2008 certification for our Merit Sensor Systems facility in South Jordan, Utah.
We are subject to various federal, state and local laws targeting fraud and abuse in the healthcare industry. Healthcare costs continue to be a subject of study, investigation and regulation by governmental agencies and legislative bodies around the world. Recently, in the United States, particular attention has been focused on medical device prices and profits, and on programs that encourage doctors to recommend, use or purchase particular medical devices. Payers have become more influential in the marketplace and increasingly are focused on medical device pricing and medical device utilization and the quality and costs of healthcare. Violations of these frauds and abuse-related laws are punishable by criminal or civil sanctions, including substantial fines, imprisonment and exclusion from participation in healthcare programs such as Medicare and Medicaid and health programs outside the United States.
EMPLOYEES
As of December 31, 2009, we employed 1,875 people, including 1,402 in manufacturing; 218 in sales and marketing; 145 in engineering, research and development; and 110 in administration.
Many of our present employees are highly skilled. Our failure or success will depend, in part, upon our ability to retain such employees. We believe that an adequate supply of skilled employees is available. We have, from time-to-time, experienced rapid turnover among our entry-level assembly workers, as well as occasional shortages of such workers, resulting in increased labor costs and administrative expenses related to hiring and training replacement and new entry-level employees. Our key employees are bound by agreements or policies of confidentiality. None of our employees are represented by a union or other collective bargaining group. We believe that our relations with our employees are generally good.
AVAILABLE INFORMATION
We file annual, quarterly and current reports and other information with the SEC. These materials can be inspected and copied at the SEC’s Public Reference Room at 100 F Street, NE, Washington, D.C. 20549. Copies of these materials may also be obtained by mail at prescribed rates from the SEC’s Public Reference Room at the above address. Information about the Public Reference Room can be obtained by calling the SEC at 1-800-SEC-0330. The SEC also maintains an Internet site that contains reports, proxy and information statements, and other information regarding issuers that file electronically with the SEC. The address of the SEC’s Internet website is www.sec.gov.
We make available, free of charge, on our Internet website, located at www.merit.com, our most recent Annual Report on Form 10-K, our most recent Quarterly Report on Form 10-Q, any Current Reports on Form 8-K filed since our most recent Annual Report on Form 10-K, and any amendments to such reports as soon as reasonably practicable following the electronic filing of such report with the SEC. In addition, we provide electronic or paper copies of such filings free of charge upon request.
FINANCIAL INFORMATION ABOUT FOREIGN AND DOMESTIC SALES
For financial information relating to our foreign and domestic sales see Note 11 to our consolidated financial statements set forth in Item 8 of this report.
Our business, operations, and financial condition are subject to certain risks and uncertainties. Should one or more of these risks or uncertainties materialize, or should any underlying assumptions prove incorrect, our actual results will vary, and may vary materially from those anticipated, estimated, projected or expected. Among the key factors that may have a direct bearing on our business, operations, or financial condition are the factors identified below:
We may be unable to protect our proprietary technology or may infringe on the proprietary technology of others.
We have obtained U.S. patents and filed additional U.S. and foreign patent applications; however, there can be no assurance that any patents we hold, or for which we have applied, will provide us with any significant competitive advantages, that third parties will not challenge our patents, or that patents owned by others will not have an adverse effect on our ability to conduct business. We could incur substantial costs in preventing patent infringement, in curbing the unauthorized use of our proprietary technology by others, or in defending against similar claims of others. Since we rely on trade secrets and proprietary know-how to maintain our competitive position, there can be no assurance that others may not independently develop similar or superior technologies.
We operate in an increasingly competitive medical technology marketplace. There has also been substantial litigation regarding patent and other intellectual property rights in the medical device industry. Our activities may require us to defend against claims and actions alleging infringement of the intellectual rights of others. If a court rules against us in any patent litigation, any of several negative outcomes could occur: we could be subject to significant liabilities, we could be forced to seek licenses from third parties, or we could be prevented from marketing certain products. Any of these outcomes could have a material adverse effect on our financial condition and operating results.
Our ability to remain competitive is dependent, in part, upon our ability to prevent other companies from using our proprietary technology incorporated into our products. We seek to protect our technology through a combination of patents, trademarks, and trade secrets, as well as licenses, proprietary know-how and confidentiality agreements. We may be unable, however, to prevent others from using our proprietary information, or continue to use such information our self, for numerous reasons, including the following, any of which could have a material adverse effect on our business, operations, or financial condition:
· Our issued patents may not be sufficiently broad to prevent others from copying our proprietary technologies
· Our issued patents may be challenged by third parties and deemed to be overbroad or unenforceable
· Our products may infringe on the patents or other intellectual property rights of other parties, requiring us to alter or discontinue our manufacture or sale of such products
· Costs associated with seeking enforcement of our patents against infringement, or defending our self against allegations of infringement, may be significant
· Our pending patent applications may not be granted for various reasons, including over breadth or conflict with an existing patent
· Other persons may independently develop, or have developed, similar or superior technologies
Economic and industry conditions constantly change, and negative economic conditions in the United States and other countries could materially and adversely affect our business and results of operations.
Our business and our results of operation are affected by many changing economic and other conditions beyond our control. Actual or potential changes in international, national, regional and local economic, business and financial conditions, including recession and inflation, may negatively affect consumer preferences, perceptions, spending patterns or demographic trends, any of which could adversely affect our business and results of operations. We may also experience higher bad-debt rates and slower receivable collection rates in our dealings with our customers. In addition, recent disruptions in the credit markets have resulted in greater volatility, less liquidity, widening of credit spreads, and decreased availability of financing. As a result of these factors, there can be no assurance that financing will be available to us on acceptable terms, if at all. An inability to obtain necessary additional financing on acceptable terms may have an adverse impact on us and on our ability to grow our business.
Termination or interruption of relationships with our suppliers, or failure of such suppliers to perform, could disrupt our business.
We rely on raw materials, component parts, finished products, and services supplied by outside third parties in connection with our business. For example, substantially all of our products are sterilized by only a few different entities. In addition, some of our products are manufactured or assembled by third parties. If a supplier of significant raw materials, component parts, finished goods, or services were to terminate its relationship with us, or otherwise cease supplying raw materials, component parts, finished goods, or services consistent with past practice, our ability to meet our obligations to our end customers may be disrupted. A disruption with respect to numerous products, or with respect to a few significant products, could have a material adverse effect on our business, operations or financial condition.
Our products may be subject to recall or product liability claims.
Our products are used in connection with invasive procedures and in other medical contexts in which it is important that those products function with precision and accuracy. If our products do not function as designed, or are designed improperly, we may choose to or be forced by regulatory agencies to withdraw such products from the market. In addition, if medical personnel or their patients suffer injury as a result of any failure of our products to function as designed, or an inappropriate design, we could be subject to lawsuits seeking significant compensatory and punitive damages. Any product recall or lawsuit seeking significant monetary damages may have a material adverse effect on our business, operations or financial condition.
We generally offer a limited warranty for product returns which are due to defects in quality and workmanship. We attempt to estimate our potential liability for future product returns and establish reserves on our financial statements in amounts that we believe will be sufficient to address our warranty obligations; however, our actual liability for product returns may significantly exceed the amount of our reserves. If we underestimate our potential liability for future product returns, or if unanticipated events result in returns that exceed our historical experience, our financial condition and operating results could be materially and adversely affected.
We may be unable to successfully manage growth, particularly if accomplished through acquisitions.
Successful implementation of our business strategy will require that we effectively manage any associated growth. To manage growth effectively, our management will need to continue to implement changes in certain aspects of our business, to improve our information systems and operations to respond to increased demand, to attract and retain qualified personnel, and to develop, train, and manage an increasing number of management-level and other employees. Growth could place an increasing strain on our management, financial, product design, marketing, distribution and other resources, and we could experience operating difficulties. Any failure to manage growth effectively could have a material adverse effect on our business, operations or financial condition.
To the extent that we grow through acquisition, we will face the additional challenges of integrating our current operations, culture, information management systems and other characteristics with that of the acquired entity. We may incur significant expenses in connection with negotiating and consummating one or more transactions, and we may inherit certain liabilities in connection with each acquisition. In addition, we may not realize competitive advantages, synergies or other benefits anticipated in connection with any such acquisition. If we do not adequately identify targets for, or manage issues related to, our future acquisitions, such acquisitions may have a negative adverse effect on our business and financial results.
A significant adverse change in, or failure to comply with, governing regulations could adversely affect our business.
Substantially all of our products are “devices,” as defined in the Federal Food, Drug and Cosmetic Act, and the manufacture, distribution, record keeping, labeling and advertisement of our products are subject to regulation by the FDA in the United States and its equivalent regulatory agencies in various foreign countries in which our products are manufactured, distributed, labeled, offered or sold. Further, we are subject to regular review and periodic inspections at our current facilities with respect to the FDA’s Quality System Regulations and similar requirements of foreign countries. In addition, we are subject to certain export control restrictions governed by the U.S. Department of the Treasury and may be governed by other regulatory agencies in various foreign countries to which our products are exported. Although we believe we are currently in material compliance with these requirements, any failure on our part to comply with all applicable current and future regulations could adversely affect our business, operations, or financial condition.
A significant portion of our revenues are derived from a few products, procedures and/or customers.
A significant portion of our revenues are attributable to sales of our inflation devices. During the year ended December 31, 2009, sales of our inflation devices (including inflation devices sold in custom kits and through OEM channels) accounted for approximately 24% of our total revenues. Sales of our inflation devices to a single OEM customer, representing our largest customer, were approximately 6% of our total inflation device sales for the year ended December 31, 2009. Any material decline in market demand, or change in OEM supplier preference, for our inflation devices could have an adverse effect on our business, operations or financial condition.
In addition, the products that have accounted for a majority of our historical revenues are designed for use in connection with a few related medical procedures, including angioplasty, stent placement procedures, and spinal procedures. If subsequent developments in medical technology or drug therapy make such procedures obsolete, or alter the methodology of such procedures so as to eliminate the usefulness of our products, we may experience a material decrease in demand for our products and experience deteriorating financial performance.
We may be unable to compete in our markets, particularly if there is a significant change in relevant practices or technology.
The market for each of our products is highly competitive. We face competition from many companies which are larger, better established, have greater financial, technical and other resources and possess a greater market presence than we do. Such resources and market presence may enable our competition to more effectively market competing products or to market competing products at reduced prices in order to gain market share.
In addition, our ability to compete successfully is dependent, in part, upon our response to changes in technology and upon our efforts to develop and market new products which achieve significant market acceptance. Competing companies with substantially greater resources than us are actively engaged in research and development of new methods, treatments, drugs, and procedures to treat or prevent cardiovascular disease that could limit the market for our products and eventually make some of our products obsolete. A reduction in the demand for a significant number of our products, or a few key products, could have a material adverse effect on our business, operations or financial condition.
The market price of our Common Stock has been, and may continue to be, volatile.
The market price of our Common Stock has been, and may continue to be, volatile for various reasons, including the following, which could have a material adverse effect on our business, operations or financial condition:
· Our announcement of new products or technical innovations, or similar announcements by our competitors
· Development of new procedures that use, or do not use, our technology
· Quarter-to-quarter variances in our financial results
· Claims involving potential infringement of patents and other intellectual property rights
· Analysts’ and other projections or recommendations regarding our Common Stock specifically or medical technology stocks generally
· Any restatement of our financial statements or any investigation of us by the SEC, the FDA or another regulatory authority
· A decline, or rise, of stock prices in the capital markets generally
Fluctuations in Euro and GBP exchange rates may negatively impact our financial results.
Our material market risk relates primarily to fluctuations in the rate of exchange between the Euro and Great Britain Pound (“GBP”) relative to the value of the U.S. Dollar. Those fluctuations could have a negative impact on our margins and financial results. For example, during 2009, the exchange rate between all applicable foreign currencies and the U.S. Dollar resulted in a decrease in our gross revenues of approximately $2.6 million and an increase of 0.10% in our gross profit.
For the year ended December 31, 2009, approximately $26.3 million, or 10%, of our sales, were denominated in foreign currencies. If the rate of exchange between the Euro and the GBP declines, against the U.S. Dollar, we may not be able to increase the prices we charge our European customers for products whose prices are denominated in Euros and GBP. Furthermore, we may be unable or elect not to enter into hedging transactions which could mitigate the effect of declining exchange rates. As a result, if the rate of exchange between Euros and GBP declines, against the U.S. Dollar, our financial results may be negatively impacted.
Operations at our manufacturing facilities may be negatively impacted by certain factors, including severe weather conditions and the impact of natural disasters.
Our operations could be affected by many factors beyond our control, including severe weather conditions and the impact of natural disasters, including hurricanes and tornados. These conditions could cause substantial damage to our facilities, interrupt our production and disrupt our ability to deliver products to our customers.
Our operations in Angleton, Texas have been suspended due to hurricanes in recent years. In September 2008 we shut down our operations in Angleton in anticipation of Hurricane Ike and production was restored shortly thereafter. While we incurred minimal damage to our facility, we experienced greater financial damage as a result of the production disruption. Although our insurance covered some of the losses associated with the event, future natural disasters could increase the cost of insurance. We cannot be certain that any losses from business interruption or property damages, along with the increases in insurance costs, will not have a material adverse effect on our results of operations or financial condition.
We are dependent upon key personnel.
Our success is dependent on key management personnel, including Fred P. Lampropoulos, our Chairman of the Board, President and Chief Executive Officer. Mr. Lampropoulos is not subject to any agreement prohibiting his departure, and we do not maintain key man life insurance on his life. The loss of Mr. Lampropoulos, or of certain other key management personnel, could have a materially adverse effect our business and operations. Our success also depends on, among other factors, the successful recruitment and retention of key operating, manufacturing, sales and other personnel.
We are subject to work stoppage, transportation and related risks.
We manufacture products at various locations in the United States and foreign countries and sell our products worldwide. We depend on third-party transportation companies to deliver supplies necessary to manufacture our products from vendors to our various facilities and to move our products to customers, operating divisions, and other subsidiaries located worldwide. Our manufacturing operations, and the operations of the transportation companies on which we depend, may be adversely affected by natural disasters or significant human events, such as a war, terrorist attack, riot, strike, slowdown or similar event. Any disruption in our manufacturing or transportation could materially adversely affect our ability to meet customer demands or our operations.
Limits on reimbursement imposed by governmental and other programs may adversely affect our business.
The cost of a significant portion of medical care is funded by governmental, social security or other insurance programs. Limits on reimbursement imposed by such programs may adversely affect the ability of hospitals and others to purchase our products. In addition, limitations on reimbursement for procedures which utilize our products could adversely affect sales.
Our failure to comply with applicable environmental laws and regulations could affect our business and results of operations.
Merit Sensor Systems, Inc. manufactures and assembles certain products that require the use of hazardous materials that are subject to various federal, state and local laws and regulations governing the protection of the environment. While the cost of compliance with such laws and regulations has not had a material adverse effect on our results of operations historically, compliance with future regulations may require additional capital investments in pollution control equipment or changes in the way Merit Sensor Systems makes its products. Additionally, because Merit Sensor Systems uses hazardous and other regulated materials in its manufacturing processes, we are subject to certain risks of liabilities and claims resulting from any accidental releases. While we believe the precautions and infrastructure Merit Sensor Systems has put in place are sufficient, any accidental release may have an adverse affect on our business and results of operations.
If certain proposed healthcare reform legislative proposals are enacted into law, our business, financial condition, results of operations and cash flows could be adversely affected.
In October 2009, both the U.S. Senate and House of Representatives released draft healthcare reform legislation that includes provisions that would impose a fee or excise tax on certain medical devices. The proposals, as currently drafted, may apply to certain of our medical device products. Many details of the proposals remain uncertain, and any healthcare reform legislation must still be enacted by both Houses of Congress and signed by the President. If either of these medical device proposals is enacted into law, our results of operations could be adversely affected.
If our employees or agents violate the U.S. Foreign Corrupt Practices Act or anti-bribery laws in other jurisdictions, we may incur fines or penalties, or experiences other adverse consequences.
We are subject to the U.S. Foreign Corrupt Practices Act (“FCPA”) and similar anti-bribery laws in non-U.S. jurisdictions which generally prohibit companies and their intermediaries from making improper payments to non-U.S. officials for the purpose of obtaining or retaining business. Because of the predominance of government-sponsored healthcare systems around the world, many of our customer relationships outside of the United States are with governmental entities and are therefore subject to such anti-bribery laws. We operate in many parts of the world that have experienced governmental corruption to some degree, and in certain circumstances strict compliance with anti-bribery laws may conflict with local customs and practices. Our internal control policies and procedures may not protect us from reckless or criminal acts committed by our employees or agents. If our employees or agents violate the provisions of the FCPA or other anti-bribery laws, we may incur fines or penalties, we may be unable to market our products in other countries or we may experience other adverse consequences which could have a material adverse effect on our operating results or financial condition.
We may be subject to laws targeting fraud and abuse in the healthcare industry, the violation of which could adversely affect our business or financial results.
Our operations are subject to various state and federal laws targeting fraud and abuse in the healthcare industry, including federal anti-kickback laws, which prohibit any person from knowingly and willfully offering, paying, soliciting or receiving remuneration, directly or indirectly, to induce or reward either the referral of an individual, or the furnishing or arranging for an item or service, for which payment may be made under federal healthcare programs, such as the Medicare and Medicaid programs. Violations of these fraud and abuse-related laws are punishable by criminal or civil sanctions, including substantial fines, imprisonment and exclusion from participation in healthcare programs such as Medicare and Medicaid and health programs outside the United States, any of which could adversely affect our business or financial results.
Item 1B. Unresolved Staff Comments.
None.
We own approximately 40 acres of real property in the city of South Jordan, Utah, surrounding an additional ten acres of leased real property on which our principal office and manufacturing facility is located which totals approximately 200,000 square feet. We sold the ten-acre site to an unrelated developer in order to facilitate construction of the facility and entered into a 25-year lease agreement (beginning in 1995) to finance the facility. Monthly lease payments attributable to the ten-acre parcel are approximately $156,000. We also hold an option to purchase the facility, exercisable at market value after 25 years. At the end of 2004, we completed construction of an approximately 47,000 square-foot manufacturing facility in South Jordan, Utah. This facility is used for research, development and pilot production clean rooms and for production of sensors. We completed an approximately 140,000 square-foot manufacturing facility located in South Jordan, Utah in September 2005 which is used for injection and insert molding production, as an automated finished goods warehouse, and as the locale for management information systems and accounting employees. During 2009, we acquired an additional three and one-half acres of property west of our South Jordan facility. We believe the acquisition of this additional property will potentially enable us to expand our operations in the future as property surrounding our existing facilities is limited due to increased development.
We own a building of approximately 65,000 square feet, with approximately three acres of land, in Galway, County Galway, Republic of Ireland, which serves as our principal office and manufacturing facility for our European operations. The facility houses a research and development team, which developed our diagnostic guide wire, and is working to develop other new products. We also manufacture other products at the Galway facility.
We lease a manufacturing facility of approximately 63,000 square feet located in Murray, Utah. The Murray facility is used for production of several of our products. We lease the facility on a month-to-month basis. The aggregate lease payments on our Murray facility are approximately $37,000 per month.
We own approximately 19 acres of land and an approximately 75,000 square-foot building in Angleton, Texas. We use the facility for the production of catheter-related products.
We own approximately 12 acres of land and an approximately 100,000 square-foot building in Chester, Virginia. We use the facility for production of custom procedure trays used in the medical industry.
In December 2009, we leased a warehouse of approximately 33,500 square feet located in Chester, Virginia. We intend to use this facility as a warehouse for finished goods produced in our existing Chester, Virginia facility. The lease is scheduled to expire in April 30, 2015. The current monthly lease payment is approximately $10,000.
In July 2009, we leased an office, warehouse and production facility of approximately 40,000 square feet located in West Jordan, Utah. We completed approximately $1.1 million in renovations to the building largely related to additional clean rooms completed over the last several months of 2009 and through January of 2010, which will provide approximately 14,000 square feet of clean rooms. We intend to use the facility to produce products transferred from our other manufacturing sites in the U.S. and believe the facility will also provide capacity for new product releases and additional products we may obtain through prospective acquisitions. The current lease is scheduled to expire in July 2012 and has three, 18-month renewal options. The current monthly lease payment is approximately $16,000
We relocated our MCTec operations to a leased manufacturing facility of approximately 10,000 square feet located in Venlo, The Netherlands. We use the facility for the coating of wires and tubing for medical devices. The lease is scheduled to expire in January 2011. The current monthly lease payment is approximately $8,000.
In May 2008, we completed construction of a new European headquarters in Beek, The Netherlands. The new 31,000 square-foot facility is designed to provide for anticipated growth in our European operations.
We believe that our existing and proposed facilities will generally be adequate for our present and future anticipated levels of operations.
In the course of conducting our business operations, we are, from time to time, involved in litigation and other disputes. Our management does not currently anticipate that any pending litigation or dispute against us will have a materially adverse effect on our business, operations or financial condition.
Item 5. Market for Registrant’s Common Equity, Related Stockholder Matters and Issuer Purchases of Equity Securities.
MARKET PRICE FOR THE COMMON STOCK
Our Common Stock is traded on the NASDAQ Global Select Market under the symbol “MMSI.” The following table sets forth high and low sale prices for the Common Stock for the periods indicated.
|
For the year ended December 31, 2009 |
|
High |
|
Low |
|
||
|
First Quarter |
|
$ |
18.00 |
|
$ |
9.57 |
|
|
Second Quarter |
|
$ |
16.99 |
|
$ |
11.68 |
|
|
Third Quarter |
|
$ |
19.54 |
|
$ |
15.71 |
|
|
Fourth Quarter |
|
$ |
19.90 |
|
$ |
15.65 |
|
|
For the year ended December 31, 2008 |
|
High |
|
Low |
|
||
|
First Quarter |
|
$ |
17.41 |
|
$ |
13.71 |
|
|
Second Quarter |
|
$ |
16.97 |
|
$ |
14.00 |
|
|
Third Quarter |
|
$ |
21.36 |
|
$ |
14.18 |
|
|
Fourth Quarter |
|
$ |
19.99 |
|
$ |
12.35 |
|
OUTSTANDING SHARES AND NUMBER OF SHAREHOLDERS
As of March 5, 2010, the number of shares of Common Stock outstanding was 28,180,527, held by approximately 161 shareholders of record, not including shareholders whose shares are held in securities position listings.
DIVIDENDS
We have never declared or paid cash dividends on the Common Stock. We presently intend to retain any future earnings for use in our business and, therefore, do not anticipate paying any dividends on the Common Stock in the foreseeable future. In addition, our revolving line of credit contains covenants prohibiting the declaration and distribution of a cash dividend at any time prior to the termination of such line of credit.
PERFORMANCE GRAPH
The following graph compares the performance of the Common Stock with the performance of the NASDAQ Stock Market (U.S. Companies) and NASDAQ Stocks (SIC 3840-3849 U.S. Companies - Surgical, Medical and Dental Instruments and Supplies) for a five-year period by measuring the changes in Common Stock prices from December 31, 2004 to December 31, 2009.
Comparison of 5 Year Cumulative Total Return
Among Merit Medical Systems, Inc., NASDAQ Stock Market (U.S.)
and NASDAQ Stocks (SIC 3840-3849)
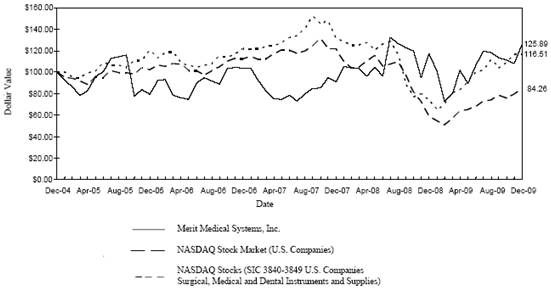
|
|
|
12/2004 |
|
12/2005 |
|
12/2006 |
|
12/2007 |
|
12/2008 |
|
12/2009 |
|
||||||
|
Merit Medical System Inc. |
|
$ |
100 |
|
$ |
79 |
|
$ |
104 |
|
$ |
91 |
|
$ |
117 |
|
$ |
126 |
|
|
NASDAQ Stock Market (U.S. Companies) |
|
100 |
|
102 |
|
112 |
|
122 |
|
59 |
|
84 |
|
||||||
|
NASDAQ Stocks (SIC 3840-3849 U.S. Companies) |
|
100 |
|
110 |
|
116 |
|
147 |
|
79 |
|
116 |
|
||||||
The stock performance graph assumes for comparison that the value of the Common Stock and of each index was $100 on December 31, 2004 and that all dividends were reinvested. Past performance is not necessarily an indicator of future results.
|
NOTE: |
Performance graph data is complete through last fiscal year. |
|
NOTE: |
Performance graph with peer group uses peer group only performance (excludes only Merit). |
|
NOTE: |
Peer group indices use beginning of period market capitalization weighting. |
|
NOTE: |
Data and graph are calculated from CRSP Total Return Index for the NASDAQ Stock Market (US Companies), Center for Research in Security Prices (CRSP), Booth School of Business, The University of Chicago. |
SECURITIES AUTHORIZED FOR ISSUANCE UNDER EQUITY COMPENSATION PLANS
The following table contains information regarding our equity compensation plans as of December 31, 2009 (in thousands):
|
|
|
Number
of securities |
|
Weighted-average |
|
Number
of securities |
|
|
|
Plan category |
|
(a) |
|
(b) |
|
(c) |
|
|
|
Equity compensation Plans approved by security holders |
|
3,631 |
(1),(3) |
$ |
12.76 |
|
2,191 |
(2),(3) |
(1) Consists of 3,630,891 shares of Common Stock subject to the options granted under the Merit Medical Systems, Inc. 2006 Long-Term Incentive Plan.
(2) Consists of 337,074 shares available to be issued under the Merit Medical Systems, Inc. Qualified and Non-Qualified Employee Stock Purchase Plan and 1,854,300 shares available to be issued under the Merit Medical Systems, Inc. 2006 Long-Term Incentive Plan.
(3) See Note 10 to our consolidated financial statements set forth in Item 8 of this report for additional information regarding these plans.
Item 6. Selected Financial Data (in thousands).
|
|
|
Years Ended December 31, |
|
|||||||||||||
|
|
|
2009 |
|
2008 |
|
2007 |
|
2006 |
|
2005 |
|
|||||
|
OPERATING DATA: |
|
|
|
|
|
|
|
|
|
|
|
|||||
|
Net Sales |
|
$ |
257,462 |
|
$ |
227,143 |
|
$ |
207,768 |
|
$ |
190,674 |
|
$ |
166,585 |
|
|
Cost of Sales |
|
148,660 |
|
133,872 |
|
127,977 |
|
117,596 |
|
97,493 |
|
|||||
|
Gross Profit |
|
108,802 |
|
93,271 |
|
79,791 |
|
73,078 |
|
69,092 |
|
|||||
|
|
|
|
|
|
|
|
|
|
|
|
|
|||||
|
Operating Expenses: |
|
|
|
|
|
|
|
|
|
|
|
|||||
|
Selling, general and administrative |
|
64,787 |
|
53,127 |
|
48,133 |
|
45,486 |
|
38,579 |
|
|||||
|
Research and development |
|
11,168 |
|
9,160 |
|
8,688 |
|
8,582 |
|
6,992 |
|
|||||
|
|
|
|
|
|
|
|
|
|
|
|
|
|||||
|
Total operating expenses |
|
75,955 |
|
62,287 |
|
56,821 |
|
54,068 |
|
45,571 |
|
|||||
|
|
|
|
|
|
|
|
|
|
|
|
|
|||||
|
|
|
|
|
|
|
|
|
|
|
|
|
|||||
|
Income From Operations |
|
32,847 |
|
30,984 |
|
22,970 |
|
19,010 |
|
23,521 |
|
|||||
|
|
|
|
|
|
|
|
|
|
|
|
|
|||||
|
Other Income (Expense): |
|
|
|
|
|
|
|
|
|
|
|
|||||
|
Interest income |
|
178 |
|
781 |
|
393 |
|
250 |
|
491 |
|
|||||
|
Interest expense |
|
(28 |
) |
(17 |
) |
(3 |
) |
(12 |
) |
(18 |
) |
|||||
|
Other income (expense) |
|
97 |
|
97 |
|
39 |
|
(64 |
) |
(94 |
) |
|||||
|
Other income—net |
|
247 |
|
861 |
|
429 |
|
174 |
|
379 |
|
|||||
|
|
|
|
|
|
|
|
|
|
|
|
|
|||||
|
Income before income taxes |
|
33,094 |
|
31,845 |
|
23,399 |
|
19,184 |
|
23,900 |
|
|||||
|
|
|
|
|
|
|
|
|
|
|
|
|
|||||
|
Income Tax Expense |
|
10,564 |
|
11,118 |
|
7,811 |
|
6,883 |
|
8,122 |
|
|||||
|
|
|
|
|
|
|
|
|
|
|
|
|
|||||
|
Net Income |
|
$ |
22,530 |
|
$ |
20,727 |
|
$ |
15,588 |
|
$ |
12,301 |
|
$ |
15,778 |
|
|
|
|
|
|
|
|
|
|
|
|
|
|
|||||
|
Earnings Per Common Share: |
|
|
|
|
|
|
|
|
|
|
|
|||||
|
Diluted |
|
$ |
0.79 |
|
$ |
0.73 |
|
$ |
0.55 |
|
$ |
0.44 |
|
$ |
0.57 |
|
|
|
|
|
|
|
|
|
|
|
|
|
|
|||||
|
Average Common Shares: |
|
|
|
|
|
|
|
|
|
|
|
|||||
|
Diluted |
|
28,606 |
|
28,550 |
|
28,204 |
|
28,245 |
|
27,847 |
|
|||||
|
|
|
|
|
|
|
|
|
|
|
|
|
|||||
|
BALANCE SHEET DATA: |
|
|
|
|
|
|
|
|
|
|
|
|||||
|
Working capital |
|
$ |
57,706 |
|
$ |
84,283 |
|
$ |
60,194 |
|
$ |
54,972 |
|
$ |
43,693 |
|
|
Total assets |
|
271,513 |
|
231,776 |
|
200,420 |
|
182,668 |
|
162,247 |
|
|||||
|
Line of credit |
|
7,000 |
|
0 |
|
0 |
|
0 |
|
0 |
|
|||||
|
Long-term debt |
|
0 |
|
0 |
|
0 |
|
0 |
|
2 |
|
|||||
|
Stockholders’ equity |
|
$ |
218,809 |
|
$ |
194,305 |
|
$ |
164,368 |
|
$ |
151,212 |
|
$ |
132,484 |
|
During the quarter ended December 31, 2006, we determined it was not likely that we would pursue the product associated with the intellectual property and assets acquired from Sub-Q, Inc. (“Sub-Q”) due to other priorities and opportunities. Therefore, we recorded an impairment charge of approximately $929,000, during the quarter primarily relating to intellectual property assets acquired from Sub-Q in March 2005.
During the quarter ended December 31, 2005, we adopted new accounting guidance related to inventory costs, and recorded additional expenses to cost of sales of $415,000, research and development expense of $83,000 and selling, general and administrative expense of $37,000.
Item 7. Management’s Discussion and Analysis of Financial Condition and Results of Operations.
OVERVIEW
We reported record sales and earnings for the twelve months ended December 31, 2009. This improvement, compared to our 2008 results, was largely the result of a 13% increase in sales, an improvement in gross margins of 120 basis points and a reduction in our effective income tax rate of 300 basis points; all of which offset higher selling, general and administrative expenses as well as research and development expenses, primarily associated with our acquisition and operation of the business and assets we acquired from Alveolus in March of 2009. The net of these factors produced record earnings of $22.5 million for 2009, up 9% from the prior year.
During 2009, we completed two of the largest acquisitions in our history, with the purchase of the Alveolus assets and the purchase of the EN Snare® product line from Hatch. The purchase of the Alveolus assets enabled us to enter into the gastroenterology and pulmonary markets and further diversify our product offerings in the medical device industry. We believe the EN Snare® product line will serve as a foundation for entry into the snare market and will allow us to develop snares for use in the gastroenterology market. Products associated with these two transactions all have gross margins in excess of our existing gross margins. We intend to continue to explore acquisition opportunities or product purchases similar to our 2009 transactions, in an effort to enhance our product offerings, improve our overall gross margins and increase our net income.
For the year ended December 31, 2009, we reported net sales of $257.5 million, up $30.3 million or 13% over 2008 net sales. Net sales growth in 2009 was primarily driven by increased sales of our stand-alone products (up $8.1 million or 12%), including EN Snare® royalties, hemostasis valves, needles and diagnostic wires; custom kit and procedure tray products (up $8.0 million or 12%); sales of products from our asset acquisitions of Alveolus and Biosearch of $7.7 million; and sales of catheters (up $7.2 million or 23%), particularly our Prelude® sheath product line, Mini access catheter product line and Resolve® locking draining catheter line.
Our gross profit as a percentage of sales was 42.3% for the year ended December 31, 2009, compared to 41.1% for year ended December 31, 2008. This improvement can be attributed primarily to lower average fixed overhead unit costs through increased productivity as fixed costs are shared over an increased number of units and a reduction in material costs.
Net income increased for the year ended December 31, 2009 to $22.5 million, compared to $20.7 million for the prior year, an increase of 9%.
RESULTS OF OPERATIONS
The following table sets forth certain operational data as a percentage of sales for the periods indicated:
|
|
|
2009 |
|
2008 |
|
2007 |
|
|
Sales |
|
100.0 |
% |
100.0 |
% |
100.0 |
% |
|
Gross margin |
|
42.3 |
|
41.1 |
|
38.4 |
|
|
Selling, general and administrative expenses |
|
25.2 |
|
23.4 |
|
23.2 |
|
|
Research and development expenses |
|
4.3 |
|
4.0 |
|
4.2 |
|
|
Income from operations |
|
12.8 |
|
13.6 |
|
11.1 |
|
|
Income before income tax expense |
|
12.9 |
|
14.0 |
|
11.3 |
|
|
Net income |
|
8.8 |
|
9.1 |
|
7.5 |
|
Our net sales increased by $30.3 million, or 13%, in 2009, compared to an increase of $19.4 million, or 9%, in 2008 and an increase of $17.1 million, or 9%, in 2007. We report sales in five product categories. Listed below are the sales relating to these product categories for the years ended December 31, 2009, 2008 and 2007:
|
|
|
Twelve Months Ended |
|
||||||||||||||||
|
|
|
December 31, |
|
||||||||||||||||
|
|
|
% Change |
|
2009 |
|
% Change |
|
2008 |
|
% Change |
|
2007 |
|
||||||
|
Stand-alone devices |
|
12 |
% |
|
$ |
76,075 |
|
9 |
% |
|
$ |
68,005 |
|
12 |
% |
|
$ |
62,417 |
|
|
Custom kits & procedure trays |
|
12 |
% |
|
74,541 |
|
11 |
% |
|
66,584 |
|
7 |
% |
|
60,013 |
|
|||
|
Inflation devices |
|
(1 |
)% |
|
61,058 |
|
3 |
% |
|
61,656 |
|
5 |
% |
|
59,595 |
|
|||
|
Catheters |
|
23 |
% |
|
38,126 |
|
20 |
% |
|
30,898 |
|
18 |
% |
|
25,743 |
|
|||
|
Gastroenterology |
|
|
|
|
7,662 |
|
|
|
|
|
|
|
|
|
|
|
|||
|
Total |
|
13 |
% |
|
$ |
257,462 |
|
9 |
% |
|
$ |
227,143 |
|
9 |
% |
|
$ |
207,768 |
|
Our sales increased during 2009, notwithstanding the fact that the markets for many of our products experienced slight pricing declines as our customers tried to reduce their costs. Substantially all of the increase in our revenues was attributable to increased unit sales. Sales by our European direct sales force are subject to foreign currency exchange rate fluctuations between the natural currency of a foreign country and the U.S. Dollar. Foreign currency exchange rate fluctuations decreased sales by 1.0% in 2009 compared to 2008; increased sales by 0.6% in 2008 compared to 2007; and increased sales by 0.9% in 2007 compared to 2006. Historically, an important part of our revenue growth came from increases in the number of procedures performed for patients in a given year. Starting in April 2007, the growth rate of coronary stents and other related procedures in the U.S. dropped significantly, reducing our historical growth rate for some interventional cardiology products sold by our U.S. direct sales force. New products have been another source of revenue growth. In 2009, 2008 and 2007, our sales of new products represented 6%, 2% and 6% sales, respectively. Included in those sales are revenues from recent acquisitions of 3%, 1% and 3% for 2009, 2008 and 2007, respectively. The third main source of revenue increases came from market share gains in our existing product lines.
International sales in 2009 were approximately $86.4 million, or 34% of total sales; international sales in 2008 were approximately $72.5 million, or 32% of total sales; international sales in 2007 were approximately $64.9 million, or 31% of total sales. These increases primarily resulted from greater acceptance of our products in international markets, ongoing growth in our European direct sales, and to a lesser degree, increased sales related to improvement in the exchange rate between the Euro and the U.S. Dollar, as discussed above. Our total direct sales in France, Germany, the U.K., Belgium, The Netherlands, Denmark, Sweden, Austria and Ireland were $26.3 million, $27.1 million and $23.8 million in 2009, 2008 and 2007, respectively.
Our gross profit as a percentage of sales was 42.3%, 41.1% and 38.4%, in 2009, 2008 and 2007, respectively. The improved gross margins in 2009 can be attributed primarily to lower average fixed overhead unit costs through increased productivity as fixed costs are shared over an increased number of units and a reduction in material costs. The increase in gross margins in 2008 resulted primarily from lower average fixed overhead unit costs resulting from increased production (unit costs decreased as fixed costs were shared over an increased number of units), lower unit costs for products manufactured in Mexico, customer price increases and production automation. These improvements also helped offset raw material and production labor cost increases that occurred during 2008. The increase in gross margins in 2007 was principally the result of production efficiencies resulting in lower headcount, product mix improvement, the transfer of the manufacturing process of four products to Mexico and certain automation projects.
Our selling, general and administrative expenses increased $11.7 million or 22%, in 2009; $5.0 million, or 10%, in 2008 over 2007; $2.6 million, or 6%, in 2007 over 2006. The increases in selling, general and administrative expenses in 2009 were primarily due to the increased expense associated with our acquisition and operation of the business and assets acquired from Alveolus of $5.7 million and the hiring of additional domestic and international sales representatives. Selling, general and administrative expenses as a percentage of sales increased slightly in 2008 when compared to the prior year. This increase was primarily the result of higher commissions commensurate with higher sales, management and sales bonuses for meeting quarterly and annually objectives, increased travel-related expenses and increased national account administration fees. Selling, general and administrative expenses for 2008 were also affected by approximately $415,000 of damages (net of insurance reimbursement of $179,000) sustained by our Angleton, Texas facility during Hurricane Ike in September 2008. The significant (70 basis points) decrease in selling, general and administrative expenses in 2007 as a percentage of sales was primarily the result of operating leverage from reducing head count, while increasing sales.
Research and development expenses increased 22% to $11.2 million in 2009, compared to $9.2 million in 2008. The increase in research and development expenses in 2009 related, in large part, to research and development projects for the Alveolus business we acquired of $1.1 million and growth in our historical research and development projects,
some of which are nearing completion. Research and development expenses increased 5% to $9.2 million in 2008, compared to $8.7 million in 2007. Our research and development expense for 2007 increased 1% to $8.7 million, compared to $8.6 million in 2006. The increase in research and development expenses in 2008 and 2007 was related primarily to research and development head count additions and indirect costs to support an increase in the number of new products we launched. Our research and development expenses as a percentage of sales were 4.3% for 2009, 4.0% for 2008 and 4.2% for 2007. We have a full pipeline of new products and management believes that we have an effective level of capabilities and expertise to continue the flow of new internally-developed products into the future.
Our effective income tax rates for 2009, 2008 and 2007 were 32%, 35% and 33%, respectively. The decrease in the effective income tax rate for 2009 over 2008 was primarily related to the profitability of our Irish operations, which are taxed at a lower tax rate than our U.S. and other foreign operations; research and development tax credits generated from our Irish operations; and investment gains sustained in our deferred compensation that are not deductible for tax purposes. The increase in the effective income tax rate for 2008 over 2007 was primarily the result of investment losses sustained in our deferred compensation plan that are not deductible for tax purposes. The decrease in the effective income tax rate for 2007 over 2006 was primarily the result of the unrecognized tax benefits which expired on our 2002 federal, state and foreign tax returns and a non-taxed gain related to corporate-owned variable life insurance contracts for our deferred compensation plan.
Our other income for 2009, 2008 and 2007 was approximately $247,000, $861,000 and $429,000, respectively. The decrease in other income for 2009 over 2008 was primarily the result of a decrease in interest income attributable to lower average cash balances, when compared to the corresponding periods in 2008. The increase in other income for 2008 over 2007 and 2007 over 2006 was primarily the result of an increase in interest income attributable to higher average cash balances and higher interest rates.
Our net income for 2009, 2008 and 2007 was approximately $22.5, $20.7 million and $15.6 million, respectively. Net income for 2009 was favorably affected by increased sales volumes and higher gross margins, a lower effective income tax rate all of which offset higher selling, general and administrative expenses and research and development expenses, primarily associated with our acquisition of the Alveolus assets in the first quarter of 2009. Net income for 2008 was positively affected by increased sales volumes and higher gross margins and partially offset by higher effective income tax rates. Net income for 2007 was positively affected by increased sales volumes, higher gross margins, lower operating expenses as a percentage of sales and a lower effective income tax rate.
LIQUIDITY AND CAPITAL RESOURCES
Capital Commitments and Contractual Obligations
The following table summarizes our capital commitments and contractual obligations as of December 31, 2009, including operating lease payments and office lease payments, as well as the future periods in which such payments are currently anticipated to become due:
|
|
|
Payment due by period (in thousands) |
|
|||||||||||||
|
Contractual Obligations |
|
Total |
|
Less than 1 Year |
|
1-3 Years |
|
4-5 Years |
|
After 5 Years |
|
|||||
|
Line of credit |
|
$ |
7,000 |
|
$ |
7,000 |
|
$ |
— |
|
$ |
— |
|
$ |
— |
|
|
Operating leases |
|
20,685 |
|
2,587 |
|
4,410 |
|
3,572 |
|
10,116 |
|
|||||
|
Royalty obligations |
|
208 |
|
50 |
|
100 |
|
58 |
|
— |
|
|||||
|
Total contractual cash |
|
$ |
27,893 |
|
$ |
9,637 |
|
$ |
4,510 |
|
$ |
3,630 |
|
$ |
10,116 |
|
We have approximately $2.9 million of unrecognized tax positions that have been recognized as liabilities in our consolidated financial statements, but are not reflected in the foregoing contractual obligations table due to uncertainty as to when such amounts may be settled.
Additional information regarding our capital commitments and contractual obligations, including royalty payments, is contained in notes 7, 8 and 12 of the notes to our consolidated financial statements, set forth in Item 8 below.
Cash Flows
Our cash flow from operations was $30.1 million in 2009, an increase of $2.1 million over 2008. This increase in cash flow from operations in 2009, when compared to 2008, resulted primarily from an increase in net income. Our
working capital for 2009, 2008 and 2007, was $57.7 million, $84.3 million and $60.2 million, respectively. The decrease in working capital in 2009 from 2008 was primarily the result of expenditures of approximately $40.1 million associated with our acquisition of the Alveolus assets and the EN Snare® product line. The increase in working capital for 2008 over 2007 was primarily the result of an increase in cash generated from our net income and cash generated from the issuance of shares of Common Stock related to employee stock option exercises. The increase in working capital for 2007 over 2006 was primarily the result of an increase in cash net of the reduction in inventories of $4.5 million as we focused on improving our inventory turns.
On December 7, 2006, we entered into an unsecured loan agreement with Bank of America, N.A. (“Bank of America”), whereby Bank of America agreed to provide us a line of credit in the amount of $30 million. Our outstanding borrowings on this loan as of December 31, 2009 and 2008 were $7.0 million and $0, respectively. Our interest rate as of December 31, 2009 was set at 1.0%. Available borrowings under this line of credit as of December 31, 2009 and 2008 were $23 million and $30 million, respectively.
On December 8, 2006, we entered into an unsecured loan agreement with Zions First National Bank (“Zions”), whereby Zions agreed to provide us a line of credit in the amount of $1 million. The loan expired on December 1, 2009; however, was extended for an additional three years to December 1, 2012. We had $0 outstanding and $1.0 million available under this line of credit as of December 31, 2009, 2008 and 2007.
Historically, we have incurred significant expenses in connection with new facilities, production automation, product development and the introduction of new products. During 2009, we spent a substantial amount of cash, $46.2 million, in connection with our acquisition of certain assets and product lines. In the event we pursue and complete similar transactions or acquisitions in the future, additional funds will likely be required to meet our strategic needs, which may require us to consider raising additional funds in the debt or equity markets. We currently believe that our existing cash balances, future cash flows from operations, sales of equity and existing lines of credit will be adequate to fund our current and future planned operations for the foreseeable future.
CRITICAL ACCOUNTING POLICIES AND ESTIMATES
Critical Accounting Policies
The SEC has requested that all registrants discuss their most critical accounting policies. The SEC has indicated that a “critical accounting policy” is one which is both important to the representation of the registrant’s financial condition and results and requires management’s most difficult, subjective or complex judgments, often as a result of the need to make estimates about the effect of matters that are inherently uncertain. We base our estimates on past experience and on various other assumptions our management believes to be reasonable under the circumstances, the results of which form the basis for making judgments about carrying values of assets and liabilities that are not readily apparent from other sources. Actual results will differ and may differ materially from these estimates under different assumptions or conditions. Additionally, changes in accounting estimates could occur in the future from period to period. Our management has discussed the development and selection of our most critical financial estimates with the audit committee of our Board of Directors. The following paragraphs identify our most critical accounting policies:
Inventory Obsolescence Reserve. Our management reviews on a regular basis inventory quantities on hand for unmarketable and/or slow-moving products that may expire prior to being sold. This review of inventory quantities for unmarketable and/or slow moving products is based on estimates of forecasted product demand prior to expiration lives. If market conditions become less favorable than those projected by our management, additional inventory write-downs may be required. We believe that the amount included in our obsolescence reserve has been a historically accurate estimate of the unmarketable and/or slow moving products that may expire prior to being sold.
Allowance for Doubtful Accounts. A majority of our receivables are with hospitals which, over our history, have demonstrated favorable collection rates. Therefore, we have experienced relatively minimal bad debts from hospital customers. In limited circumstances, we have written off bad debts as the result of the termination of our business relationships with foreign distributors. The most significant write-offs over our history have come from U.S. packers who bundle our products in surgical trays.
We maintain allowances for doubtful accounts relating to estimated losses resulting from the inability of our customers to make required payments. The allowance is based upon historical experience and a review of individual customer balances. If the financial condition of our customers were to deteriorate, resulting in an impairment of their ability to make payments, then additional allowances may be required.
Stock-Based Compensation. We measure share-based compensation cost at the grant date based on the value of the award and recognize the cost as an expense over the term of the vesting period. Judgment is required in estimating
the fair value of share-based awards granted and their expected forfeiture rate. If actual results differ significantly from these estimates, stock-based compensation expense and our results of operations could be materially impacted.
Income Taxes. Under our accounting policies, we initially recognize a tax position in our financial statements when it becomes likely that the position will be sustained upon examination by the tax authorities. Such tax positions are initially and subsequently measured as the largest amount of tax benefit that has a greater than 50% likelihood of being realized upon ultimate settlement with the tax authorities assuming full knowledge of the position and all relevant facts. Although we believe our provisions for unrecognized tax positions are reasonable, we can make no assurance that the final tax outcome of these matters will not be different from that which we have reflected in our income tax provisions and accruals. The tax law is subject to varied interpretations and we have taken positions related to certain matters where the law is subject to interpretation. Such differences could have a material impact on our income tax provisions and operating results in the period(s) in which we make such determination.
Goodwill and Intangible Assets Impairment. We test our goodwill balances as of July 1 of each year for impairment, or whenever impairment indicators arise. We utilize several reporting units in evaluating goodwill for impairment. We assess the estimated fair value of reporting units based on discounted future cash flows. If the carrying amount of a reporting unit exceeds the fair value of the reporting unit, an impairment charge is recognized in an amount equal to the excess of the carrying amount of the reporting unit goodwill over implied fair value of that goodwill. This analysis requires significant judgments, including estimation of future cash flows and the length of time they will occur, which is based on internal forecasts and a determination of a discount rate based on our weighted average cost of capital.
We evaluate the recoverability of intangible assets whenever events or changes in circumstances indicate that its carrying amount may not be recoverable. This analysis requires similar significant judgments as those discussed above regarding goodwill, except for cash flows are based on an undiscounted cash flow to determine the fair value of the intangible. All of our intangible assets are subject to amortization.
See Note 1 of the notes to the consolidated financial statements describing accounting policies governing each of these matters, set forth in Item 8 below.
Item 7A. Quantitative and Qualitative Disclosures About Market Risk.
Our principal market risk relates to changes in the value of the Euro and GBP relative to the value of the U.S. Dollar. Our consolidated financial statements are denominated in and our principal currency is, the U.S. Dollar. A portion of our revenues ($26.3 million, representing approximately 10% of our aggregate revenues) for the year ended December 31, 2009 was attributable to sales that were denominated in foreign currencies. The balance of our international sales was denominated in U.S. Dollars. Certain expenses are also denominated in foreign currencies, which partially offset risks associated with fluctuations of exchanges rates between foreign currencies on the one hand and the U.S. Dollar on the other hand. Because of our Euro and GBP-denominated revenues and expenses, in a year in which our Euro and GBP-denominated revenues exceed our Euro and GBP-based expenses, the value of such Euro and GBP-denominated net income increases if the value of the Euro and GBP increase relative to the value of the U.S. Dollar and decreases if the value of the Euro and GBP decrease relative to the value of the U. S. Dollar. During the year ended December 31, 2009, the exchange rate between our foreign currencies against the U.S. Dollar resulted in a decrease of our gross revenues of approximately $2.6 million and an increase of 0.1% in gross profit.
On November 30, 2009, we forecasted a net exposure for December 31, 2009 (representing the difference between Euro and GBP denominated receivables and Euro-denominated payables) of approximately 331,000 Euros and 394,000 GBPs. In order to partially offset such risks at November 30, 2009, we entered into a 30-day forward contract for the Euro and GBP with a notional amount of approximately 331,000 Euros and notional amount of 394,000 GBPs. We enter into similar transactions at various times during the year to partially offset exchange rate risks we bear throughout the year. These contracts are marked to market at each month-end. During the years ended December 31, 2009, 2008 and 2007, we recorded a net gain of approximately $83,000, $52,000 and $29,000, respectively, which is included in other income/(expense), on foreign currency transactions. We do not purchase or hold derivative financial instruments for speculative or trading purposes. The fair value of our open positions at December 31, 2009 and 2008 was not material.
We are also subject to market risk related to variable rate debt. As of December 31, 2009, our operating line of credit with Bank of America has a variable rate which is tied to LIBOR rates. We do not believe our interest expense would be materially affected by changes in interest rates.
Item 8. Financial Statements and Supplementary Data.
REPORT OF INDEPENDENT REGISTERED PUBLIC ACCOUNTING FIRM
To the Board of Directors and Stockholders of Merit Medical Systems, Inc.:
We have audited the accompanying consolidated balance sheets of Merit Medical Systems, Inc. and subsidiaries (the “Company”) as of December 31, 2009 and 2008 and the related consolidated statements of income, stockholders’ equity and cash flows for each of the three years in the period ended December 31, 2009. Our audits also included the financial statement schedule listed in the Index at Item 15. These financial statements and financial statement schedule are the responsibility of the Company’s management. Our responsibility is to express an opinion on the financial statements and financial statement schedule based on our audits.
We conducted our audits in accordance with the standards of the Public Company Accounting Oversight Board (United States). Those standards require that we plan and perform the audit to obtain reasonable assurance about whether the financial statements are free of material misstatement. An audit includes examining, on a test basis, evidence supporting the amounts and disclosures in the financial statements. An audit also includes assessing the accounting principles used and significant estimates made by management, as well as evaluating the overall financial statement presentation. We believe that our audits provide a reasonable basis for our opinion.
In our opinion, such consolidated financial statements present fairly, in all material respects, the financial position of the Company as of December 31, 2009 and 2008 and the results of its operations and its cash flows for each of the three years in the period ended December 31, 2009, in conformity with accounting principles generally accepted in the United States of America. Also, in our opinion, such financial statement schedule, when considered in relation to the basic consolidated financial statements taken as a whole, presents fairly, in all material respects, the information set forth therein.
As discussed in Note 1 to the consolidated financial statements in 2009, the Company adopted new accounting guidance related to business combinations, and in 2008, the Company adopted new accounting guidance that defined fair value, established a framework for measuring fair value, and expanded disclosures about fair value measurements.
We have also audited, in accordance with the standards of the Public Company Accounting Oversight Board (United States), the Company’s internal control over financial reporting as of December 31, 2009, based on the criteria established in Internal Control — Integrated Framework issued by the Committee of Sponsoring Organizations of the Treadway Commission and our report dated March 10, 2010, expressed an unqualified opinion on the Company’s internal control over financial reporting.
/s/ DELOITTE & TOUCHE LLP
Salt Lake City,
Utah
March 10, 2010
MERIT MEDICAL SYSTEMS, INC. AND SUBSIDIARIES
CONSOLIDATED BALANCE SHEETS
DECEMBER 31, 2009 AND 2008
(In thousands)
|
|
|
2009 |
|
2008 |
|
||
|
ASSETS |
|
|
|
|
|
||
|
|
|
|
|
|
|
||
|
CURRENT ASSETS: |
|
|
|
|
|
||
|
Cash and cash equivalents |
|
$ |
6,133 |
|
$ |
34,030 |
|
|
Trade receivables — net of allowance for
uncollectible accounts — |
|
30,954 |
|
27,749 |
|
||
|
Employee receivables |
|
145 |
|
126 |
|
||
|
Other receivables |
|
827 |
|
818 |
|
||
|
Inventories |
|
47,170 |
|
38,358 |
|
||
|
Prepaid expenses and other assets |
|
1,801 |
|
985 |
|
||
|
Deferred income tax assets |
|
3,289 |
|
2,782 |
|
||
|
Income tax refund receivable |
|
295 |
|
607 |
|
||
|
|
|
|
|
|
|
||
|
Total current assets |
|
90,614 |
|
105,455 |
|
||
|
|
|
|
|
|
|
||
|
PROPERTY AND EQUIPMENT: |
|
|
|
|
|
||
|
Land and land improvements |
|
9,777 |
|
7,992 |
|
||
|
Buildings |
|
50,040 |
|
49,793 |
|
||
|
Manufacturing equipment |
|
77,069 |
|
68,184 |
|
||
|
Furniture and fixtures |
|
15,586 |
|
16,689 |
|
||
|
Leasehold improvements |
|
10,280 |
|
9,868 |
|
||
|
Construction-in-progress |
|
13,968 |
|
7,599 |
|
||
|
|
|
|
|
|
|
||
|
Total property and equipment |
|
176,720 |
|
160,125 |
|
||
|
|
|
|
|
|
|
||
|
Less accumulated depreciation |
|
(62,074 |
) |
(56,186 |
) |
||
|
|
|
|
|
|
|
||
|
Property and equipment — net |
|
114,646 |
|
103,939 |
|
||
|
|
|
|
|
|
|
||
|
OTHER ASSETS: |
|
|
|
|
|
||
|
Intangibles — net of accumulated amortization — 2009 — $5,450 and 2008 — $3,122 |
|
26,898 |
|
6,913 |
|
||
|
Goodwill |
|
33,002 |
|
13,048 |
|
||
|
Other assets |
|
6,353 |
|
2,325 |
|
||
|
Deferred income tax assets |
|
|
|
23 |
|
||
|
Deposits |
|
|
|
73 |
|
||
|
|
|
|
|
|
|
||
|
Total other assets |
|
66,253 |
|
22,382 |
|
||
|
|
|
|
|
|
|
||
|
TOTAL |
|
$ |
271,513 |
|
$ |
231,776 |
|
|
See notes to consolidated financial statements. |
(Continued) |
MERIT MEDICAL SYSTEMS, INC. AND SUBSIDIARIES
CONSOLIDATED BALANCE SHEETS
DECEMBER 31, 2009 AND 2008
(In thousands)
|
|
|
2009 |
|
2008 |
|
||
|
LIABILITIES AND STOCKHOLDERS’ EQUITY |
|
|
|
|
|
||
|
|
|
|
|
|
|
||
|
CURRENT LIABILITIES: |
|
|
|
|
|
||
|
Trade payables |
|
$ |
13,352 |
|
$ |
10,622 |
|
|
Accrued expenses |
|
12,196 |
|
9,973 |
|
||
|
Advances from employees |
|
212 |
|
211 |
|
||
|
Line of credit |
|
7,000 |
|
|
|
||
|
Income taxes payable |
|
148 |
|
366 |
|
||
|
|
|
|
|
|
|
||
|
Total current liabilities |
|
32,908 |
|
21,172 |
|
||
|
|
|
|
|
|
|
||
|
DEFERRED INCOME TAX LIABILITIES |
|
11,251 |
|
8,771 |
|
||
|
|
|
|
|
|
|
||
|
LIABILITIES RELATED TO UNRECOGNIZED TAX POSITIONS |
|
2,945 |
|
2,818 |
|
||
|
|
|
|
|
|
|
||
|
DEFERRED COMPENSATION PAYABLE |
|
3,382 |
|
2,348 |
|
||
|
|
|
|
|
|
|
||
|
DEFERRED CREDITS |
|
1,874 |
|
1,994 |
|
||
|
|
|
|
|
|
|
||
|
OTHER LONG-TERM OBLIGATIONS |
|
344 |
|
368 |
|
||
|
|
|
|
|
|
|
||
|
Total liabilities |
|
52,704 |
|
37,471 |
|
||
|
|
|
|
|
|
|
||
|
COMMITMENTS AND CONTINGENCIES (Notes 2, 7, 8 and 12) |
|
|
|
|
|
||
|
|
|
|
|
|
|
||
|
STOCKHOLDERS’ EQUITY: |
|
|
|
|
|
||
|
Preferred stock — 5,000 shares authorized as of December 31, 2009 and 2008; no shares issued |
|
|
|
|
|
||
|
Common stock, no par value; shares authorized — 2009 and 2008 - 100,000; issued shares as of December 31, 2009 - 28,181 and December 31, 2008 - 28,093 |
|
63,690 |
|
61,689 |
|
||
|
Retained earnings |
|
155,204 |
|
132,674 |
|
||
|
Accumulated other comprehensive loss |
|
(85 |
) |
(58 |
) |
||
|
|
|
|
|
|
|
||
|
Total stockholders’ equity |
|
218,809 |
|
194,305 |
|
||
|
|
|
|
|
|
|
||
|
TOTAL |
|
$ |
271,513 |
|
$ |
231,776 |
|
|
See notes to consolidated financial statements. |
(Concluded) |
MERIT MEDICAL SYSTEMS, INC. AND SUBSIDIARIES
CONSOLIDATED STATEMENTS OF INCOME
YEARS ENDED DECEMBER 31, 2009, 2008 AND 2007
(In thousands except per share amounts)
|
|
|
2009 |
|
2008 |
|
2007 |
|
|||
|
|
|
|
|
|
|
|
|
|||
|
NET SALES |
|
$ |
257,462 |
|
$ |
227,143 |
|
$ |
207,768 |
|
|
|
|
|
|
|
|
|
|
|||
|
COST OF SALES |
|
148,660 |
|
133,872 |
|
127,977 |
|
|||
|
|
|
|
|
|
|
|
|
|||
|
GROSS PROFIT |
|
108,802 |
|
93,271 |
|
79,791 |
|
|||
|
|
|
|
|
|
|
|
|
|||
|
OPERATING EXPENSES: |
|
|
|
|
|
|
|
|||
|
Selling, general and administrative |
|
64,787 |
|
53,127 |
|
48,133 |
|
|||
|
Research and development |
|
11,168 |
|
9,160 |
|
8,688 |
|
|||
|
|
|
|
|
|
|
|
|
|||
|
Total operating expenses |
|
75,955 |
|
62,287 |
|
56,821 |
|
|||
|
|
|
|
|
|
|
|
|
|||
|
INCOME FROM OPERATIONS |
|
32,847 |
|
30,984 |
|
22,970 |
|
|||
|
|
|
|
|
|
|
|
|
|||
|
OTHER INCOME (EXPENSE): |
|
|
|
|
|
|
|
|||
|
Interest income |
|
178 |
|
781 |
|
393 |
|
|||
|
Interest expense |
|
(28 |
) |
(17 |
) |
(3 |
) |
|||
|
Other income |
|
97 |
|
97 |
|
39 |
|
|||
|
|
|
|
|
|
|
|
|
|||
|
Other income — net |
|
247 |
|
861 |
|
429 |
|
|||
|
|
|
|
|
|
|
|
|
|||
|
INCOME BEFORE INCOME TAXES |
|
33,094 |
|
31,845 |
|
23,399 |
|
|||
|
|
|
|
|
|
|
|
|
|||
|
INCOME TAX EXPENSE |
|
10,564 |
|
11,118 |
|
7,811 |
|
|||
|
|
|
|
|
|
|
|
|
|||
|
NET INCOME |
|
$ |
22,530 |
|
$ |
20,727 |
|
$ |
15,588 |
|
|
|
|
|
|
|
|
|
|
|||
|
EARNINGS PER COMMON SHARE: |
|
|
|
|
|
|
|
|||
|
Basic |
|
$ |
0.80 |
|
$ |
0.75 |
|
$ |
0.57 |
|
|
|
|
|
|
|
|
|
|
|||
|
Diluted |
|
$ |
0.79 |
|
$ |
0.73 |
|
$ |
0.55 |
|
|
|
|
|
|
|
|
|
|
|||
|
AVERAGE COMMON SHARES: |
|
|
|
|
|
|
|
|||
|
Basic |
|
28,011 |
|
27,769 |
|
27,425 |
|
|||
|
|
|
|
|
|
|
|
|
|||
|
Diluted |
|
28,606 |
|
28,550 |
|
28,204 |
|
|||
See notes to consolidated financial statements.
MERIT MEDICAL SYSTEMS, INC. AND SUBSIDIARIES
CONSOLIDATED STATEMENTS OF STOCKHOLDERS’
EQUITY
YEARS ENDED DECEMBER 31, 2009, 2008 AND 2007
(In thousands)
|
|
|
|
|
Common Stock |
|
Retained |
|
Accumulated |
|
||||||
|
|
|
Total |
|
Shares |
|
Amount |
|
Earnings |
|
Loss |
|
||||
|
BALANCE — January 1, 2007 |
|
$ |
151,212 |
|
27,647 |
|
$ |
54,394 |
|
$ |
96,969 |
|
$ |
(151 |
) |
|
Comprehensive income: |
|
|
|
|
|
|
|
|
|
|
|
||||
|
Net income |
|
15,588 |
|
|
|
|
|
15,588 |
|
|
|
||||
|
Foreign currency translation adjustment |
|
95 |
|
|
|
|
|
|
|
95 |
|
||||
|
|
|
|
|
|
|
|
|
|
|
|
|
||||
|
Total comprehensive income |
|
15,683 |
|
|
|
|
|
|
|
|
|
||||
|
|
|
|
|
|
|
|
|
|
|
|
|
||||
|
Cumulative effect of a change in accounting principle - adoption of accounting for uncertainty in income taxes |
|
(610 |
) |
|
|
|
|
(610 |
) |
|
|
||||
|
Tax benefit attributable to appreciation of common stock options exercised |
|
500 |
|
|
|
500 |
|
|
|
|
|
||||
|
Stock-based compensation expense |
|
1,130 |
|
|
|
1,130 |
|
|
|
|
|
||||
|
Issuance of common stock under Employee Stock Purchase Plans |
|
323 |
|
27 |
|
323 |
|
|
|
|
|
||||
|
Stock repurchased and retired |
|
(5,407 |
) |
(464 |
) |
(5,407 |
) |
|
|
|
|
||||
|
Options exercised |
|
1,537 |
|
203 |
|
1,537 |
|
|
|
|
|
||||
|
|
|
|
|
|
|
|
|
|
|
|
|
||||
|
BALANCE — December 31, 2007 |
|
$ |
164,368 |
|
27,413 |
|
$ |
52,477 |
|
$ |
111,947 |
|
$ |
(56 |
) |
|
|
|
|
|
|
|
|
|
|
|
|
|
||||
|
Comprehensive income: |
|
|
|
|
|
|
|
|
|
|
|
||||
|
Net income |
|
20,727 |
|
|
|
|
|
20,727 |
|
|
|
||||
|
Foreign currency translation adjustment |
|
(2 |
) |
|
|
|
|
|
|
(2 |
) |
||||
|
|
|
|
|
|
|
|
|
|
|
|
|
||||
|
Total comprehensive income |
|
20,725 |
|
|
|
|
|
|
|
|
|
||||
|
|
|
|
|
|
|
|
|
|
|
|
|
||||
|
Tax benefit attributable to appreciation of common stock options exercised |
|
2,044 |
|
|
|
2,044 |
|
|
|
|
|
||||
|
Stock-based compensation expense |
|
962 |
|
|
|
962 |
|
|
|
|
|
||||
|
Issuance of common stock under Employee Stock Purchase Plans |
|
305 |
|
19 |
|
305 |
|
|
|
|
|
||||
|
Warrants exercised |
|
496 |
|
49 |
|
496 |
|
|
|
|
|
||||
|
Options exercised |
|
5,405 |
|
612 |
|
5,405 |
|
|
|
|
|
||||
|
|
|
|
|
|
|
|
|
|
|
|
|
||||
|
BALANCE — December 31, 2008 |
|
$ |
194,305 |
|
28,093 |
|
$ |
61,689 |
|
$ |
132,674 |
|
$ |
(58 |
) |
|
|
|
|
|
|
|
|
|
|
|
|
|
||||
|
Comprehensive income: |
|
|
|
|
|
|
|
|
|
|
|
||||
|
Net income |
|
22,530 |
|
|
|
|
|
22,530 |
|
|
|
||||
|
Foreign currency translation adjustment |
|
(27 |
) |
|
|
|
|
|
|
(27 |
) |
||||
|
|
|
|
|
|
|
|
|
|
|
|
|
||||
|
Total comprehensive income |
|
22,503 |
|
|
|
|
|
|
|
|
|
||||
|
|
|
|
|
|
|
|
|
|
|
|
|
||||
|
Tax benefit attributable to appreciation of common stock options exercised |
|
987 |
|
|
|
987 |
|
|
|
|
|
||||
|
Stock-based compensation expense |
|
1,182 |
|
|
|
1,182 |
|
|
|
|
|
||||
|
Issuance of common stock under Employee Stock Purchase Plans |
|
353 |
|
24 |
|
353 |
|
|
|
|
|
||||
|
Warrants exercised |
|
517 |
|
51 |
|
517 |
|
|
|
|
|
||||
|
Options exercised |
|
1,920 |
|
308 |
|
1,920 |
|
|
|
|
|
||||
|
Stock repurchased and retired |
|
(2,474 |
) |
(250 |
) |
(2,474 |
) |
|
|
|
|
||||
|
Shares surrendered in exchange for payment of payroll tax liabilities |
|
(254 |
) |
(23 |
) |
(254 |
) |
|
|
|
|
||||
|
Shares surrendered in exchange for the exercise of stock options |
|
(230 |
) |
(22 |
) |
(230 |
) |
|
|
|
|
||||
|
|
|
|
|
|
|
|
|
|
|
|
|
|
|
|
|
|
BALANCE — December 31, 2009 |
|
$ |
218,809 |
|
28,181 |
|
$ |
63,690 |
|
$ |
155,204 |
|
$ |
(85 |
) |
See notes to consolidated financial statements.
MERIT MEDICAL SYSTEMS, INC. AND SUBSIDIARIES
CONSOLIDATED STATEMENTS OF CASH FLOWS
YEARS ENDED DECEMBER 31, 2009, 2008 AND 2007
(In thousands)
|
|
|
2009 |
|
2008 |
|
2007 |
|
|||
|
|
|
|
|
|
|
|
|
|||
|
CASH FLOWS FROM OPERATING ACTIVITIES: |
|
|
|
|
|
|
|
|||
|
Net income |
|
$ |
22,530 |
|
$ |
20,727 |
|
$ |
15,588 |
|
|
|
|
|
|
|
|
|
|
|||
|
Adjustments to reconcile net income to net cash provided by operating activities: |
|
|
|
|
|
|
|
|||
|
Depreciation and amortization |
|
12,271 |
|
10,240 |
|
9,444 |
|
|||
|
Losses on sales and/or abandonment of property and equipment |
|
271 |
|
526 |
|
317 |
|
|||
|
Write-off of certain patents and license agreement |
|
154 |
|
164 |
|
245 |
|
|||
|
Amortization of deferred credits |
|
(120 |
) |
(111 |
) |
(135 |
) |
|||
|
Purchase of trading investments |
|
(458 |
) |
(349 |
) |
(267 |
) |
|||
|
Proceeds from sale of trading investments |
|
|
|
|
|
218 |
|
|||
|
Unrealized (gains) losses on trading investments |
|
(561 |
) |
987 |
|
(259 |
) |
|||
|
Deferred income taxes |
|
1,791 |
|
(183 |
) |
984 |
|
|||
|
Tax benefit attributable to appreciation of common stock options exercised |
|
(987 |
) |
(2,044 |
) |
(500 |
) |
|||
|
Stock-based compensation expense |
|
1,182 |
|
962 |
|
1,130 |
|
|||
|
Changes in operating assets and liabilities net of effects from acquisitions: |
|
|
|
|
|
|
|
|||
|
Trade receivables |
|
(2,131 |
) |
(1,464 |
) |
(496 |
) |
|||
|
Employee receivables |
|
(16 |
) |
10 |
|
52 |
|
|||
|
Other receivables |
|
(13 |
) |
304 |
|
(930 |
) |
|||
|
Inventories |
|
(6,882 |
) |
(4,036 |
) |
5,056 |
|
|||
|
Prepaid expenses and other assets |
|
(571 |
) |
301 |
|
(258 |
) |
|||
|
Income tax refund receivable |
|
319 |
|
(93 |
) |
(194 |
) |
|||
|
Other assets |
|
(568 |
) |
5 |
|
12 |
|
|||
|
Trade payables |
|
296 |
|
758 |
|
(671 |
) |
|||
|
Accrued expenses |
|
1,628 |
|
554 |
|
872 |
|
|||
|
Advances from employees |
|
|
|
(57 |
) |
11 |
|
|||
|
Current liabilities related to unrecognized tax positions |
|
|
|
(1,023 |
) |
1,023 |
|
|||
|
Income taxes payable |
|
825 |
|
1,692 |
|
1,595 |
|
|||
|
Non-current liabilities related to unrecognized tax positions |
|
114 |
|
864 |
|
(1,010 |
) |
|||
|
Deferred compensation payable |
|
1,034 |
|
(715 |
) |
194 |
|
|||
|
Other long-term obligations |
|
(38 |
) |
(52 |
) |
(16 |
) |
|||
|
|
|
|
|
|
|
|
|
|||
|
Total adjustments |
|
7,540 |
|
7,240 |
|
16,417 |
|
|||
|
|
|
|
|
|
|
|
|
|||
|
Net cash provided by operating activities |
|
30,070 |
|
27,967 |
|
32,005 |
|
|||
|
|
|
|
|
|
|
|
|
|||
|
CASH FLOWS FROM INVESTING ACTIVITIES: |
|
|
|
|
|
|
|
|||
|
Capital expenditures for: |
|
|
|
|
|
|
|
|||
|
Property and equipment |
|
(18,478 |
) |
(14,476 |
) |
(16,288 |
) |
|||
|
Patents and trademarks |
|
(1,191 |
) |
(432 |
) |
(450 |
) |
|||
|
Proceeds from the sale of property and equipment |
|
27 |
|
45 |
|
11 |
|
|||
|
Cash paid in acquisitions |
|
(46,150 |
) |
(5,112 |
) |
(4,726 |
) |
|||
|
|
|
|
|
|
|
|
|
|||
|
Net cash used in investing activities |
|
(65,792 |
) |
(19,975 |
) |
(21,453 |
) |
|||
|
See notes to consolidated financial statements. |
(Continued) |
MERIT MEDICAL SYSTEMS, INC. AND SUBSIDIARIES
CONSOLIDATED STATEMENTS OF CASH FLOWS
YEARS ENDED DECEMBER 31, 2009, 2008 AND 2007
(In thousands)
|
|
|
2009 |
|
2008 |
|
2007 |
|
|||
|
|
|
|
|
|
|
|
|
|||
|
CASH FLOWS FROM FINANCING ACTIVITIES: |
|
|
|
|
|
|
|
|||
|
Proceeds from issuance of common stock |
|
$ |
2,560 |
|
$ |
6,206 |
|
$ |
1,860 |
|
|
Borrowings on line of credit |
|
19,000 |
|
|
|
|
|
|||
|
Payments on line of credit |
|
(12,000 |
) |
|
|
|
|
|||
|
Excess tax benefits from stock-based compensation |
|
987 |
|
2,044 |
|
500 |
|
|||
|
Payment of taxes related to an exchange of common stock |
|
(254 |
) |
|
|
|
|
|||
|
Common stock repurchased and retired |
|
(2,474 |
) |
|
|
(5,407 |
) |
|||
|
|
|
|
|
|
|
|
|
|||
|
Net cash provided by (used in) financing activities |
|
7,819 |
|
8,250 |
|
(3,047 |
) |
|||
|
|
|
|
|
|
|
|
|
|||
|
EFFECT OF EXCHANGE RATES ON CASH |
|
6 |
|
214 |
|
231 |
|
|||
|
|
|
|
|
|
|
|
|
|||
|
NET (DECREASE) INCREASE IN CASH AND CASH EQUIVALENTS |
|
(27,897 |
) |
16,456 |
|
7,736 |
|
|||
|
|
|
|
|
|
|
|
|
|||
|
CASH AND CASH EQUIVALENTS: |
|
|
|
|
|
|
|
|||
|
Beginning of year |
|
34,030 |
|
17,574 |
|
9,838 |
|
|||
|
|
|
|
|
|
|
|
|
|||
|
End of year |
|
$ |
6,133 |
|
$ |
34,030 |
|
$ |
17,574 |
|
|
|
|
|
|
|
|
|
|
|||
|
SUPPLEMENTAL DISCLOSURES OF CASH FLOW |
|
|
|
|
|
|
|
|||
|
INFORMATION — Cash paid during the year for: |
|
|
|
|
|
|
|
|||
|
Interest |
|
$ |
26 |
|
$ |
17 |
|
$ |
5 |
|
|
|
|
|
|
|
|
|
|
|||
|
Income taxes |
|
$ |
8,215 |
|
$ |
9,853 |
|
$ |
5,354 |
|
|
|
|
|
|
|
|
|
|
|||
|
SUPPLEMENTAL DISCLOSURES OF NON-CASH INVESTING AND FINANCING ACTIVITIES |
|
|
|
|
|
|
|
|||
|
Fixed asset purchases in accounts payable |
|
$ |
2,724 |
|
$ |
847 |
|
$ |
1,173 |
|
|
|
|
|
|
|
|
|
|
|||
|
Adoption of FIN 48 |
|
|
|
|
|
$ |
610 |
|
||
|
|
|
|
|
|
|
|
|
|||
|
Merit common stock surrendered (21,556 shares) in exchange for exercise of stock options |
|
$ |
230 |
|
|
|
|
|
||
|
See notes to consolidated financial statements. |
(Concluded) |
MERIT MEDICAL SYSTEMS, INC. AND SUBSIDIARIES
NOTES TO CONSOLIDATED FINANCIAL STATEMENTS
YEARS ENDED DECEMBER 31, 2009, 2008 AND 2007
1. ORGANIZATION AND SUMMARY OF SIGNIFICANT ACCOUNTING POLICIES
Organization. Merit Medical Systems, Inc. develops, manufactures and markets disposable medical products primarily used in diagnostic and interventional cardiology and radiology procedures. We operate primarily as one segment, sales of disposable medical devices used for cardiology and radiology procedures (two other segments do not meet the quantitative thresholds for reporting separate information). We manufacture our products in plants located in the United States, The Netherlands and Ireland. We export sales to dealers and have direct sales forces in the United States and Western Europe (see Note 11). Our consolidated financial statements have been prepared in accordance with accounting principles generally accepted in the United States of America. The following is a summary of the more significant of such policies.
Use of Estimates in Preparing Financial Statements. The preparation of financial statements in conformity with accounting principles generally accepted in the United States of America requires management to make estimates and assumptions that affect the reported amounts of assets and liabilities and disclosure of contingent assets and liabilities at the date of the financial statements and the reported amounts of revenues and expenses during the reporting period. Actual results could differ from those estimates.
Principles of Consolidation. The consolidated financial statements include our wholly-owned subsidiaries. Intercompany balances and transactions have been eliminated.
Cash and Cash Equivalents. For purposes of the statements of cash flows, we consider interest bearing deposits with an original maturity date of three months or less to be cash equivalents.
Receivables. The allowance for uncollectible accounts receivable is based on our historical bad debt experience and on management’s evaluation of its ability to collect individual outstanding balances.
Inventories. We value our inventories at the lower of cost, determined on a first-in, first-out method, or market value. Market value for raw materials is based on replacement costs. Inventory costs include material, labor and manufacturing overhead. We review inventories on hand at least quarterly and record provisions for estimated excess, slow moving and obsolete inventory, as well as inventory with a carrying value in excess of net realizable value. The regular and systematic inventory valuation reviews include a current assessment of future product demand, historical experience and product expiration.
Goodwill and Intangible Assets. We test goodwill balances as of July 1 for impairment on an annual basis or whenever impairment indicators arise. We utilize several reporting units in evaluating goodwill for impairment. We assess the estimated fair value of reporting units based on discounted future cash flows. If the carrying amount of a reporting unit exceeds the fair value of the reporting unit, an impairment charge is recognized in an amount equal to the excess of the carrying amount of the reporting unit goodwill over the implied fair value of that goodwill.
We evaluate the recoverability of intangible assets periodically and take into account events or circumstances that warrant revised estimates of useful lives or that indicate that impairment exists. All of our intangible assets are subject to amortization. Intangible assets are amortized over a straight line basis except for customer lists which are generally amortized on an accelerated basis over the following useful lives:
|
Customer lists and developed technology |
|
5 - 15 years |
|
Distribution agreements |
|
5 - 11 years |
|
License agreements and trademarks |
|
5 - 15 years |
|
Covenant not to compete |
|
3 - 10 years |
|
Patents |
|
17 years |
|
Royalty income |
|
5 years |
Long-Lived Assets. We review the carrying amount of our long-lived assets for impairment whenever events or change in circumstances indicate that the carry amount may not be recoverable. An asset is considered impaired when estimated future cash flows are less than the carrying amount of the asset. In the event the carrying amount of such asset is not considered recoverable, the asset is adjusted to its fair value. Fair value is generally determined based on discounted future cash flow. There were no impairments of long-lived assets during the years ended December 31, 2009, 2008 and 2007.
Property and Equipment. Property and equipment is stated at the historical cost of construction or purchase. Construction costs include payroll-related costs capitalized during construction. Maintenance and repairs of property and equipment are charged to operations as incurred. Leasehold improvements are amortized over the lesser of the base term of the lease or estimated life of the leasehold improvements. Construction-in-process consists of various production equipment being constructed internally and externally. Assets in construction-in-process will commence depreciating once the asset has been placed in service. Depreciation and amortization are computed using the straight-line method over estimated useful lives as follows:
|
Buildings |
|
40 years |
|
|
Manufacturing equipment |
|
5 - 20 years |
|
|
Furniture and fixtures |
|
3 - 10 years |
|
|
Land improvements |
|
10 - 20 years |
|
|
Leasehold improvements |
|
4 - 25 years |
|
Deferred Compensation. We have a deferred compensation plan that permits certain management employees to defer a portion of their salary until the future. We established a Rabbi trust to finance obligations under the plan with corporate-owned variable life insurance contracts. The cash surrender value totaled approximately $3.3 million and $2.3 million at December 31, 2009 and 2008, respectively, which is included in “Other assets” in our consolidated balance sheets. We have recorded a “Deferred Compensation Payable” of approximately $3.4 million and $2.3 million at December 31, 2009 and 2008, respectively, to reflect the liability to our employees under this plan.
Other Assets. Other assets consist of our deferred compensation plan cash surrender value discussed above, an investment in a privately-held company accounted for at cost, deposits related to various leases, and a long-term income tax refund receivable.
Deferred Credits. Deferred credits consist of grant money received from the Irish government. Grant money is received for a percentage of expenditures on eligible property and equipment, specific research and development projects and costs of hiring and training employees. Amounts related to the acquisition of property and equipment are amortized as a reduction of depreciation expense over the lives of the corresponding property and equipment.
Revenue Recognition. We sell our single-use disposable medical products through a direct sales force in the U.S., through OEM relationships, custom packers and a combination of direct sales force and independent distributors in international markets. Revenues from these customers are recognized when all of the following have occurred: (i) persuasive evidence of an arrangement exists, (ii) delivery has occurred or services have been rendered, (iii) the price is fixed or determinable and (iv) the ability to collect is reasonably assured. These criteria are generally satisfied at the time of shipment when risk of loss and title passes to the customer. We have certain written agreements with group purchasing organizations to sell our products to participating hospitals. Some of these agreements and most of our direct European sales have destination shipping terms which require us to defer the recognition of a sale until the product has arrived at our customers’ locations. We reserve for sales returns of defective products (i.e. warranty liability) as a reduction in revenue, based on our historical experience. We also offer sales rebates and discounts to purchasing groups. These reserves are recorded as a reduction in revenue and are not considered material to our consolidated statements of income for the years ended December 31, 2009, 2008 and 2007. In addition, we invoice our customers for taxes assessed by governmental authorities such as sales tax and value added taxes. We present these taxes on a net basis.
Shipping and Handling. We bill our customers for shipping and handling charges, which are included in total revenues for the applicable period and the corresponding shipping and handling expense is reported in cost of sales.
Cost of Sales. We include product costs (i.e. material, direct labor and overhead costs), shipping and handling expense, product royalty expense, developed technology expense, production related depreciation expense and product license agreement expense in cost of sales.
Research and Development. Research and development costs are expensed as incurred.
Income Taxes. We utilize an asset and liability approach for financial accounting and reporting for income taxes. Deferred income taxes are provided for temporary differences in the basis of assets and liabilities as reported for financial statement and income tax purposes. Deferred income taxes reflect the tax effects of net operating loss and tax credit carryovers and temporary differences between the carrying amounts of assets and liabilities for financial reporting purposes and the amounts used for income tax purposes. Realization of certain deferred tax assets is dependent upon future earnings, if any. We make estimates and judgments in determining the need for a provision for income taxes, including the estimation of our taxable income for each full fiscal year.
On January 1, 2007, we adopted a new accounting standard that clarified the accounting for uncertainty in income taxes recognized in our financial statements. Under this standard, tax positions are initially recognized in the financial statements when it is more likely than not the position will be sustained upon examination by the tax authorities. Such tax positions are initially and subsequently measured as the largest amount of tax benefit that has the greater than 50% likelihood of being realized upon ultimate settlement with the tax authority assuming full knowledge of the position and all relevant facts.
Earnings per Common Share. Net income per common share is computed by both the basic method, which uses the weighted average number of our common shares outstanding and the diluted method, which includes the dilutive common shares from stock options and warrants, as calculated using the treasury stock method.
Fair Value Measurements. On January 1, 2008, we adopted a new accounting standard that defined fair value, established a framework for measuring fair value, and expanded disclosure about fair value measurements. In February 2008, the Financial Accounting Standards Board (“FASB”) adopted a one-year deferral of the fair value measurement and disclosure requirements for non-financial assets and liabilities. We adopted the fair value measurement and disclosure requirements for measuring financial assets and liabilities on January 1, 2008 and the fair value measurement and disclosure requirements for non-financial assets and liabilities on January 1, 2009 and the adoption of each did not have a material impact on our consolidated financial statements.
The fair value of a financial instrument is the amount that could be received upon the sale of an asset or paid to transfer a liability in an orderly transaction between market participants at the measurement date. Financial assets are marked to bid prices and financial liabilities are marked to offer prices. Fair value measurements do not include transaction costs. A fair value hierarchy is used to prioritize the quality and reliability of the information used to determine fair values. Categorization within the fair value hierarchy is based on the lowest level of input that is significant to the fair value measurement. The fair value hierarchy is defined into the following three categories:
Level 1: Quoted market prices in active markets for identical assets or liabilities.
Level 2: Observable market-based inputs or unobservable inputs that are corroborated by market data.
Level 3: Unobservable inputs that are not corroborated by market data.
Stock-Based Compensation. We recognize the fair value compensation cost relating to share-based payment transactions in accordance with Accounting Standards Codification (“ASC”) 718, Compensation — Stock Compensation. Under the provisions of ASC 718, share-based compensation cost is measured at the grant date, based on the fair value of the award and is recognized over the employee’s requisite service period, which is generally the vesting period. The fair value of our stock options is estimated using a Black-Scholes option valuation model. Stock-based compensation expense for the years ended December 31, 2009, 2008 and 2007 was $1.2 million, $1.0 million and $1.1 million, respectively.
Concentration of Credit Risk. Financial instruments that potentially subject us to concentrations of credit risk consist primarily of cash and cash equivalents and accounts receivable. We provide credit, in the normal course of business, primarily to hospitals and independent third-party packers and distributors. We perform ongoing credit evaluations of our customers and maintain allowances for potential credit losses. Sales to our single largest customer approximated 6%, 7% and 7% of total sales for the years ended December 31, 2009, 2008 and 2007, respectively.
Foreign Currency. The financial statements of our foreign subsidiaries are measured using local currencies as the functional currency, with the exception of Ireland which uses the U.S. Dollar as its functional currency. Assets and liabilities are translated into U.S. Dollars at year-end rates of exchange and results of operations are translated at average rates for the year. Gains and losses resulting from these translations are included in accumulated other comprehensive loss as a separate component of stockholders’ equity. Foreign currency transactions denominated in a currency other than the entity’s functional currency are included in determining net income for the period. Such foreign currency transaction gains and losses have not been significant for purposes of our financial reporting.
Foreign Currency Forward Contracts. On November 30, 2009, we forecasted a net exposure for December 31, 2009 (representing the difference between Euro and GBP denominated receivables and Euro-denominated payables) of approximately 331,000 Euros and 394,000 GBPs. In order to partially offset such risks at November 30, 2009, we entered into a 30-day forward contract for the Euro and GBP with a notional amount of approximately 331,000 Euros and notional amount of 394,000 GBPs. We enter into similar transactions at various times during the year to partially offset exchange rate risks we bear throughout the year. These contracts are marked to market at each month-end. During the years ended December 31, 2009 and 2008, we recorded a net loss on these forward contracts of approximately $9,000 and $1,000, respectively, which is included in other income (expense) on these forward contracts. We do not purchase or hold derivative financial instruments for speculative or trading purposes. The fair value of our open positions at December 31, 2009 and 2008 was not material.
Accumulated Other Comprehensive Loss. Accumulated other comprehensive loss consists entirely of foreign currency translation adjustments.
Recently Issued Financial Accounting Standards. In October 2009, the FASB issued Accounting Standards Update (“ASU”), 2009-13, Revenue Recognition (Topic 605): Multiple Deliverable Revenue Arrangements — A Consensus of the FASB Emerging Issues Task Force. This update provides application guidance on whether multiple deliverables exist, how the deliverables should be separated and how the consideration should be allocated to one or more units of accounting. This update establishes a selling price hierarchy for determining the selling price of a deliverable. The selling price used for each deliverable will be based on vendor-specific objective evidence, if available, third-party evidence if vendor-specific objective evidence is not available, or estimated selling price if neither vendor-specific or third-party evidence is available. We will be required to apply this guidance prospectively for revenue arrangements entered into or materially modified after January 1, 2011; however, earlier application is permitted. We have not determined the impact that this update may have on our consolidated financial statements.
In June 2009, the FASB issued ASC 105, Generally Accepted Accounting Principles - Overall (“ASC 105”). ASC 105 establishes the FASB ASC as the source of authoritative accounting principles recognized by the FASB to be applied by nongovernmental entities in the preparation of financial statements in conformity with U.S. GAAP. The FASB will not issue new standards in the form of Statements, FASB Staff Positions or Emerging Issues Task Force Abstracts. Instead, it will issue ASUs. This standard reorganizes the thousands of GAAP pronouncements into roughly 90 accounting topics and displays them using a consistent structure. Also included is relevant SEC guidance organized using the same topical structure in separate sections. ASC 105 is effective for interim and annual periods ending after September 15, 2009. We adopted ASC 105 in the third quarter of 2009. The adoption does not have an effect on our financial position or results of operations; however, because ASC 105 completely replaces existing standards, it will affect the way U.S. GAAP is referenced within the consolidated financial statements and accounting policies.
In June 2009, the FASB issued guidance now codified in FASB ASC 810, Consolidation (“ASC 810”). ASC 810 amends tests for variable interest entities to determine whether a variable interest entity must be consolidated. ASC 810 requires an entity to perform an analysis to determine whether an entity’s variable interest or interests give it a controlling financial interest in a variable interest entity. This guidance requires ongoing reassessments of whether an entity is the primary beneficiary of a variable interest entity and enhanced disclosures that provide more transparent information about an entity’s involvement with a variable interest entity. We will be required to apply this guidance on January 1, 2010. We do not expect the adoption of this guidance to have a material effect on our consolidated financial statements.
In May 2009, the FASB issued guidance now codified in FASB ASC 855, Subsequent Events, which provides guidance on the assessment of subsequent events. This guidance defines the period after the balance sheet date during which we should evaluate events or transactions that may occur for potential recognition or disclosure in the financial statements and the required disclosures for such events. The guidance is effective for interim or annual reporting periods ending after June 15, 2009. We adopted this guidance in the second quarter of 2009, the adoption of which did not have a material effect on our consolidated financial statements.
In December 2007, the FASB issued guidance now codified in FASB ASC 805, Business Combinations (“ASC 805”). ASC 805 requires all business combinations completed after the effective date to be accounted for by applying the acquisition method (previously referred to as the purchase method). Companies applying this method will have to identify the acquirer, determine the acquisition date and purchase price and recognize at their acquisition-date fair values of the identifiable assets acquired, liabilities assumed and any non-controlling interests in the acquiree. In the case of a bargain purchase, the acquirer is required to reevaluate the measurements of the recognized assets and liabilities at the acquisition date and recognize a gain on that date if an excess remains. We adopted this guidance on January 1, 2009. We expensed costs related to the Alveolus, Biosearch and Hatch acquisitions of approximately $558,000 during the year ended December 31, 2009, which would have been included in Goodwill under previous guidance. The continued effect
of adoption on our consolidated financial statements will depend upon the nature of any acquisitions completed after adoption.
2. ACQUISITIONS
On October 21, 2009, we completed a transaction with Vysera, a medical products developer based in Galway, Ireland. In the transaction, we entered into an Exclusive License, Development and Supply Agreement, pursuant to which Vysera granted to us an exclusive license to use, modify and sell certain valve technology and biomaterial coating technology for medical devices (the “Licensed Technology”) and other intellectual property associated with the Licensed Technology and to develop and market improvements to the Licensed Technology. In the transaction, we also purchased 253,047 Class A Ordinary Shares of Vysera, for an aggregate price of approximately $2.4 million, which is accounted for at cost. Under the Vysera license agreement, we paid Vysera a license fee of $1.5 million and agreed to pay royalties on products we sell which incorporate the Licensed Technology. The license fee for $1.5 million has been allocated to developed technology and will be amortized over 15 years.
On June 2, 2009, we entered into an asset purchase agreement with Hatch, a Georgia limited liability company to purchase assets associated with the EN Snare® foreign body retrieval system. We paid Hatch $21 million as of December 31, 2009. Our consolidated financial statements for the year ended December 31, 2009 reflect royalty income (net sales) subsequent to the acquisition date of approximately $1.0 million and a net income of approximately $210,000 related to our Hatch acquisition. The purchase price was allocated as follows (in thousands):
|
Assets Acquired |
|
|
|
|
|
Intangibles |
|
|
|
|
|
Developed technology |
|
$ |
8,100 |
|
|
Customer list |
|
590 |
|
|
|
Non-compete |
|
240 |
|
|
|
Trademark |
|
650 |
|
|
|
Goodwill |
|
11,420 |
|
|
|
Total assets acquired |
|
21,000 |
|
|
|
|
|
|
|
|
|
Liabilities Assumed |
|
None |
|
|
|
|
|
|
|
|
|
Net assets acquired |
|
$ |
21,000 |
|
With respect to the assets we acquired from Hatch, we intend to amortize developed technology over 11 years and a non-compete covenant over seven years. The acquired trademarks are scheduled to renew in 3.87 years (based on a weighted-average computation, from December 31, 2009 until the trademark renewal date). While U.S. trademarks can be renewed indefinitely, we currently estimate that we will generate cash flow from the acquired trademarks for a period of 15 years from the acquisition date.
On March 9, 2009, we entered into an asset purchase agreement with Alveolus, a North Carolina corporation to purchase their non-vascular interventional stents used for esophageal, tracheobronchial and biliary stenting procedures. We paid Alveolus $19.1 million in March 2009. The gross amount of trade receivables we acquired from Alveolus was approximately $1.0 million, of which $49,000 was expected to be uncollectible. Our consolidated financial statements for the year ended December 31, 2009 reflect sales subsequent to the acquisition date of approximately $6.1 million and a net loss of approximately $2.3 million related to our acquisition of the Alveolus assets. The purchase price was allocated as follows (in thousands):
|
Assets Acquired |
|
|
|
|
|
Inventories |
|
$ |
1,741 |
|
|
Trade receivables |
|
974 |
|
|
|
Other assets |
|
241 |
|
|
|
Property and equipment |
|
547 |
|
|
|
Intangibles |
|
|
|
|
|
Developed technology |
|
5,700 |
|
|
|
Trademarks |
|
1,400 |
|
|
|
Customer lists |
|
1,100 |
|
|
|
In-process research and development |
|
400 |
|
|
|
Goodwill |
|
8,028 |
|
|
|
Total assets acquired |
|
20,131 |
|
|
|
|
|
|
|
|
|
Liabilities Assumed |
|
|
|
|
|
Accounts payable |
|
467 |
|
|
|
Other liabilities |
|
572 |
|
|
|
Total liabilities assumed |
|
1,039 |
|
|
|
|
|
|
|
|
|
Net assets acquired |
|
$ |
19,092 |
|
With respect to the assets we acquired from Alveolus, we intend to amortize the developed technology and trademarks over 15 years and customer lists on an accelerated basis over seven years. We intend to amortize the in-process research and development over 15 years, which will begin if the resulting product is successfully launched in the market. The acquired trademarks are scheduled to renew in 3.52 years (based on a weighted-average calculation, from December 31, 2009 until the trademark renewal date). While U.S. trademarks can be renewed indefinitely, we currently estimate that we will generate cash flow from the acquired trademarks for a period of 15 years from the acquisition date.
Our in-process research and development (“IPR&D”) represents the value of in-process projects acquired in 2009 that have not yet reached technological feasibility and have no alternative future uses as of the date of acquisition. The primary basis for determining the technological feasibility of these projects is obtaining regulatory approval to market the underlying products in an applicable geographic region. At the time of acquisition, we expect all acquired IPR&D will reach technological feasibility, but there can be no assurance that the commercial viability of these products will actually be achieved. Our IPR&D is currently not subject to amortization but amortization will commence upon the related product launch.
On February 19, 2009, we entered into an asset purchase and supply agreement with Biosearch, a New Jersey corporation, to purchase a bipolar coagulation probe and grafted biliary stents. We paid $1.1 million in February 2009 and paid an additional $500,000 in June 2009. Our financial statements for the year ended December 31, 2009 reflect sales subsequent to the acquisition date of approximately $1.6 million and net income of approximately $320,000 related to the Biosearch acquisition. The purchase price was allocated as follows (in thousands):
|
Assets Acquired |
|
|
|
|
|
Inventories |
|
$ |
188 |
|
|
Property and equipment |
|
31 |
|
|
|
Intangibles |
|
|
|
|
|
Developed technology |
|
380 |
|
|
|
Customer lists |
|
660 |
|
|
|
Non-compete |
|
25 |
|
|
|
Goodwill |
|
316 |
|
|
|
Total assets acquired |
|
1,600 |
|
|
|
|
|
|
|
|
|
Liabilities Assumed |
|
None |
|
|
|
|
|
|
|
|
|
Net assets acquired |
|
$ |
1,600 |
|
With respect to the assets we acquired from Biosearch, we intend to amortize developed technology over 15 years, customer lists on an accelerated basis over eight years and a non-compete covenant over seven years.
The goodwill arising from the acquisitions discussed above consists largely of the synergies and economies of scale we hope to achieve from combining the acquired assets and operations with our historical operations. The goodwill recognized from these acquisitions is expected to be deductible for income tax purposes.
The following table summarizes our unaudited consolidated results of operations for the years ended December 31, 2009 and 2008, as well as the unaudited pro forma consolidated results of operations as though the Hatch, Alveolus and Biosearch acquisitions had occurred on January 1, 2008 (in thousands, except per share data):
|
|
|
Year Ended |
|
Year Ended |
|
||||||||
|
|
|
As Reported |
|
Pro Forma |
|
As Reported |
|
Pro Forma |
|
||||
|
|
|
|
|
|
|
|
|
|
|
||||
|
Sales |
|
$ |
257,462 |
|
$ |
259,914 |
|
$ |
227,143 |
|
$ |
238,639 |
|
|
Net income |
|
22,530 |
|
22,470 |
|
20,727 |
|
18,532 |
|
||||
|
Earnings per common share: |
|
|
|
|
|
|
|
|
|
||||
|
Basic |
|
$ |
.80 |
|
$ |
.80 |
|
$ |
.75 |
|
$ |
.67 |
|
|
Diluted |
|
$ |
.79 |
|
$ |
.79 |
|
$ |
.73 |
|
$ |
.65 |
|
The unaudited pro forma condensed consolidated income statement information set forth above is for informational purposes only and should not be considered indicative of actual results that would have been achieved if the Hatch, Alveolus and Biosearch transactions had been completed at the beginning of 2008, or results that may be obtained in any future period.
On December 11, 2008, we entered into an asset purchase agreement with Tran PA-C, Inc., a Florida corporation (“Tran PA-C”), to purchase certain catheter extraction products for $1.5 million. We also accrued $11,000 in acquisition costs associated with the transaction. Additional payments to Tran PA-C totaling $1.5 million have not been accrued as they are contingent upon reaching future certain sales levels. In addition, we agreed to pay Tran PA-C a running royalty payment of 6% of net sales for the catheter extractor product for the 10 years subsequent to the date of the asset purchase agreement. The purchase price was allocated to inventories for $71,228, property and equipment for $15,436, customer lists for $80,000, developed technology for $85,000, a covenant not to compete for $30,000 and goodwill for $1.2 million. With respect to the assets we acquired from Tran PA-C, we intend to amortize customer lists on an accelerated basis over 14 years and developed technology over ten years. This product can be used to extract chronic dialysis catheters, similar to our ProGuide™ dialysis catheter purchased from Datascope in 2007.
On January 29, 2008, we entered into an asset purchase and supply agreement with Micrus Endovascular Corporation, a Delaware corporation (“Micrus”) to purchase three catheter platforms for $3.0 million dollars. We paid Micrus $1.5 million in January 2008 and an additional $1.5 million in December of 2008. We also paid Micrus $12,300 in acquisition costs. The purchase price was allocated to inventories for approximately $144,000, customer lists for approximately $270,000, developed technology for approximately $330,000 and goodwill for approximately $2.3 million. We intend to amortize customer lists on an accelerated basis over 14 years and developed technology over 15 years.
During 2007, we entered into a distribution agreement with Milamy, wherein we purchased the exclusive, worldwide right to distribute the KanguruWeb® Abdominal Retraction System in vascular lab markets for $350,000. During 2008, we entered into an agreement with Milamy whereby Milamy agreed to terminate their exclusive license rights with McKnight and substitute us as the exclusive licensee of the KanguruWeb® technology in exchange for our payment of $100,000. The purchase price was allocated to a distribution agreement for $450,000 and we intend to amortize it over five years.
On August 7, 2007, we entered into a distribution agreement with GMA Company, Ltd (“GMA”) for the exclusive distribution rights to sell a micro-catheter. We paid to GMA an initial payment of $500,000 in September 2007, another payment of $500,000 in November 2007 and $500,000 in September 2008. We paid $4,000 in acquisition costs. On March 3, 2009, we paid $500,000 to GMA representing the final payment due on our distribution agreement. We have allocated the purchase price of approximately $2.0 million as a distribution agreement and we intend to amortize it over an estimated life of 11 years.
On July 17, 2007, we entered into a patent assignment and royalty agreement with Lightek Corporation (“Lightek”) to manufacture and sell a radiopaque marker band. We made an initial payment of $228,000 to Lightek in 2007 and a payment of $200,000 in May of 2008 for reaching certain milestones identified in the patent assignment and royalty agreement. In addition, we agreed to a running royalty payment of 3% of net sales beginning with the issuance of the patent and continuing through the expiration of the patent. We paid Lightek $8,400 in 2007 and accrued $1,600 for acquisition costs. A final milestone payment of approximately $90,000 was made in 2009 upon their achievement of certain sales levels. The purchase price was allocated to developed technology for $78,000, customer lists for $240,000
and goodwill for $210,000. With respect to the assets we acquired form Lightek, we intend to amortize customer lists on an accelerated basis over 14 years and developed technology over 15 years.
On February 26, 2007, we entered into an asset purchase agreement with Datascope to purchase certain assets for the manufacture and sale of the ProGuide™ catheter for approximately $3.3 million, including future minimum royalty payments of $279,181. In connection with this agreement, we acquired assets, inventories, a customer list, patents and a trademark. The purchase price was allocated to property and equipment for $25,971, inventories for $778,659, a customer list for $300,000, developed technology for $150,000, a trademark for $150,000, a covenant not to compete for $20,000 and goodwill for approximately $1.9 million. In addition, we agreed to a running royalty payment of 5% of net sales through 2014, with a minimum annual payment of $50,000. Based on management’s evaluation of the purchase agreement, we recorded the additional minimum earn-out payment as an assumed liability and an addition to the cost of the acquisition. The minimum running royalty payment of $350,000 to be paid through 2014 was discounted using our incremental borrowing rate of 6% to arrive at an assumed liability of $279,181. We intend to amortize customer lists on an accelerated basis over 14 years and developed technology and trademark over 15 years and a covenant not to compete over 3 years.
On February 14, 2007, we terminated our exclusive sales distributor agreement with Medrad and purchased the customer list and information we believe will enable us to conduct direct sales in Sweden. The purchase price of $124,036 was allocated to property and equipment and customer lists. We intend to amortize customer lists amortized on an accelerated basis over 14 years.
Pro forma consolidated financial results for the acquisitions completed related to years ending December 31, 2008 and 2007 have not been included because their effects would not be material.
3. INVENTORIES
Inventories at December 31, 2009 and 2008, consisted of the following (in thousands):
|
|
|
2009 |
|
2008 |
|
||
|
|
|
|
|
|
|
||
|
Finished goods |
|
$ |
24,502 |
|
$ |
17,818 |
|
|
Work-in-process |
|
5,542 |
|
4,790 |
|
||
|
Raw materials |
|
17,126 |
|
15,750 |
|
||
|
|
|
|
|
|
|
||
|
Total |
|
$ |
47,170 |
|
$ |
38,358 |
|
4. GOODWILL AND INTANGIBLE ASSETS
The changes in the carrying amount of goodwill for the years ended December 31, 2009 and 2008, are as follows (in thousands):
|
|
|
2009 |
|
2008 |
|
||
|
|
|
|
|
|
|
||
|
Goodwill balance at January 1 |
|
$ |
13,048 |
|
$ |
9,527 |
|
|
Additions as the result of acquisitions |
|
19,954 |
|
3,521 |
|
||
|
|
|
|
|
|
|
||
|
Goodwill balance at December 31 |
|
$ |
33,002 |
|
$ |
13,048 |
|
Intangible assets at December 31, 2009 and 2008, consisted of the following (in thousands):
|
|
|
2009 |
|
|||||||
|
|
|
Gross |
|
Accumulated |
|
Net |
|
|||
|
|
|
|
|
|
|
|
|
|||
|
Patents |
|
$ |
3,757 |
|
$ |
(1,214 |
) |
$ |
2,543 |
|
|
Distribution agreement |
|
2,400 |
|
(385 |
) |
2,015 |
|
|||
|
License agreements |
|
403 |
|
(287 |
) |
116 |
|
|||
|
Trademark |
|
2,538 |
|
(411 |
) |
2,127 |
|
|||
|
Developed technology |
|
17,513 |
|
(535 |
) |
16,978 |
|
|||
|
In-process research and development |
|
400 |
|
0 |
|
400 |
|
|||
|
Covenant not to compete |
|
315 |
|
(25 |
) |
290 |
|
|||
|
Customer lists |
|
4,755 |
|
(2,380 |
) |
2,375 |
|
|||
|
Royalty agreements |
|
267 |
|
(213 |
) |
54 |
|
|||
|
|
|
|
|
|
|
|
|
|||
|
Total |
|
$ |
32,348 |
|
$ |
(5,450 |
) |
$ |
26,898 |
|
|
|
|
2008 |
|
|||||||
|
|
|
Gross |
|
Accumulated |
|
Net |
|
|||
|
|
|
|
|
|
|
|
|
|||
|
Patents |
|
$ |
2,704 |
|
$ |
(1,019 |
) |
$ |
1,685 |
|
|
Distribution agreement |
|
1,901 |
|
(178 |
) |
1,723 |
|
|||
|
License agreements |
|
403 |
|
(242 |
) |
161 |
|
|||
|
Trademark |
|
515 |
|
(314 |
) |
201 |
|
|||
|
Developed technology |
|
1,730 |
|
(119 |
) |
1,611 |
|
|||
|
Covenant not to compete |
|
50 |
|
(18 |
) |
32 |
|
|||
|
Customer lists |
|
2,465 |
|
(1,073 |
) |
1,392 |
|
|||
|
Royalty agreements |
|
267 |
|
(159 |
) |
108 |
|
|||
|
|
|
|
|
|
|
|
|
|||
|
Total |
|
$ |
10,035 |
|
$ |
(3,122 |
) |
$ |
6,913 |
|
Aggregate amortization expense for the years ended December 31, 2009, 2008 and 2007, was approximately $2,342,000, $965,000 and $807,000, respectively.
Estimated amortization expense for the intangible assets for the next five years consisted of the following as of December 31, 2009 (in thousands):
|
Year Ending |
|
|
|
|
|
|
|
|
|
|
|
2010 |
|
$ |
2,636 |
|
|
2011 |
|
2,320 |
|
|
|
2012 |
|
2,148 |
|
|
|
2013 |
|
2,117 |
|
|
|
2014 |
|
1,952 |
|
|
5. INCOME TAXES
For the years ended December 31, 2009, 2008 and 2007, income before income taxes is broken out between U.S. and foreign-sourced operations and consisted of the following (in thousands):
|
|
|
2009 |
|
2008 |
|
2007 |
|
|||
|
|
|
|
|
|
|
|
|
|||
|
Domestic |
|
$ |
26,918 |
|
$ |
28,184 |
|
$ |
22,033 |
|
|
Foreign |
|
6,176 |
|
3,661 |
|
1,366 |
|
|||
|
|
|
|
|
|
|
|
|
|||
|
Total |
|
$ |
33,094 |
|
$ |
31,845 |
|
$ |
23,399 |
|
The components of the provision for income taxes for the years ended December 31, 2009, 2008 and 2007 consisted of the following (in thousands):
|
|
|
2009 |
|
2008 |
|
2007 |
|
|||
|
|
|
|
|
|
|
|
|
|||
|
Current expense: |
|
|
|
|
|
|
|
|||
|
Federal |
|
$ |
7,846 |
|
$ |
9,693 |
|
$ |
5,660 |
|
|
State |
|
689 |
|
1,008 |
|
800 |
|
|||
|
Foreign |
|
238 |
|
600 |
|
367 |
|
|||
|
|
|
|
|
|
|
|
|
|||
|
|
|
8,773 |
|
11,301 |
|
6,827 |
|
|||
|
|
|
|
|
|
|
|
|
|||
|
Deferred (benefit) expense: |
|
|
|
|
|
|
|
|||
|
Federal |
|
1,264 |
|
(133 |
) |
752 |
|
|||
|
State |
|
227 |
|
(44 |
) |
254 |
|
|||
|
Foreign |
|
300 |
|
(6 |
) |
(22 |
) |
|||
|
|
|
|
|
|
|
|
|
|||
|
|
|
1,791 |
|
(183 |
) |
984 |
|
|||
|
|
|
|
|
|
|
|
|
|||
|
Total |
|
$ |
10,564 |
|
$ |
11,118 |
|
$ |
7,811 |
|
The difference between the income tax expense reported and amounts computed by applying the statutory federal rate of 35.0% to pretax income for the years ended December 31, 2009, 2008 and 2007 consisted of the following (in thousands):
|
|
|
2009 |
|
2008 |
|
2007 |
|
|||
|
|
|
|
|
|
|
|
|
|||
|
Computed federal income tax expense at statutory rate of 35% |
|
$ |
11,583 |
|
$ |
11,146 |
|
$ |
8,189 |
|
|
State income taxes |
|
596 |
|
627 |
|
685 |
|
|||
|
Tax credits |
|
(670 |
) |
(271 |
) |
(195 |
) |
|||
|
Production activity deduction |
|
(215 |
) |
(114 |
) |
(118 |
) |
|||
|
Income of subsidiaries recorded at foreign tax rates |
|
(1,062 |
) |
(822 |
) |
(224 |
) |
|||
|
Tax-exempt interest income |
|
|
|
(45 |
) |
(82 |
) |
|||
|
Uncertain tax positions |
|
114 |
|
66 |
|
13 |
|
|||
|
Deferred compensation insurance investments |
|
(196 |
) |
398 |
|
(210 |
) |
|||
|
Other — including the effect of graduated rates |
|
414 |
|
133 |
|
(247 |
) |
|||
|
|
|
|
|
|
|
|
|
|||
|
Total income tax expense |
|
$ |
10,564 |
|
$ |
11,118 |
|
$ |
7,811 |
|
Deferred income tax assets and liabilities at December 31, 2009 and 2008, consisted of the following temporary differences and carry-forward items (in thousands):
|
|
|
Current |
|
Long-Term |
|
||||||||
|
|
|
2009 |
|
2008 |
|
2009 |
|
2008 |
|
||||
|
|
|
|
|
|
|
|
|
|
|
||||
|
Deferred income tax assets: |
|
|
|
|
|
|
|
|
|
||||
|
Allowance for uncollectible accounts receivable |
|
$ |
221 |
|
$ |
205 |
|
$ |
— |
|
$ |
— |
|
|
Accrued compensation expense |
|
750 |
|
699 |
|
1,436 |
|
966 |
|
||||
|
Inventory capitalization for tax purposes |
|
696 |
|
531 |
|
|
|
|
|
||||
|
Inventory obsolescence reserve |
|
540 |
|
510 |
|
|
|
|
|
||||
|
Net operating loss carry-forwards |
|
|
|
|
|
|
|
77 |
|
||||
|
Deferred revenue |
|
|
|
|
|
152 |
|
173 |
|
||||
|
Intangible assets |
|
|
|
|
|
420 |
|
487 |
|
||||
|
Stock-based compensation expense |
|
|
|
|
|
1,476 |
|
1,083 |
|
||||
|
Uncertain tax positions |
|
354 |
|
318 |
|
230 |
|
251 |
|
||||
|
Other |
|
1,055 |
|
705 |
|
|
|
6 |
|
||||
|
|
|
|
|
|
|
|
|
|
|
||||
|
Total deferred income tax assets |
|
3,616 |
|
2,968 |
|
3,714 |
|
3,043 |
|
||||
|
|
|
|
|
|
|
|
|
|
|
||||
|
Deferred income tax liabilities: |
|
|
|
|
|
|
|
|
|
||||
|
Prepaid expenses |
|
(327) |
|
(186 |
) |
|
|
|
|
||||
|
Property and equipment |
|
|
|
|
|
(13,873) |
|
(11,161 |
) |
||||
|
Other |
|
|
|
|
|
(1,092) |
|
(630 |
) |
||||
|
|
|
|
|
|
|
|
|
|
|
||||
|
Net |
|
$ |
3,289 |
|
$ |
2,782 |
|
$ |
(11,251) |
|
$ |
(8,748 |
) |
|
|
|
|
|
|
|
|
|
|
|
||||
|
Reported as: |
|
|
|
|
|
|
|
|
|
||||
|
Deferred income tax assets |
|
$ |
3,289 |
|
$ |
2,782 |
|
$ |
|
|
$ |
23 |
|
|
Deferred income tax liabilities |
|
|
|
|
|
(11,251) |
|
(8,771 |
) |
||||
|
|
|
|
|
|
|
|
|
|
|
||||
|
Net |
|
$ |
3,289 |
|
$ |
2,782 |
|
$ |
(11,251) |
|
$ |
(8,748 |
) |
The long-term deferred income tax balances are not netted as they represent deferred amounts applicable to different taxing jurisdictions. Deferred income tax balances reflect the effects of temporary differences between the carrying amounts of assets and liabilities and their tax bases and are stated at enacted tax rates expected to be in effect when taxes are actually paid or recovered.
We have not provided U.S. deferred income taxes or foreign withholding taxes on the undistributed earnings of our non-U.S. subsidiaries since these earnings are intended to be reinvested indefinitely in operations outside the United States. It is not practical to estimate the amount of additional taxes that might be payable on such undistributed earnings.
As of December 31, 2009 and 2008, we had non-U.S. net operating loss carry-forward of approximately $0 and $273,000, respectively, which had no expiration date.
We are subject to income taxes in the United States and numerous foreign jurisdictions. Significant judgment is required in determining our worldwide provision for income taxes and recording the related assets and liabilities. In the ordinary course of our business, there are many transactions and calculations where the ultimate tax determination is uncertain. We are regularly under audit by tax authorities. Our federal and state income tax returns for 2006 through 2009 are open tax years. Our returns in several foreign tax jurisdictions have open tax years from 2004 through 2009.
On January 1, 2007, we adopted a new accounting standard that clarified the accounting for uncertainty in income taxes recognized in the financial statements. As a result of this adoption, we recognized a cumulative-effect adjustment of approximately $610,000, increasing our liability for unrecognized tax benefits and reducing the January 1, 2007 balance of retained earnings.
The total liability for unrecognized tax benefits at December 31, 2009 and 2008, including temporary tax differences, was approximately $2.9 million and $2.8 million, respectively, of which approximately $2.4 million and $2.3 million, respectively, would favorably impact our effective tax rate if recognized. As of December 31, 2009 and 2008, we accrued approximately $251,000 and $242,000, respectively, in interest and penalties related to unrecognized tax benefits. We account for interest expense and penalties for unrecognized tax benefits as part of our income tax provision. We do not anticipate that unrecognized tax benefits will significantly increase or decrease within 12 months of the reporting date.
During the year ended December 31, 2009, we added approximately $127,000 to our liability for unrecognized tax benefits. Of our total liability for unrecognized tax benefits, approximately $631,000 would favorably impact our 2009 effective tax rate if recognized. Included in this amount is approximately $9,000 for the year ended December 31, 2009 related to interest expense. In addition, we recorded an unrecognized tax benefit related to the lapse of applicable statutes of limitation of approximately $711,000, of which approximately $610,000 favorably impacted our effective tax rate.
During the year ended December 31, 2008, we reduced our liability for unrecognized tax benefits by approximately $793,000. This reduction in our unrecognized tax benefits was due primarily to the settlement of our Internal Revenue Service (“IRS”) audit. Included in this amount is a reduction of approximately $160,000 for the year ended December 31, 2008 related to interest expense. In addition, we recorded an unrecognized tax benefit related to the lapse of applicable statutes of limitation of approximately $627,000, of which approximately $543,000 favorably impacted our effective tax rate. We also added approximately $816,000 to our liability for unrecognized tax benefits, of which we believe approximately $449,000 would favorably impact our effective tax rate, if recognized.
Although we believe our estimates are reasonable, we can make no assurance that the final tax outcome of these matters will not be different from that which we have reflected in our historical income tax provisions and accruals. Such difference could have a material impact on our income tax provision and operating results in the period in which we make such determination.
A reconciliation of the beginning and ending amount of liabilities associated with uncertain tax positions for the years ended December 31, 2009, 2008 and 2007 consisted of the following:
|
Tabular Rollforward |
|
2009 |
|
2008 |
|
2007 |
|
|||
|
Unrecognized tax benefits, opening balance |
|
$ |
2,668 |
|
$ |
3,611 |
|
$ |
3,212 |
|
|
Gross increases in tax positions taken in a prior year |
|
163 |
|
257 |
|
131 |
|
|||
|
Gross decreases in tax positions taken in a prior year |
|
(40 |
) |
(278 |
) |
(4 |
) |
|||
|
Gross increases in tax positions taken in the current year |
|
710 |
|
547 |
|
554 |
|
|||
|
Settlements with taxing authorities |
|
— |
|
(842 |
) |
— |
|
|||
|
Lapse of applicable statute of limitations |
|
(711 |
) |
(627 |
) |
(542 |
) |
|||
|
Unrecognized tax benefits, ending balance |
|
$ |
2,790 |
|
$ |
2,668 |
|
$ |
3,351 |
|
The tabular rollforward ending balance does not include interest expense (net of tax effect) and penalties related to unrecognized tax benefits. During the year ended December 31, 2008, we settled two open audits with the IRS related to certain temporary deductions. As a result of these settlements, we paid an additional $2.2 million on our 2007 federal and state extension payments. The reversal of these temporary differences and the payment of the additional taxes did not have a material impact on our financial statements for the year ended December 31, 2008, as the income tax liabilities had already been accrued in our financial statements. Of the amounts paid, $1.0 million was classified as a current liability related to unrecognized tax positions on the December 31, 2007 consolidated balance sheet.
6. ACCRUED EXPENSES
Accrued expenses at December 31, 2009 and 2008, consisted of the following (in thousands):
|
|
|
2009 |
|
2008 |
|
||
|
|
|
|
|
|
|
||
|
Payroll taxes |
|
$ |
823 |
|
$ |
640 |
|
|
Payroll |
|
1,557 |
|
2,377 |
|
||
|
Bonuses |
|
2,072 |
|
482 |
|
||
|
Commissions |
|
689 |
|
699 |
|
||
|
Vacation |
|
2,616 |
|
2,438 |
|
||
|
Other accrued expenses |
|
4,439 |
|
3,337 |
|
||
|
|
|
|
|
|
|
||
|
Total |
|
$ |
12,196 |
|
$ |
9,973 |
|
7. REVOLVING CREDIT FACILITY AND LONG-TERM DEBT
On December 7, 2006, we entered into an unsecured loan agreement with Bank of America, whereby Bank of America agreed to provide us with a line of credit in the amount of $30.0 million expiring on December 7, 2010. The loan agreement requires us to pay interest at a rate equal to the lesser of (i) the maximum lawful rate of interest permitted under applicable usury laws, or (ii) Bank of America’s prime rate, plus a negative margin, as defined in the loan agreement. Alternatively, we may elect optional interest rates based on the London Inter-Bank Offered Rate (LIBOR) during interest periods we have agreed to with Bank of America. Our outstanding borrowings on this loan as of December 31, 2009 and 2008 were $7.0 million and $0, respectively. Our interest rate as of December 31, 2009 is set at 1.0%.
On December 8, 2006, we entered into an unsecured loan agreement with Zions, whereby Zions agreed to provide us with a line of credit in the amount of $1.0 million. The Zions loan agreement requires us to pay interest at a rate of prime minus 0.35%. The loan expired on December 1, 2009; however, it was extended for an additional three years to December 1, 2012. There were no outstanding borrowings on this loan as of December 31, 2009 and 2008.
We believe we are in compliance with the covenants in our loan agreements, which require the maintenance of certain financial ratios and minimum working capital and also include, among other things, limitations on our incurrence of additional indebtedness, restrictions on our pledge or sale of assets and a prohibition against our payment of dividends to shareholders.
8. COMMITMENTS AND CONTINGENCIES
We are obligated under non-cancelable operating leases for manufacturing facilities, finished good distribution, office space and equipment. Total rental expense on these operating leases and on our manufacturing and office building for the years ended December 31, 2009, 2008 and 2007, approximated $2.8 million, $2.6 million and $2.6 million, respectively.
The future minimum lease payments for operating leases as of December 31, 2009, consisted of the following (in thousands):
|
Years Ending |
|
Operating |
|
|
|
|
|
|
|
|
|
2010 |
|
$ |
2,587 |
|
|
2011 |
|
2,308 |
|
|
|
2012 |
|
2,102 |
|
|
|
2013 |
|
1,789 |
|
|
|
2014 |
|
1,783 |
|
|
|
Thereafter |
|
10,116 |
|
|
|
|
|
|
|
|
|
Total minimum lease payments |
|
$ |
20,685 |
|
Irish Government Development Agency Grants. As of December 31, 2009, we had entered into several grant agreements with the Irish Government Development Agency. We have recorded the grants related to research and development projects and costs of hiring and training employees as a reduction of operating expenses in 2009 and 2008 in the amounts of approximately $177,000 and $158,000, respectively. Grants related to the acquisition of property and
equipment purchased in Ireland are amortized as a reduction to depreciation expense over lives corresponding to the depreciable lives of such property and equipment. The balance of deferred credits related to such grants as of December 31, 2009 and 2008, was approximately $1,874,000 and $1,994,000, respectively. During 2009, 2008 and 2007, approximately $121,000, $111,000 and $135,000, respectively, of the deferred credit was amortized as a reduction of operating expenses.
There is a commitment to repay the Irish government for grants received if we were to cease production in Ireland prior to the expiration of the grant liability period. The grant liability period is usually between 5-8 years from the last claim made on a grant. As of December 31, 2009, the total amount of grants that could be subject to refund was approximately $3.1 million. Management does not believe we will ever have to repay any of these grant monies, as we have no intention of ceasing operation in Ireland.
Litigation. In the ordinary course of business, we are involved in litigation and claims which management believes will not have a materially adverse effect on our financial position or results of operations.
9. EARNINGS PER COMMON SHARE (EPS)
The computation of weighted average shares outstanding and the basic and diluted earnings per common share for the following periods consisted of the following (in thousands except per share amounts):
|
|
|
Net |
|
Shares |
|
Per Share |
|
||
|
|
|
|
|
|
|
|
|
||
|
Year ended December 31, 2009: |
|
|
|
|
|
|
|
||
|
Basic EPS |
|
$ |
22,530 |
|
28,011 |
|
$ |
0.80 |
|
|
Effect of dilutive stock options and warrants |
|
|
|
595 |
|
|
|
||
|
|
|
|
|
|
|
|
|
||
|
Diluted EPS |
|
$ |
22,530 |
|
28,606 |
|
$ |
0.79 |
|
|
|
|
|
|
|
|
|
|
||
|
Year ended December 31, 2008: |
|
|
|
|
|
|
|
||
|
Basic EPS |
|
$ |
20,727 |
|
27,769 |
|
$ |
0.75 |
|
|
Effect of dilutive stock options and warrants |
|
|
|
781 |
|
|
|
||
|
|
|
|
|
|
|
|
|
||
|
Diluted EPS |
|
$ |
20,727 |
|
28,550 |
|
$ |
0.73 |
|
|
|
|
|
|
|
|
|
|
||
|
Year ended December 31, 2007: |
|
|
|
|
|
|
|
||
|
Basic EPS |
|
$ |
15,588 |
|
27,425 |
|
$ |
0.57 |
|
|
Effect of dilutive stock options and warrants |
|
|
|
779 |
|
|
|
||
|
|
|
|
|
|
|
|
|
||
|
Diluted EPS |
|
$ |
15,588 |
|
28,204 |
|
$ |
0.55 |
|
For the years ended December 31, 2009, 2008 and 2007, approximately 681,000, 984,000 and 1,422,000, respectively, of stock options were not included in the computation of diluted earnings per share because they would have been anti-dilutive.
Repurchase of Our Common Stock. On February 24, 2007, our Board of Directors approved the repurchase of 344,084 shares of our Common Stock in a private transaction with a non-institutional private investor for $4.1 million, which occurred during the first quarter of 2007. On April 30, 2007, our Board of Directors approved the repurchase of up to 1.4 million shares of Common Stock. During the second and third quarters of 2007, we repurchased a total of 119,900 shares of Common Stock for approximately $1.3 million. During the first quarter of 2009 we repurchased a total of 250,158 shares of Common Stock for approximately $2.5 million.
10. EMPLOYEE STOCK PURCHASE PLAN AND STOCK OPTIONS AND WARRANTS.
Our stock-based compensation primarily consists of the following plans:
Stock Incentive Plan. During 1999, we adopted the Merit Medical Systems, Inc. Stock Incentive Plan (formerly the 1999 Omnibus Stock Incentive Plan), which provides for the issuance of incentive stock options, non-statutory stock options and certain corresponding stock appreciation rights (the “Stock Incentive Plan”). Options may be granted to directors, officers, outside consultants and key employees and may be granted upon such terms and such conditions as the Compensation Committee of our Board of Directors determines. Options typically vest 20% per year over either a four and one-half or five-year life with contractual lives of five, seven and ten years. The Stock Incentive Plan also provides for options that vest 100% upon grant with contractual lives of ten years. In no event, however, may the exercise price be less than the fair market value on the date of grant. Under a provision of our Stock Incentive Plan, participants are allowed to surrender shares of our Common Stock for the payment of the option price and minimum statutory taxes associated with the exercise of options. The shares surrendered must be shares the participant has held for more than six months. The value of the shares surrendered is based on the closing price of our Common Stock on the date of exercise by the participant. During 2009, approximately 224,000 of the remaining shares expired under this Stock Incentive Plan.
2006 Long-Term Incentive Plan. In May 2006, our Board of Directors adopted and our shareholders approved, the Merit Medical Systems, Inc. 2006 Long-Term Incentive Plan (the “2006 Incentive Plan”). The 2006 Incentive Plan provides for the granting of stock options, stock appreciation rights, restricted stock, stock units (including restricted stock units) and performance awards. Options may be granted to directors, officers, outside consultants and key employees and may be granted upon such terms and such conditions as the Compensation Committee of our Board of Directors determines. Options will typically vest on an annual basis over a three to five year life (or one year if performance based) with contractual lives of seven to ten years. As of December 31, 2009, a total of approximately 1.9 million shares remained available to be issued under the 2006 Incentive Plan.
Employee Stock Purchase Plan. We have a qualified and a non-qualified Employee Stock Purchase Plan (“ESPP”), which will expire on June 30, 2016. As of December 31, 2009, the total number of shares that remained available to be issued under our qualified plan was approximately 257,000 shares and 80,000 shares for our non-qualified plan. ESPP participants purchase shares on a quarterly basis at a price equal to 95% of the market price of the Common Stock at the end of the applicable offering period.
Stock-Based Compensation Expense. The stock-based compensation expense before income tax expense for the years ended December 31, 2009, 2008 and 2007 consisted of the following (in thousands):
|
|
|
2009 |
|
2008 |
|
2007 |
|
|||
|
|
|
|
|
|
|
|
|
|||
|
Cost of goods sold |
|
$ |
205 |
|
$ |
101 |
|
$ |
261 |
|
|
Research and development |
|
57 |
|
37 |
|
81 |
|
|||
|
Selling, general, and administrative |
|
920 |
|
824 |
|
788 |
|
|||
|
Stock-based compensation expense before taxes |
|
$ |
1,182 |
|
$ |
962 |
|
$ |
1,130 |
|
We recognize stock-based compensation expense (net of a forfeiture rate) for those awards which are expected to vest on a straight-line basis over the requisite service period. We estimate the forfeiture rate based on our historical experience and expectations about future forfeitures. As of December 31, 2009, the total remaining unrecognized compensation cost related to non-vested stock options, net of forfeitures, was approximately $3.9 million and is expected to be recognized over a weighted average period of 3.4 years.
In applying the Black-Scholes methodology to the option grants, the fair value of our stock-based awards granted were estimated using an expected annual dividend yield of 0% and the following assumptions for the periods indicated below:
|
|
|
2009 |
|
2008 |
|
2007 |
|
|
|
|
|
|
|
|
|
|
|
Risk-free interest rate |
|
2.70% |
|
3.24%-3.55% |
|
3.64%-5.00% |
|
|
Expected option life |
|
6.0 years |
|
4.2-6.0 years |
|
6.0 years |
|
|
Expected price volatility |
|
42.4% |
|
38.0%-41.7% |
|
44.3%-47.8% |
|
The average risk-free interest rate is determined using the U.S. Treasury rate in effect as of the date of grant, based on the expected term of the stock option. We determine the expected term of the stock options using the historical exercise behavior of employees. The expected price volatility was determined using a weighted average of daily historical volatility of our stock price over the corresponding expected option life and implied volatility based on recent trends of the daily historical volatility. For options with a vesting period, compensation expense is recognized on a straight-line basis over the service period, which corresponds to the vesting period. Compensation expense is recognized immediately for options that are fully vested on the date of grant. During the years ended December 31, 2009, 2008 and 2007, 140,000, 499,000 and 425,500 stock-based compensation grants were made for a total fair value of approximately $1.0 million, $2.5 million and $2.5 million, net of estimated forfeitures, respectively.
The table below presents information related to stock option activity for the years ended December 31, 2009, 2008 and 2007 (in thousands):
|
|
|
2009 |
|
2008 |
|
2007 |
|
|||
|
|
|
|
|
|
|
|
|
|||
|
Total intrinsic value of stock options exercised |
|
$ |
2,757 |
|
$ |
6,150 |
|
$ |
1,471 |
|
|
Cash received from stock option exercises |
|
1,690 |
|
5,405 |
|
1,537 |
|
|||
|
Net income tax benefit from the exercises of stock options |
|
987 |
|
2,044 |
|
500 |
|
|||
Changes in stock options for the years ended December 31, 2009, 2008 and 2007 consisted of the following (shares and intrinsic value in thousands):
|
|
|
Number |
|
Weighted |
|
Remaining |
|
Intrinsic |
|
||
|
|
|
|
|
|
|
|
|
|
|
||
|
2007: |
|
|
|
|
|
|
|
|
|
||
|
Beginning balance |
|
3,797 |
|
|
|
|
|
|
|
||
|
Granted |
|
426 |
|
$ |
12.14 |
|
|
|
|
|
|
|
Exercised |
|
203 |
|
6.40 |
|
|
|
|
|
||
|
Forfeited/expired |
|
69 |
|
14.27 |
|
|
|
|
|
||
|
Outstanding at December 31 |
|
3,951 |
|
11.34 |
|
5.7 |
|
$ |
13,754 |
|
|
|
Exercisable |
|
3,353 |
|
11.28 |
|
5.7 |
|
12,405 |
|
||
|
Ending vested and expected to vest |
|
3,908 |
|
11.33 |
|
5.6 |
|
13,669 |
|
||
|
|
|
|
|
|
|
|
|
|
|
||
|
Weighted average fair value of options granted during year |
|
|
|
$ |
6.34 |
|
|
|
|
|
|
|
|
|
|
|
|
|
|
|
|
|
||
|
2008: |
|
|
|
|
|
|
|
|
|
||
|
Beginning balance |
|
3,951 |
|
|
|
|
|
|
|
||
|
Granted |
|
499 |
|
$ |
14.41 |
|
|
|
|
|
|
|
Exercised |
|
612 |
|
8.85 |
|
|
|
|
|
||
|
Forfeited/expired |
|
5 |
|
18.84 |
|
|
|
|
|
||
|
Outstanding at December 31 |
|
3,833 |
|
12.12 |
|
5.0 |
|
$ |
23,579 |
|
|
|
Exercisable |
|
2,964 |
|
11.74 |
|
4.7 |
|
19,665 |
|
||
|
Ending vested and expected to vest |
|
3,785 |
|
12.11 |
|
5.0 |
|
23,367 |
|
||
|
|
|
|
|
|
|
|
|
|
|
||
|
Weighted average fair value of options granted during year |
|
|
|
$ |
5.32 |
|
|
|
|
|
|
|
|
|
|
|
|
|
|
|
|
|
||
|
2009: |
|
|
|
|
|
|
|
|
|
||
|
Beginning balance |
|
3,833 |
|
|
|
|
|
|
|
||
|
Granted |
|
140 |
|
$ |
17.28 |
|
|
|
|
|
|
|
Exercised |
|
308 |
|
6.60 |
|
|
|
|
|
||
|
Forfeited/expired |
|
34 |
|
15.39 |
|
|
|
|
|
||
|
Outstanding at December 31 |
|
3,631 |
|
12.76 |
|
4.2 |
|
$ |
24,363 |
|
|
|
Exercisable |
|
2,854 |
|
12.37 |
|
3.9 |
|
20,459 |
|
||
|
Ending vested and expected to vest |
|
3,610 |
|
12.75 |
|
4.2 |
|
24,261 |
|
||
|
|
|
|
|
|
|
|
|
|
|
||
|
Weighted average fair value of options granted during year |
|
|
|
$ |
6.86 |
|
|
|
|
|
|
On November 17, 2004, we acquired all of the assets and assumed certain liabilities of MedSource Packaging Concepts LLC (“MedSource”). In connection with this acquisition we issued 100,000 warrants to MedSource at a fair value of approximately $323,170. Changes in these warrants for the years ended December 31, 2009, 2008 and 2007, consisted of the following (in thousands):
|
|
|
Number |
|
Weighted |
|
Remaining |
|
Intrinsic |
|
|||
|
|
|
|
|
|
|
|
|
|
|
|||
|
2007: |
|
|
|
|
|
|
|
|
|
|||
|
Beginning balance |
|
100 |
|
|
|
|
|
|
|
|
||
|
Outstanding at December 31 |
|
100 |
|
|
$ |
10.13 |
|
1.9 |
|
$ |
377 |
|
|
Exercisable |
|
100 |
|
|
10.13 |
|
1.9 |
|
377 |
|
||
|
|
|
|
|
|
|
|
|
|
|
|
||
|
2008: |
|
|
|
|
|
|
|
|
|
|
||
|
Beginning balance |
|
100 |
|
|
|
|
|
|
|
|
||
|
Exercised |
|
49 |
|
|
$ |
10.13 |
|
|
|
|
|
|
|
Outstanding at December 31 |
|
51 |
|
|
10.13 |
|
0.9 |
|
$ |
369 |
|
|
|
Exercisable |
|
51 |
|
|
10.13 |
|
0.9 |
|
369 |
|
||
|
|
|
|
|
|
|
|
|
|
|
|
||
|
2009: |
|
|
|
|
|
|
|
|
|
|
||
|
Beginning balance |
|
51 |
|
|
$ |
10.13 |
|
|
|
|
|
|
|
Exercised |
|
51 |
|
|
10.13 |
|
|
|
|
|
||
|
Outstanding at December 31 |
|
0 |
|
|
0.00 |
|
0.0 |
|
$ |
0 |
|
|
|
Exercisable |
|
0 |
|
|
0.00 |
|
0.0 |
|
0 |
|
||
The following table summarizes information about stock options outstanding at December 31, 2009 (shares in thousands):
|
|
|
Options Outstanding |
|
Options Exercisable |
|
|||||||||
|
Range of |
|
Number |
|
Weighted |
|
Weighted |
|
Number |
|
Weighted |
|
|||
|
|
|
|
|
|
|
|
|
|
|
|
|
|||
|
$2.07–$9.74 |
|
940 |
|
2.2 |
|
$ |
7.35 |
|
940 |
|
|
$ |
7.35 |
|
|
$10.47–$12.14 |
|
991 |
|
4.7 |
|
11.75 |
|
751 |
|
|
11.63 |
|
||
|
$13.22–$15.03 |
|
1,127 |
|
5.1 |
|
14.49 |
|
731 |
|
|
14.54 |
|
||
|
$15.12–$21.67 |
|
573 |
|
4.9 |
|
20.01 |
|
432 |
|
|
20.90 |
|
||
|
|
|
|
|
|
|
|
|
|
|
|
|
|
||
|
$2.07–$21.67 |
|
3,631 |
|
|
|
|
|
2,854 |
|
|
|
|
||
11. SEGMENT REPORTING AND FOREIGN OPERATIONS
We operate primarily as one segment, sales of disposable medical devices used for cardiology and radiology procedures (two other segments do not meet the quantitative thresholds for reporting separate information). We report sales in five product categories. Sales relating to these product categories for the years ended December 31, 2009, 2008 and 2007 consisted of the following (in thousands):
|
|
|
Year Ended |
|
||||||||||||||||
|
|
|
December 31, |
|
||||||||||||||||
|
|
|
% Change |
|
2009 |
|
% Change |
|
2008 |
|
% Change |
|
2007 |
|
||||||
|
Stand-alone devices |
|
12 |
% |
|
$ |
76,075 |
|
9 |
% |
|
$ |
68,005 |
|
12 |
% |
|
$ |
62,417 |
|
|
Custom kits & procedure trays |
|
12 |
% |
|
74,541 |
|
11 |
% |
|
66,584 |
|
7 |
% |
|
60,013 |
|
|||
|
Inflation devices |
|
(1 |
)% |
|
61,058 |
|
3 |
% |
|
61,656 |
|
5 |
% |
|
59,595 |
|
|||
|
Catheters |
|
23 |
% |
|
38,126 |
|
20 |
% |
|
30,898 |
|
18 |
% |
|
25,743 |
|
|||
|
Gastroenterology devices |
|
|
|
|
7,662 |
|
|
|
|
|
|
|
|
|
|
|
|||
|
Total |
|
13 |
% |
|
$ |
257,462 |
|
9 |
% |
|
$ |
227,143 |
|
9 |
% |
|
$ |
207,768 |
|
During the years ended December 31, 2009, 2008 and 2007, we had foreign sales of approximately $86.4 million, $72.5 million and $64.9 million or approximately 34%, 32% and 31%, respectively, of total sales, primarily in China, Japan, Germany, France and the United Kingdom. Foreign sales are attributed based on location of the customer receiving the product.
Our long-lived assets by geographic area consisted of the following (in thousands):
|
|
|
2009 |
|
2008 |
|
||
|
|
|
|
|
|
|
||
|
United States |
|
$ |
89,428 |
|
$ |
78,920 |
|
|
Ireland |
|
17,148 |
|
16,584 |
|
||
|
Other foreign countries |
|
8,070 |
|
8,435 |
|
||
|
|
|
|
|
|
|
||
|
Total |
|
$ |
114,646 |
|
$ |
103,939 |
|
12. ROYALTY AGREEMENTS
Pursuant to a 1992 settlement agreement, we entered into a license agreement with another medical product manufacturer (the “Licensor”), whereby the Licensor granted to us a nonexclusive right and license to manufacture and sell products which are subject to the patents issued to the Licensor. The license agreement terminated in August 2008 upon the expiration of the last related patent. For the rights and license granted under the agreement, we paid the Licensor a nonrefundable prepaid royalty in the amount of $600,000. In addition to the prepaid royalty, we agreed to pay the Licensor a continuing royalty of 5.75% of sales (which will not exceed $450,000 for any calendar year) made in the United States, of products covered by the license agreement. Royalties of $450,000 were paid or accrued in each of the years ended December 31, 2008 and 2007.
During 2006, in connection with the purchase of the Futura® safety scalpel product line from Hypoguard USA, Inc. we acquired certain rights under a license agreement with Innovative Surgical Technology, Inc. (“IST”) whereby IST granted to us an exclusive worldwide license to manufacture and sell products which are subject to the patents issued to IST. For the rights and license granted under the agreement, we agreed to pay the IST a royalty of 4% of net sales, with annual minimum royalty payments of $144,000 for calendar years 2007 through 2014 and $108,000 for 2015. During the years ended December 31, 2008 and 2007, we paid or accrued a royalty of $108,000 and $144,000, respectively, under this license agreement. During January 2009, we negotiated to purchase from IST the patents related to this product for $432,000. The patent will amortize over the remaining life of the patents, which is approximately five and one-half years. In connection with the purchase of the patents, IST forgave royalties payable for the three months ended December 31, 2008 in the amount of $36,000.
During 2007, in connection with the purchase of the ProGuide™ chronic dialysis catheter from Datacope, we entered into a running royalty agreement as partial consideration of the assignment of acquired intellectual property to us. Under this agreement, we agreed to pay Datascope a royalty of 5% of net sales, with annual minimum royalty payments of $50,000 for calendar years 2008 through 2013. During each of the years ended December 31, 2009, 2008 and 2007, we paid or accrued a royalty of $50,000 under this agreement.
13. EMPLOYEE BENEFIT PLANS
We have a contributory 401(k) savings and profit sharing plan (the “Plan”) covering all U.S. full-time employees who are at least 18 years of age. The Plan has a 90-day minimum service requirement. We may contribute, at our discretion, matching contributions based on the employees’ compensation. Contributions we made to the Plan for the years ended December 31, 2009, 2008 and 2007, totaled approximately $833,000, $0 and $510,000, respectively. We have defined contribution plans covering some of our foreign employees. We contribute between three and 36% of the employee’s compensation for certain foreign non-management employees, between ten and 36% of the employee’s compensation for certain foreign management employees and 48% of compensation for a foreign executive employee. Contributions made to these plans for the years ended December 31, 2009, 2008 and 2007, totaled approximately $550,000, $541,000 and $635,000, respectively.
14. QUARTERLY RESULTS OF OPERATIONS (UNAUDITED)
Quarterly data for the years ended December 31, 2009, 2008 and 2007, consisted of the following (in thousands except per share amounts):
|
|
|
Quarter Ended |
|
||||||||||
|
|
|
March 31 |
|
June 30 |
|
September 30 |
|
December 31 |
|
||||
|
|
|
|
|
|
|
|
|
|
|
||||
|
2009 |
|
|
|
|
|
|
|
|
|
||||
|
|
|
|
|
|
|
|
|
|
|
||||
|
Net sales |
|
$ |
58,371 |
|
$ |
64,837 |
|
$ |
66,759 |
|
$ |
67,495 |
|
|
Gross profit |
|
24,808 |
|
28,143 |
|
28,535 |
|
27,316 |
|
||||
|
Income from operations |
|
7,900 |
|
8,963 |
|
8,463 |
|
7,521 |
|
||||
|
Income tax expense |
|
2,537 |
|
3,144 |
|
2,349 |
|
2,534 |
|
||||
|
Net income |
|
5,537 |
|
5,841 |
|
6,085 |
|
5,067 |
|
||||
|
Basic earnings per common share |
|
0.20 |
|
0.21 |
|
0.22 |
|
0.18 |
|
||||
|
Diluted earnings per common share |
|
0.19 |
|
0.21 |
|
0.21 |
|
0.18 |
|
||||
|
|
|
|
|
|
|
|
|
|
|
||||
|
2008 |
|
|
|
|
|
|
|
|
|
||||
|
|
|
|
|
|
|
|
|
|
|
||||
|
Net sales |
|
$ |
53,553 |
|
$ |
57,441 |
|
$ |
58,153 |
|
$ |
57,996 |
|
|
Gross profit |
|
21,592 |
|
24,502 |
|
23,684 |
|
23,493 |
|
||||
|
Income from operations |
|
6,604 |
|
9,009 |
|
7,169 |
|
8,202 |
|
||||
|
Income tax expense |
|
2,432 |
|
3,337 |
|
2,198 |
|
3,151 |
|
||||
|
Net income |
|
4,317 |
|
5,818 |
|
5,200 |
|
5,392 |
|
||||
|
Basic earnings per common share |
|
0.16 |
|
0.21 |
|
0.19 |
|
0.19 |
|
||||
|
Diluted earnings per common share |
|
0.15 |
|
0.21 |
|
0.18 |
|
0.19 |
|
||||
|
|
|
|
|
|
|
|
|
|
|
||||
|
2007 |
|
|
|
|
|
|
|
|
|
||||
|
|
|
|
|
|
|
|
|
|
|
||||
|
Net sales |
|
$ |
51,030 |
|
$ |
51,811 |
|
$ |
50,584 |
|
$ |
54,343 |
|
|
Gross profit |
|
18,858 |
|
19,536 |
|
19,783 |
|
21,614 |
|
||||
|
Income from operations |
|
4,479 |
|
5,471 |
|
6,086 |
|
6,934 |
|
||||
|
Income tax expense |
|
1,598 |
|
1,937 |
|
1,891 |
|
2,385 |
|
||||
|
Net income |
|
2,969 |
|
3,596 |
|
4,295 |
|
4,728 |
|
||||
|
Basic earnings per common share |
|
0.11 |
|
0.13 |
|
0.16 |
|
0.17 |
|
||||
|
Diluted earnings per common share |
|
0.10 |
|
0.13 |
|
0.15 |
|
0.17 |
|
||||
15. FAIR VALUE MEASUREMENTS
Our financial assets and liabilities carried at fair value measured on a recurring basis as of December 31, 2009 and 2008 consisted of the following (in thousands):
|
|
|
|
|
Fair Value Measurements Using |
|
||||||||
|
|
|
Total Fair |
|
Quoted prices in |
|
Significant other |
|
Significant |
|
||||
|
|
|
Value at |
|
active markets |
|
observable inputs |
|
Unobservable inputs |
|
||||
|
Description |
|
December 31, 2009 |
|
(Level 1) |
|
(Level 2) |
|
(Level 3) |
|
||||
|
|
|
|
|
|
|
|
|
|
|
||||
|
Deferred compensation investments (2) |
|
$ |
3,343 |
|
$ |
— |
|
$ |
3,343 |
|
$ |
— |
|
|
|
|
|
|
Fair Value Measurements Using |
|
||||||||
|
|
|
Total Fair |
|
Quoted prices in |
|
Significant other |
|
Significant |
|
||||
|
|
|
Value at |
|
active markets |
|
observable inputs |
|
Unobservable inputs |
|
||||
|
Description |
|
December 31, 2008 |
|
(Level 1) |
|
(Level 2) |
|
(Level 3) |
|
||||
|
|
|
|
|
|
|
|
|
|
|
||||
|
Commercial paper (1) |
|
$ |
19,995 |
|
$ |
— |
|
$ |
19,995 |
|
$ |
— |
|
|
Deferred compensation investments (2) |
|
2,325 |
|
274 |
|
2,051 |
|
|
|
||||
(1) The fair value of the commercial paper is based on a fixed-income approach over a straight-line basis. In the event a transaction is observed on the same security in the market place, the price is adjusted to reflect the quoted market price.
(2) The deferred compensation investments are held in a Rabbi trust under an insurance-based deferred compensation plan. The investments of the Rabbi trust are valued based upon unit values multiplied by the number of units held. The unit value is based upon the investment’s net asset value adjusted for some administrative fees.
During the years ended December 31, 2009, 2008 and 2007, we had write-offs of approximately $154,000, $164,000, $245,000, respectively, related to the measurement of non-financial assets at fair value on a nonrecurring basis subsequent to their initial recognition.
The carrying amount of cash and cash equivalents, receivables and trade payables approximates fair value.
SUPPLEMENTARY FINANCIAL DATA
The supplementary financial information required by Item 302 of Regulation S-K is contained in Note 14 to our consolidated financial statements set forth above.
Item 9. Changes in and Disagreements with Accountants on Accounting and Financial Disclosure.
None.
Item 9A. Controls and Procedures.
DISCLOSURE CONTROLS AND PROCEDURES
Under the supervision and with the participation of our management, including our principal executive officer and principal financial officer, we conducted an evaluation of our disclosure controls and procedures, as such term is defined under Rule 13a-15(e) promulgated under the Securities Exchange Act of 1934 as of December 31, 2009. Based on this evaluation, our principal executive officer and principal financial officer concluded that our disclosure controls and procedures are effective in ensuring that information we are required to disclose in the reports we file or submit under the Exchange Act is recorded, processed, summarized and reported, within the time periods specified in the SEC’s rules and forms.
INTERNAL CONTROL OVER FINANCIAL REPORTING
Our management is responsible for establishing and maintaining adequate internal control over financial reporting as defined in Rules 13a-15(f) and 15d-15(f) under the Securities Exchange Act of 1934, as amended. Our internal control over financial reporting is a process designed to provide reasonable assurance regarding the reliability of financial reporting and the preparation of financial statements for external purposes in accordance with accounting principles generally accepted in the United States of America. Internal control over financial reporting includes those written policies and procedures that:
· Pertain to the maintenance of records that, in reasonable detail, accurately and fairly reflect the transactions and dispositions of the assets of Merit
· Provide reasonable assurance that transactions are recorded as necessary to permit preparation of financial statements in accordance with generally accepted accounting principles in the United States of America
· Provide reasonable assurance that our receipts and expenditures are being made only in accordance with authorization of our management and directors
· Provide reasonable assurance regarding prevention or timely detection of the unauthorized acquisition, use or disposition of assets that could have a material effect on the consolidated financial statements
Internal control over financial reporting includes the controls themselves, monitoring and internal auditing practices and actions taken to correct deficiencies as identified. Because of its inherent limitations, internal control over financial reporting may not prevent or detect misstatements. Also, projections of any evaluation of effectiveness to future periods are subject to the risk that controls may become inadequate because of changes in conditions, or that the degree of compliance with the policies or procedures may deteriorate.
Our management assessed the effectiveness of our internal control over financial reporting as of December 31, 2009. In making this assessment, our management used the criteria set forth by the Committee of Sponsoring Organizations of the Treadway Commission (COSO) in Internal Control-Integrated Framework. Based on those criteria
and management’s assessment, we believe that, as of December 31, 2009, our internal control over financial reporting is effective.
CHANGES IN INTERNAL CONTROL OVER FINANCIAL REPORTING
During the fiscal quarter ended December 31, 2009, there has been no change in internal control over financial reporting that has materially affected, or is reasonably likely to materially affect our internal control over financial reporting.
Our independent registered public accountants have also issued an audit report on our internal control over financial reporting. This report appears below.
REPORT OF INDEPENDENT REGISTERED PUBLIC ACCOUNTING FIRM
To the Board of Directors and Shareholders of Merit Medical Systems, Inc.
We have audited the internal control over financial reporting of Merit Medical Systems, Inc. and subsidiaries (the “Company”) as of December 31, 2009, based on criteria established in Internal Control — Integrated Framework issued by the Committee of Sponsoring Organizations of the Treadway Commission. The Company’s management is responsible for maintaining effective internal control over financial reporting and for its assessment of the effectiveness of internal control over financial reporting, included in the accompanying Management’s Report on Internal Control over Financial Reporting. Our responsibility is to express an opinion on the Company’s internal control over financial reporting based on our audit.
We conducted our audit in accordance with the standards of the Public Company Accounting Oversight Board (United States). Those standards require that we plan and perform the audit to obtain reasonable assurance about whether effective internal control over financial reporting was maintained in all material respects. Our audit included obtaining an understanding of internal control over financial reporting, assessing the risk that a material weakness exists, testing and evaluating the design and operating effectiveness of internal control based on the assessed risk and performing such other procedures as we considered necessary in the circumstances. We believe that our audit provides a reasonable basis for our opinion.
A company’s internal control over financial reporting is a process designed by, or under the supervision of, the company’s principal executive and principal financial officers, or persons performing similar functions and effected by the company’s board of directors, management and other personnel to provide reasonable assurance regarding the reliability of financial reporting and the preparation of financial statements for external purposes in accordance with generally accepted accounting principles. A company’s internal control over financial reporting includes those policies and procedures that (1) pertain to the maintenance of records that, in reasonable detail, accurately and fairly reflect the transactions and dispositions of the assets of the company; (2) provide reasonable assurance that transactions are recorded as necessary to permit preparation of financial statements in accordance with generally accepted accounting principles and that receipts and expenditures of the company are being made only in accordance with authorizations of management and directors of the company; and (3) provide reasonable assurance regarding prevention or timely detection of unauthorized acquisition, use, or disposition of the company’s assets that could have a material effect on the financial statements.
Because of the inherent limitations of internal control over financial reporting, including the possibility of collusion or improper management override of controls, material misstatements due to error or fraud may not be prevented or detected on a timely basis. Also, projections of any evaluation of the effectiveness of the internal control over financial reporting to future periods are subject to the risk that the controls may become inadequate because of changes in conditions, or that the degree of compliance with the policies or procedures may deteriorate.
In our opinion, the Company maintained, in all material respects, effective internal control over financial reporting as of December 31, 2009, based on the criteria established in Internal Control — Integrated Framework issued by the Committee of Sponsoring Organizations of the Treadway Commission.
We have also audited, in accordance with the standards of the Public Company Accounting Oversight Board (United States), the consolidated financial statements and financial statement schedule as of and for the year ended December 31, 2009, of the Company and our report dated March 10, 2010 expressed an unqualified opinion on those financial statements and financial statement schedule and included an explanatory paragraph regarding the adoption of new accounting guidance.
/s/ DELOITTE & TOUCHE LLP
Salt Lake City,
Utah
March 10, 2010
None.
These items are incorporated by reference to our definitive proxy statement relating to our Annual Meeting of Shareholders scheduled for May 26, 2010. We anticipate that our definitive proxy statement will be filed with the SEC not later than 120 days after December 31, 2009, pursuant to Regulation 14A of the Securities Exchange Act of 1934, as amended.
Item 15. Exhibits and Financial Statement Schedules.
(a) Documents filed as part of this Report:
(1) Financial Statements. The following consolidated financial statements and the notes thereto, and the Reports of Independent Registered Public Accounting Firm are incorporated by reference as provided in Item 8 and Item 9A of this report:
|
Report of Independent Registered Public Accounting Firm — Internal Control |
|
|
|
Report of Independent Registered Public Accounting Firm — Financial Statements |
|
|
|
Consolidated Balance Sheets as of December 31, 2009 and 2008 |
|
|
|
Consolidated Statements of Income for the Years Ended December 31, 2009, 2008 and 2007 |
|
|
|
Consolidated Statements of Stockholders’ Equity for the Years Ended December 31, 2009, 2008 and 2007 |
|
|
|
Consolidated Statements of Cash Flows for the Years Ended December 31, 2009, 2008 and 2007 |
|
|
|
Notes to Consolidated Financial Statements |
(2) Financial Statement Schedule.
· Schedule II - Valuation and qualifying accounts
|
YEARS ENDED DECEMBER 31, 2009, 2008 AND 2007 |
|||||||||||||
|
(In Thousands) |
|||||||||||||
|
|
|
|
|
|
|
|
|
|
|
||||
|
|
|
|
|
Additions |
|
|
|
|
|
||||
|
|
|
Balance at |
|
Charged to |
|
|
|
Balance at |
|
||||
|
|
|
Beginning |
|
Costs |
|
|
|
End of |
|
||||
|
Description |
|
of Year |
|
Expenses (a) |
|
Deduction (b) |
|
Year |
|
||||
|
|
|
|
|
|
|
|
|
|
|
||||
|
ALLOWANCE FOR UNCOLLECTIBLE ACCOUNTS: |
|
|
|
|
|
|
|
|
|
||||
|
|
|
|
|
|
|
|
|
|
|
||||
|
2007 |
|
$ |
(560 |
) |
$ |
(19 |
) |
$ |
82 |
|
$ |
(497 |
) |
|
2008 |
|
(497 |
) |
(139 |
) |
131 |
|
|
(505 |
) |
|||
|
2009 |
|
(505 |
) |
(214 |
) |
178 |
|
|
(541 |
) |
|||
|
(a) |
We record a bad debt provision based upon historical experience and a review of individual customer balances. |
|
(b) |
When an individual customer balance becomes impaired and is deemed uncollectible a deduction is made against the allowance for uncollectible accounts. |
|
|
|
|
|
Additions |
|
|
|
|
|
||||
|
|
|
Balance at |
|
Charged to |
|
|
|
Balance at |
|
||||
|
|
|
Beginning |
|
Costs |
|
|
|
End of |
|
||||
|
Description |
|
of Year |
|
Expenses (c) |
|
Deductions (d) |
|
Year |
|
||||
|
|
|
|
|
|
|
|
|
|
|
||||
|
RESERVE FOR INVENTORY OBSOLESCENCE: |
|
|
|
|
|
|
|
|
|
||||
|
|
|
|
|
|
|
|
|
|
|
||||
|
2007 |
|
$ |
(2,105 |
) |
$ |
(1,416 |
) |
$ |
1,186 |
|
$ |
(2,335 |
) |
|
2008 |
|
(2,335 |
) |
(1,096 |
) |
1,170 |
|
|
(2,261 |
) |
|||
|
2009 |
|
(2,261 |
) |
(1,469 |
) |
1,297 |
|
|
(2,433 |
) |
|||
|
(c) |
We write down our inventory for estimated obsolescence for unmarketable and/or slow moving products that may expire prior to being sold. |
|
(d) |
When a previously reserved for inventory item is either disposed of or sold we record a deduction to its reserve for obsolescence inventory. |
All other schedules have been omitted because they are not required, not applicable, or the information is otherwise set forth in the financial statements or notes thereto.
(b) None
(b) Exhibits:
The following exhibits required by Item 601 of Regulation S—K are filed herewith or have been filed previously with the SEC as indicated below:
|
|
|
Description |
|
Exhibit No. |
|
|
|
|
|
|
|
3.1 |
|
Articles of Incorporation as amended and restated* |
|
[Form 10-Q filed August 14, 1996, Exhibit No. 1] |
|
|
|
|
|
|
|
3.2 |
|
Bylaws* |
|
[Form S—18 filed October 19, 1989, Exhibit No. 2] |
|
|
|
|
|
|
|
3.3 |
|
Amended and Restated Bylaws |
|
[Form 10-Q filed November 8, 2007, Exhibit No. 3.3] |
|
|
|
|
|
|
|
4 |
|
Specimen Certificate of the Common Stock* |
|
[Form S—18 filed October 19, 1989, Exhibit No. 10] |
|
|
|
|
|
|
|
4.3 |
|
Articles of Amendment of the Articles of Incorporation dated May 14, 1993* |
|
[Form S-3 filed February 14, 2005, Exhibit 4.3] |
|
|
|
|
|
|
|
4.4 |
|
Articles of Amendment to Articles of Incorporation dated June 6, 1996* |
|
[Form S-3 filed February 14, 2005, Exhibit 4.4] |
|
|
|
|
|
|
|
4.5 |
|
Articles of Amendment to Articles of Incorporation dated June 12, 1997* |
|
[Form S-3 filed February 14, 2005, Exhibit 4.5] |
|
|
|
|
|
|
|
4.7 |
|
Articles of Amendment to the Articles of Incorporation dated May 22, 2003* |
|
[Form S-3 filed February 14, 2005, Exhibit 4.7] |
|
|
|
|
|
|
|
4.8 |
|
Articles of Amendment to the Articles of Incorporation dated May 23, 2008* |
|
[Form 8-K filed May 28, 2008, Exhibit 3.1] |
|
|
|
|
|
|
|
10.1 |
|
Merit Medical Systems, Inc. Long Term Incentive Plan (as amended and restated) dated March 25, 1996*† |
|
[Form 10-Q filed August 14, 1996, Exhibit No. 2] |
|
|
|
|
|
|
|
10.2 |
|
Merit Medical Systems, Inc. 401(k) Profit Sharing Plan (as amended effective January 1, 1991*† |
|
[Form S—1 filed February 14, 1992, Exhibit No. 8] |
|
|
|
|
|
|
|
10.3 |
|
License Agreement, dated April 8, 1992 with Utah Medical Products, Inc.* |
|
[Form S—1 filed February 14, 1992, Exhibit No. 5] |
|
|
|
|
|
|
|
10.4 |
|
Lease Agreement dated as of June 8, 1993 for office and manufacturing facility* |
|
[Form 10—K for year ended December 31, 1994, Exhibit No. 10.4] |
|
|
|
|
|
|
|
10.12 |
|
Amended and Restated Deferred Compensation Plan*† |
|
[Form 10-K for year ended December 31, 2003, Exhibit No. 10.12] |
|
|
|
|
|
|
|
10.13 |
|
Purchase Agreement dated November 17, 2004 between Merit Medical Systems, Inc. and MedSource Packaging Concepts LLC* |
|
[Form 10-K for year ended December 31, 2004, Exhibit No. 10.13] |
|
|
|
|
|
|
|
10.17 |
|
Unsecured Loan Agreement with Bank of America, N.A.* |
|
[Form 8-K filed December 7, 2006, Exhibit 10.1] |
|
|
|
|
|
|
|
10.18 |
|
Seventh Amendment to the First Restatement of the Merit Medical Systems, Inc. 401(k) Profit Sharing Plan*† |
|
[Form 10-K for year ended December 31, 2006, Exhibit No. 10.18] |
|
|
|
|
|
|
|
10.19 |
|
Stock Purchase Agreement by and between Merit Medical Systems, Inc. and Sheen Man Co. LTD, dated April 1, 2007* |
|
[Form 10-Q filed May 9, 2007, Exhibit No. 10.19] |
|
10.20 |
|
Eighth Amendment to the First Restatement of the Merit Medical Systems, Inc. 401(k) Profit Sharing Plan*† |
|
[Form 10-K for year ended December 31, 2007, Exhibit No. 10.20] |
|
|
|
|
|
|
|
10.21 |
|
Ninth Amendment to the First Restatement of the Merit Medical Systems, Inc. 401(k) Profit Sharing Plan*† |
|
[Form 10-K for year ended December 31, 2007, Exhibit No. 10.21] |
|
|
|
|
|
|
|
10.22 |
|
Tenth Amendment to the First Restatement of the Merit Medical Systems, Inc. 401(k) Profit Sharing Plan*† |
|
[Form 10-K for year ended December 31, 2007, Exhibit No. 10.22] |
|
|
|
|
|
|
|
10.23 |
|
Merit Medical Systems, Inc. Amended and Restated Deferred Compensation Plan, effective January 1, 2008*† |
|
[Form 8-K filed December 18, 2008, Exhibit 10.1] |
|
|
|
|
|
|
|
10.24 |
|
Employment Agreement, made on December 31, 2008, by and between Merit Medical Systems, Inc. and Fred P. Lampropoulos*† |
|
[Form 8-K filed January 7, 2009, Exhibit 10.1] |
|
|
|
|
|
|
|
10.25 |
|
Employment Agreement, made on December 31, 2008, by and between Merit Medical Systems, Inc. and Kent W. Stanger*† |
|
[Form 8-K filed January 7, 2009, Exhibit 10.2] |
|
|
|
|
|
|
|
10.26 |
|
Employment Agreement, made on December 31, 2008, by and between Merit Medical Systems, Inc. and Martin R. Stephens*† |
|
[Form 8-K filed January 7, 2009, Exhibit 10.3] |
|
|
|
|
|
|
|
10.27 |
|
Employment Agreement, made on December 31, 2008, by and between Merit Medical Systems, Inc. and Arlin D. Nelson*† |
|
[Form 8-K filed January 7, 2009, Exhibit 10.4] |
|
|
|
|
|
|
|
10.28 |
|
Employment Agreement, made on December 31, 2008, by and between Merit Medical Systems, Inc. and Rashelle Perry*† |
|
[Form 8-K filed January 7, 2009, Exhibit 10.5] |
|
|
|
|
|
|
|
10.29 |
|
Eleventh Amendment to the First Restatement of the Merit Medical Systems, Inc. 401(k) Profit Sharing Plan*† |
|
[Form 10-K for year ended December 31, 2008, Exhibit No. 10.29] |
|
|
|
|
|
|
|
10.30 |
|
Twelfth Amendment to the First Restatement of the Merit Medical Systems, Inc. 401(k) Profit Sharing Plan*† |
|
[Form 10-K for year ended December 31, 2008, Exhibit No. 10.30] |
|
|
|
|
|
|
|
10.31 |
|
Second Amendment to the Merit Medical Systems, Inc. 2006 Long-Term Incentive Plan*† |
|
[Form 8-K filed May 27, 2009, Exhibit 10.1] |
|
|
|
|
|
|
|
10.32 |
|
Second Restatement of the Merit Medical Systems, Inc. 401(k) Profit Sharing Plan*† |
|
[Form 8-K filed January 7, 2010, Exhibit 10.1] |
|
|
|
|
|
|
|
21 |
|
Subsidiaries of Merit Medical Systems, Inc |
|
Filed herewith |
|
|
|
|
|
|
|
23.1 |
|
Consent of Independent Registered Public Accounting Firm |
|
Filed herewith |
|
|
|
|
|
|
|
31.1 |
|
Certification of Chief Executive Officer |
|
Filed herewith |
|
|
|
|
|
|
|
31.2 |
|
Certification of Chief Financial Officer |
|
Filed herewith |
|
|
|
|
|
|
|
32.1 |
|
Certification of Chief Executive Officer |
|
Filed herewith |
|
|
|
|
|
|
|
32.2 |
|
Certification of Chief Financial Officer |
|
Filed herewith |
* These exhibits are incorporated herein by reference.
† Indicates management contract or compensatory plan or arrangement.
(c) Schedules:
None
Pursuant to the requirements of Section 13 or 15(d) of the Securities Exchange Act of 1934, the Registrant has duly caused this Annual Report on Form 10-K to be signed on its behalf by the undersigned, thereunto duly authorized, on March 10, 2010.
|
|
MERIT MEDICAL SYSTEMS, INC. |
|
|
|
|
|
|
|
|
|
|
|
By: |
/s/ FRED P. LAMPROPOULOS |
|
|
|
Fred P. Lampropoulos, President and |
|
|
|
Chief Executive Officer |
ADDITIONAL SIGNATURE AND POWER OF ATTORNEY
Pursuant to the requirements of the Securities Exchange Act of 1934, this report has been signed below by the following persons on behalf of the registrant and in the capacities indicated on March 10, 2010. In addition, each person whose signature to this report appears below hereby constitutes and appoints Fred P. Lampropoulos and Kent W. Stanger, and each of them, as his true and lawful attorney-in-fact and agent, with full power of substitution, to sign on his behalf individually and in the capacity stated below and to perform any acts necessary to be done in order to file all amendments and post-effective amendments to this report, and any and all instruments or documents filed as part of or in connection with this report or the amendments thereto and each of the undersigned does hereby ratify and confirm all that said attorney-in-fact and agent, or his substitutes, shall do or cause to be done by virtue hereof.
|
Signature |
|
Capacity in Which Signed |
|
|
|
|
|
/s/: FRED P. LAMPROPOULOS |
|
President, Chief Executive Officer and Director |
|
Fred P. Lampropoulos |
|
(Principal executive officer) |
|
|
|
|
|
/s/: KENT W. STANGER |
|
Chief Financial Officer, Secretary, Treasurer and Director (Principal financial and accounting officer) |
|
Kent W. Stanger |
|
|
|
|
|
|
|
/s/: RICHARD W. EDELMAN |
|
Director |
|
Richard W. Edelman |
|
|
|
|
|
|
|
/s/: REX C. BEAN |
|
Director |
|
Rex C. Bean |
|
|
|
|
|
|
|
/s/: JAMES J. ELLIS |
|
Director |
|
James J. Ellis |
|
|
|
|
|
|
|
/s/: MICHAEL E. STILLABOWER |
|
Director |
|
Michael E. Stillabower |
|
|
|
|
|
|
|
/s/: FRANKLIN J. MILLER |
|
Director |
|
Franklin J. Miller |
|
|