Attached files
| file | filename |
|---|---|
| EX-99.1 - EX-99.1 - Phillips Edison & Company, Inc. | pecoearningsreleaseq32.htm |
| 8-K - 8-K - Phillips Edison & Company, Inc. | cik0001476204-20201109.htm |

Third Quarter 2020 Results Presentation Thursday, November 12, 2020
AGENDA PREPARED REMARKS JEFF EDISON - Chairman and CEO Portfolio Overview COVID-19 Update Q3 2020 Highlights JOHN CAULFIELD - CFO Financial Results Balance Sheet JEFF EDISON - Chairman and CEO Declaration of December 2020 Distribution Tender Offer Outlook QUESTION AND ANSWER SESSION WWW.PHILLIPSEDISON.COM/INVESTORS PHILLIPS EDISON & COMPANY | 2

FORWARD-LOOKING STATEMENT DISCLOSURE Certain statements contained in this presentation for Phillips Edison & Company, Inc. (“we,” the “Company,” “our,” or “us”) other than historical facts may be considered forward-looking statements within the meaning of Section 27A of the Securities Act of 1933, as amended (the “Securities Act”), Section 21E of the Securities Exchange Act of 1934, as amended (the “Exchange Act”), and the Private Securities Litigation Reform Act of 1995 (collectively with the Securities Act and the Exchange Act, the “Acts”). We intend for all such forward-looking statements to be covered by the applicable safe harbor provisions for forward-looking statements contained in the Acts. Such forward-looking statements generally can be identified by the use of forward-looking terminology such as “may,” “will,” “can,” “expect,” “intend,” “anticipate,” “estimate,” “believe,” “continue,” “possible,” “initiatives,” “focus,” “seek,” “objective,” “goal,” “strategy,” “plan,” “potential,” “potentially,” “preparing,” “projected,” “future,” “long-term,” “once,” “should,” “could,” “would,” “might,” “uncertainty,” or other similar words. Readers are cautioned not to place undue reliance on these forward-looking statements, which speak only as of the date this report is filed with the U.S. Securities and Exchange Commission (“SEC”). Such statements include, but are not limited to, (a) statements about our focus, plans, strategies, initiatives, and prospects; (b) statements about the COVID-19 pandemic, including its duration and potential or expected impact on our tenants, our business, and our estimated value per share; (c) statements about our intentions regarding the Tender Offer, a reverse stock split, our distributions, share repurchase program, and dividend reinvestment program; and (d) statements about our future results of operations, capital expenditures, and liquidity. Such statements are subject to known and unknown risks and uncertainties, which could cause actual results to differ materially from those projected or anticipated, including, without limitation: (i) changes in national, regional, or local economic climates; (ii) local market conditions, including an oversupply of space in, or a reduction in demand for, properties similar to those in our portfolio; (iii) vacancies, changes in market rental rates, and the need to periodically repair, renovate, and re-let space; (iv) changes in interest rates and the availability of permanent mortgage financing; (v) competition from other available properties and the attractiveness of properties in our portfolio to our tenants; (vi) the financial stability of tenants, including the ability of tenants to pay rent; (vii) changes in tax, real estate, environmental, and zoning laws; (viii) the concentration of our portfolio in a limited number of industries, geographies, or investments; (ix) the effects of the COVID-19 pandemic, including on the demand for consumer goods and services and levels of consumer confidence in the safety of visiting shopping centers as a result of the COVID-19 pandemic; (x) the measures taken by federal, state, and local government agencies and tenants in response to the COVID-19 pandemic, including mandatory business shutdowns, stay-at-home orders and social distancing guidelines; (xi) the impact of the COVID-19 pandemic on our tenants and their ability to pay rent on time or at all, or to renew their leases and, in the case of non-renewal, our ability to re-lease the space at the same or more favorable terms or at all; (xii) the length and severity of the COVID-19 pandemic in the United States; (xiii) the pace of recovery following the COVID-19 pandemic given the current severe economic contraction and increase in unemployment rates; (xiv) our ability to implement cost containment strategies; (xv) our and our tenants’ ability to obtain loans under government programs; (xvi) our ability to pay down, refinance, restructure, or extend our indebtedness as it becomes due; (xvii) to the extent we were seeking to dispose of properties in the near term, significantly greater uncertainty regarding our ability to do so at attractive prices; (xviii) the impact of the COVID-19 pandemic on our business, results of operations, financial condition, and liquidity; and (xix) supply chain disruptions due to the COVID-19 pandemic. Additional important factors that could cause actual results to differ are described in the filings made from time to time by the Company with the SEC and include the risk factors and other risks and uncertainties described in our 2019 Annual Report on Form 10-K, filed with the SEC on March 12, 2020 and those included in our Quarterly Report on Form 10-Q for the quarter ended September 30, 2020, filed with the SEC on November 9, 2020, in each case as updated from time to time in our periodic and/or current reports filed with the SEC, which are accessible on the SEC’s website at www.sec.gov. Except as required by law, we do not undertake any obligation to update or revise any forward-looking statement, whether as a result of new information, future events, or otherwise. WWW.PHILLIPSEDISON.COM/INVESTORS PHILLIPS EDISON & COMPANY | 3
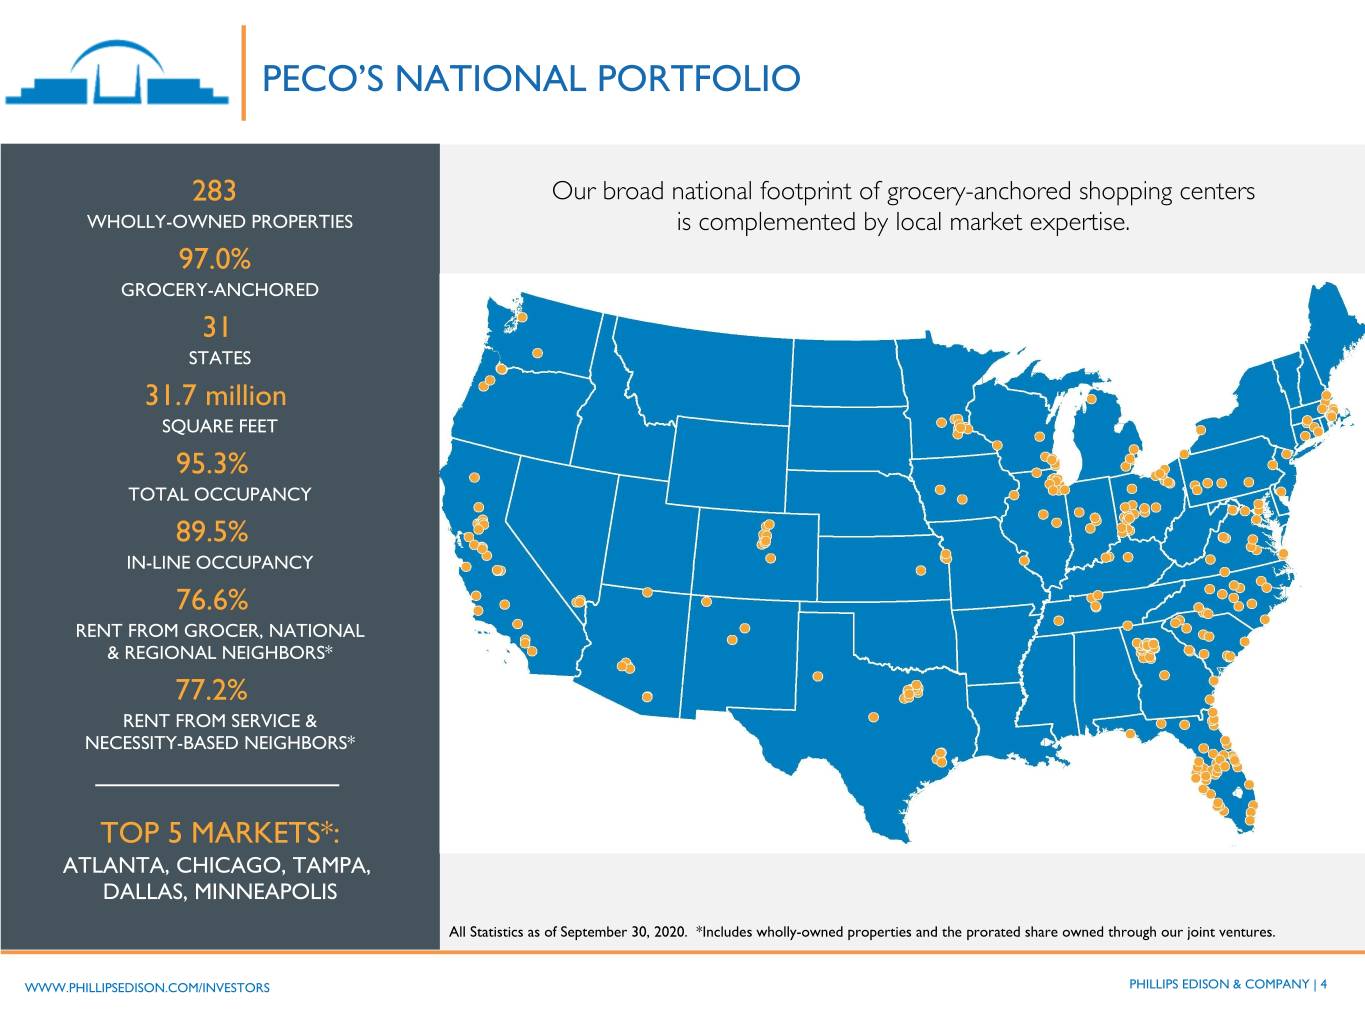
PECO’S NATIONAL PORTFOLIO 283 Our broad national footprint of grocery-anchored shopping centers WHOLLY-OWNED PROPERTIES is complemented by local market expertise. 97.0% GROCERY-ANCHORED 31 STATES 31.7 million SQUARE FEET 95.3% TOTAL OCCUPANCY 89.5% IN-LINE OCCUPANCY 76.6% RENT FROM GROCER, NATIONAL & REGIONAL NEIGHBORS* 77.2% RENT FROM SERVICE & NECESSITY-BASED NEIGHBORS* TOP 5 MARKETS*: ATLANTA, CHICAGO, TAMPA, DALLAS, MINNEAPOLIS All Statistics as of September 30, 2020. *Includes wholly-owned properties and the prorated share owned through our joint ventures. WWW.PHILLIPSEDISON.COM/INVESTORS PHILLIPS EDISON & COMPANY | 4
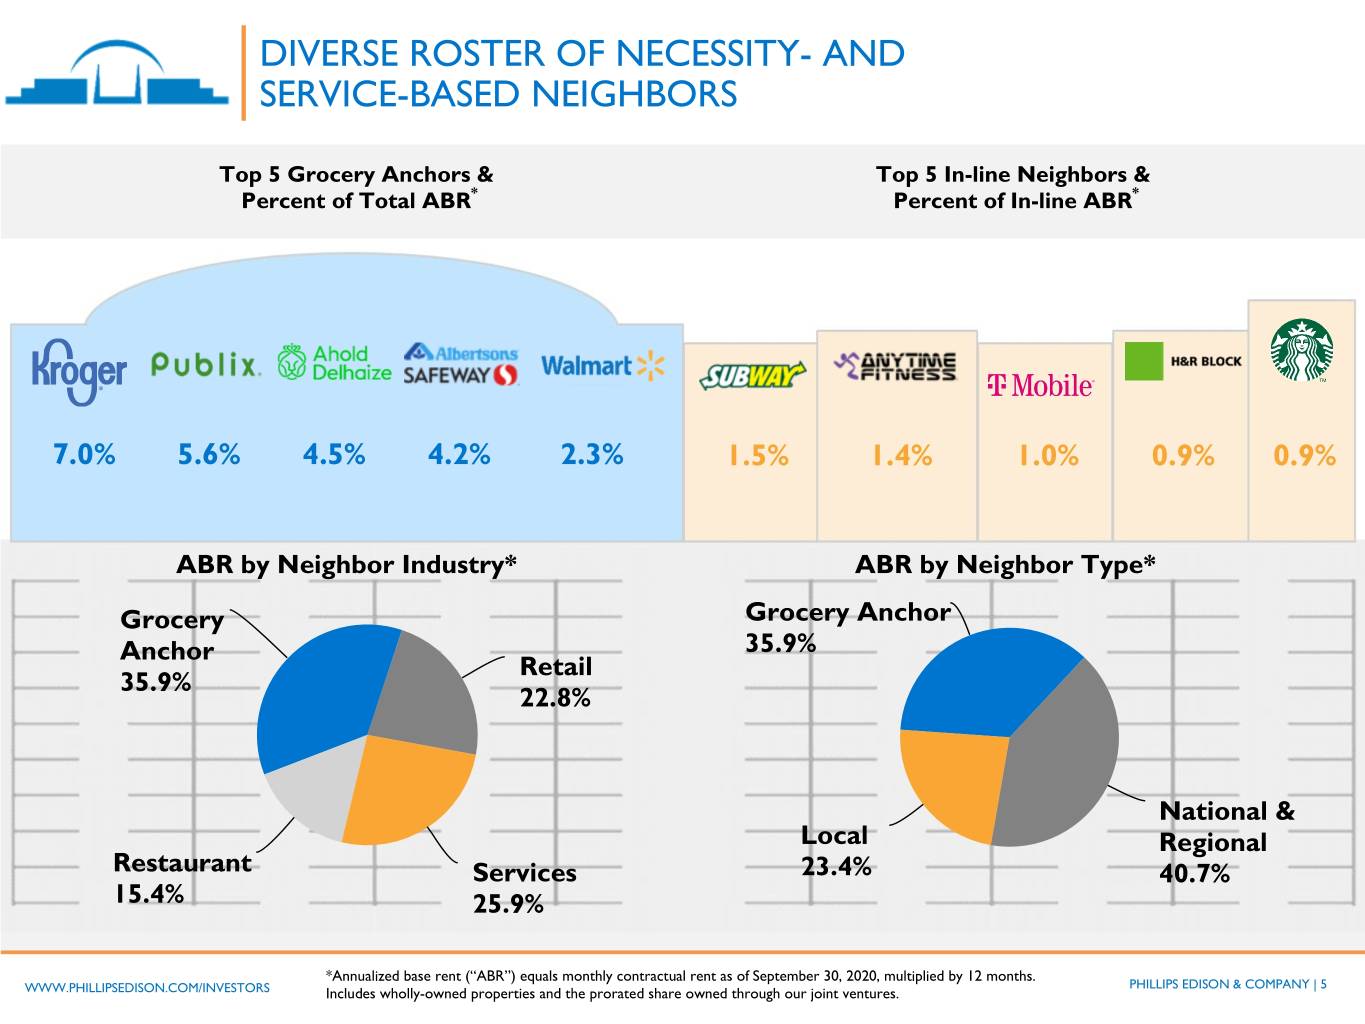
DIVERSE ROSTER OF NECESSITY- AND SERVICE-BASED NEIGHBORS Top 5 Grocery Anchors & Top 5 In-line Neighbors & Percent of Total ABR* Percent of In-line ABR* 7.0% 5.6% 4.5% 4.2% 2.3% 1.5% 1.4% 1.0% 0.9% 0.9% ABR by Neighbor Industry* ABR by Neighbor Type* Grocery Grocery Anchor Anchor 35.9% Retail 35.9% 22.8% National & Local Regional Restaurant Services 23.4% 40.7% 15.4% 25.9% *Annualized base rent (“ABR”) equals monthly contractual rent as of September 30, 2020, multiplied by 12 months. PHILLIPS EDISON & COMPANY | 5 WWW.PHILLIPSEDISON.COM/INVESTORS Includes wholly-owned properties and the prorated share owned through our joint ventures.
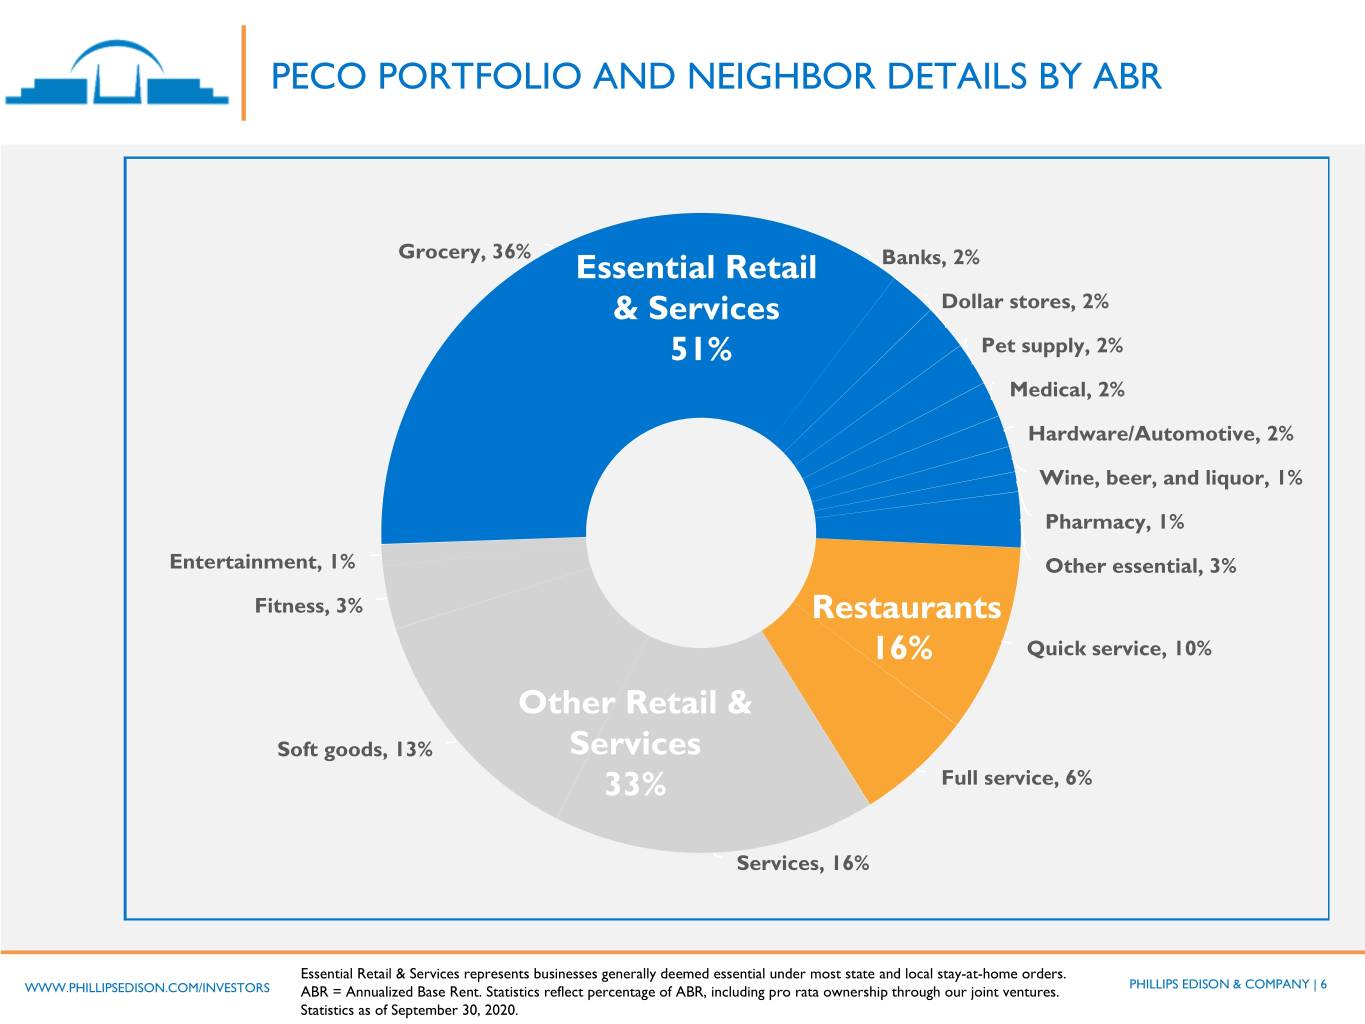
PECO PORTFOLIO AND NEIGHBOR DETAILS BY ABR Grocery, 36% Essential Retail Banks, 2% & Services Dollar stores, 2% 51% Pet supply, 2% Medical, 2% Hardware/Automotive, 2% Wine, beer, and liquor, 1% Pharmacy, 1% Entertainment, 1% Other essential, 3% Fitness, 3% Restaurants 16% Quick service, 10% Other Retail & Soft goods, 13% Services 33% Full service, 6% Services, 16% Essential Retail & Services represents businesses generally deemed essential under most state and local stay-at-home orders. PHILLIPS EDISON & COMPANY | 6 WWW.PHILLIPSEDISON.COM/INVESTORS ABR = Annualized Base Rent. Statistics reflect percentage of ABR, including pro rata ownership through our joint ventures. Statistics as of September 30, 2020.
RESILIENT PORTFOLIO GROCERY PROVES RESILIENCE DURING COVID-19 PANDEMIC • When the pandemic hit, our top priority became preservation of capital as we executed a number of cost-cutting initiatives: ◦ Reductions of compensation for executives and Board of Directors ◦ Delayed capital projects and reduced expenses at the property and corporate levels including a reduction in employee headcount ◦ Temporary suspension of repurchases and monthly distributions • Steps to preserve capital resulted in an increase in retained cash, which supports the principal and net asset value of your investment - this value is not lost • Our Q3 results reflect the resilience of essential and necessity-based retail in the face of the challenges brought on by the ongoing pandemic • Recent spikes in COVID-19, civil unrest, and the current political environment all contribute to the ongoing uncertainty in the economy WWW.PHILLIPSEDISON.COM/INVESTORS PHILLIPS EDISON & COMPANY | 7
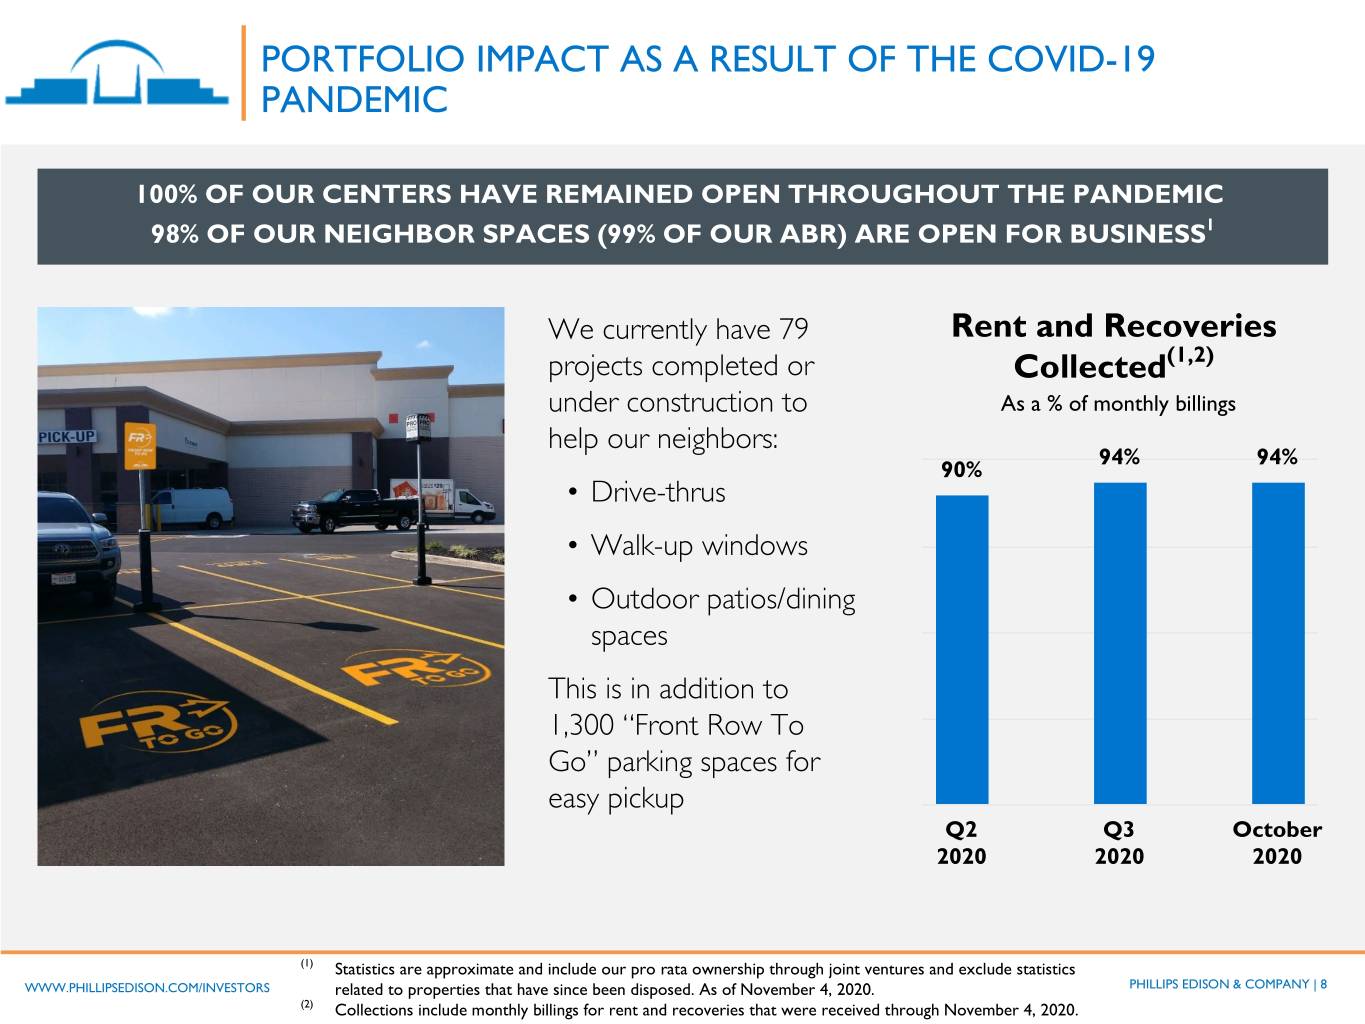
PORTFOLIO IMPACT AS A RESULT OF THE COVID-19 PANDEMIC 100% OF OUR CENTERS HAVE REMAINED OPEN THROUGHOUT THE PANDEMIC 98% OF OUR NEIGHBOR SPACES (99% OF OUR ABR) ARE OPEN FOR BUSINESS1 We currently have 79 Rent and Recoveries projects completed or Collected(1,2) under construction to As a % of monthly billings help our neighbors: 94% 94% 90% • Drive-thrus • Walk-up windows • Outdoor patios/dining spaces This is in addition to 1,300 “Front Row To Go” parking spaces for easy pickup Q2 Q3 October 2020 2020 2020 (1) Statistics are approximate and include our pro rata ownership through joint ventures and exclude statistics WWW.PHILLIPSEDISON.COM/INVESTORS related to properties that have since been disposed. As of November 4, 2020. PHILLIPS EDISON & COMPANY | 8 (2) Collections include monthly billings for rent and recoveries that were received through November 4, 2020.
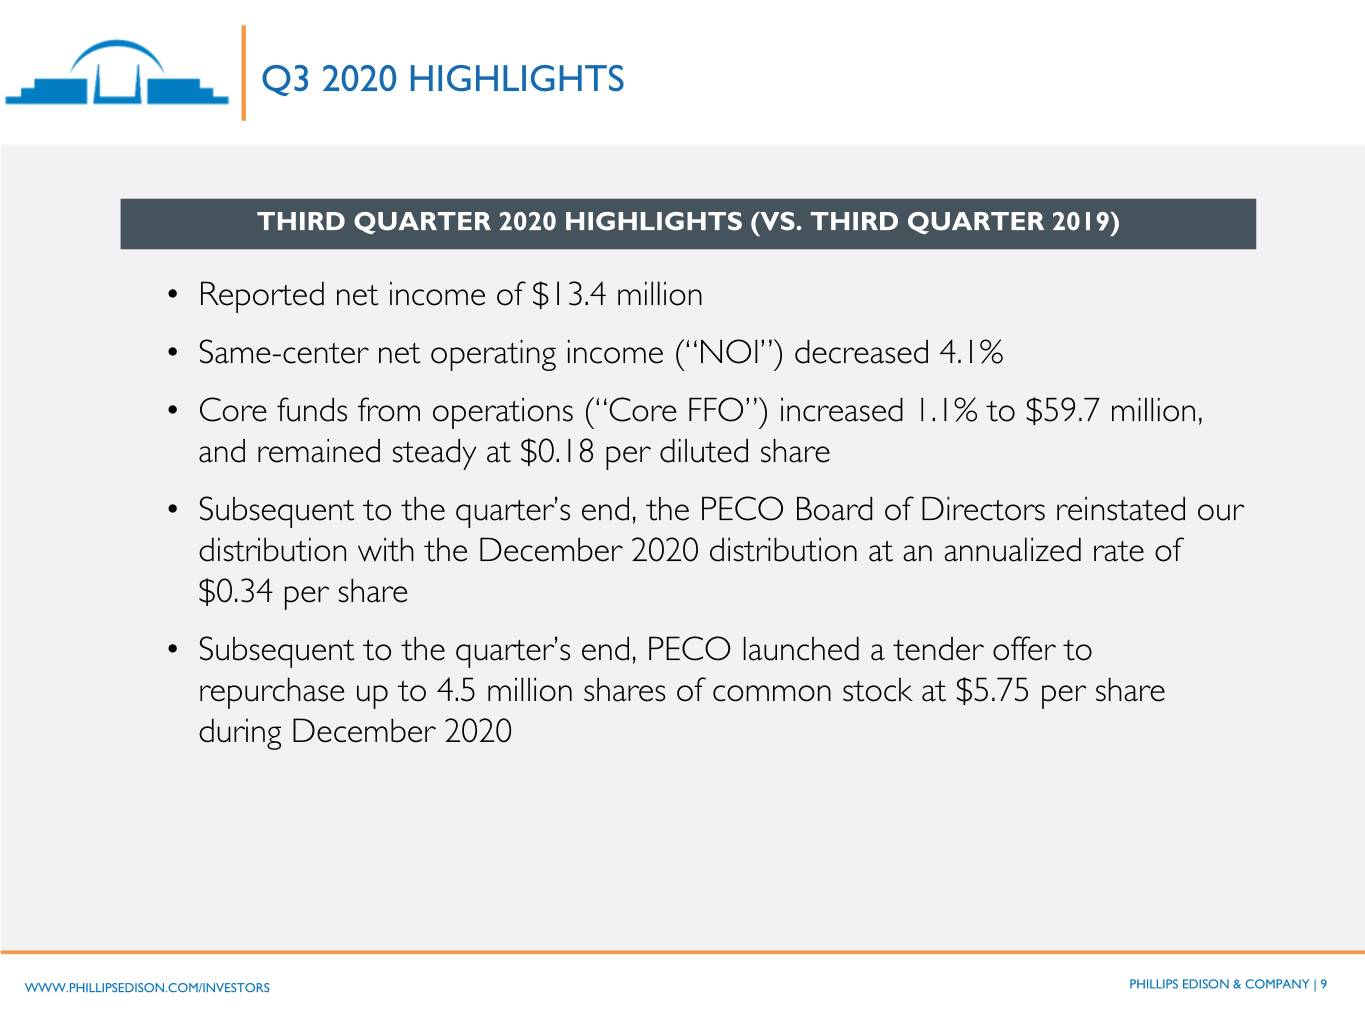
Q3 2020 HIGHLIGHTS THIRD QUARTER 2020 HIGHLIGHTS (VS. THIRD QUARTER 2019) • Reported net income of $13.4 million • Same-center net operating income (“NOI”) decreased 4.1% • Core funds from operations (“Core FFO”) increased 1.1% to $59.7 million, and remained steady at $0.18 per diluted share • Subsequent to the quarter’s end, the PECO Board of Directors reinstated our distribution with the December 2020 distribution at an annualized rate of $0.34 per share • Subsequent to the quarter’s end, PECO launched a tender offer to repurchase up to 4.5 million shares of common stock at $5.75 per share during December 2020 WWW.PHILLIPSEDISON.COM/INVESTORS PHILLIPS EDISON & COMPANY | 9
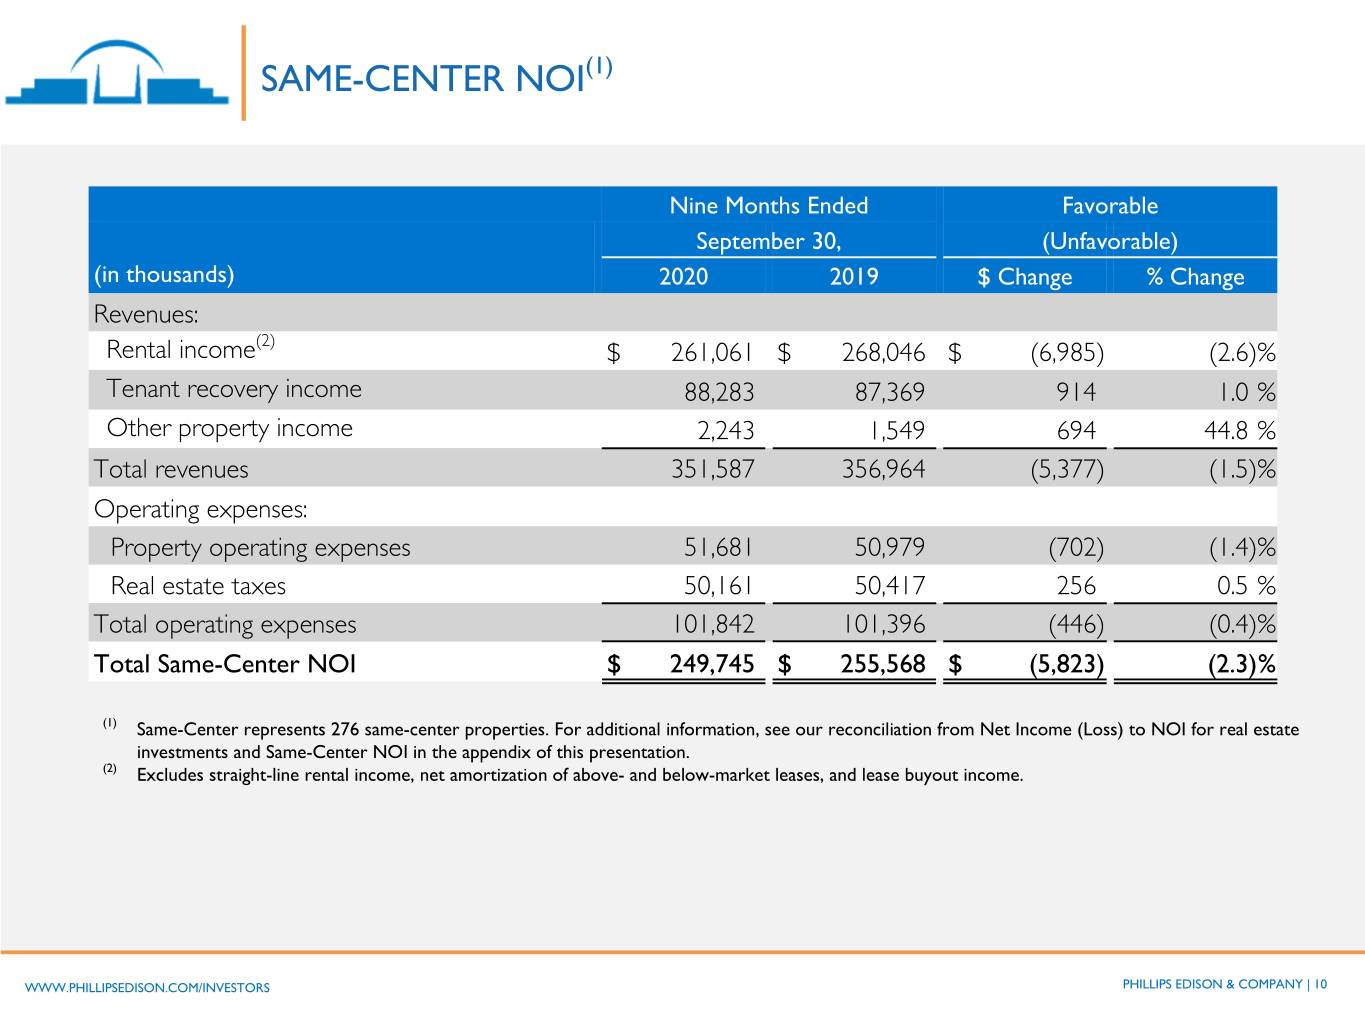
SAME-CENTER NOI(1) Nine Months Ended Favorable September 30, (Unfavorable) (in thousands) 2020 2019 $ Change % Change Revenues: Rental income(2) $ 261,061 $ 268,046 $ (6,985) (2.6) % Tenant recovery income 88,283 87,369 914 1.0 % Other property income 2,243 1,549 694 44.8 % Total revenues 351,587 356,964 (5,377) (1.5) % Operating expenses: Property operating expenses 51,681 50,979 (702) (1.4) % Real estate taxes 50,161 50,417 256 0.5 % Total operating expenses 101,842 101,396 (446) (0.4) % Total Same-Center NOI $ 249,745 $ 255,568 $ (5,823) (2.3) % (1) Same-Center represents 276 same-center properties. For additional information, see our reconciliation from Net Income (Loss) to NOI for real estate investments and Same-Center NOI in the appendix of this presentation. (2) Excludes straight-line rental income, net amortization of above- and below-market leases, and lease buyout income. WWW.PHILLIPSEDISON.COM/INVESTORS PHILLIPS EDISON & COMPANY | 10
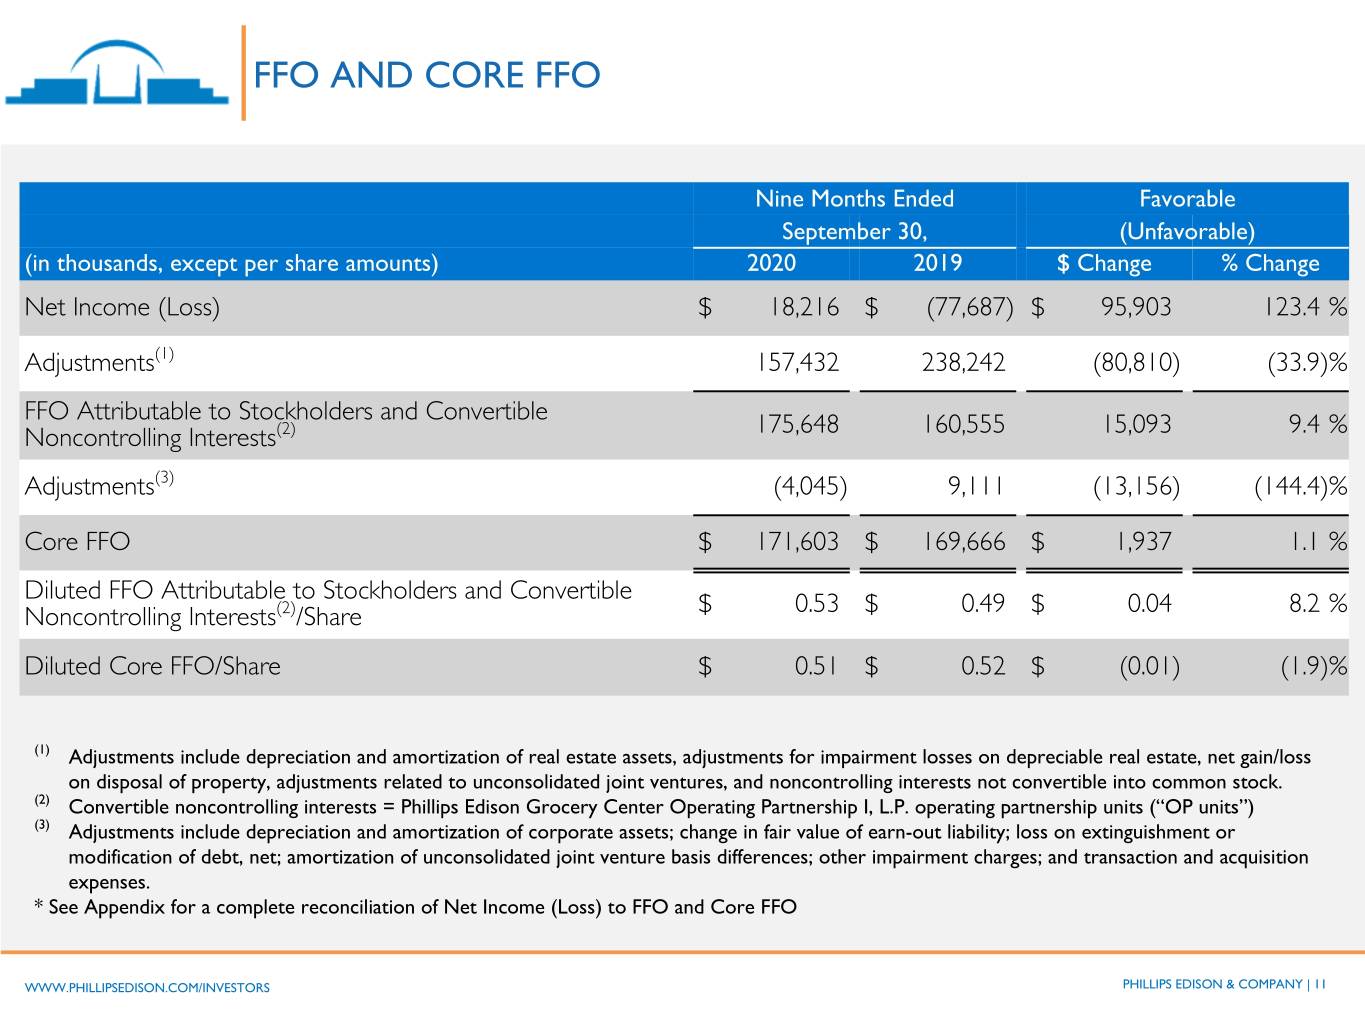
FFO AND CORE FFO Nine Months Ended Favorable September 30, (Unfavorable) (in thousands, except per share amounts) 2020 2019 $ Change % Change Net Income (Loss) $ 18,216 $ (77,687) $ 95,903 123.4 % Adjustments(1) 157,432 238,242 (80,810) (33.9) % FFO Attributable to Stockholders and Convertible Noncontrolling Interests(2) 175,648 160,555 15,093 9.4 % Adjustments(3) (4,045) 9,111 (13,156) (144.4) % Core FFO $ 171,603 $ 169,666 $ 1,937 1.1 % Diluted FFO Attributable to Stockholders and Convertible Noncontrolling Interests(2)/Share $ 0.53 $ 0.49 $ 0.04 8.2 % Diluted Core FFO/Share $ 0.51 $ 0.52 $ (0.01) (1.9) % (1) Adjustments include depreciation and amortization of real estate assets, adjustments for impairment losses on depreciable real estate, net gain/loss on disposal of property, adjustments related to unconsolidated joint ventures, and noncontrolling interests not convertible into common stock. (2) Convertible noncontrolling interests = Phillips Edison Grocery Center Operating Partnership I, L.P. operating partnership units (“OP units”) (3) Adjustments include depreciation and amortization of corporate assets; change in fair value of earn-out liability; loss on extinguishment or modification of debt, net; amortization of unconsolidated joint venture basis differences; other impairment charges; and transaction and acquisition expenses. * See Appendix for a complete reconciliation of Net Income (Loss) to FFO and Core FFO WWW.PHILLIPSEDISON.COM/INVESTORS PHILLIPS EDISON & COMPANY | 11
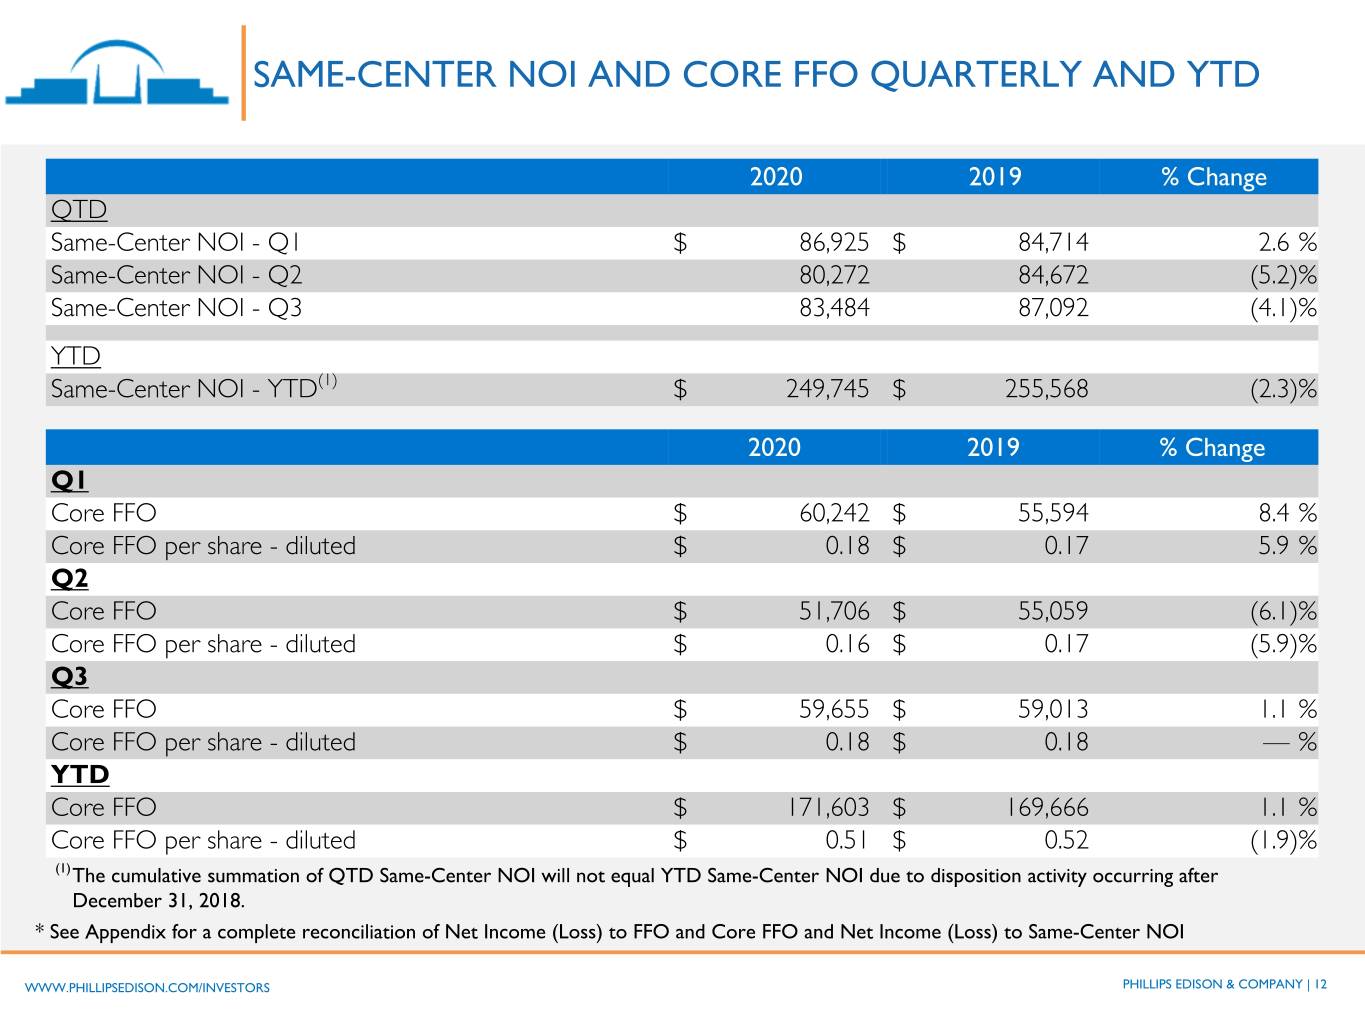
SAME-CENTER NOI AND CORE FFO QUARTERLY AND YTD 2020 2019 % Change QTD Same-Center NOI - Q1 $ 86,925 $ 84,714 2.6 % Same-Center NOI - Q2 80,272 84,672 (5.2) % Same-Center NOI - Q3 83,484 87,092 (4.1) % YTD Same-Center NOI - YTD(1) $ 249,745 $ 255,568 (2.3) % 2020 2019 % Change Q1 Core FFO $ 60,242 $ 55,594 8.4 % Core FFO per share - diluted $ 0.18 $ 0.17 5.9 % Q2 Core FFO $ 51,706 $ 55,059 (6.1) % Core FFO per share - diluted $ 0.16 $ 0.17 (5.9) % Q3 Core FFO $ 59,655 $ 59,013 1.1 % Core FFO per share - diluted $ 0.18 $ 0.18 — % YTD Core FFO $ 171,603 $ 169,666 1.1 % Core FFO per share - diluted $ 0.51 $ 0.52 (1.9) % (1)The cumulative summation of QTD Same-Center NOI will not equal YTD Same-Center NOI due to disposition activity occurring after December 31, 2018. * See Appendix for a complete reconciliation of Net Income (Loss) to FFO and Core FFO and Net Income (Loss) to Same-Center NOI WWW.PHILLIPSEDISON.COM/INVESTORS PHILLIPS EDISON & COMPANY | 12
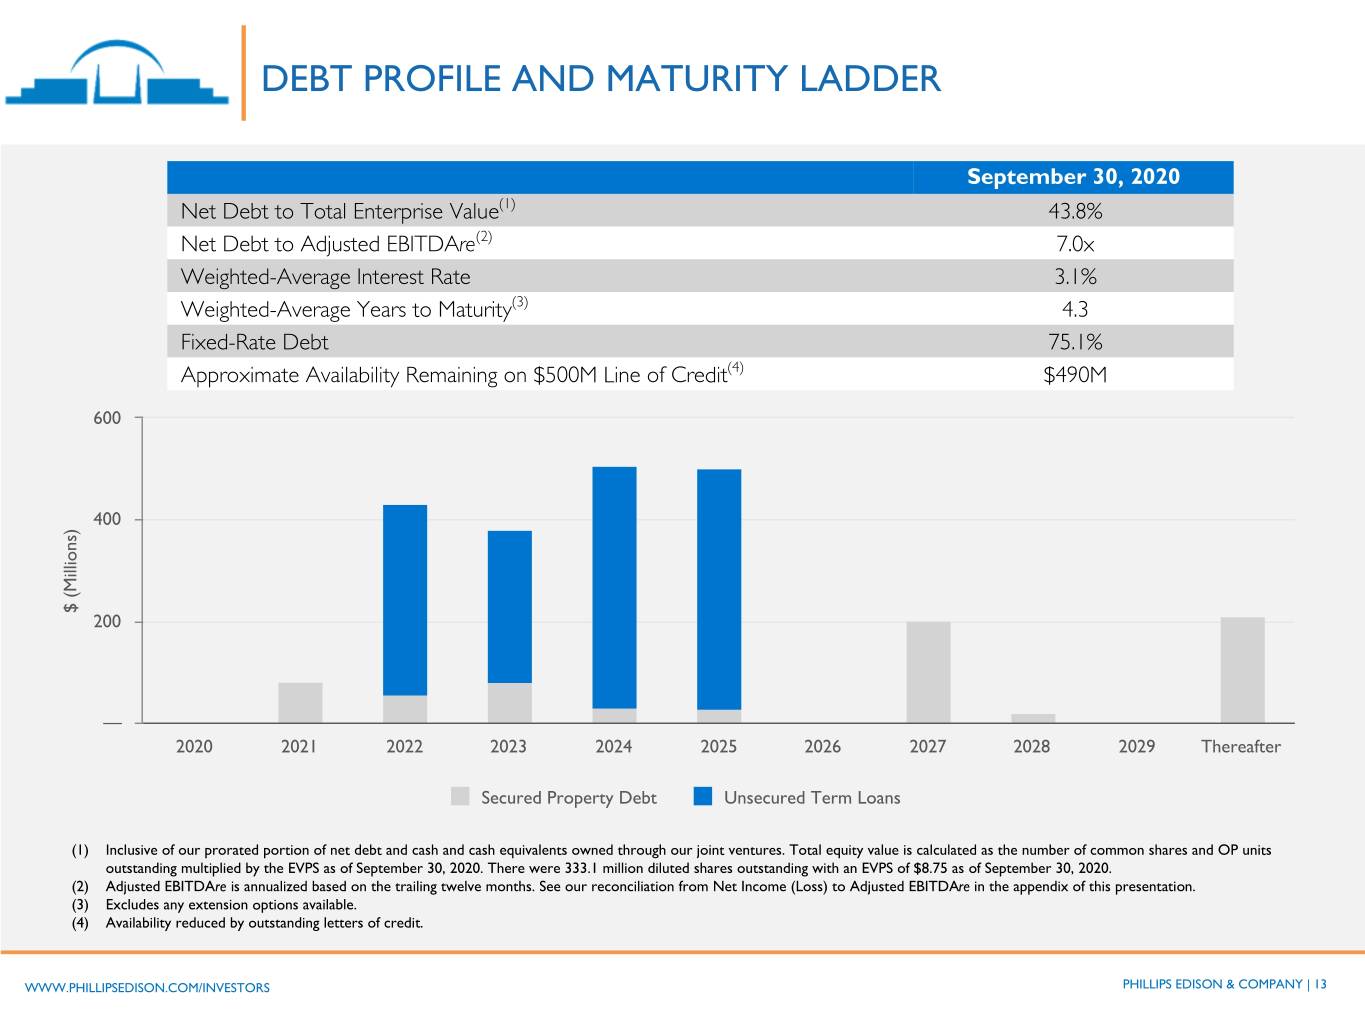
DEBT PROFILE AND MATURITY LADDER September 30, 2020 Net Debt to Total Enterprise Value(1) 43.8% Net Debt to Adjusted EBITDAre(2) 7.0x Weighted-Average Interest Rate 3.1% Weighted-Average Years to Maturity(3) 4.3 Fixed-Rate Debt 75.1% Approximate Availability Remaining on $500M Line of Credit(4) $490M 600 400 $ (Millions) 200 — 2020 2021 2022 2023 2024 2025 2026 2027 2028 2029 Thereafter Secured Property Debt Unsecured Term Loans (1) Inclusive of our prorated portion of net debt and cash and cash equivalents owned through our joint ventures. Total equity value is calculated as the number of common shares and OP units outstanding multiplied by the EVPS as of September 30, 2020. There were 333.1 million diluted shares outstanding with an EVPS of $8.75 as of September 30, 2020. (2) Adjusted EBITDAre is annualized based on the trailing twelve months. See our reconciliation from Net Income (Loss) to Adjusted EBITDAre in the appendix of this presentation. (3) Excludes any extension options available. (4) Availability reduced by outstanding letters of credit. WWW.PHILLIPSEDISON.COM/INVESTORS PHILLIPS EDISON & COMPANY | 13
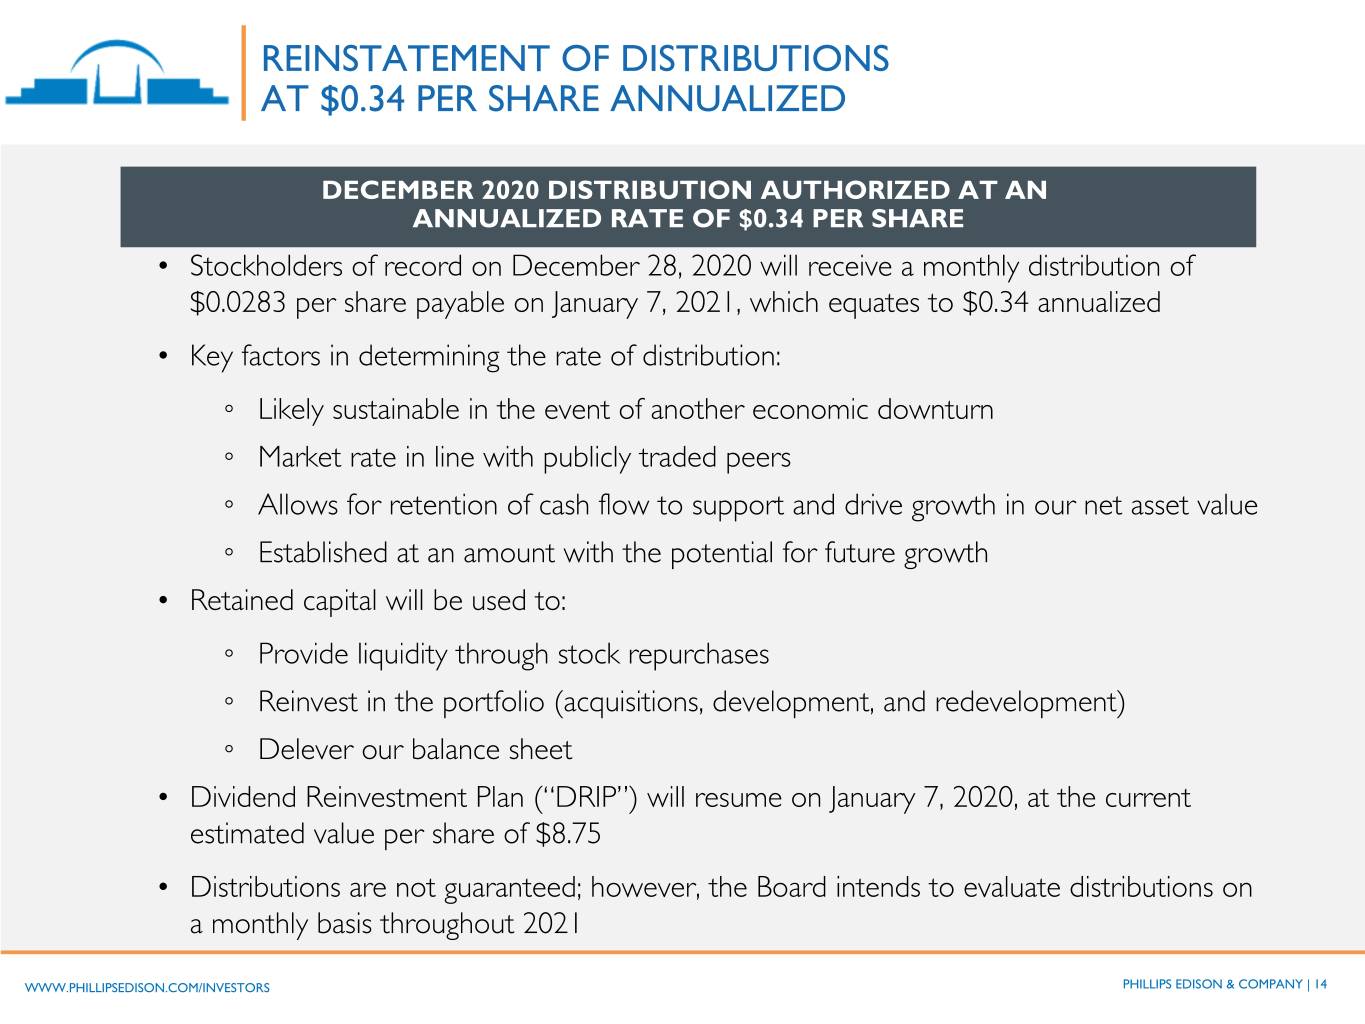
REINSTATEMENT OF DISTRIBUTIONS AT $0.34 PER SHARE ANNUALIZED DECEMBER 2020 DISTRIBUTION AUTHORIZED AT AN ANNUALIZED RATE OF $0.34 PER SHARE • Stockholders of record on December 28, 2020 will receive a monthly distribution of $0.0283 per share payable on January 7, 2021, which equates to $0.34 annualized • Key factors in determining the rate of distribution: ◦ Likely sustainable in the event of another economic downturn ◦ Market rate in line with publicly traded peers ◦ Allows for retention of cash flow to support and drive growth in our net asset value ◦ Established at an amount with the potential for future growth • Retained capital will be used to: ◦ Provide liquidity through stock repurchases ◦ Reinvest in the portfolio (acquisitions, development, and redevelopment) ◦ Delever our balance sheet • Dividend Reinvestment Plan (“DRIP”) will resume on January 7, 2020, at the current estimated value per share of $8.75 • Distributions are not guaranteed; however, the Board intends to evaluate distributions on a monthly basis throughout 2021 WWW.PHILLIPSEDISON.COM/INVESTORS PHILLIPS EDISON & COMPANY | 14
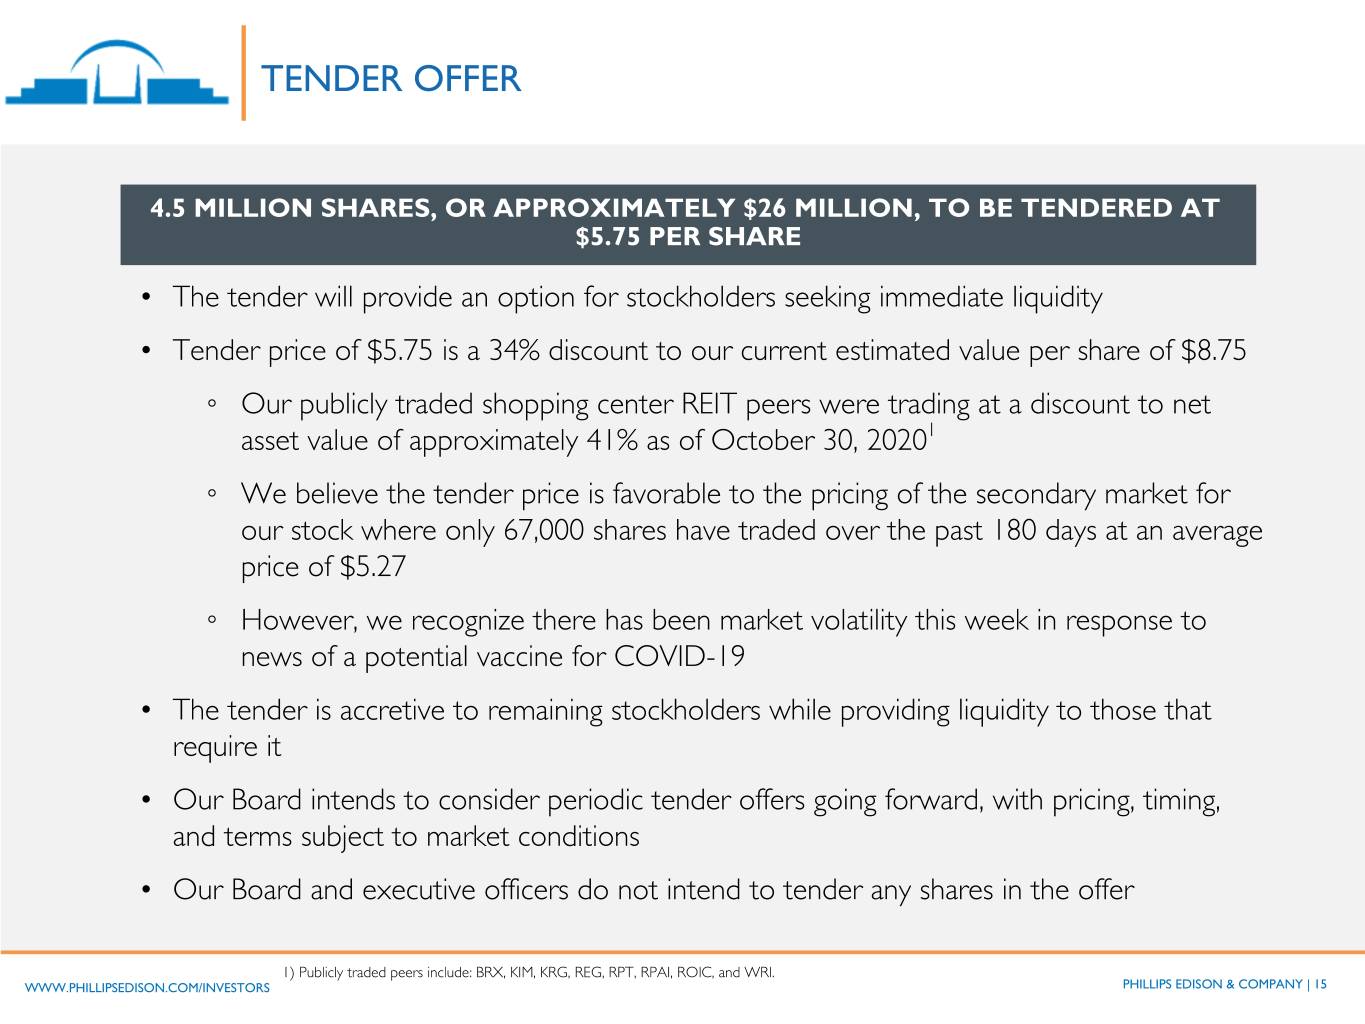
TENDER OFFER 4.5 MILLION SHARES, OR APPROXIMATELY $26 MILLION, TO BE TENDERED AT $5.75 PER SHARE • The tender will provide an option for stockholders seeking immediate liquidity • Tender price of $5.75 is a 34% discount to our current estimated value per share of $8.75 ◦ Our publicly traded shopping center REIT peers were trading at a discount to net asset value of approximately 41% as of October 30, 20201 ◦ We believe the tender price is favorable to the pricing of the secondary market for our stock where only 67,000 shares have traded over the past 180 days at an average price of $5.27 ◦ However, we recognize there has been market volatility this week in response to news of a potential vaccine for COVID-19 • The tender is accretive to remaining stockholders while providing liquidity to those that require it • Our Board intends to consider periodic tender offers going forward, with pricing, timing, and terms subject to market conditions • Our Board and executive officers do not intend to tender any shares in the offer 1) Publicly traded peers include: BRX, KIM, KRG, REG, RPT, RPAI, ROIC, and WRI. WWW.PHILLIPSEDISON.COM/INVESTORS PHILLIPS EDISON & COMPANY | 15
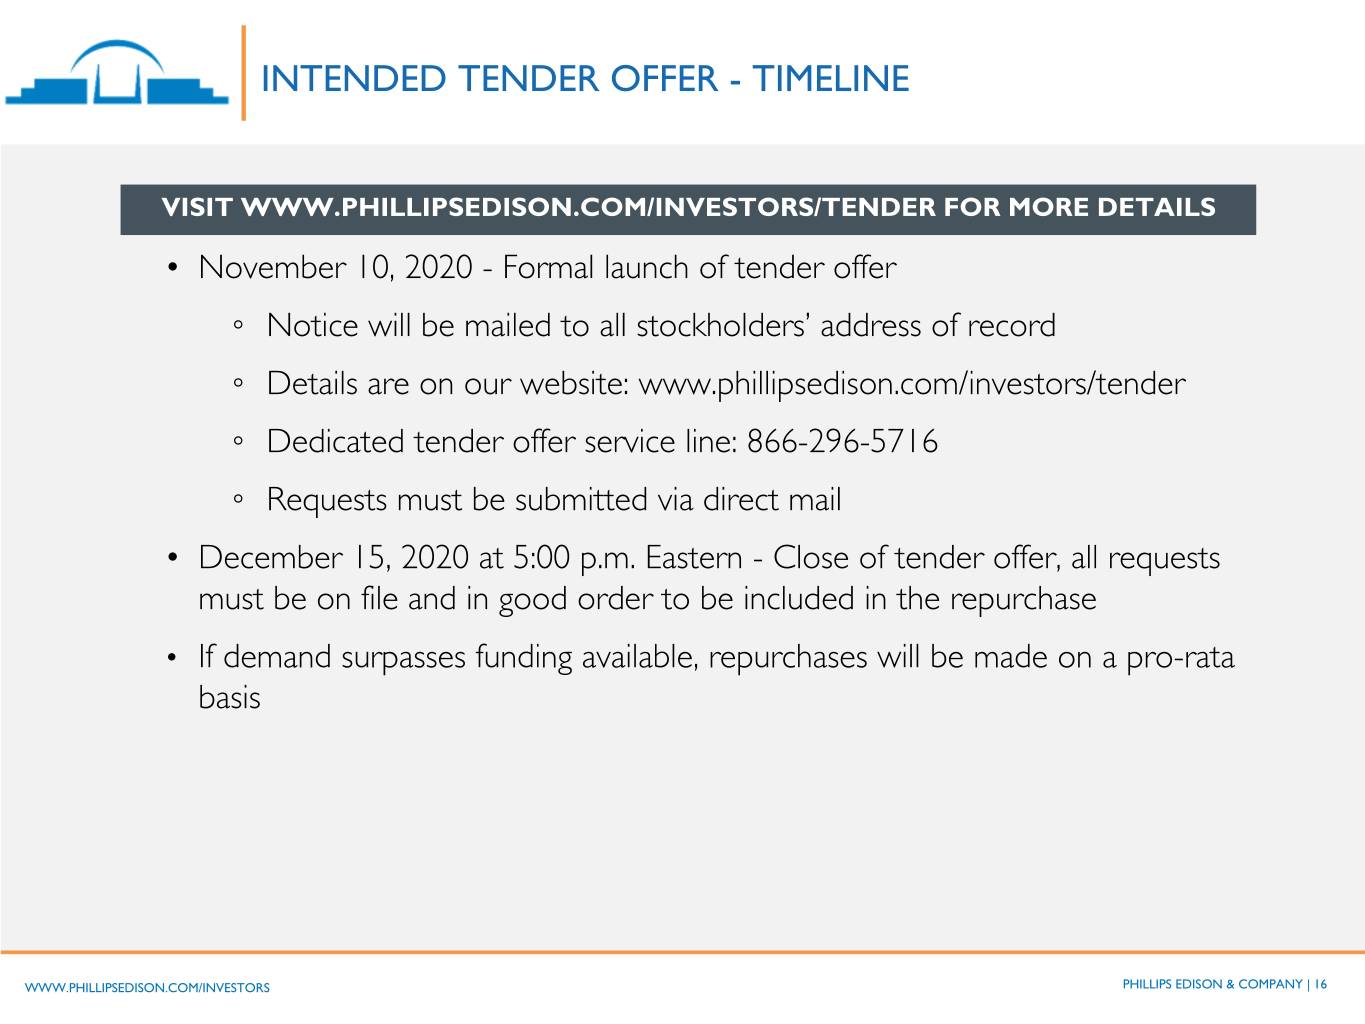
INTENDED TENDER OFFER - TIMELINE VISIT WWW.PHILLIPSEDISON.COM/INVESTORS/TENDER FOR MORE DETAILS • November 10, 2020 - Formal launch of tender offer ◦ Notice will be mailed to all stockholders’ address of record ◦ Details are on our website: www.phillipsedison.com/investors/tender ◦ Dedicated tender offer service line: 866-296-5716 ◦ Requests must be submitted via direct mail • December 15, 2020 at 5:00 p.m. Eastern - Close of tender offer, all requests must be on file and in good order to be included in the repurchase • If demand surpasses funding available, repurchases will be made on a pro-rata basis WWW.PHILLIPSEDISON.COM/INVESTORS PHILLIPS EDISON & COMPANY | 16
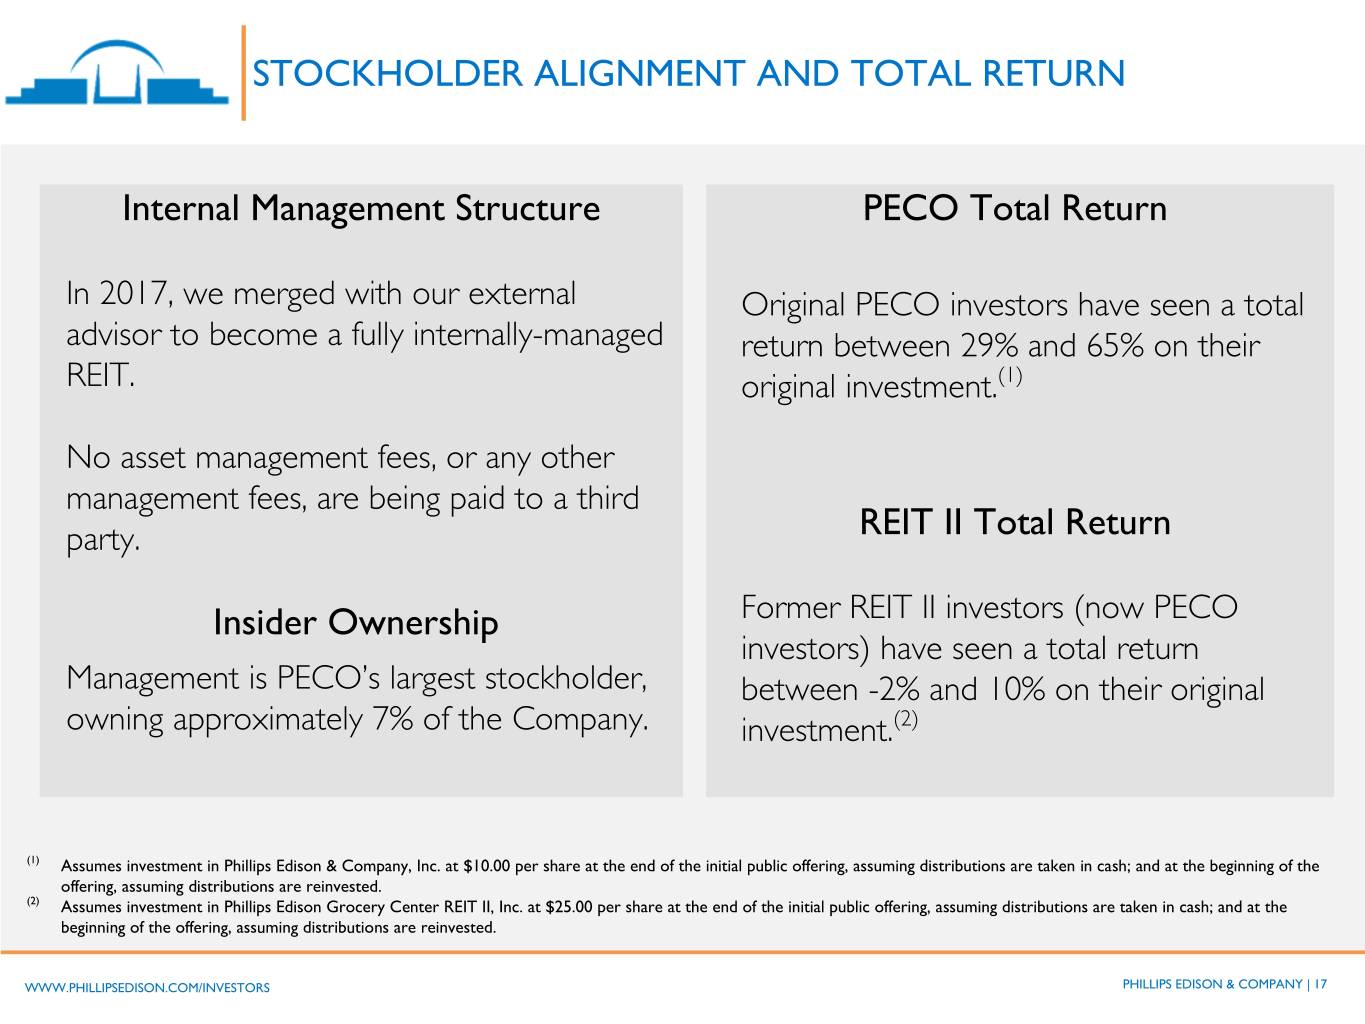
STOCKHOLDER ALIGNMENT AND TOTAL RETURN Internal Management Structure PECO Total Return In 2017, we merged with our external Original PECO investors have seen a total advisor to become a fully internally-managed return between 29% and 65% on their REIT. original investment.(1) No asset management fees, or any other management fees, are being paid to a third party. REIT II Total Return Insider Ownership Former REIT II investors (now PECO investors) have seen a total return Management is PECO’s largest stockholder, between -2% and 10% on their original owning approximately 7% of the Company. investment.(2) (1) Assumes investment in Phillips Edison & Company, Inc. at $10.00 per share at the end of the initial public offering, assuming distributions are taken in cash; and at the beginning of the offering, assuming distributions are reinvested. (2) Assumes investment in Phillips Edison Grocery Center REIT II, Inc. at $25.00 per share at the end of the initial public offering, assuming distributions are taken in cash; and at the beginning of the offering, assuming distributions are reinvested. WWW.PHILLIPSEDISON.COM/INVESTORS PHILLIPS EDISON & COMPANY | 17
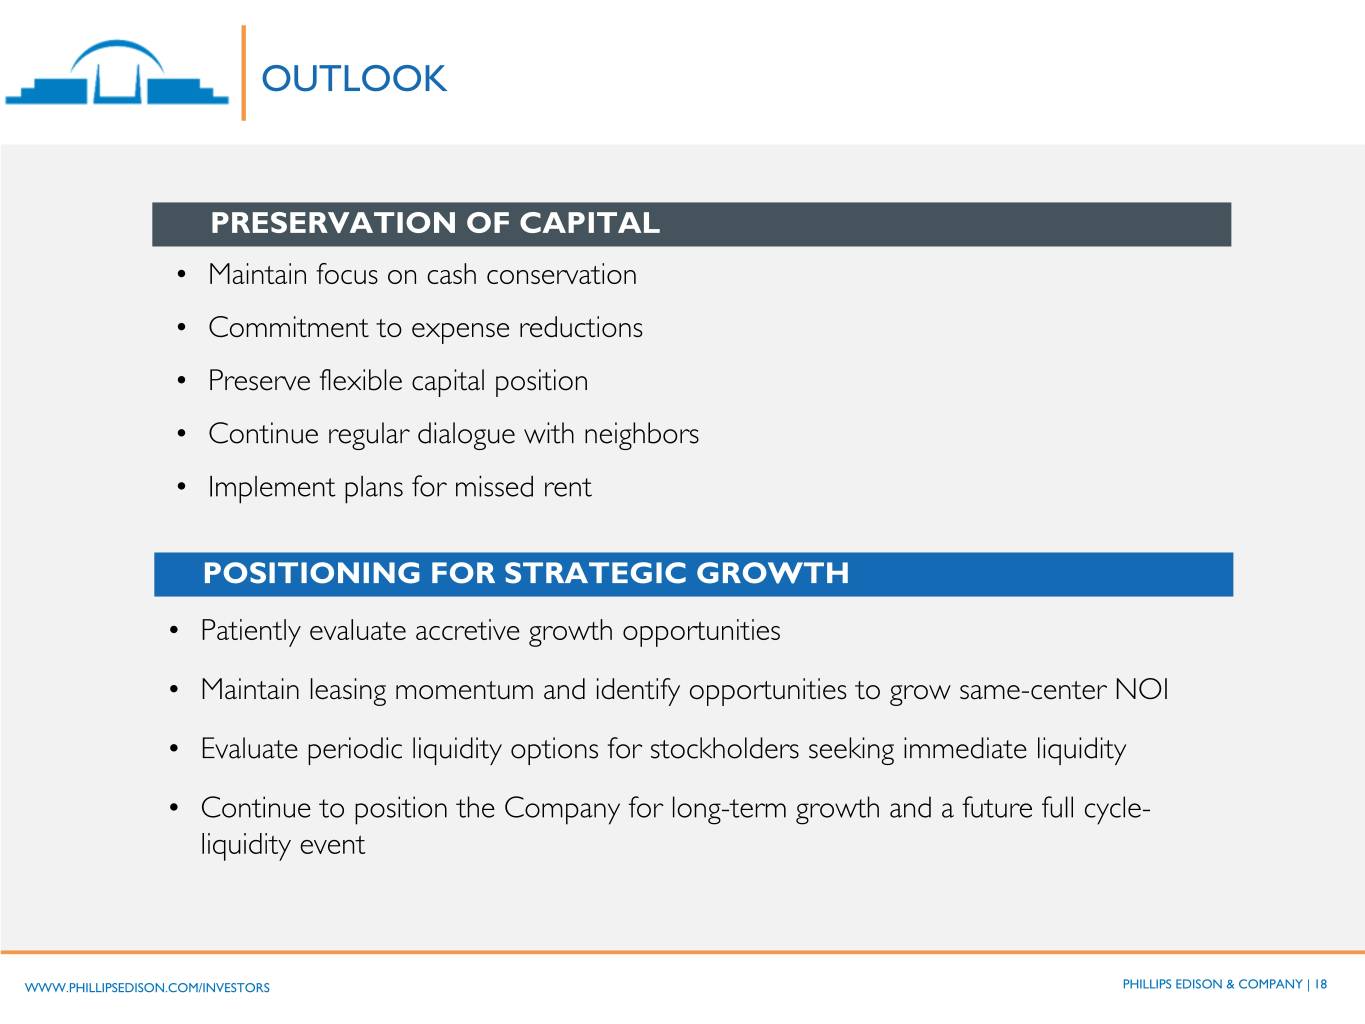
OUTLOOK PRESERVATION OF CAPITAL • Maintain focus on cash conservation • Commitment to expense reductions • Preserve flexible capital position • Continue regular dialogue with neighbors • Implement plans for missed rent POSITIONING FOR STRATEGIC GROWTH • Patiently evaluate accretive growth opportunities • Maintain leasing momentum and identify opportunities to grow same-center NOI • Evaluate periodic liquidity options for stockholders seeking immediate liquidity • Continue to position the Company for long-term growth and a future full cycle- liquidity event WWW.PHILLIPSEDISON.COM/INVESTORS PHILLIPS EDISON & COMPANY | 18
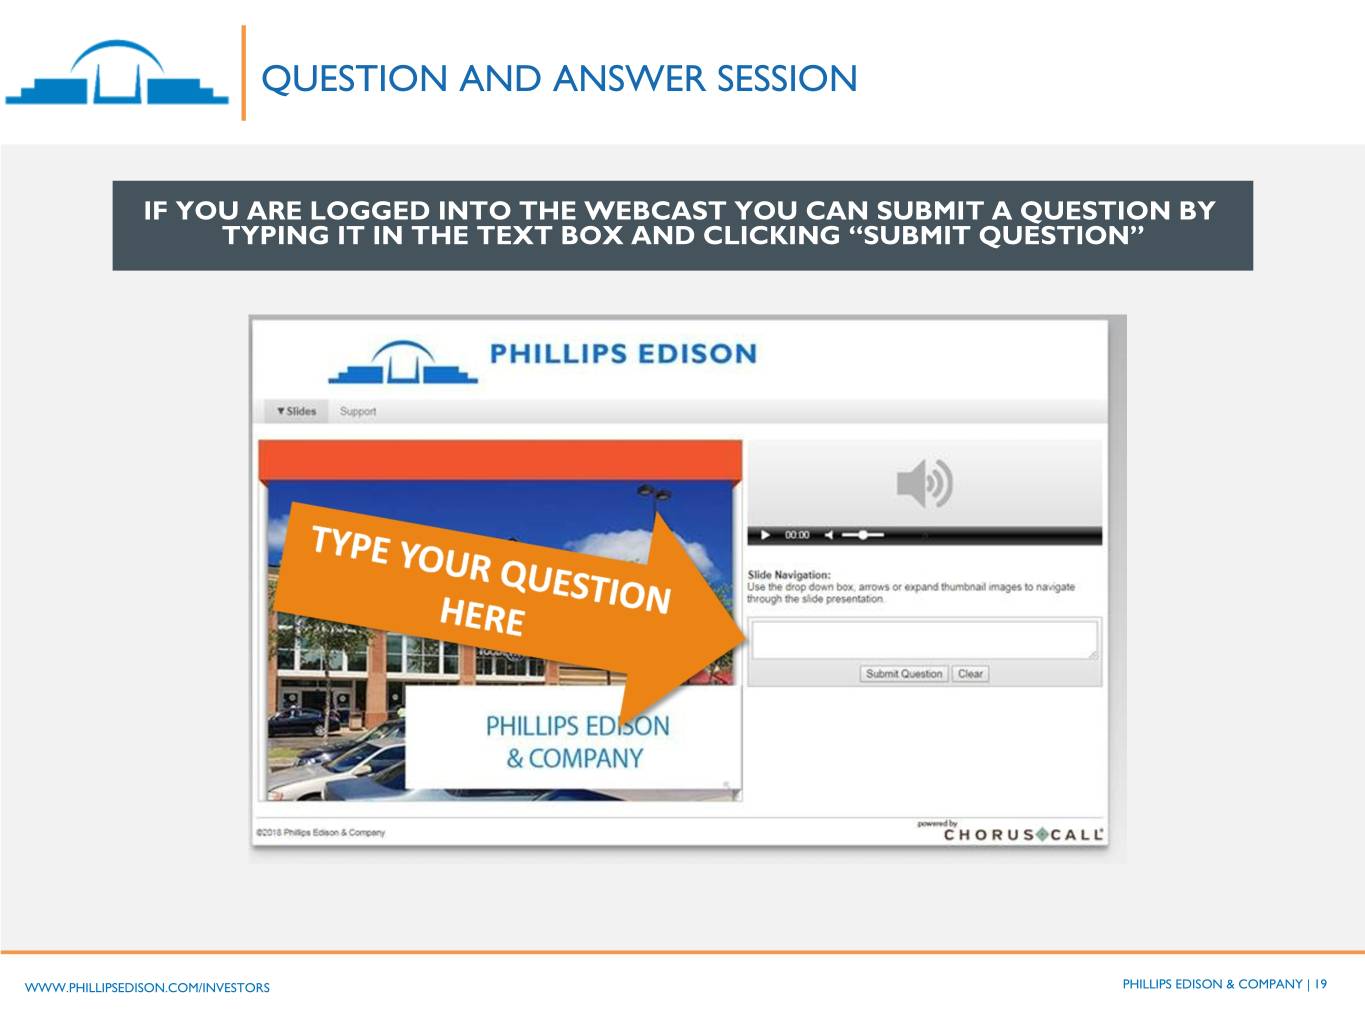
QUESTION AND ANSWER SESSION IF YOU ARE LOGGED INTO THE WEBCAST YOU CAN SUBMIT A QUESTION BY TYPING IT IN THE TEXT BOX AND CLICKING “SUBMIT QUESTION” WWW.PHILLIPSEDISON.COM/INVESTORS PHILLIPS EDISON & COMPANY | 19

FOR MORE INFORMATION INVESTORRELATIONS@PHILLIPSEDISON.COM WWW.PHILLIPSEDISON.COM/INVESTORS INVESTORS AND NIGO SERVICING: (888) 518-8073 PHILLIPS EDISON ADVISOR SERVICES: (833) 347-5717 WWW.PHILLIPSEDISON.COM/INVESTORS PHILLIPS EDISON & COMPANY | 20
APPENDIX WWW.PHILLIPSEDISON.COM/INVESTORS PHILLIPS EDISON & COMPANY | 21
NON-GAAP MEASURES We present Same-Center NOI as a supplemental measure of our performance. We define NOI as total operating revenues, adjusted to exclude non-cash revenue items, less property operating expenses and real estate taxes. For the three and nine months ended September 30, 2020 and 2019, Same-Center NOI represents the NOI for the 276 properties that were wholly-owned and operational for the entire portion of both comparable reporting periods. We believe Same-Center NOI provides useful information to our investors about our financial and operating performance because it provides a performance measure of the revenues and expenses directly involved in owning and operating real estate assets and provides a perspective not immediately apparent from net income (loss). Because Same-Center NOI excludes the change in NOI from properties acquired or disposed of after December 31, 2018, it highlights operating trends such as occupancy levels, rental rates, and operating costs on properties that were operational for both comparable periods. Other REITs may use different methodologies for calculating Same-Center NOI, and accordingly, our Same-Center NOI may not be comparable to other REITs. Same-Center NOI should not be viewed as an alternative measure of our financial performance as it does not reflect the operations of our entire portfolio, nor does it reflect the impact of general and administrative expenses, depreciation and amortization, interest expense, other income (expense), or the level of capital expenditures and leasing costs necessary to maintain the operating performance of our properties that could materially impact our results from operations. WWW.PHILLIPSEDISON.COM/INVESTORS PHILLIPS EDISON & COMPANY | 22
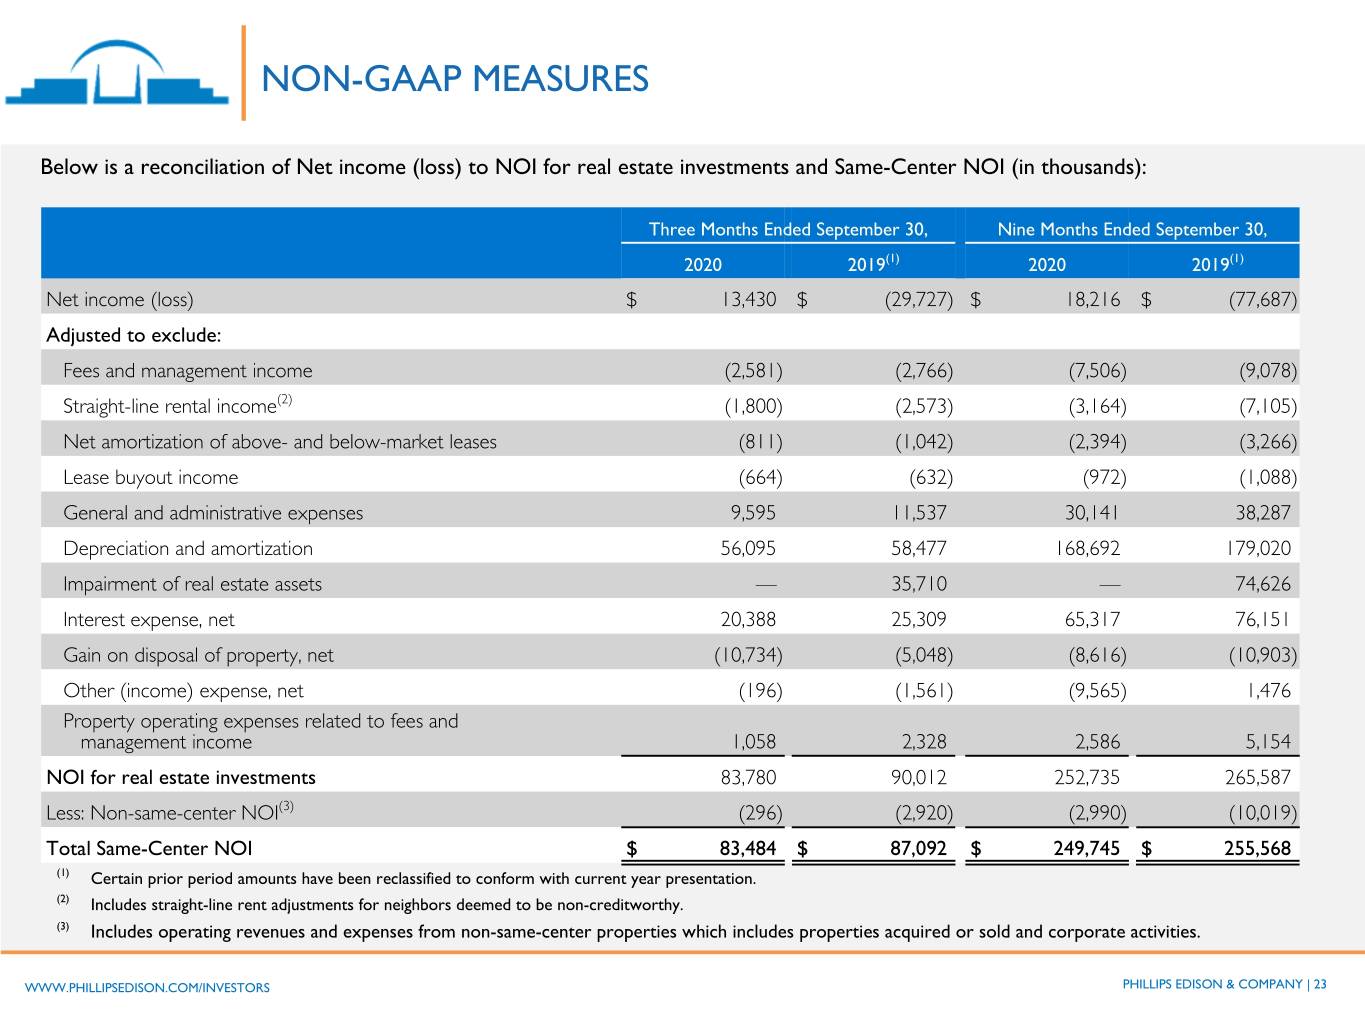
NON-GAAP MEASURES Below is a reconciliation of Net income (loss) to NOI for real estate investments and Same-Center NOI (in thousands): Three Months Ended September 30, Nine Months Ended September 30, 2020 2019(1) 2020 2019(1) Net income (loss) $ 13,430 $ (29,727) $ 18,216 $ (77,687) Adjusted to exclude: Fees and management income (2,581) (2,766) (7,506) (9,078) Straight-line rental income(2) (1,800) (2,573) (3,164) (7,105) Net amortization of above- and below-market leases (811) (1,042) (2,394) (3,266) Lease buyout income (664) (632) (972) (1,088) General and administrative expenses 9,595 11,537 30,141 38,287 Depreciation and amortization 56,095 58,477 168,692 179,020 Impairment of real estate assets — 35,710 — 74,626 Interest expense, net 20,388 25,309 65,317 76,151 Gain on disposal of property, net (10,734) (5,048) (8,616) (10,903) Other (income) expense, net (196) (1,561) (9,565) 1,476 Property operating expenses related to fees and management income 1,058 2,328 2,586 5,154 NOI for real estate investments 83,780 90,012 252,735 265,587 Less: Non-same-center NOI(3) (296) (2,920) (2,990) (10,019) Total Same-Center NOI $ 83,484 $ 87,092 $ 249,745 $ 255,568 (1) Certain prior period amounts have been reclassified to conform with current year presentation. (2) Includes straight-line rent adjustments for neighbors deemed to be non-creditworthy. (3) Includes operating revenues and expenses from non-same-center properties which includes properties acquired or sold and corporate activities. WWW.PHILLIPSEDISON.COM/INVESTORS PHILLIPS EDISON & COMPANY | 23

NON-GAAP MEASURES Funds from Operations and Core Funds from Operations FFO is a non-GAAP performance financial measure that is widely recognized as a measure of REIT operating performance. The National Association of Real Estate Investment Trusts (“Nareit”) defines FFO as net income (loss) computed in accordance with GAAP, excluding gains (or losses) from sales of property and gains (or losses) from change in control, plus depreciation and amortization, and after adjustments for impairment losses on real estate and impairments of in-substance real estate investments in investees that are driven by measurable decreases in the fair value of the depreciable real estate held by the unconsolidated partnerships and joint ventures. Adjustments for unconsolidated partnerships and joint ventures are calculated to reflect FFO on the same basis. We calculate FFO Attributable to Stockholders and Convertible Noncontrolling Interests in a manner consistent with the Nareit definition, with an additional adjustment made for noncontrolling interests that are not convertible into common stock. Core FFO is an additional performance financial measure used by us as FFO includes certain non-comparable items that affect our performance over time. We believe that Core FFO is helpful in assisting management and investors with the assessment of the sustainability of operating performance in future periods. We believe it is more reflective of our core operating performance and provides an additional measure to compare our performance across reporting periods on a consistent basis by excluding items that may cause short-term fluctuations in net income (loss). To arrive at Core FFO, we adjust FFO attributable to stockholders and convertible noncontrolling interests to exclude certain recurring and non-recurring items including, but not limited to, depreciation and amortization of corporate assets, changes in the fair value of the earn-out liability, amortization of unconsolidated joint venture basis differences, gains or losses on the extinguishment or modification of debt, other impairment charges, and transaction and acquisition expenses. FFO, FFO Attributable to Stockholders and Convertible Noncontrolling Interests, and Core FFO should not be considered alternatives to net income (loss) under GAAP, as an indication of our liquidity, nor as an indication of funds available to cover our cash needs, including our ability to fund distributions. Core FFO may not be a useful measure of the impact of long-term operating performance on value if we do not continue to operate our business plan in the manner currently contemplated. Accordingly, FFO, FFO Attributable to Stockholders and Convertible Noncontrolling Interests, and Core FFO should be reviewed in connection with other GAAP measurements, and should not be viewed as more prominent measures of performance than net income (loss) or cash flows from operations prepared in accordance with GAAP. Our FFO, FFO Attributable to Stockholders and Convertible Noncontrolling Interests, and Core FFO, as presented, may not be comparable to amounts calculated by other REITs. WWW.PHILLIPSEDISON.COM/INVESTORS PHILLIPS EDISON & COMPANY | 24
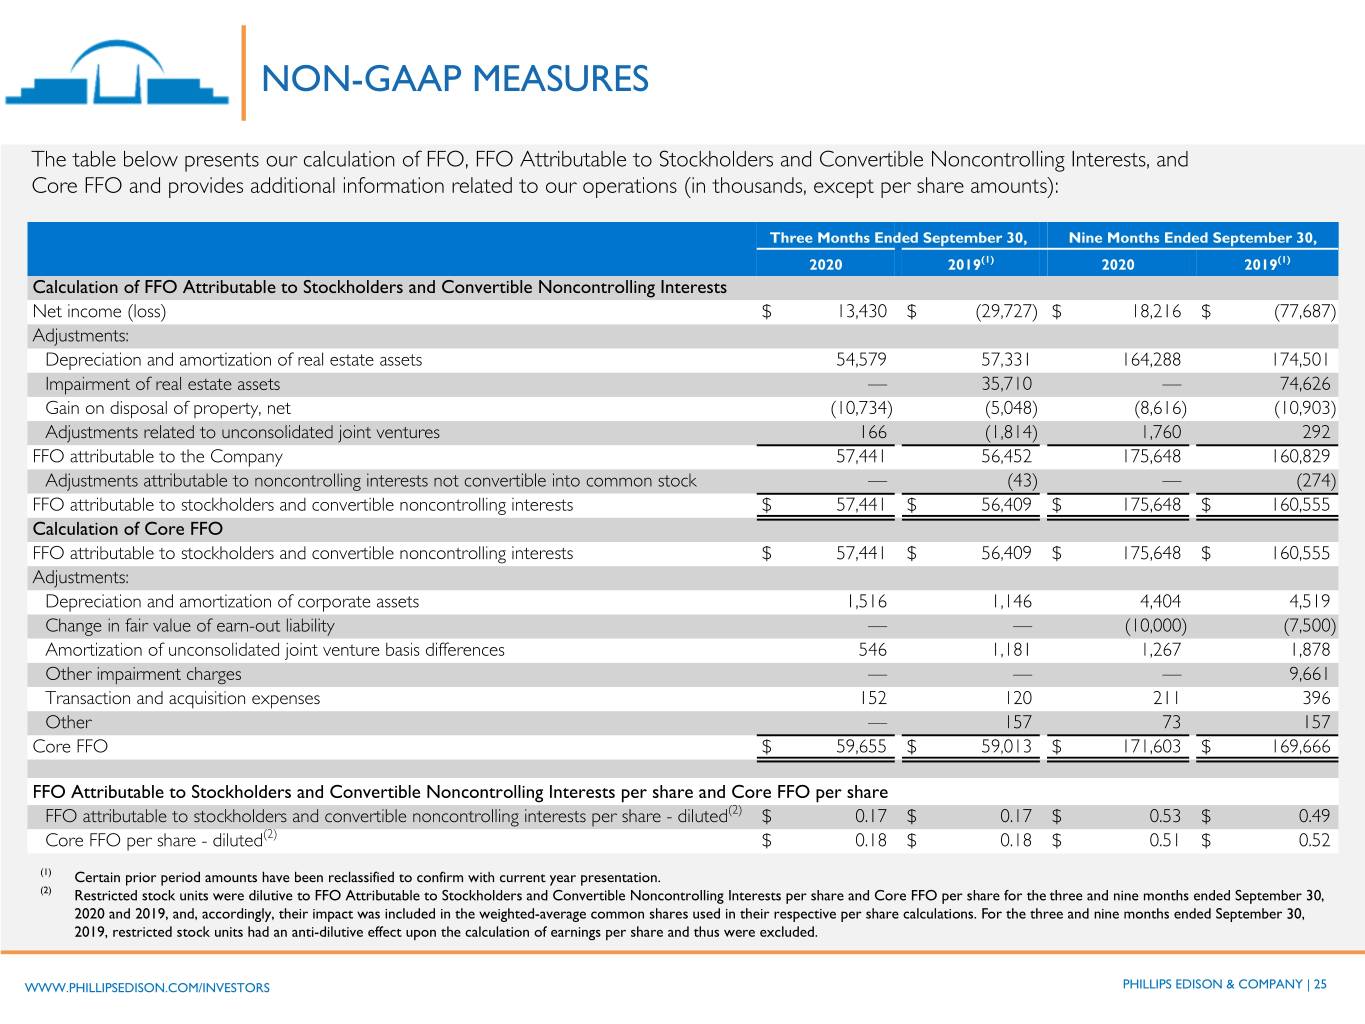
NON-GAAP MEASURES The table below presents our calculation of FFO, FFO Attributable to Stockholders and Convertible Noncontrolling Interests, and Core FFO and provides additional information related to our operations (in thousands, except per share amounts): Three Months Ended September 30, Nine Months Ended September 30, 2020 2019(1) 2020 2019(1) Calculation of FFO Attributable to Stockholders and Convertible Noncontrolling Interests Net income (loss) $ 13,430 $ (29,727) $ 18,216 $ (77,687) Adjustments: Depreciation and amortization of real estate assets 54,579 57,331 164,288 174,501 Impairment of real estate assets — 35,710 — 74,626 Gain on disposal of property, net (10,734) (5,048) (8,616) (10,903) Adjustments related to unconsolidated joint ventures 166 (1,814) 1,760 292 FFO attributable to the Company 57,441 56,452 175,648 160,829 Adjustments attributable to noncontrolling interests not convertible into common stock — (43) — (274) FFO attributable to stockholders and convertible noncontrolling interests $ 57,441 $ 56,409 $ 175,648 $ 160,555 Calculation of Core FFO FFO attributable to stockholders and convertible noncontrolling interests $ 57,441 $ 56,409 $ 175,648 $ 160,555 Adjustments: Depreciation and amortization of corporate assets 1,516 1,146 4,404 4,519 Change in fair value of earn-out liability — — (10,000) (7,500) Amortization of unconsolidated joint venture basis differences 546 1,181 1,267 1,878 Other impairment charges — — — 9,661 Transaction and acquisition expenses 152 120 211 396 Other — 157 73 157 Core FFO $ 59,655 $ 59,013 $ 171,603 $ 169,666 FFO Attributable to Stockholders and Convertible Noncontrolling Interests per share and Core FFO per share FFO attributable to stockholders and convertible noncontrolling interests per share - diluted(2) $ 0.17 $ 0.17 $ 0.53 $ 0.49 Core FFO per share - diluted(2) $ 0.18 $ 0.18 $ 0.51 $ 0.52 (1) Certain prior period amounts have been reclassified to confirm with current year presentation. (2) Restricted stock units were dilutive to FFO Attributable to Stockholders and Convertible Noncontrolling Interests per share and Core FFO per share for the three and nine months ended September 30, 2020 and 2019, and, accordingly, their impact was included in the weighted-average common shares used in their respective per share calculations. For the three and nine months ended September 30, 2019, restricted stock units had an anti-dilutive effect upon the calculation of earnings per share and thus were excluded. WWW.PHILLIPSEDISON.COM/INVESTORS PHILLIPS EDISON & COMPANY | 25
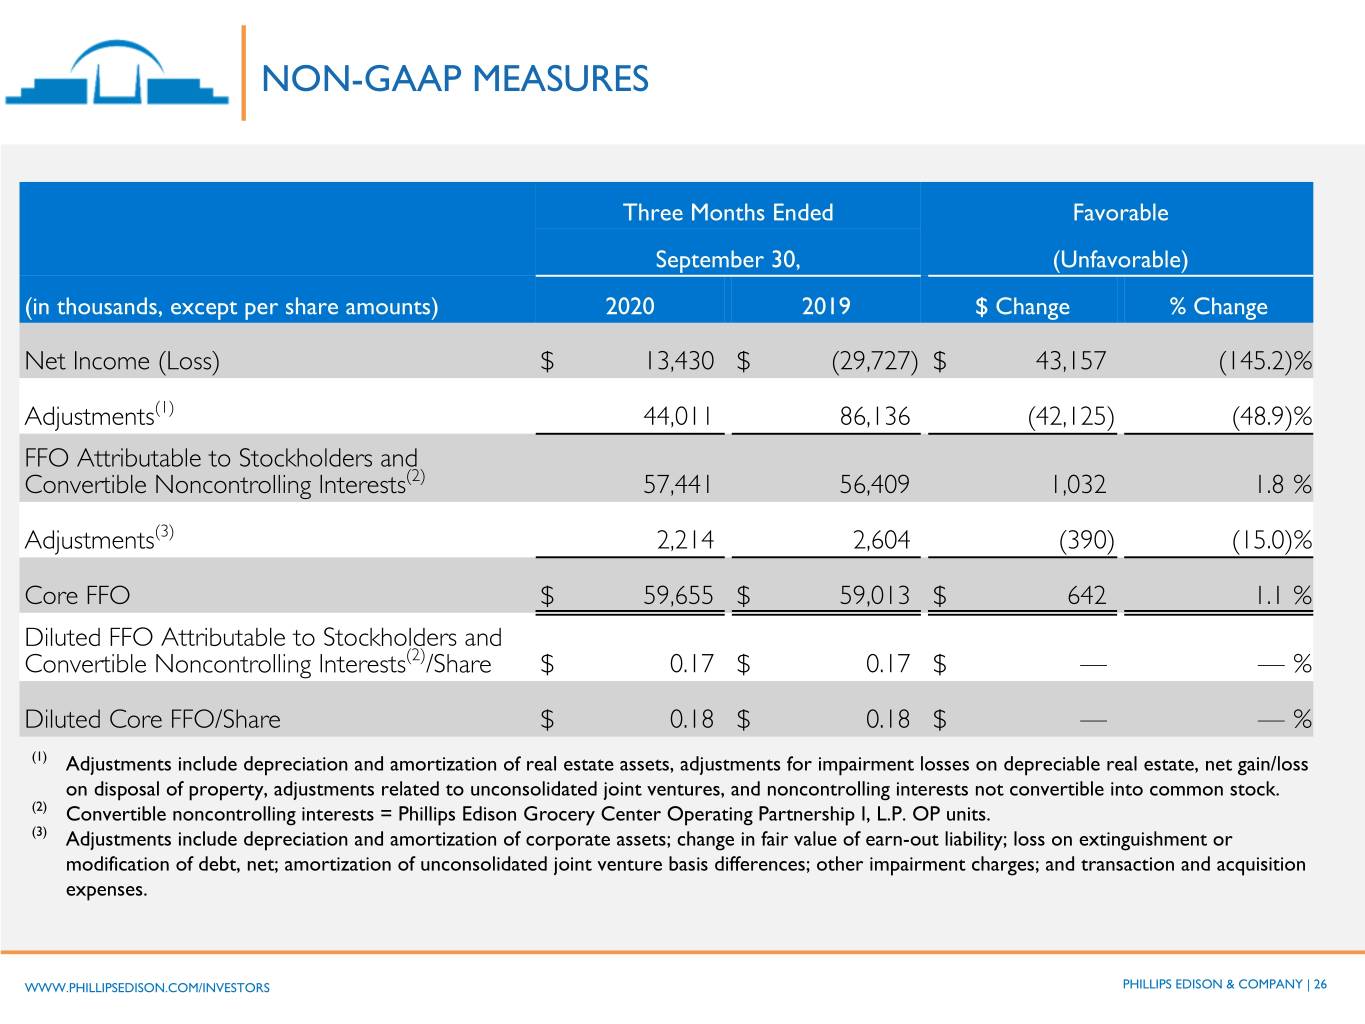
NON-GAAP MEASURES Three Months Ended Favorable September 30, (Unfavorable) (in thousands, except per share amounts) 2020 2019 $ Change % Change Net Income (Loss) $ 13,430 $ (29,727) $ 43,157 (145.2) % Adjustments(1) 44,011 86,136 (42,125) (48.9) % FFO Attributable to Stockholders and Convertible Noncontrolling Interests(2) 57,441 56,409 1,032 1.8 % Adjustments(3) 2,214 2,604 (390) (15.0) % Core FFO $ 59,655 $ 59,013 $ 642 1.1 % Diluted FFO Attributable to Stockholders and Convertible Noncontrolling Interests(2)/Share $ 0.17 $ 0.17 $ — — % Diluted Core FFO/Share $ 0.18 $ 0.18 $ — — % (1) Adjustments include depreciation and amortization of real estate assets, adjustments for impairment losses on depreciable real estate, net gain/loss on disposal of property, adjustments related to unconsolidated joint ventures, and noncontrolling interests not convertible into common stock. (2) Convertible noncontrolling interests = Phillips Edison Grocery Center Operating Partnership I, L.P. OP units. (3) Adjustments include depreciation and amortization of corporate assets; change in fair value of earn-out liability; loss on extinguishment or modification of debt, net; amortization of unconsolidated joint venture basis differences; other impairment charges; and transaction and acquisition expenses. WWW.PHILLIPSEDISON.COM/INVESTORS PHILLIPS EDISON & COMPANY | 26
NON-GAAP MEASURES Earnings Before Interest, Taxes, Depreciation, and Amortization for Real Estate (“EBITDAre”) and Adjusted EBITDAre We have included the calculation of EBITDAre to better align with publicly traded REITs. Additionally, we believe that, as another important earnings metric, it is a useful indicator of our ability to support our debt obligations. Nareit defines EBITDAre as net income (loss) computed in accordance with GAAP before (i) interest expense, (ii) income tax expense, (iii) depreciation and amortization, (iv) gains or losses from disposition of depreciable property, and (v) impairment write-downs of depreciable property. Adjustments for unconsolidated partnerships and joint ventures are calculated to reflect EBITDAre on the same basis. Adjusted EBITDAre is an additional performance measure used by us as EBITDAre includes certain non-comparable items that affect our performance over time. To arrive at Adjusted EBITDAre, we exclude certain recurring and non-recurring items from EBITDAre, including, but not limited to: (i) changes in the fair value of the earn-out liability; (ii) other impairment charges; (iii) amortization of basis differences in our investments in our unconsolidated joint ventures; and (iv) transaction and acquisition expenses. We use EBITDAre and Adjusted EBITDAre as additional measures of operating performance which allow us to compare earnings independent of capital structure, determine debt service and fixed cost coverage, and measure enterprise value. EBITDAre and Adjusted EBITDAre should not be considered as alternatives to net income (loss), as an indication of our liquidity, nor as an indication of funds available to cover our cash needs, including our ability to fund distributions. Accordingly, EBITDAre and Adjusted EBITDAre should be reviewed in connection with other GAAP measurements, and should not be viewed as more prominent measures of performance than net income (loss) or cash flows from operations prepared in accordance with GAAP. Our EBITDAre and Adjusted EBITDAre, as presented, may not be comparable to amounts calculated by other REITs. WWW.PHILLIPSEDISON.COM/INVESTORS PHILLIPS EDISON & COMPANY | 27
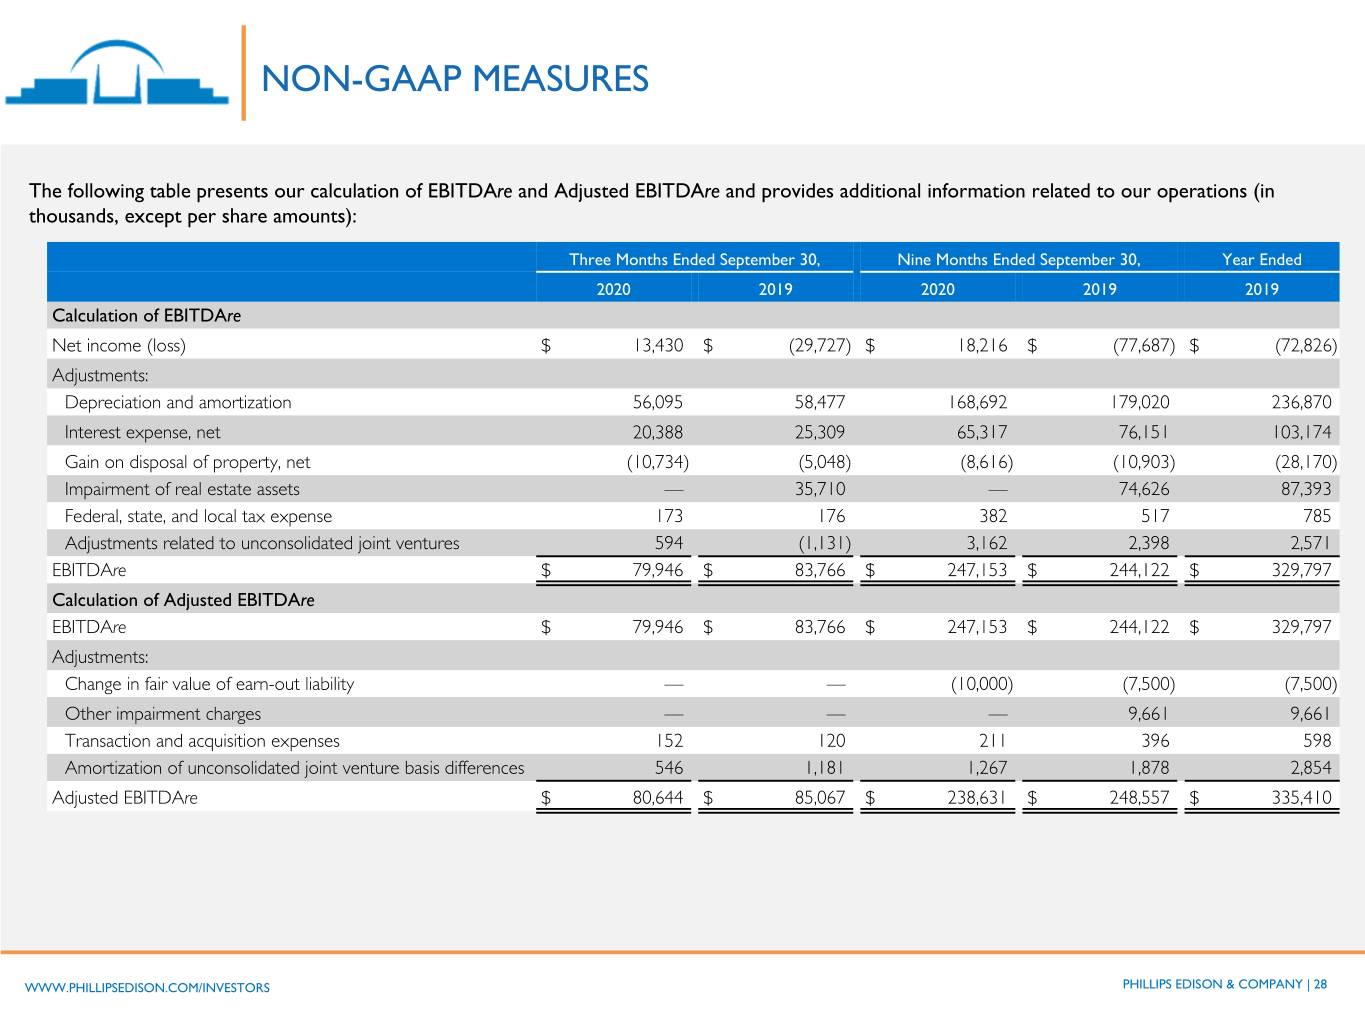
NON-GAAP MEASURES The following table presents our calculation of EBITDAre and Adjusted EBITDAre and provides additional information related to our operations (in thousands, except per share amounts): Three Months Ended September 30, Nine Months Ended September 30, Year Ended 2020 2019 2020 2019 2019 Calculation of EBITDAre Net income (loss) $ 13,430 $ (29,727) $ 18,216 $ (77,687) $ (72,826) Adjustments: Depreciation and amortization 56,095 58,477 168,692 179,020 236,870 Interest expense, net 20,388 25,309 65,317 76,151 103,174 Gain on disposal of property, net (10,734) (5,048) (8,616) (10,903) (28,170) Impairment of real estate assets — 35,710 — 74,626 87,393 Federal, state, and local tax expense 173 176 382 517 785 Adjustments related to unconsolidated joint ventures 594 (1,131) 3,162 2,398 2,571 EBITDAre $ 79,946 $ 83,766 $ 247,153 $ 244,122 $ 329,797 Calculation of Adjusted EBITDAre EBITDAre $ 79,946 $ 83,766 $ 247,153 $ 244,122 $ 329,797 Adjustments: Change in fair value of earn-out liability — — (10,000) (7,500) (7,500) Other impairment charges — — — 9,661 9,661 Transaction and acquisition expenses 152 120 211 396 598 Amortization of unconsolidated joint venture basis differences 546 1,181 1,267 1,878 2,854 Adjusted EBITDAre $ 80,644 $ 85,067 $ 238,631 $ 248,557 $ 335,410 WWW.PHILLIPSEDISON.COM/INVESTORS PHILLIPS EDISON & COMPANY | 28
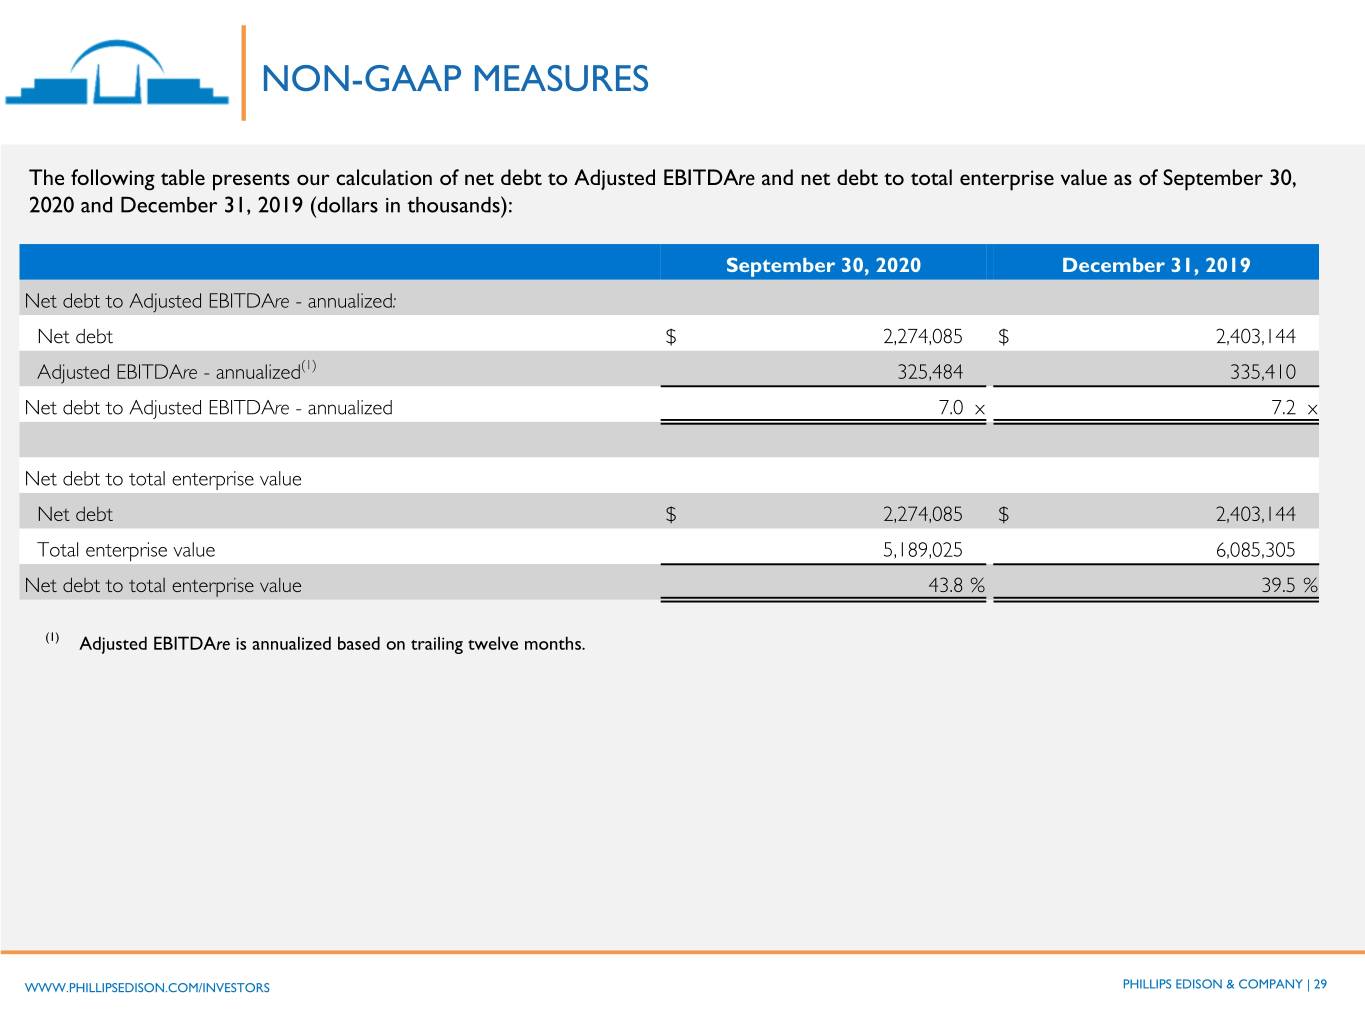
NON-GAAP MEASURES The following table presents our calculation of net debt to Adjusted EBITDAre and net debt to total enterprise value as of September 30, 2020 and December 31, 2019 (dollars in thousands): September 30, 2020 December 31, 2019 Net debt to Adjusted EBITDAre - annualized: Net debt $ 2,274,085 $ 2,403,144 Adjusted EBITDAre - annualized(1) 325,484 335,410 Net debt to Adjusted EBITDAre - annualized 7.0 x 7.2 x Net debt to total enterprise value Net debt $ 2,274,085 $ 2,403,144 Total enterprise value 5,189,025 6,085,305 Net debt to total enterprise value 43.8 % 39.5 % (1) Adjusted EBITDAre is annualized based on trailing twelve months. WWW.PHILLIPSEDISON.COM/INVESTORS PHILLIPS EDISON & COMPANY | 29
