Attached files
| file | filename |
|---|---|
| EX-99.1 - EXHIBIT 99.1 - Phillips Edison & Company, Inc. | peco_20200331-ex991.htm |
| EX-32.2 - EXHIBIT 32.2 - Phillips Edison & Company, Inc. | peco_20200331-ex322.htm |
| EX-32.1 - EXHIBIT 32.1 - Phillips Edison & Company, Inc. | peco_20200331-ex321.htm |
| EX-31.2 - EXHIBIT 31.2 - Phillips Edison & Company, Inc. | peco_20200331-ex312.htm |
| EX-31.1 - EXHIBIT 31.1 - Phillips Edison & Company, Inc. | peco_20200331-ex311.htm |
| EX-10.1 - EXHIBIT 10.1 - Phillips Edison & Company, Inc. | peco_20200331-ex101.htm |
UNITED STATES
SECURITIES AND EXCHANGE COMMISSION
Washington, D.C. 20549
FORM 10-Q
(Mark One)
þ QUARTERLY REPORT PURSUANT TO SECTION 13 OR 15(d) OF THE SECURITIES EXCHANGE ACT OF 1934
For the quarterly period ended March 31, 2020
OR
¨ TRANSITION REPORT PURSUANT TO SECTION 13 OR 15(d) OF THE SECURITIES EXCHANGE ACT OF 1934
For the transition period from to
Commission file number 000-54691

PHILLIPS EDISON & COMPANY, INC.
(Exact Name of Registrant as Specified in Its Charter)
Maryland | 27-1106076 |
(State or other jurisdiction of incorporation or organization) | (I.R.S. Employer Identification No.) |
11501 Northlake Drive Cincinnati, Ohio | 45249 |
(Address of principal executive offices) | (Zip Code) |
(513) 554-1110
(Registrant’s telephone number, including area code)
Securities registered pursuant to Section 12(b) of the Act:
Title of each class | Trading Symbol(s) | Name of each exchange on which registered | ||
None | None | None | ||
Indicate by check mark whether the registrant (1) has filed all reports required to be filed by Section 13 or 15(d) of the Securities Exchange Act of 1934 during the preceding 12 months (or for such shorter period that the registrant was required to file such reports), and (2) has been subject to such filing requirements for the past 90 days. Yes þ No ¨
Indicate by check mark whether the registrant has submitted electronically every Interactive Data File required to be submitted pursuant to Rule 405 of Regulation S-T (§232.405 of this chapter) during the preceding 12 months (or for such shorter period that the registrant was required to submit such files). Yes þ No ¨
Indicate by check mark whether the registrant is a large accelerated filer, an accelerated filer, a non-accelerated filer, a smaller reporting company, or an emerging growth company. See the definitions of “large accelerated filer,” “accelerated filer,” “smaller reporting company,” and “emerging growth company” in Rule 12b-2 of the Exchange Act.
Large accelerated filer | ¨ | Accelerated filer | ¨ |
Non-accelerated filer | þ | Smaller reporting company | ¨ |
Emerging growth company | ¨ | ||
If an emerging growth company, indicate by check mark if the registrant has elected not to use the extended transition period for complying with any new or revised financial accounting standards provided pursuant to Section 13(a) of the Exchange Act. ¨
Indicate by check mark whether the registrant is a shell company (as defined in Rule 12b-2 of the Exchange Act). Yes ¨ No þ
As of May 1, 2020, there were 290.5 million outstanding shares of common stock of the Registrant.
PHILLIPS EDISON & COMPANY, INC.
FORM 10-Q
TABLE OF CONTENTS
PART I. FINANCIAL INFORMATION | ||
ITEM 1. | ||
ITEM 2. | ||
ITEM 3. | ||
ITEM 4. | ||
PART II. OTHER INFORMATION | ||
ITEM 1. | ||
ITEM 1A. | ||
ITEM 2. | ||
ITEM 5. | ||
ITEM 6. | ||
1
w PART I FINANCIAL INFORMATION |
ITEM 1. FINANCIAL STATEMENTS
PHILLIPS EDISON & COMPANY, INC.
CONSOLIDATED BALANCE SHEETS
AS OF MARCH 31, 2020 AND DECEMBER 31, 2019
(Condensed and Unaudited)
(In thousands, except per share amounts)
March 31, 2020 | December 31, 2019 | ||||||
ASSETS | |||||||
Investment in real estate: | |||||||
Land and improvements | $ | 1,547,542 | $ | 1,552,562 | |||
Building and improvements | 3,201,552 | 3,196,762 | |||||
In-place lease assets | 441,492 | 442,729 | |||||
Above-market lease assets | 65,946 | 65,946 | |||||
Total investment in real estate assets | 5,256,532 | 5,257,999 | |||||
Accumulated depreciation and amortization | (786,328 | ) | (731,560 | ) | |||
Net investment in real estate assets | 4,470,204 | 4,526,439 | |||||
Investment in unconsolidated joint ventures | 41,904 | 42,854 | |||||
Total investment in real estate assets, net | 4,512,108 | 4,569,293 | |||||
Cash and cash equivalents | 36,532 | 17,820 | |||||
Restricted cash | 48,043 | 77,288 | |||||
Goodwill | 29,066 | 29,066 | |||||
Other assets, net | 141,263 | 128,690 | |||||
Real estate investment and other assets held for sale | — | 6,038 | |||||
Total assets | $ | 4,767,012 | $ | 4,828,195 | |||
LIABILITIES AND EQUITY | |||||||
Liabilities: | |||||||
Debt obligations, net | $ | 2,356,401 | $ | 2,354,099 | |||
Below-market lease liabilities, net | 108,998 | 112,319 | |||||
Earn-out liability | 22,000 | 32,000 | |||||
Derivative liability | 62,756 | 20,974 | |||||
Deferred income | 13,841 | 15,955 | |||||
Accounts payable and other liabilities | 109,210 | 124,054 | |||||
Total liabilities | 2,673,206 | 2,659,401 | |||||
Commitments and contingencies (Note 8) | — | — | |||||
Equity: | |||||||
Preferred stock, $0.01 par value per share, 10,000 shares authorized, zero shares issued and | |||||||
outstanding at March 31, 2020 and December 31, 2019 | — | — | |||||
Common stock, $0.01 par value per share, 1,000,000 shares authorized, 290,416 and 289,047 | |||||||
shares issued and outstanding at March 31, 2020 and December 31, 2019, respectively | 2,903 | 2,890 | |||||
Additional paid-in capital | 2,793,803 | 2,779,130 | |||||
Accumulated other comprehensive loss (“AOCI”) | (58,552 | ) | (20,762 | ) | |||
Accumulated deficit | (986,292 | ) | (947,252 | ) | |||
Total stockholders’ equity | 1,751,862 | 1,814,006 | |||||
Noncontrolling interests | 341,944 | 354,788 | |||||
Total equity | 2,093,806 | 2,168,794 | |||||
Total liabilities and equity | $ | 4,767,012 | $ | 4,828,195 | |||
See notes to consolidated financial statements.
2
PHILLIPS EDISON & COMPANY, INC.
CONSOLIDATED STATEMENTS OF OPERATIONS AND COMPREHENSIVE LOSS
FOR THE THREE MONTHS ENDED MARCH 31, 2020 AND 2019
(Condensed and Unaudited)
(In thousands, except per share amounts)
Three Months Ended March 31, | |||||||
2020 | 2019 | ||||||
Revenues: | |||||||
Rental income | $ | 128,466 | $ | 128,860 | |||
Fees and management income | 2,165 | 3,261 | |||||
Other property income | 892 | 648 | |||||
Total revenues | 131,523 | 132,769 | |||||
Operating Expenses: | |||||||
Property operating | 21,762 | 22,866 | |||||
Real estate taxes | 17,112 | 17,348 | |||||
General and administrative | 10,740 | 13,285 | |||||
Depreciation and amortization | 56,227 | 60,989 | |||||
Impairment of real estate assets | — | 13,717 | |||||
Total operating expenses | 105,841 | 128,205 | |||||
Other: | |||||||
Interest expense, net | (22,775 | ) | (25,009 | ) | |||
(Loss) gain on disposal of property, net | (1,577 | ) | 7,121 | ||||
Other income, net | 9,869 | 7,536 | |||||
Net income (loss) | 11,199 | (5,788 | ) | ||||
Net (income) loss attributable to noncontrolling interests | (1,430 | ) | 593 | ||||
Net income (loss) attributable to stockholders | $ | 9,769 | $ | (5,195 | ) | ||
Earnings per common share: | |||||||
Net income (loss) per share attributable to stockholders - basic and diluted (See Note 10) | $ | 0.03 | $ | (0.02 | ) | ||
Comprehensive loss: | |||||||
Net income (loss) | $ | 11,199 | $ | (5,788 | ) | ||
Other comprehensive loss: | |||||||
Change in unrealized value on interest rate swaps | (43,364 | ) | (14,361 | ) | |||
Comprehensive loss | (32,165 | ) | (20,149 | ) | |||
Net (income) loss attributable to noncontrolling interests | (1,430 | ) | 593 | ||||
Other comprehensive loss attributable to noncontrolling interests | 5,574 | 1,938 | |||||
Comprehensive loss attributable to stockholders | $ | (28,021 | ) | $ | (17,618 | ) | |
See notes to consolidated financial statements.
3
PHILLIPS EDISON & COMPANY, INC.
CONSOLIDATED STATEMENTS OF EQUITY
FOR THE THREE MONTHS ENDED MARCH 31, 2020 AND 2019
(Condensed and Unaudited)
(In thousands, except per share amounts)
Common Stock | Additional Paid-In Capital | AOCI | Accumulated Deficit | Total Stockholders’ Equity | Noncontrolling Interests | Total Equity | ||||||||||||||||||||||||
Shares | Amount | |||||||||||||||||||||||||||||
Balance at January 1, 2019 | 279,803 | $ | 2,798 | $ | 2,674,871 | $ | 12,362 | $ | (692,573 | ) | $ | 1,997,458 | $ | 414,911 | $ | 2,412,369 | ||||||||||||||
Dividend reinvestment plan (“DRIP”) | 1,603 | 16 | 17,702 | — | — | 17,718 | — | 17,718 | ||||||||||||||||||||||
Share repurchases | (605 | ) | (6 | ) | (6,674 | ) | — | — | (6,680 | ) | — | (6,680 | ) | |||||||||||||||||
Change in unrealized value on interest rate swaps | — | — | — | (12,423 | ) | — | (12,423 | ) | (1,938 | ) | (14,361 | ) | ||||||||||||||||||
Common distributions declared, $0.17 per share | — | — | — | — | (47,972 | ) | (47,972 | ) | — | (47,972 | ) | |||||||||||||||||||
Distributions to noncontrolling interests | — | — | — | — | — | — | (7,167 | ) | (7,167 | ) | ||||||||||||||||||||
Share-based compensation | 40 | — | 227 | — | — | 227 | 839 | 1,066 | ||||||||||||||||||||||
Conversion of noncontrolling interests | 708 | 7 | 7,820 | — | — | 7,827 | (7,827 | ) | — | |||||||||||||||||||||
Net loss | — | — | — | — | (5,195 | ) | (5,195 | ) | (593 | ) | (5,788 | ) | ||||||||||||||||||
Balance at March 31, 2019 | 281,549 | $ | 2,815 | $ | 2,693,946 | $ | (61 | ) | $ | (745,740 | ) | $ | 1,950,960 | $ | 398,225 | $ | 2,349,185 | |||||||||||||
Balance at January 1, 2020 | 289,047 | $ | 2,890 | $ | 2,779,130 | $ | (20,762 | ) | $ | (947,252 | ) | $ | 1,814,006 | $ | 354,788 | $ | 2,168,794 | |||||||||||||
DRIP | 1,436 | 14 | 15,926 | — | — | 15,940 | — | $ | 15,940 | |||||||||||||||||||||
Share repurchases | (288 | ) | (3 | ) | (2,697 | ) | — | — | (2,700 | ) | — | (2,700 | ) | |||||||||||||||||
Change in unrealized value on interest rate swaps | — | — | — | (37,790 | ) | — | (37,790 | ) | (5,574 | ) | (43,364 | ) | ||||||||||||||||||
Common distributions declared, $0.17 per share | — | — | — | — | (48,809 | ) | (48,809 | ) | — | (48,809 | ) | |||||||||||||||||||
Distributions to noncontrolling interests | — | — | — | — | — | — | (7,105 | ) | (7,105 | ) | ||||||||||||||||||||
Share-based compensation | 103 | 1 | 140 | — | — | 141 | (290 | ) | (149 | ) | ||||||||||||||||||||
Conversion of noncontrolling interests | 118 | 1 | 1,304 | — | — | 1,305 | (1,305 | ) | — | |||||||||||||||||||||
Net income | — | — | — | — | 9,769 | 9,769 | 1,430 | 11,199 | ||||||||||||||||||||||
Balance at March 31, 2020 | 290,416 | $ | 2,903 | $ | 2,793,803 | $ | (58,552 | ) | $ | (986,292 | ) | $ | 1,751,862 | $ | 341,944 | $ | 2,093,806 | |||||||||||||
See notes to consolidated financial statements.
4
PHILLIPS EDISON & COMPANY, INC.
CONSOLIDATED STATEMENTS OF CASH FLOWS
FOR THE THREE MONTHS ENDED MARCH 31, 2020 AND 2019
(Condensed and Unaudited)
(In thousands)
Three Months Ended March 31, | |||||||
2020 | 2019 | ||||||
CASH FLOWS FROM OPERATING ACTIVITIES: | |||||||
Net income (loss) | $ | 11,199 | $ | (5,788 | ) | ||
Adjustments to reconcile net income (loss) to net cash provided by operating activities: | |||||||
Depreciation and amortization of real estate assets | 54,817 | 59,342 | |||||
Impairment of real estate assets | — | 13,717 | |||||
Depreciation and amortization of corporate assets | 1,410 | 1,647 | |||||
Net amortization of above- and below-market leases | (788 | ) | (1,133 | ) | |||
Amortization of deferred financing expenses | 1,251 | 1,297 | |||||
Amortization of debt and derivative adjustments | 1,061 | 2,227 | |||||
Loss (gain) on disposal of property, net | 1,577 | (7,121 | ) | ||||
Change in fair value of earn-out liability | (10,000 | ) | (7,500 | ) | |||
Straight-line rent | (2,288 | ) | (1,713 | ) | |||
Share-based compensation | (149 | ) | 1,272 | ||||
Other | 707 | 995 | |||||
Changes in operating assets and liabilities: | |||||||
Other assets, net | (14,871 | ) | 1,923 | ||||
Accounts payable and other liabilities | (8,313 | ) | (17,921 | ) | |||
Net cash provided by operating activities | 35,613 | 41,244 | |||||
CASH FLOWS FROM INVESTING ACTIVITIES: | |||||||
Real estate acquisitions | (4,319 | ) | — | ||||
Capital expenditures | (15,965 | ) | (8,574 | ) | |||
Proceeds from sale of real estate | 17,447 | 35,755 | |||||
Return of investment in unconsolidated joint ventures | 424 | 1,197 | |||||
Net cash (used in) provided by investing activities | (2,413 | ) | 28,378 | ||||
CASH FLOWS FROM FINANCING ACTIVITIES: | |||||||
Net change in credit facility | 34,000 | (22,000 | ) | ||||
Payments on mortgages and loans payable | (32,657 | ) | (2,428 | ) | |||
Distributions paid, net of DRIP | (32,792 | ) | (30,132 | ) | |||
Distributions to noncontrolling interests | (7,108 | ) | (6,958 | ) | |||
Repurchases of common stock | (5,176 | ) | (5,444 | ) | |||
Other | — | (206 | ) | ||||
Net cash used in financing activities | (43,733 | ) | (67,168 | ) | |||
NET (DECREASE) INCREASE IN CASH, CASH EQUIVALENTS, AND RESTRICTED CASH | (10,533 | ) | 2,454 | ||||
CASH, CASH EQUIVALENTS, AND RESTRICTED CASH: | |||||||
Beginning of period | 95,108 | 84,304 | |||||
End of period | $ | 84,575 | $ | 86,758 | |||
RECONCILIATION TO CONSOLIDATED BALANCE SHEETS: | |||||||
Cash and cash equivalents | $ | 36,532 | $ | 12,684 | |||
Restricted cash | 48,043 | 74,074 | |||||
Cash, cash equivalents, and restricted cash at end of period | $ | 84,575 | $ | 86,758 | |||
5
PHILLIPS EDISON & COMPANY, INC.
CONSOLIDATED STATEMENTS OF CASH FLOWS
FOR THE THREE MONTHS ENDED MARCH 31, 2020 AND 2019
(Unaudited)
(In thousands)
2020 | 2019 | ||||||
SUPPLEMENTAL CASH FLOW DISCLOSURE, INCLUDING NON-CASH INVESTING AND FINANCING ACTIVITIES: | |||||||
Cash paid for interest | $ | 20,329 | $ | 21,679 | |||
Right-of-use (“ROU”) assets obtained in exchange for new lease liabilities | 551 | 36 | |||||
Accrued capital expenditures | 3,392 | 2,095 | |||||
Change in distributions payable | 77 | 122 | |||||
Change in distributions payable - noncontrolling interests | (3 | ) | 209 | ||||
Change in accrued share repurchase obligation | (2,476 | ) | 1,236 | ||||
Distributions reinvested | 15,940 | 17,718 | |||||
See notes to consolidated financial statements.
6
Phillips Edison & Company, Inc.
Notes to Consolidated Financial Statements
(Condensed and Unaudited)
1. ORGANIZATION |
Phillips Edison & Company, Inc. (“we,” the “Company,” “our,” or “us”) was formed as a Maryland corporation in October 2009. Substantially all of our business is conducted through Phillips Edison Grocery Center Operating Partnership I, L.P., (the “Operating Partnership”), a Delaware limited partnership formed in December 2009. We are a limited partner of the Operating Partnership, and our wholly owned subsidiary, Phillips Edison Grocery Center OP GP I LLC, is the sole general partner of the Operating Partnership.
We are a real estate investment trust (“REIT”) that invests primarily in well-occupied, grocery-anchored, neighborhood and community shopping centers that have a mix of creditworthy national, regional, and local retailers that sell necessity-based goods and services in strong demographic markets throughout the United States. In addition to managing our own shopping centers, our third-party investment management business provides comprehensive real estate and asset management services to three institutional joint ventures, in which we have a partial ownership interest, and one private fund (collectively, the “Managed Funds”).
As of March 31, 2020, we wholly-owned 285 real estate properties. Additionally, we owned a 20% equity interest in Necessity Retail Partners (“NRP”), a joint venture that owned seven properties; a 15% interest in Grocery Retail Partners I LLC (“GRP I”), a joint venture that owned 17 properties; and a 10% interest in Grocery Retail Partners II LLC (“GRP II”), a joint venture that owned three properties.
2. SUMMARY OF SIGNIFICANT ACCOUNTING POLICIES |
Set forth below is a summary of the significant accounting estimates and policies that management believes are important to the preparation of our consolidated interim financial statements. Certain of our accounting estimates are particularly important for an understanding of our financial position and results of operations and require the application of significant judgment by management. For example, significant estimates and assumptions have been made with respect to the useful lives of assets, recoverable amounts of receivables, and other fair value measurement assessments required for the preparation of the consolidated financial statements. As a result, these estimates are subject to a degree of uncertainty.
During the first quarter of 2020, a novel coronavirus (“COVID-19”) began spreading globally, with the outbreak being classified as a pandemic by the World Health Organization on March 11, 2020. Because of the adverse economic conditions that exist as a result of the impacts of the COVID-19 pandemic, it is possible that the estimates and assumptions that have been utilized in the preparation of the consolidated financial statements could change significantly. Specifically as it relates to our business, the current economic situation has resulted in temporary tenant closures at our shopping centers, often as a result of “stay-at-home” government mandates which limit travel and movement of the general public to essential activities only and require all non-essential businesses to close. These mandates could result in increased permanent retail store closings nationally if the duration of the closures is prolonged. This could reduce the demand for leasing space in our shopping centers and result in a decline in occupancy and rental revenues in our real estate portfolio. All of this activity impacts our estimates around the collectability of revenue and valuation of real estate assets, goodwill and other intangible assets, and certain liabilities, among others.
There were no changes to our significant accounting policies during the three months ended March 31, 2020. For a full summary of our accounting policies, refer to our 2019 Annual Report on Form 10-K filed with the SEC on March 11, 2020.
Basis of Presentation and Principles of Consolidation—The accompanying consolidated financial statements have been prepared in accordance with accounting principles generally accepted in the United States of America (“GAAP”) for interim financial information and with instructions to Form 10-Q and Article 10 of Regulation S-X. Accordingly, they do not include all of the information and footnotes required by GAAP for complete financial statements. Readers of this Quarterly Report on Form 10-Q should refer to our audited consolidated financial statements for the year ended December 31, 2019, which are included in our 2019 Annual Report on Form 10-K. In the opinion of management, all normal and recurring adjustments necessary for the fair presentation of the unaudited consolidated financial statements for the periods presented have been included in this Quarterly Report. Our results of operations for the three months ended March 31, 2020 are not necessarily indicative of the operating results expected for the full year.
The accompanying consolidated financial statements include our accounts and those of our majority-owned subsidiaries. All intercompany balances and transactions are eliminated upon consolidation.
Income Taxes—Our consolidated financial statements include the operations of wholly owned subsidiaries that have jointly elected to be treated as Taxable REIT Subsidiaries (“TRS”) and are subject to U.S. federal, state, and local income taxes at regular corporate tax rates. During the three months ended March 31, 2020, an immaterial amount of federal income tax benefit was reported, and we recorded a full valuation allowance for our net deferred tax asset. We recorded no income tax expense or benefit for the three months ended March 31, 2019. We recognized an immaterial amount of state and local income tax expense for the three months ended March 31, 2020 and 2019, which is included in Other Income, Net on the consolidated statements of operations and comprehensive loss (“consolidated statements of operations”).
7
Recently Issued and Newly Adopted Accounting Pronouncements—The following table provides a brief description of newly adopted accounting pronouncements and their effect on our consolidated financial statements:
Standard | Description | Date of Adoption | Effect on the Financial Statements or Other Significant Matters | |||
Accounting Standards Update (“ASU”) 2016-13, Financial Instruments - Credit Losses (Topic 326): Measurement of Credit Losses on Financial Instruments ASU 2018-19, Financial Instruments - Credit Losses (Topic 326): Codification Improvements ASU 2019-05, Financial Instruments - Credit Losses (Topic 326): Targeted Transition Relief ASU 2019-11, Codification Improvements to Topic 326, Financial Instruments - Credit Losses ASU 2020-02, Financial Instruments - Credit Losses (Topic 326) and Leases (Topic 842) | The amendments in this update replaced the incurred loss impairment methodology in current GAAP with a methodology that reflects expected credit losses and requires consideration of a broader range of reasonable and supportable information to inform credit loss estimates. It clarified that receivables arising from operating leases are not within the scope of Accounting Standards Codification (“ASC”) Topic 326. Instead, impairment of receivables arising from operating leases will be accounted for in accordance with Topic 842. It also allowed election of the fair value option on certain financial instruments. | January 1, 2020 | The adoption of this standard did not have a material impact on our consolidated financial statements. The majority of our financial instruments result from operating lease transactions, which are not within the scope of this standard. | |||
ASU 2018-17, Consolidation (Topic 810): Targeted Improvements to Related Party Guidance for Variable Interest Entities | This ASU amended two aspects of the related-party guidance in Topic 810: (1) added an elective private-company scope exception to the variable interest entity guidance for entities under common control and (2) indirect interests held through related parties in common control arrangements will be considered on a proportional basis for determining whether fees paid to decision makers and service providers are variable interests. | January 1, 2020 | The adoption of this standard did not have a material impact on our consolidated financial statements. | |||
ASU 2019-04, Codification Improvements to Topic 326, Financial Instruments—Credit Losses, Topic 815, Derivatives and Hedging, and Topic 825, Financial Instruments | This ASU amended a variety of topics, improving certain aspects of previously issued ASUs, including ASU 2016-01, Financial Instruments-Overall (Subtopic 825-10): Recognition and Measurement of Financial Assets and Financial Liabilities, ASU 2016-13, Financial Instruments-Credit Losses (Topic 326): Measurement of Credit Losses on Financial Instruments, and ASU 2017-12, Derivatives and Hedging (Topic 815): Targeted Improvements to Accounting for Hedging Activities. | January 1, 2020 | The adoption of this standard did not have a material impact on our consolidated financial statements. | |||
ASU 2020-04, Reference Rate Reform (Topic 848): Facilitation of the Effects of Reference Rate Reform on Financial Reporting | This ASU contains practical expedients for reference rate reform related activities that impact debt, leases, derivatives and other contracts. The guidance in ASU 2020-04 is optional and may be elected over time as reference rate reform activities occur. | March 12, 2020 | We have elected to apply the hedge accounting expedients related to probability and the assessments of effectiveness for future LIBOR-indexed cash flows to assume that the index upon which future hedged transactions will be based matches the index on the corresponding derivatives. Application of these expedients preserves the presentation of derivatives consistent with past presentation. We continue to evaluate the impact of the guidance and may apply other elections as applicable as additional changes in the market occur. | |||
In response to the COVID-19 pandemic, the FASB issued interpretive guidance addressing the accounting treatment of lease concessions stemming from the pandemic. Under this guidance, entities may make an election to account for lease concessions granted in conjunction with the pandemic consistent with how those concessions would be accounted for under ASC Topic 842, Leases (“ASC 842”) if those enforceable rights and obligations for those concessions already existed within the lease agreement. This accounting treatment may be applied regardless of whether enforceable rights and obligations for those concessions are explicitly outlined within the lease. As a result, entities that make this election will not have to analyze each lease to determine whether enforceable rights and obligations for concessions exist within the contract, and may elect not to account for these concessions as lease modifications within the scope of ASC 842. We will continue to assess the potential impact of this accounting treatment. As of May 11, 2020, we had not yet made any such concessions.
8
Reclassifications—The following line item on our consolidated balance sheets as of December 31, 2019 was reclassified to conform to current year presentation:
• | Corporate Intangible Assets, Net was included in Other Assets, Net. |
The following line items on our consolidated statements of cash flows for the three months ended March 31, 2019 were reclassified to conform to current year presentation:
• | Amortization of Debt and Derivative Adjustments was listed on a separate line from Other Cash Flows from Operating Activities; and |
• | Equity in Net Loss of Unconsolidated Joint Ventures was combined with Other Cash Flows from Operating Activities. |
3. LEASES |
Lessor—The majority of our leases are largely similar in that the leased asset is retail space within our properties, and the lease agreements generally contain similar provisions and features, without substantial variations. All of our leases are currently classified as operating leases. Lease income related to our operating leases was as follows for the three months ended March 31, 2020 and 2019 (dollars in thousands):
March 31, 2020 | March 31, 2019 | ||||||
Rental income related to fixed lease payments | $ | 98,335 | $ | 97,586 | |||
Rental income related to variable lease payments | 31,838 | 30,527 | |||||
Other(1) | (1,707 | ) | 747 | ||||
Total rental income | $ | 128,466 | $ | 128,860 | |||
(1) | Amounts consist of amortization of above- and below-market lease intangibles, lease inducements, revenue adjustments related to changes in collectability, settlement income, and lease buyout income. |
Approximate future fixed contractual lease payments to be received under non-cancelable operating leases in effect as of March 31, 2020, assuming no new or renegotiated leases or option extensions on lease agreements, are as follows (in thousands):
Year | Amount | ||
Remaining 2020 | $ | 281,778 | |
2021 | 341,849 | ||
2022 | 305,829 | ||
2023 | 257,200 | ||
2024 | 201,367 | ||
Thereafter | 537,322 | ||
Total | $ | 1,925,345 | |
No single tenant comprised 10% or more of our aggregate annualized base rent (“ABR”) as of March 31, 2020. As of March 31, 2020, our real estate investments in Florida and California represented 12.3% and 10.5% of our ABR, respectively. As a result, the geographic concentration of our portfolio makes it particularly susceptible to adverse weather or economic events, including the impact of the COVID-19 pandemic, in the Florida and California real estate markets. As of May 11, 2020, there were approximately 210 and 170 tenant spaces temporarily closed as a result of the COVID-19 pandemic in Florida and California, respectively.
States have issued “stay-at-home” orders that have resulted in temporary business closures but have exempted businesses providing essential goods and services from these mandatory closures. While the definition of what constitutes an essential business and related guidelines vary between different states and municipalities, as it pertains to our portfolio, we believe this generally includes grocers and supermarkets, healthcare providers and pharmacies, banks, gas stations, automotive repair shops, pet stores, laundromats, and other businesses offering goods and services that would similarly be considered critical for a functional society and life-sustaining activities. Even among those that are considered to be essential, many businesses have seen sharp decreases in foot traffic and customer patronage as a result of “stay-at-home” mandates and social distancing guidelines. State mandates have continued to evolve from the initial closures in late March, with certain states implementing “stay-at-home” orders in April, and other states beginning to ease restrictions in late April and early May. As of March 31, 2020, we believe tenants comprising approximately 51% of our portfolio’s ABR are considered essential retail businesses and services. In addition to these essential retail businesses and services, restaurants, comprising approximately 15% of our ABR, are also characterized as essential in many states and municipalities, and may remain open for takeout and delivery.
9
Lessee—Lease assets and liabilities, grouped by balance sheet line where they are recorded, consisted of the following as of March 31, 2020 and December 31, 2019 (in thousands):
Balance Sheet Information | Balance Sheet Location | March 31, 2020 | December 31, 2019 | |||||
ROU assets, net - operating leases(1) | Investment in Real Estate | $ | 3,952 | $ | 7,613 | |||
ROU assets, net - operating and finance leases | Other Assets, Net | 2,396 | 2,111 | |||||
Operating lease liability | Accounts Payable and Other Liabilities | 6,168 | 9,453 | |||||
Finance lease liability | Debt Obligations, Net | 384 | 443 | |||||
(1) | During the three months ended March 31, 2020, one of our acquisitions was land upon which one of our shopping centers is situated that was previously subject to a ground lease in which the lessor controlled an option requiring us to purchase the land subject to the lease. Our valuation of the ROU asset and lease liability as of December 31, 2019 for this ground lease reflected the assumption that the lessor would exercise this option and that we would purchase the underlying land asset. |
4. REAL ESTATE ACTIVITY |
Property Sales—The following table summarizes our real estate disposition activity (dollars in thousands):
Three Months Ended March 31, | |||||||
2020 | 2019 | ||||||
Number of properties sold(1) | 3 | 3 | |||||
Proceeds from sale of real estate | $ | 17,447 | $ | 35,755 | |||
(Loss) gain on sale of properties, net(2) | (826 | ) | 7,399 | ||||
(1) | We retained certain outparcels of land associated with one of our property dispositions during the three months ended March 31, 2020, and as a result, this property is still included in our total property count. |
(2) | The (loss) gain on sale of properties, net does not include miscellaneous write-off activity, which is also recorded in (Loss) Gain on Disposal of Property, Net on the consolidated statements of operations. |
Impairment of Real Estate Assets—During the three months ended March 31, 2020, we did not recognize any impairment charges. During the three months ended March 31, 2019, we recognized impairment charges totaling $13.7 million. The impairments were associated with certain anticipated property dispositions where the net book value exceeded the estimated fair value. Our estimated fair value was based upon the contracted price to sell or the marketed price for disposition, less estimated costs to sell. We have applied reasonable estimates and judgments in determining the amount of impairment recognized.
Acquisitions—During the three months ended March 31, 2020, we acquired two parcels of land for a total of $4.3 million, both of which are either underneath or adjacent to shopping centers that we own.
There were no acquisitions during the three months ended March 31, 2019.
10
5. OTHER ASSETS, NET |
The following is a summary of Other Assets, Net outstanding as of March 31, 2020 and December 31, 2019, excluding amounts related to assets classified as held for sale (in thousands):
March 31, 2020 | December 31, 2019 | ||||||
Other assets, net: | |||||||
Deferred leasing commissions and costs | $ | 39,667 | $ | 38,738 | |||
Deferred financing expenses | 13,971 | 13,971 | |||||
Office equipment, ROU assets, and other | 20,612 | 19,430 | |||||
Corporate intangible assets | 4,883 | 4,883 | |||||
Total depreciable and amortizable assets | 79,133 | 77,022 | |||||
Accumulated depreciation and amortization | (37,880 | ) | (35,055 | ) | |||
Net depreciable and amortizable assets | 41,253 | 41,967 | |||||
Accounts receivable, net(1) | 52,854 | 46,125 | |||||
Accounts receivable - affiliates | 972 | 728 | |||||
Deferred rent receivable, net | 31,572 | 29,291 | |||||
Derivative asset | 18 | 2,728 | |||||
Prepaid expenses and other | 14,594 | 7,851 | |||||
Total other assets, net | $ | 141,263 | $ | 128,690 | |||
(1) | Net of $6.2 million and $6.9 million of reserves for uncollectible amounts. |
6. DEBT OBLIGATIONS |
The following is a summary of the outstanding principal balances and interest rates, which include the effect of derivative financial instruments, for our debt obligations as of March 31, 2020 and December 31, 2019 (dollars in thousands):
Interest Rate(1) | March 31, 2020 | December 31, 2019 | |||||||
Revolving credit facility(2) | LIBOR + 1.4% | $ | 34,000 | $ | — | ||||
Term loans(3) | 2.01% - 4.59% | 1,622,500 | 1,652,500 | ||||||
Secured loan facilities | 3.35% - 3.52% | 395,000 | 395,000 | ||||||
Mortgages | 3.45% - 7.91% | 322,127 | 324,578 | ||||||
Finance lease liability | 384 | 443 | |||||||
Assumed market debt adjustments, net | (1,285 | ) | (1,218 | ) | |||||
Deferred financing expenses, net | (16,325 | ) | (17,204 | ) | |||||
Total | $ | 2,356,401 | $ | 2,354,099 | |||||
(1) | Interest rates are as of March 31, 2020. |
(2) | The gross borrowings and payments under our revolving credit facility were $55.0 million and $21.0 million, respectively, during the three months ended March 31, 2020. The gross borrowings and payments under our revolving credit facility were $64.0 million and $86.0 million, respectively, during the three months ended March 31, 2019. |
(3) | Our term loans carry an interest rate of LIBOR plus a spread. While most of the rates are fixed through the use of swaps, there is still a portion of these loans that is not fixed through a swap, and thus is still indexed to LIBOR. |
In January 2020, we made the final $30 million payment on our term loan maturing in 2021. Following this payment, the next term loan maturity is in April 2022.
In March 2020, we borrowed $34 million on our $500 million revolving credit facility in order to satisfy general operating needs. In April 2020, we borrowed an additional $200 million on our revolving credit facility to meet our operating needs for a sustained period due to the COVID-19 pandemic. As of May 11, 2020, total availability on our revolving credit facility, net of any letters of credit, was $254.7 million. Our debt is subject to certain covenants, and as of March 31, 2020, we were in compliance with the restrictive covenants of our outstanding debt obligations.
11
The allocation of total debt between fixed-rate and variable-rate as well as between secured and unsecured, excluding market debt adjustments and deferred financing expenses, net, as of March 31, 2020 and December 31, 2019, is summarized below (in thousands):
March 31, 2020 | December 31, 2019 | ||||||
As to interest rate:(1) | |||||||
Fixed-rate debt | $ | 1,944,511 | $ | 2,122,021 | |||
Variable-rate debt | 429,500 | 250,500 | |||||
Total | $ | 2,374,011 | $ | 2,372,521 | |||
As to collateralization: | |||||||
Unsecured debt | $ | 1,656,500 | $ | 1,652,500 | |||
Secured debt | 717,511 | 720,021 | |||||
Total | $ | 2,374,011 | $ | 2,372,521 | |||
Weighed-average interest rate(1) | 3.3 | % | 3.4 | % | |||
(1) | Includes the effects of derivative financial instruments (see Notes 7 and 12). |
7. DERIVATIVES AND HEDGING ACTIVITIES |
Risk Management Objective of Using Derivatives—We are exposed to certain risks arising from both our business operations and economic conditions. We principally manage our exposure to a wide variety of business and operational risks through management of our core business activities. We manage economic risks, including interest rate, liquidity, and credit risk, primarily by managing the amount, sources, and duration of our debt funding, and through the use of derivative financial instruments. Specifically, we enter into interest rate swaps to manage exposures that arise from business activities that result in the receipt or payment of future known and uncertain cash amounts, the value of which are determined by interest rates. Our derivative financial instruments are used to manage differences in the amount, timing, and duration of our known or expected cash receipts and our known or expected cash payments principally related to our investments and borrowings.
Cash Flow Hedges of Interest Rate Risk—Interest rate swaps designated as cash flow hedges involve the receipt of variable amounts from a counterparty in exchange for our making fixed-rate payments over the life of the agreements without exchange of the underlying notional amount.
The changes in the fair value of derivatives designated, and that qualify, as cash flow hedges are recorded in AOCI and are subsequently reclassified into earnings in the period that the hedged forecasted transaction affects earnings. During the three months ended March 31, 2020 and 2019, such derivatives were used to hedge the variable cash flows associated with certain variable-rate debt. Amounts reported in AOCI related to these derivatives will be reclassified to Interest Expense, Net as interest payments are made on the variable-rate debt. During the next twelve months, we estimate that an additional $18.7 million will be reclassified from AOCI as an increase to Interest Expense, Net.
The following is a summary of our interest rate swaps that were designated as cash flow hedges of interest rate risk as of March 31, 2020 and December 31, 2019 (notional amounts in thousands):
March 31, 2020 | December 31, 2019 | ||||||
Count | 8 | 9 | |||||
Notional amount | $ | 1,227,000 | $ | 1,402,000 | |||
Fixed LIBOR | 0.8% - 2.9% | 0.8% - 2.9% | |||||
Maturity date | 2020 - 2025 | 2020 - 2025 | |||||
The table below details the nature of the gain or loss recognized on interest rate derivatives designated as cash flow hedges in the consolidated statements of operations (in thousands):
Three Months Ended March 31, | |||||||
2020 | 2019 | ||||||
Amount of (loss) recognized in other comprehensive income on derivatives | $ | (44,916 | ) | $ | (12,857 | ) | |
Amount of loss (gain) reclassified from AOCI into interest expense | 1,552 | (1,504 | ) | ||||
Credit-risk-related Contingent Features—We have agreements with our derivative counterparties that contain provisions where, if we default, or are capable of being declared in default, on any of our indebtedness, we could also be declared to be in default on our derivative obligations. As of March 31, 2020, the fair value of our derivatives in a net liability position, which included accrued interest but excluded any adjustment for nonperformance risk related to these agreements, was approximately $62.8 million. As of March 31, 2020, we had not posted any collateral related to these agreements and were not in breach of any agreement provisions. If we had breached any of these provisions, we could have been required to settle our obligations under the agreements at their termination value of $62.8 million.
12
8. COMMITMENTS AND CONTINGENCIES |
Litigation—We are involved in various claims and litigation matters arising in the ordinary course of business, some of which involve claims for damages. Many of these matters are covered by insurance, although they may nevertheless be subject to deductibles or retentions. Although the ultimate liability for these matters cannot be determined, based upon information currently available, we believe the resolution of such claims and litigation will not have a material adverse effect on our consolidated financial statements.
Environmental Matters—In connection with the ownership and operation of real estate, we may potentially be liable for costs and damages related to environmental matters. In addition, we may own or acquire certain properties that are subject to environmental remediation. Depending on the nature of the environmental matter, the seller of the property, a tenant of the property, and/or another third party may be responsible for environmental remediation costs related to a property. Additionally, in connection with the purchase of certain properties, the respective sellers and/or tenants may agree to indemnify us against future remediation costs. We also carry environmental liability insurance on our properties that provides limited coverage for any remediation liability and/or pollution liability for third-party bodily injury and/or property damage claims for which we may be liable. We are not aware of any environmental matters which we believe are reasonably likely to have a material effect on our consolidated financial statements.
Captive Insurance—Our captive insurance company, Silver Rock Insurance, Inc. (“Silver Rock”) provides general liability insurance, wind, reinsurance, and other coverage to us and our related-party joint ventures. We capitalize Silver Rock in accordance with applicable regulatory requirements.
Silver Rock established annual premiums based on the past loss experience of the insured properties. An independent third party was engaged to perform an actuarial estimate of projected future claims, related deductibles, and projected future expenses necessary to fund associated risk management programs. Premiums paid to Silver Rock may be adjusted based on these estimates, and such premiums may be reimbursed by tenants pursuant to specific lease terms.
As of March 31, 2020, we had four cash collateralized letters of credit outstanding totaling approximately $9.7 million to provide security for our obligations under Silver Rock’s insurance and reinsurance contracts.
COVID-19—As of March 31, 2020, we were not aware of any significant liabilities or obligations to waive rent that we have incurred under force majeure or co-tenancy clauses in tenant leases.
9. EQUITY |
General—The holders of common stock are entitled to one vote per share on all matters voted on by stockholders, including one vote per nominee in the election of our board of directors (“Board”). Our charter does not provide for cumulative voting in the election of directors.
On May 6, 2020, our Board decreased the estimated value per share (“EVPS”) of our common stock to $8.75 based substantially on the estimated market value of our portfolio of real estate properties and our third-party investment management business as of March 31, 2020. The decrease was primarily driven by the negative impact of the COVID-19 pandemic on PECO’s non-grocery tenants resulting from social distancing and stay-at-home guidelines and the uncertainty of the duration and full effect on the overall economy. We engaged a third-party valuation firm to provide a calculation of the range in EVPS of our common stock as of March 31, 2020, which reflected certain balance sheet assets and liabilities as of that date. Previously, our EVPS was $11.10, based substantially on the estimated market value of our portfolio of real estate properties and our third-party investment management business as of March 31, 2019.
Shares of our common stock were issued under the DRIP, as discussed below, at the same price as the EVPS in effect at the time of issuance.
Dividend Reinvestment Plan—The DRIP allows stockholders to invest distributions in additional shares of our common stock, subject to certain limits. Stockholders who elect to participate in the DRIP may choose to invest all or a portion of their cash distributions in shares of our common stock at a price equal to our most recent EVPS.
Stockholders who elect to participate in the DRIP, and who are subject to U.S. federal income taxation laws, will incur a tax liability on an amount equal to the fair value on the relevant distribution date of the shares of our common stock purchased with reinvested distributions, even though such stockholders have elected not to receive the distributions in cash.
On March 27, 2020, the DRIP was temporarily suspended. The March 2020 distribution was paid all in cash on April 1, 2020.
Distributions—On March 27, 2020, our Board temporarily suspended stockholder distributions, effective after the payment of the March 2020 dividend on April 1, 2020 as a result of the uncertainty surrounding the COVID-19 pandemic, including the impact that the pandemic and the measures taken by governmental agencies and tenants in response to the pandemic are expected to continue to have on our shopping centers and our financial condition, liquidity sources, and capital needs.
Distributions paid entirely in cash to stockholders and OP unit holders of record subsequent to March 31, 2020 were as follows (in thousands, except distribution rate):
Month | Date of Record | Distribution Rate | Date Distribution Paid | Amount of Distribution Paid | |||||
March 2020 | 3/16/2020 | $0.05583344 | 4/1/2020 | $ | 18,541 | ||||
13
Share Repurchase Program (“SRP”)—Our SRP provides an opportunity for stockholders to have shares of common stock repurchased, subject to certain restrictions and limitations. The Board reserves the right, in its sole discretion, at any time and from time to time, to reject any request for repurchase.
On August 7, 2019, the Board suspended the SRP with respect to standard repurchases. Our SRP for death, qualifying disability, or determination of incompetence was temporarily suspended effective March 27, 2020.
Convertible Noncontrolling Interests—Under the terms of the Fourth Amended and Restated Agreement of Limited Partnership (the “Partnership Agreement”), Operating Partnership unit (“OP unit”) holders may elect to exchange OP units. The Operating Partnership controls the form of the redemption, and may elect to exchange OP units for shares of our common stock, provided that the OP units have been outstanding for at least one year, or for cash. As the form of redemption for OP units is within our control, the OP units outstanding as of March 31, 2020 and December 31, 2019 are classified as Noncontrolling Interests within permanent equity on our consolidated balance sheets. The distributions that have been paid on OP units are included in Distributions to Noncontrolling Interests on the consolidated statements of equity. During the three months ended March 31, 2020 and 2019, 0.1 million and 0.7 million OP units were converted into shares of our common stock at a 1:1 ratio, respectively. There were approximately 42.7 million OP units outstanding as of March 31, 2020 and December 31, 2019. Additionally, certain of our outstanding time- and performance-based equity awards will result in the issuance of shares or OP units upon vesting in future periods.
10. EARNINGS PER SHARE |
We use the two-class method of computing earnings per share (“EPS”), which is an earnings allocation formula that determines EPS for common stock and any participating securities according to dividends declared (whether paid or unpaid). Under the two-class method, basic EPS is computed by dividing Net Income (Loss) Attributable to Stockholders by the weighted-average number of shares of common stock outstanding for the period. Diluted EPS reflects the potential dilution that could occur from share equivalent activity.
OP units held by limited partners other than us are considered to be participating securities because they contain non-forfeitable rights to dividends or dividend equivalents, and have the potential to be exchanged for an equal number of shares of our common stock in accordance with the terms of the the Partnership Agreement.
In previous periods, we issued certain share-based awards to employees which are tied to the value of our EVPS, but that are paid in cash upon vesting. We have a small number of these awards that remain outstanding, however, they are not considered to be participating securities as they are not convertible into common stock, and as such are not included as a component of our basic or diluted EPS calculation.
The impact of outstanding OP units on basic and diluted EPS has been calculated using the two-class method whereby earnings are allocated to the OP units based on dividends declared and the OP units’ participation rights in undistributed earnings. The effects of the two-class method on basic and diluted EPS were immaterial to the consolidated financial statements as of March 31, 2020 and 2019.
The following table provides a reconciliation of the numerator and denominator of the earnings per share calculations (in thousands, except per share amounts):
Three Months Ended March 31, | |||||||
2020 | 2019 | ||||||
Numerator: | |||||||
Net income (loss) attributable to stockholders - basic | $ | 9,769 | $ | (5,195 | ) | ||
Net income (loss) attributable to convertible OP units(1) | 1,430 | (783 | ) | ||||
Net income (loss) - diluted | $ | 11,199 | $ | (5,978 | ) | ||
Denominator: | |||||||
Weighted-average shares - basic | 289,955 | 281,263 | |||||
OP units(1) | 42,848 | 43,996 | |||||
Dilutive restricted stock awards | 425 | — | |||||
Adjusted weighted-average shares - diluted | 333,228 | 325,259 | |||||
Earnings per common share: | |||||||
Basic and diluted | $ | 0.03 | $ | (0.02 | ) | ||
(1) OP units include units that are convertible into common stock or cash, at the Operating Partnership’s option. The Operating Partnership income or loss attributable to these OP units, which is included as a component of Net (Income) Loss Attributable to Noncontrolling Interests on the consolidated statements of operations, has been added back in the numerator as these OP units were included in the denominator for all years presented.
Approximately 2.6 million unvested time- and performance-based stock awards were outstanding as of March 31, 2019. These securities were anti-dilutive for the three months ended March 31, 2019, and, as a result, their impact was excluded from the weighted-average common shares used to calculate diluted EPS for that period.
14
11. REVENUE RECOGNITION AND RELATED PARTY TRANSACTIONS |
Revenue—Summarized below are amounts included in Fees and Management Income. The revenue includes the fees and reimbursements earned by us from the Managed Funds, and other revenues that are not in the scope of ASC Topic 606, Revenue from Contracts with Customers, but that are included in this table for the purpose of disclosing all related party revenues (in thousands):
Three Months Ended March 31, | |||||||
2020 | 2019 | ||||||
Recurring fees(1) | $ | 1,216 | $ | 1,582 | |||
Transactional revenue and reimbursements(2) | 430 | 1,222 | |||||
Insurance premiums(3) | 519 | 457 | |||||
Total fees and management income | $ | 2,165 | $ | 3,261 | |||
(1) | Recurring fees include asset management fees and property management fees. |
(2) | Transactional revenue includes items such as leasing commissions, construction management fees, and acquisition fees. |
(3) | Insurance premium income from other parties includes amounts from third parties not affiliated with us. |
Certain related party accounts receivable and organization and offering costs payable that were outstanding as of March 31, 2019 related to Phillips Edison Grocery Center REIT III, Inc. (“REIT III”) and were settled when we merged with REIT III in October 2019.
Other Related Party Matters—We are the limited guarantor for up to $190 million, capped at $50 million in most instances, of debt for our NRP joint venture. We are also the limited guarantor of a $175 million mortgage loan for GRP I. Our guaranty in both cases is limited to being the non-recourse carveout guarantor and the environmental indemnitor. We are also party to a separate agreement with our joint venture partner in which any potential liability under our guaranty for GRP I will be apportioned between us and our joint venture partner based on our respective ownership percentages in GRP I. We have no liability recorded on our consolidated balance sheets for either guaranty as of March 31, 2020 and December 31, 2019.
12. FAIR VALUE MEASUREMENTS |
The following describes the methods we use to estimate the fair value of our financial and nonfinancial assets and liabilities:
Cash and Cash Equivalents, Restricted Cash, Accounts Receivable, and Accounts Payable—We consider the carrying values of these financial instruments to approximate fair value because of the short period of time between origination of the instruments and their expected realization.
Real Estate Investments—The purchase prices of the investment properties, including related lease intangible assets and liabilities, were allocated at estimated fair value based on Level 3 inputs, such as discount rates, capitalization rates, comparable sales, replacement costs, income and expense growth rates, and current market rents and allowances as determined by management.
Debt Obligations—We estimate the fair value of our debt by discounting the future cash flows of each instrument at rates currently offered for similar debt instruments of comparable maturities by our lenders using Level 3 inputs. The discount rates used approximate current lending rates for loans or groups of loans with similar maturities and credit quality, assuming the debt is outstanding through maturity and considering the debt’s collateral (if applicable). We have utilized market information, as available, or present value techniques to estimate the amounts required to be disclosed.
The following is a summary of borrowings as of March 31, 2020 and December 31, 2019 (in thousands):
March 31, 2020 | December 31, 2019 | ||||||||||||||
Recorded Principal Balance(1) | Fair Value | Recorded Principal Balance(1) | Fair Value | ||||||||||||
Revolving credit facility | $ | 34,000 | 33,767 | $ | — | $ | — | ||||||||
Term loans | 1,607,464 | 1,594,503 | 1,636,470 | 1,656,765 | |||||||||||
Secured portfolio loan facilities | 390,769 | 384,068 | 390,780 | 399,054 | |||||||||||
Mortgages(2) | 324,168 | 325,219 | 326,849 | 337,614 | |||||||||||
Total | $ | 2,356,401 | $ | 2,337,557 | $ | 2,354,099 | $ | 2,393,433 | |||||||
(1) | Recorded principal balances include net deferred financing expenses of $16.3 million and $17.2 million as of March 31, 2020 and December 31, 2019, respectively. Recorded principal balances also include assumed market debt adjustments of $1.3 million and $1.2 million as of March 31, 2020 and December 31, 2019, respectively. There are deferred financing expenses related to our revolving credit facility that are in an asset position and thus are not included in these balances. |
(2) | Our finance lease liability is included in the mortgages line item, as presented. |
15
Recurring and Nonrecurring Fair Value Measurements—Our earn-out liability and interest rate swaps are measured and recognized at fair value on a recurring basis, while certain real estate assets and liabilities are measured and recognized at fair value as needed. Fair value measurements that occurred as of and during the three months ended March 31, 2020 and the year ended December 31, 2019, were as follows (in thousands):
March 31, 2020 | December 31, 2019 | ||||||||||||||||||
Level 1 | Level 2 | Level 3 | Level 1 | Level 2 | Level 3 | ||||||||||||||
Recurring | |||||||||||||||||||
Derivative assets(1) | $ | — | $ | 18 | $ | — | $ | — | $ | 2,728 | $ | — | |||||||
Derivative liability(1) | — | (62,756 | ) | — | — | (20,974 | ) | — | |||||||||||
Earn-out liability | — | — | (22,000 | ) | — | — | (32,000 | ) | |||||||||||
Nonrecurring | |||||||||||||||||||
Impaired real estate assets, net(2) | — | — | — | — | 280,593 | — | |||||||||||||
Impaired corporate intangible asset, net(3) | — | — | — | — | — | 4,401 | |||||||||||||
(1) | We record derivative assets in Other Assets, Net and derivative liabilities in Derivative Liability on our consolidated balance sheets. |
(2) | The carrying value of impaired real estate assets may have subsequently increased or decreased after the measurement date due to capital improvements, depreciation, or sale. |
(3) | The carrying value of our impaired corporate intangible asset, net, which consists of in-place management contracts, subsequently decreased after the measurement date due to amortization as well as through derecognition as part of the merger with REIT III. |
Derivative Instruments—As of March 31, 2020 and December 31, 2019, we had interest rate swaps that fixed LIBOR on portions of our unsecured term loan facilities.
All interest rate swap agreements are measured at fair value on a recurring basis. The valuation of these instruments is determined using widely accepted valuation techniques, including discounted cash flow analysis on the expected cash flows of each derivative. This analysis reflects the contractual terms of the derivatives, including the period to maturity, and uses observable market-based inputs, including interest rate curves and implied volatilities. The fair values of interest rate swaps are determined using the market standard methodology of netting the discounted future fixed cash receipts (or payments) and the discounted expected variable cash payments (or receipts). The variable cash payments (or receipts) are based on an expectation of future interest rates (forward curves) derived from observable market interest rate curves.
To comply with the provisions of ASC Topic 820, Fair Value Measurement, we incorporate credit valuation adjustments to appropriately reflect both our own nonperformance risk and the respective counterparty’s nonperformance risk in the fair value measurements. In adjusting the fair value of our derivative contracts for the effect of nonperformance risk, we have considered the impact of netting and any applicable credit enhancements, such as collateral postings, thresholds, mutual puts, and guarantees.
Although we determined that the significant inputs used to value our derivatives fell within Level 2 of the fair value hierarchy, the credit valuation adjustments associated with our counterparties and our own credit risk utilize Level 3 inputs, such as estimates of current credit spreads, to evaluate the likelihood of default by us and our counterparties. However, as of March 31, 2020 and December 31, 2019, we have assessed the significance of the impact of the credit valuation adjustments on the overall valuation of our derivative positions and have determined that the credit valuation adjustments are not significant to the overall valuation of our derivatives. As a result, we have determined that our derivative valuations in their entirety are classified in Level 2 of the fair value hierarchy.
Earn-out—As part of our acquisition of Phillips Edison Limited Partnership (“PELP”), an earn-out structure was established which gave PELP the opportunity to earn additional OP units based upon the potential achievement of certain performance targets subsequent to the acquisition. After the expiration of certain provisions in 2019, PELP is now eligible to earn up to five million OP units based on the timing and valuation of a liquidity event for PECO, which can occur no later than December 31, 2021 in order for the performance targets to be achieved per the terms of the agreement.
We estimate the fair value of this liability on a quarterly basis using the Monte Carlo method. This method requires us to make assumptions about future dividend yields, volatility, and timing and pricing of liquidity events, which are unobservable and are considered Level 3 inputs in the fair value hierarchy. A change in these inputs to a different amount might result in a significantly higher or lower fair value measurement at the reporting date. In calculating the fair value of this liability, we have determined that the most likely range of potential outcomes includes a possibility of no additional OP units issued as well as up to a maximum of five million units being issued.
Changes in the fair value of the earn-out liability have been and will continue to be recognized in earnings. The following table presents a reconciliation of the change in the earn-out liability measured at fair value on a recurring basis using Level 3 inputs and recognized as Other Income, Net in the consolidated statements of operations (in thousands):
Earn-Out Liability | |||
Balance at December 31, 2019 | $ | 32,000 | |
Change in fair value recognized in Other Income, Net | (10,000 | ) | |
Balance at March 31, 2020 | $ | 22,000 | |
Real Estate Asset Impairment—Our real estate assets are measured and recognized at fair value less costs to sell on a nonrecurring basis dependent upon when we determine an impairment has occurred. During the three months ended March 31, 2019, we impaired assets that were under contract or actively marketed for sale at a disposition price that was less
16
than carrying value, or that had other operational impairment indicators. The valuation technique used for the fair value of all impaired real estate assets was the expected net sales proceeds, which we consider to be a Level 2 input in the fair value hierarchy. We did not impair any assets during the three months ended March 31, 2020.
On a quarterly basis, we employ a multi-step approach to assess our real estate assets for possible impairment and record any impairment charges identified. The first step is the identification of potential triggering events, such as significant decreases in occupancy or the presence of large dark or vacant spaces. If we observe any of these indicators for a shopping center, we then perform an additional screen test consisting of a years-to-recover analysis to determine if we will recover the net book value of the property over its remaining economic life based upon net operating income as forecasted for the current year. In the event that the results of this first step indicate a triggering event for a center, we proceed to the second step, utilizing an undiscounted cash flow model for the center to identify potential impairment. If the undiscounted cash flows are less than the net book value of the center as of the balance sheet date, we proceed to the third step. In performing the third step, we utilize market data such as capitalization rates and sales price per square foot on comparable recent real estate transactions to estimate fair value of the real estate assets. We also utilize expected net sales proceeds to estimate the fair value of any centers that are actively being marketed for sale. If the estimated fair value of the property is less than the recorded net book value at the balance sheet date, we record an impairment charge.
In addition to these procedures, we also review undeveloped or unimproved land parcels that we own for evidence of impairment and record any impairment charges as necessary. Primary impairment triggers for these land parcels are changes to our plans or intentions with regards to such properties, or planned dispositions at prices that are less than the current carrying values.
Our quarterly impairment procedures have not been altered by the COVID-19 pandemic, as we believe key impairment indicators such as temporary store closings and large dark or vacant spaces will continue to be identified in our review. We have utilized forecasts that incorporate estimated decreases in net operating income (“NOI”) and cash flows as a result of the COVID-19 pandemic in performing our review procedures for the three months ended March 31, 2020. However, it is possible that we could experience unanticipated changes in assumptions that are employed in our impairment review which could impact our cash flows and fair value conclusions. Such unanticipated changes relative to our expectations include but are not limited to: increases or decreases in the duration or permanence of tenant closures, increases or decreases in collectability reserves and write-offs, additional capital required to fill vacancies, extended lease-up periods, future closings of large tenants, changes in macroeconomic assumptions such as rate of inflation and capitalization rates, and changes to the estimated timing of disposition of the properties under review.
We recorded the following expense upon impairment of real estate assets (in thousands):
Three Months Ended March 31, | |||||||
2020 | 2019 | ||||||
Impairment of real estate assets | $ | — | $ | 13,717 | |||
13. SUBSEQUENT EVENTS |
In preparing the condensed and unaudited consolidated financial statements, we have evaluated subsequent events through the filing of this report on Form 10-Q for recognition and/or disclosure purposes. Based on this evaluation, we have determined that there were no events that have occurred that require recognition or disclosure, other than certain events and transactions that have been disclosed elsewhere in these consolidated financial statements.
17
ITEM 2. MANAGEMENT’S DISCUSSION AND ANALYSIS OF FINANCIAL CONDITION AND RESULTS OF OPERATIONS
All references to “Notes” throughout this document refer to the footnotes to the consolidated financial statements in Part I, Item 1. Financial Statements.
Cautionary Note Regarding Forward-Looking Statements
Certain statements contained in this Quarterly Report on Form 10-Q (this “Report”) of Phillips Edison & Company, Inc. (“we,” the “Company,” “our,” or “us”) other than historical facts may be considered forward-looking statements within the meaning of Section 27A of the Securities Act of 1933, as amended (the “Securities Act”), Section 21E of the Securities Exchange Act of 1934, as amended (the “Exchange Act”), and the Private Securities Litigation Reform Act of 1995. We intend for all such forward-looking statements to be covered by the applicable safe harbor provisions for forward-looking statements contained in those Acts. Such forward-looking statements generally can be identified by the use of forward-looking terminology such as “may,” “will,” “expect,” “intend,” “anticipate,” “estimate,” “believe,” “continue,” “possible,” “initiatives,” “focus,” “seek,” “objective,” “goal,” “strategy,” “plan,” “potential,” “potentially,” “preparing,” “projected,” “future,” “long-term,” “once,” “should,” “could,” “would,” “might,” “uncertainty,” or other similar words. Readers are cautioned not to place undue reliance on these forward-looking statements, which speak only as of the date this report is filed with the U.S. Securities and Exchange Commission (“SEC”). Such statements include, but are not limited to, statements about our focus, plans, strategies, initiatives, and prospects; statements about the global pandemic of a novel coronavirus (“COVID-19”), including its duration and potential or expected impact on our tenants, our business, and our estimated value per share; statements about our estimated value per share and when it may be updated; statements about the duration or extent of the suspension of our distributions, share repurchase program, and dividend reinvestment program; and statements about our future results of operations, capital expenditures, and liquidity. Such statements are subject to known and unknown risks and uncertainties, which could cause actual results to differ materially from those projected or anticipated, including, without limitation, (i) changes in national, regional, or local economic climates; (ii) local market conditions, including an oversupply of space in, or a reduction in demand for, properties similar to those in our portfolio; (iii) vacancies, changes in market rental rates, and the need to periodically repair, renovate, and re-let space; (iv) changes in interest rates and the availability of permanent mortgage financing; (v) competition from other available properties and the attractiveness of properties in our portfolio to our tenants; (vi) the financial stability of tenants, including the ability of tenants to pay rent; (vii) changes in tax, real estate, environmental, and zoning laws; (viii) the concentration of our portfolio in a limited number of industries, geographies, or investments; (ix) the effects of the COVID-19 pandemic, including on the demand for consumer goods and services and levels of consumer confidence in the safety of visiting shopping centers as a result of the COVID-19 pandemic; (x) the measures taken by federal, state, and local government agencies and tenants in response to the COVID-19 pandemic, including mandatory business shutdowns, stay-at-home orders and social distancing guidelines; (xi) the impact of the COVID-19 pandemic on our tenants and their ability to pay rent on time or at all, or to renew their leases and, in the case of non-renewal, our ability to re-lease the space at the same or more favorable terms or at all; (xii) the length and severity of the COVID-19 pandemic in the United States; (xiii) the pace of recovery following the COVID-19 pandemic given the current severe economic contraction and increase in unemployment rates; (xiv) our ability to implement cost containment strategies; (xv) our and our tenants’ ability to obtain loans under the CARES Act or similar state programs; (xvi) our ability to pay down, refinance, restructure, or extend our indebtedness as it becomes due; (xvii) to the extent we were seeking to dispose of properties in the near term, significantly greater uncertainty regarding our ability to do so at attractive prices; (xviii) the impact of the COVID-19 pandemic on our business, results of operations, financial condition, and liquidity; and (xix) supply chain disruptions due to the COVID-19 pandemic. Additional important factors that could cause actual results to differ are described in the filings made from time to time by the Company with the SEC and include the risk factors and other risks and uncertainties described in our 2019 Annual Report on Form 10-K, filed with the SEC on March 11, 2020, and those included in this Report, in each case as updated from time to time in our periodic and/or current reports filed with the SEC, which are accessible on the SEC’s website at www.sec.gov.
Except as required by law, we do not undertake any obligation to update or revise any forward-looking statement, whether as a result of new information, future events, or otherwise.
Overview
We are an internally-managed REIT and one of the nation’s largest owners and operators of grocery-anchored shopping centers. The majority of our revenue is lease revenue derived from our real estate investments. Additionally, we operate an investment management business providing property management and advisory services to approximately $570 million of third-party assets. This business provides comprehensive real estate and asset management services to the Managed Funds.
During the first quarter of 2020, the COVID-19 pandemic began spreading globally, with the outbreak being classified as a pandemic by the World Health Organization on March 11, 2020. We began preparing for the effects of the COVID-19 pandemic on our business as well as the economic climate as a whole. Our employees are almost entirely working remotely to help combat the spread of the virus, while also allowing us to be as productive as possible during this time. Some of our initiatives to respond to the ongoing pandemic are:
• | We temporarily suspended stockholder distributions (see Note 9 for more detail); |
• | We temporarily suspended the SRP for death, qualifying disability, or determination of incompetence, while our standard SRP remains suspended; |
• | Our Compensation Committee approved a temporary 25% reduction to the base salary of our chief executive officer; a temporary 10% reduction to the base salaries of our president, chief operating officer, chief financial officer, and general counsel; and a 10% reduction to board members’ base compensation for the 2020-2021 term; |
18
• | We have implemented expense reductions at the property and corporate levels, including the temporary reductions in executive salaries and director compensation, and workforce reductions; |
• | We are delaying capital projects to the extent possible; and |
• | We have borrowed $200 million on our revolving credit facility to ensure that we are able to meet our operating needs for a sustained period. |
As a result of the pandemic, many state governments have issued “stay-at-home” mandates that generally limit travel and movement of the general public to essential activities only and require all non-essential businesses to close. The impact these measures are having on our portfolio has evolved since March 31, 2020 and will continue to do so. Our wholly-owned properties and those owned through our joint ventures contained approximately 5,550 tenant spaces as of May 11, 2020. The following statistics are related to our wholly-owned properties and those owned through our joint ventures as of May 11, 2020 (all statistics are approximate; ABR, GLA, and rent include the prorated portion attributable to properties owned through our joint ventures):
• | 30% of all tenant spaces, totaling 21% of our ABR and 16% of our GLA, remained temporarily closed |
• | Temporary closures include 7% of tenant spaces that we believe are considered to be essential retail and service businesses, totaling 3% of the ABR and 2% of the GLA associated with all essential retail and service businesses; even though they are generally exempted from “stay-at-home” mandates, some essential businesses have temporarily closed due to sharp decreases in foot traffic and customer patronage as a result of these mandates and social distancing guidelines |
• | Received 2,120 rent relief requests from tenant spaces representing 29% of our ABR, all of which are still being evaluated |
• | Collected 77% of rent and recoveries billed for April 2020 and 74% of rent and recoveries billed for the month of May |
We believe substantially all tenants, including those that have been deemed non-essential businesses, are contractually obligated to continue with their rent payments as documented in our lease agreements with them. The Coronavirus Aid, Relief, and Economic Security Act, including the Paycheck Protection Program and Health Care Enhancement Act (collectively, the “CARES Act”), is intended to provide economic relief and stimulus to taxpayers and businesses in order to mitigate the economic impact of the pandemic, and provides an estimated $2.7 trillion to combat the COVID-19 pandemic and stimulate the economy through the provision of government loans and grants to affected individuals and businesses. We have begun working directly with our tenants to inform them of the benefits available through the CARES Act and other small business programs. We have created a resource page on our website to assist in these information efforts.
Portfolio and Leasing Statistics—Below are statistical highlights of our wholly-owned portfolio:
March 31, 2020 | ||
Number of properties | 285 | |
Number of states | 31 | |
Total square feet (in thousands) | 31,862 | |
Leased % of rentable square feet | 95.6 | % |
Average remaining lease term (in years)(1) | 4.6 | |
% ABR from grocery-anchored properties | 97.0 | % |
(1) | The average remaining lease term in years excludes future options to extend the term of the lease. |
The following table details information for our joint ventures, which is the basis for determining the prorated information included in the subsequent tables as of March 31, 2020 (dollars and square feet in thousands):
March 31, 2020 | ||||||||||
Joint Venture | Ownership Percentage | Number of Properties | ABR(1) | GLA(2) | ||||||
Necessity Retail Partners | 20% | 7 | $ | 11,933 | 851 | |||||
Grocery Retail Partners I | 15% | 17 | 24,462 | 1,909 | ||||||
Grocery Retail Partners II | 10% | 3 | 3,840 | 312 | ||||||
(1) | We calculate ABR as monthly contractual rent as of March 31, 2020, multiplied by 12 months. |
(2) | Gross leasable area (“GLA”) is defined as the portion of the total square feet of a building that is available for tenant leasing. |
19
Lease Expirations—The following chart shows, on an aggregate basis, all of the scheduled lease expirations after March 31, 2020 for each of the next ten years and thereafter for our wholly-owned properties and the prorated portion of those owned through our joint ventures:
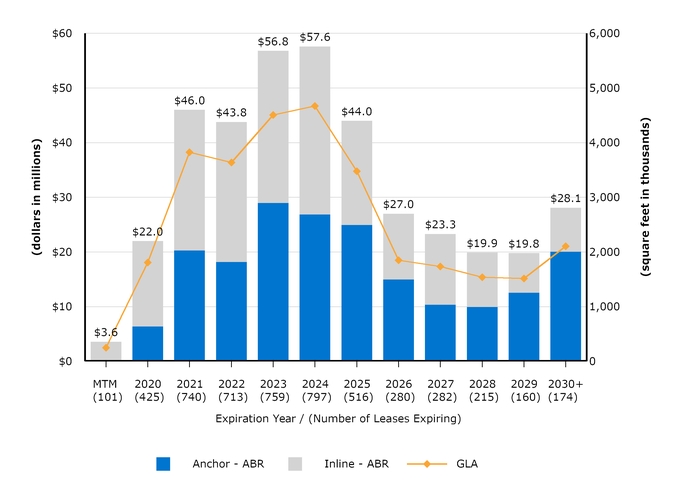
Our ability to create rental rate growth generally depends on our leverage during new and renewal lease negotiations with prospective and existing tenants, which typically occurs when occupancy at our centers is high or during periods of economic growth and recovery. Conversely, we may experience rental rate decline when occupancy at our centers is low or during periods of economic recession, as the leverage during new and renewal lease negotiations may shift to prospective and existing tenants.
We continued to meet or exceed average rental rates on expiring leases during the first quarter of 2020 and our leased occupancy remained high as of March 31, 2020 at 95.6%; however, due to the impact of the COVID-19 pandemic, a large number of our tenant spaces have temporarily closed. Most of our grocery tenants remain open and continue to service their customers during this pandemic; however, many other tenants are either not currently operating or have significantly reduced sales due to government-mandated social distancing and “stay-at-home” guidelines. We expect increased volatility in new and renewal rental rates until the business environment becomes more stable.
For our wholly-owned properties and the prorated share of those owned through our joint ventures, subsequent to March 31, 2020, we renewed approximately 0.3 million total square feet and $2.6 million of total ABR of future expiring leases. This includes four anchor leases that were renewed pursuant to the exercise of an option to extend the lease.
See the section below titled Management’s Discussion and Analysis of Financial Condition and Results of Operations - Results of Operations - Leasing Activity for further discussion of leasing activity.
20
Portfolio Tenancy—We define national tenants as those tenants that operate in at least three states. Regional tenants are defined as those tenants that have at least three locations in fewer than three states. The following charts present the composition of our portfolio, including our wholly-owned properties and the prorated portion of those owned through our joint ventures, by tenant type as of March 31, 2020:
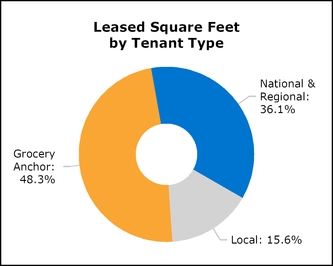
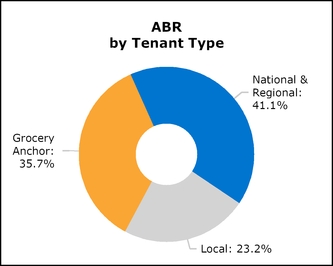
The following charts present the composition of our portfolio by tenant industry as of March 31, 2020:
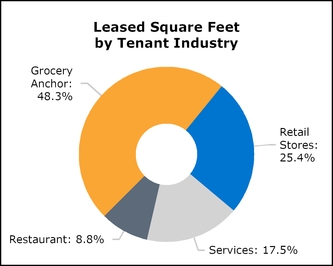
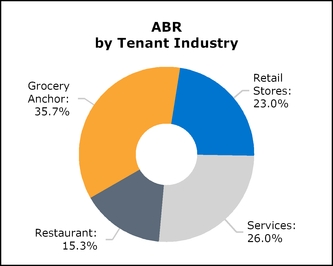
21
In response to the COVID-19 pandemic, as of May 11, 2020, 15 states have state-wide “stay-at-home” mandates in place and 26 states have partial mandates in place, with 4 states that we expect to begin lifting mandates in the coming weeks. We estimate that approximately 51.1% of our ABR, including the pro rata portion attributable to our properties owned through our joint ventures, is from retail and service businesses generally deemed essential under most state and local mandates as of March 31, 2020:
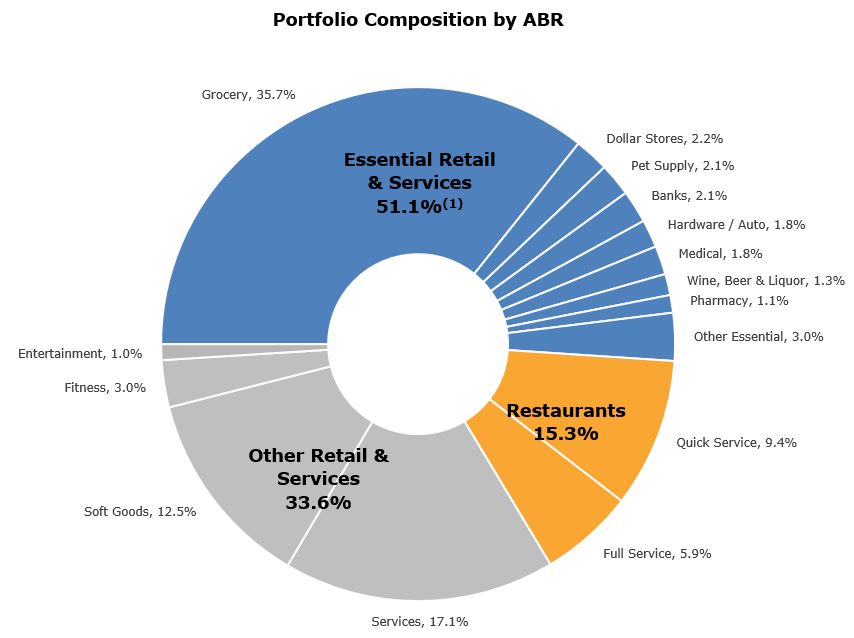
(1) | Includes tenants that we believe are considered to be essential retail and service businesses but that may have temporarily closed due to sharp decreases in foot traffic and customer patronage as a result of “stay-at-home” mandates and social distancing guidelines. |
22
The following table presents our top twenty tenants by ABR, including our wholly-owned properties and the prorated portion of those owned through our joint ventures, as of March 31, 2020 (dollars and square feet in thousands):
March 31, 2020 | |||||||||||||||
Tenant(1) | ABR | % of ABR | Leased Square Feet | % of Leased Square Feet | Number of Locations(2) | ||||||||||
Kroger | $ | 26,877 | 6.9 | % | 3,466 | 11.2 | % | 66 | |||||||
Publix | 22,019 | 5.6 | % | 2,241 | 7.3 | % | 56 | ||||||||
Ahold Delhaize | 17,496 | 4.5 | % | 1,278 | 4.1 | % | 25 | ||||||||
Albertsons-Safeway | 16,674 | 4.3 | % | 1,629 | 5.3 | % | 31 | ||||||||
Walmart | 8,933 | 2.3 | % | 1,770 | 5.7 | % | 13 | ||||||||
Giant Eagle | 8,085 | 2.1 | % | 823 | 2.7 | % | 12 | ||||||||
TJX Companies | 4,968 | 1.3 | % | 428 | 1.4 | % | 15 | ||||||||
Sprouts Farmers Market | 4,885 | 1.2 | % | 334 | 1.1 | % | 11 | ||||||||
Dollar Tree | 4,194 | 1.1 | % | 445 | 1.4 | % | 45 | ||||||||
Raley's | 3,798 | 1.0 | % | 253 | 0.8 | % | 4 | ||||||||
SUPERVALU | 3,480 | 0.9 | % | 386 | 1.2 | % | 8 | ||||||||
Subway Group | 3,077 | 0.8 | % | 127 | 0.4 | % | 92 | ||||||||
Schnuck's | 2,993 | 0.8 | % | 329 | 1.1 | % | 5 | ||||||||
Save Mart | 2,619 | 0.7 | % | 309 | 1.0 | % | 6 | ||||||||
Southeastern Grocers | 2,599 | 0.7 | % | 291 | 0.9 | % | 8 | ||||||||
Anytime Fitness, Inc. | 2,581 | 0.7 | % | 173 | 0.6 | % | 37 | ||||||||
Lowe's | 2,407 | 0.6 | % | 371 | 1.2 | % | 4 | ||||||||
Kohl's Corporation | 2,255 | 0.6 | % | 365 | 1.2 | % | 4 | ||||||||
Food 4 Less (PAQ) | 2,215 | 0.6 | % | 118 | 0.4 | % | 2 | ||||||||
Petco Animal Supplies, Inc. | 2,099 | 0.5 | % | 127 | 0.4 | % | 11 | ||||||||
$ | 144,254 | 37.2 | % | 15,263 | 49.4 | % | 455 | ||||||||
(1) | Tenants are grouped by parent company and may represent multiple subsidiaries and banners. |
(2) | Number of locations excludes auxiliary leases with grocery anchors such as fuel stations, pharmacies, and liquor stores. Additionally, in the event that a parent company has multiple subsidiaries or banners serving as tenants in a single shopping center, those subsidiaries are included as one location. |
Of our top 20 tenants, TJX Companies and Kohl’s Corporation had announced the temporary closure of all their stores nationwide as of March 31, 2020. As of May 11, certain TJX Companies and Kohl’s Corporation store locations have begun to reopen. While no other top 20 tenants have announced company-wide closures, certain locations may be closed due to specific state regulations. We are not aware, at this time, of the bankruptcy or permanent closure of any of the top 20 tenants in our shopping centers. No tenant represents more than 6.9% of our ABR on a pro-rata basis.
23
Results of Operations
Impact of the COVID-19 Pandemic
The COVID-19 pandemic did not significantly affect our results of operations for the first quarter of 2020, with the exception of certain items noted in our discussion of results below. However, the negative impact on our results of operations in the second quarter of 2020 and future quarters could be significant, depending on a number of factors outside of our control, including the duration and severity of the pandemic; the nature and duration of “stay-at-home” mandates and business shut-downs as well as physical and social distancing guidelines and recommendations from governmental authorities; the nature and effectiveness of any economic stimulus or relief measures, including the CARES Act; overall economic conditions on both a macro and micro level, including consumer demand as well as retailer demand for space within our shopping centers; and the impact of all of the factors above, including other potentially unknown factors, on our tenants’ ability to continue paying rent and related charges on time or at all and tenants’ willingness to renew their leases on the same terms or at all.
The potential impact of the COVID-19 pandemic to our second quarter results may be significant and may include reduced revenue from tenant concessions, increased collectability reserves, decreased recovery rates on expenses, and other unforeseen impacts that may arise in the course of operating during these circumstances. See Item 2. Management’s Discussion and Analysis of Financial Condition and Results of Operations - Overview for our observation of certain of these factors through May 11, 2020. The duration of the pandemic and mitigating measures, and their economic impact, may cause some of our current tenants to permanently vacate their spaces and/or not renew their leases, and we may have difficulty leasing these spaces on the same or better terms or at all, and/or incur additional costs to lease the space. Extended periods of vacancy or reduced revenues could also trigger impairments of our real estate assets. Moreover, we anticipate a reduction in our disposition and acquisition activity, as well as potential joint venture activities, during the second quarter and potentially for the remainder of 2020. Conversely, the disruption to our workforce upon the emergence of the COVID-19 pandemic has been and is expected to be minimal as the nature of our operations, coupled with our IT infrastructure, allows our employees to successfully work remotely.
We believe that our investment focus on grocery-anchored shopping centers that provide daily necessities will help lessen the negative effect of the pandemic on our business compared to non-grocery anchored retail shopping centers. We are closely monitoring the occupancy, operating performance, and tenants’ sales in our centers, including those tenants operating with reduced hours or under government-imposed restrictions. We are also taking action to maximize our financial flexibility by implementing expense reductions at the property and corporate level, delaying capital projects to the extent possible, drawing on our revolving credit facility, and temporarily suspending monthly distributions and share repurchases for death, disability, or determination of incompetence.
Summary of Operating Activities
Three Months Ended March 31, | Favorable (Unfavorable) Change | ||||||||||||||
(Dollars in thousands) | 2020 | 2019 | $ | % | |||||||||||
Revenues: | |||||||||||||||
Rental income | $ | 128,466 | $ | 128,860 | $ | (394 | ) | (0.3 | )% | ||||||
Fee and management income | 2,165 | 3,261 | (1,096 | ) | (33.6 | )% | |||||||||
Other property income | 892 | 648 | 244 | 37.7 | % | ||||||||||
Operating Expenses: | |||||||||||||||
Property operating expenses | (21,762 | ) | (22,866 | ) | 1,104 | 4.8 | % | ||||||||
Real estate tax expenses | (17,112 | ) | (17,348 | ) | 236 | 1.4 | % | ||||||||
General and administrative expenses | (10,740 | ) | (13,285 | ) | 2,545 | 19.2 | % | ||||||||
Depreciation and amortization | (56,227 | ) | (60,989 | ) | 4,762 | 7.8 | % | ||||||||
Impairment of real estate assets | — | (13,717 | ) | 13,717 | NM | ||||||||||
Other: | |||||||||||||||
Interest expense, net | (22,775 | ) | (25,009 | ) | 2,234 | 8.9 | % | ||||||||
(Loss) gain on disposal of property, net | (1,577 | ) | 7,121 | (8,698 | ) | (122.1 | )% | ||||||||
Other income, net | 9,869 | 7,536 | 2,333 | 31.0 | % | ||||||||||
Net income (loss) | 11,199 | (5,788 | ) | 16,987 | NM | ||||||||||
Net (income) loss attributable to noncontrolling interests | (1,430 | ) | 593 | (2,023 | ) | NM | |||||||||
Net income (loss) attributable to stockholders | $ | 9,769 | $ | (5,195 | ) | $ | 14,964 | NM | |||||||
Our basis for analyzing significant fluctuations in our results of operations generally includes review of the results of our same-center portfolio, non-same-center portfolio, and revenues and expenses from our management activities. We define our same-center portfolio as the 279 properties that were owned and operational prior to January 1, 2019. We define our non-same-center portfolio as those properties that were not fully owned and operational in both periods owing to real estate asset activity occurring after December 31, 2018, which includes 24 properties disposed of and five properties acquired. Below are explanations of the significant fluctuations in the results of operations for the three months ended March 31, 2020 and 2019:
24
Rental Income decreased $0.4 million as follows:
• | $3.4 million decrease related to our non-same-center portfolio, namely our net disposition of 19 properties; and |
• | $3.0 million increase related to our same-center portfolio primarily as follows: |
▪ | $2.3 million increase in rental revenues primarily due to a $0.23 increase in average minimum rent per square foot and a 1.7% increase in average occupancy; |
▪ | $2.1 million increase in recovery income largely as a result of higher recoverable real estate taxes and insurance expenses; |
▪ | $0.6 million increase in temporary and variable rent as well as non-cash adjustments; partially offset by |
▪ | $2.1 million decrease due to higher adjustments for tenants that have been identified as a credit risk, including as a result of the COVID-19 pandemic. |
Fee and Management Income:
• | The $1.1 million decrease in fee and management income is primarily due to fees no longer received from REIT III following its acquisition by us in October 2019. |
Property Operating Expenses decreased $1.1 million primarily as follows:
• | $0.8 million decrease related to our net disposition of 19 properties; and |
• | $0.3 million decrease related to our same-center portfolio and corporate operating activities. |
General and Administrative Expenses:
• | The $2.5 million decrease in general and administrative expenses was primarily due to a decrease in estimated performance-based compensation, including adjustments made as a result of the COVID-19 pandemic. |
Depreciation and Amortization decreased $4.8 million primarily as follows:
• | $2.2 million decrease related to our net disposition of 19 properties; and |
• | $1.8 million decrease related to our same-center portfolio, primarily due to intangible lease assets becoming fully amortized by December 31, 2019. |
Impairment of Real Estate Assets:
• | The decrease in impairment of real estate assets of $13.7 million was primarily due to less disposition activity. Our impairments during the three months ended March 31, 2019 were related to assets under contract or actively marketed for sale at a disposition price that was less than the carrying value, the proceeds from which were or will be used to fund tax-efficient acquisitions, to fund redevelopment opportunities in owned centers, and for general corporate purposes. We continue to sell non-core assets and may potentially recognize impairments in future quarters, but such disposition activity will likely be delayed or reduced due to current market conditions as a result of the COVID-19 pandemic. |
Interest Expense, Net:
• | The $2.2 million decrease was largely due to repricing activities executed during 2019. Interest Expense, Net was comprised of the following (dollars in thousands): |
Three Months Ended March 31, | |||||||
2020 | 2019 | ||||||
Interest on revolving credit facility, net | $ | 216 | $ | 855 | |||
Interest on term loans, net | 12,731 | 14,853 | |||||
Interest on secured debt | 7,350 | 5,771 | |||||
Non-cash amortization and other | 2,478 | 3,530 | |||||
Interest expense, net | $ | 22,775 | $ | 25,009 | |||
Weighted-average interest rate as of end of period | 3.3 | % | 3.5 | % | |||
Weighted-average term (in years) as of end of period | 4.7 | 4.8 | |||||
(Loss) Gain on Disposal of Property, Net:
• | The $8.7 million decrease was primarily related to the sale of three properties with a net loss and associated write-offs of $1.6 million during the three months ended March 31, 2020, as compared to the sale of three properties with a net gain of $7.1 million during the three months ended March 31, 2019 (see Note 4). |
25
Other Income, Net:
• | The $2.3 million increase was largely due to the change in the fair value of our earn-out liability during the three months ended March 31, 2020 as compared to the same period in 2019. Other Income, Net was comprised of the following (dollars in thousands): |
Three Months Ended March 31, | |||||||
2020 | 2019 | ||||||
Change in fair value of earn-out liability | $ | 10,000 | $ | 7,500 | |||
Equity in loss of unconsolidated joint ventures | (280 | ) | (456 | ) | |||
Transaction and acquisition expenses | (45 | ) | (88 | ) | |||
Federal, state, and local income tax expense | (29 | ) | — | ||||
Other | 223 | 580 | |||||
Other income, net | $ | 9,869 | $ | 7,536 | |||
Leasing Activity—The average rent per square foot and cost of executing leases fluctuates based on the tenant mix, size of the leased space, and lease term. Leases with national and regional tenants generally require a higher cost per square foot to execute than those with local tenants. However, generally such national and regional tenants will also pay higher rates for a longer term.
Below is a summary of leasing activity for our wholly-owned properties for the three months ended March 31, 2020 and 2019:
Total Deals(1) | Inline Deals(1)(2) | |||||||||||||||
2020 | 2019 | 2020 | 2019 | |||||||||||||
New leases: | ||||||||||||||||
Number of leases | 87 | 107 | 77 | 103 | ||||||||||||
Square footage (in thousands) | 382 | 323 | 180 | 252 | ||||||||||||
ABR (in thousands) | $ | 5,563 | $ | 4,878 | $ | 3,214 | $ | 4,167 | ||||||||
ABR per square foot | $ | 14.56 | $ | 15.08 | $ | 17.84 | $ | 16.54 | ||||||||
Cost per square foot of executing new leases(3) | $ | 22.03 | $ | 27.61 | $ | 27.94 | $ | 27.95 | ||||||||
Number of comparable leases(4) | 25 | 40 | 25 | 38 | ||||||||||||
Comparable rent spread(5) | 6.8 | % | 17.2 | % | 6.8 | % | 14.9 | % | ||||||||
Weighted average lease term (in years) | 9.1 | 7.1 | 6.6 | 6.5 | ||||||||||||
Renewals and options: | ||||||||||||||||
Number of leases | 127 | 163 | 113 | 152 | ||||||||||||
Square footage (in thousands) | 739 | 688 | 249 | 326 | ||||||||||||
ABR (in thousands) | $ | 9,720 | $ | 10,550 | $ | 5,364 | $ | 7,106 | ||||||||
ABR per square foot | $ | 13.15 | $ | 15.34 | $ | 21.53 | $ | 21.80 | ||||||||
ABR per square foot prior to renewals | $ | 12.33 | $ | 14.15 | $ | 19.18 | $ | 19.32 | ||||||||
Percentage increase in ABR per square foot | 6.7 | % | 8.4 | % | 12.2 | % | 12.8 | % | ||||||||
Cost per square foot of executing renewals and options | $ | 3.41 | $ | 3.25 | $ | 4.36 | $ | 5.05 | ||||||||
Number of comparable leases(4) | 89 | 130 | 86 | 127 | ||||||||||||
Comparable rent spread(5) | 11.2 | % | 12.3 | % | 14.4 | % | 13.6 | % | ||||||||
Weighted average lease term (in years) | 4.7 | 4.8 | 4.0 | 4.7 | ||||||||||||
Portfolio retention rate(6) | 71.2 | % | 84.4 | % | 67.3 | % | 80.8 | % | ||||||||
(1) | Per square foot amounts may not recalculate exactly based on other amounts presented within the table due to rounding. |
(2) | We consider an inline deal to be a lease for less than 10,000 square feet of GLA. |
(3) | The cost of executing new leases, renewals, and options includes leasing commissions, tenant improvement costs, landlord work, and tenant concessions. The costs associated with landlord work are excluded for repositioning and redevelopment projects, if any. |
(4) | A comparable lease is a lease that is executed for the exact same space (location and square feet) in which a tenant was previously located. For a lease to be considered comparable, it must have been executed within 365 days from the earlier of legal possession or the day the prior tenant physically vacated the space. |
(5) | The comparable rent spread compares the percentage increase (or decrease) of new or renewal leases (excluding options) to the expiring lease of a unit that was occupied within the past twelve months. |
(6) | The portfolio retention rate is calculated by dividing (a) total square feet of retained tenants with current period lease expirations by (b) the square feet of leases expiring during the period. |
26
Non-GAAP Measures
Same-Center Net Operating Income—We present Same-Center NOI as a supplemental measure of our performance. We define NOI as total operating revenues, adjusted to exclude non-cash revenue items, less property operating expenses and real estate taxes. For the three months ended March 31, 2020, Same-Center NOI represents the NOI for the 279 properties that were wholly-owned and operational for the entire portion of both comparable reporting periods. We believe Same-Center NOI provides useful information to our investors about our financial and operating performance because it provides a performance measure of the revenues and expenses directly involved in owning and operating real estate assets and provides a perspective not immediately apparent from net income (loss). Because Same-Center NOI excludes the change in NOI from properties acquired or disposed of after December 31, 2018, it highlights operating trends such as occupancy levels, rental rates, and operating costs on properties that were operational for both comparable periods. Other REITs may use different methodologies for calculating Same-Center NOI, and accordingly, our Same-Center NOI may not be comparable to other REITs.
Same-Center NOI should not be viewed as an alternative measure of our financial performance as it does not reflect the operations of our entire portfolio, nor does it reflect the impact of general and administrative expenses, depreciation and amortization, interest expense, other income (expense), or the level of capital expenditures and leasing costs necessary to maintain the operating performance of our properties that could materially impact our results from operations.
The table below compares Same-Center NOI (dollars in thousands):
Three Months Ended March 31, | Favorable (Unfavorable) | |||||||||||||
2020 | 2019 | $ Change | % Change | |||||||||||
Revenues: | ||||||||||||||
Rental income(1) | $ | 90,447 | $ | 89,684 | $ | 763 | ||||||||
Tenant recovery income | 31,036 | 28,947 | 2,089 | |||||||||||
Other property income | 878 | 613 | 265 | |||||||||||
Total revenues | 122,361 | 119,244 | 3,117 | 2.6 | % | |||||||||
Operating expenses: | ||||||||||||||
Property operating expenses | 18,281 | 18,112 | (169 | ) | ||||||||||
Real estate taxes | 17,155 | 16,418 | (737 | ) | ||||||||||
Total operating expenses | 35,436 | 34,530 | (906 | ) | (2.6 | )% | ||||||||
Total Same-Center NOI | $ | 86,925 | $ | 84,714 | $ | 2,211 | 2.6 | % | ||||||
(1) | Excludes straight-line rental income, net amortization of above- and below-market leases, and lease buyout income. |
Same-Center NOI Reconciliation—Below is a reconciliation of Net Income (Loss) to NOI for our real estate investments and Same-Center NOI (in thousands):
Three Months Ended March 31, | |||||||
2020 | 2019(1) | ||||||
Net income (loss) | $ | 11,199 | $ | (5,788 | ) | ||
Adjusted to exclude: | |||||||
Fees and management income | (2,165 | ) | (3,261 | ) | |||
Straight-line rental income and expense | (2,312 | ) | (1,713 | ) | |||
Net amortization of above- and below-market leases | (788 | ) | (1,133 | ) | |||
Lease buyout income | (94 | ) | (232 | ) | |||
General and administrative expenses | 10,740 | 13,285 | |||||
Depreciation and amortization | 56,227 | 60,989 | |||||
Impairment of real estate assets | — | 13,717 | |||||
Interest expense, net | 22,775 | 25,009 | |||||
Loss (gain) on disposal of property, net | 1,577 | (7,121 | ) | ||||
Other income, net | (9,869 | ) | (7,536 | ) | |||
Property operating expenses related to fees and management income | 646 | 1,295 | |||||
NOI for real estate investments | 87,936 | 87,511 | |||||
Less: Non-same-center NOI(2) | (1,011 | ) | (2,797 | ) | |||
Total Same-Center NOI | $ | 86,925 | $ | 84,714 | |||
(1) | Certain prior period amounts have been reclassified to conform with current year presentation. |
(2) | Includes operating revenues and expenses from non-same-center properties which includes properties acquired or sold and corporate activities. |
27
Funds from Operations (“FFO”) and Core FFO—FFO is a non-GAAP performance financial measure that is widely recognized as a measure of REIT operating performance. The National Association of Real Estate Investment Trusts (“Nareit”) defines FFO as net income (loss) computed in accordance with GAAP, excluding gains (or losses) from sales of property and gains (or losses) from change in control, plus depreciation and amortization, and after adjustments for impairment losses on real estate and impairments of in-substance real estate investments in investees that are driven by measurable decreases in the fair value of the depreciable real estate held by the unconsolidated partnerships and joint ventures. Adjustments for unconsolidated partnerships and joint ventures are calculated to reflect FFO on the same basis. We calculate FFO Attributable to Stockholders and Convertible Noncontrolling Interests in a manner consistent with the Nareit definition, with an additional adjustment made for noncontrolling interests that are not convertible into common stock.
Core FFO is an additional performance financial measure used by us as FFO includes certain non-comparable items that affect our performance over time. We believe that Core FFO is helpful in assisting management and investors with the assessment of the sustainability of operating performance in future periods. We believe it is more reflective of our core operating performance and provides an additional measure to compare our performance across reporting periods on a consistent basis by excluding items that may cause short-term fluctuations in net income (loss). To arrive at Core FFO, we adjust FFO attributable to stockholders and convertible noncontrolling interests to exclude certain recurring and non-recurring items including, but not limited to, depreciation and amortization of corporate assets, changes in the fair value of the earn-out liability, gains or losses on the extinguishment or modification of debt, transaction and acquisition expenses, and amortization of unconsolidated joint venture basis differences.
FFO, FFO Attributable to Stockholders and Convertible Noncontrolling Interests, and Core FFO should not be considered alternatives to net income (loss) or income (loss) from continuing operations under GAAP, as an indication of our liquidity, nor as an indication of funds available to cover our cash needs, including our ability to fund distributions. Core FFO may not be a useful measure of the impact of long-term operating performance on value if we do not continue to operate our business plan in the manner currently contemplated.
Accordingly, FFO, FFO Attributable to Stockholders and Convertible Noncontrolling Interests, and Core FFO should be reviewed in connection with other GAAP measurements, and should not be viewed as more prominent measures of performance than net income (loss) or cash flows from operations prepared in accordance with GAAP. Our FFO, FFO Attributable to Stockholders and Convertible Noncontrolling Interests, and Core FFO, as presented, may not be comparable to amounts calculated by other REITs.
28
The following table presents our calculation of FFO, FFO Attributable to Stockholders and Convertible Noncontrolling Interests, and Core FFO and provides additional information related to our operations (in thousands, except per share amounts):
Three Months Ended March 31, | |||||||
2020 | 2019(1) | ||||||
Calculation of FFO Attributable to Stockholders and Convertible Noncontrolling Interests | |||||||
Net income (loss) | $ | 11,199 | $ | (5,788 | ) | ||
Adjustments: | |||||||
Depreciation and amortization of real estate assets | 54,817 | 59,342 | |||||
Impairment of real estate assets | — | 13,717 | |||||
Loss (gain) on disposal of property, net | 1,577 | (7,121 | ) | ||||
Adjustments related to unconsolidated joint ventures | 654 | 1,055 | |||||
FFO attributable to the Company | 68,247 | 61,205 | |||||
Adjustments attributable to noncontrolling interests not convertible into common stock | — | (190 | ) | ||||
FFO attributable to stockholders and convertible noncontrolling interests | $ | 68,247 | $ | 61,015 | |||
Calculation of Core FFO | |||||||
FFO attributable to stockholders and convertible noncontrolling interests | $ | 68,247 | $ | 61,015 | |||
Adjustments: | |||||||
Depreciation and amortization of corporate assets | 1,410 | 1,647 | |||||
Change in fair value of earn-out liability | (10,000 | ) | (7,500 | ) | |||
Amortization of unconsolidated joint venture basis differences | 467 | 344 | |||||
Loss on extinguishment or modification of debt, net | 73 | — | |||||
Transaction and acquisition expenses | 45 | 88 | |||||
Core FFO | $ | 60,242 | $ | 55,594 | |||
FFO Attributable to Stockholders and Convertible Noncontrolling Interests per share and Core FFO per share | |||||||
Weighted-average common shares outstanding - diluted(2) | 333,228 | 325,922 | |||||
FFO attributable to stockholders and convertible noncontrolling interests per share - diluted | $ | 0.20 | $ | 0.19 | |||
Core FFO per share - diluted | $ | 0.18 | $ | 0.17 | |||
(1) | Certain prior period amounts have been reclassified to conform with current year presentation. |
(2) | Restricted stock awards were dilutive to FFO Attributable to Stockholders and Convertible Noncontrolling Interests and Core FFO for the three months ended March 31, 2020 and 2019, and, accordingly, their impact was included in the weighted-average common shares used to calculate diluted FFO Attributable to Stockholders and Convertible Noncontrolling Interests per share and Core FFO per share. For the three months ended March 31, 2019, restricted stock awards with a weighted-average impact of 0.7 million shares had an anti-dilutive effect upon the calculation of earnings per share, as further detailed in Note 10, and thus were excluded. As these shares were not anti-dilutive to diluted FFO Attributable to Stockholders and Convertible Noncontrolling Interests and Core FFO per share, they are included here. |
Liquidity and Capital Resources
General—Aside from standard operating expenses, we expect our principal cash demands to be for:
• | principal and interest payments on our outstanding indebtedness; |
• | cash distributions to stockholders to comply with REIT requirements; |
• | capital expenditures and leasing costs; |
• | investments in real estate; and |
• | redevelopment and repositioning projects. |
We expect our primary sources of liquidity to be:
• | operating cash flows; |
• | proceeds from debt financings, including borrowings under our unsecured revolving credit facility; |
• | proceeds received from the disposition of properties; |
• | distributions received from joint ventures; |
• | available, unrestricted cash and cash equivalents; and |
• | reinvested distributions once distributions to stockholders and thus the DRIP are reactivated/reinstated. |
We anticipate that cash from operations may be reduced at least in the near term as a result of the immediate impact of the COVID-19 pandemic as we may temporarily experience reduced cash payments and/or revenue from tenants. Additionally,
29
our cash from financing activities will be impacted by actions taken to preserve liquidity, as we have temporarily suspended our distributions, the DRIP, and the SRP for death, qualifying disability, or determination of incompetence (standard SRP repurchases remain suspended). We are monitoring events closely and managing our cash usage, which also includes delaying capital spending and redevelopment where possible as well as reducing other property and corporate expenses. At this time, we believe our current sources of liquidity, most significantly our operating cash flows and borrowing availability on our revolving credit facility, are sufficient to meet our short- and long-term cash demands.
Debt—The following table summarizes information about our debt as of March 31, 2020 and December 31, 2019 (dollars in thousands):
March 31, 2020 | December 31, 2019 | ||||||
Total debt obligations, gross | $ | 2,374,011 | $ | 2,372,521 | |||
Weighted average interest rate at end of period | 3.3 | % | 3.4 | % | |||
Weighted average term (in years) at end of period | 4.7 | 5.0 | |||||
Revolving credit facility capacity | $ | 500,000 | $ | 500,000 | |||
Revolving credit facility availability(1) | 454,705 | 489,805 | |||||
Revolving credit facility maturity(2) | October 2021 | October 2021 | |||||
(1) | Net of any outstanding balance and letters of credit. |
(2) | The revolving credit facility has an additional option to extend the maturity to October 2022, with its execution being subject to compliance with certain terms included in the loan agreement, including the absence of any defaults and the payment of relevant fees. As of March 31, 2020, we were in compliance with these terms and expect to be in compliance over the next twelve months. |
In January 2020, we paid down $30.0 million of term loan debt maturing in 2021 using proceeds from property dispositions in 2019. Following this repayment, our next term loan maturity is in April 2022. In March 2020, we borrowed $34 million on our $500 million revolving credit facility in order to satisfy general operating needs. In April 2020, we borrowed an additional $200 million on our revolving credit facility to meet our operating needs for a sustained period due to the COVID-19 pandemic. To the extent we continue to maintain a balance on our revolving credit facility, our interest expense will be higher in future quarters. As of May 11, 2020, total availability on our revolving credit facility, net of any letters of credit, was $254.7 million.
Our debt is subject to certain covenants, and as of March 31, 2020, we were in compliance with the restrictive covenants of our outstanding debt obligations. We expect to continue to meet the requirements of our debt covenants over the next twelve months.
We believe our debt to total enterprise value and debt covenant compliance as of March 31, 2020 allows us access to future borrowings as needed in the near term. The following table presents our calculation of net debt to total enterprise value, inclusive of our prorated portion of net debt and cash and cash equivalents owned through our joint ventures, as of March 31, 2020 and December 31, 2019 (dollars in thousands):
March 31, 2020 | December 31, 2019 | ||||||
Net debt: | |||||||
Total debt, excluding market adjustments and deferred financing expenses | $ | 2,421,098 | $ | 2,421,520 | |||
Less: Cash and cash equivalents | 37,445 | 18,376 | |||||
Total net debt | $ | 2,383,653 | $ | 2,403,144 | |||
Enterprise value: | |||||||
Total net debt | $ | 2,383,653 | $ | 2,403,144 | |||
Total equity value(1) | 2,914,555 | 3,682,161 | |||||
Total enterprise value | $ | 5,298,208 | $ | 6,085,305 | |||
Net debt to total enterprise value | 45.0 | % | 39.5 | % | |||
(1) | Total equity value is calculated as the number of common shares and OP units outstanding multiplied by the EVPS as of March 31, 2020 and December 31, 2019, respectively. There were 333.1 million diluted shares outstanding with an EVPS of $8.75 and 331.7 million diluted shares outstanding with an EVPS of $11.10 as of March 31, 2020 and December 31, 2019, respectively. |
Capital Expenditures and Redevelopment Activity—We make capital expenditures during the course of normal operations, which include maintenance capital expenditures and tenant improvements as well as value-enhancing anchor space repositioning and redevelopment, ground-up outparcel development, and other accretive projects. Currently, we are delaying all capital projects to the extent possible in order to maximize our available capital in response to the uncertainty around the duration and negative impact of the COVID-19 pandemic.
During the three months ended March 31, 2020 and 2019, we had capital spend of $16.0 million and $8.6 million, respectively. Our capital spend during the three months ended March 31, 2020 included development and redevelopment spend of $8.8 million primarily related to projects originating in 2019. These projects have an estimated total remaining spend of $30.8 million, of which $4.1 million of expected spend in 2020 has been paused due to the delay in capital projects as a result of the COVID-19 pandemic. Upon resumption of increased capital expenditures, we anticipate that obligations related to capital improvements as well as redevelopment and development can be met with cash flows from operations, cash flows from dispositions, or borrowings on our unsecured revolving line of credit.
30
Merger and Acquisition Activity—We continually monitor the commercial real estate market for properties that have future growth potential, are located in attractive demographic markets, and support our business objectives. Given the uncertainty around the COVID-19 pandemic as well as the resulting market conditions, we expect a lower volume of acquisition activity for the remainder of 2020. During the three months ended March 31, 2020, we acquired two parcels of land, as described in Note 4 to the consolidated financial statements, for a total cash outlay of $4.3 million. We did not acquire any properties during the same period in 2019.
Disposition and Contribution Activity—We are actively evaluating our portfolio of assets for opportunities to make strategic dispositions of assets that no longer meet our growth and investment objectives or assets that have stabilized in order to capture their value. We expect to continue to make strategic dispositions during 2020, though it is possible that our disposition activity, including any activity to expand our investment management business through seeded joint ventures, may be delayed or otherwise disrupted depending on the impact of the COVID-19 pandemic. The following table highlights our property dispositions for the three months ended March 31, 2020 and 2019 (dollars and square feet in thousands):
Three Months Ended March 31, | |||||||
2020 | 2019 | ||||||
Number of properties sold | 3 | 3 | |||||
GLA | 264 | 281 | |||||
Proceeds from the sale of real estate | $ | 17,447 | $ | 35,755 | |||
(Loss) gain on sale of properties, net(1) | (826 | ) | 7,399 | ||||
(1) | The (loss) gain on sale of properties, net does not include miscellaneous write-off activity, which is also recorded in (Loss) Gain on Disposal of Property, Net on the consolidated statements of operations. |
31
Distributions—Distributions to our common stockholders and OP unit holders, including key financial metrics for comparison purposes, for the three months ended March 31, 2020 and 2019, are as follows (in thousands):
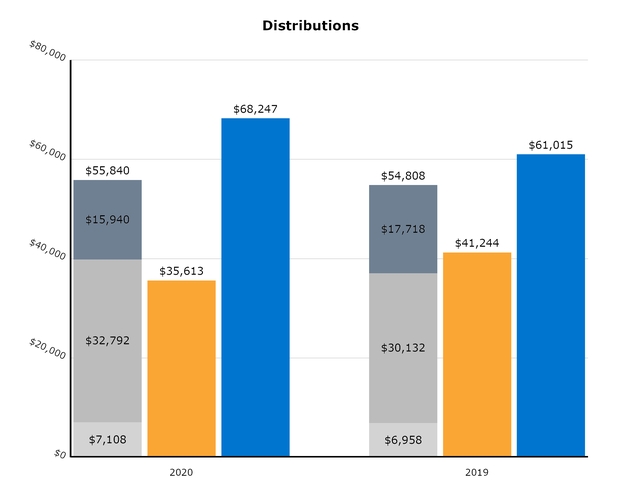
Cash distributions to OP unit holders | Net cash provided by operating activities | |||
Cash distributions to common stockholders | FFO attributable to stockholders and nonconvertible noncontrolling interests(1) | |||
Distributions reinvested through the DRIP | ||||
(1) | See Item 2. Management’s Discussion and Analysis of Financial Condition and Results of Operations - Non-GAAP Measures - Funds from Operations and Modified Funds from Operations for the definition of FFO, for information regarding why we present FFO, as well as for a reconciliation of this non-GAAP financial measure to Net Income (Loss). |
We paid distributions monthly of $0.05583344 per share for the months of January, February, and March 2020. The timing and amount of distributions is determined by our Board and is influenced in part by our intention to comply with REIT requirements of the Internal Revenue Code, as well as our results of operations, our general financial condition, general economic conditions, and other factors.
To maintain our qualification as a REIT, we must make aggregate annual distributions to our stockholders of at least 90% of our REIT taxable income (which is computed without regard to the dividends paid deduction or net capital gain, and which does not necessarily equal net income (loss) as calculated in accordance with GAAP). We generally will not be subject to U.S. federal income tax on the income that we distribute to our stockholders each year due to meeting the REIT qualification requirements. However, we may be subject to certain state and local taxes on our income, property, or net worth and to federal income and excise taxes on our undistributed income.
We have not established a minimum distribution level, and our charter does not require that we make distributions to our stockholders.
On March 27, 2020, our Board temporarily suspended stockholder distributions, effective after the payment of the March 2020 dividend on April 1, 2020. The DRIP was also temporarily suspended, and the March 2020 distribution paid on April 1, 2020 was paid all in cash. In August 2019, our Board suspended the SRP with respect to standard repurchases. On March 27, 2020, our Board temporarily suspended the SRP for death, qualifying disability, or determination of incompetence. In determining to suspend the payment of distributions and the operation of the DRIP and the SRP, the Board considered various factors, including the impact that the COVID-19 pandemic and the measures taken by governmental agencies and tenants in response
32
to the COVID-19 pandemic are expected to continue to have on our shopping centers and our financial condition, liquidity sources, and capital needs.
Cash Flow Activities—As of March 31, 2020, we had cash and cash equivalents and restricted cash of $84.6 million, a net cash decrease of $10.5 million during the three months ended March 31, 2020.
Below is a summary of our cash flow activity for the three months ended March 31, 2020 and 2019 (dollars in thousands):
Three Months Ended March 31, | ||||||||||||||
2020 | 2019 | $ Change | % Change | |||||||||||
Net cash provided by operating activities | $ | 35,613 | $ | 41,244 | $ | (5,631 | ) | (13.7 | )% | |||||
Net cash (used in) provided by investing activities | (2,413 | ) | 28,378 | (30,791 | ) | (108.5 | )% | |||||||
Net cash used in financing activities | (43,733 | ) | (67,168 | ) | 23,435 | (34.9 | )% | |||||||
Operating Activities—Our net cash provided by operating activities was primarily impacted by the following:
• | Property operations and working capital—Most of our operating cash comes from rental and tenant recovery income and is offset by property operating expenses, real estate taxes, and general and administrative costs. Our change in cash flows from property operations is primarily due to fluctuations in working capital accounts attributable to slightly lower cash receipts at the end of March during the normal course of our property operations. |
• | Fee and management income—We also generate operating cash from our third-party investment management business, pursuant to various management and advisory agreements between us and the Managed Funds. Our fee and management income was $2.2 million for the three months ended March 31, 2020, a decrease of $1.1 million as compared to the same period in 2019, primarily due to fee and management income no longer received from REIT III following its acquisition by us in October 2019. |
• | Cash paid for interest—During the three months ended March 31, 2020, we paid $20.3 million for interest, a decrease of $1.4 million over the same period in 2019 largely due to our repricing activity executed during 2019. |
Investing Activities—Our net cash (used in) provided by investing activities was primarily impacted by the following:
• | Real estate acquisitions—During the three months ended March 31, 2020, we acquired two parcels of land, as described in Note 4 to the consolidated financial statements, for a total cash outlay of $4.3 million. We did not acquire any properties during the same period in 2019. |
• | Real estate dispositions—During the three months ended March 31, 2020, we disposed of three properties for a net cash inflow of $17.4 million, as compared to three property dispositions for a net cash inflow of $35.8 million during the same period in 2019. |
• | Capital expenditures—We invest capital into leasing our properties and maintaining or improving the condition of our properties. During the three months ended March 31, 2020, we paid $16.0 million for capital expenditures, an increase of $7.4 million over the same period in 2019, primarily driven by our investment in value-added redevelopment and new development in our existing centers during the three months ended March 31, 2020. |
Financing Activities—Our net cash used in financing activities was primarily impacted by the following:
• | Debt borrowings and payments—Cash from financing activities is primarily affected by inflows from borrowings and outflows from payments on debt. As our debt obligations mature, we intend to refinance the remaining balance, if possible, or pay off the balances at maturity using proceeds from operations and/or corporate-level debt. During the three months ended March 31, 2020, we had net borrowings of $1.5 million, primarily as a result of drawing $34.0 million on our revolving credit facility, offset by a pay down in January 2020 of $30.0 million on term loan debt maturing in 2021. During the three months ended March 31, 2019 our net borrowings decreased $24.4 million primarily as a result of payments on our revolving credit facility, funded by cash inflows from the disposition of properties. |
• | Distributions to stockholders and OP unit holders—Cash used for distributions to common stockholders and OP unit holders increased $2.8 million for the three months ended March 31, 2020, primarily due to an increase in shares outstanding as compared to the same period in 2019. |
• | Share repurchases—Cash outflows for share repurchases decreased by $0.3 million for the three months ended March 31, 2020 as compared to the same period in 2019 due to the suspension of the SRP for death, qualifying disability, or determination of incompetence which became effective March 27, 2020. |
Critical Accounting Policies and Estimates
Our 2019 Annual Report on Form 10-K, filed with the SEC on March 11, 2020, contains a description of our critical accounting policies and estimates, including those relating to real estate acquisitions, rental income, and the valuation of real estate assets. There have been no significant changes to our critical accounting policies during 2020.
Because of the adverse economic conditions and uncertainty regarding the negative impacts of the COVID-19 pandemic, it is possible that the estimates and assumptions that have been utilized in the preparation of the consolidated financial statements could change or vary significantly from actual results. Please refer to Notes 2 and 12 for additional discussion on the potential impact that the COVID-19 pandemic could have on significant accounting estimates as employed per our critical accounting policies.
Impact of Recently Issued Accounting Pronouncements
In response to the COVID-19 pandemic, in April 2020, the FASB issued interpretive guidance addressing the accounting treatment of lease concessions stemming from the pandemic. Under this guidance, entities may make an election to account for lease concessions granted in conjunction with the pandemic consistent with how those concessions would be accounted for
33
under ASC 842 if those enforceable rights and obligations for those concessions already existed within the lease agreement. This accounting treatment may be applied regardless of whether enforceable rights and obligations for those concessions are explicitly outlined within the lease. As a result, entities that make this election will not have to analyze each lease to determine whether enforceable rights and obligations for concessions exist within the contract, and may elect not to account for these concessions as lease modifications within the scope of ASC 842. We continue to assess the impact of this accounting pronouncement.
Please refer to Note 2 for discussion of the impact of other recently issued accounting pronouncements.
ITEM 3. QUANTITATIVE AND QUALITATIVE DISCLOSURES ABOUT MARKET RISK
There have been no material changes from the quantitative and qualitative disclosures about market risk disclosed in Part II, Item 7A of our 2019 Annual Report on Form 10-K filed with the SEC on March 11, 2020.
ITEM 4. CONTROLS AND PROCEDURES
Evaluation of Disclosure Controls and Procedures
Our management, with the participation of our Principal Executive Officer and Principal Financial Officer, has evaluated the effectiveness of our disclosure controls and procedures (as defined in Rule 13a-15(e) under the Exchange Act) as of March 31, 2020. Based on that evaluation, our Principal Executive Officer and Principal Financial Officer concluded that our disclosure controls and procedures (as defined in Rule 13a-15(e) under the Exchange Act) were effective as of March 31, 2020.
Changes in Internal Control over Financial Reporting
During the quarter ended March 31, 2020, as a result of the COVID-19 pandemic, most of our employees began working from home in March; however, these changes to the working environment did not have a material effect on our internal control over financial reporting. There were no changes in our internal control over financial reporting (as defined in Rule 13a-15(f) under the Exchange Act) that have materially affected, or are reasonably likely to materially affect, our internal control over financial reporting.
w PART II OTHER INFORMATION |
ITEM 1. LEGAL PROCEEDINGS
From time to time, we are party to legal proceedings, which arise in the ordinary course of our business. We are not currently involved in any legal proceedings for which we are not covered by our liability insurance or the outcome is reasonably likely to have a material impact on our results of operations or financial condition, nor are we aware of any such legal proceedings contemplated by governmental authorities.
ITEM 1A. RISK FACTORS
The following risk factors supplement the risk factors set forth in our 2019 Annual Report on Form 10-K filed with the U.S. Securities and Exchange Commission (“SEC”) on March 11, 2020:
If we continue to pay distributions from sources other than our cash flows from operations, we may not be able to sustain our distribution rate, we may have fewer funds available for investment in properties and other assets, and our stockholders’ overall returns may be reduced.
Our organizational documents permit us to pay distributions from any source without limitation (other than those limitations set forth under Maryland law). To the extent we continue to fund distributions from borrowings, we will have fewer funds available for investment in real estate properties and other real estate-related assets, and our stockholders’ overall returns may be reduced.
At times, we may need to borrow funds to pay distributions, which could increase our operating costs. Furthermore, if we cannot cover our distributions with cash flows from operations, we may be unable to sustain our distribution rate. For the three months ended March 31, 2020, we paid gross distributions to our common stockholders and noncontrolling interests of $55.8 million, including distributions reinvested through the dividend reinvestment plan (“DRIP”) of $15.9 million. For the three months ended March 31, 2020, our net cash provided by operating activities was $35.6 million, which represents a shortfall of $20.2 million, or 36.2%, of our distributions paid, while our funds from operations (“FFO”) Attributable to Stockholders and Convertible Noncontrolling Interests was $68.2 million, which represents an excess of $12.4 million, or 22.2%, of the distributions paid. The shortfall was funded by borrowings. For the three months ended March 31, 2019, we paid distributions of $54.8 million, including distributions reinvested through the DRIP of $17.7 million. For the three months ended March 31, 2019, our net cash provided by operating activities was $41.2 million, which represents a shortfall of $13.6 million, or 24.8%, of our distributions paid, while our FFO was $61.0 million, which represents a excess of $6.2 million, or 11.3%, of our distributions paid. The shortfall was funded by borrowings.
34
The outbreak of the COVID-19 pandemic has had, and could continue to have, a material adverse effect on our and our tenants’ businesses, financial condition, results of operations, cash flow, liquidity, and ability to satisfy debt service obligations.
In March 2020, the World Health Organization declared COVID-19 a global pandemic. The COVID-19 pandemic has caused, and could continue to cause, significant disruptions to the United States and global economy and has contributed to significant volatility and negative pressure in financial markets. The global impact of the outbreak is continually evolving and, as additional cases of the virus are identified, many countries, including the United States, have reacted by instituting quarantines, restrictions on travel, and/or mandatory closures of businesses. Certain states and cities, including where our properties are located, have also reacted by instituting quarantines, restrictions on travel, “shelter-in-place” or “stay-at-home” rules, restrictions on types of business that may continue to operate, and/or restrictions on the types of construction projects that may continue.
Our retail and services tenants depend on in-person interactions with their customers to generate unit-level profitability, and the COVID-19 pandemic may decrease customer willingness to frequent, and mandated “shelter-in-place” or “stay-at-home” orders may prevent customers from frequenting, our tenants’ businesses, which may result in their inability to maintain profitability and make timely rental payments to us under their leases or to otherwise seek lease modifications or to declare bankruptcy. We own properties across the United States, including properties in states that have been significantly impacted by the COVID-19 pandemic. We have a higher concentration of ABR from temporarily closed tenants in certain states which have implemented stay-at-home and social distancing guidelines and mandates, such as Florida, Texas, California, Illinois and Georgia. Our wholly-owned properties and those owned through our joint ventures contained approximately 5,550 tenant spaces as of May 11, 2020. As of May 11, 2020, approximately 1,640, or 30%, of these tenant spaces were temporarily closed, which represented 21% of our annualized base rent (“ABR”) and 16% of our gross leasable area (“GLA”), including some tenants that we believe are considered to be essential businesses but have temporarily closed due to sharp decreases in foot traffic and customer patronage as a result of government mandates and social distancing guidelines. Approximately 7% of tenant spaces that we believe are considered to be essential retail and service businesses, totaling approximately 3% of the ABR and 2% of the GLA associated with all essential retail and service businesses, are included in these temporary closures as of May 11, 2020. We cannot presently determine when or how many of our tenants will reopen. As of May 11, 2020, we have received 2,120 rent relief requests from tenant spaces representing approximately 29% of our ABR, all of which are still being evaluated. As of May 11, 2020, we have collected approximately 77% of rent and recoveries billed for the month of April and approximately 74% of rent and recoveries billed for the month of May. We currently anticipate the above circumstances to negatively impact our revenues for the second quarter of 2020 and potentially for the remainder of the year.
Moreover, the ongoing COVID-19 pandemic and restrictions intended to prevent and mitigate its spread could have additional adverse effects on our business, including with regards to:
• | the ability and willingness of our tenants to renew their leases upon expiration, our ability to re-lease the properties on the same or better terms in the event of nonrenewal or in the event we exercise our right to replace an existing tenant, and obligations we may incur in connection with the replacement of an existing tenant, particularly in light of the adverse impact to the financial health of many retailers and service providers that has occurred and continues to occur as a result of the COVID-19 pandemic and the significant uncertainty as to when and the conditions under which potential tenants will be able to operate physical retail locations in the future; |
• | a potential sustained or permanent increase in online shopping instead of shopping at physical retail properties, thereby reducing demand for space in our shopping centers and possible related reductions in rent or increased costs to lease space; |
• | the adverse impact of current economic conditions on the market value of our real estate portfolio and our third-party investment management business, and consequently on the estimated value per share (“EVPS”) of our common stock; |
• | the adverse impact of the current economic conditions on our ability to effect a liquidity event at an attractive price or at all in the near term and for a potentially lengthy period of time; |
• | to the extent we were seeking to sell properties in the near term, significantly greater uncertainty regarding our ability to do so at attractive prices or at all; |
• | anticipated returns from development and redevelopment projects, which have been temporarily delayed to the extent possible; |
• | the broader impact of the severe economic contraction due to the COVID-19 pandemic, the resulting increase in unemployment that has occurred in the short-term and its effect on consumer behavior, and negative consequences that will occur if these trends are not timely reversed; |
• | state, local, or industry-initiated efforts, such as a rent freeze for tenants or a suspension of a landlord’s ability to enforce evictions, which may affect our ability to collect rent or enforce remedies for the failure to pay rent; |
• | severe disruption and instability in the global financial markets or deteriorations in credit and financing conditions, which could make it difficult for us to access debt and equity capital on attractive terms, or at all, and impact our ability to fund business operations and activities and repay liabilities on a timely basis; |
• | our ability to pay down, refinance, restructure, or extend our indebtedness as it becomes due, and our potential inability to comply with the financial covenants of our credit facility and other debt agreements, which could result in a default and potential acceleration of indebtedness and impact our ability to make additional borrowings under our credit facility or otherwise in the future; and |
• | a potential reduction in our operating effectiveness as employees work remotely or if key personnel become unavailable due to illness or other personal circumstances related to the COVID-19 pandemic. |
We have temporarily suspended stockholder distributions in an effort to preserve cash due to current economic uncertainty and we may choose to do the same in the future. Additionally, we may in the future choose to pay distributions in shares of
35
our common stock rather than solely in cash, which may result in our stockholders having a tax liability with respect to such distributions that exceeds the amount of cash received, if any.
While the rapid developments regarding the COVID-19 pandemic preclude any prediction as to its ultimate adverse impact, the current economic, political, and social environment presents material risks and uncertainties with respect to our and our tenants’ business, financial condition, results of operations, cash flows, liquidity, and ability to satisfy debt service obligations. Moreover, to the extent any of these risks and uncertainties adversely impact us in the ways described above or otherwise, they may also have the effect of heightening many of the other risks described under the section entitled “Item 1A. Risk Factors” in our most recent annual report on Form 10-K for the year ended December 31, 2019.
ITEM 2. UNREGISTERED SALES OF EQUITY SECURITIES AND USE OF PROCEEDS
Share Repurchases
During the three months ended March 31, 2020, we repurchased shares as follows (shares in thousands):
Period | Total Number of Shares Repurchased | Average Price Paid per Share(1)(2) | Total Number of Shares Purchased as Part of a Publicly Announced Plan or Program(1) | Approximate Dollar Value of Shares That May Yet Be Repurchased Under the Program | |||||
January 2020 | 163 | $ | 10.26 | 127 | (2) | ||||
February 2020 | 132 | 10.00 | 132 | (2) | |||||
March 2020 | 11 | 10.00 | 11 | (2) | |||||
(1) | We announced the commencement of the Share Repurchase Program (“SRP”) in August 2010. It has subsequently been amended, most recently in August 2019. In addition, during the three months ended March 31, 2020, we repurchased approximately 35,000 shares for an aggregate purchase price of $0.4 million (average price of $11.10 per share) in connection with common shares surrendered to us to satisfy statutory minimum tax withholding obligations associated with the vesting of restricted stock awards under our equity-based compensation plan. |
(2) | We currently limit the dollar value and number of shares that may yet be repurchased under the SRP, as described in Part II Item 5 of our Annual Report on Form 10-K filed March 11, 2020. |
Effective March 27, 2020, the Board temporarily suspended the SRP for requests related to death, qualifying disability, or determination of incompetence. The standard SRP remains suspended.
ITEM 5. OTHER INFORMATION
Executive Officer and Director Compensation
Effective May 18, 2020, owing to the COVID-19 pandemic and its anticipated effect on the Company’s operations, (i) Jeffrey Edison, our Chairman and Chief Executive Officer, has agreed to temporarily reduce his base salary by 25% and (ii) our other named executive officers, Tanya E. Brady, General Counsel and Secretary, John P. Caulfield, Chief Financial Officer and Treasurer, Devin I. Murphy, President, and Robert F. Myers, Chief Operating Officer, each agreed to temporarily reduce their respective base salaries by 10%. In addition, each of the eight independent members of our Board agreed to temporarily reduce their respective annual base cash and equity compensation for the 2020-2021 term by 10%. Each of these reductions were unanimously approved by the Compensation Committee on May 6, 2020 and will be reevaluated as things develop.
Estimated Value Per Share
On May 6, 2020, the independent directors of our Board decreased the EVPS of our common stock to $8.75. The valuation was based substantially on the estimated “as is” market value of our portfolio of wholly-owned real estate properties in various geographic locations in the United States as well as our pro rata share of those properties owned through our joint ventures (collectively, our “Portfolio”) and the estimated value of in-place contracts of our third-party asset management business as of March 31, 2020.
We provide the EVPS to assist broker-dealers that participated in our public offering in meeting their customer account statement reporting obligations under Financial Industry Regulatory Authority (“FINRA”) Rule 2231. This valuation was performed in accordance with the provisions of Practice Guideline 2013-01, Valuations of Publicly Registered Non-Listed REITs, issued by the Institute for Portfolio Alternatives (“IPA”) in April 2013 (“IPA Valuation Guidelines”).
We engaged Duff & Phelps, LLC (“Duff & Phelps”), an independent valuation expert that has expertise in appraising commercial real estate assets, to provide a calculation of the range in EVPS of our common stock as of March 31, 2020. Duff & Phelps prepared a valuation report (“Valuation Report”) that provided this range based substantially on its estimate of the “as is” market value of the Portfolio and the estimated value of in-place contracts of the third-party asset management business. Duff & Phelps made adjustments to the aggregate estimated value of our Portfolio to reflect balance sheet assets and liabilities provided by our management as of March 31, 2020, before calculating a range of estimated values based on the number of outstanding shares of our common stock as of March 31, 2020. The COVID-19 pandemic has impacted the global financial markets. As of the valuation date, Duff & Phelps attached less weight to previous market evidence for comparison purposes to arrive at opinions of value. Due to a dearth of transaction activity that takes into account this impact, they were forced to infer conclusions from public market data (stock prices) and other data which are very volatile. They surveyed market participants on a daily basis to try to glean market inputs, but due to the overall uncertainty of the broader markets, the data points are not widely consistent. The valuation is, therefore, reported on the basis of “material valuation uncertainty”. Consequently, less certainty, and a higher degree of caution, should be attached to the valuation than would
36
normally be the case. These calculations produced an EVPS in the range of $8.45 to $9.68 as of March 31, 2020, and the independent directors, after discussions with management, approved $8.75 as the EVPS as of March 31, 2020. We previously established an EVPS on May 8, 2019 of $11.10 based substantially on the same methodology and process as of March 31, 2019. We expect to review the EVPS at least annually.
The following table summarizes the material components of the EVPS of our common stock as of March 31, 2020 (in thousands, except per share amounts):
Low | High | ||||||
Investment in Real Estate Assets: | |||||||
Phillips Edison real estate valuation | $ | 5,135,800 | $ | 5,536,300 | |||
Management company | 23,000 | 23,000 | |||||
Joint venture properties(1) | 87,345 | 94,290 | |||||
Total market value | 5,246,145 | 5,653,590 | |||||
Other Assets: | |||||||
Cash and cash equivalents | 35,437 | 35,437 | |||||
Restricted cash | 47,866 | 47,866 | |||||
Accounts receivable | 49,645 | 49,645 | |||||
Derivative assets | 18 | 18 | |||||
Prepaid expenses and other assets | 12,009 | 12,009 | |||||
Total other assets | 144,975 | 144,975 | |||||
Liabilities: | |||||||
Notes payable and credit facility | 2,420,714 | 2,420,714 | |||||
Mark to market - debt | 10,052 | 10,052 | |||||
Derivative liability | 62,756 | 62,756 | |||||
Accounts payable and accrued expenses | 82,138 | 82,138 | |||||
Total liabilities | 2,575,660 | 2,575,660 | |||||
Net Asset Value | $ | 2,815,460 | $ | 3,222,905 | |||
Common stock and OP units outstanding | 333,092 | 333,092 | |||||
Net Asset Value Per Share | $ | 8.45 | $ | 9.68 | |||
(1) | Represents our pro rata share of the properties owned by our joint ventures. |
Our goal is to provide an estimate of the market value of our shares. However, the majority of our assets consist of commercial real estate, and as with any valuation methodology, the methodologies used were based upon a number of assumptions and estimates that may not have been accurate or complete. Different parties with different assumptions and estimates could have derived a different EVPS, and those differences could have been significant. These limitations are discussed further under “Limitations of Estimated Value per Share” below.
Valuation Methodologies—Our goal in calculating an EVPS was to arrive at a value that was reasonable and based off of what we deemed to be appropriate valuation and appraisal methodologies and assumptions and a process that was in accordance with the IPA Valuation Guidelines. The following is a summary of the valuation methodologies and components used to calculate the EVPS.
Independent Valuation Firm—Duff & Phelps was retained by us on February 27, 2020, as authorized by the independent directors of the Board, to provide independent valuation services. Duff & Phelps, who is not affiliated with us, is a leading global valuation advisor with expertise in complex valuation work. Duff & Phelps had previously provided services to us pertaining to the allocation of acquisition purchase prices for financial reporting purposes in connection with the Portfolio, for which it received usual and customary compensation. Duff & Phelps may be engaged to provide professional services to us in the future. The Duff & Phelps personnel who prepared the valuation had no present or prospective interest in the Portfolio and no personal interest with us.
Duff & Phelps’ engagement for its valuation services was not contingent upon developing or reporting predetermined results. In addition, Duff & Phelps’ compensation for completing the valuation services was not contingent upon the development or reporting of a predetermined value or direction in value that favors the cause of us, the amount of the value opinion, the attainment of a stipulated result, or the occurrence of a subsequent event directly related to the intended use of its Valuation Report. We agreed to indemnify Duff & Phelps against certain liabilities arising out of this engagement.
Duff & Phelps’ analyses, opinions, or conclusions were developed, and the Valuation Report was prepared, in conformity with the Uniform Standards of Professional Appraisal Practice. The Valuation Report was reviewed, approved and signed by
37
individuals with the professional designation of MAI (Member of the Appraisal Institute). The use of the Valuation Report is subject to the requirements of the Appraisal Institute relating to review by its duly authorized representatives. Duff & Phelps did not inspect the properties that formed the Portfolio.
In preparing the Valuation Report, Duff & Phelps relied on information provided by us regarding the Portfolio. For example, we provided information regarding building size, year of construction, land size and other physical, financial, and economic characteristics. We also provided lease information, such as current rent amounts, rent commencement and expiration dates, and rent increase amounts and dates. Property-level cash flow projections were negatively impacted for the estimated effects of the COVID-19 pandemic.
Duff & Phelps did not investigate the legal description or legal matters relating to the Portfolio, including title or encumbrances, and title to the properties was assumed to be good and marketable. The Portfolio was also assumed to be free and clear of liens, easements, encroachments and other encumbrances, and to be in full compliance with zoning, use, occupancy, environmental and similar laws unless otherwise stated by us. The Valuation Report contains other assumptions, qualifications and limitations that qualify the analysis, opinions and conclusions set forth therein. Furthermore, the prices at which our real estate properties may actually be sold could differ from their appraised values.
The foregoing is a summary of the standard assumptions, qualifications and limitations that generally apply to the Valuation Report.
Real Estate Portfolio Valuation—Duff & Phelps estimated the “as is” market values of the Portfolio as of March 31, 2020 using various methodologies. Generally accepted valuation practice suggests assets may be valued using a range of methodologies. Duff & Phelps utilized the income capitalization approach with support from the sales comparison approach for each property. The income approach was the primary indicator of value, with secondary consideration given to the sales approach. Duff & Phelps performed a study of each market to measure current market conditions, supply and demand factors, growth patterns, and their effect on each of the subject properties.
The income capitalization approach simulates the reasoning of an investor who views the cash flows that would result from the anticipated revenue and expense on a property throughout its lifetime. Under the income capitalization approach, Duff & Phelps used an estimated net operating income (“NOI”) for each property, and then converted it to a value indication using a discounted cash flow analysis. The discounted cash flow analysis focuses on the operating cash flows expected from a property and the anticipated proceeds of a hypothetical sale at the end of an assumed holding period, with these amounts then being discounted to their present value. The discounted cash flow method is appropriate for the analysis of investment properties with multiple leases, particularly leases with cancellation clauses or renewal options, and especially in volatile markets.
The sales comparison approach estimates value based on what other purchasers and sellers in the market have agreed to as a price for comparable improved properties. This approach is based upon the principle of substitution, which states that the limits of prices, rents and rates tend to be set by the prevailing prices, rents and rates of equally desirable substitutes. Duff & Phelps gathered comparable sales data throughout various markets as secondary support for its valuation estimate.
The following summarizes the upper and lower bounds of the average terminal capitalization rates and discount rates that were used to arrive at the estimated market value of our Portfolio:
Range in Values | |
Terminal Capitalization Rate | 7.08% - 7.58% |
Discount Rate | 7.69% - 8.19% |
Management Company Valuation—Duff & Phelps estimated the aggregate market value associated with our third-party asset management business using various methodologies. Duff & Phelps considered various applications of the income approach, market approach, and underlying assets approach, with the income approach determined to be the most reliable method for purposes of the analysis. The income approach analysis considered the projected fee income earned for services provided pursuant to various management and advisory agreements over the expected duration of that contract, assuming normal and customary renewal provisions. Such services include property management services performed for the properties in the Portfolio, as well as property and asset management services for certain unaffiliated real estate investment portfolios. In performing this analysis, solely fee income related to properties owned as of March 31, 2020 was considered. The income approach also considered a reasonable level of expenses to support such activities, as well as other adjustments, and a discount rate that accounted for the time value of money and the risk of achieving the projected cash flows. All other assets and liabilities acquired are short term in nature and therefore the carrying value is considered to approximate the fair value. The result of the income approach analysis was the aggregate market value of the third-party asset management business, from which an estimated market value of net tangible assets (liabilities) was subtracted (added), to result in the aggregate intangible value of the management company.
Sensitivity Analysis—While we believe that Duff & Phelps’ assumptions and inputs were reasonable, a change in these assumptions would have impacted the calculations of the estimated value of the Portfolio, the estimated value of our third-party asset management business, and our EVPS. The table below illustrates the impact on Duff & Phelps’ range in EVPS if the terminal capitalization rates or discount rates were adjusted by 25 basis points and assumes all other factors remain unchanged. Additionally, the table illustrates the impact if only one change in assumptions was made, with all other factors held constant. Further, each of these assumptions could change by more than 25 basis points or 5%.
38
Resulting Range in Estimated Value Per Share | |||||||
Increase of 25 basis points | Decrease of 25 basis points | Increase of 5% | Decrease of 5% | ||||
Terminal Capitalization Rate | $8.25 - $9.42 | $8.81 - $10.10 | $8.13 - $9.31 | $8.95 - $10.24 | |||
Discount Rate | $8.23 - $9.43 | $8.81 - $10.07 | $8.06 - $9.28 | $8.99 - $10.24 | |||
Other Assets and Other Liabilities—Duff & Phelps made adjustments to the aggregate estimated values of our investments to reflect our other assets and other liabilities based on balance sheet information provided by us as of March 31, 2020.
Role of the Independent Directors—The independent directors discussed the valuation process and results with representatives of Duff & Phelps. The independent directors also discussed the results, the Portfolio, the third-party asset management business, our other assets and liabilities, and other matters with management. Management recommended to the independent directors that $8.75 per share be approved as the EVPS of our common stock. The independent directors discussed the rationale for this value with management.
Following the independent directors’ discussion with Duff & Phelps and the recommendation of management, and in light of other factors considered by the independent directors, the independent directors concluded that the range in EVPS of $8.45 to $9.68 was appropriate. The independent directors agreed to accept the recommendation of management and approved $8.75 as the EVPS of our common stock as of March 31, 2020, which determination was ultimately and solely the responsibility of the independent directors.
Limitations of Estimated Value per Share—We are providing this EVPS to assist broker-dealers that participated in our public offering in meeting our customer account statement reporting obligations. This valuation was performed in accordance with the provisions of the IPA Valuation Guidelines. As with any valuation methodology, the methodologies used were based upon a number of estimates and assumptions that may not have been accurate or complete. Different parties with different assumptions and estimates could have derived a different EVPS, and this difference could have been significant. The EVPS is not audited and does not represent a determination of the fair value of our assets or liabilities based on accounting principles generally accepted in the United States (“GAAP”), nor does it represent a liquidation value of our assets and liabilities, the price a third party would pay to acquire us, the price at which our shares of common stock would trade in secondary markets, or the amount at which our shares of common stock would trade on a national securities exchange.
Accordingly, we can give no assurance that:
• | our shares would trade at or near the EVPS if listed on a national securities exchange; |
• | a stockholder would be able to resell his or her shares at the EVPS; |
• | a stockholder would ultimately realize distributions per share equal to the EVPS upon a liquidation of our assets and settlement of our liabilities; |
• | a stockholder would receive an amount per share equal to the EVPS upon a sale of the Company; |
• | a third party would offer the EVPS in an arm’s-length transaction to purchase all or substantially all of our shares of common stock; |
• | another independent third-party appraiser or third-party valuation firm would agree with our EVPS; or |
• | the methodologies used to calculate our EVPS would be acceptable to FINRA for use on customer account statements or that the EVPS will satisfy the applicable annual valuation requirements under ERISA. |
Further, aside from estimates regarding the impact of the COVID-19 pandemic, we have not made any adjustments to the valuation of our EVPS for the impact of other transactions occurring subsequent to March 31, 2020, including, but not limited to, (1) acquisitions or dispositions, (2) NOI earned, (3) increases or decreases in our indebtedness or changes in interest rate swap liabilities, and (4) changes in leases, tenancy or other business and operational changes. The value of our shares of common stock will fluctuate over time in response to developments related to individual real estate assets, the management of those assets, and changes in the real estate and finance markets. Because of, among other factors, the high concentration of our total assets in real estate and the number of shares of our common stock outstanding, changes in the value of individual real estate assets or changes in valuation assumptions could have a very significant impact on the value of our shares of common stock. The EVPS does not take into account any disposition costs or fees for real estate properties, debt prepayment penalties that may be incurred upon the prepayment of certain of our debt obligations, or the impact of restrictions on the assumption of debt. Accordingly, the EVPS of our common stock may or may not be an accurate reflection of the fair market value of our stockholders’ investments and will not likely represent the amount of net proceeds that would result from an immediate sale of our assets.
39
ITEM 6. EXHIBITS
Ex. | Description |
10.1 | |
31.1 | |
31.2 | |
32.1 | |
32.2 | |
99.1 | |
101.1 | The following information from the Company’s Quarterly Report on Form 10-Q for the quarter ended March 31, 2020, formatted in XBRL (eXtensible Business Reporting Language): (i) Consolidated Balance Sheets; (ii) Consolidated Statements of Operations and Comprehensive Loss; (iii) Consolidated Statements of Equity; and (iv) Consolidated Statements of Cash Flows* |
*Filed herewith.
40
SIGNATURES
Pursuant to the requirements of the Securities Exchange Act of 1934, the Registrant has duly caused this report to be signed on its behalf by the undersigned thereunto duly authorized.
PHILLIPS EDISON & COMPANY, INC. | ||
Date: May 12, 2020 | By: | /s/ Jeffrey S. Edison |
Jeffrey S. Edison | ||
Chairman of the Board and Chief Executive Officer (Principal Executive Officer) | ||
Date: May 12, 2020 | By: | /s/ John P. Caulfield |
John P. Caulfield | ||
Chief Financial Officer, Senior Vice President and Treasurer (Principal Financial Officer) | ||
41