Attached files
| file | filename |
|---|---|
| 8-K - 8-K - SMARTFINANCIAL INC. | smbk-20201106x8k.htm |
Exhibit 99.1
| Piper Sandler East Coast Financial Services Conference November 9-10, 2020 Miller Welborn Chairman of the Board Billy Carroll President & CEO |

| Legal Disclaimer 2 Forward-Looking Statements This presentation may contain statements that are based on management’s current estimates or expectations of future events or future results, and that may be deemed to constitute forward-looking statements as defined under the Private Securities Litigation Reform Act of 1995. These statements, including statements regarding the potential effects of the COVID-19 pandemic on the SmartFinancial’s business and financial results and conditions, are not historical in nature and can generally be identified by such words as “expect,” “anticipate,” “intend,” “plan,” “believe,” “seek,” “may,” “estimate,” and similar expressions. All forward-looking statements are subject to risks, uncertainties, and other factors that may cause the actual results of SmartFinancial to differ materially from future results expressed or implied by such forward-looking statements. Such risks, uncertainties, and other factors include, among others, (1) the risk of litigation and reputational risk associated with historic acquisition activity;(2) the risk that cost savings and revenue synergies from recently completed acquisitions may not be realized or may take longer than anticipated to realize;(3) disruption from recently completed acquisitions with customer, supplier, employee, or other business relationships;(4) our ability to successfully integrate the businesses acquired as part of previous acquisitions with the business of SmartBank;(5) risks related to the completed acquisition of Progressive Financial Group, Inc.(“PFG”);(6) the risk that the anticipated benefits from the completed acquisition of PFG may not be realized in the time frame anticipated;(7) changes in management’s plans for the future;(8) prevailing, or changes in, economic or political conditions, particularly in our market areas; (9) credit risk associated with our lending activities;(10) changes in interest rates, loan demand, real estate values, or competition;(11) changes in accounting principles, policies, or guidelines;(12) changes in applicable laws, rules, or regulations, including changes to statutes, regulations or regulatory policies or practices as a result of, or in response to, COVID-19;(13) adverse results from current or future litigation, regulatory examinations or other legal and/or regulatory actions, including as a result of the Company’s participation in and execution of government programs related to the COVID-19 pandemic;(14) the impact of the COVID-19 pandemic on the Company’s assets, business, cash flows, financial condition, liquidity, prospects and results of operations;(15) potential increases in the provision for loan losses resulting from the COVID-19 pandemic; and (16) other general competitive, economic, political, and market factors, including those affecting our business, operations, pricing, products, or services. These and other factors that could cause results to differ materially from those described in the forward-looking statements can be found in SmartFinancial’s most recent annual report on Form 10-K, quarterly reports on Form 10-Q, and current reports on Form 8-K, in each case filed with or furnished to the Securities and Exchange Commission (the “SEC”) and available on the SEC’s website (www.sec.gov). Undue reliance should not be placed on forward-looking statements. SmartFinancial disclaims any obligation to update or revise any forward-looking statements contained in this release, which speak only as of the date hereof, whether as a result of new information, future events, or otherwise. Non-GAAP Financial Measures Statements included in this presentation include Non-GAAP financial measures and should be read along with the accompanying tables, which provide a reconciliation of Non-GAAP financial measures to GAAP financial measures. SmartFinancial management uses several Non-GAAP financial measures, including:(i) operating earnings, (ii) operating return on average assets, (iii) operating return on average shareholder equity, (iv) return on average tangible common equity, (v) operating return on average tangible common equity, (vi) operating efficiency ratio;(vii) tangible common equity;(viii) average tangible common equity;(ix) tangible book value;(x) operating pre-tax pre-provision earnings;(xi) operating noninterest income;(xii) operating noninterest expense; and ratios derived therefrom, in its analysis of the company's performance. Operating earnings excludes the following from net income: securities gains and losses, merger termination fee of $6.4 million in the second quarter of 2019, merger related and restructuring expenses, tax benefit from director options previously exercised, and the income tax effect of adjustments. Operating return on average assets is the annualized operating earnings (Non-GAAP) divided by average assets. Operating return on average shareholder equity is the annualized operating earnings (Non-GAAP) divided by average equity. Return on average tangible common equity is the annualized net income divided by average tangible common equity (Non-GAAP). Operating return on average tangible common equity is the annualized operating earnings (Non-GAAP) divided by average tangible common equity (Non-GAAP). The operating efficiency ratio includes an adjustment for taxable equivalent yields and excludes securities gains and losses and merger related and restructuring expenses from the efficiency ratio. Tangible common equity and average tangible common equity excludes goodwill and other intangible assets from shareholders’ equity and average shareholders’ equity. Tangible book value excludes goodwill and other intangible assets less shareholders’ equity divided by common shares outstanding. Operating pre-tax pre-provision earnings is net interest income plus operating noninterest income (Non-GAAP) less operating noninterest expense (Non-GAAP). Operating noninterest income excludes the following from noninterest income: securities gains and losses, expenses related to the termination of the ADECA loan program and the merger termination fee of $6.4 million in the second quarter of 2019. Operating noninterest expense excludes the following from noninterest expense: prior year adjustments to salaries, merger related and restructuring expenses and certain franchise tax true-up expenses. Management believes that Non-GAAP financial measures provide additional useful information that allows investors to evaluate the ongoing performance of the company and provide meaningful comparisons to its peers. Management believes these non-GAAP financial measures also enhance investors' ability to compare period-to-period financial results and allow investors and company management to view our operating results excluding the impact of items that are not reflective of the underlying operating performance. Non-GAAP financial measures should not be considered as an alternative to any measure of performance or financial condition as promulgated under GAAP, and investors should consider SmartFinancial's performance and financial condition as reported under GAAP and all other relevant information when assessing the performance or financial condition of the company. Non-GAAP financial measures have limitations as analytical tools, and investors should not consider them in isolation or as a substitute for analysis of the results or financial condition as reported under GAAP. |
| Markets 3 |

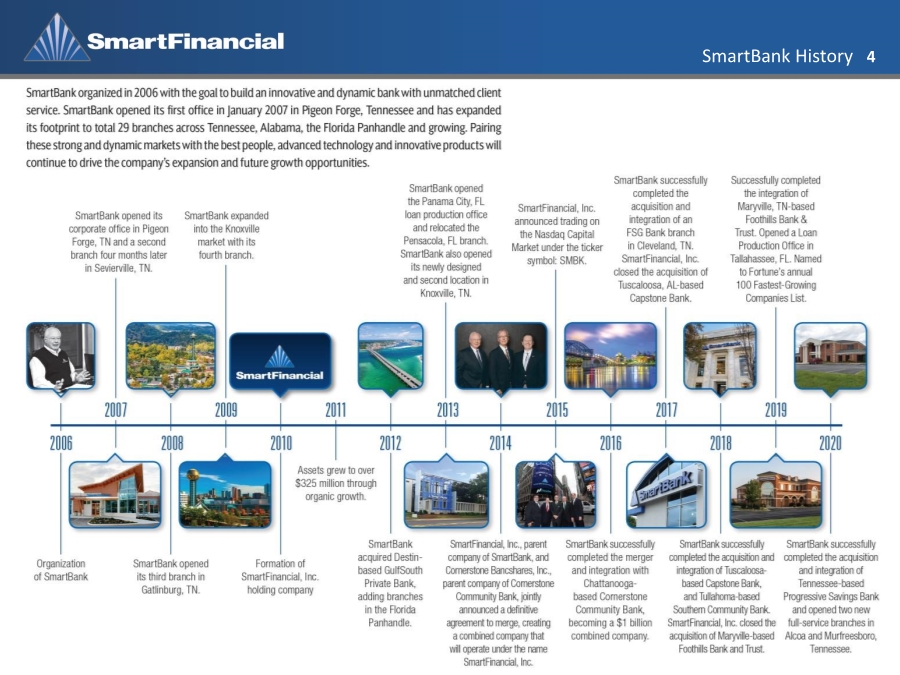
| SmartBank History 4 |
| Leadership 5 |

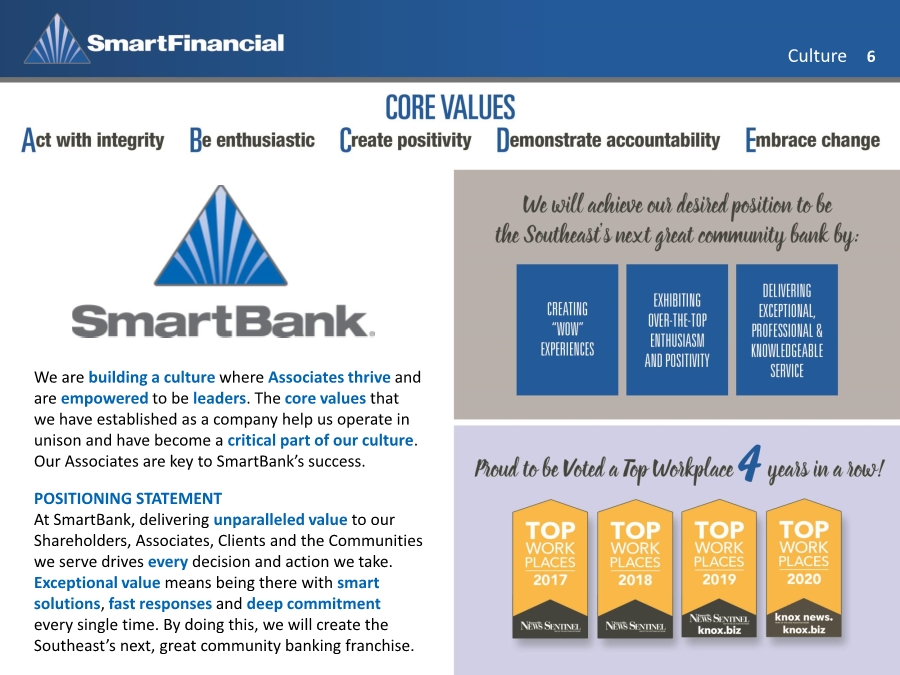
| Culture 6 We are building a culture where Associates thrive and are empowered to be leaders. The core values that we have established as a company help us operate in unison and have become a critical part of our culture. Our Associates are key to SmartBank’s success. POSITIONING STATEMENT At SmartBank, delivering unparalleled value to our Shareholders, Associates, Clients and the Communities we serve drives every decision and action we take. Exceptional value means being there with smart solutions, fast responses and deep commitment every single time. By doing this, we will create the Southeast’s next, great community banking franchise. |
| Third Quarter Financial Highlights |

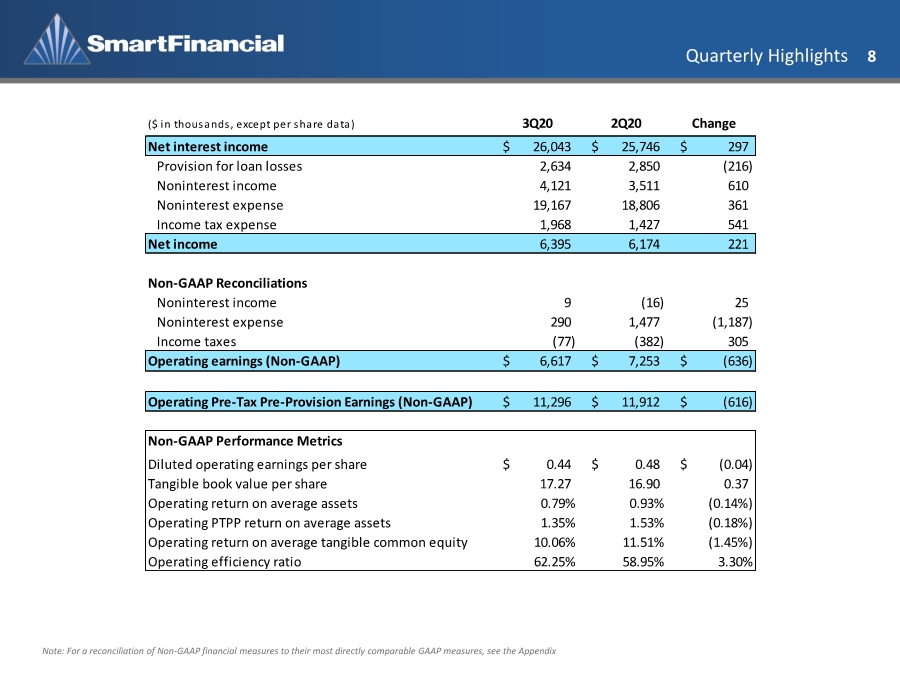
| Quarterly Highlights 8 Note: For a reconciliation of Non-GAAP financial measures to their most directly comparable GAAP measures, see the Appendix ($ in thousands, except per share data) 3Q20 2Q20 Change Net interest income 26,043 $ 25,746 $ 297 $ Provision for loan losses 2,634 2,850 (216) Noninterest income 4,121 3,511 610 Noninterest expense 19,167 18,806 361 Income tax expense 1,968 1,427 541 Net income 6,395 6,174 221 Non-GAAP Reconciliations Noninterest income 9 (16) 25 Noninterest expense 290 1,477 (1,187) Income taxes (77) (382) 305 Operating earnings (Non-GAAP) 6,617 $ 7,253 $ (636) $ Operating Pre-Tax Pre-Provision Earnings (Non-GAAP) 11,296 $ 11,912 $ (616) $ Non-GAAP Performance Metrics Diluted operating earnings per share 0.44 $ 0.48 $ (0.04) $ Tangible book value per share 17.27 16.90 0.37 Operating return on average assets 0.79% 0.93% (0.14%) Operating PTPP return on average assets 1.35% 1.53% (0.18%) Operating return on average tangible common equity 10.06% 11.51% (1.45%) Operating efficiency ratio 62.25% 58.95% 3.30% |
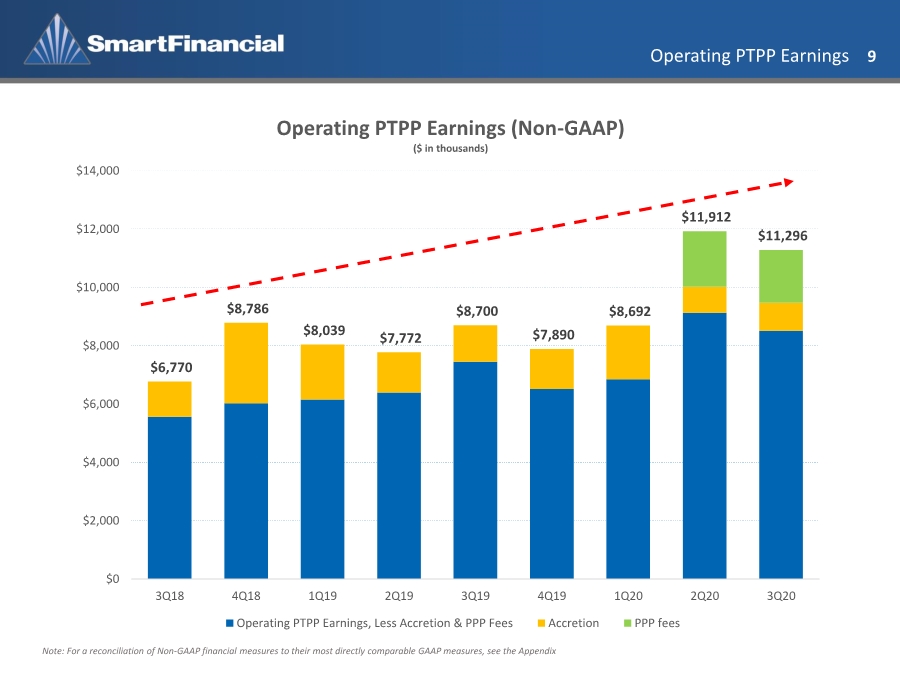
| Operating PTPP Earnings 9 Note: For a reconciliation of Non-GAAP financial measures to their most directly comparable GAAP measures, see the Appendix $6,770 $8,786 $8,039 $7,772 $8,700 $7,890 $8,692 $11,912 $11,296 $0 $2,000 $4,000 $6,000 $8,000 $10,000 $12,000 $14,000 3Q18 4Q18 1Q19 2Q19 3Q19 4Q19 1Q20 2Q20 3Q20 Operating PTPP Earnings (Non-GAAP) ($ in thousands) Operating PTPP Earnings, Less Accretion & PPP Fees Accretion PPP fees |
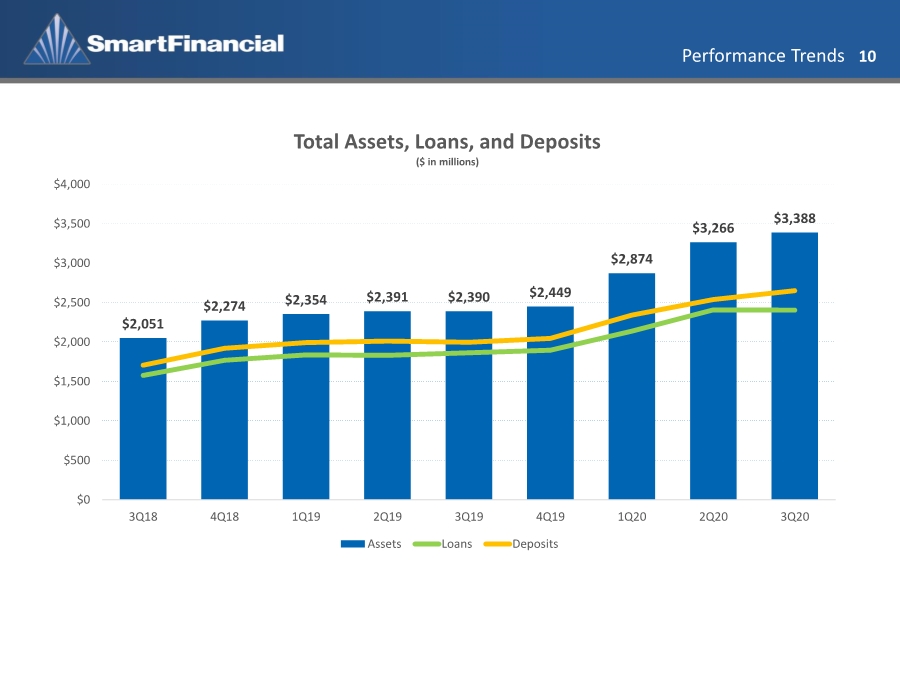
| Performance Trends 10 $2,051 $2,274 $2,354 $2,391 $2,390 $2,449 $2,874 $3,266 $3,388 $0 $500 $1,000 $1,500 $2,000 $2,500 $3,000 $3,500 $4,000 3Q18 4Q18 1Q19 2Q19 3Q19 4Q19 1Q20 2Q20 3Q20 Total Assets, Loans, and Deposits ($ in millions) Assets Loans Deposits |
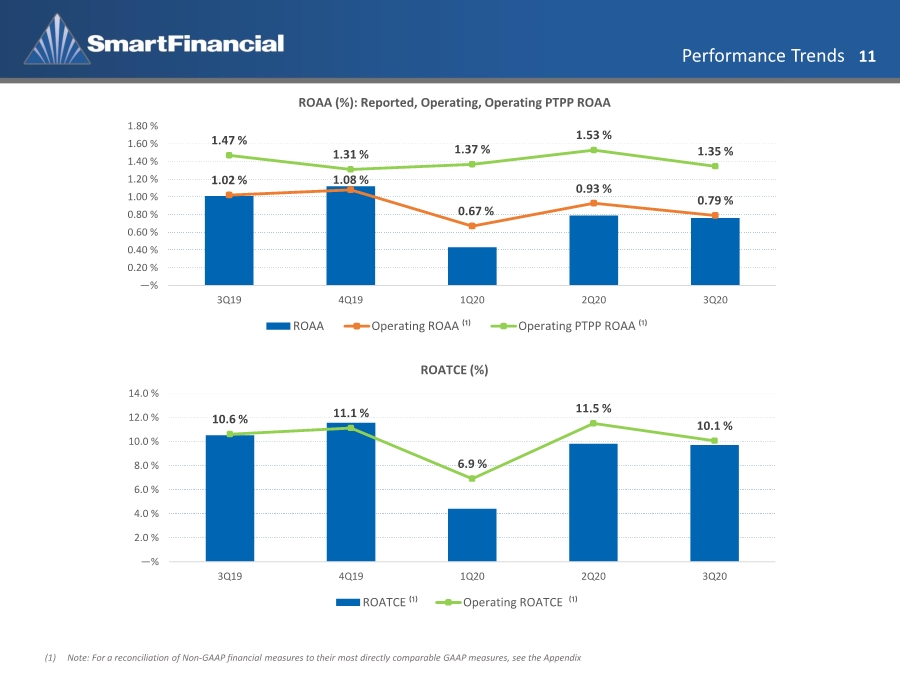
| Performance Trends 11 (1) Note: For a reconciliation of Non-GAAP financial measures to their most directly comparable GAAP measures, see the Appendix 1.02 % 1.08 % 0.67 % 0.93 % 0.79 % 1.47 % 1.31 % 1.37 % 1.53 % 1.35 % —% 0.20 % 0.40 % 0.60 % 0.80 % 1.00 % 1.20 % 1.40 % 1.60 % 1.80 % 3Q19 4Q19 1Q20 2Q20 3Q20 ROAA (%): Reported, Operating, Operating PTPP ROAA ROAA Operating ROAA ⁽¹⁾ Operating PTPP ROAA ⁽¹⁾ 10.6 % 11.1 % 6.9 % 11.5 % 10.1 % —% 2.0 % 4.0 % 6.0 % 8.0 % 10.0 % 12.0 % 14.0 % 3Q19 4Q19 1Q20 2Q20 3Q20 ROATCE (%) ROATCE ⁽¹⁾ Operating ROATCE ⁽¹⁾ |
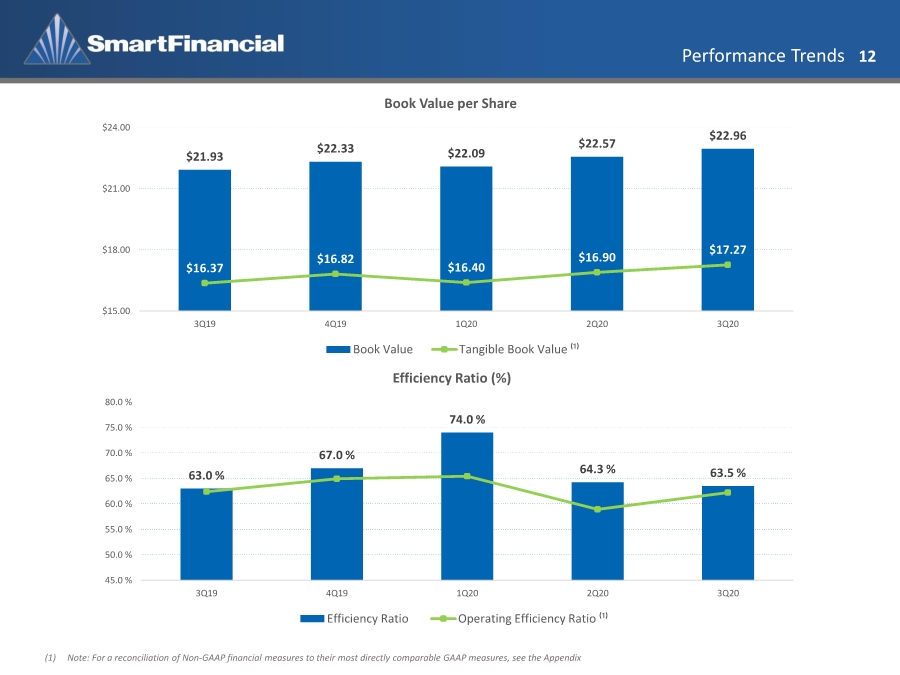
| Performance Trends 12 (1) Note: For a reconciliation of Non-GAAP financial measures to their most directly comparable GAAP measures, see the Appendix $21.93 $22.33 $22.09 $22.57 $22.96 $16.37 $16.82 $16.40 $16.90 $17.27 $15.00 $18.00 $21.00 $24.00 3Q19 4Q19 1Q20 2Q20 3Q20 Book Value per Share Book Value Tangible Book Value ⁽¹⁾ 63.0 % 67.0 % 74.0 % 64.3 % 63.5 % 45.0 % 50.0 % 55.0 % 60.0 % 65.0 % 70.0 % 75.0 % 80.0 % 3Q19 4Q19 1Q20 2Q20 3Q20 Efficiency Ratio (%) Efficiency Ratio Operating Efficiency Ratio ⁽¹⁾ |
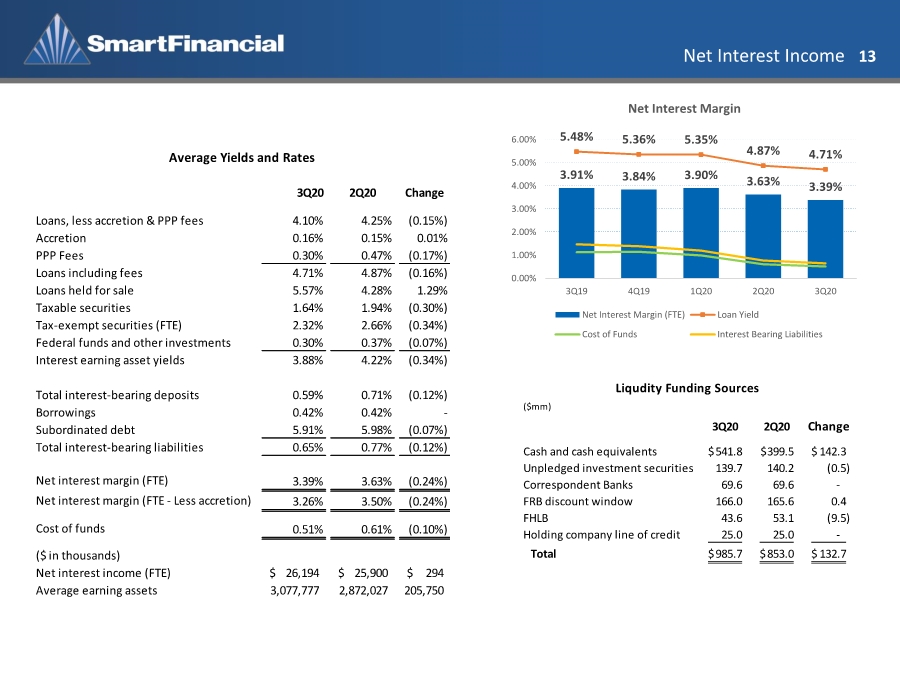
| Net Interest Income 13 3Q20 2Q20 Change Loans, less accretion & PPP fees 4.10% 4.25% (0.15%) Accretion 0.16% 0.15% 0.01% PPP Fees 0.30% 0.47% (0.17%) Loans including fees 4.71% 4.87% (0.16%) Loans held for sale 5.57% 4.28% 1.29% Taxable securities 1.64% 1.94% (0.30%) Tax-exempt securities (FTE) 2.32% 2.66% (0.34%) Federal funds and other investments 0.30% 0.37% (0.07%) Interest earning asset yields 3.88% 4.22% (0.34%) Total interest-bearing deposits 0.59% 0.71% (0.12%) Borrowings 0.42% 0.42% - Subordinated debt 5.91% 5.98% (0.07%) Total interest-bearing liabilities 0.65% 0.77% (0.12%) Net interest margin (FTE) 3.39% 3.63% (0.24%) Net interest margin (FTE - Less accretion) 3.26% 3.50% (0.24%) Cost of funds 0.51% 0.61% (0.10%) ($ in thousands) Net interest income (FTE) 26,194 $ 25,900 $ 294 $ Average earning assets 3,077,777 2,872,027 205,750 Average Yields and Rates 3.91% 3.84% 3.90% 3.63% 3.39% 5.48% 5.36% 5.35% 4.87% 4.71% 0.00% 1.00% 2.00% 3.00% 4.00% 5.00% 6.00% 3Q19 4Q19 1Q20 2Q20 3Q20 Net Interest Margin Net Interest Margin (FTE) Loan Yield Cost of Funds Interest Bearing Liabilities ($mm) 3Q20 2Q20 Change Cash and cash equivalents 541.8 $ 399.5 $ 142.3 $ Unpledged investment securities 139.7 140.2 (0.5) Correspondent Banks 69.6 69.6 - FRB discount window 166.0 165.6 0.4 FHLB 43.6 53.1 (9.5) Holding company line of credit 25.0 25.0 - Total 985.7 $ 853.0 $ 132.7 $ Liqudity Funding Sources |
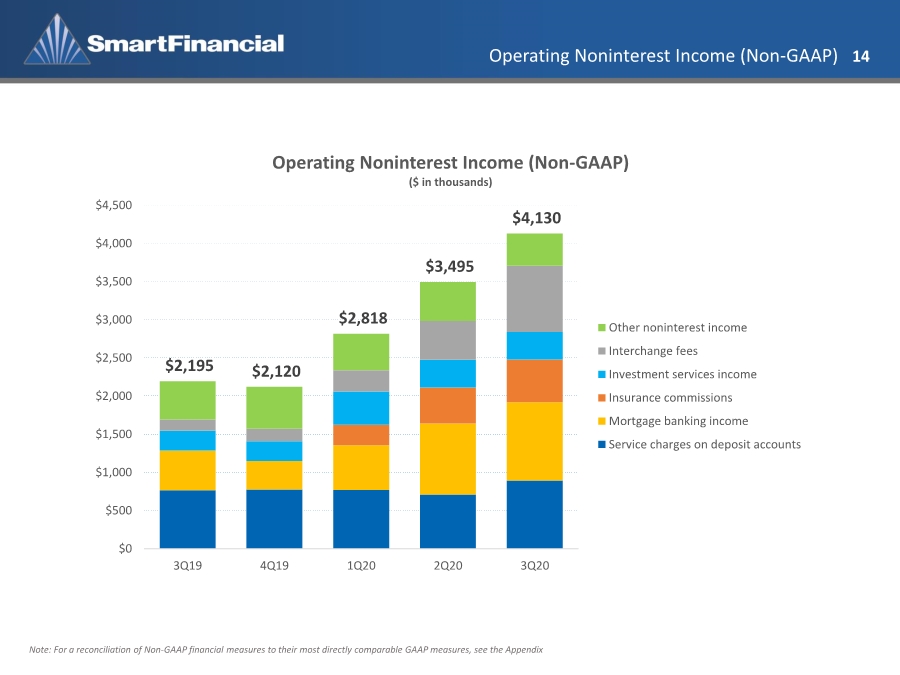
| Operating Noninterest Income (Non-GAAP) 14 Note: For a reconciliation of Non-GAAP financial measures to their most directly comparable GAAP measures, see the Appendix $2,195 $2,120 $2,818 $3,495 $4,130 $0 $500 $1,000 $1,500 $2,000 $2,500 $3,000 $3,500 $4,000 $4,500 3Q19 4Q19 1Q20 2Q20 3Q20 Operating Noninterest Income (Non-GAAP) ($ in thousands) Other noninterest income Interchange fees Investment services income Insurance commissions Mortgage banking income Service charges on deposit accounts |
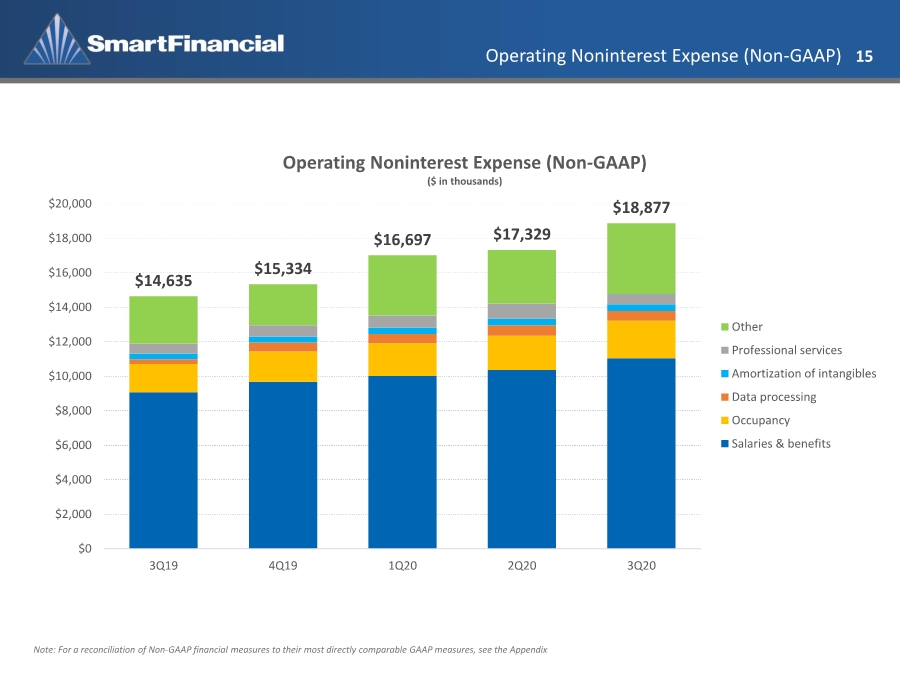
| Operating Noninterest Expense (Non-GAAP) 15 Note: For a reconciliation of Non-GAAP financial measures to their most directly comparable GAAP measures, see the Appendix $14,635 $15,334 $16,697 $17,329 $18,877 $0 $2,000 $4,000 $6,000 $8,000 $10,000 $12,000 $14,000 $16,000 $18,000 $20,000 3Q19 4Q19 1Q20 2Q20 3Q20 Operating Noninterest Expense (Non-GAAP) ($ in thousands) Other Professional services Amortization of intangibles Data processing Occupancy Salaries & benefits |
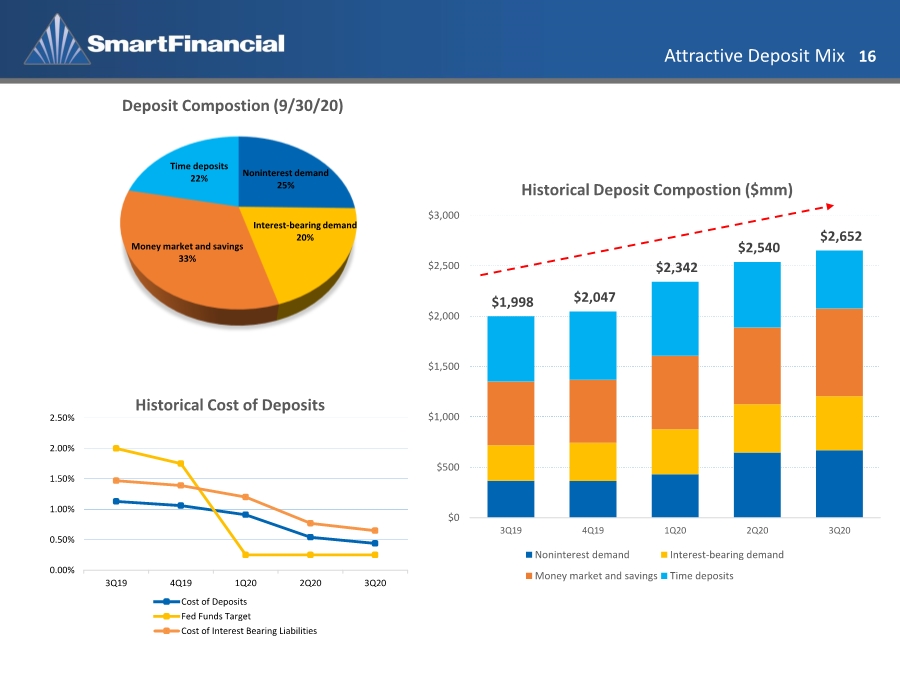
| Attractive Deposit Mix 16 Noninterest demand 25% Interest-bearing demand 20% Money market and savings 33% Time deposits 22% Deposit Compostion (9/30/20) 0.00% 0.50% 1.00% 1.50% 2.00% 2.50% 3Q19 4Q19 1Q20 2Q20 3Q20 Historical Cost of Deposits Cost of Deposits Fed Funds Target Cost of Interest Bearing Liabilities $1,998 $2,047 $2,342 $2,540 $2,652 $0 $500 $1,000 $1,500 $2,000 $2,500 $3,000 3Q19 4Q19 1Q20 2Q20 3Q20 Historical Deposit Compostion ($mm) Noninterest demand Interest-bearing demand Money market and savings Time deposits |
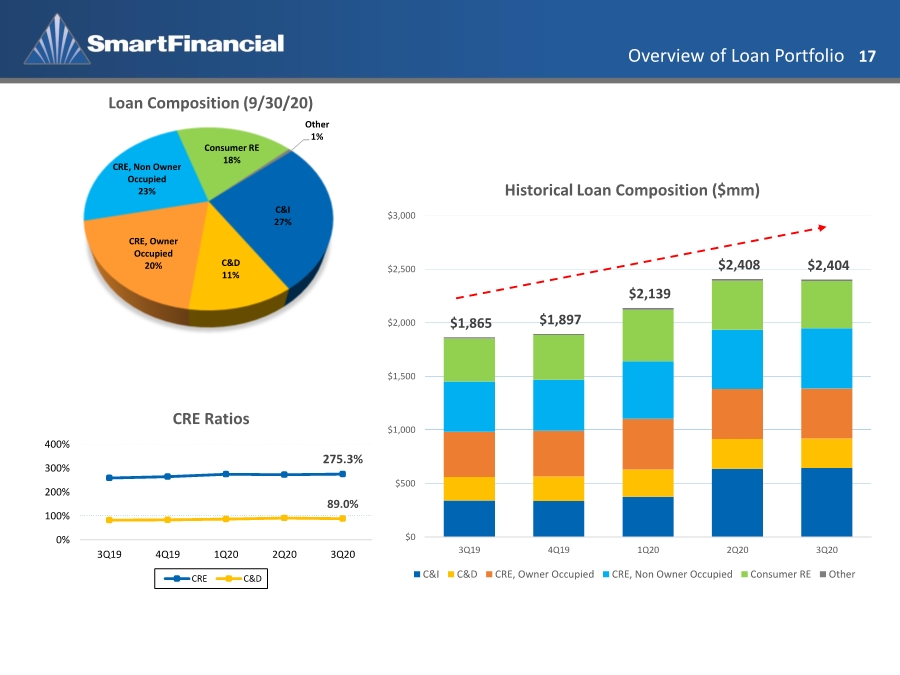
| Overview of Loan Portfolio 17 C&I 27% C&D 11% CRE, Owner Occupied 20% CRE, Non Owner Occupied 23% Consumer RE 18% Other 1% Loan Composition (9/30/20) $1,865 $1,897 $2,139 $2,408 $2,404 $0 $500 $1,000 $1,500 $2,000 $2,500 $3,000 3Q19 4Q19 1Q20 2Q20 3Q20 Historical Loan Composition ($mm) C&I C&D CRE, Owner Occupied CRE, Non Owner Occupied Consumer RE Other 275.3% 89.0% 0% 100% 200% 300% 400% 3Q19 4Q19 1Q20 2Q20 3Q20 CRE Ratios CRE C&D |
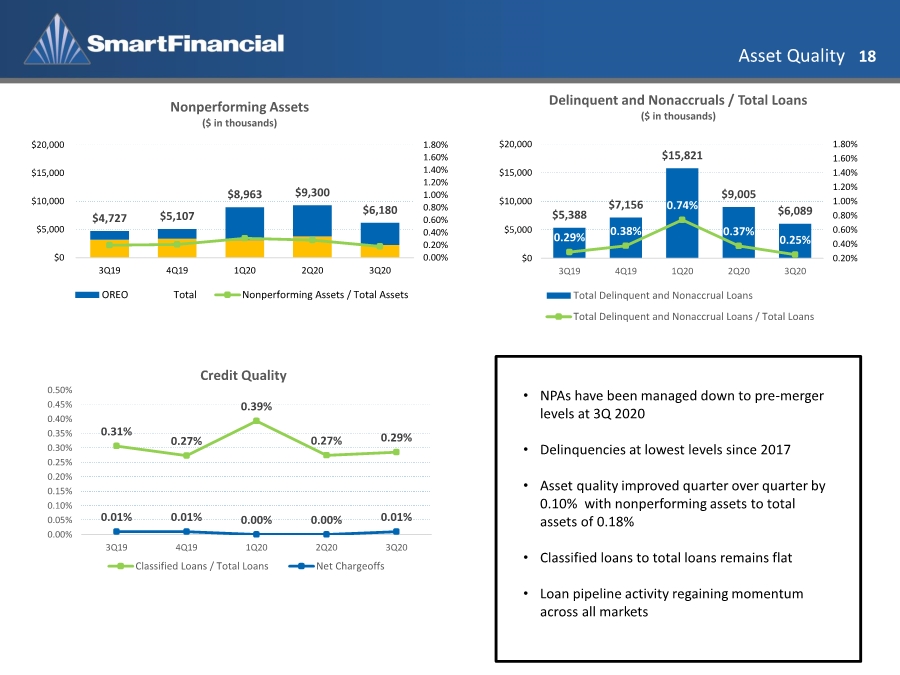
| Asset Quality 18 $5,388 $7,156 $15,821 $9,005 $6,089 0.29% 0.38% 0.74% 0.37% 0.25% 0.20% 0.40% 0.60% 0.80% 1.00% 1.20% 1.40% 1.60% 1.80% $0 $5,000 $10,000 $15,000 $20,000 3Q19 4Q19 1Q20 2Q20 3Q20 Delinquent and Nonaccruals / Total Loans ($ in thousands) Total Delinquent and Nonaccrual Loans Total Delinquent and Nonaccrual Loans / Total Loans $4,727 $5,107 $8,963 $9,300 $6,180 0.00% 0.20% 0.40% 0.60% 0.80% 1.00% 1.20% 1.40% 1.60% 1.80% $0 $5,000 $10,000 $15,000 $20,000 3Q19 4Q19 1Q20 2Q20 3Q20 Nonperforming Assets ($ in thousands) OREO Total Nonperforming Assets / Total Assets 0.31% 0.27% 0.39% 0.27% 0.29% 0.01% 0.01% 0.00% 0.00% 0.01% 0.00% 0.05% 0.10% 0.15% 0.20% 0.25% 0.30% 0.35% 0.40% 0.45% 0.50% 3Q19 4Q19 1Q20 2Q20 3Q20 Credit Quality Classified Loans / Total Loans Net Chargeoffs • NPAs have been managed down to pre-merger levels at 3Q 2020 • Delinquencies at lowest levels since 2017 • Asset quality improved quarter over quarter by 0.10% with nonperforming assets to total assets of 0.18% • Classified loans to total loans remains flat • Loan pipeline activity regaining momentum across all markets |
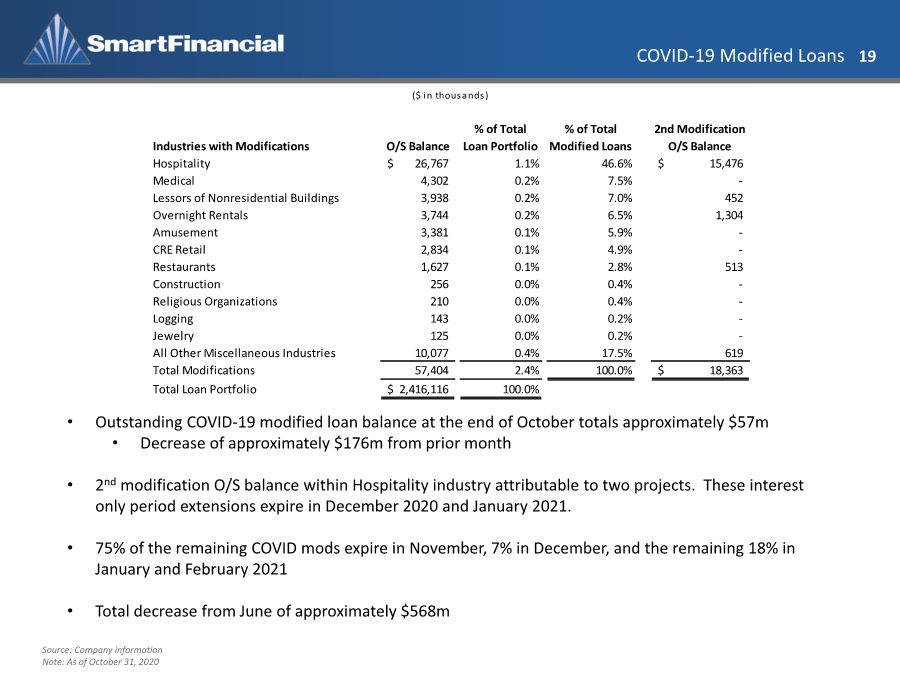
| COVID-19 Modified Loans 19 Source: Company information Note: As of October 31, 2020 • Outstanding COVID-19 modified loan balance at the end of October totals approximately $57m • Decrease of approximately $176m from prior month • 2nd modification O/S balance within Hospitality industry attributable to two projects. These interest only period extensions expire in December 2020 and January 2021. • 75% of the remaining COVID mods expire in November, 7% in December, and the remaining 18% in January and February 2021 • Total decrease from June of approximately $568m Industries with Modifications O/S Balance % of Total Loan Portfolio % of Total Modified Loans 2nd Modification O/S Balance Hospitality 26,767 $ 1.1% 46.6% 15,476 $ Medical 4,302 0.2% 7.5% - Lessors of Nonresidential Buildings 3,938 0.2% 7.0% 452 Overnight Rentals 3,744 0.2% 6.5% 1,304 Amusement 3,381 0.1% 5.9% - CRE Retail 2,834 0.1% 4.9% - Restaurants 1,627 0.1% 2.8% 513 Construction 256 0.0% 0.4% - Religious Organizations 210 0.0% 0.4% - Logging 143 0.0% 0.2% - Jewelry 125 0.0% 0.2% - All Other Miscellaneous Industries 10,077 0.4% 17.5% 619 Total Modifications 57,404 2.4% 100.0% 18,363 $ Total Loan Portfolio 2,416,116 $ 100.0% ($ in thousands) |
| Paycheck Protection Program 20 Client, 67.8% Non-Client, 32.2% Total PPP Loans: Client vs. Non-Client ($ in thousands) Source: Company information Note: As of September 30, 2020 State Loan Amount Loan Count Client Loan Amount Non-Client Loan Amount Alabama $59,253 557 40,174 $ 19,079 $ Florida 21,729 207 14,732 6,997 Georgia 9,163 78 6,213 2,950 Tennessee 200,159 2,065 135,708 64,451 Other 10,485 50 7,109 3,376 Total $300,789 2,957 203,936 $ 96,853 $ Total PPP Loans Level Loan Amount Loan Count % of Total Count $50,000 and less 33,074 $ 1,877 63.5% Greater than $50,000 267,715 1,080 36.5% Total 300,789 $ 2,957 100.0% PPP Loan Forgiveness |

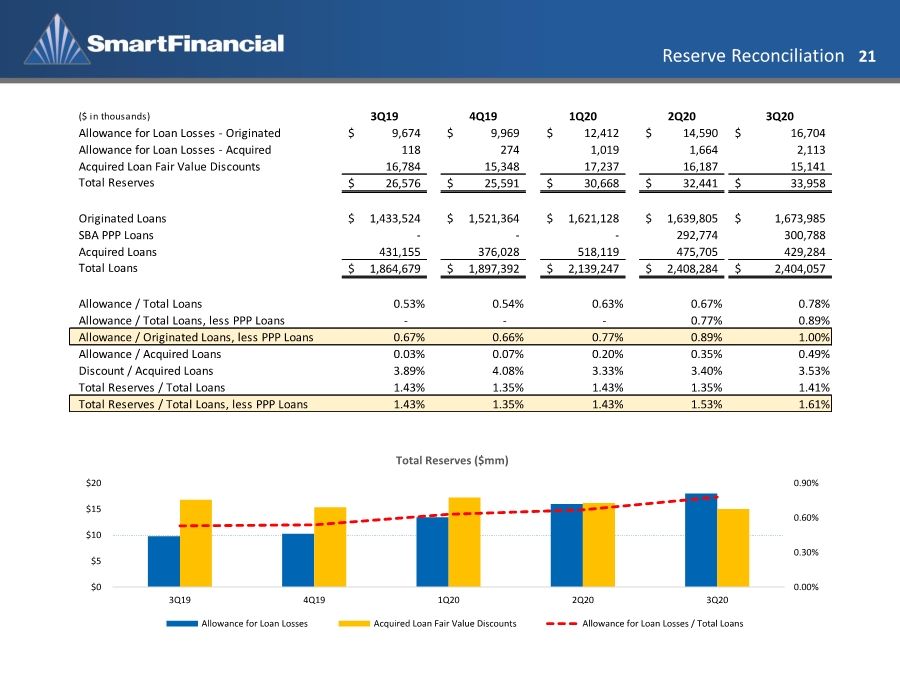
| Reserve Reconciliation 21 ($ in thousands) 3Q19 4Q19 1Q20 2Q20 3Q20 Allowance for Loan Losses - Originated 9,674 $ 9,969 $ 12,412 $ 14,590 $ 16,704 $ Allowance for Loan Losses - Acquired 118 274 1,019 1,664 2,113 Acquired Loan Fair Value Discounts 16,784 15,348 17,237 16,187 15,141 Total Reserves 26,576 $ 25,591 $ 30,668 $ 32,441 $ 33,958 $ Originated Loans 1,433,524 $ 1,521,364 $ 1,621,128 $ 1,639,805 $ 1,673,985 $ SBA PPP Loans - - - 292,774 300,788 Acquired Loans 431,155 376,028 518,119 475,705 429,284 Total Loans 1,864,679 $ 1,897,392 $ 2,139,247 $ 2,408,284 $ 2,404,057 $ Allowance / Total Loans 0.53% 0.54% 0.63% 0.67% 0.78% Allowance / Total Loans, less PPP Loans - - - 0.77% 0.89% Allowance / Originated Loans, less PPP Loans 0.67% 0.66% 0.77% 0.89% 1.00% Allowance / Acquired Loans 0.03% 0.07% 0.20% 0.35% 0.49% Discount / Acquired Loans 3.89% 4.08% 3.33% 3.40% 3.53% Total Reserves / Total Loans 1.43% 1.35% 1.43% 1.35% 1.41% Total Reserves / Total Loans, less PPP Loans 1.43% 1.35% 1.43% 1.53% 1.61% 0.00% 0.30% 0.60% 0.90% $0 $5 $10 $15 $20 3Q19 4Q19 1Q20 2Q20 3Q20 Total Reserves ($mm) Allowance for Loan Losses Acquired Loan Fair Value Discounts Allowance for Loan Losses / Total Loans |
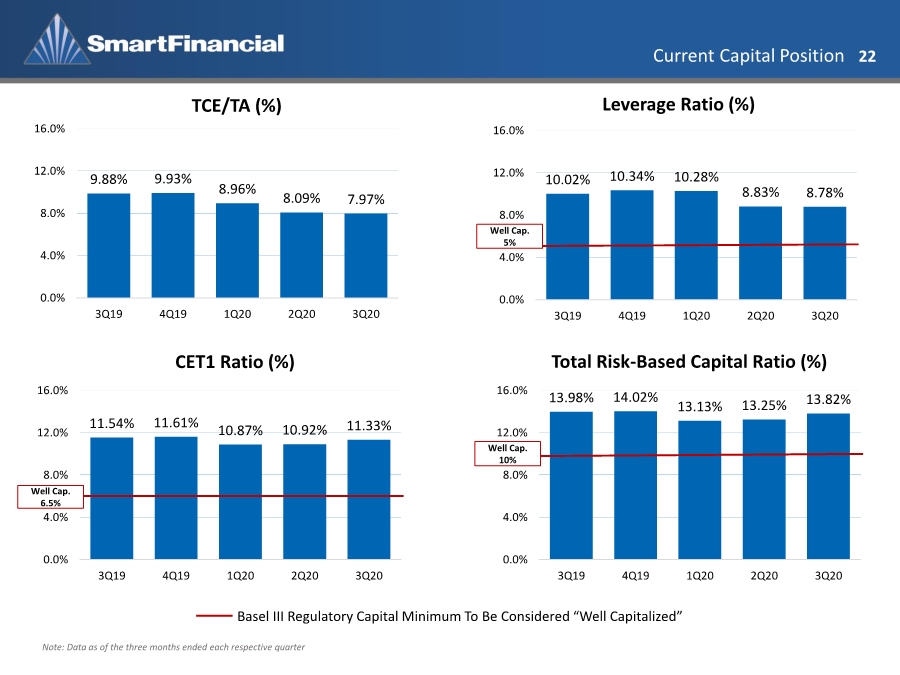
| Current Capital Position 22 Note: Data as of the three months ended each respective quarter Basel III Regulatory Capital Minimum To Be Considered “Well Capitalized” 9.88% 9.93% 8.96% 8.09% 7.97% 0.0% 4.0% 8.0% 12.0% 16.0% 3Q19 4Q19 1Q20 2Q20 3Q20 10.02% 10.34% 10.28% 8.83% 8.78% 0.0% 4.0% 8.0% 12.0% 16.0% 3Q19 4Q19 1Q20 2Q20 3Q20 11.54% 11.61% 10.87% 10.92% 11.33% 0.0% 4.0% 8.0% 12.0% 16.0% 3Q19 4Q19 1Q20 2Q20 3Q20 13.98% 14.02% 13.13% 13.25% 13.82% 0.0% 4.0% 8.0% 12.0% 16.0% 3Q19 4Q19 1Q20 2Q20 3Q20 TCE/TA (%) Leverage Ratio (%) CET1 Ratio (%) Total Risk-Based Capital Ratio (%) Well Cap. 5% Well Cap. 6.5% Well Cap. 10% |
| Appendix |

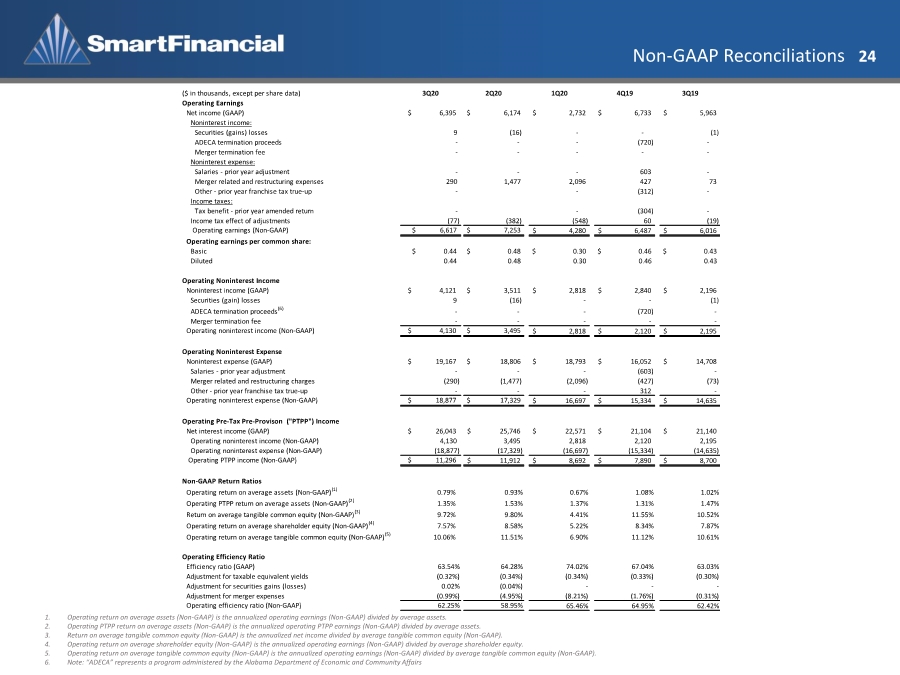
| Non-GAAP Reconciliations 24 1. Operating return on average assets (Non-GAAP) is the annualized operating earnings (Non-GAAP) divided by average assets. 2. Operating PTPP return on average assets (Non-GAAP) is the annualized operating PTPP earnings (Non-GAAP) divided by average assets. 3. Return on average tangible common equity (Non-GAAP) is the annualized net income divided by average tangible common equity (Non-GAAP). 4. Operating return on average shareholder equity (Non-GAAP) is the annualized operating earnings (Non-GAAP) divided by average shareholder equity. 5. Operating return on average tangible common equity (Non-GAAP) is the annualized operating earnings (Non-GAAP) divided by average tangible common equity (Non-GAAP). 6. Note: “ADECA” represents a program administered by the Alabama Department of Economic and Community Affairs ($ in thousands, except per share data) 3Q20 2Q20 1Q20 4Q19 3Q19 Operating Earnings Net income (GAAP) $ 6,395 $ 6,174 2,732 $ 6,733 $ 5,963 $ Noninterest income: Securities (gains) losses 9 (16) - - (1) ADECA termination proceeds - - - (720) - Merger termination fee - - - - - Noninterest expense: Salaries - prior year adjustment - - - 603 - Merger related and restructuring expenses 290 1,477 2,096 427 73 Other - prior year franchise tax true-up - - (312) - Income taxes: Tax benefit - prior year amended return - - (304) - Income tax effect of adjustments (77) (382) (548) 60 (19) Operating earnings (Non-GAAP) $ 6,617 $ 7,253 4,280 $ 6,487 $ 6,016 $ Operating earnings per common share: Basic $ 0.44 $ 0.48 $ 0.30 $ 0.46 $ 0.43 Diluted 0.44 0.48 0.30 0.46 0.43 Operating Noninterest Income Noninterest income (GAAP) $ 4,121 $ 3,511 2,818 $ 2,840 $ 2,196 $ Securities (gain) losses 9 (16) - - (1) ADECA termination proceeds(6) - - - (720) - Merger termination fee - - - - - Operating noninterest income (Non-GAAP) $ 4,130 $ 3,495 2,818 $ 2,120 $ 2,195 $ Operating Noninterest Expense Noninterest expense (GAAP) $ 19,167 $ 18,806 18,793 $ 16,052 $ 14,708 $ Salaries - prior year adjustment - - - (603) - Merger related and restructuring charges (290) (1,477) (2,096) (427) (73) Other - prior year franchise tax true-up - - - 312 - Operating noninterest expense (Non-GAAP) $ 18,877 $ 17,329 16,697 $ 15,334 $ 14,635 $ Operating Pre-Tax Pre-Provison ("PTPP") Income Net interest income (GAAP) $ 26,043 25,746 $ 22,571 $ 21,104 $ 21,140 $ Operating noninterest income (Non-GAAP) 4,130 3,495 2,818 2,120 2,195 Operating noninterest expense (Non-GAAP) (18,877) (17,329) (16,697) (15,334) (14,635) Operating PTPP income (Non-GAAP) $ 11,296 11,912 $ 8,692 $ 7,890 $ 8,700 $ Non-GAAP Return Ratios Operating return on average assets (Non-GAAP)(1) 0.79% 0.93% 0.67% 1.08% 1.02% Operating PTPP return on average assets (Non-GAAP)(2) 1.35% 1.53% 1.37% 1.31% 1.47% Return on average tangible common equity (Non-GAAP)(3) 9.72% 9.80% 4.41% 11.55% 10.52% Operating return on average shareholder equity (Non-GAAP)(4) 7.57% 8.58% 5.22% 8.34% 7.87% Operating return on average tangible common equity (Non-GAAP)(5) 10.06% 11.51% 6.90% 11.12% 10.61% Operating Efficiency Ratio Efficiency ratio (GAAP) 63.54% 64.28% 74.02% 67.04% 63.03% Adjustment for taxable equivalent yields (0.32%) (0.34%) (0.34%) (0.33%) (0.30%) Adjustment for securities gains (losses) 0.02% (0.04%) --- Adjustment for merger expenses (0.99%) (4.95%) (8.21%) (1.76%) (0.31%) Operating efficiency ratio (Non-GAAP) 62.25% 58.95% 65.46% 64.95% 62.42% |
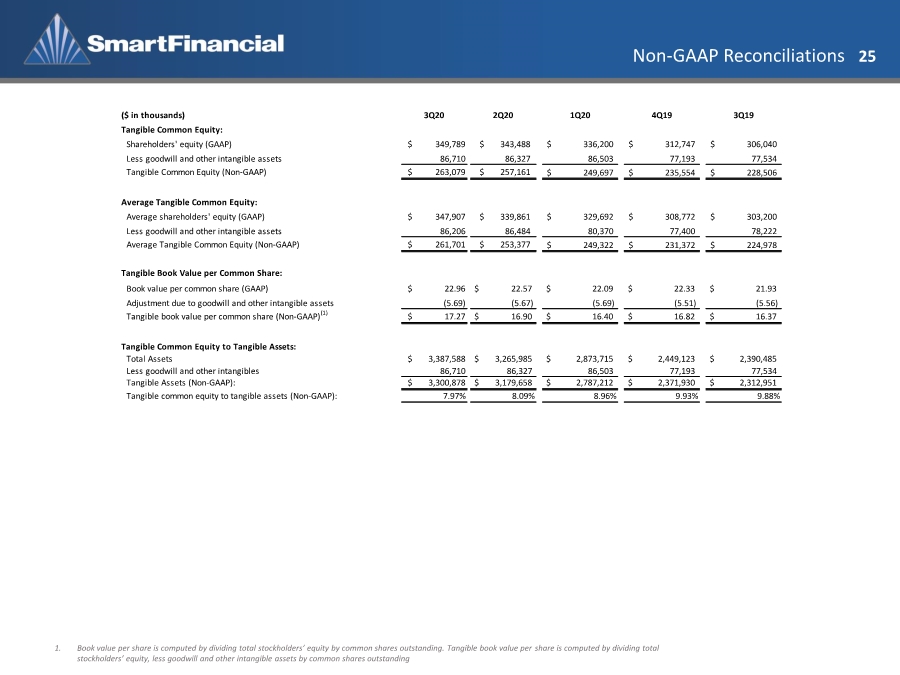
| Non-GAAP Reconciliations 25 1. Book value per share is computed by dividing total stockholders’ equity by common shares outstanding. Tangible book value per share is computed by dividing total stockholders’ equity, less goodwill and other intangible assets by common shares outstanding ($ in thousands) 3Q20 2Q20 1Q20 4Q19 3Q19 Tangible Common Equity: Shareholders' equity (GAAP) $ 349,789 $ 343,488 336,200 $ 312,747 $ 306,040 $ Less goodwill and other intangible assets 86,710 86,327 86,503 77,193 77,534 Tangible Common Equity (Non-GAAP) $ 263,079 $ 257,161 249,697 $ 235,554 $ 228,506 $ Average Tangible Common Equity: Average shareholders' equity (GAAP) $ 347,907 $ 339,861 329,692 $ 308,772 $ 303,200 $ Less goodwill and other intangible assets 86,206 86,484 80,370 77,400 78,222 Average Tangible Common Equity (Non-GAAP) $ 261,701 $ 253,377 249,322 $ 231,372 $ 224,978 $ Tangible Book Value per Common Share: Book value per common share (GAAP) $ 22.96 $ 22.57 $ 22.09 $ 22.33 $ 21.93 Adjustment due to goodwill and other intangible assets (5.69) (5.67) (5.69) (5.51) (5.56) Tangible book value per common share (Non-GAAP)(1) $ 17.27 $ 16.90 $ 16.40 $ 16.82 $ 16.37 Tangible Common Equity to Tangible Assets: Total Assets $ 3,387,588 $ 3,265,985 $ 2,873,715 $ 2,449,123 $ 2,390,485 Less goodwill and other intangibles 86,710 86,327 86,503 77,193 77,534 Tangible Assets (Non-GAAP): $ 3,300,878 $ 3,179,658 $ 2,787,212 $ 2,371,930 $ 2,312,951 Tangible common equity to tangible assets (Non-GAAP): 7.97% 8.09% 8.96% 9.93% 9.88% |
| Investor Contact 26 Billy Carroll President & CEO 865.868.0613 billy.carroll@smartbank.com Miller Welborn Chairman 423.385.3067 miller.welborn@smartbank.com 5401 Kingston Pike, Suite 600 Knoxville, TN 37919 |
|