Attached files
| file | filename |
|---|---|
| EX-99.3 - EX-99.3 - DigitalBridge Group, Inc. | ex9932020q3pres.htm |
| EX-99.1 - EX-99.1 - DigitalBridge Group, Inc. | ex9912020q3pr.htm |
| 8-K - 8-K - DigitalBridge Group, Inc. | clny-20201106.htm |
| Cautionary Statement Regarding Forward-Looking Statements | ||
This presentation may contain forward-looking statements within the meaning of the federal securities laws. Forward-looking statements relate to expectations, beliefs, projections, future plans and strategies, anticipated events or trends and similar expressions concerning matters that are not historical facts. In some cases, you can identify forward-looking statements by the use of forward-looking terminology such as “may,” “will,” “should,” “expects,” “intends,” “plans,” “anticipates,” “believes,” “estimates,” “predicts,” or “potential” or the negative of these words and phrases or similar words or phrases which are predictions of or indicate future events or trends and which do not relate solely to historical matters. You can also identify forward-looking statements by discussions of strategy, plans or intentions.
Forward-looking statements involve known and unknown risks, uncertainties, assumptions and contingencies, many of which are beyond the Company’s control, and may cause the Company’s actual results to differ significantly from those expressed in any forward-looking statement. Factors that might cause such a difference include, without limitation, the Company’s ability to build the leading digital real estate provider and funding source for the occupancy, infrastructure, equity and credit needs of the world’s mobile communications and data-driven companies, the impact of COVID-19 on the global economy, including the Company’s businesses, whether the Company, including its Core FFO ex-gains/losses and hospitality segment performance, will continue to rebound from the effects of COVID-19, whether the Company’s wellness infrastructure segment, including contractual rent collections, will continue to perform well despite ongoing impacts of COVID-19, the Company’s ability to continue driving strong growth in its digital business and accelerating its digital transformation, whether the Company will realize the anticipated benefits of Wafra’s strategic investment in the Company’s digital investment management business, including whether the Wafra investment will become subject to redemption and the amount of commitments Wafra will make to the Company’s digital investment products, the Company’s ability to raise third party capital in its managed funds or co-investment structures and the pace of such fundraising (including as a result of the impact of COVID-19), the performance of DataBank, including whether the pending zColo transaction will be consummated and if so, whether it will transform DataBank into a leading U.S. edge data center operator, the actual amount of third party capital to be raised by the Company in the zColo transaction, the success and performance of the Company’s future investment product offerings, including the Digital Equity franchise and Digital Credit initiative, whether the Company will realize the anticipated benefits of its investment in Vantage Data Centers, including the performance and stability of its portfolio, whether the Company will preserve and harvest value at its legacy assets, the pace of growth in the Company’s digital investment management franchise, the Company’s ability to bring high quality digital assets onto the balance sheet, the resilience and growth in demand for digital infrastructure, the Company’s ability to simplify its business and further monetize legacy businesses and assets, including the timing and amount of proceeds to be received by the Company if any (including whether anticipated 2020 levels of OED monetizations will be achieved), the Company’s ability to consummate the pending hospitality exit transaction and the amount of net proceeds to be received by the Company from the transaction, whether the Company’s operations of its non-digital business units will result in maximizing cash flows and value over time, including the impact of COVID-19 on such operations and cash flows, the timing of and proceeds from OED monetization and its impact on the Company’s near-term liquidity, the impact of impairments, the Company’s ability to successfully negotiate accommodations with lenders or refinance its mortgage debt on wellness infrastructure assets and hospitality properties on attractive terms, or at all, and any resulting impact on the Company’s financial condition and liquidity, whether the Company will maintain or produce higher Core FFO per share (including or excluding gains and losses from sales of certain investments) in the coming quarters, or ever, the Company’s FEEUM and its ability to continue growth at the current pace or at all, whether the Company will continue to pay dividends on its preferred stock, the impact of changes to the Company’s management or board of directors, employee and organizational structure, the Company’s financial flexibility and liquidity, including borrowing capacity under its revolving credit facility (including as a result of the impact of COVID-19), the use of sales proceeds and available liquidity, the performance of the Company’s investment in CLNC (including as a result of the impact of COVID-19), including the CLNC share price as compared to book value and how the Company evaluates the Company’s investment in CLNC, the impact of management changes at CLNC, the Company’s ability to minimize balance sheet commitments to its managed investment vehicles, customer demand for datacenters, the Company's portfolio composition, the Company's expected taxable income and net cash flows, excluding the contribution of gains, the Company’s ability to pay or grow the dividend at all in the future, the impact of any changes to the Company’s management agreements with NorthStar Healthcare Income, Inc., CLNC and other managed investment vehicles, whether Colony Capital will be able to maintain its qualification as a REIT for U.S. federal income tax purposes, the timing of and ability to deploy available capital, including whether any redeployment of capital will generate higher total returns, the Company’s ability to maintain inclusion and relative performance on the RMZ, Colony Capital’s leverage, including the Company’s ability to reduce debt and the timing and amount of borrowings under its credit facility, increased interest rates and operating costs, adverse economic or real estate developments in Colony Capital’s markets, Colony Capital’s failure to successfully operate or lease acquired properties, decreased rental rates, increased vacancy rates or failure to renew or replace expiring leases, increased costs of capital expenditures, defaults on or non-renewal of leases by tenants, the impact of economic conditions (including the impact of COVID-19 on such conditions) on the borrowers of Colony Capital’s commercial real estate debt investments and the commercial mortgage loans underlying its commercial mortgage backed securities, adverse general and local economic conditions, an unfavorable capital market environment, decreased leasing activity or lease renewals, and other risks and uncertainties, including those detailed in the Company’s Annual Report on Form 10-K for the fiscal year ended December 31, 2019, Quarterly Report on Form 10-Q for the quarter ended March 31, 2020, and Quarterly Report on Form 10-Q for the quarter ended June 30, 2020, each under the heading “Risk Factors,” as such factors may be updated from time to time in our subsequent periodic filings with the U.S. Securities and Exchange Commission (“SEC”).
All forward-looking statements reflect Colony Capital’s good faith beliefs, assumptions and expectations, but they are not guarantees of future performance. Additional information about these and other factors can be found in Colony Capital’s reports filed from time to time with the SEC. Colony Capital cautions investors not to unduly rely on any forward-looking statements. The forward-looking statements speak only as of the date of this presentation. Colony Capital is under no duty to update any of these forward-looking statements after the date of this presentation, nor to conform prior statements to actual results or revised expectations, and Colony Capital does not intend to do so.
This presentation may contain statistics and other data that has been obtained or compiled from information made available by third-party service providers. Colony Capital has not independently verified such statistics or data.
This presentation is for informational purposes only and does not constitute an offer to sell or a solicitation of an offer to buy any securities of Colony Capital. This information is not intended to be indicative of future results. Actual performance of Colony Capital may vary materially.
The appendices herein contain important information that is material to an understanding of this presentation and you should read this presentation only with and in context of the appendices.
Colony Capital | Supplemental Financial Report | ||||||||
| Important Note Regarding Non-GAAP Financial Measures | ||
This supplemental package includes certain “non-GAAP” supplemental measures that are not defined by generally accepted accounting principles, or GAAP, including the financial metrics defined below, of which the calculations may from methodologies utilized by other REITs for similar performance measurements, and accordingly, may not be comparable to those of other REITs.
FFO: The Company calculates funds from operations (“FFO”) in accordance with standards established by the Board of Governors of the National Association of Real Estate Investment Trusts, which defines FFO as net income or loss calculated in accordance with GAAP, excluding (i) extraordinary items, as defined by GAAP; (ii) gains and losses from sales of depreciable real estate; (iii) impairment write-downs associated with depreciable real estate; (iv) gains and losses from a change in control in connection with interests in depreciable real estate or in-substance real estate, plus (v) real estate-related depreciation and amortization; and (vi) including similar adjustments for equity method investments. Included in FFO are gains and losses from sales of assets which are not depreciable real estate such as loans receivable, equity method investments, as well as equity and debt securities, as applicable.
Core FFO: The Company computes core funds from operations (“Core FFO”) by adjusting FFO for the following items, including the Company’s share of these items recognized by its unconsolidated partnerships and joint ventures: (i) gains and losses from sales of depreciable real estate within the Other Equity and Debt segment, net of depreciation, amortization and impairment previously adjusted for FFO; (ii) gains and losses from sales of businesses within the Investment Management segment and impairment write-downs associated with the Investment Management segment; (iii) equity-based compensation expense; (iv) effects of straight-line rent revenue and expense; (v) amortization of acquired above- and below-market lease values; (vi) amortization of deferred financing costs and debt premiums and discounts; (vii) unrealized fair value gains or losses on interest rate and foreign currency hedges, and foreign currency remeasurements; (viii) acquisition and merger related transaction costs; (ix) restructuring and merger integration costs; (x) amortization and impairment of finite-lived intangibles related to investment management contracts and customer relationships; (xi) gain on remeasurement of consolidated investment entities and the effect of amortization thereof; (xii) non-real estate fixed asset depreciation, amortization and impairment; (xiii) change in fair value of contingent consideration; and (xiv) tax effect on certain of the foregoing adjustments. Beginning with the first quarter of 2018, the Company’s Core FFO from its interest in Colony Credit Real Estate (NYSE: CLNC) represented its percentage interest multiplied by CLNC’s Core Earnings. Refer to CLNC’s filings with the SEC for the definition and calculation of Core Earnings.
FFO and Core FFO should not be considered alternatives to GAAP net income as indications of operating performance, or to cash flows from operating activities as measures of liquidity, nor as indications of the availability of funds for our cash needs, including funds available to make distributions. FFO and Core FFO should not be used as supplements to or substitutes for cash flow from operating activities computed in accordance with GAAP.
The Company uses FFO and Core FFO as supplemental performance measures because, in excluding real estate depreciation and amortization and gains and losses from property dispositions, it provides a performance measure that captures trends in occupancy rates, rental rates, and operating costs. The Company also believes that, as widely recognized measures of the performance of REITs, FFO and Core FFO will be used by investors as a basis to compare its operating performance with that of other REITs. However, because FFO and Core FFO exclude depreciation and amortization and capture neither the changes in the value of the Company’s properties that resulted from use or market conditions nor the level of capital expenditures and leasing commissions necessary to maintain the operating performance of its properties, all of which have real economic effect and could materially impact the Company’s results from operations, the utility of FFO and Core FFO as measures of the Company’s performance is limited. FFO and Core FFO should be considered only as supplements to GAAP net income as a measure of the Company’s performance. Additionally, Core FFO excludes the impact of certain fair value fluctuations, which, if they were to be realized, could have a material impact on the Company’s operating performance. The Company also presents Core FFO excluding gains and losses from sales of certain investments as well as its share of similar adjustments for CLNC. The Company believes that such a measure is useful to investors as it excludes periodic gains and losses from sales of investments that are not representative of its ongoing operations.
Digital Operating Earnings before Interest, Taxes, Depreciation and Amortization for Real Estate (EBITDAre) and Adjusted EBITDA
The Company calculates EBITDAre in accordance with the standards established by the National Association of Real Estate Investment Trusts, which defines EBITDAre as net income or loss calculated in accordance with GAAP, excluding interest, taxes, depreciation and amortization, gains or losses from the sale of depreciated property, and impairment of depreciated property. The Company calculates Adjusted EBITDA by adjusting EBITDAre for the effects of straight-line rental income/expense adjustments and amortization of acquired above- and below-market lease adjustments to rental income, equity-based compensation expense, restructuring and integration costs, transaction costs from unsuccessful deals and business combinations, litigation expense, the impact of other impairment charges, gains or losses from sales of undepreciated land, and gains or losses on early extinguishment of debt and hedging instruments. Revenues and corresponding costs related to the delivery of services that are not ongoing, such as installation services, are also excluded from Adjusted EBITDA. The Company uses EBITDAre and Adjusted EBITDA as supplemental measures of our performance because they eliminate depreciation, amortization, and the impact of the capital structure from its operating results. However, because EBITDAre and Adjusted EBITDA are calculated before recurring cash charges including interest expense and taxes, and are not adjusted for capital expenditures or other recurring cash requirements, their utilization as a cash flow measurement is limited.
Colony Capital | Supplemental Financial Report | ||||||||
| Important Note Regarding Non-GAAP Financial Measures | ||
Fee Related Earnings (“FRE”): The Company calculates FRE for its investment management business within the digital segment as base management fees, other service fee income, and other income inclusive of cost reimbursements, less compensation expense (excluding equity-based compensation), administrative expenses, and other operating expenses related to the investment management business. The Company uses FRE as a supplemental performance measure as it may provide additional insight into the profitability of the overall digital investment management business and is presented prior to the deduction for Wafra's 31.5% interest.
NOI: NOI for our real estate segments represents total property and related income less property operating expenses, adjusted for the effects of (i) straight-line rental income adjustments; (ii) amortization of acquired above- and below-market lease adjustments to rental income; and (iii) other items such as adjustments for the Company’s share of NOI of unconsolidated ventures.
The Company believes that NOI is a useful measure of operating performance of its respective real estate portfolios as it is more closely linked to the direct results of operations at the property level. NOI also reflects actual rents received during the period after adjusting for the effects of straight-line rents and amortization of above- and below- market leases; therefore, a comparison of NOI across periods better reflects the trend in occupancy rates and rental rates of the Company’s properties.
NOI excludes historical cost depreciation and amortization, which are based on different useful life estimates depending on the age of the properties, as well as adjust for the effects of real estate impairment and gains or losses on sales of depreciated properties, which eliminate differences arising from investment and disposition decisions. This allows for comparability of operating performance of the Company’s properties period over period and also against the results of other equity REITs in the same sectors. Additionally, by excluding corporate level expenses or benefits such as interest expense, any gain or loss on early extinguishment of debt and income taxes, which are incurred by the parent entity and are not directly linked to the operating performance of the Company’s properties, NOI provides a measure of operating performance independent of the Company’s capital structure and indebtedness. However, the exclusion of these items as well as others, such as capital expenditures and leasing costs, which are necessary to maintain the operating performance of the Company’s properties, and transaction costs and administrative costs, may limit the usefulness of NOI. NOI may fail to capture significant trends in these components of U.S. GAAP net income (loss) which further limits its usefulness. NOI should not be considered as an alternative to net income (loss), determined in accordance with U.S. GAAP, as an indicator of operating performance.
Pro-rata: The Company presents pro-rata financial information, which is not, and is not intended to be, a presentation in accordance with GAAP. The Company computes pro-rata financial information by applying its economic interest to each financial statement line item on an investment-by-investment basis. Similarly, noncontrolling interests’ share of assets, liabilities, profits and losses was computed by applying noncontrolling interests’ economic interest to each financial statement line item. The Company provides pro-rata financial information because it may assist investors and analysts in estimating the Company’s economic interest in its investments. However, pro-rata financial information as an analytical tool has limitations. Other equity REITs may not calculate their pro-rata information in the same methodology, and accordingly, the Company’s pro-rata information may not be comparable to such other REITs' pro-rata information. As such, the pro-rata financial information should not be considered in isolation or as a substitute for our financial statements as reported under GAAP, but may be used as a supplement to financial information as reported under GAAP.
Tenant/operator provided information: The information related to the Company’s tenants/operators that is provided in this presentation has been provided by, or derived from information provided by, such tenants/operators. The Company has not independently verified this information and has no reason to believe that such information is inaccurate in any material respect. The Company is providing this data for informational purposes only.
Colony Capital | Supplemental Financial Report | ||||||||
| Note Regarding CLNY Reportable Segments / Consolidated and OP Share of Consolidated Amounts | ||
This presentation includes supplemental financial information for the following segments: Digital Investment Management, Digital Operating, Digital Other, Wellness Infrastructure and Other.
Digital Investment Management
This business encompasses the investment and stewardship of third party capital in digital infrastructure and real estate. The Company's flagship opportunistic strategy is conducted through DCP and separately capitalized vehicles while other strategies, including digital credit and public equities, will be or are conducted through other investment vehicles. The Company earns management fees, generally based on the amount of assets or capital managed in investment vehicles, and have the potential to earn carried interest based on the performance of such investment vehicles subject to achievement of minimum return hurdles.
Digital Operating
This business is composed of balance sheet equity interests in digital infrastructure and real estate operating companies, which generally earns rental income from providing use of space and/or capacity in or on digital assets through leases, services and other agreements. The Company currently owns interests in two companies, DataBank's edge colocation data centers and Vantage stabilized hyperscale data centers ("Vantage SDC"), which are also portfolio companies under Digital IM for the equity interests owned by third party capital.
Digital Other
This segment is composed of equity interests in digital investment vehicles, the largest of which is the Company’s investment and commitment to DCP. This segment also includes the Company’s investment and commitment to the digital liquid strategies and seed investments for future digital investment vehicles.
Wellness Infrastructure
This segment is composed of a diverse portfolio of senior housing, skilled nursing facilities, medical office buildings, and hospitals. The Company earns rental income from senior housing, skilled nursing facilities and hospital assets that are under net leases to single tenants/operators and from medical office buildings which are both single tenant and multi-tenant. In addition, certain of the Company's senior housing properties are managed by operators under a RIDEA (REIT Investment Diversification and Empowerment Act) structure, which allows the Company to gain financial exposure to underlying operations of the facility in a tax efficient manner versus receiving contractual rent under a net lease arrangement.
Other
This segment is composed of other equity and debt investments ("OED") and non-digital investment management business ("Other IM"). OED encompasses a diversified group of non-digital real estate and real estate-related equity and debt investments, including shares in Colony Credit Real Estate, Inc ("CLNC"), other real estate equity and debt investments and other real estate related securities, among other holdings. Over time, the Company expects to monetize the bulk of its OED portfolio as it completes its digital evolution. Other IM, which is separate from Digital IM, encompasses the Company’s management of private real estate credit funds and related co-investment vehicles, CLNC, and NorthStar Healthcare, a public non-traded healthcare REIT. Many of the investments underlying these vehicles are co-owned by the Company’s balance sheet and categorized under OED. The Company earns management fees, generally based on the amount of assets or capital managed, and contractual incentive fees or potential carried interest based on the performance of the investment vehicles managed subject to achievement of minimum return hurdles.
Discontinued Operations
In September, the Company entered into a definitive agreement to sell five of the six hotel portfolios in its former Hospitality segment and its 55% interest in the THL Hotel Portfolio, with a total of 197 hotel properties. The sixth hotel portfolio is in the process of receivership and the other 45% interest in the THL Hotel Portfolio continues to be held by investment vehicles managed by the Company. The sale of these hotel portfolios is a strategic shift that will have a significant effect on the Company’s operations and financial results, and has met the criteria as held for sale and discontinued operations. For all current and prior periods presented, the related assets and liabilities are presented as assets and liabilities held for sale on the consolidated balance sheets and the related operating results are presented as loss from discontinued operations on the consolidated statement of operations. In December 2019, the Company completed the sale of the light industrial portfolio and its related management platform, which represented the vast majority of the former industrial segment. The Company continues to own the bulk industrial assets which remain held for sale and are presented as discontinued operations on the consolidated statements of operations.
Throughout this presentation, consolidated figures represent the interest of both the Company (and its subsidiary Colony Capital Operating Company or the “CLNY OP”) and noncontrolling interests. Figures labeled as CLNY OP share represent the Company’s pro-rata share.
Colony Capital | Supplemental Financial Report | ||||||||
| Table of Contents | ||
Page | |||||||||||
| I. | Financial Overview | ||||||||||
a. | 6 | ||||||||||
b. | 7-8 | ||||||||||
| II. | Financial Results | ||||||||||
a. | 9 | ||||||||||
b. | 10 | ||||||||||
c. | 11 | ||||||||||
d. | 12 | ||||||||||
e. | 13 | ||||||||||
| III. | Capitalization | ||||||||||
a. | 14 | ||||||||||
b. | Revolving Credit Facility | 15 | |||||||||
c. | Convertible/Exchangeable Notes & Perpetual Preferred Stock | 16 | |||||||||
d. | Debt Maturity and Amortization Schedules | 17 | |||||||||
e. | Structure | 18 | |||||||||
| IV. | Digital Investment Management | 19 | |||||||||
| V. | Digital Operating | 20 | |||||||||
| VI. | Digital Other | 21 | |||||||||
Page | |||||||||||
| VII. | Wellness Infrastructure | ||||||||||
a. | Summary Metrics and Operating Results | 22 | |||||||||
b. | Portfolio Overview | 23-24 | |||||||||
| VIII. | Other | ||||||||||
a. | Other Equity and Debt | 25-27 | |||||||||
b. | Other Investment Management | 28 | |||||||||
| IX. | Total Company Assets Under Management | 29 | |||||||||
| X. | Appendices | ||||||||||
a. | 31-32 | ||||||||||
b. | 33 | ||||||||||
c. | Reconciliation of Net Income (Loss) to Digital Investment Management FRE and Reconciliation of Net Income (Loss) to Digital Operating Adjusted EBITDA | 34 | |||||||||
d. | Discontinued Operations | 35 | |||||||||
Colony Capital | Supplemental Financial Report | 5 | ||||||||||
| Ia. Financial Overview - Summary Metrics | ||
| ($ and shares in thousands, except per share data and as noted; as of or for the three months ended September 30, 2020, unless otherwise noted) (Unaudited) | |||||
| Financial Data | |||||
| Net income (loss) attributable to common stockholders | $ | (205,784) | |||
| Net income (loss) attributable to common stockholders per basic share | (0.44) | ||||
| Core FFO | (76,697) | ||||
| Core FFO per basic share | (0.14) | ||||
| Core FFO excluding gains/losses | 4,782 | ||||
| Core FFO excluding gains/losses per basic share | 0.01 | ||||
| Balance Sheet, Capitalization and Trading Statistics | |||||
| Total consolidated assets | $ | 19,043,050 | |||
| CLNY OP share of consolidated assets | 10,087,808 | ||||
Total consolidated debt(1) | 7,165,859 | ||||
CLNY OP share of consolidated debt(1) | 3,683,660 | ||||
Shares and OP units outstanding as of September 30, 2020(2) | 535,473 | ||||
Shares and OP units outstanding as of November 2, 2020(2) | 535,439 | ||||
| Liquidation preference of perpetual preferred equity | 1,033,750 | ||||
| Insider ownership of shares and OP units as of November 2, 2020 | 10.0 | % | |||
| Digital Assets Under Management ("AUM") | $23.3 billion | ||||
| Digital Fee Earning Equity Under Management ("FEEUM") | $8.6 billion | ||||
| Total Company AUM | $46.8 billion | ||||
| Total Company FEEUM | $17.4 billion | ||||
Notes:
In evaluating the information presented throughout this presentation see the appendices to this presentation for definitions and reconciliations of non-GAAP financial measures to GAAP measures.
(1) Represents principal balance and excludes debt issuance costs, discounts and premiums. Excludes $3.5 billion consolidated, or $3.0 billion CLNY OP share, of Hospitality and THL portfolio debt and $235 million consolidated, or $120 million CLNY OP share, of Bulk Industrial portfolio debt.
(2) The Company issued Wafra five warrants to purchase up to an aggregate of 5% (on a fully-diluted, post-transaction basis) of the Company’s class A common stock. Each warrant entitles Wafra to purchase up to 5.35 million shares of the Company's class A common stock, with strike prices of $2.43, $3.00, $4.00, $5.00 and $6.00 per share for each warrant, exercisable until July 17, 2026.
Colony Capital | Supplemental Financial Report | 6 | ||||||||||
| Ib. Financial Overview - Summary of Segments | ||
| ($ in thousands; as of or for the three months ended September 30, 2020, unless otherwise noted) | Consolidated amount | CLNY OP share of consolidated amount | |||||||||
Digital Investment Management(1) | |||||||||||
| Third-party AUM ($ in millions) | $ | 22,237 | |||||||||
| FEEUM ($ in millions) | 8,554 | ||||||||||
Q3 2020 fee related earnings (FRE)(2) | 8,889 | ||||||||||
| Digital Operating | |||||||||||
Q3 2020 Adjusted EBITDA(3)(4) | 45,568 | 6,948 | |||||||||
Investment-level non-recourse financing(5) | 2,546,359 | 355,263 | |||||||||
| Digital Other | |||||||||||
| Net carrying value | 256,451 | 210,396 | |||||||||
Notes:
(1) In July 2020, the Company closed on a strategic investment from Wafra of approximately $250 million for a 31.5% ownership stake in the Digital Investment Management business. Wafra also committed over $150 million to Digital Colony’s current and future GP co-investments.
(2) For a reconciliation of net income/(loss) to FRE, please refer to the appendix to this presentation.
(3) For a reconciliation of net income/(loss) from continuing operations to Adjusted EBITDA, please refer to the appendix to this presentation.
(4) Includes a partial period of EBITDA for the Vantage SDC portfolio acquired on July 22, 2020.
(5) Represents unpaid principal balance.
Colony Capital | Supplemental Financial Report | 7 | ||||||||||
| Ib. Financial Overview - Summary of Segments (cont’d) | ||
| ($ in thousands except as noted; as of or for the three months ended September 30, 2020, unless otherwise noted) | Consolidated amount | CLNY OP share of consolidated amount | ||||||||||||
| Wellness Infrastructure | ||||||||||||||
Q3 2020 net operating income(1)(2) | $ | 61,653 | $ | 43,732 | ||||||||||
Investment-level non-recourse financing(3) | 2,773,688 | 1,963,248 | ||||||||||||
| Other | ||||||||||||||
Other Equity & Debt ("OED")(4) | ||||||||||||||
| Assets | $ | 5,228,820 | $ | 2,631,143 | ||||||||||
Debt(3) | 2,068,626 | 1,097,262 | ||||||||||||
| Equity | $ | 3,160,194 | $ | 1,533,881 | ||||||||||
| Other Investment Management | ||||||||||||||
| Third-party AUM ($ in millions) | 14,679 | |||||||||||||
| FEEUM ($ in millions) | 8,832 | |||||||||||||
| Q3 2020 fee revenue | 23,871 | |||||||||||||
| Net Assets | ||||||||||||||
Cash and cash equivalents, restricted cash and other assets(5) | $ | 1,393,008 | $ | 754,037 | ||||||||||
Accrued and other liabilities and dividends payable(6) | 760,436 | 425,928 | ||||||||||||
| Net assets | $ | 632,572 | $ | 328,109 | ||||||||||
Notes:
(1) NOI includes $1.0 million consolidated or $0.7 million CLNY OP share of interest earned related to $52 million consolidated or $37 million CLNY OP share carrying value of healthcare real estate loans. This interest income is in the Interest Income line item on the Company’s Statement of Operations.
(2) For a reconciliation of net income/(loss) from continuing operations to NOI, please refer to the appendix to this presentation.
(3) Represents unpaid principal balance.
(4) Includes all components related to real estate assets, including tangible real estate and lease-related intangibles, and assets and liabilities classified as held for sale on the Company’s financial statements. Includes THL hotel and Bulk Industrial portfolio assets and debt of $1.3 billion consolidated, or $0.7 billion CLNY OP share, and $1.1 billion consolidated, or $0.6 billion CLNY OP share, respectively. The THL hotel and Bulk Industrial portfolios are classified as held for sale and presented under discontinued operations for the third quarter 2020.
(5) Other assets excludes $15 million consolidated and CLNY OP share of margin/collateral value which is included in the assets of Digital Other investments shown on page 21 and $28.0 million consolidated or $15.6 million CLNY OP share of THL capital reserves which is included in OED assets shown on pages 25-27.
(6) Accrued and other liabilities excludes $97 million of derivative liability which is included in the debt of Digital Other investments shown on page 21 and $(47.7) million consolidated or $(26.5) million CLNY OP share of THL working capital reserves which is included in OED assets shown on pages 25-27.
Colony Capital | Supplemental Financial Report | 8 | ||||||||||
| IIa. Financial Results - Consolidated Balance Sheet | ||
| ($ in thousands, except per share data) (unaudited) | As of September 30, 2020 | |||||||
| Assets | ||||||||
| Cash and cash equivalents | $ | 658,446 | ||||||
| Restricted cash | 167,109 | |||||||
| Real estate, net | 7,860,474 | |||||||
| Loans receivable | 1,325,144 | |||||||
| Equity and debt investments | 1,911,988 | |||||||
| Goodwill | 851,757 | |||||||
| Deferred leasing costs and intangible assets, net | 1,275,039 | |||||||
| Assets held for disposition | 4,379,558 | |||||||
| Other assets | 534,734 | |||||||
| Due from affiliates | 78,801 | |||||||
| Total assets | $ | 19,043,050 | ||||||
| Liabilities | ||||||||
| Debt, net | $ | 7,085,994 | ||||||
| Accrued and other liabilities | 789,866 | |||||||
| Intangible liabilities, net | 109,616 | |||||||
| Liabilities related to assets held for disposition | 3,908,474 | |||||||
| Due to affiliates | 1,279 | |||||||
| Dividends and distributions payable | 18,516 | |||||||
| Total liabilities | 11,913,745 | |||||||
| Commitments and contingencies | ||||||||
| Redeemable noncontrolling interests | 287,231 | |||||||
| Equity | ||||||||
| Stockholders’ equity: | ||||||||
| Preferred stock, $0.01 par value per share; $1,033,750 liquidation preference; 250,000 shares authorized; 41,350 shares issued and outstanding | 999,490 | |||||||
| Common stock, $0.01 par value per share | ||||||||
| Class A, 949,000 shares authorized; 481,662 shares issued and outstanding | 4,817 | |||||||
| Class B, 1,000 shares authorized; 734 shares issued and outstanding | 7 | |||||||
| Additional paid-in capital | 7,559,551 | |||||||
| Accumulated deficit | (6,054,881) | |||||||
| Accumulated other comprehensive income | 76,610 | |||||||
| Total stockholders’ equity | 2,585,594 | |||||||
| Noncontrolling interests in investment entities | 4,085,739 | |||||||
| Noncontrolling interests in Operating Company | 170,741 | |||||||
| Total equity | 6,842,074 | |||||||
| Total liabilities, redeemable noncontrolling interests and equity | $ | 19,043,050 | ||||||
Colony Capital | Supplemental Financial Report | 9 | ||||||||||
| IIb. Financial Results - Noncontrolling Interests’ Share Balance Sheet | ||
| ($ in thousands, except per share data) (unaudited) | As of September 30, 2020 | |||||||
| Assets | ||||||||
| Cash and cash equivalents | $ | 191,729 | ||||||
| Restricted cash | 90,053 | |||||||
| Real estate, net | 4,627,456 | |||||||
| Loans receivable | 607,857 | |||||||
| Equity and debt investments | 704,460 | |||||||
| Goodwill | 463,537 | |||||||
| Deferred leasing costs and intangible assets, net | 903,806 | |||||||
| Assets held for disposition | 993,891 | |||||||
| Other assets | 372,453 | |||||||
| Total assets | $ | 8,955,242 | ||||||
| Liabilities | ||||||||
| Debt, net | $ | 3,501,057 | ||||||
| Accrued and other liabilities | 313,336 | |||||||
| Intangible liabilities, net | 53,544 | |||||||
| Liabilities related to assets held for disposition | 714,335 | |||||||
| Total liabilities | 4,582,272 | |||||||
| Commitments and contingencies | ||||||||
| Redeemable noncontrolling interests | 287,231 | |||||||
| Equity | ||||||||
| Stockholders’ equity: | ||||||||
| Preferred stock, $0.01 par value per share; $1,033,750 liquidation preference; 250,000 shares authorized; 41,350 shares issued and outstanding | — | |||||||
| Common stock, $0.01 par value per share | ||||||||
| Class A, 949,000 shares authorized; 481,662 shares issued and outstanding | — | |||||||
| Class B, 1,000 shares authorized; 734 shares issued and outstanding | — | |||||||
| Additional paid-in capital | — | |||||||
| Accumulated deficit | — | |||||||
| Accumulated other comprehensive income | — | |||||||
| Total stockholders’ equity | — | |||||||
| Noncontrolling interests in investment entities | 4,085,739 | |||||||
| Noncontrolling interests in Operating Company | — | |||||||
| Total equity | 4,085,739 | |||||||
| Total liabilities, redeemable noncontrolling interests and equity | $ | 8,955,242 | ||||||
Colony Capital | Supplemental Financial Report | 10 | ||||||||||
| IIc. Financial Results - Consolidated Segment Operating Results | ||
| Three Months Ended September 30, 2020 | |||||||||||||||||||||||||||||||||||||||||||||||
| ($ in thousands) (Unaudited) | Digital Investment Management | Digital Operating | Digital Other | Wellness Infrastructure | Other | Discontinued Operations | Amounts not allocated to segments | Total | |||||||||||||||||||||||||||||||||||||||
| Revenues | — | ||||||||||||||||||||||||||||||||||||||||||||||
| Property operating income | $ | — | $ | 98,506 | $ | 16 | $ | 120,479 | $ | 27,121 | $ | — | $ | — | $ | 246,122 | |||||||||||||||||||||||||||||||
| Interest income | 2 | — | 2 | 992 | 12,566 | — | 1,254 | 14,816 | |||||||||||||||||||||||||||||||||||||||
| Fee income | 20,048 | — | — | — | 23,871 | — | — | 43,919 | |||||||||||||||||||||||||||||||||||||||
| Other income | 87 | 43 | 718 | 2,722 | 5,740 | — | 2,510 | 11,820 | |||||||||||||||||||||||||||||||||||||||
| Total revenues | 20,137 | 98,549 | 736 | 124,193 | 69,298 | — | 3,764 | 316,677 | |||||||||||||||||||||||||||||||||||||||
| Expenses | |||||||||||||||||||||||||||||||||||||||||||||||
| Property operating expense | — | 37,544 | — | 57,459 | 13,390 | — | — | 108,393 | |||||||||||||||||||||||||||||||||||||||
| Interest expense | — | 18,589 | — | 32,310 | 6,479 | — | 14,471 | 71,849 | |||||||||||||||||||||||||||||||||||||||
| Investment and servicing expense | — | 2,237 | 1,141 | 1,031 | 24,871 | — | 1,252 | 30,532 | |||||||||||||||||||||||||||||||||||||||
| Transaction costs | — | 5 | — | — | — | — | 3,305 | 3,310 | |||||||||||||||||||||||||||||||||||||||
| Depreciation and amortization | 6,427 | 73,032 | — | 31,961 | 13,208 | — | 1,105 | 125,733 | |||||||||||||||||||||||||||||||||||||||
| Impairment loss | 3,832 | — | — | 2,451 | 29,886 | — | — | 36,169 | |||||||||||||||||||||||||||||||||||||||
| Compensation expense | — | ||||||||||||||||||||||||||||||||||||||||||||||
| Cash and equity-based compensation | 9,603 | 8,697 | — | 3,113 | 14,267 | — | 18,100 | 53,780 | |||||||||||||||||||||||||||||||||||||||
| Carried interest and incentive compensation | 912 | — | — | — | — | — | — | 912 | |||||||||||||||||||||||||||||||||||||||
| Administrative expenses | 1,846 | 2,970 | 82 | 991 | 5,853 | — | 11,758 | 23,500 | |||||||||||||||||||||||||||||||||||||||
| Total expenses | 22,620 | 143,074 | 1,223 | 129,316 | 107,954 | — | 49,991 | 454,178 | |||||||||||||||||||||||||||||||||||||||
| Other income (loss) | |||||||||||||||||||||||||||||||||||||||||||||||
| Gain on sale of real estate assets | — | — | — | 186 | 13,072 | — | — | 13,258 | |||||||||||||||||||||||||||||||||||||||
| Other gain (loss), net | 32 | (45) | 2,917 | 3,836 | (27,662) | — | (1,572) | (22,494) | |||||||||||||||||||||||||||||||||||||||
| Equity method earnings (loss) | 52 | — | 4,400 | — | (57,935) | — | — | (53,483) | |||||||||||||||||||||||||||||||||||||||
| Equity method earnings (loss) - carried interest | 6,082 | — | — | — | — | — | — | 6,082 | |||||||||||||||||||||||||||||||||||||||
| Income (loss) before income taxes | 3,683 | (44,570) | 6,830 | (1,101) | (111,181) | — | (47,799) | (194,138) | |||||||||||||||||||||||||||||||||||||||
| Income tax benefit (expense) | (144) | 6,091 | (73) | (5,868) | 10,053 | — | (137) | 9,922 | |||||||||||||||||||||||||||||||||||||||
| Income (loss) from continuing operations | 3,539 | (38,479) | 6,757 | (6,969) | (101,128) | — | (47,936) | (184,216) | |||||||||||||||||||||||||||||||||||||||
| Income (loss) from discontinued operations | — | — | — | — | — | (177,014) | — | (177,014) | |||||||||||||||||||||||||||||||||||||||
| Net income (loss) | 3,539 | (38,479) | 6,757 | (6,969) | (101,128) | (177,014) | (47,936) | (361,230) | |||||||||||||||||||||||||||||||||||||||
| Net income (loss) attributable to noncontrolling interests: | |||||||||||||||||||||||||||||||||||||||||||||||
| Redeemable noncontrolling interests | (2,681) | — | 523 | — | — | — | — | (2,158) | |||||||||||||||||||||||||||||||||||||||
| Investment entities | 4,299 | (33,154) | — | 5,629 | (65,072) | (60,856) | — | (149,154) | |||||||||||||||||||||||||||||||||||||||
| Operating Company | 191 | (528) | 618 | (1,249) | (3,575) | (11,519) | (6,589) | (22,651) | |||||||||||||||||||||||||||||||||||||||
| Net income (loss) attributable to Colony Capital, Inc. | 1,730 | (4,797) | 5,616 | (11,349) | (32,481) | (104,639) | (41,347) | (187,267) | |||||||||||||||||||||||||||||||||||||||
| Preferred stock dividends | — | — | — | — | — | — | 18,517 | 18,517 | |||||||||||||||||||||||||||||||||||||||
| Net income (loss) attributable to common stockholders | $ | 1,730 | $ | (4,797) | $ | 5,616 | $ | (11,349) | $ | (32,481) | $ | (104,639) | $ | (59,864) | $ | (205,784) | |||||||||||||||||||||||||||||||
Colony Capital | Supplemental Financial Report | 11 | ||||||||||
| IId. Financial Results - Noncontrolling Interests’ Share Segment Operating Results | ||
| Three Months Ended September 30, 2020 | |||||||||||||||||||||||||||||||||||||||||||||||
| ($ in thousands) (unaudited) | Digital Investment Management | Digital Operating | Digital Other | Wellness Infrastructure | Other | Discontinued Operations | Amounts not allocated to segments | Total | |||||||||||||||||||||||||||||||||||||||
| Revenues | — | ||||||||||||||||||||||||||||||||||||||||||||||
| Property operating income | $ | — | $ | 82,912 | $ | — | $ | 35,049 | $ | 17,149 | $ | — | $ | — | $ | 135,110 | |||||||||||||||||||||||||||||||
| Interest income | — | — | — | 300 | 5,832 | — | — | 6,132 | |||||||||||||||||||||||||||||||||||||||
| Fee income | 6,305 | — | — | — | 28 | — | — | 6,333 | |||||||||||||||||||||||||||||||||||||||
| Other income | 28 | 38 | 131 | 815 | 2,946 | — | — | 3,958 | |||||||||||||||||||||||||||||||||||||||
| Total revenues | 6,333 | 82,950 | 131 | 36,164 | 25,955 | — | — | 151,533 | |||||||||||||||||||||||||||||||||||||||
| Expenses | |||||||||||||||||||||||||||||||||||||||||||||||
| Property operating expense | — | 31,647 | — | 16,710 | 8,205 | — | — | 56,562 | |||||||||||||||||||||||||||||||||||||||
| Interest expense | — | 15,640 | — | 9,276 | 4,443 | — | — | 29,359 | |||||||||||||||||||||||||||||||||||||||
| Investment and servicing expense | — | 2,143 | 3 | 312 | 12,626 | — | — | 15,084 | |||||||||||||||||||||||||||||||||||||||
| Transaction costs | — | — | — | — | — | — | — | — | |||||||||||||||||||||||||||||||||||||||
| Depreciation and amortization | 1,394 | 62,119 | — | 9,347 | 7,187 | — | — | 80,047 | |||||||||||||||||||||||||||||||||||||||
| Impairment loss | 1,207 | — | — | 730 | 18,863 | — | — | 20,800 | |||||||||||||||||||||||||||||||||||||||
| Compensation expense | |||||||||||||||||||||||||||||||||||||||||||||||
| Cash and equity-based compensation | 2,520 | 6,956 | — | — | 2,010 | — | — | 11,486 | |||||||||||||||||||||||||||||||||||||||
| Carried interest and incentive compensation | 287 | — | — | — | — | — | — | 287 | |||||||||||||||||||||||||||||||||||||||
| Administrative expenses | 504 | 2,432 | 82 | 145 | 1,248 | — | — | 4,411 | |||||||||||||||||||||||||||||||||||||||
| Total expenses | 5,912 | 120,937 | 85 | 36,520 | 54,582 | — | — | 218,036 | |||||||||||||||||||||||||||||||||||||||
| Other income (loss) | |||||||||||||||||||||||||||||||||||||||||||||||
| Gain on sale of real estate assets | — | — | — | 38 | 8,708 | — | — | 8,746 | |||||||||||||||||||||||||||||||||||||||
| Other gain (loss), net | 10 | (39) | 477 | 1,164 | (14,965) | — | — | (13,353) | |||||||||||||||||||||||||||||||||||||||
| Equity method earnings (loss) | 41 | — | — | — | (28,328) | — | — | (28,287) | |||||||||||||||||||||||||||||||||||||||
| Equity method earnings (loss) - carried interest | 4,832 | — | — | — | — | — | — | 4,832 | |||||||||||||||||||||||||||||||||||||||
| Income (loss) before income taxes | 5,304 | (38,026) | 523 | 846 | (63,212) | — | — | (94,565) | |||||||||||||||||||||||||||||||||||||||
| Income tax benefit (expense) | (2) | 4,872 | — | (1,781) | (1,860) | — | — | 1,229 | |||||||||||||||||||||||||||||||||||||||
| Net income (loss) | 5,302 | (33,154) | 523 | (935) | (65,072) | — | — | (93,336) | |||||||||||||||||||||||||||||||||||||||
| Income (loss) from discontinued operations | — | — | — | — | (60,856) | — | (60,856) | ||||||||||||||||||||||||||||||||||||||||
| Non-pro rata allocation of income (loss) to NCI | (3,684) | — | — | 6,564 | — | — | — | 2,880 | |||||||||||||||||||||||||||||||||||||||
| Net income (loss) attributable to noncontrolling interests | $ | 1,618 | $ | (33,154) | $ | 523 | $ | 5,629 | $ | (65,072) | $ | (60,856) | $ | — | $ | (151,312) | |||||||||||||||||||||||||||||||
Colony Capital | Supplemental Financial Report | 12 | ||||||||||
IIe. Financial Results - Segment Reconciliation of Net Income to FFO & Core FFO | ||
| OP pro rata share by segment | Amounts attributable to noncontrolling interests | CLNY consolidated as reported | |||||||||||||||||||||||||||||||||||||||||||||||||||||||||
| ($ in thousands; For the Three Months Ended September 30 ,2020; and Unaudited) | Digital IM | Digital Operating | Digital Other | Wellness Infrastructure | Other | Discontinued Operations | Amounts not allocated to segments | Total OP pro rata share | |||||||||||||||||||||||||||||||||||||||||||||||||||
| Net income (loss) attributable to common stockholders | $ | 1,730 | $ | (4,797) | $ | 5,616 | $ | (11,349) | $ | (32,484) | $ | (104,636) | $ | (59,864) | $ | (205,784) | $ | — | $ | (205,784) | |||||||||||||||||||||||||||||||||||||||
| Net income (loss) attributable to noncontrolling common interests in Operating Company | 191 | (528) | 618 | (1,249) | (3,572) | (11,522) | (6,589) | (22,651) | — | (22,651) | |||||||||||||||||||||||||||||||||||||||||||||||||
| Net income (loss) attributable to common interests in Operating Company and common stockholders | 1,921 | (5,325) | 6,234 | (12,598) | (36,056) | (116,158) | (66,453) | (228,435) | — | (228,435) | |||||||||||||||||||||||||||||||||||||||||||||||||
| Adjustments for FFO: | |||||||||||||||||||||||||||||||||||||||||||||||||||||||||||
Real estate depreciation and amortization | — | 10,388 | — | 26,150 | 9,121 | 32,794 | — | 78,453 | 84,252 | 162,705 | |||||||||||||||||||||||||||||||||||||||||||||||||
Impairment of real estate | — | — | — | 1,694 | 7,312 | 63,027 | — | 72,033 | 70,734 | 142,767 | |||||||||||||||||||||||||||||||||||||||||||||||||
Gain from sales of real estate | — | — | — | (148) | (4,449) | 346 | — | (4,251) | (8,081) | (12,332) | |||||||||||||||||||||||||||||||||||||||||||||||||
Less: Adjustments attributable to noncontrolling interests in investment entities | — | — | — | — | — | — | — | — | (146,905) | (146,905) | |||||||||||||||||||||||||||||||||||||||||||||||||
| FFO | $ | 1,921 | $ | 5,063 | $ | 6,234 | $ | 15,098 | $ | (24,072) | $ | (19,991) | $ | (66,453) | $ | (82,200) | $ | — | $ | (82,200) | |||||||||||||||||||||||||||||||||||||||
| Additional adjustments for Core FFO: | |||||||||||||||||||||||||||||||||||||||||||||||||||||||||||
Gains and losses from sales of depreciable real estate within the Other segment, net of depreciation, amortization and impairment previously adjusted for FFO(1) | — | — | — | — | (4,461) | — | — | (4,461) | (6,068) | (10,529) | |||||||||||||||||||||||||||||||||||||||||||||||||
Gains and losses from sales of investment management businesses and impairment write-downs associated investment management | 2,625 | — | — | — | 3,521 | — | — | 6,146 | 1,400 | 7,546 | |||||||||||||||||||||||||||||||||||||||||||||||||
CLNC Core Earnings adjustments(2) | — | — | — | — | (27,256) | — | — | (27,256) | — | (27,256) | |||||||||||||||||||||||||||||||||||||||||||||||||
Equity-based compensation expense | 166 | 29 | — | 729 | 2,452 | 202 | 4,659 | 8,237 | 143 | 8,380 | |||||||||||||||||||||||||||||||||||||||||||||||||
Straight-line rent revenue and expense | 10 | (249) | — | (1,983) | (122) | (192) | (224) | (2,760) | (3,522) | (6,282) | |||||||||||||||||||||||||||||||||||||||||||||||||
Amortization of acquired above- and below-market lease values, net | — | 106 | — | (1,563) | 68 | (8) | — | (1,397) | 21 | (1,376) | |||||||||||||||||||||||||||||||||||||||||||||||||
Amortization of deferred financing costs and debt premiums and discounts | — | (397) | 33 | 1,896 | (1,440) | 2,403 | 3,099 | 5,594 | (1,212) | 4,382 | |||||||||||||||||||||||||||||||||||||||||||||||||
Unrealized fair value losses on interest rate and foreign currency hedges, and foreign currency remeasurements | — | (11) | — | (2,705) | 5,909 | — | — | 3,193 | (1,241) | 1,952 | |||||||||||||||||||||||||||||||||||||||||||||||||
Acquisition and merger-related transaction costs | — | 5 | — | — | 153 | 4,500 | 3,305 | 7,963 | — | 7,963 | |||||||||||||||||||||||||||||||||||||||||||||||||
Restructuring and merger integration costs(3) | — | — | — | — | 667 | — | 6,172 | 6,839 | — | 6,839 | |||||||||||||||||||||||||||||||||||||||||||||||||
Amortization and impairment of investment management intangibles | 2,045 | — | — | — | 2,494 | — | — | 4,539 | 4,310 | 8,849 | |||||||||||||||||||||||||||||||||||||||||||||||||
Non-real estate fixed asset depreciation, amortization and impairment | 55 | 525 | — | — | 27 | — | 1,105 | 1,712 | 2,161 | 3,873 | |||||||||||||||||||||||||||||||||||||||||||||||||
Tax effect of Core FFO adjustments, net | (1,185) | (642) | — | — | (1,019) | — | — | (2,846) | (2,564) | (5,410) | |||||||||||||||||||||||||||||||||||||||||||||||||
Less: Adjustments attributable to noncontrolling interests in investment entities | — | — | — | — | — | — | — | — | 6,572 | 6,572 | |||||||||||||||||||||||||||||||||||||||||||||||||
| Core FFO | $ | 5,637 | $ | 4,429 | $ | 6,267 | $ | 11,472 | $ | (43,079) | $ | (13,086) | $ | (48,337) | $ | (76,697) | $ | — | $ | (76,697) | |||||||||||||||||||||||||||||||||||||||
Less: Core FFO (gains) losses | — | — | — | 3,412 | 77,340 | 727 | — | 81,479 | — | 81,479 | |||||||||||||||||||||||||||||||||||||||||||||||||
| Core FFO ex-gains/losses attributable to common interests in Operating Company and common stockholders | $ | 5,637 | $ | 4,429 | $ | 6,267 | $ | 14,884 | $ | 34,261 | $ | (12,359) | $ | (48,337) | $ | 4,782 | $ | — | $ | 4,782 | |||||||||||||||||||||||||||||||||||||||
Notes:
(1) Net of $23.7 million consolidated or $8.9 million CLNY OP share of depreciation, amortization and impairment charges previously adjusted to calculate FFO.
(2) Represents adjustments to align the Company’s Core FFO with CLNC’s definition of Core Portfolio Core Earnings to reflect the Company’s percentage interest in CLNC's earnings.
(3) Restructuring and merger integration costs primarily represent costs and charges incurred as a result of corporate restructuring and reorganization to implement the digital evolution. These costs and charges include severance, retention, relocation, transition, shareholder settlement and other related restructuring costs, which are not reflective of the Company’s core operating performance and the Company does not expect to incur these costs subsequent to the completion of the digital transformation.
Colony Capital | Supplemental Financial Report | 13 | ||||||||||
| IIIa. Capitalization - Overview | ||
| ($ in thousands; except per share data; as of September 30, 2020, unless otherwise noted) | Consolidated amount | CLNY OP share of consolidated amount | Wtd. avg. years remaining to maturity(1) | Wtd. avg. interest rate(2) | ||||||||||||||||||||||
| Debt (UPB) | ||||||||||||||||||||||||||
| Non-recourse debt: | ||||||||||||||||||||||||||
| Digital Operating | $ | 2,546,359 | $ | 355,263 | 3.3 | 4.4 | % | |||||||||||||||||||
| Wellness Infrastructure | 2,773,688 | 1,963,248 | 3.8 | 4.1 | % | |||||||||||||||||||||
Other | 987,200 | 506,537 | 3.0 | 3.7 | % | |||||||||||||||||||||
Trust Preferred Securities ("TruPS")(3) | 280,117 | 280,117 | 15.7 | 3.1 | % | (4) | ||||||||||||||||||||
Total non-recourse debt(5) | 6,587,364 | 3,105,165 | ||||||||||||||||||||||||
| Corporate debt: | ||||||||||||||||||||||||||
| $500 million revolving credit facility | — | — | N/A | N/A | ||||||||||||||||||||||
Convertible/exchangeable senior notes(6) | 545,107 | 545,107 | 3.9 | 5.4 | % | |||||||||||||||||||||
| Other corporate debt | 33,388 | 33,388 | 5.2 | 5.0 | % | |||||||||||||||||||||
Total corporate debt | 578,495 | 578,495 | ||||||||||||||||||||||||
Total debt(5) | $ | 7,165,859 | $ | 3,683,660 | ||||||||||||||||||||||
| Non-recourse debt - Fixed / Floating summary | ||||||||||||||||||||||||||
| Fixed | $ | 2,269,654 | $ | 612,236 | ||||||||||||||||||||||
| Floating | 4,317,710 | 2,492,929 | ||||||||||||||||||||||||
| Total non-recourse debt | $ | 6,587,364 | $ | 3,105,165 | ||||||||||||||||||||||
| Perpetual preferred stock, redemption value | ||||||||||||||||||||||||||
| Total perpetual preferred stock | $ | 1,033,750 | ||||||||||||||||||||||||
Notes:
(1) Weighted Average Years Remaining to Maturity is based on initial maturity dates or extended maturity dates if the criteria to extend have been met as of November 2, 2020, the latest practicable date that the information was available, and the extension option is at the Company’s discretion.
(2) Based on 1-month LIBOR of 0.15% and 3-month LIBOR of 0.23% for floating rate debt.
(3) Includes the TruPS, which were issued by trusts of which the sole assets are junior subordinated notes issued by NRF Holdco, LLC. NRF Holdco, LLC is a subsidiary of the Company and owns the Wellness Infrastructure segment, the Hospitality portfolio, as well as certain OED. The Company is neither an obligor nor guarantor on the junior subordinated debt or TruPS.
(4) Based on 3-month LIBOR plus rates between 2.50% to 3.25%.
(5) During the third quarter 2020, the Company entered into definitive agreement to sell all but one hospitality portfolio, which is under receivership. These assets and the Bulk Industrial portfolio are presented under discontinued operations for the third quarter 2020 and the related $3.5 billion consolidated, or $3.0 billion CLNY OP share, of Hospitality and THL portfolio debt, and $235 million consolidated, or $120 million CLNY OP share, of Bulk Industrial portfolio debt is excluded from above presentation.
(6) The 5.375% exchangeable senior notes is an obligation of NRF Holdco, LLC as the issuer, a subsidiary of the Company.
Colony Capital | Supplemental Financial Report | 14 | ||||||||||
| IIIb. Capitalization - Revolving Credit Facility | ||
| ($ in thousands, except as noted; as of September 30, 2020) | ||||||||
| Revolving credit facility | ||||||||
| Maximum principal amount | $ | 500,000 | ||||||
| Amount outstanding | — | |||||||
| Initial maturity | January 11, 2021 | |||||||
| Fully-extended maturity | January 10, 2022 | |||||||
| Interest rate | LIBOR + 2.50% | |||||||
Financial covenants as defined in the Credit Agreement(1): | Covenant level | |||||||
Consolidated Tangible Net Worth | Minimum $1,740 million | |||||||
Consolidated Fixed Charge Coverage Ratio(2) | Minimum 1.30 to 1.00 | |||||||
Interest Coverage Ratio(3) | Minimum 3.00 to 1.00 | |||||||
Consolidated Leverage Ratio | Maximum 0.65 to 1.00 | |||||||
| Company status: As of September 30, 2020, CLNY is meeting all required covenant threshold levels. | ||||||||
Notes:
(1) The Company's credit agreement allows for the exclusion of the assets, debt, fixed charges and earnings of investments with non-recourse debt at the Company's election.
(2) The borrowing base is discounted by 10% at a Fixed Charge Coverage Ratio between 1.30 and 1.50 to 1.00.
(3) Interest Coverage Ratio represents the ratio of the sum of (1) earnings from borrowing base assets and (2) certain investment management earnings divided by the greater of (a) actual interest expense on the revolving credit facility and (b) the average balance of the facility multiplied by 7.0% for the applicable quarter.
Colony Capital | Supplemental Financial Report | 15 | ||||||||||
| IIIc. Capitalization - Convertible/Exchangeable Notes & Perpetual Preferred Stock | ||
| ($ in thousands; except per share data; as of September 30, 2020, unless otherwise noted) | ||||||||||||||||||||||||||||||||||||||
| Convertible/exchangeable debt | ||||||||||||||||||||||||||||||||||||||
| Description | Outstanding principal | Final due date(1) | Interest rate | Conversion price (per share of common stock) | Conversion ratio | Conversion shares | ||||||||||||||||||||||||||||||||
| 5.75% Exchangeable senior notes | $ | 300,000 | July 15, 2025 | 5.75% fixed | $ | 2.30 | 434.7826 | 130,435 | ||||||||||||||||||||||||||||||
| 3.875% Convertible senior notes | 31,502 | January 15, 2021 | 3.875% fixed | 16.57 | 60.3431 | 1,901 | ||||||||||||||||||||||||||||||||
| 5.0% Convertible senior notes | 200,000 | April 15, 2023 | 5.00% fixed | 15.76 | 63.4700 | 12,694 | ||||||||||||||||||||||||||||||||
5.375% Exchangeable senior notes(2) | 13,605 | June 15, 2033 | 5.375% fixed | 12.04 | 83.0837 | 1,130 | ||||||||||||||||||||||||||||||||
| Total convertible debt | $ | 545,107 | ||||||||||||||||||||||||||||||||||||
| Perpetual preferred stock | ||||||||||||||||||||
| Description | Liquidation preference | Shares outstanding (In thousands) | Callable period | |||||||||||||||||
| Series G 7.5% cumulative redeemable perpetual preferred stock | $ | 86,250 | 3,450 | Callable | ||||||||||||||||
| Series H 7.125% cumulative redeemable perpetual preferred stock | 287,500 | 11,500 | Callable | |||||||||||||||||
| Series I 7.15% cumulative redeemable perpetual preferred stock | 345,000 | 13,800 | On or after June 5, 2022 | |||||||||||||||||
| Series J 7.125% cumulative redeemable perpetual preferred stock | 315,000 | 12,600 | On or after September 22, 2022 | |||||||||||||||||
| Total preferred stock | $ | 1,033,750 | 41,350 | |||||||||||||||||
Notes:
(1) Callable at principal amount only if CLNY common stock has traded at least 130% of the conversion price for 20 of 30 consecutive trading days: on or after April 22, 2020, for the 5.0% convertible senior notes; on or after January 22, 2019, for the 3.875% convertible senior notes; and on or after on or after June 15, 2020, for the 5.375% exchangeable senior notes.
(2) The 5.375% exchangeable senior notes is an obligation of NRF Holdco, LLC as the issuer, a subsidiary of the Company.
Colony Capital | Supplemental Financial Report | 16 | ||||||||||
| IIId. Capitalization - Debt Maturity and Amortization Schedules | ||
| ($ in thousands; as of September 30, 2020) | Payments due by period(1) | |||||||||||||||||||||||||||||||||||||
| Consolidated debt | 2020 | 2021 | 2022 | 2023 | 2024 and after | Total | ||||||||||||||||||||||||||||||||
| Non-recourse debt: | ||||||||||||||||||||||||||||||||||||||
| Digital Operating | $ | 4,631 | $ | 18,576 | $ | 108,656 | $ | 1,108,939 | $ | 1,305,557 | $ | 2,546,359 | ||||||||||||||||||||||||||
| Wellness Infrastructure | 48,603 | 139,421 | 54,172 | 14,294 | 2,517,198 | 2,773,688 | ||||||||||||||||||||||||||||||||
Other | 164,845 | 177,818 | 110,109 | 92,299 | 442,129 | 987,200 | ||||||||||||||||||||||||||||||||
TruPS(2) | — | — | — | — | 280,117 | 280,117 | ||||||||||||||||||||||||||||||||
| Corporate debt: | ||||||||||||||||||||||||||||||||||||||
| $500 million revolving credit facility | — | — | — | — | — | — | ||||||||||||||||||||||||||||||||
Convertible/exchangeable senior notes(3) | — | 31,502 | — | 200,000 | 313,605 | 545,107 | ||||||||||||||||||||||||||||||||
| Other corporate debt | 573 | 2,359 | 2,481 | 2,609 | 25,366 | 33,388 | ||||||||||||||||||||||||||||||||
| Total consolidated debt | $ | 218,652 | $ | 369,676 | $ | 275,418 | $ | 1,418,141 | $ | 4,883,972 | $ | 7,165,859 | ||||||||||||||||||||||||||
| Pro rata debt | 2020 | 2021 | 2022 | 2023 | 2024 and after | Total | ||||||||||||||||||||||||||||||||
| Non-recourse debt: | ||||||||||||||||||||||||||||||||||||||
| Digital Operating | $ | 636 | $ | 2,554 | $ | 13,739 | $ | 139,673 | $ | 198,661 | $ | 355,263 | ||||||||||||||||||||||||||
| Wellness Infrastructure | 34,248 | 111,818 | 42,472 | 10,006 | 1,764,704 | 1,963,248 | ||||||||||||||||||||||||||||||||
Other | 68,220 | 166,864 | 36,907 | 80,406 | 154,140 | 506,537 | ||||||||||||||||||||||||||||||||
TruPS(2) | — | — | — | — | 280,117 | 280,117 | ||||||||||||||||||||||||||||||||
| Corporate debt: | ||||||||||||||||||||||||||||||||||||||
| $500 million revolving credit facility | — | — | — | — | — | — | ||||||||||||||||||||||||||||||||
Convertible/exchangeable senior notes(3) | — | 31,502 | — | 200,000 | 313,605 | 545,107 | ||||||||||||||||||||||||||||||||
| Other corporate debt | 573 | 2,359 | 2,481 | 2,609 | 25,366 | 33,388 | ||||||||||||||||||||||||||||||||
| Total pro rata debt | $ | 103,677 | $ | 315,097 | $ | 95,599 | $ | 432,694 | $ | 2,736,593 | $ | 3,683,660 | ||||||||||||||||||||||||||
Notes:
(1) Weighted Average Years Remaining to Maturity is based on initial maturity dates or extended maturity dates if the criteria to extend have been met as of November 2, 2020, the latest practicable date that the information was available, and the extension option is at the Company’s discretion.
(2) Includes the TruPS, which were issued by trusts of which the sole assets are junior subordinated notes issued by NRF Holdco, LLC. NRF Holdco, LLC is a subsidiary of the Company and owns the Wellness Infrastructure segment, the Hospitality portfolio, as well as certain OED. The Company is neither an obligor nor guarantor on the junior subordinated debt or TruPS.
(3) The 5.375% exchangeable senior notes is an obligation of NRF Holdco, LLC as the issuer, a subsidiary of the Company.
Colony Capital | Supplemental Financial Report | 17 | ||||||||||
| IIIe. Capitalization - Structure | ||
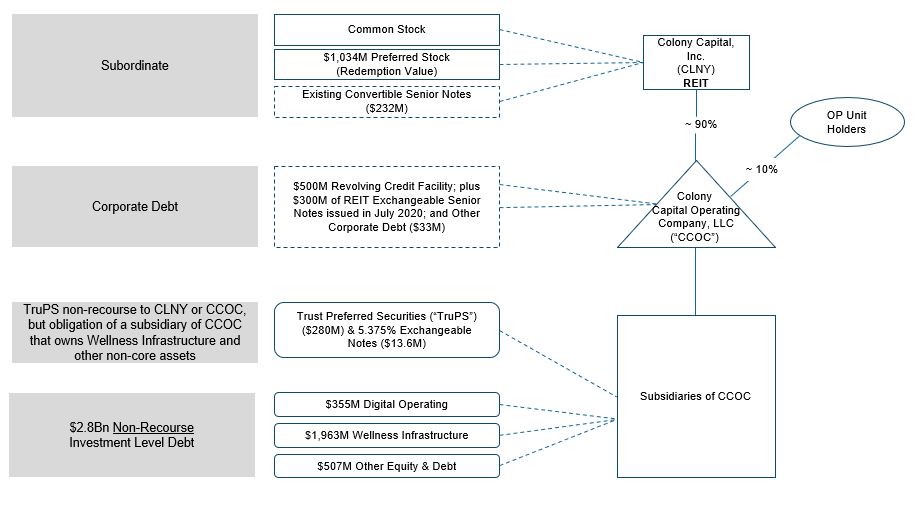
Colony Capital | Supplemental Financial Report | 18 | ||||||||||
| IV. Digital Investment Management | ||
| Digital Third-party AUM & FEEUM | ||||||||||||||||||||
| ($ in millions, as of September 30, 2020, unless otherwise noted) | AUM CLNY OP Share | FEEUM CLNY OP Share | Fee Rate | |||||||||||||||||
| Digital Colony Partners I | $ | 5,686 | $ | 3,756 | 1.2 | % | ||||||||||||||
| Separately Capitalized Portfolio Companies | 7,747 | 2,487 | 0.9 | % | ||||||||||||||||
| Co-Investment (Sidecar) Capital | 8,707 | 2,158 | 0.5 | % | ||||||||||||||||
| Liquid Strategies | 97 | 153 | 0.5 | % | ||||||||||||||||
| Digital Investment Management Total | $ | 22,237 | $ | 8,554 | 0.9 | % | ||||||||||||||
FRE(1) | ||||||||||||||||||||
| ($ in thousands, unless otherwise noted) | Q3 2020 | |||||||||||||||||||
| Fee income | $ | 20,048 | ||||||||||||||||||
| Other income | 87 | |||||||||||||||||||
| Compensation expense—cash | (9,414) | |||||||||||||||||||
| Administrative expenses | (1,832) | |||||||||||||||||||
| FRE Total | $ | 8,889 | ||||||||||||||||||
Notes:
(1) For a reconciliation of net income/(loss) to FRE, please refer to the appendix to this presentation.
Colony Capital | Supplemental Financial Report | 19 | ||||||||||
| V. Digital Operating | ||
| Portfolio Overview | Consolidated amount | CLNY OP share of consolidated amount | |||||||||||||||
| ($ in thousand, as of September 30, 2020, unless otherwise noted) | |||||||||||||||||
Asset(1) | $ | 4,925,383 | $ | 724,234 | |||||||||||||
Debt(2) | (2,546,359) | (355,263) | |||||||||||||||
| Net Carrying Value | $ | 2,379,024 | $ | 368,971 | |||||||||||||
Adjusted EBITDA(3) | Q3 2020 | ||||||||||||||||
| ($ in thousands, unless otherwise noted) | Consolidated amount | CLNY OP share of consolidated amount | |||||||||||||||
| Total revenues | $ | 98,549 | $ | 15,600 | |||||||||||||
| Property operating expenses | (37,544) | (6,026) | |||||||||||||||
| Compensation and administrative expenses | (11,592) | (2,299) | |||||||||||||||
| Transaction, investment and servicing costs | (2,242) | (266) | |||||||||||||||
EBITDAre(4): | $ | 47,171 | 7,009 | ||||||||||||||
| Straight-line rent expenses and amortization of above- and below-market lease intangibles | (2,106) | (154) | |||||||||||||||
| Compensation expense—equity-based | 148 | 30 | |||||||||||||||
| Installation services | (65) | (13) | |||||||||||||||
| Restructuring & integration costs | 470 | 94 | |||||||||||||||
| Transaction, investment and servicing costs | (50) | (18) | |||||||||||||||
Adjusted EBITDA(4): | $ | 45,568 | $ | 6,948 | |||||||||||||
| Operating Metrics | |||||||||||||||||
| ($ in millions, unless otherwise noted) | 9/30/20 | 9/30/19(5) | |||||||||||||||
| Number of Data Centers | 32 | 29 | |||||||||||||||
| Max Critical I.T. Square Feet | 1,137,866 | 1,047,304 | |||||||||||||||
| Leased Square Feet | 945,640 | 818,341 | |||||||||||||||
| % Utilization Rate | 83.1 | % | 78.1 | % | |||||||||||||
| MRR (Annualized) | $ | 374.0 | $ | 296.2 | |||||||||||||
| Bookings (Annualized) | $ | 9.4 | $ | 13.0 | |||||||||||||
| Quarterly Churn (% of Prior Quarter MRR) | 1.0 | % | 1.2 | % | |||||||||||||
Notes:
(1) Includes all components related to real estate assets, including tangible real estate and lease-related intangibles
(2) Represents unpaid principal balance.
(3) For a reconciliation of net income/(loss) from continuing operations to adjusted EBITDA, please refer to the appendix to this presentation.
(4) Includes a partial quarter of EBITDAre and Adjusted EBITDA for the 12.4% interest in the Vantage SDC portfolio the Company acquired on July 22, 2020.
(5) The Company did not own an interest in DataBank or Vantage SDC in the third quarter 2019.
Colony Capital | Supplemental Financial Report | 20 | ||||||||||
| VI. Digital Other | ||
| Portfolio Overview | ||||||||||||||
| ($ in thousand, as of September 30, 2020, unless otherwise noted) | Consolidated amount | CLNY OP share of consolidated amount | ||||||||||||
| CLNY's GP Co-investments in DCP I Investments ($250 million total commitment) | $ | 184,829 | $ | 176,329 | ||||||||||
Equity interests in digital investment vehicles(1) | 71,622 | 34,067 | ||||||||||||
| Net carrying value | $ | 256,451 | $ | 210,396 | ||||||||||
Notes:
(1) Net of $97 million of derivative liability from Accrued and Other Liabilities.
Colony Capital | Supplemental Financial Report | 21 | ||||||||||
| VIIa. Wellness Infrastructure - Summary Metrics and Operating Results | ||
| ($ in thousands; as of or for the three months ended September 30, 2020, unless otherwise noted) | Consolidated amount | CLNY OP share of consolidated amount | ||||||||||||
| Net operating income | ||||||||||||||
| Net operating income: | ||||||||||||||
| Senior Housing - Operating | $ | 12,011 | $ | 8,430 | ||||||||||
| Medical Office Buildings | 12,527 | 8,724 | ||||||||||||
| Triple-Net Lease: | ||||||||||||||
Senior Housing(1) | 13,223 | 9,312 | ||||||||||||
| Skilled Nursing Facilities | 22,304 | 16,160 | ||||||||||||
| Hospitals | 1,588 | 1,106 | ||||||||||||
| Total net operating income | $ | 61,653 | $ | 43,732 | ||||||||||
| Portfolio overview | Total number of properties | Capacity | % Occupied(2) | TTM Lease Coverage(3) | WA Remaining Lease Term | |||||||||||||||||||||||||||
| Senior Housing - Operating | 53 | 4,771 units | 75.2 | % | N/A | N/A | ||||||||||||||||||||||||||
| Medical Office Buildings | 106 | 3.8 million sq. ft. | 83.0 | % | N/A | 4.5 | ||||||||||||||||||||||||||
| Triple-Net Lease: | ||||||||||||||||||||||||||||||||
| Senior Housing | 65 | 3,529 units | 79.1 | % | 1.3x | 11.7 | ||||||||||||||||||||||||||
| Skilled Nursing Facilities | 88 | 10,458 beds | 72.7 | % | 1.3x | 5.1 | ||||||||||||||||||||||||||
| Hospitals | 9 | 456 beds | 59.5 | % | 2.7x | 9.6 | ||||||||||||||||||||||||||
| Total | 321 | |||||||||||||||||||||||||||||||
| Same store financial/operating results related to the segment | |||||||||||||||||||||||||||||||||||||||||||||||
% Occupied(2) | TTM Lease Coverage(3) | NOI | |||||||||||||||||||||||||||||||||||||||||||||
| Q3 2020 | Q3 2019 | 6/30/2020 | 6/30/2019 | Q3 2020 | Q3 2019 | % Change | |||||||||||||||||||||||||||||||||||||||||
| Senior Housing - Operating | 75.2 | % | 82.0 | % | N/A | N/A | $ | 11,709 | $ | 13,254 | (11.7) | % | |||||||||||||||||||||||||||||||||||
| Medical Office Buildings | 83.0 | % | 82.2 | % | N/A | N/A | 12,527 | 12,923 | (3.1) | % | |||||||||||||||||||||||||||||||||||||
| Triple-Net Lease: | |||||||||||||||||||||||||||||||||||||||||||||||
| Senior Housing | 79.1 | % | 84.1 | % | 1.3x | 1.3x | 13,216 | 12,233 | 8.0 | % | |||||||||||||||||||||||||||||||||||||
| Skilled Nursing Facilities | 72.7 | % | 82.5 | % | 1.3x | 1.2x | 22,310 | 23,230 | (4.0) | % | |||||||||||||||||||||||||||||||||||||
| Hospitals | 59.5 | % | 61.3 | % | 2.7x | 1.7x | 1,589 | 808 | 96.7 | % | |||||||||||||||||||||||||||||||||||||
| Total | $ | 61,351 | $ | 62,448 | (1.8) | % | |||||||||||||||||||||||||||||||||||||||||
Notes:
(1) NOI includes $1.0 million consolidated or $0.7 million CLNY OP share of interest earned related to $52 million consolidated or $37 million CLNY OP share carrying value of healthcare real estate loans. This interest income is in the Interest Income line item on the Company’s Statement of Operations. For a reconciliation of net income/(loss) attributable to common stockholders to NOI, please refer to the appendix to this presentation.
(2) Occupancy % for Senior Housing - Operating represents average of the presented quarter, MOB’s is as of last day in the quarter and Triple-Net Lease represents average of the prior quarter. Occupancy represents real estate property operator’s patient occupancy for all types except MOB.
(3) Represents the ratio of the tenant's/operator's EBITDAR to cash rent payable to the Company's Healthcare Real Estate segment on a trailing twelve month basis and as of the prior quarter due to timing of data availability from tenant/operators. Refer to Important Notes Regarding Non-GAAP Financial Measures and Definitions pages in this presentation for additional information regarding the use of tenant/operator EBITDAR.
Colony Capital | Supplemental Financial Report | 22 | ||||||||||
| VIIb. Wellness Infrastructure - Portfolio Overview | ||
| (As of or for the three months ended September 30, 2020, unless otherwise noted) | ||||||||||||||||||||||||||||||||
Triple-Net Lease Coverage(1) | % of Triple-Net Lease TTM NOI as of June 30, 2020 | |||||||||||||||||||||||||||||||
| TTM Lease Coverage | # of Leases | Senior Housing | Skilled Nursing Facilities & Hospitals | % Triple-Net Lease NOI | WA Remaining Lease Term | |||||||||||||||||||||||||||
| Less than 0.99x | 3 | — | % | 17 | % | 17 | % | 6 yrs | ||||||||||||||||||||||||
| 1.00x - 1.09x | 2 | 5 | % | — | % | 5 | % | 4 yrs | ||||||||||||||||||||||||
| 1.10x - 1.19x | 2 | — | % | 18 | % | 18 | % | 7 yrs | ||||||||||||||||||||||||
| 1.20x - 1.29x | 2 | — | % | 12 | % | 12 | % | 4 yrs | ||||||||||||||||||||||||
| 1.30x - 1.39x | 1 | 28 | % | — | % | 28 | % | 14 yrs | ||||||||||||||||||||||||
| 1.40x - 1.49x | — | — | % | — | % | — | % | — | ||||||||||||||||||||||||
| 1.50x and greater | 5 | 2 | % | 18 | % | 20 | % | 4 yrs | ||||||||||||||||||||||||
| Total / W.A. | 15 | 35 | % | 65 | % | 100 | % | 8 yrs | ||||||||||||||||||||||||
Revenue Mix(2) | June 30, 2020 TTM | |||||||||||||||||||
| Private Pay | Medicare | Medicaid | ||||||||||||||||||
| Senior Housing - Operating | 86 | % | 4 | % | 10 | % | ||||||||||||||
| Medical Office Buildings | 100 | % | — | % | — | % | ||||||||||||||
| Triple-Net Lease: | ||||||||||||||||||||
| Senior Housing | 61 | % | — | % | 39 | % | ||||||||||||||
| Skilled Nursing Facilities | 25 | % | 22 | % | 54 | % | ||||||||||||||
| Hospitals | 32 | % | 56 | % | 11 | % | ||||||||||||||
| W.A. | 60 | % | 10 | % | 30 | % | ||||||||||||||
Notes:
(1) Represents the ratio of the tenant's/operator's EBITDAR to cash rent payable to the Company's Healthcare Real Estate segment on a trailing twelve month basis and due to timing of availability of data tenants/operators provide information from prior quarter. Refer to Important Notes Regarding Non-GAAP Financial Measures and Definitions pages in this presentation for additional information regarding the use of tenant/operator EBITDAR. Represents leases with EBITDAR coverage in each listed range. Excludes interest income associated with triple-net lease senior housing and hospital types. Caring Homes (U.K.) lease (EBITDAR) coverage includes additional collateral provided by the operator.
(2) Revenue mix represents percentage of revenues derived from private, Medicare and Medicaid payor sources and as of the prior quarter due to timing of data availability from tenant/operators. The payor source percentages for the hospital category excludes two operating partners, who do not track or report payor source data and totals approximately one-third of NOI in the hospital category. Overall percentages are weighted by NOI exposure in each category.
Colony Capital | Supplemental Financial Report | 23 | ||||||||||
| VIIb. Wellness Infrastructure - Portfolio Overview (cont’d) | ||
| ($ in thousands; as of or for the three months ended September 30, 2020, unless otherwise noted) | ||||||||||||||
| Top 10 Geographic Locations by NOI | ||||||||||||||
| Number of properties | NOI | |||||||||||||
| United Kingdom | 46 | $ | 10,497 | |||||||||||
| Indiana | 55 | 7,390 | ||||||||||||
| Florida | 25 | 6,240 | ||||||||||||
| Pennsylvania | 8 | 5,104 | ||||||||||||
| Oregon | 31 | 4,657 | ||||||||||||
| Georgia | 21 | 4,239 | ||||||||||||
| Illinois | 35 | 3,794 | ||||||||||||
| Texas | 29 | 3,476 | ||||||||||||
| Ohio | 14 | 3,387 | ||||||||||||
| Washington | 10 | 2,186 | ||||||||||||
| Total | 274 | $ | 50,970 | |||||||||||
| Top 10 Operators/Tenants by NOI | ||||||||||||||||||||||||||||||||||||||
| Property Type/Primary Segment | Number of properties | NOI | % Occupied | TTM Lease Coverage | WA Remaining Lease Term | |||||||||||||||||||||||||||||||||
Caring Homes (U.K.)(1) | Sr. Housing / NNN | 46 | $ | 10,497 | 77.7 | % | 1.3x | 14 yrs | ||||||||||||||||||||||||||||||
| Senior Lifestyle | Sr. Housing / RIDEA | 30 | 9,740 | 73.7 | % | N/A | N/A | |||||||||||||||||||||||||||||||
| Sentosa | SNF / NNN | 8 | 5,104 | 71.0 | % | 0.9x | 8 yrs | |||||||||||||||||||||||||||||||
| Millers | SNF / NNN | 28 | 3,990 | 64.6 | % | 1.9x | N/A | |||||||||||||||||||||||||||||||
| Wellington Healthcare | SNF / NNN | 10 | 3,961 | 80.0 | % | 1.1x | 6 yrs | |||||||||||||||||||||||||||||||
| Frontier | Sr. Housing / RIDEA / NNN | 20 | 3,099 | 85.3 | % | N/A | N/A | |||||||||||||||||||||||||||||||
| Opis | SNF / NNN | 11 | 2,945 | 48.5 | % | 1.2x | 3 yrs | |||||||||||||||||||||||||||||||
| Consulate | SNF / NNN | 10 | 2,614 | 87.2 | % | 1.1x | 7 yrs | |||||||||||||||||||||||||||||||
| WW Healthcare | SNF / NNN | 5 | 1,323 | 70.5 | % | 1.3x | 5 yrs | |||||||||||||||||||||||||||||||
| Regency Pacific | SNF / NNN | 14 | 1,170 | 72.0 | % | 1.5x | 9 yrs | |||||||||||||||||||||||||||||||
| Total | 182 | $ | 44,443 | |||||||||||||||||||||||||||||||||||
Notes:
(1) Caring Homes (U.K.) lease (EBITDAR) coverage includes additional collateral provided by the operator.
Colony Capital | Supplemental Financial Report | 24 | ||||||||||
| VIIIa. Other Equity and Debt | ||
| CLNY OP Share | ||||||||||||||||||||||||||
| Depreciated Carrying Value | ||||||||||||||||||||||||||
| ($ in millions) | 9/30/2020 | |||||||||||||||||||||||||
| Investment | Investment Type | Property Type | Geography | CLNY Ownership %(1) | Assets | Equity | % of Total Equity | |||||||||||||||||||
| Colony Credit Real Estate, Inc. ("CLNC") | Public Company Common Shares | Various | Various | 36% | $ | 365.9 | $ | 365.9 | 24 | % | ||||||||||||||||
| Tolka Irish NPL Portfolio | Non-Performing First Mortgage Loans | Primarily Office | Ireland | 100% | 375.1 | 150.6 | 10 | % | ||||||||||||||||||
| Cortland Multifamily Preferred Equity | Preferred Equity | Multifamily | Primarily SouthEast US | 100% | 116.6 | 116.6 | 8 | % | ||||||||||||||||||
| Bulk Industrial Portfolio | Real Estate Equity | Industrial | Nationwide | 51% | 189.0 | 69.1 | 5 | % | ||||||||||||||||||
| Ronan CRE Portfolio Loan | Mezzanine Loan | Office, Residential, Mixed-Use | Ireland / France | 50% | 65.2 | 65.2 | 4 | % | ||||||||||||||||||
| Origination DrillCo Joint Venture | Oil & Gas Well Development Financing | Oil & Gas | East Texas | 100% | 62.0 | 62.0 | 4 | % | ||||||||||||||||||
| Spencer Dock Loan | Mezzanine Loan with Profit Participation | Office, Hospitality & Residential | Ireland | 20% | 52.2 | 52.2 | 3 | % | ||||||||||||||||||
| McKillin Portfolio Loan | Debt Financing | Office and Personal Guarantee | Primarily US and UK | 96% | 47.3 | 47.3 | 3 | % | ||||||||||||||||||
| Dublin Docklands | Senior Loan with Profit Participation | Office & Residential | Ireland | 15% | 46.1 | 46.1 | 3 | % | ||||||||||||||||||
| AccorInvest | Real Estate Equity | Hospitality | Primarily Europe | 1% | 45.8 | 45.8 | 3 | % | ||||||||||||||||||
| France & Spain CRE Portfolio | Real Estate Equity | Primarily Office & Hospitality | France & Spain | 33% | 116.3 | 43.8 | 3 | % | ||||||||||||||||||
| CRC DrillCo Joint Venture | Oil & Gas Well Development Financing | Oil & Gas | California | 25% | 36.3 | 36.3 | 2 | % | ||||||||||||||||||
| Maranatha French Hotel Portfolio | Real Estate Equity | Hospitality | France | 44% | 39.4 | 32.3 | 2 | % | ||||||||||||||||||
Hendon Retail Portfolio(2) | A-Note Loan | Retail | US | 100% | 30.0 | 30.0 | 2 | % | ||||||||||||||||||
| Remaining OED (>45 Investments) | Various | Various | Various | Various | 1,044.0 | 370.5 | 24 | % | ||||||||||||||||||
| Total Other Equity and Debt | $ | 2,631.2 | $ | 1,533.7 | 100 | % | ||||||||||||||||||||
(1) Ownership % represents CLNY OP’s share of the entire investment accounting for all non-controlling interests including interests managed by the Company and other third parties.
(2) Subsequent to quarter-end, the Company was paid $30 million through a discounted payoff of on a mortgage secured by two enclosed malls, two strip centers and various pad sites located in GA, FL and TN.
Colony Capital | Supplemental Financial Report | 25 | ||||||||||
| VIIIa. Other Equity and Debt | ||
| CLNY OP Share | |||||||||||||||||
| Depreciated Carrying Value | |||||||||||||||||
| ($ in millions) | 9/30/2020 | ||||||||||||||||
| Investment | CLNY Ownership %(1) | Assets | Equity | % of Total Equity | Description | ||||||||||||
| Colony Credit Real Estate, Inc. ("CLNC") | 36% | $ | 365.9 | $ | 365.9 | 24 | % | CLNC is a commercial real estate credit REIT externally managed by the Company with $4.3 billion in at-share assets and $1.7 billion in GAAP book equity value, as of September 30, 2020. The Company owns approximately 48.0 million shares and share equivalents, or 36%, of CLNC. | |||||||||
| Tolka Irish NPL Portfolio | 100% | 375.1 | 150.6 | 10 | % | NPL portfolio backed by nine assets primarily composed of high quality office buildings in prime Irish locations in Greater Dublin. | |||||||||||
| Cortland Multifamily Preferred Equity | 100% | 116.6 | 116.6 | 8 | % | 14% preferred equity to a multifamily owner and operator with over 60,000 multifamily units primarily located in the Sunbelt markets. | |||||||||||
| Bulk Industrial Portfolio | 51% | 189.0 | 69.1 | 5 | % | Portfolio of industrial assets, consisting of six buildings totaling 4.2 million square feet in five industrial markets in the United States. | |||||||||||
| Ronan CRE Portfolio Loan | 50% | 65.2 | 65.2 | 4 | % | EUR 93.8 million junior loan with an 11% coupon (4.5% cash interest and 6.5% PIK interest) and maturity in Jan-22 collateralized by a portfolio of 12 income-producing mixed-use assets and 5 residential and mixed-use development sites primarily in Ireland. | |||||||||||
| Origination DrillCo Joint Venture | 100% | 62.0 | 62.0 | 4 | % | 8 producing oil & gas wells in east Texas, in which Colony receives a majority of the cash flows until Colony receives an agreed upon return at which point its share will decrease to a minority of the cash flows. Going forward, the Company does not anticipate funding material capital. | |||||||||||
| Spencer Dock Loan | 20% | 52.2 | 52.2 | 3 | % | EUR 222.6 million whole loan (EUR 155.4 million funded to date and EUR 67.2 million in residual commitment) with 71% profit participation in a Dublin mixed-use development of more than 1 million square feet. The South Site (accounting for 56.4% of total NIA) is entirely pre let to SalesForce and Dalata, while the North Site (accounting for 43.6% of total NIA) is currently under planning review. | |||||||||||
| McKillin Portfolio Loan | 96% | 47.3 | 47.3 | 3 | % | GBP 49 million note secured by (i) pledge of borrower’s equity interest in a Boston office tower, (ii) other commercial real estate collateral and (iii) borrower’s personal guarantee, which is capped in amount. | |||||||||||
| Dublin Docklands | 15% | 46.1 | 46.1 | 3 | % | EUR 230 million acquisition and pre-development financing with 70% profit participation on a prime waterfront freehold site in Dublin’s Docklands (1.86ha) with planning permission for a mixed used development comprising 4 properties (2 residential and 2 office blocks). Enabling works are underway for site preparation. | |||||||||||
Colony Capital | Supplemental Financial Report | 26 | ||||||||||
| VIIIa. Other Equity and Debt | ||
| CLNY OP Share | |||||||||||||||||
| Depreciated Carrying Value | |||||||||||||||||
| ($ in millions) | 9/30/2020 | ||||||||||||||||
| Investment | CLNY Ownership %(1) | Assets | Equity | % of Total Equity | Description | ||||||||||||
| AccorInvest | 1% | 45.8 | 45.8 | 3 | % | Ownership of a diversified portfolio of approximately 900 hotels located primarily in Europe and mostly within the economy and midscale segments managed by Accor. The Company’s position sits alongside EUR 770 million of third-party capital managed by the Company, which combine to own approximately 22% of AccorInvest. | |||||||||||
| France & Spain CRE Portfolio | 33% | 116.3 | 43.8 | 3 | % | Portfolio constituted by 29 office and hotel assets, of which 28 office properties are located in France (representing 50% of the portfolio) and 1 hotel in Spain (representing 50% of the portfolio). | |||||||||||
| CRC DrillCo Joint Venture | 25% | 36.3 | 36.3 | 2 | % | Bankruptcy remote interest in ~175 producing oil & gas wells in California operated by California Resources Corp, through Alpine Energy Capital, in which Alpine receives a majority of the cash flows until Colony receives an agreed upon return at which point its share will decrease to a minority of the cash flows. Going forward, the Company does not anticipate funding material capital. | |||||||||||
| Maranatha French Hotel Portfolio | 44% | 39.4 | 32.3 | 2 | % | Equity financing investment for restructuring and repositioning of the Maranatha Group, France’s third-largest hotel group, which went to bankruptcy. Initial portfolio perimeter constituted by 37 hotels across France along with a management company. | |||||||||||
Hendon Retail Portfolio(2) | 100% | 30.0 | 30.0 | 2 | % | On October 13, 2020, closed on the discounted payoff with CLNY receiving $30 million. The mortgage was secured by two enclosed malls, two strip centers and various pad sites located in GA, FL and TN. | |||||||||||
| Remaining OED (>45 Investments) | Various | 1,044.0 | 370.5 | 24 | % | ||||||||||||
| Total Other Equity and Debt | $ | 2,631.2 | $ | 1,533.7 | 100 | % | |||||||||||
(1) Ownership % represents CLNY OP’s share of the entire investment accounting for all non-controlling interests including interests managed by the Company and other third parties.
(2) Subsequent to quarter-end, the Company was paid $30 million through a discounted payoff of on a mortgage secured by two enclosed malls, two strip centers and various pad sites located in GA, FL and TN.
Colony Capital | Supplemental Financial Report | 27 | ||||||||||
| VIIIb. Other Investment Management | ||
| ($ in millions, except as noted; as of September 30, 2020, unless otherwise noted) | CLNY OP Share | |||||||||||||||||||||||||||||||||||||
| Segment | Products | Description | AUM | FEEUM | Fee Rate | Fee Revenues (in thousands) | ||||||||||||||||||||||||||||||||
| Other Institutional Funds | • Credit • Opportunistic • Other co-investment vehicles | • 27 years of institutional investment management experience • Sponsorship of private equity funds and vehicles earning asset management fees and performance fees • More than 300 investor relationships | $ | 8,552 | $ | 5,689 | .8 | % | $ | 12,085 | ||||||||||||||||||||||||||||
| Public Company | • Colony Credit Real Estate, Inc. | • NYSE-listed credit focused REIT • Contract with base management fees with potential for incentive fees | 2,728 | 1,961 | 1.5 | % | 7,355 | |||||||||||||||||||||||||||||||
| Retail Companies | • NorthStar Healthcare Income | • Manage public non-traded vehicles earning asset management and performance fees | 3,399 | 1,182 | (1) | 1.5 | % | 4,431 | ||||||||||||||||||||||||||||||
| Total | $ | 14,679 | $ | 8,832 | $ | 23,871 | ||||||||||||||||||||||||||||||||
Notes:
(1) FEEUM of NorthStar Healthcare Income represents its most recently published Net Asset Value.
Colony Capital | Supplemental Financial Report | 28 | ||||||||||
| IX. Total Company Assets Under Management | ||
| ($ in millions) | CLNY OP Share | |||||||||||||||||||
| Segment | 9/30/20 | % of Grand Total | 9/30/19 | % of Grand Total | ||||||||||||||||
| Digital investment management | 22,237 | 47.5 | % | 13,796 | 30.3 | % | ||||||||||||||
| Digital operating | $ | 724 | 1.5 | % | $ | — | — | % | ||||||||||||
| Digital other | 308 | .7 | % | 53 | .1 | % | ||||||||||||||
| Digital AUM | $ | 23,269 | 49.7 | % | $ | 13,849 | 30.4 | % | ||||||||||||
| Wellness Infrastructure | 2,564 | 5.5 | % | 3,746 | 8.2 | % | ||||||||||||||
| Hospitality | 2,502 | 5.3 | % | 3,843 | 8.4 | % | ||||||||||||||
Other(1) | 3,611 | 7.7 | % | 4,806 | 10.6 | % | ||||||||||||||
| Industrial | 189 | .4 | % | 1,711 | 3.8 | % | ||||||||||||||
| Legacy balance sheet AUM | 8,866 | 18.9 | % | 14,106 | 31.0 | % | ||||||||||||||
CLNC(2) | 2,728 | 5.8 | % | 3,522 | 7.7 | % | ||||||||||||||
| Legacy Institutional | 8,552 | 18.3 | % | 10,601 | 23.3 | % | ||||||||||||||
| Retail Companies | 3,399 | 7.3 | % | 3,440 | 7.6 | % | ||||||||||||||
| Legacy Investment Management AUM | 14,679 | 31.4 | % | 17,563 | 38.6 | % | ||||||||||||||
| Grand Total AUM | $ | 46,814 | 100.0 | % | $ | 45,518 | 100.0 | % | ||||||||||||
Notes:
(1) Includes the Company’s 36% ownership share of CLNC’s total pro-rata share of assets of $4.3 billion as of September 30, 2020 and $5.6 billion as of September 30, 2019.
(2) Represents third-party 64% ownership share of CLNC’s total pro-rata share of assets of $4.3 billion as of September 30, 2020 and $5.6 billion as of September 30, 2019.
Colony Capital | Supplemental Financial Report | 29 | ||||||||||
APPENDICES
Colony Capital | Supplemental Financial Report | 30 | ||||||||||
| Xa. Appendices - Definitions | ||
Assets Under Management (“AUM”)
Assets owned by the Company’s balance sheet and assets for which the Company and its affiliates provide investment management services, including assets for which the Company may or may not charge management fees and/or performance allocations. Balance sheet AUM is based on the undepreciated carrying value of digital investments and the impaired carrying value of non-digital investments as of the report date. Investment management AUM is based on the cost basis of managed investments as reported by each underlying vehicle as of the report date. AUM further includes uncalled capital commitments, but excludes CLNY OP’s share of non wholly-owned real estate investment management platform’s AUM. The Company's calculations of AUM may differ from the calculations of other asset managers, and as a result, this measure may not be comparable to similar measures presented by other asset managers.
Contracted Revenue Growth (“Bookings”)
The Company defines Bookings as either (1) a new data center customer contract for new or additional services over and above any services already being provided as well as (2) an increase in contracted rates on the same services when a contract renews. In both instances a booking is considered to be generated when a new contract is signed with the recognition of new revenue to occur when the new contract begins billing.
Churn
The Company calculates Churn as the percentage of MRR lost during the period divided by the prior period’s MRR. Churn is intended to represent data center customer contracts which are terminated during the period, not renewed or are renewed at a lower rate.
CLNY Operating Partnership (“CLNY OP”)
The operating partnership through which the Company conducts all of its activities and holds substantially all of its assets and liabilities. CLNY OP share excludes noncontrolling interests in investment entities.
Fee-Earning Equity Under Management (“FEEUM”)
Equity for which the Company and its affiliates provides investment management services and derives management fees and/or performance allocations. FEEUM generally represents the basis used to derive fees, which may be based on invested equity, stockholders’ equity, or fair value pursuant to the terms of each underlying investment management agreement. The Company's calculations of FEEUM may differ materially from the calculations of other asset managers, and as a result, this measure may not be comparable to similar measures presented by other asset managers.
Wellness Infrastructure same store portfolio: defined as properties in operation throughout the full periods presented under the comparison and included 321 properties in the comparisons. Properties acquired or disposed during these periods are excluded for the same store portfolio.
Monthly Recurring Revenue (“MRR”)
The Company defines MRR as revenue from ongoing services that is generally fixed in price and contracted for longer than 30 days.
NOI: Net Operating Income. NOI for the Company's real estate segments represents total property and related income less property operating expenses, adjusted for the effects of (i) straight-line rental income adjustments; (ii) amortization of acquired above- and below-market lease adjustments to rental income; and (iii) other items such as adjustments for the Company’s share of NOI of unconsolidated ventures.
Colony Capital | Supplemental Financial Report | 31 | ||||||||||
| Xa. Appendices - Definitions | ||
Earnings Before Interest, Tax, Depreciation, Amortization and Rent (“EBITDAR”)
Represents earnings before interest, taxes, depreciation, amortization and rent for facilities accruing to the tenant/operator of the property (not the Company) for the period presented. The Company uses EBITDAR in determining TTM Lease Coverage for triple-net lease properties in its Wellness Infrastructure segment. EBITDAR has limitations as an analytical tool. EBITDAR does not reflect historical cash expenditures or future cash requirements for facility capital expenditures or contractual commitments. In addition, EBITDAR does not represent a property's net income or cash flow from operations and should not be considered an alternative to those indicators. The Company utilizes EBITDAR as a supplemental measure of the ability of the Company's operators/tenants to generate sufficient liquidity to meet related obligations to the Company.
TTM Lease Coverage
Represents the ratio of EBITDAR to recognized cash rent for owned facilities on a trailing twelve month basis. TTM Lease Coverage is a supplemental measure of a tenant’s/operator’s ability to meet their cash rent obligations to the Company. However, its usefulness is limited by, among other things, the same factors that limit the usefulness of EBITDAR.
ADR: Average Daily Rate
RevPAR: Revenue per Available Room
UPB: Unpaid Principal Balance
REIM: Real Estate Investment Management
Colony Capital | Supplemental Financial Report | 32 | ||||||||||
| Xb. Appendices - Reconciliation of Net Income (Loss) to NOI | ||
| ($ in thousands; for the three months ended September 30, 2020) | |||||||||||
| NOI Determined as Follows | Wellness Infrastructure | ||||||||||
| Total revenues | $ | 124,193 | |||||||||
| Straight-line rent revenue and amortization of above- and below-market lease intangibles | (5,079) | ||||||||||
| Interest income | (2) | ||||||||||
Property operating expenses(1) | (57,459) | ||||||||||
| NOI | $ | 61,653 | |||||||||
| Reconciliation of Net Income (Loss) from Continuing Operations to NOI | |||||||||||
| Wellness Infrastructure | |||||||||||
| Income (loss) | $ | (6,969) | |||||||||
| Adjustments: | |||||||||||
| Straight-line rent revenue and amortization of above- and below-market lease intangibles | (5,079) | ||||||||||
| Interest income | (2) | ||||||||||
| Interest expense | 32,310 | ||||||||||
| Transaction, investment and servicing costs | 1,031 | ||||||||||
| Depreciation and amortization | 31,961 | ||||||||||
| Impairment loss | 2,451 | ||||||||||
| Compensation and administrative expense | 4,104 | ||||||||||
| Gain on sale of real estate | (186) | ||||||||||
| Other (gain) loss, net | (3,836) | ||||||||||
| Income tax (benefit) expense | 5,868 | ||||||||||
| NOI | $ | 61,653 | |||||||||
Notes:
(1) Property operating expenses includes property management fees paid to third parties.
Colony Capital | Supplemental Financial Report | 33 | ||||||||||
| Xc. Appendices - Reconciliations of Net Income (Loss) to Digital IM FRE and Digital Operating Adjusted EBITDA | ||
| ($ in thousands; for the three months ended September 30, 2020) | |||||||||||||||||
| Digital Investment Management FRE Determined as Follows | |||||||||||||||||
| Digital Investment Management Net income (loss) | 3,539 | ||||||||||||||||
| Adjustments: | |||||||||||||||||
| Interest income | (2) | ||||||||||||||||
| Depreciation and amortization | 10,259 | ||||||||||||||||
| Compensation expense—equity-based | 1,101 | ||||||||||||||||
| Administrative expenses—straight-line rent | 14 | ||||||||||||||||
| Equity method (earnings) losses | (6,134) | ||||||||||||||||
| Other (gain) loss, net | (32) | ||||||||||||||||
| Income tax (benefit) expense | 144 | ||||||||||||||||
| FRE | $ | 8,889 | |||||||||||||||
| Digital Operating Adjusted EBITDA Determined as Follows | |||||||||||||||||
| Net income (loss) from continuing operations | $ | (38,479) | |||||||||||||||
| Adjustments: | |||||||||||||||||
| Interest expense | 18,589 | ||||||||||||||||
| Income tax (benefit) expense | (6,091) | ||||||||||||||||
| Depreciation and amortization | 73,107 | ||||||||||||||||
| Other gain loss | 45 | ||||||||||||||||
| EBITDAre: | 47,171 | ||||||||||||||||
| Straight-line rent expenses and amortization of above- and below-market lease intangibles | (2,106) | ||||||||||||||||
| Compensation expense—equity-based | 148 | ||||||||||||||||
| Installation services | (65) | ||||||||||||||||
| Restructuring & integration costs | 470 | ||||||||||||||||
| Transaction, investment and servicing costs | (50) | ||||||||||||||||
| Adjusted EBITDA: | $ | 45,568 | |||||||||||||||
Colony Capital | Supplemental Financial Report | 34 | ||||||||||
| Xd. Appendices - Assets and Liabilities of Assets Presented Under Discontinued Operations | ||
| ($ in thousands; for the three months ended September 30, 2020) | Hospitality and THL | Bulk Industrial | |||||||||||||||
| Assets | |||||||||||||||||
| Restricted cash | $ | 69,033 | $ | — | |||||||||||||
| Real estate, net | 3,517,983 | 342,758 | |||||||||||||||
| Deferred leasing costs and intangible assets, net | 1,851 | 23,599 | |||||||||||||||
| Other assets | 80,198 | 4,247 | |||||||||||||||
Total assets held for disposition—discontinued operations | 3,669,065 | 370,604 | |||||||||||||||
| Liabilities | |||||||||||||||||
| Debt, net | 3,479,355 | 233,627 | |||||||||||||||
| Lease intangibles and other liabilities | 165,010 | 2,230 | |||||||||||||||
Total liabilities related to assets held for disposition—discontinued operations | $ | 3,644,365 | $ | 235,857 | |||||||||||||
Colony Capital | Supplemental Financial Report | 35 | ||||||||||