Attached files
| file | filename |
|---|---|
| EX-99.1 - EX-99.1 - Manitex International, Inc. | d75824dex991.htm |
| 8-K - 8-K - Manitex International, Inc. | d75824d8k.htm |

MANITEX INTERNATIONAL, INC. NASDAQ: MNTX Third Quarter Earnings Conference Call November 2020 Exhibit 99.2

Forward-Looking Statement and Non-GAAP Measures Safe Harbor Statement under the U.S. Private Securities Litigation Reform Act of 1995: This presentation contains statements that are forward-looking in nature which express the beliefs and expectations of management including statements regarding the Company’s expected results of operations or liquidity; statements concerning projections, predictions, expectations, estimates or forecasts as to our business, financial and operational results and future economic performance; and statements of management’s goals and objectives and other similar expressions concerning matters that are not historical facts. In some cases, you can identify forward-looking statements by terminology such as “anticipate,” “estimate,” “plan,” “project,” “continuing,” “ongoing,” “expect,” “we believe,” “we intend,” “may,” “will,” “should,” “could,” and similar expressions. Such statements are based on current plans, estimates and expectations and involve a number of known and unknown risks, uncertainties and other factors that could cause the Company's future results, performance or achievements to differ significantly from the results, performance or achievements expressed or implied by such forward-looking statements. These factors and additional information are discussed in the Company's filings with the Securities and Exchange Commission and statements in this presentation should be evaluated in light of these important factors. Although we believe that these statements are based upon reasonable assumptions, we cannot guarantee future results. Forward-looking statements speak only as of the date on which they are made, and the Company undertakes no obligation to update publicly or revise any forward-looking statement, whether as a result of new information, future developments or otherwise. NASDAQ : MNTX
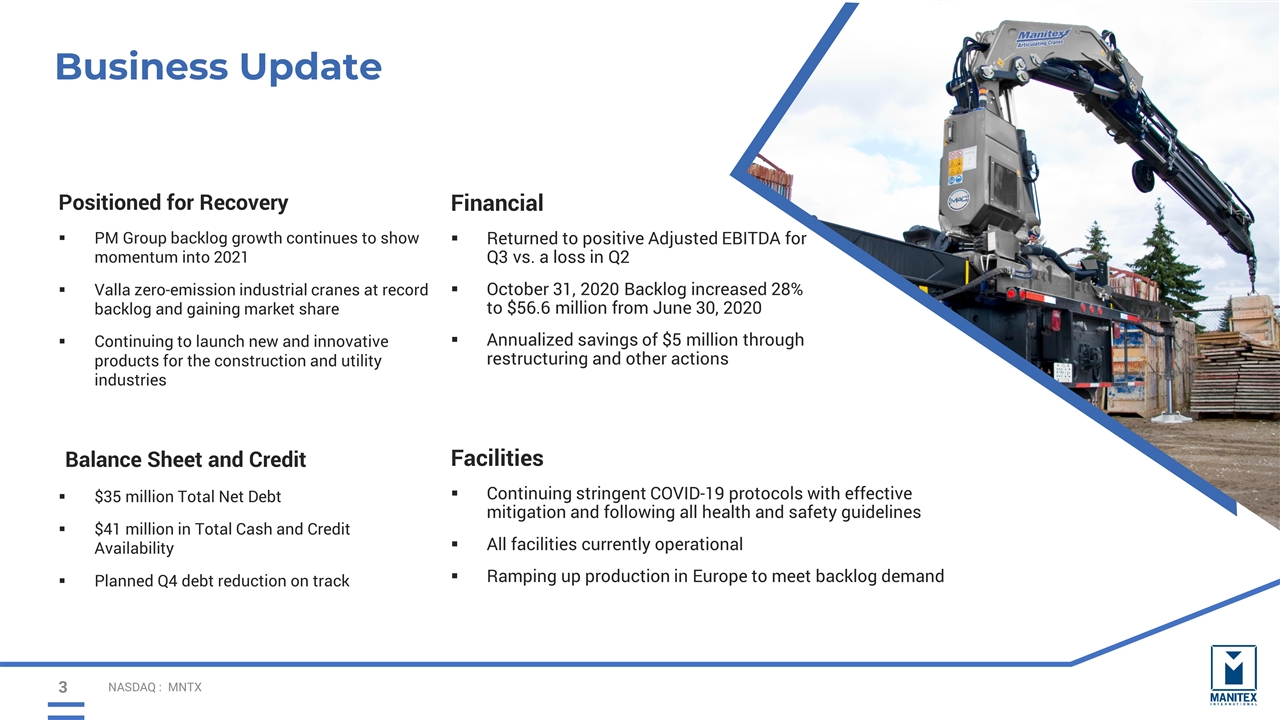
Business Update NASDAQ : MNTX Positioned for Recovery PM Group backlog growth continues to show momentum into 2021 Valla zero-emission industrial cranes at record backlog and gaining market share Continuing to launch new and innovative products for the construction and utility industries Financial Returned to positive Adjusted EBITDA for Q3 vs. a loss in Q2 October 31, 2020 Backlog increased 28% to $56.6 million from June 30, 2020 Annualized savings of $5 million through restructuring and other actions \Balance Sheet and Credit $35 million Total Net Debt $41 million in Total Cash and Credit Availability Planned Q4 debt reduction on track Facilities Continuing stringent COVID-19 protocols with effective mitigation and following all health and safety guidelines All facilities currently operational Ramping up production in Europe to meet backlog demand
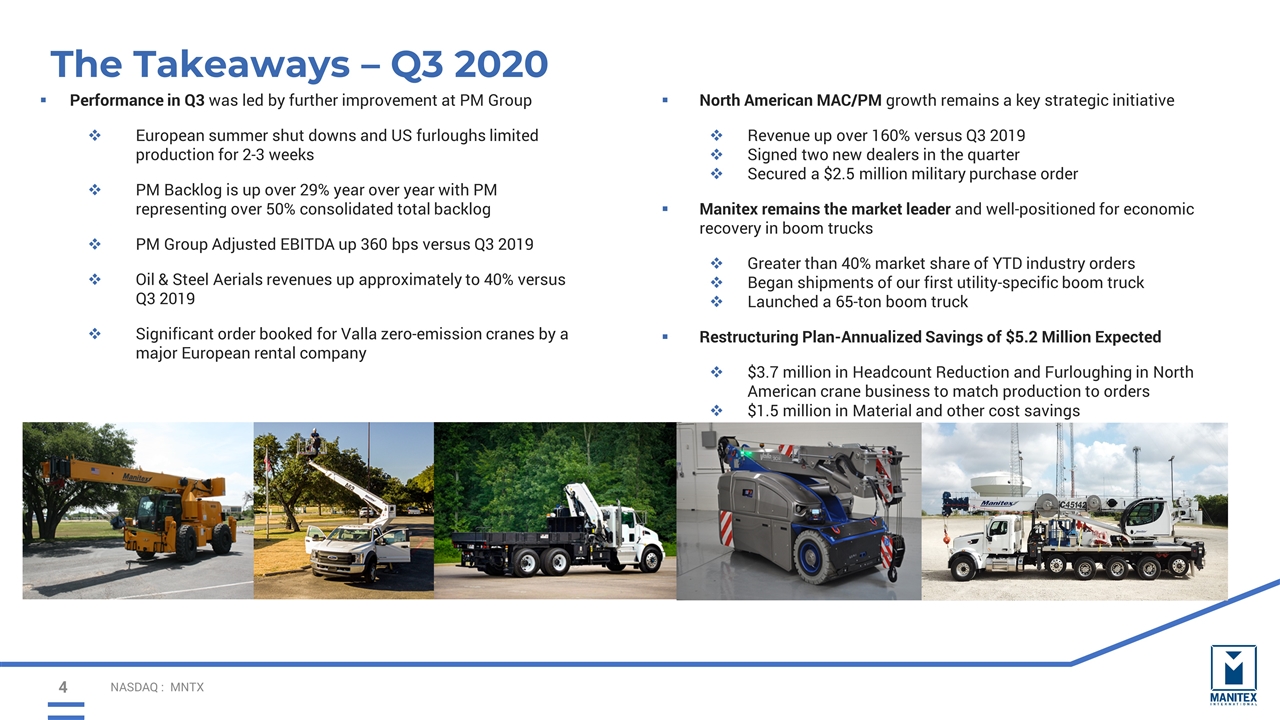
The Takeaways – Q3 2020 Performance in Q3 was led by further improvement at PM Group European summer shut downs and US furloughs limited production for 2-3 weeks PM Backlog is up over 29% year over year with PM representing over 50% consolidated total backlog PM Group Adjusted EBITDA up 360 bps versus Q3 2019 Oil & Steel Aerials revenues up approximately to 40% versus Q3 2019 Significant order booked for Valla zero-emission cranes by a major European rental company North American MAC/PM growth remains a key strategic initiative Revenue up over 160% versus Q3 2019 Signed two new dealers in the quarter Secured a $2.5 million military purchase order Manitex remains the market leader and well-positioned for economic recovery in boom trucks Greater than 40% market share of YTD industry orders Began shipments of our first utility-specific boom truck Launched a 65-ton boom truck Restructuring Plan-Annualized Savings of $5.2 Million Expected $3.7 million in Headcount Reduction and Furloughing in North American crane business to match production to orders $1.5 million in Material and other cost savings NASDAQ : MNTX
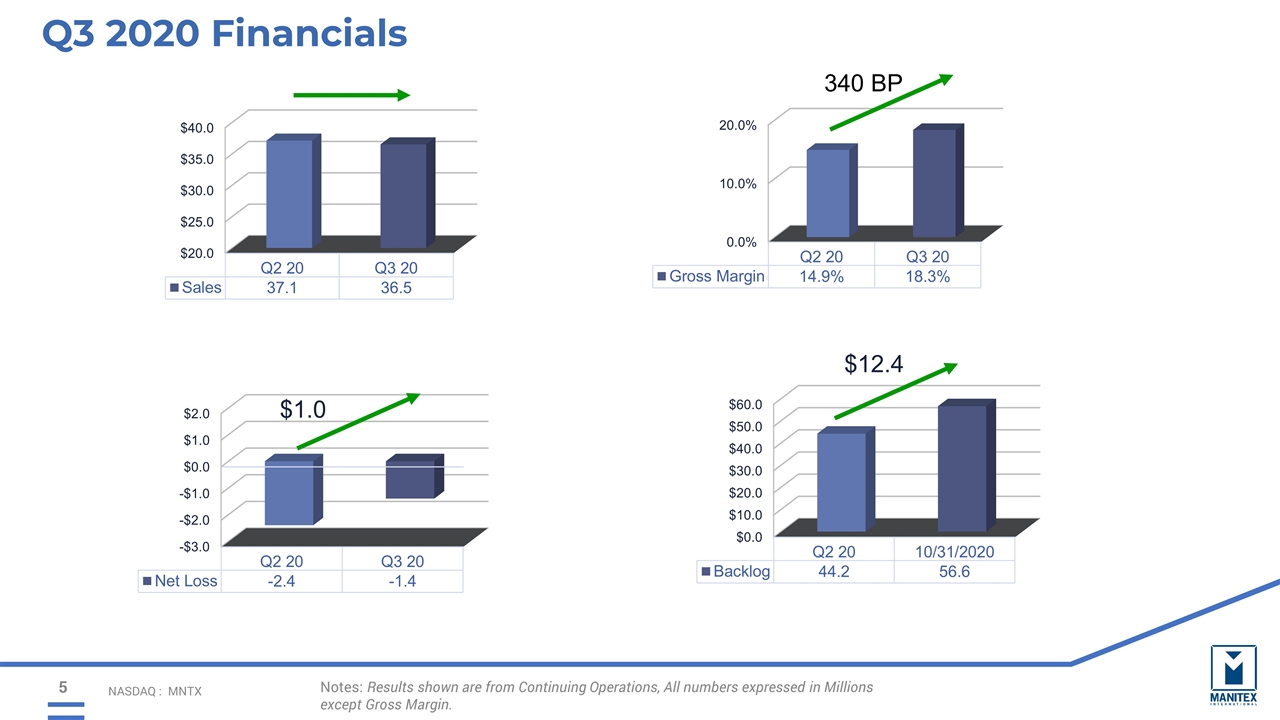
NASDAQ : MNTX Notes: Results shown are from Continuing Operations, All numbers expressed in Millions except Gross Margin. Q3 2020 Financials 340 BP
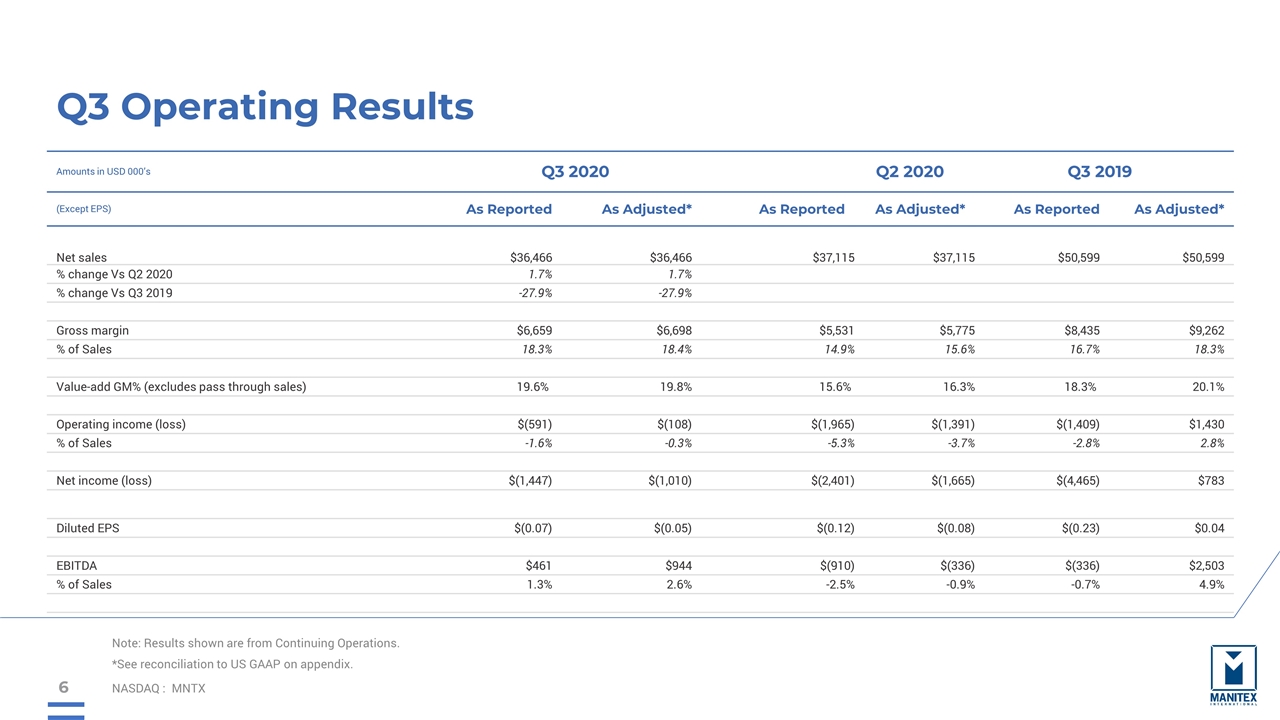
Q3 Operating Results NASDAQ : MNTX Amounts in USD 000’s Q3 2020 Q2 2020 Q3 2019 (Except EPS) As Reported As Adjusted* As Reported As Adjusted* As Reported As Adjusted* Net sales $36,466 $36,466 $37,115 $37,115 $50,599 $50,599 % change Vs Q2 2020 1.7% 1.7% % change Vs Q3 2019 -27.9% -27.9% Gross margin $6,659 $6,698 $5,531 $5,775 $8,435 $9,262 % of Sales 18.3% 18.4% 14.9% 15.6% 16.7% 18.3% Value-add GM% (excludes pass through sales) 19.6% 19.8% 15.6% 16.3% 18.3% 20.1% Operating income (loss) $(591) $(108) $(1,965) $(1,391) $(1,409) $1,430 % of Sales -1.6% -0.3% -5.3% -3.7% -2.8% 2.8% Net income (loss) $(1,447) $(1,010) $(2,401) $(1,665) $(4,465) $783 Diluted EPS $(0.07) $(0.05) $(0.12) $(0.08) $(0.23) $0.04 EBITDA $461 $944 $(910) $(336) $(336) $2,503 % of Sales 1.3% 2.6% -2.5% -0.9% -0.7% 4.9% Note: Results shown are from Continuing Operations. *See reconciliation to US GAAP on appendix.
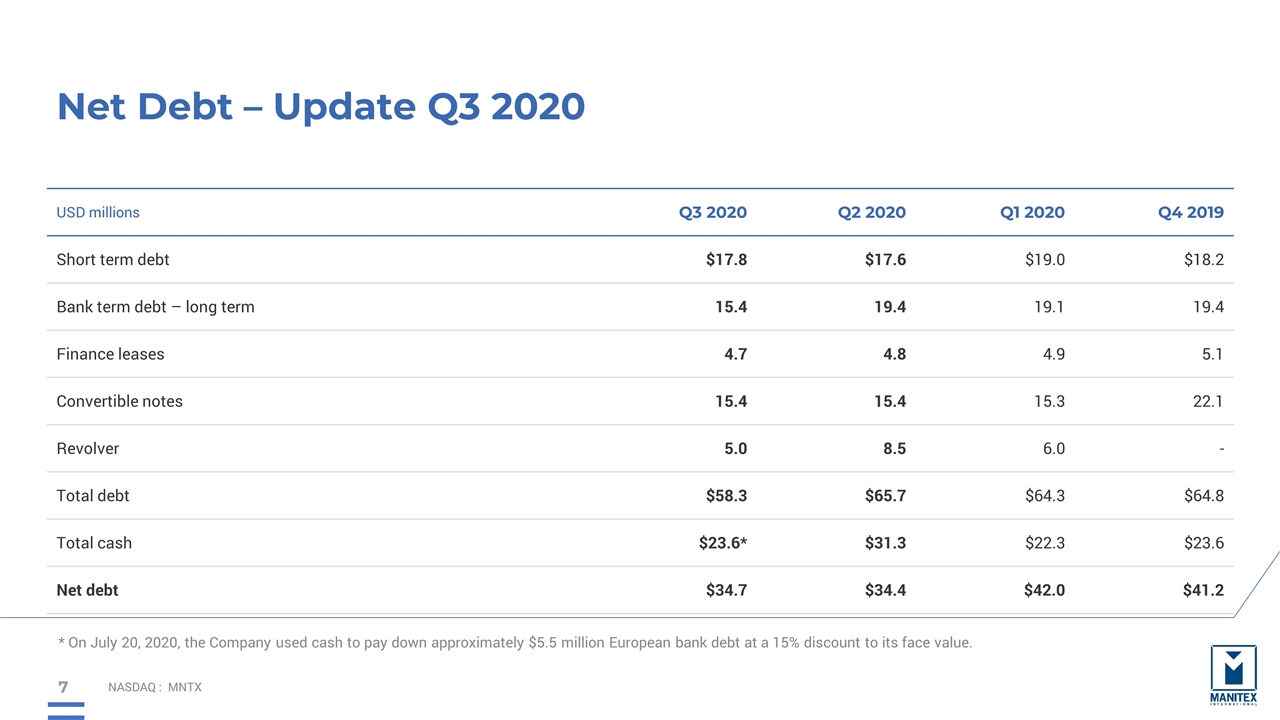
Net Debt – Update Q3 2020 NASDAQ : MNTX USD millions Q3 2020 Q2 2020 Q1 2020 Q4 2019 Short term debt $17.8 $17.6 $19.0 $18.2 Bank term debt – long term 15.4 19.4 19.1 19.4 Finance leases 4.7 4.8 4.9 5.1 Convertible notes 15.4 15.4 15.3 22.1 Revolver 5.0 8.5 6.0 - Total debt $58.3 $65.7 $64.3 $64.8 Total cash $23.6* $31.3 $22.3 $23.6 Net debt $34.7 $34.4 $42.0 $41.2 * On July 20, 2020, the Company used cash to pay down approximately $5.5 million European bank debt at a 15% discount to its face value.
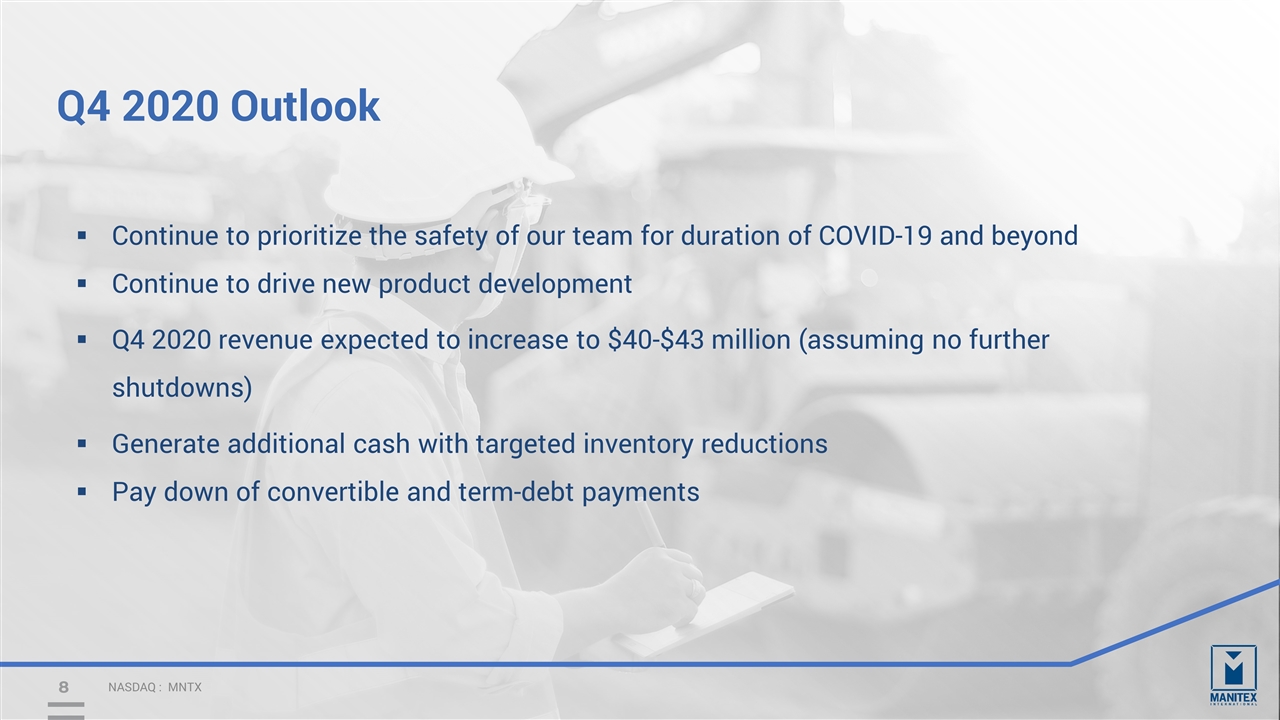
Q4 2020 Outlook NASDAQ : MNTX Continue to prioritize the safety of our team for duration of COVID-19 and beyond Continue to drive new product development Q4 2020 revenue expected to increase to $40-$43 million (assuming no further shutdowns) Generate additional cash with targeted inventory reductions Pay down of convertible and term-debt payments
APPENDIX_- SUPPLEMENTAL FINANCIALS
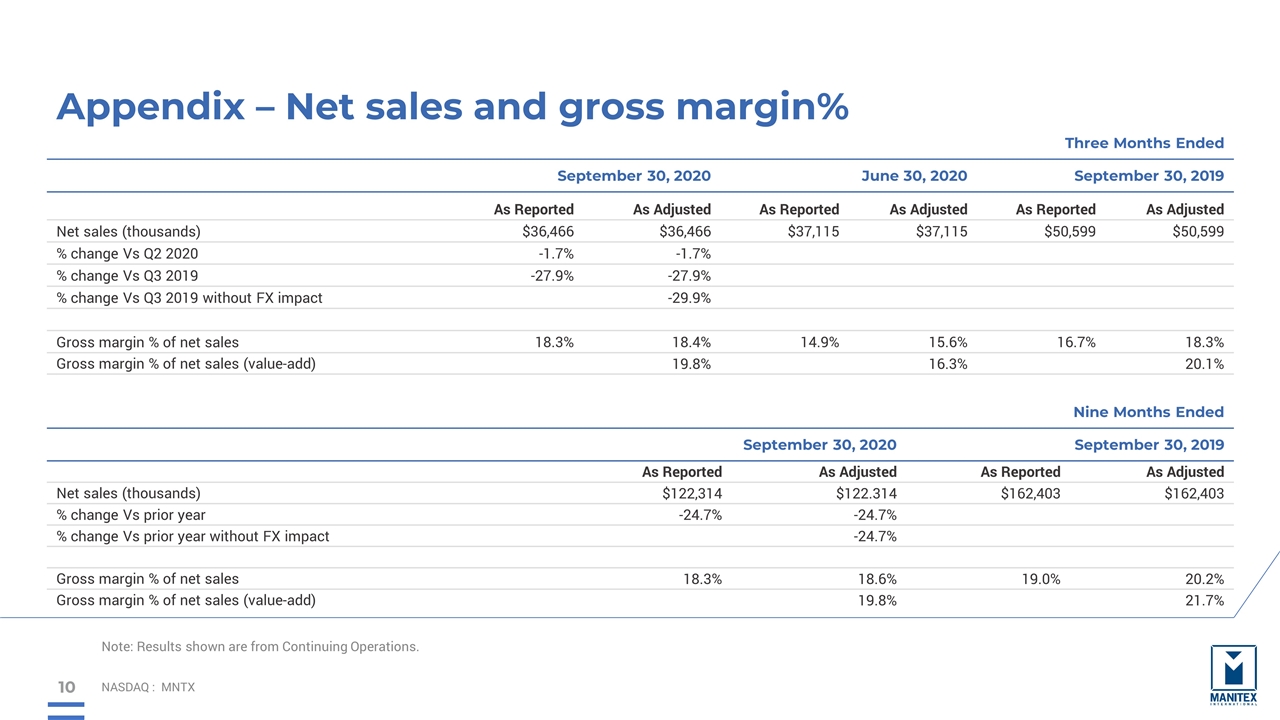
Appendix – Net sales and gross margin% NASDAQ : MNTX Three Months Ended September 30, 2020 June 30, 2020 September 30, 2019 As Reported As Adjusted As Reported As Adjusted As Reported As Adjusted Net sales (thousands) $36,466 $36,466 $37,115 $37,115 $50,599 $50,599 % change Vs Q2 2020 -1.7% -1.7% % change Vs Q3 2019 -27.9% -27.9% % change Vs Q3 2019 without FX impact -29.9% Gross margin % of net sales 18.3% 18.4% 14.9% 15.6% 16.7% 18.3% Gross margin % of net sales (value-add) 19.8% 16.3% 20.1% Note: Results shown are from Continuing Operations. Nine Months Ended September 30, 2020 September 30, 2019 As Reported As Adjusted As Reported As Adjusted Net sales (thousands) $122,314 $122.314 $162,403 $162,403 % change Vs prior year -24.7% -24.7% % change Vs prior year without FX impact -24.7% Gross margin % of net sales 18.3% 18.6% 19.0% 20.2% Gross margin % of net sales (value-add) 19.8% 21.7%
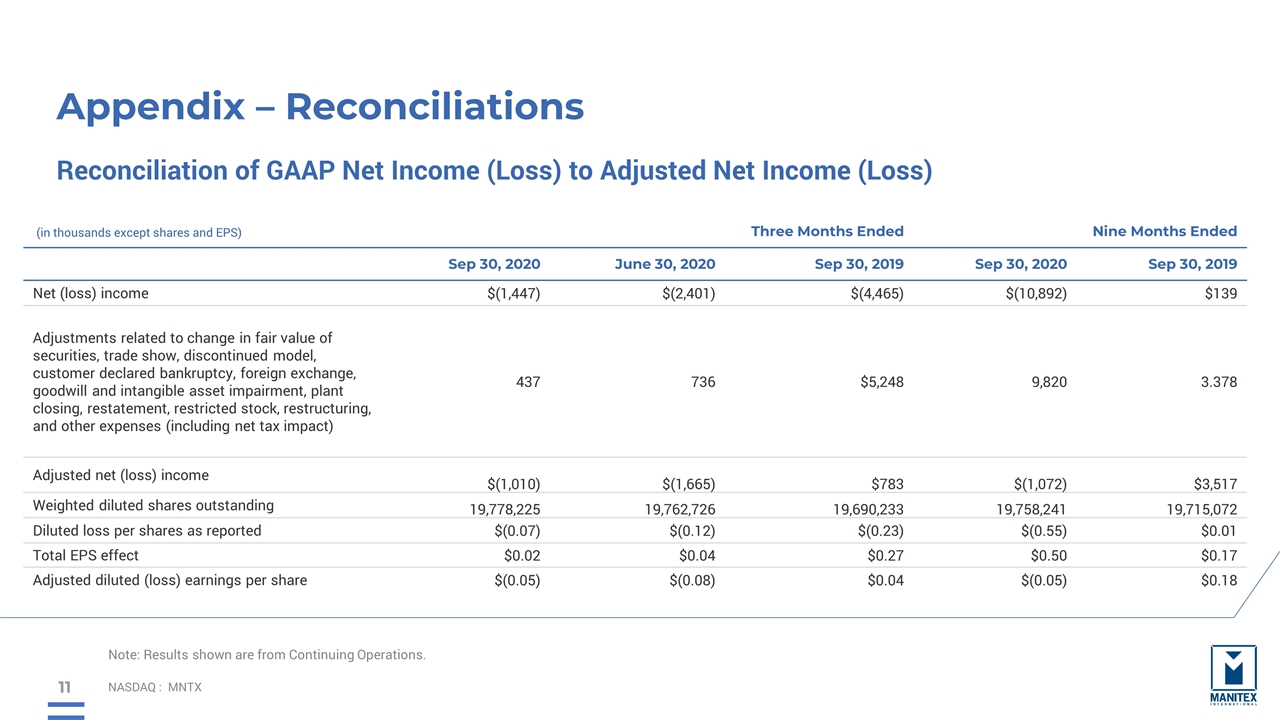
Appendix – Reconciliations NASDAQ : MNTX Reconciliation of GAAP Net Income (Loss) to Adjusted Net Income (Loss) Note: Results shown are from Continuing Operations. (in thousands except shares and EPS) Three Months Ended Nine Months Ended Sep 30, 2020 June 30, 2020 Sep 30, 2019 Sep 30, 2020 Sep 30, 2019 Net (loss) income $(1,447) $(2,401) $(4,465) $(10,892) $139 Adjustments related to change in fair value of securities, trade show, discontinued model, customer declared bankruptcy, foreign exchange, goodwill and intangible asset impairment, plant closing, restatement, restricted stock, restructuring, and other expenses (including net tax impact) 437 736 $5,248 9,820 3.378 Adjusted net (loss) income $(1,010) $(1,665) $783 $(1,072) $3,517 Weighted diluted shares outstanding 19,778,225 19,762,726 19,690,233 19,758,241 19,715,072 Diluted loss per shares as reported $(0.07) $(0.12) $(0.23) $(0.55) $0.01 Total EPS effect $0.02 $0.04 $0.27 $0.50 $0.17 Adjusted diluted (loss) earnings per share $(0.05) $(0.08) $0.04 $(0.05) $0.18
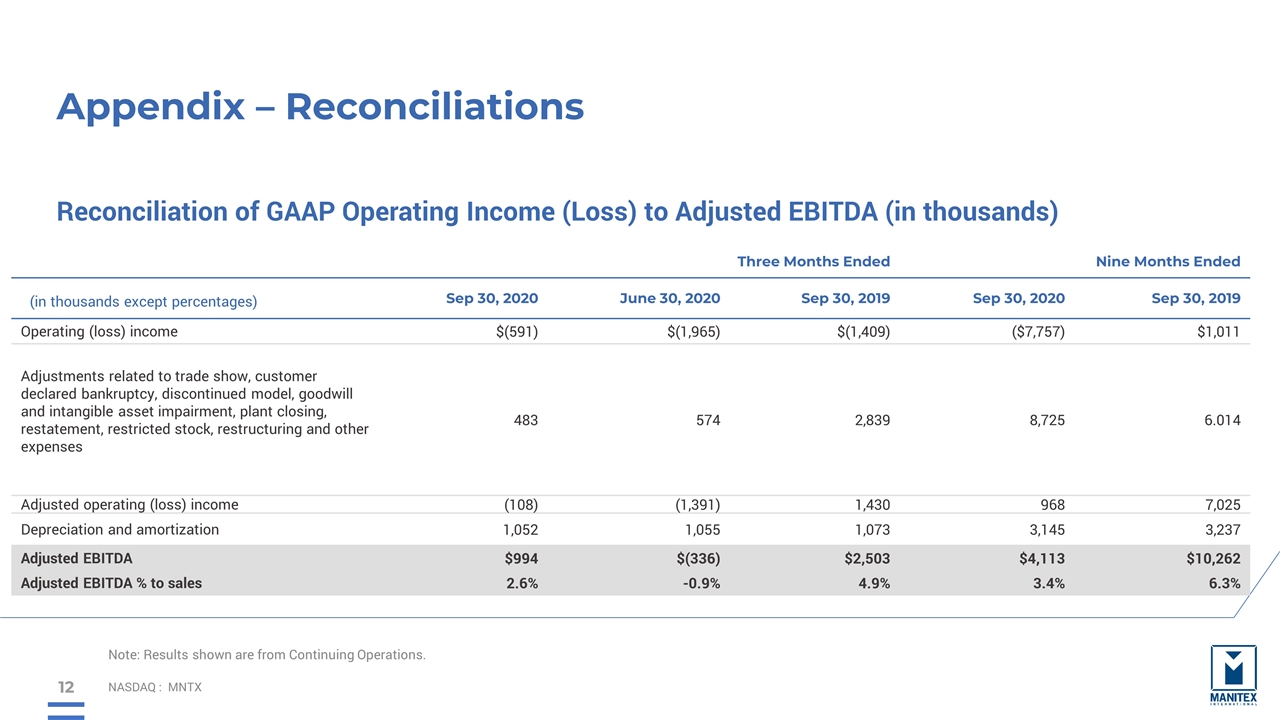
Appendix – Reconciliations NASDAQ : MNTX Reconciliation of GAAP Operating Income (Loss) to Adjusted EBITDA (in thousands) Note: Results shown are from Continuing Operations. Three Months Ended Nine Months Ended (in thousands except percentages) Sep 30, 2020 June 30, 2020 Sep 30, 2019 Sep 30, 2020 Sep 30, 2019 Operating (loss) income $(591) $(1,965) $(1,409) ($7,757) $1,011 Adjustments related to trade show, customer declared bankruptcy, discontinued model, goodwill and intangible asset impairment, plant closing, restatement, restricted stock, restructuring and other expenses 483 574 2,839 8,725 6.014 Adjusted operating (loss) income (108) (1,391) 1,430 968 7,025 Depreciation and amortization 1,052 1,055 1,073 3,145 3,237 Adjusted EBITDA $994 $(336) $2,503 $4,113 $10,262 Adjusted EBITDA % to sales 2.6% -0.9% 4.9% 3.4% 6.3%
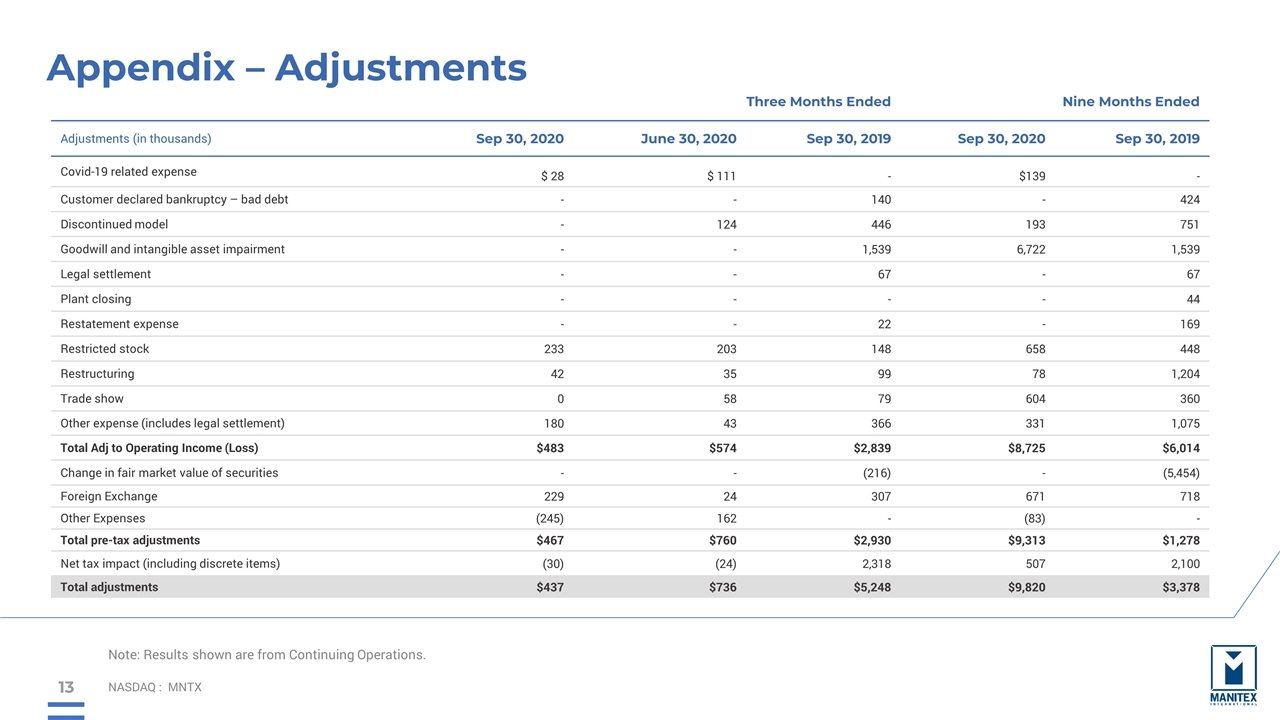
Appendix – Adjustments NASDAQ : MNTX Note: Results shown are from Continuing Operations. Three Months Ended Nine Months Ended Adjustments (in thousands) Sep 30, 2020 June 30, 2020 Sep 30, 2019 Sep 30, 2020 Sep 30, 2019 Covid-19 related expense $ 28 $ 111 - $139 - Customer declared bankruptcy – bad debt - - 140 - 424 Discontinued model - 124 446 193 751 Goodwill and intangible asset impairment - - 1,539 6,722 1,539 Legal settlement - - 67 - 67 Plant closing - - - - 44 Restatement expense - - 22 - 169 Restricted stock 233 203 148 658 448 Restructuring 42 35 99 78 1,204 Trade show 0 58 79 604 360 Other expense (includes legal settlement) 180 43 366 331 1,075 Total Adj to Operating Income (Loss) $483 $574 $2,839 $8,725 $6,014 Change in fair market value of securities - - (216) - (5,454) Foreign Exchange 229 24 307 671 718 Other Expenses (245) 162 - (83) - Total pre-tax adjustments $467 $760 $2,930 $9,313 $1,278 Net tax impact (including discrete items) (30) (24) 2,318 507 2,100 Total adjustments $437 $736 $5,248 $9,820 $3,378

Steve Filipov, CEO Manitex International 708-237-2054 Peter Seltzberg, IR Darrow Associates, Inc. 516-419-9915 MANITEX INTERNATIONAL, INC. NASDAQ: MNTX Third Quarter Earnings Conference Call November 2020
