Attached files
| file | filename |
|---|---|
| EX-32.1 - EX-32.1 - Manitex International, Inc. | mntx-ex321_10.htm |
| EX-31.2 - EX-31.2 - Manitex International, Inc. | mntx-ex312_11.htm |
| EX-31.1 - EX-31.1 - Manitex International, Inc. | mntx-ex311_6.htm |
| EX-23.1 - EX-23.1 - Manitex International, Inc. | mntx-ex231_8.htm |
| EX-21.1 - EX-21.1 - Manitex International, Inc. | mntx-ex211_9.htm |
UNITED STATES
SECURITIES AND EXCHANGE COMMISSION
Washington, D.C. 20549
FORM 10-K
ANNUAL REPORT
PURSUANT TO SECTION 13 OR 15(d)
OF THE SECURITIES EXCHANGE ACT OF 1934
FOR THE FISCAL YEAR ENDED DECEMBER 31, 2017
Commission File No.: 001-32401
MANITEX INTERNATIONAL, INC.
(Exact name of registrant as specified in its charter)
|
Michigan |
|
42-1628978 |
|
(State of incorporation) |
|
(I.R.S. Employer Identification No.) |
|
9725 Industrial Drive Bridgeview, Illinois |
|
60455 |
|
(Address of principal executive offices) |
|
(Zip Code) |
Registrant’s telephone number, including area code: (708) 430-7500
Securities registered pursuant to Section 12(b) of the Act:
|
Title of each class |
|
Name of each exchange on which registered |
|
Common Stock, no par value |
|
The NASDAQ Stock Market LLC |
|
Preferred Share Purchase Rights |
|
The NASDAQ Stock Market LLC |
Securities registered pursuant to Section 12(g) of the Act:
None
Indicate by check mark if the registrant is a well-known seasoned issuer, as defined in Rule 405 of the Securities Act. Yes ☐ No ☒
Indicate by check mark if the registrant is not required to file reports pursuant to Section 13 or Section 15(d) of the Act. Yes ☐ No ☒
Indicate by check mark whether the registrant: (1) has filed all reports required to be filed by Section 13 or 15(d) of the Securities Exchange Act of 1934 during the preceding 12 months (or for such shorter period that the registrant was required to file such reports), and (2) has been subject to such filing requirements for the past 90 days. Yes ☐ No ☒
Indicate by check mark whether the registrant has submitted electronically and posted on its corporate Web site, if any, every Interactive Data File required to be submitted and posted pursuant to Rule 405 of Regulation S-T during the preceding 12 months (or for such shorter period that the registrant was required to submit and post such files). Yes ☒ No ☐
Indicate by check mark if disclosure of delinquent filers pursuant to Item 405 of Regulation S-K is not contained herein, and will not be contained, to the best of registrant’s knowledge, in definitive proxy or information statements incorporated by reference in Part III of this Form 10-K or any amendment to this Form 10-K.☐
Indicate by check mark whether the registrant is a large accelerated filer, an accelerated filer, a non-accelerated filer, or a smaller reporting company, or an emerging growth company. See the definitions of “large accelerated filer”, “accelerated filer” and “smaller reporting company,” and “emerging growth company” in Rule 12b-2 of the Exchange Act.
|
Large Accelerated Filer |
☐ |
Accelerated Filer |
☒ |
|
|
|
|
|
|
Non-Accelerated Filer |
☐ |
Smaller reporting company |
☐ |
|
|
|
|
|
|
Emerging growth company |
☐ |
|
|
If an emerging growth company, indicate by check mark if the registrant has elected not to use the extended transition period for complying with any new or revised financial accounting standards provided pursuant to Section 13(a) of the Securities Act. ☐
Indicate by check mark whether the registrant is a shell company (as defined in Rule 12b-2 of the Act). Yes ☐ No ☒
The aggregate market value of the shares of common stock, no par value (“Common Stock”), held by non-affiliates of the registrant as of June 30, 2017 was approximately $93 million based upon the closing price for the Common Stock of $6.98 on the NASDAQ Stock Market on such date.
The number of shares of the registrant’s common stock outstanding as of March 1, 2018 was 16,662,386.
DOCUMENTS INCORPORATED BY REFERENCE
Part III of this Annual Report on Form 10-K incorporates by reference information (to the extent specific sections are referred to herein) from the registrant’s Proxy Statement for its 2018 Annual Meeting (the “2018 Proxy Statement”) to be filed with the Commission within 120 days after the end of the fiscal year ended December 31, 2017.
|
|
1 |
|||
|
ITEM 1. |
|
|
2 |
|
|
ITEM 1A. |
|
|
9 |
|
|
ITEM 1B. |
|
|
16 |
|
|
ITEM 2. |
|
|
16 |
|
|
ITEM 3. |
|
|
16 |
|
|
ITEM 4. |
|
|
16 |
|
|
|
|
|
||
|
|
17 |
|||
|
ITEM 5. |
|
|
17 |
|
|
ITEM 6. |
|
|
19 |
|
|
ITEM 7. |
|
MANAGEMENT’S DISCUSSION AND ANALYSIS OF FINANCIAL CONDITION AND RESULTS OF OPERATIONS |
|
20 |
|
ITEM 7A. |
|
|
38 |
|
|
ITEM 8. |
|
|
39 |
|
|
ITEM 9. |
|
CHANGES IN AND DISAGREEMENTS WITH ACCOUNTANTS ON ACCOUNTING AND FINANCIAL DISCLOSURE |
|
91 |
|
ITEM 9A. |
|
|
91 |
|
|
ITEM 9B. |
|
|
93 |
|
|
|
|
|
||
|
|
94 |
|||
|
ITEM 10. |
|
|
94 |
|
|
ITEM 11. |
|
|
94 |
|
|
ITEM 12. |
|
SECURITY OWNERSHIP OF CERTAIN BENEFICIAL OWNERS AND MANAGEMENT AND RELATED STOCKHOLDER MATTERS |
|
94 |
|
ITEM 13. |
|
CERTAIN RELATIONSHIPS AND RELATED TRANSACTIONS, AND DIRECTOR INDEPENDENCE |
|
94 |
|
ITEM 14. |
|
|
94 |
|
|
|
|
|
||
|
|
95 |
|||
|
ITEM 15. |
|
|
95 |
|
|
|
|
|
||
|
|
102 |
|||
i
References to the “Company,” “we,” “our” and “us” refer to Manitex International, Inc., together in each case with our subsidiaries and any predecessor entities unless the context suggests otherwise.
Forward-Looking Statements
When reading this section of this Annual Report on Form 10-K, it is important that you also read the financial statements and related notes thereto. This Annual Report on Form 10-K and certain information incorporated herein by reference contain forward-looking statements within the “safe harbor” provisions of the Private Securities Litigation Reform Act of 1995. All statements contained in this Annual Report on Form 10-K, other than statements that are purely historical, are forward-looking statements and are based upon management’s present expectations, objectives, anticipations, plans, hopes, beliefs, intentions or strategies regarding the future. We use words such as “anticipate,” “estimate,” “plan,” “project,” “continuing,” “ongoing,” “expect,” “believe,” “intend,” “may,” “will,” “should,” “could,” and similar expressions to identify forward-looking statements. Forward-looking statements in this Annual Report on Form 10-K include, without limitation: (1) projections of revenue, earnings, capital structure and other financial items, (2) statements of our plans and objectives, (3) statements regarding the capabilities and capacities of our business operations, (4) statements of expected future economic conditions and the effect on us and on our customers, (5) expected benefits of our cost reduction measures, and (6) assumptions underlying statements regarding us or our business. Our actual results may differ from information contained in these forward looking-statements for many reasons, including those described below and in the section entitled “Item 1A. Risk Factors”:
|
(1) |
a future substantial deterioration in economic conditions, especially in the United States and Europe; |
|
(2) |
government spending; fluctuations in the construction industry, and capital expenditures in the oil and gas industry; |
|
(3) |
our level of indebtedness and our ability to meet financial covenants required by our debt agreements; |
|
(4) |
our ability to negotiate extensions of our credit agreements and to obtain additional debt or equity financing when needed; |
|
(5) |
the cyclical nature of the markets we operate in; |
|
(6) |
increase in interest rates; |
|
(7) |
Our increasingly international operations expose us to additional risks and challenges associated with conducting business internationally; |
|
(8) |
difficulties in implementing new systems, integrating acquired businesses, managing anticipated growth, and responding to technological change; |
|
(9) |
our customers’ diminished liquidity and credit availability; |
|
(10) |
the performance of our competitors; |
|
(11) |
shortages in supplies and raw materials or the increase in costs of materials; |
|
(12) |
potential losses under residual value guarantees, |
|
(13) |
product liability claims, intellectual property claims, and other liabilities; |
|
(14) |
the volatility of our stock price; |
|
(15) |
future sales of our common stock; |
|
(16) |
the willingness of our stockholders and directors to approve mergers, acquisitions, and other business transactions; |
|
(17) |
currency transaction (foreign exchange) risks and the risk related to forward currency contracts; |
|
(18) |
certain provisions of the Michigan Business Corporation Act and the Company’s Articles of Incorporation, as amended, Amended and Restated Bylaws, and the Company’s Preferred Stock Purchase Rights may discourage or prevent a change in control of the Company; |
|
(19) |
a substantial portion of our revenues are attributed to limited number of customers which may decrease or cease purchasing any time; |
|
(20) |
a disruption or breach in our information technology systems; |
|
(21) |
our reliance on the management and leadership skills of our senior executives; |
|
(22) |
the cost of compliance with Section 404 of the Sarbanes-Oxley Act of 2002; and |
|
(23) |
Impairment in the carrying value of goodwill could negatively affect our operating results; and |
|
(24) |
other factors. |
1
The risks described in our Annual Report on Form 10-K are not the only risks facing our Company. Additional risks and uncertainties not currently known to us or that we currently deem to be immaterial also may materially adversely affect our business, financial condition or operating results. We do not undertake, and expressly disclaim, any obligation to update this forward-looking information, except as required under applicable law.
Our Business
The Company is a leading provider of engineered lifting solutions. The Company operates in a single business segment. The Company designs, manufactures and distributes a diverse group of products that serve different functions and are used in a variety of industries.
Through its Manitex, Inc. (“Manitex”) subsidiary, it markets a comprehensive line of boom trucks, truck cranes and sign cranes. Manitex’s boom trucks and crane products are primarily used for industrial projects, energy exploration and infrastructure development, including, roads, bridges and commercial construction.
Badger Equipment Company (“Badger”) is a manufacturer of specialized rough terrain cranes and material handling products. Badger primarily serves the needs of the construction, municipality and railroad industries.
PM Group S.p.A. (“PM”) is a leading Italian manufacturer of truck mounted hydraulic knuckle boom cranes with a 50-year history of technology and innovation, and a product range spanning more than 50 models. Its largest subsidiary, Oil & Steel (“O&S”), is a manufacturer of truck-mounted aerial platforms with a diverse product line and an international client base.
Our Valla product line of industrial cranes is a full range of precision pick and carry cranes using electric, diesel, and hybrid power options. Its cranes offer wheeled or tracked, and fixed or swing boom configurations, with special applications designed specifically to meet the needs of its customers. These products are sold internationally through dealers and into the rental distribution channel.
Sabre Manufacturing, LLC (“Sabre”), which is located in Knox, Indiana, manufactures a comprehensive line of specialized mobile tanks for liquid and solid storage and containment solutions with capacities from 8,000 to 21,000 gallons. Its mobile tanks are sold to specialized independent tank rental companies and through the Company’s existing dealer network. The tanks are used in a variety of end markets such as petrochemical, waste management and oil and gas drilling.
Crane and Machinery, Inc. (“C&M”) is a distributor of the Company’s products as well as Terex Corporation’s (“Terex”) rough terrain and truck cranes. Crane and Machinery Leasing, Inc.’s (“C&M Leasing”) rents equipment manufactured by the Company as well limited amount of equipment manufactured by third parties. Although C&M is a distributor of Terex rough terrain and truck cranes, C&M’s primary business is the distribution of products manufactured by the Company. C&M Leasing’s primary business is the facilitation of sales of products manufactured by the Company through its rent to own program. As C&M and C&M Leasing’s primary business is the facilitation of Company manufactured product sales, discrete financial information is not available.
Consolidated Variable Interest Entity
Even though it has no ownership interest in SVW Crane & Equipment Company (together with its wholly owned subsidiary, Rental Consulting Service Company, “SVW”), the Company has the power to direct the activities that most significantly impact SVW’s economic performance. Additionally, the Company was the primary beneficiary of the SVW relationship. SVW obtained third party financing, which was effectively guaranteed by the Company, on specific cranes the Company manufactured and remitted the loan proceeds to the Company. Other than its business transactions described herein, SVW had no other substantial business operations. The Company has determined that SVW is a Variable Interest Entity (“VIE”) that under current accounting guidance needs to be consolidated in the Company’s financial results.
Recent Acquisitions
On March 12, 2015, the Company entered into inventory and equipment purchase agreements with Columbia Tanks, LLC. Financial results are included in the consolidated results beginning on March 12, 2015.
On January 15, 2015, the Company acquired PM Group S.p.A. (“PM”) which is based in San Cesario sul Panaro, Modena, Italy. PM’s financial results are included in the consolidated results beginning on January 15, 2015.
On December 19, 2014, the Company completed an agreement with Terex and became the majority owner of ASV, which is located in Grand Rapids, Minnesota. As a result of the transaction, the Company owned 51% of ASV and Terex owned 49% of ASV. ASV’s financial results were included in the consolidated results beginning on December 20, 2014. ASV is currently classified as a discontinued operation. See “Discontinued Operations” section below for additional information.
2
On December 16, 2014, the Company, BGI USA Inc. (“BGI”), Movedesign SRL and R& S Advisory S.r.l., entered into an operating agreement for Lift Ventures LLC (“Lift Ventures”), a joint venture entity. Lift Ventures manufactures and sells certain products and components, including the Schaeff line of electric forklifts and certain Liftking products. The Company owned 25% of the equity of Lift Ventures and licenses certain intellectual property related to the Company’s products to Lift Ventures. In 2016, the Company determined its investment in Lift Ventures was impaired and has recognized an impairment charge to write off its entire investment in Lift Ventures LLC (See Note 26).
On November 30, 2013, CVS Ferrari srl (“CVS”), an Italian corporation and a wholly subsidiary (as of the date of acquisitions) of Manitex International, Inc., purchased the assets of Valla SpA (“Valla”). Valla develops mobile cranes from 2 to 90 tons, using electric, diesel and hybrid power options. Its cranes offer wheeled or tracked, fixed or swing boom configurations, with special applications designed specifically to meet the needs of its customers. Valla was reorganized as Manitex Valla srl (“Valla”) in conjunction with the sale of CVS in December 2016. Valla’s financial results are included in the consolidated results beginning on November 30, 2013.
On August 19, 2013, Manitex Sabre, Inc. (“Sabre”) acquired the assets of Sabre Manufacturing, LLC, which is located in Knox, Indiana. Sabre manufactures a comprehensive line of specialized mobile tanks for liquid and solid storage and containment solutions. Sabre’s financial results are included in the consolidated results beginning on August 19, 2013.
Discontinued Operations
ASV is located in Grand Rapids, Minnesota and manufactures a line of high quality compact track and skid steer loaders. The products are used in site clearing, general construction, forestry, golf course maintenance and landscaping industries, with general construction being the largest.
Prior to the quarter ended June 30, 2017, the Company owned a 51% interest in ASV Holdings, Inc., which was formerly known as A.S.V., LLC (“ASV Holdings”). On May 11, 2017, in anticipation of an initial public offering, ASV Holdings converted from an LLC to a C-Corporation and the Company’s 51% interest was converted to 4,080,000 common shares of ASV Holdings. On May 17, 2017, in connection within its initial public offering, ASV Holdings sold 1,800,000 of its own shares and the Company sold 2,000,000 shares of ASV Holdings common stock. As of December 31, 2017, the Company held a 21.2% interest in ASV Holdings, but no longer held a controlling interest in ASV Holdings. ASV Holdings was deconsolidated during the quarter ended June 30, 2017 and is recorded as an equity investment starting with quarter ended June 30, 2017. Since this 10-K is being filed after above described events, prior period financial statements included in this 10-K have been restated to reflect ASV Holdings as a discontinued operation. See Note 27 to our Consolidated Financial Statements for discussion of transactions made subsequent to year end related to ASV Holdings.
CVS Ferrari srl (“CVS”) designed and manufactured a range of reach stackers and associated lifting equipment for the global container handling market. CVS was sold on December 22, 2016 and is presented as a discontinued operation.
Manitex Liftking ULC (“Manitex Liftking” or “Liftking”) sold a complete line of rough terrain forklifts, a line of stand-up electric forklifts, cushioned tiered forklifts with lifting capacities from 18 thousand to 40 thousand pounds and special mission oriented vehicles, as well as other specialized carriers, heavy material handling transporters and steel mill equipment. Liftking was sold on September 30, 2016 and is presented as a discontinued operation.
Manitex Load King, LLC (“Load King”) manufactured specialized custom trailers and hauling systems typically used for transporting heavy equipment. Load King trailers served niche markets in the commercial construction, railroad, military and equipment rental industries through a dealer network. Load King was sold on December 28, 2015 and is presented as a discontinued operation.
General Corporate Information
Our predecessor company was formed in 1993 and was purchased in 2003 by Veri-Tek International, Corp., which changed its name to Manitex International, Inc. in 2008. Our principal executive offices are located at 9725 Industrial Drive, Bridgeview, Illinois 60455 and our telephone number is (708) 430-7500. Our website address is www.manitexinternational.com. Information contained on our website is not incorporated by reference into this report and such information should not be considered to be part of this report.
3
INFORMATION ABOUT OUR BUSINESS
Boom Trucks
A boom truck is a straight telescopic boom crane outfitted with a hook and winch which is mounted on a standard flatbed commercial (Class 7 or 8) truck chassis. Relative to other lifting equipment, boom trucks provide increased versatility and are capable of transporting relatively large payloads from site to site at highway speeds. A boom truck is usually sold with outriggers, pads and devices for reinforcing the chassis in order to improve safety and stability. Although produced in a wide range of models and sizes, boom trucks can be broadly distinguished by their normal lifting capability as light, medium, and heavy-cranes. Various models of medium or heavy-lift boom trucks can safely lift loads from 15 to 70 tons and operating radii can exceed 200 feet. Another advantage of the boom truck is the ability to provide occasional man lift capabilities at a very low cost to height ratio. While it is not uncommon to see a very old boom truck, most replacement cycles seem to trend to seven years. The market for boom trucks has historically been cyclical.
Although the Company offers a complete line of boom trucks from light to heavy capacity cranes much of our efforts have been devoted to the development of higher capacity boom trucks specifically designed to meet the particular needs of customers including those in energy production and power distribution. We believe it is an advantage to be skewed towards the heavier lifting capacity, since the heavier capacity cranes have somewhat higher margins.
Markets that drive demand for boom trucks include power distribution, oil and gas recovery, infrastructure and new home, commercial and industrial construction. Historically, the new home construction market, which uses lower capacity cranes, has probably been the most cyclical. More recently demand from the energy sector has become significantly impacted by changes in oil prices.
The Company sells its boom trucks through a network of over forty full service dealers in the United States, Canada, Mexico, South America, and the Middle East. A number of our dealers maintain a rental fleet of their own. Boom trucks can be rented for either short or long-term periods.
In 2012, the market for boom trucks again showed considerable improvement with total industry unit sales approaching pre-2008 levels. The market dynamics were, however, considerably different than they previously were. Much of the current demand then was being driven by niche market sectors, i.e., oil and gas exploration and power line construction. The demand from the general construction market, although slowly improving, still did not approach pre-2008 levels. For 2012, the Company’s boom truck unit sales increased by approximately 65% as compared to the prior year. The increase in unit sales reflects the Company’s strategic initiatives which have emphasized the development of boom trucks with higher lifting capacities that target the oil and gas and power line distribution markets.
In 2013, the overall market for boom truck was marginally down from the prior year. However, revenues generated from boom truck sales by the Company increased by approximately 30% in 2013. Accordingly, the Company’s market share was also up. The revenue increase was principally attributed to an increase in production capacity. This increase in capacity allowed us to reduce the backlog that existed at December 31, 2012 and to more aggressively promote the sale of our lower tonnage cranes. A significant portion of the December 2012 backlog was for higher tonnage cranes used in niche markets particularly the North American energy sector. During the year, there was a softening in the demand for our products which are related to the energy sector.
In 2014, the Company saw a decline in orders for cranes with higher lifting capacities that serve niche markets, including the North American energy sector slowdown from prior years, largely as a result of the fall in oil prices. However, demand for lower capacity cranes increased, offsetting the decrease in revenues generated from the sale of cranes with higher lifting capacities. The increase in revenues generated from the sale of cranes with lower lifting capacity is reflective of the continued growth of general construction activity in North America. The change in mix did, however, result in lower gross profit percent for 2014.
In 2015, the Company continued to aggressively pursue other markets for its boom trucks including the tree industry, utility industry, and the general construction markets. This focus offset and mitigated the impact of the energy market decline. While oil prices continued to decline and the U.S. oil rig count dropped from 1,600 in January 2015 to just over 500 at end of the year we noted that the energy companies began selling excess equipment into our other markets. This combined impact lower energy market sales combined with the selling off of excess equipment – resulted in a significant decrease in boom truck revenues during the year.
In 2016, we noted that this selloff of excess equipment continued through much of the year. This selloff dampened demand for new equipment in both the energy market and the other markets we serve with our boom trucks. We did note that oil prices did begin to increase and by the beginning of June were approaching $50 per barrel. Additionally, the oil rig count began to increase again and by year end totaled 525 oil rigs. Late in the year, orders received began to increase and included orders for a number of cranes in a multitude of markets that the Company serves.
4
During 2017, Oil prices remained relatively stable through the first nine months of the year, before the prices began to strengthen considerably during the fourth quarter of the year. Oil prices at the end of 2017 topped $61 per barrel. The oil rig count declined during the first half of the year to 431 before rebounding to 658 by the end of 2017. In early 2018, the oil rig count continued to increase and at the end of March 2018 was over 800. The sell-off of used equipment continued through most of the year but the effects diminished throughout the year. The market for boom trucks continued to improve throughout the year but remained below normal levels. Orders, however, increased significantly in the fourth quarter of 2017 and going into 2018 demand for boom trucks continues to increase.
Knuckle Boom Cranes
PM is a leading Italian manufacturer of truck mounted hydraulic knuckle boom cranes with a 50-year history of technology and innovation, and a product range spanning more than 50 models. Its largest subsidiary, Oil & Steel (“O&S”), is a manufacturer of truck-mounted aerial platforms with a diverse product line
PM knuckle boom cranes are hydraulic folding and articulating cranes, mounted on a commercial chassis, with lifting capacities that range from small (lifting capacity up to three ton meter) to super heavy (lifting capacity two hundred and ten ton meter), often supplied with a jib for additional reach. With a compact design and footprint, the crane can be mounted to maximize the load carrying capability of the chassis onto which it is mounted. Combined with the cranes ability to operate in a compact footprint the ability to carry a payload provides a competitive advantage over other truck mounted cranes and makes the knuckle boom crane particularly attractive for a variety of end uses in the construction and product delivery sectors.
The knuckle boom crane market is a global market with a wide variety of end sector applications, but focused particularly on residential and non-residential construction, road and bridge and infrastructure development. Historically the knuckle boom crane has not had significant application in the energy sector. PM knuckle boom cranes are sold into a variety of geographies including West and East Europe, Central Asia, Africa, North and Central America, South America, the Middle East and the Far East and Pacific region. Historically, PM focused on its domestic and local Western European markets, but in recent years has expanded its sales and distribution efforts internationally. PM has twelve international sales and distribution offices located in several European countries as well as the Far East and Latin America. After acquisition by Manitex, the Company expanded its distribution capability with the existing Manitex dealer network in North America as well as expanding the number of independent service centers in the US.
The market for knuckle boom cranes has been growing in recent years as the acceptability of the product has grown and its advantages have been accepted. Growth in North America where the straight mast boom truck crane has been the more dominant product has been more rapid in recent years in combination with the overall improvement in the North American construction sector. PM Group share of the North American market has been historically low, however, this is an area of growth opportunity for the Company following its acquisition by Manitex.
PM aerial platforms are self-propelled or truck mounted and places an operator in a basket in the air in order to perform maintenance, repairs or similar activities. The equipment is used in a variety of applications including utilities, sign work and industrial maintenance and is often sold to rental operations.
PM group product serves in a number of geographies in West and East Europe but also the near and Far East and sells through dealers as well as its own sales and distribution offices. The market generally follows the domestic economic cycle for any particular country. Consequently, the market has shown a positive trend in the recent past as European economies recover from the 2009 / 2010 economic crisis.
As PM severs a global market, its revenues are affected by changes in economic conditions in markets they serve. In 2016, the middle-east market was soft and had an impact on PM 2016 revenues.
In 2017, the demand for knuckle boom cranes was up modestly in all the markets that PM sells into except for the Middle East. The demand from the Middle East market was consistent with the prior year but remains significantly depressed. During 2017, demand from Western and North Europe were PM largest markets. Although there was growth in the other PM markets, the demand from these markets had not returned to earlier levels.
5
Industrial Cranes
Our Badger subsidiary sells specialized industrial cranes through a network of dealers. The Badger product line includes specialized 15 and 30 ton industrial cranes (which can be used by the railroads) as well as a 10 ton carry deck crane which are all sold under both the Badger and Manitex names. Additionally, Badger sells lattice cranes with 20 to 30 ton lifting capacity marketed under the Little Giant trade name. The Little Giant line has five lattice boom models, three of which are dedicated rail cranes. In addition, Badger also sells a 30 ton truck crane and a 25 ton crawler crane under the Little Giant name. Badger also has the capability to manufacture certain of our lower capacity boom trucks and provides expanded boom truck manufacturing capacity when needed.
The products are used by railroads, refineries, states, municipalities, and for general construction. The Company believes it has an advantage over its competitors in selling to railroads as it is the only crane manufacturer that has integrated the installation of rail gear into its production process. Competitors send their cranes to a third party to have rail gear added which both increases cost and delays deliveries.
Our Valla product line of industrial cranes is a full range of precision pick and carry cranes from 2 to 90 tons, using electric, diesel, and hybrid power options. Its cranes offer wheeled or tracked, and fixed or swing boom configurations, with special applications designed specifically to meet the needs of its customers. The product is sold internationally through dealers and into the rental distribution channel.
Mobile Tanks
Manitex Sabre manufactures a comprehensive line of specialized mobile tanks for liquid and solid storage and containment solutions with capacities from 8,000 to 21,000 gallons. Its mobile tanks are sold to specialized independent tank rental companies and through other direct customers.
The tanks have historically been used in variety of end markets such as petrochemical, waste management and oil and gas drilling. However, when we purchased Sabre in 2013, their business heavily skewed towards the energy sector. Since early 2014, we have been working to diversify the products, customers, and applications. This includes expanding environmental applications and using our tanks to store deicer fluid at airports.
Equipment Distribution
Crane and Machinery, Inc. (“C&M”) is a distributor of the Company’s products as well as Terex’s rough terrain and truck cranes.
Crane and Machinery Leasing, Inc.’s (“C&M Leasing”) rents equipment manufactured by the Company as well as a limited amount of equipment manufactured by third parties. Although C&M is a distributor of Terex rough terrain and truck cranes; C&M’s primary business is the distribution of products manufactured by the Company. C&M Leasing’s primary business is the facilitation of sales of products manufactured by the Company through its rent to own program.
Consolidated Variable Interest Entity
Even though it has no ownership interest in SVW Crane & Equipment Company (together with its wholly owned subsidiary, Rental Consulting Service Company, “SVW”), the Company has the power to direct the activities that most significantly impact SVW’s economic performance. Additionally, the Company was the primary beneficiary of the SVW relationship. SVW obtained third party financing, which was effectively guaranteed by the Company, on specific cranes the Company manufactured and remitted the loan proceeds to the Company. Other than its business transactions described herein, SVW had no other substantial business operations. The Company has determined that SVW is a Variable Interest Entity (”VIE”) that under current accounting guidance needs to consolidate in the Company’s financial results.
Part Sales
As part of our operations, we supply repair and replacement parts for our products. The parts business margins are higher than our overall margins. Part sales as a percentage of revenues tend to increase when there is a down-turn in the industry. Part sales as a percentage of revenues are approximately 13%, 13% and 10% for the years ended December 31, 2017, 2016 and 2015, respectively.
6
Total Company Revenues by Sources
The sources of the Company’s revenues are summarized below:
|
|
|
|
|
|
|
|
|
|
|
|
|
|
|
|
|
2017 |
|
|
2016 |
|
|
2015 |
|
|||
|
Boom trucks, knuckle boom & truck cranes |
|
|
76 |
% |
|
|
70 |
% |
|
|
68 |
% |
|
Industrial cranes and forklifts |
|
|
0 |
% |
|
|
3 |
% |
|
|
3 |
% |
|
Rough terrain forklifts |
|
|
1 |
% |
|
|
2 |
% |
|
|
0 |
% |
|
Rough terrain cranes |
|
|
2 |
% |
|
|
1 |
% |
|
|
8 |
% |
|
Mobile tanks |
|
|
2 |
% |
|
|
4 |
% |
|
|
6 |
% |
|
Used construction equipment |
|
|
6 |
% |
|
|
7 |
% |
|
|
5 |
% |
|
Part sales |
|
|
13 |
% |
|
|
13 |
% |
|
|
10 |
% |
|
Total Revenue |
|
|
100 |
% |
|
|
100 |
% |
|
|
100 |
% |
In 2017, one customer, Rush Truck Center, accounted for approximately 12.0% of the Company’s revenue. In 2016 and 2015, no customer accounted for 10% or more of the Company’s revenue.
Raw Materials
The Company purchases a variety of components used in the production of its products. The Company purchases steel and a variety of machined parts, components and subassemblies including weldments, winches, cylinders, frames, rims, axles, wheels, tires, suspensions, cables, booms and cabs, as well as engines, transmissions and cabs. Additionally, Manitex and PM mount their cranes on commercial truck chassis, which are either purchased by the Company or supplied by the customer. Lead times for these materials (including chassis) vary from several weeks to many months. The Company is vulnerable to a supply interruption in instances when only one supplier has been qualified and identifying and qualifying alternative suppliers can be very time consuming, and in some cases, could take longer than a year. The Company has been working on qualifying secondary sources of some products to assure supply consistency and to reduce costs. The degree to which our supply base can respond to changes in market demand directly affects our ability to increase production and the Company attempts to maintain some additional inventory in order to react to unexpected increases in demand. During 2017, 2016 and 2015, raw materials and components were generally available to meet our production schedules and had no significant impact on full year revenues. During the first part of 2014 delivery of chassis for our larger cranes had a modest impact on production, however this was alleviated during the year as manufacturers increased their production and demand also slowed compared to the first half of the year.
Any future supply chain issues that might impact the Company will in part depend on how fast the rate of growth is for a product as well as the rate of growth in the general economy. Strong general economic growth could put us in competition for parts with other industries. Additionally, events or circumstance at a particular supplier could impact the availability of a necessary component.
Patents and Trademarks
The Company protects its trade names and trademarks through registration. Its technology consists of bill of materials, drawings, plans, vendor sources and specifications and although the Company’s technology has considerable value, it does not generally have patent protection. The Company has (on rare occasions) filed for patent protection on a specific feature. In the future, the Company will consider seeking patent protection on any new design features believed to present a significant future benefit.
The Company owns and uses several trademarks relating to its brands that have significant value and are instrumental to the Company’s ability to market its products. The Company’s most significant trademarks are its trademark “Manitex” (presently registered with the United States Patent and Trademark Office until 2027). Badger Equipment Company markets its products under the “Little Giant” and Badger trade names. The Company’s PM Group subsidiary sells its products using the trademark “PM” and PM Group’s O&S subsidiary sells its products using the “OIL & STEEL” trademark. The Manitex, Badger, Little Giant, PM and OIL & STEEL trademarks and trade names are important to the marketing and operation of the Company’s business as a significant number of our products are sold under those names. PM Group’s O&S subsidiary has three patents. One is registered with the Italian Patents and Trademarks Office until 2028. O&S has two additional patents registered with OHIM that are in force until 2031 and 2034, respectively.
7
Seasonality
Traditionally, the Company’s peak selling periods for cranes are the second and third quarters of a calendar year as a result of the need for equipment in the spring, summer and fall construction seasons. A significant portion of cranes sold over the last several years have been deployed in specialized industries or applications, such as oil and gas production, power distribution and in the railroad industry. Sales in these markets are subject to significant fluctuations which correlate more with general economic conditions and the prices of commodities, including oil, and generally are not of a seasonal nature.
Sales of cranes from the Equipment Distribution division mirror the seasonality of the overall Company. However, the sale of parts is much less seasonal given the geographic breadth of the customer base. Crane repairs are performed by the Equipment Distribution division throughout the year but are somewhat affected by the slowdown in construction activity during the typically harsh winters in the Midwestern United States.
Competition
Lifting Equipment
The market for the Company’s boom trucks and knuckle boom cranes, industrial cranes and trailers is highly competitive. The Company competes based on product design, quality of products and services, product performance, maintenance costs and price. Several competitors have greater financial, marketing, manufacturing and distribution resources than we do. The Company believes that it effectively competes with its competitors.
The Company’s boom cranes compete with cranes manufactured by National Crane, Terex, Weldco Beales, Elliott and Altec. The Company’s knuckle boom cranes compete with Palfinger, Fassi, Effer and HIAB. The Company competes primarily with Terex and Broderson in selling rough terrain and industrial cranes. The Company’s mobile tanks compete with tanks sold by Dragon Tank and Pinnacle Mfg., LLC.
The Equipment Distribution division’s primary business is facilitation of sale of products manufactured by the Company. As such, it faces the same competition described above for products manufactured by the Company. Additionally, the Equipment Distribution division has a dealership arrangement with Terex and must compete against dealers of other rough terrain and truck crane manufacturers. Locally, the Equipment Distribution division competes against Runnion Equipment (dealer for National Crane), Power Equipment Leasing (dealer for Elliott) and Guiffre Cranes (dealer for Manitex and Terex boom trucks). Runnion is also authorized to sell Manitex boom trucks.
While no geographic limitations exist regarding the Equipment Distribution business’s ability to sell cranes internationally, the lack of any barriers to entry and the heavy use of the Internet make this a highly active and competitive market in which to distribute cranes.
Competition for our Equipment Distribution repair business is even more intense since it is limited geographically due to the necessity of having physical access to the cranes. Most of the above referenced companies also compete in this aspect of the business, as do other types of crane and equipment dealers from nearby areas such as Indiana or Wisconsin.
Equipment Distribution parts sales are global in scope and benefit greatly from the Internet and the tenure and expertise of our employees. While competition in this area is extensive, the breadth of the products offered and our long history in this part of the business is we believe a competitive advantage.
Our Equipment Distribution business competes based on the design, quality and performance of the products it distributes, price and the supporting repair and part services that it provides. Several competitors have greater financial, marketing and distribution resources than we do. The Company, however, believes that it effectively competes with its competitors.
Backlog
The backlog at December 31, 2017 was approximately $61.5 million, compared to a backlog of approximately $31.3 million at December 31, 2016. The December 31, 2017 backlog has increased by $11.8 million since September 30, 2017 when it was at $50.3 million. The backlog has continued to grow during the early part of 2018 and was $87.3 million at February 28, 2018. The Company expects to ship product to fulfill its existing backlog within the next twelve months.
8
Research and Development
The Company spent $2.6 million, $2.9 million and $3.1 million on company-sponsored research and development activities for 2017, 2016 and 2015, respectively.
Geographic Information
The information regarding revenue, the basis for attributing revenue from external customers to individual countries, and long-lived assets is found in Note 18 “Geographic Information” to our consolidated financial statements, is hereby incorporated by reference into this Part I, Item 1.
Employees
As of December 31, 2017, the Company had 561 full time employees. The Company has not experienced any work stoppages and anticipates continued good employee relations. Eighteen (18) of our employees are covered by collective bargaining agreements. Fourteen (14) of our employees at our Badger subsidiary are represented by International Union, UAW and its local No. 316. The current union contract expires on January 20, 2020. Four employees are currently represented by Automobile Mechanics’ Local 701. The union contract expired on September 30, 2017, but a new contract is pending that will go thru October 1, 2019. The employees represented by the Automobile Mechanics’ Local 701 are mechanics that work in our Equipment Distribution business. A number of our Equipment Distribution customers in the Chicago metropolitan area mandate union mechanics usage for any service / repair jobs.
Governmental Regulation
The Company is subject to various governmental regulations, such as environmental regulations, employment and health regulations, and safety regulations. We have various internal controls and procedures designed to maintain compliance with these regulations. The cost of compliance programs is not material but is subject to additions to or changes in federal, state or local legislation or changes in regulatory implementation or interpretation of government regulations.
Available Information
The Company makes available free of charge our annual report on Form 10-K, quarterly reports on Form 10-Q, current reports on Form 8-K and amendments to those reports filed or furnished as required by Section 13(a) or 15(d) of the Securities Exchange Act of 1934, as amended, through our Internet Website (www.manitexinternational.com) as soon as is reasonably practicable after we electronically file such material with, or furnish it to, the Securities and Exchange Commission. Information contained in or incorporated into our Internet Website is not incorporated by reference herein.
You should carefully consider the following risks, together with the cautionary statement under the caption “Forward-Looking Statements” and the other information included in this report. The risks described below are not the only ones the Company faces. Additional risks that are currently unknown to the Company or that the Company currently considers to be immaterial may also impair its business or adversely affect the Company’s financial condition or results of operations. If any of the following risks actually occur, the Company’s business, financial condition or results of operation could be adversely affected.
Significant deterioration in economic conditions, especially in the United States and Europe, has had and may again have negative effects on the Company’s results of operations and cash flows
Significant deterioration in economic conditions, especially in the United States and Europe, has had and may again have negative effects on the Company’s results of operations and cash flows. Economic conditions affect the Company’s sales volumes, pricing levels and overall profitability. Demand for many of the Company’s products depends on end-use markets. Challenging economic conditions may reduce demand for our products and may also impair the ability of customers to pay for products they have purchased. As a result, the Company’s reserves for doubtful accounts and write-offs for accounts receivable may increase.
A significant deterioration in economic conditions has caused and may again cause deterioration in the credit quality of our customers and the estimated residual value of our equipment. This could further negatively impact the ability of our customers to obtain the resources they need to make purchases of our equipment. Reduced credit availability will diminish our customers’ ability to invest in their businesses, refinance maturing debt obligations, and meet ongoing working capital needs. If customers do not have sufficient access to credit, demand for the Company’s products will likely decline. Reduced access to credit and the capital markets will also negatively affect the Company’s ability to invest in strategic growth initiatives such as acquisitions.
9
Certain of the Company’s products are significantly affected by the level of capital expenditures in the oil and gas industry and lower capital expenditures have affected and may continue to affect the results of the Company’s operations.
The demand for our product in part depends on the condition of the oil and gas industry and, in particular, on the level of capital expenditures of companies engaged in the exploration, development, and production of oil and natural gas. Capital expenditures by these companies are influenced by the following factors:
|
|
• |
the oil and gas industry’s ability to economically justify placing discoveries of oil and gas reserves in production; |
|
|
• |
current and projected oil and gas prices; |
|
|
• |
the oil and gas industry’s need to clear all structures from the lease once the oil and gas reserves have been depleted; |
|
|
• |
weather events, such as major tropical storms; |
|
|
• |
the abilities of oil and gas companies to generate, access and deploy capital; |
|
|
• |
exploration, production and transportation costs; |
|
|
• |
the discovery rate of new oil and gas reserves; |
|
|
• |
the sale and expiration dates of oil and gas leases and concessions; |
|
|
• |
local and international political and economic conditions; |
|
|
• |
the ability or willingness of host country government entities to fund their budgetary commitments; and |
|
|
• |
technological advances. |
Historically, prices of oil and natural gas and exploration, development and production have fluctuated substantially. A sustained period of substantially reduced capital expenditures by oil and gas companies will result in decreased demand for certain equipment produced by the Company, lower margins, and possibly net losses. Additionally, oil and gas companies may sell excess equipment into the general construction market which could further depress demand for certain of products.
The Company’s level of indebtedness reduces financial flexibility and could impede our ability to operate.
As of December 31, 2017, the Company’s total debt was $95.3 million, which includes: revolving term credit facilities, notes payable, convertible debt and capital lease obligations.
Our level of debt affects our operations in several important ways, including the following:
|
|
• |
a significant portion of our cash flow from operations is likely to be dedicated to the payment of the principal and interest on our indebtedness; |
|
|
• |
our ability to obtain additional financing in the future for working capital, capital expenditures or acquisitions may be limited; |
|
|
• |
we may be unable to refinance our indebtedness on terms acceptable to us or at all; |
|
|
• |
our cash flow may be insufficient to meet our required principal and interest payments; and |
|
|
• |
we may be unable to obtain additional loans as a result of covenants and agreements with existing debt holders. |
The Company must comply with restrictive covenants in its outstanding debt agreements.
The Company’s existing debt agreements contain a number of significant covenants which may limit its ability to, among other things, borrow additional money, make capital expenditures, pay dividends, dispose of assets and acquire new businesses. These covenants also require the Company to meet certain financial and non-financial tests. The Company received waivers related to non-compliance with certain covenants and defaults under its U.S. credit facilities and its convertible notes. The Company also restructured certain debt arrangements which restructuring cured the defaults caused by the failed covenant. An additional default or other event of non-compliance, if not waived or otherwise permitted by the Company’s lenders, could result in acceleration of the Company’s debt and possibly bankruptcy.
The Company may require additional funding, which may not be available on favorable terms or at all.
Our future capital requirements will depend on the amount of cash generated or required by our current operations, as well as additional funds which may be needed to finance future acquisitions. Future cash needs are subject to substantial uncertainty.
10
We cannot guarantee that adequate funds will be available when needed, and if we do not receive sufficient capital, we may be required to alter or reduce the scope of our operations or to forego making future acquisitions. If we raise additional funds by issuing equity securities, existing stockholders may be diluted.
The Company’s business is affected by the cyclical nature of its markets.
A substantial portion of our revenues are attributed to limited number of customers which may decrease or cease purchasing any time, since the Company’s products depends upon the general economic conditions of the markets in which the Company competes. The Company’s sales depend in part upon its customers’ replacement or repair cycles. Adverse economic conditions, including a decrease in commodity prices, may cause customers to forego or postpone new purchases in favor of repairing existing machinery. Downward economic cycles may result in reductions in sales of the Company’s products, which may reduce the Company’s profits. The Company has taken a number of steps to reduce its fixed costs and diversify its operations to decrease the negative impact of these cycles. There can be no assurance, however, that these steps will prevent the negative impact of poor economic conditions
The Company’s business is sensitive to increases in interest rates.
The Company is exposed to interest rate volatility with regard to future issuances of fixed rate debt and existing issuances of variable rate debt. Primary exposure includes movements in the U.S. prime rate, LIBOR and Italian short-term borrowing rates.
If interest rates rise, it becomes more costly for the Company’s customers to borrow money to pay for the equipment they buy from the Company. Should the U. S. Federal Reserve Board decide to increase rates, prospects for business investment and manufacturing could deteriorate sufficiently and impact sales opportunities.
The Company’s business is sensitive to government spending.
Many of the Company’s customers depend substantially on government spending, including highway construction and maintenance and other infrastructure projects by U.S. federal and state governments and governments in other nations. Any decrease or delay in government funding of highway construction and maintenance and other infrastructure projects could cause the Company’s revenues and profits to decrease.
The Company’s revenues are attributed to limited number of customers which may decrease or cease purchasing any time.
The Company’s revenues are attributed to a limited number of customers. We generally do not have long-term supply agreements with our customers. Even if a multi-year contract exists, the customer is not required to commit to minimum purchases and can cease purchasing at any time. If we were to lose either a significant customer or several smaller customers our operating results and cash flows would be adversely impacted.
The Company is dependent upon third-party suppliers, making us vulnerable to supply shortages.
The Company obtains materials and manufactured components from third-party suppliers. Any delay in the ability of the Company’s suppliers to provide the Company with necessary materials and components may affect the Company’s capabilities at a number of our manufacturing locations, or may require the Company to seek alternative supply sources. Delays in obtaining supplies may result from a number of factors affecting the Company’s suppliers including capacity constraints, labor disputes, the impaired financial condition of a particular supplier, suppliers’ allocations to other purchasers, weather emergencies or acts of war or terrorism. Any delay in receiving supplies could impair the Company’s ability to deliver products to customers and, accordingly, could have a material adverse effect on business, results of operations and financial condition.
In addition, the Company purchases material and services from suppliers on extended terms based on the Company’s overall credit rating. Negative changes in the Company’s credit rating may impact suppliers’ willingness to extend terms and increase the cash requirements of the business.
Price increases in materials could affect our profitability.
We use large amounts of steel and other items in the manufacture of our products. In the past, market prices of some of our key raw materials increased significantly. If we experience future significant increases in material costs, including steel, we may not be able to reduce product cost in other areas or pass future raw material price increases on to our customers and our margins could be adversely affected.
11
We provide credit guarantees or residual value guarantees for some of our customers.
The Company’s customers, from time to time, may fund acquisitions of our products through third-party finance companies. In certain instances, the Company has in the past provided credit guarantees or residual value guarantees. With these guarantees, we must assess the probability of losses or non-performance in ways similar to the evaluation of accounts receivable. We establish reserves based upon our analysis of the current quality and financial position of our customers, past payment experience and collateral values. In circumstances where we believe it is probable that a specific customer will have difficulty meeting its financial obligations, a specific reserve is recorded to recognize a liability for a guarantee we expect to pay, taking into account any amounts that we would anticipate realizing if we are forced to repossess the equipment that supports the customer’s financial obligations to us. During periods of economic weakness, collateral underlying our guarantees of indebtedness of customers or receivables can decline sharply, thereby increasing our exposure to losses. In the future, we may incur losses in excess of our recorded reserves if the financial condition of our customers were to deteriorate further or the full amount of any anticipated proceeds from the sale of the collateral supporting our customers’ financial obligations is not realized. Historically, no losses related to guarantees have been realized; however, there can be no assurance that our historical experience with respect to guarantees will be indicative of future results.
The Company depends on its information technology systems. If its information technology systems do not perform in a satisfactory manner or if the security of them is breached, it could be disruptive and or adversely affect the operations and results of operations of the Company.
The Company depends on its information technology systems, some of which are managed by third parties, to process, transmit and store electronic information (including sensitive data such as confidential business information and personally identifiable data relating to employees, customers and other business partners), and to manage or support a variety of critical business processes and activities. If our information technology systems do not perform in a satisfactory manner, it could be disruptive and or adversely affect the operations and results of operations of the Company, including the ability of the Company to report accurate and timely financial results.
Furthermore, our information technology systems may be damaged, disrupted or shut down due to attacks by computer hackers, computer viruses, employee error or malfeasance, power outages, hardware failures, telecommunication or utility failures, catastrophes or other unforeseen events, and in any such circumstances our system redundancy and other disaster recovery planning may be ineffective or inadequate. A failure of or breach in information technology security could expose us and our customers, distributors and suppliers to risks of misuse of information or systems, the compromise of confidential information, manipulation and destruction of data, defective products, production downtimes and operations disruptions. In addition, such breaches in security could result in litigation, regulatory action and potential liability, as well as the costs and operational consequences of implementing further data protection measures, each of which could have a material adverse effect on our business or results of operations.
The Company may face limitations on its ability to integrate acquired businesses.
The successful integration of new businesses depends on the Company’s ability to manage these new businesses and cut excess costs. While the Company believes it has successfully integrated these acquisitions to date, the Company cannot ensure that these acquired companies will operate profitably or that the intended beneficial effect from these acquisitions will be realized.
If the Company is unable to manage anticipated growth effectively, the business could be harmed.
If the Company fails to manage growth, the Company’s financial results and business prospects may be harmed. To manage the Company’s growth and to execute its business plan efficiently, the Company will need to institute operational, financial and management controls, as well as reporting systems and procedures. The Company also must effectively expand, train and manage its employee base. The Company cannot assure you that it will be successful in any of these endeavors.
The Company relies on key management.
The Company relies on the management and leadership skills of David Langevin, Chairman and Chief Executive Officer. When Mr. Langevin joined the Company, he signed a three year employment agreement with the Company which expired on December 31, 2008. Mr. Langevin’s employment agreement has been extended and now expires on December 31, 2019. Under the employment agreement, Mr. Langevin’s employment term automatically extends for successive periods of three years unless either the Company or Mr. Langevin gives written notice to the other party of non-renewal at least 90 days prior to the end of the then current employment term. The loss of his services could have a significant and negative impact on the Company’s business. In addition, the Company relies on the management and leadership skills of other senior executives. The Company could be harmed by the loss of key personnel in the future.
12
The Company’s success depends upon the continued protection of its trademarks and the Company may be forced to incur substantial costs to maintain, defend, protect and enforce its intellectual property rights.
The Company’s registered and common law trademarks, as well as certain of the Company’s licensed trademarks, have significant value and are instrumental to the Company’s ability to market its products. The Company’s marks “Manitex” “Badger”, “Sabre”, “Valla”, “PM” and “O&S” are important to the Company’s business as the majority of the Company’s products are sold under those names. The Company has not registered all of its trademarks in the United States nor in the foreign countries where it does business. Third parties could assert claims against such intellectual property that the Company could be unable to successfully resolve. If the Company has to change the names of any of its products, it may experience a loss of goodwill associated with its brand names, customer confusion and a loss of sales.
In addition, international protection of the Company’s intellectual property may not be available in some foreign countries to the same extent permitted by the laws of the United States. The Company could also incur substantial costs to defend legal actions relating to use of its intellectual property, which could have a material adverse effect on the Company’s business, results of operations or financial condition.
The Company may be required to record goodwill impairment charges on all or a significant amount of the goodwill on its Consolidated Balance Sheets.
As of December 31, 2017, the Company had approximately $43.6 million of goodwill. The Company tests goodwill for impairment at least annually. If the carrying value of goodwill exceeds the implied fair value of the goodwill, an impairment charge is recorded for the excess. An impairment of a significant portion of goodwill could materially negatively affect the Company’s results of operations.
The Company may be unable to effectively respond to technological change, which could have a material adverse effect on the Company’s results of operations and business.
The markets served by the Company are not historically characterized by rapidly changing technology. Nevertheless, the Company’s future success will depend in part upon the Company’s ability to enhance its current products and to develop and introduce new products. If the Company fails to anticipate or respond adequately to competitors’ product improvements and new production introductions, future results of operations and financial condition will be negatively affected.
The Company operates in a highly competitive industry and the Company is particularly subject to the risks of such competition.
The Company competes in a highly competitive industry and the competition which the Company encounters has an effect on its product prices, market share, revenues and profitability. Because certain competitors have substantially greater financial, production, research and development resources and substantially greater name recognition than the Company, the Company is particularly subject to the risks inherent in competing with them and may be put at a competitive disadvantage. To compete successfully, the Company’s products must excel in terms of quality, price, product line, ease of use, safety and comfort, and the Company must also provide excellent customer service. The greater financial resources of the Company’s competitors may put it at a competitive disadvantage. If competition in the Company’s industry intensifies or if the Company’s current competitors enhance their products or lower their prices for competing products, the Company may lose sales or be required to lower its prices. This may reduce revenue from the Company’s products and services, lower its gross margins or cause the Company to lose market share. The Company may not be able to differentiate our products from those of competitors, successfully develop or introduce less costly products, offer better performance than competitors or offer purchasers of our products payment and other commercial terms as favorable as those offered by competitors.
The Company faces product liability claims and other liabilities due to the nature of its business.
In the Company’s lines of business numerous suits have been filed alleging damages for accidents that have occurred during the use or operation of the Company’s products. The Company is self-insured, up to certain limits, for these product liability exposures, as well as for certain exposures related to general, workers’ compensation and automobile liability. Insurance coverage is obtained for catastrophic losses as well as those risks required to be insured by law or contract. Any material liabilities not covered by insurance could have an adverse effect on the Company’s financial condition.
13
Our increasingly international operations expose us to additional risks and challenges associated with conducting business internationally.
The international expansion of our business may expose us to risks inherent in conducting foreign operations. These risks include:
|
|
• |
challenges associated with managing geographically diverse operations, which require an effective organizational structure and appropriate business processes, procedures and controls; |
|
|
• |
the increased cost of doing business in foreign jurisdictions, including compliance with international and U.S. laws and regulations that apply to our international operations; |
|
|
• |
currency exchange and interest rate fluctuations and the resulting effect on our revenue and expenses, and the cost and risk of entering into hedging transactions, if we continue to do so in the future; |
|
|
• |
potentially adverse tax consequences; |
|
|
• |
complexities and difficulties in obtaining protection and enforcing our intellectual property; |
|
|
• |
compliance with additional regulations and government authorities in a highly regulated business; and |
|
|
• |
general economic and political conditions internationally. |
The risks that the Company faces in its international operations may continue to intensify if the Company further develops and expands its international operations.
The Company is subject to currency fluctuations.
Changes in exchange rates between various currencies have had, and will continue to have, an impact on our earnings. We regularly evaluate opportunities for, and at times engage in, hedging activities to mitigate the impact that changes in exchange rates for various currencies may have on our financial results. Our hedging activities are designed to reduce and delay, but not to eliminate, the effects of foreign currency fluctuations. Factors that could affect the effectiveness of our hedging activities include volatility of currency markets, and the availability of effective hedging instruments. Since the hedging activities are designed to reduce volatility, they may have the effect of reducing both the negative and positive impacts that changes in exchange rates may have. Our future financial results could be significantly affected by the value of the U.S. dollar versus the native currencies of our subsidiaries (primarily the Euro) as well as the native currencies of foreign subsidiaries and other currencies in which they conduct business. The degree to which our financial results are affected for any given time period will depend in part upon our hedging activities. There can be no assurance that our hedging activities will have the desired beneficial impact on our financial condition or results of operations. Moreover, no hedging activity can completely insulate us from the risks associated with changes in currency exchange rates. We currently have exposure to changes in exchange rates for a number of currencies including the Euro, the Chilean peso and the Argentinean peso.
Risks Relating to our Common Stock
The Company’s principal shareholders, executive officers and directors hold a significant percentage of the Company’s common stock, and these shareholders may take actions that may be adverse to your interests.
The Company’s principal shareholders, executive officers and directors beneficially own, in the aggregate, approximately 19% of the Company’s common stock as of March 20, 2018. As a result, these shareholders, acting together, will be able to significantly influence all matters requiring shareholder approval, including the election and removal of directors and approval of significant corporate transactions such as mergers, consolidations, sales and purchases of assets. They also could dictate the management of the Company’s business and affairs. This concentration of ownership could have the effect of delaying, deferring or preventing a change in control or impeding a merger or consolidation, takeover or other business combination, which could cause the market price of our common stock to fall or prevent you from receiving a premium in such a transaction.
The cost of compliance with Section 404 of the Sarbanes-Oxley Act of 2002 may negatively impact the Company’s income.
The Company is subject to the rules and regulations of the SEC, including those rules and regulations mandated by the Sarbanes-Oxley Act of 2002. Section 404 of the Sarbanes-Oxley Act requires all reporting companies to include in their annual report a statement of management’s responsibilities for establishing and maintaining adequate internal control over financial reporting, together with an assessment of the effectiveness of those internal controls. Section 404 further requires that the reporting company’s independent auditors attest to, and report on, this management assessment. The Company expects its expenses related to its internal and external auditors to be significant. If we fail to maintain a system of adequate controls, it could have an adverse effect on our business and stock price.
14
The price of our common stock is highly volatile.
The trading price of the Company’s common stock is highly volatile and could be subject to wide fluctuations in price in response to various factors, many of which are beyond the Company’s control, including:
|
|
• |
the degree to which the Company successfully implements its business strategy; |
|
|
• |
actual or anticipated variations in quarterly or annual operating results; |
|
|
• |
changes in recommendations by the investment community or in their estimates of the Company’s revenues or operating results; |
|
|
• |
failure to meet expectations of industry analysts; |
|
|
• |
speculation in the press or investment community; |
|
|
• |
strategic actions by the Company’s competitors; |
|
|
• |
announcements of technological innovations or new products by the Company or competitors; |
|
|
• |
changes in business conditions affecting the Company and its customers; and |
|
|
• |
potential to be delisted |
In the past, following periods of volatility in the market price of a company’s securities, class action litigation has often been brought against companies. If a securities class action suit is filed against us, whether or not meritorious, we would incur substantial legal fees and our management’s attention and resources would be diverted from operating our business in order to respond to the litigation.
Provisions of the Michigan Business Corporation Act and the Company’s Articles of Incorporation, Amended and Restated Bylaws, and Rights Agreement may discourage or prevent a takeover of the Company.
Provisions of the Company’s Articles of Incorporation and Amended and Restated Bylaws, Michigan law, and the Rights Agreement, dated October 17, 2008, between the Company and Broadridge Corporate Issuer Solution, Inc., as rights agent, could make it more difficult for a third party to acquire the Company, even if doing so would be perceived to be beneficial to you. These provisions could discourage potential takeover attempts and could adversely affect the market price of the Company’s shares. Because of these provisions, you might not be able to receive a premium on your investment. These provisions:
|
|
• |
authorize the Company’s Board of Directors, with approval by a majority of its independent Directors but without requiring shareholder consent, to issue shares of “blank check” preferred stock that could be issued by the Company’s Board of Directors to increase the number of outstanding shares and prevent a takeover attempt; |
|
|
• |
limit our shareholders’ ability to call a special meeting of the Company’s shareholders; |
|
|
• |
limit the Company’s shareholders’ ability to amend, alter or repeal the Company bylaws; |
|
|
• |
may result in the issuance of preferred stock, which would significantly dilute the stock ownership percentage of certain shareholders and make it more difficult for a third party to acquire a majority of the Company’s outstanding voting stock; and |
|
|
• |
restrict business combinations with certain shareholders. |
The provisions described above could prevent, delay or defer a change in control of the Company or its management.
15
The restatement of our previously issued financial statements has been time-consuming and expensive and could expose us to additional risks that could have a negative effect on our Company.
We have restated our previously issued audited financial statements for the year ended December 31, 2016 as well as the unaudited quarterly financial information included in our Annual Report on Form 10-K for the year ended December 31, 2016, the unaudited financial statements for the quarter ended March 31, 2017 included in our Quarterly Report on Form 10-Q for the quarter ended March 31, 2017, and the unaudited financial statements for the six-month period ended June 30, 2017 included in our Quarterly Report on Form 10-Q for the quarter ended June 30, 2017. In addition, our Quarterly Report on Form 10-Q for the quarter ended September 30, 2017 and our Annual Report on Form 10-K for the year ended December 31, 2017 were not filed in a timely manner. The restatement process has been time consuming and expensive and, along with the failure to make certain filings with the SEC in a timely manner, could expose us to additional risks that could have a negative effect on our Company. In particular, we have incurred substantial unanticipated expenses and costs, including audit, legal and other professional fees, in connection with the restatement of our previously issued financial statements and the ongoing remediation of material weaknesses in our internal control over financial reporting. Certain remediation actions have been recommended and we are in the process of implementing them (see Item 9A "Controls and Procedures" of this Form 10-K for a description of these remediation measures). To the extent these steps are not successful, we could be forced to incur additional time and expense. Our management’s attention has also been diverted from the operation of our business in connection with the restatement and these ongoing remediation efforts. In addition, as a result of these restatements and failure to timely make certain filings with the SEC, we could be subject to governmental, regulatory or other actions. Any such proceedings could, regardless of the outcome, consume a significant amount of management’s time and attention and could result in additional legal, accounting and other costs and liabilities.
None
The Company’s executive offices are located at 9725 Industrial Drive, Bridgeview, Illinois 60455. The Company has seven principal operating plants. The Company’s Lifting Equipment business operates from the facilities described in this paragraph. The Company builds boom trucks, and sign cranes in its 188,000 sq. ft. leased facility located in Georgetown, Texas. The Company manufactures its knuckle boom cranes, in two owned facilities, the 542,000 sq. ft. plant located in S. Cesario sul Panaro, Italy and the 213,000 sq. ft. facility located in Arad, Romania. The Romania facility also produces sub-assemblies that are incorporated into PM products manufactured in Italy. The Company manufactures its precision pick and carry cranes in a 58,000 sq. ft. facility located in Piacenza, Italy. The Company builds specialized rough terrain cranes and material handling product in its 170,000 sq. ft. owned facility located in Winona, Minnesota. The Company builds its specialized mobile tanks for liquid and solid storage and containment solutions in its 100,000 sq. ft. leased facility located in Knox, Indiana.
The Company operates its crane distribution business from a 39,000 sq. ft. leased facility located in Bridgeview, Illinois. The Bridgeview facility also houses our corporate offices.
All our facilities are used exclusively by the Company. The Company believes that its facilities are suitable for its business and will be adequate to meet our current needs.
The Company is involved in various legal proceedings, including product liability and workers’ compensation matters which have arisen in the normal course of operations. The Company has product liability insurance with self-insurance retention that ranges from $50 thousand to $0.5 million. The Company has a $250 thousand per claim deductible on worker compensation claims and aggregates of $1.0 million to $1.9 million depending on the policy year. Certain cases are at a preliminary stage and it is not possible to estimate the amount or timing of any cost to the Company. However, the Company does not believe that these contingencies, in the aggregate, will have a material adverse effect on the Company. Reserves have been established for several liability cases related to PM acquisitions. When it is probable that a loss has been incurred and possible to make a reasonable estimate of the Company’s liability with respect to such matters, a provision is recorded for the amount of such estimate or the minimum amount of a range of estimates when it is not possible to estimate the amount within the range that is most likely to occur.
Not applicable
16
|
ITEM 5. |
MARKET FOR REGISTRANT’S COMMON EQUITY, RELATED STOCKHOLDER MATTERS AND ISSUER PURCHASES OF EQUITY SECURITIES |
Market for the Company’s Common Stock
The Company’s common stock is listed on The NASDAQ Capital Market trading under the symbol MNTX. The following table sets forth the high and low sales prices of the common stock for the fiscal periods indicated, as reported on The NASDAQ Capital Market.
Price Range of Common Stock
|
2017 |
|
High |
|
|
Low |
|
||
|
First Quarter |
|
$ |
9.89 |
|
|
$ |
6.38 |
|
|
Second Quarter |
|
$ |
7.84 |
|
|
$ |
6.21 |
|
|
Third Quarter |
|
$ |
9.49 |
|
|
$ |
6.75 |
|
|
Fourth Quarter |
|
$ |
10.00 |
|
|
$ |
7.28 |
|
|
|
|
|
|
|
|
|
|
|
|
2016 |
|
High |
|
|
Low |
|
||
|
First Quarter |
|
$ |
6.30 |
|
|
$ |
4.25 |
|
|
Second Quarter |
|
$ |
7.23 |
|
|
$ |
5.18 |
|
|
Third Quarter |
|
$ |
7.68 |
|
|
$ |
4.98 |
|
|
Fourth Quarter |
|
$ |
7.62 |
|
|
$ |
4.98 |
|
Number of Common Stockholders
As of March 19, 2018, there were 176 record holders of the Company’s common stock.
Dividends
During the fiscal years ended December 31, 2017, 2016 and 2015, the Company did not declare or pay any cash dividends on its common stock and the Company does not intend to pay any cash dividends in the foreseeable future. Furthermore, the terms of our credit facility do not allow us to declare or pay dividends without the prior written consent of the lender.
Performance Graph
The following stock performance graph is intended to show our stock performance compared with that of comparable companies. The stock performance graph shows the change in market value of ten thousand dollars invested in our Common Stock, the Russell 2000 Index and a peer group of comparable companies (“Peer Group”) for the five year period commencing December 31, 2012 through December 31, 2017. The cumulative total stockholder return of the peer group and Russell 2000 Index assumes dividends are reinvested. The stockholder return shown on the graph below is not indicative of future performance. The companies in the Peer Group are weighted by market capitalization.
The Peer Group consists of the following companies, which are in similar lines of business to Manitex International Inc. Lindsay Corporation (LNN), Gencor Industries Inc. (GENC), Astec Industries, Inc. (ASTE), Columbus McKinnon Corporation (CMCO) and Alamo Group, Inc. (ALG). The companies in the Peer Group generally have market capitalizations that are significantly greater than the Company’s market capitalization. It was necessary to select companies with higher market capitalizations to find companies with similar lines of business. Our competitors are most often either small privately owned companies with a narrow product line or a segment of a very large company. In selecting our Peer Group, we intentionally excluded the companies that had the largest market capitalization even when their product lines were similar to ours.
17
CUMULATIVE TOTAL RETURN
Based upon an initial investment of $10,000 on December 31, 2012
with dividends reinvested
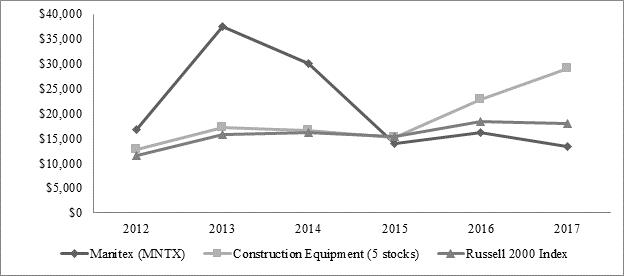
|
|
|
December 31, |
|
|
December 31, |
|
|
December 31, |
|
|
December 31, |
|
|
December 31, |
|
|
December 31, |
|
||||||
|
|
|
2012 |
|
|
2013 |
|
|
2014 |
|
|
2015 |
|
|
2016 |
|
|
2017 |
|
||||||
|
Manitex International, Inc. |
|
$ |
10,000 |
|
|
$ |
22,241 |
|
|
$ |
17,801 |
|
|
$ |
8,333 |
|
|
$ |
9,608 |
|
|
$ |
13,445 |
|
|
Russell 2000 Index |
|
$ |
10,000 |
|
|
$ |
13,700 |
|
|
$ |
14,184 |
|
|
$ |
13,374 |
|
|
$ |
15,978 |
|
|
$ |
18,079 |
|
|
Construction Equipment (5 stocks) |
|
$ |
10,000 |
|
|
$ |
17,162 |
|
|
$ |
16,564 |
|
|
$ |
15,211 |
|
|
$ |
22,911 |
|
|
$ |
29,012 |
|
Issuer Purchases of Equity Securities
The following table provides information about the Company’s purchases of equity securities during the quarter ended December 31, 2017:
|
Period |
|
Total number of shares purchased (1) |
|
|
Average price paid per share |
|
|
Total number of shares purchased as part of publicly announced plans or programs |
|
|
Maximum number or approximate dollar value of shares that may yet be purchased under the plans or programs |
|
||||
|
October 1 through October 31, 2017 |
|
|
— |
|
|
|
— |
|
|
|
— |
|
|
|
— |
|
|
November 1 through November 30, 2017 |
|
|
— |
|
|
|
— |
|
|
|
— |
|
|
|
— |
|
|
December 1 through December 31, 2017 |
|
|
4,758 |
|
|
$ |
9.60 |
|
|
|
— |
|
|
|
— |
|
|
Total |
|
|
4,758 |
|
|
$ |
9.60 |
|
|
|
— |
|
|
|
— |
|
|
(1) |
The Company purchased and cancelled 4,758 shares of its common stock on December 31, 2017. The shares were purchased from employees on December 31, 2017 at the market closing price of $9.60 on that date. The employees used the proceeds from the sale of shares to satisfy their withholding tax obligations that arose when restricted shares vested on that date. |
18
The following selected financial data should be read in conjunction with our financial statements and the related notes thereto and “Management’s Discussion and Analysis of Financial Condition and Results of Operations” included elsewhere in this report.
The Company’s results include the results for companies acquired from their respective effective dates of acquisition: August 19, 2013 for Sabre, November 30, 2013 for Valla, December 16, 2014 for Lift Ventures, December 20, 2014 for ASV, January 15, 2015 for the PM Group and March 12, 2015 for Columbia Tanks.
The below financial data reflects the following entities as discontinued operations from 2013 through the year in which the entity was disposed: 2015 for Manitex Load King, Inc. and 2016 for Liftking, and CVS. In addition, the data for the years 2014 to 2017 presents ASV as a discontinued operation.
(In thousands except share information)
|
|
|
|
|
|
|
|
|
|
|
|
|
|
|
|
|
|
|
|
|
|
|
|
|
2017 |
|
|
2016 |
|
|
2015 |
|
|
2014 |
|
|
2013 |
|
|||||
|
Summary of Operations: |
|
|
|
|
|
|
|
|
|
|
|
|
|
|
|
|
|
|
|
|
|
Net revenues |
|
$ |
213,112 |
|
|
$ |
173,197 |
|
|
$ |
202,747 |
|
|
$ |
174,738 |
|
|
$ |
164,678 |
|
|
Operating (loss) income |
|
|
(265 |
) |
|
|
(9,974 |
) |
|
|
(288 |
) |
|
|
13,058 |
|
|
|
18,142 |
|
|
Net (loss) income from continuing operations |
|
|
(7,067 |
) |
|
|
(23,189 |
) |
|
|
(5,325 |
) |
|
|
7,261 |
|
|
|
11,489 |
|
|
Net (loss) income from continuing operations attributable to shareholders of Manitex International, Inc. |
|
$ |
(7,067 |
) |
|
$ |
(23,189 |
) |
|
$ |
(5,325 |
) |
|
$ |
7,261 |
|
|
$ |
11,489 |
|
|
Earnings (loss) per share from continuing operations attributable to shareholders of Manitex International, Inc. |
|
|
|
|
|
|
|
|
|
|
|
|
|
|
|
|
|
|
|
|
|
Basic |
|
$ |
(0.43 |
) |
|
$ |
(1.44 |
) |
|
$ |
(0.33 |
) |
|
$ |
0.52 |
|
|
$ |
0.91 |
|
|
Diluted |
|
$ |
(0.43 |
) |
|
$ |
(1.44 |
) |
|
$ |
(0.33 |
) |
|
$ |
0.52 |
|
|
$ |
0.90 |
|
|
Shares used to calculate earnings per share: |
|
|
|
|
|
|
|
|
|
|
|
|
|
|
|
|
|
|
|
|
|
Basic |
|
|
16,548,444 |
|
|
|
16,133,284 |
|
|
|
15,970,074 |
|
|
|
13,858,189 |
|
|
|
12,671,205 |
|
|
Diluted |
|
|
16,548,444 |
|
|
|
16,133,284 |
|
|
|
15,970,074 |
|
|
|
13,904,289 |
|
|
|
12,717,575 |
|
|
|
|
|
|
|
|
|
|
|
|
|
|
|
|
|
|
|
|
|
|
|
|
Total assets |
|
$ |
225,188 |
|
|
$ |
326,954 |
|
|
$ |
401,423 |
|
|
$ |
314,267 |
|
|
$ |
180,497 |
|
|
Total debt for continuing operations |
|
$ |
95,253 |
|
|
$ |
106,295 |
|
|
$ |
109,437 |
|
|
$ |
46,389 |
|
|
$ |
36,743 |
|
|
Total shareholders equity attributed to shareholders of Manitex International, Inc. |
|
$ |
70,845 |
|
|
$ |
72,465 |
|
|
$ |
107,012 |
|
|
$ |
120,391 |
|
|
$ |
76,632 |
|
19
The following management’s discussion and analysis of financial condition and results of continuing operations should be read in conjunction with the Company’s financial statements and notes, and other information included elsewhere in this Report.
FORWARD-LOOKING STATEMENTS
When reading this section of this Annual Report on Form 10-K, it is important that you also read the financial statements and related notes thereto. This Annual Report on Form 10-K and certain information incorporated herein by reference contain forward-looking statements within the “safe harbor” provisions of the Private Securities Litigation Reform Act of 1995. All statements contained in this Annual Report on Form 10-K, other than statements that are purely historical, are forward-looking statements and are based upon management’s present expectations, objectives, anticipations, plans, hopes, beliefs, intentions or strategies regarding the future. We use words such as “anticipate,” “estimate,” “plan,” “project,” “continuing,” “ongoing,” “expect,” “believe,” “intend,” “may,” “will,” “should,” “could,” and similar expressions to identify forward-looking statements. Forward-looking statements in this Annual Report on Form 10-K include, without limitation: projections of revenue, earnings, capital structure and other financial items, statements of our plans and objectives, statements regarding the capabilities and capacities of our business operations, statements of expected future economic conditions and the effect on us and on our customers, expected benefits of our cost reduction measures, and assumptions underlying statements regarding us or our business. Our actual results may differ from information contained in these forward looking-statements for many reasons, including those described below and in the section entitled “Item 1A. Risk Factors”:
|
(1) |
a future substantial deterioration in economic conditions, especially in the United States and Europe; |
|
(2) |
government spending; fluctuations in the construction industry, and capital expenditures in the oil and gas industry; |
|
(3) |
our level of indebtedness and our ability to meet financial covenants required by our debt agreements; |
|
(4) |
our ability to negotiate extensions of our credit agreements and to obtain additional debt or equity financing when needed; |
|
(5) |
the cyclical nature of the markets we operate in; |
|
(6) |
increase in interest rates; |
|
(7) |
Our increasingly international operations expose us to additional risks and challenges associated with conducting business internationally; |
|
(8) |
difficulties in implementing new systems, integrating acquired businesses, managing anticipated growth, and responding to technological change; |
|
(9) |
our customers’ diminished liquidity and credit availability; |
|
(10) |
the performance of our competitors; |
|
(11) |
shortages in supplies and raw materials or the increase in costs of materials; |
|
(12) |
potential losses under residual value guarantees, |
|
(13) |
product liability claims, intellectual property claims, and other liabilities; |
|
(14) |
the volatility of our stock price; |
|
(15) |
future sales of our common stock; |
|
(16) |
the willingness of our stockholders and directors to approve mergers, acquisitions, and other business transactions; |
|
(17) |
currency transaction (foreign exchange) risks and the risk related to forward currency contracts; |
|
(18) |
certain provisions of the Michigan Business Corporation Act and the Company’s Articles of Incorporation, as amended, Amended and Restated Bylaws, and the Company’s Preferred Stock Purchase Rights may discourage or prevent a change in control of the Company; |
|
(19) |
a substantial portion of our revenues are attributed to limited number of customers which may decrease or cease purchasing any time; |
|
(20) |
a disruption or breach in our information technology systems; |
|
(21) |
our reliance on the management and leadership skills of our senior executives; |
|
(22) |
the cost of compliance with Section 404 of the Sarbanes-Oxley Act of 2002; and |
|
(23) |
Impairment in the carrying value of goodwill could negatively affect our operating results; and |
|
(24) |
other factors. |
20
The risks described in this Annual Report on Form 10-K are not the only risks facing our Company. Additional risks and uncertainties not currently known to us or that we currently deem to be immaterial also may materially adversely affect our business, financial condition or operating results. We do not undertake, and expressly disclaim, any obligation to update this forward-looking information, except as required under applicable law.
OVERVIEW
The Company is a leading provider of engineered lifting solutions. The Company operates in a single business segment. The Company designs, manufactures and distributes a diverse group of products that serve different functions and are used in a variety of industries.
Through its Manitex, Inc. subsidiary, it markets a comprehensive line of boom trucks, truck cranes and sign cranes. Manitex’s boom trucks and crane products are primarily used for industrial projects, energy exploration and infrastructure development, including, roads, bridges and commercial construction.
Badger Equipment Company (“Badger”) is a manufacturer of specialized rough terrain cranes and material handling products. Badger primarily serves the needs of the construction, municipality and railroad industries.
PM Group S.p.A. (“PM”) is a leading Italian manufacturer of truck mounted hydraulic knuckle boom cranes with a 50-year history of technology and innovation, and a product range spanning more than 50 models. Its largest subsidiary, Oil & Steel (“O&S”), is a manufacturer of truck-mounted aerial platforms with a diverse product line and an international client base.
Our Valla product line of industrial cranes is a full range of precision pick and carry cranes using electric, diesel, and hybrid power options. Its cranes offer wheeled or tracked, and fixed or swing boom configurations, with special applications designed specifically to meet the needs of its customers. These products are sold internationally through dealers and into the rental distribution channel.
Sabre Manufacturing, LLC, which is located in Knox, Indiana, manufactures a comprehensive line of specialized mobile tanks for liquid and solid storage and containment solutions with capacities from 8,000 to 21,000 gallons. Its mobile tanks are sold to specialized independent tank rental companies and through the Company’s existing dealer network. The tanks are used in a variety of end markets such as petrochemical, waste management and oil and gas drilling.
Crane and Machinery, Inc. (“C&M”) is a distributor of the Company’s products as well as Terex’s rough terrain and truck cranes. Crane and Machinery Leasing, Inc.’s (“C&M Leasing”) rents equipment manufactured by the Company as well limited amount of equipment manufactured by third parties. Although C&M is a distributor of Terex rough terrain and truck cranes, C&M’s primary business is the distribution of products manufactured by the Company. C&M Leasing’s primary business is the facilitation of sales of products manufactured by the Company through its rent to own program. As C&M and C&M Leasing’s primary business is the facilitation of Company manufactured product sales, discrete financial information is not available.
Consolidated Variable Interest Entity
Even though it has no ownership interest in SVW Crane & Equipment Company (together with its wholly owned subsidiary, Rental Consulting Service Company, “SVW”), the Company has the power to direct the activities that most significantly impact SVW’s economic performance. Additionally, the Company was the primary beneficiary of the SVW relationship. SVW obtained third party financing, which was effectively guaranteed by the Company, on specific cranes the Company manufactured and remitted the loan proceeds to the Company. Other than its business transactions described herein, SVW had no other substantial business operations. The Company has determined that SVW is a Variable Interest Entity (”VIE”) that under current accounting guidance needs to be consolidated in the Company’s financial results.
Income and losses related to VIE’s are typically shown in a company’s financial statements as being attributed to a non-controlling interest. Other than its transactions between SVW and the Company, SVW had no other substantial business operations. Furthermore, the Company exercised control and absorbed all losses and received all the income from SVW operations. Therefore, the Company has concluded that income and losses related to the VIE are attributable to the Shareholders of the Company.
Economic Conditions
In 2015, the Company continued to aggressively pursue other markets for its boom trucks including the tree industry, utility industry, and the general construction markets. This focus offset and mitigated the impact of the energy market decline. While oil prices continued to decline and the U.S. oil rig count dropped from 1,600 in January 2015 to just over 500 at end of the year we noted that the energy companies began selling excess equipment into our other markets. This combined impact lower energy market sales combined with the selling off of excess equipment – resulted in a significant decrease in boom truck revenues during the year.
21
In 2016, we noted that this selloff of excess equipment continued through much of the year. This selloff dampened demand for new equipment in both the energy market and the other markets we serve with our boom trucks. We did note that oil prices did begin to increase and by the beginning of June were approaching $50 per barrel. Additionally, the oil rig count began to increase again and by year end totaled 525 oil rigs. Late in the year, orders received began to increase and included orders for a number of cranes in a multitude of markets that the Company serves. The Company continues to aggressively pursue multiple markets including the tree, utility, general construction and, energy markets.
During 2017, Oil prices remained relatively stable through the first nine months of the year, before the prices began to strengthen considerably during the fourth quarter of the year. Oil prices at the end of 2017 topped $61 per barrel. The oil rig count declined during the first half of the year to 431 before rebounding to 658 by the end of 2017. In early 2018, the oil rig count continued to increase and at the end of March 2018 increased to over 800. The sell-off of used equipment continued through most of the year but the effects diminished throughout the year. The market for boom trucks continued to improve throughout the year but remained below normal levels. Orders, however, increased significantly in the fourth quarter of 2017 and going into 2018 demand for boom trucks continues to increase.
The market for PM knuckle boom cranes have not been significantly affected by decrease in oil prices. The markets for these products have been more stable. The North American market for knuckle boom cranes is growing. PM currently has a small share of the market for knuckle boom cranes in North America. The Company has started to manufacture knuckle boom cranes on a limited basis in the United States and is marketing them through the Company’s current distribution channels. The Company currently has a strong presence in North America for its boom trucks. The Company believes that it can significantly increase the Company’s share for knuckle boom cranes in North America. The Company believes this is an immediate opportunity that will continue to grow over time.
In 2017, the demand for knuckle boom cranes was up modestly in all the markets that PM sells into except for the Middle East. The demand from the Middle East market was consistent with the prior year but remains significantly depressed. During 2017, demand from Western and North Europe, were PM largest markets. Although there was growth in the other PM markets, the demand from these markets have not returned to levels achieved in the past.
Factors Affecting Revenues and Gross Profit
The Company derives most of its revenue from purchase orders from dealers and distributors. The demand for the Company’s products depends upon the general economic conditions of the markets in which the Company competes. The Company’s sales depend in part upon its customers’ replacement or repair cycles. Adverse economic conditions, including a decrease in commodity prices, may cause customers to forego or postpone new purchases in favor of repairing existing machinery.
Gross profit varies from period to period. Factors that affect gross profit include product mix, production levels and cost of raw materials. Margins tend to increase when production is skewed towards larger capacity cranes.
The following table sets forth certain financial data for the three years ended December 31, 2017, 2016 and 2015:
22
Results of Consolidated Operations
MANITEX INTERNATIONAL, INC.
(In thousands, except share data)
|
|
|
For the Year Ended |
|
|
For the Year Ended |
|
|
For the Year Ended |
|
|||
|
|
|
December 31, |
|
|
December 31, |
|
|
December 31, |
|
|||
|
|
|
2017 |
|
|
2016 |
|
|
2015 |
|
|||
|
Net revenues |
|
$ |
213,112 |
|
|
$ |
173,197 |
|
|
$ |
202,747 |
|
|
Cost of sales |
|
|
176,266 |
|
|
|
143,260 |
|
|
|
160,752 |
|
|
Gross profit |
|
|
36,846 |
|
|
|
29,937 |
|
|
|
41,995 |
|
|
Operating expenses |
|
|
|
|
|
|
|
|
|
|
|
|
|
Research and development costs |
|
|
2,564 |
|
|
|
2,939 |
|
|
|
3,123 |
|
|
Selling, general and administrative expenses |
|
|
34,547 |
|
|
|
36,972 |
|
|
|
39,160 |
|
|
Total operating expenses |
|
|
37,111 |
|
|
|
39,911 |
|
|
|
42,283 |
|
|
Operating loss |
|
|
(265 |
) |
|
|
(9,974 |
) |
|
|
(288 |
) |
|
Other income (expense) |
|
|
|
|
|
|
|
|
|
|
|
|
|
Interest expense |
|
|
(6,498 |
) |
|
|
(6,390 |
) |
|
|
(6,441 |
) |
|
Interest expense related to write off of debt issuance costs |
|
|
— |
|
|
|
(1,439 |
) |
|
|
— |
|
|
Foreign currency transaction (loss) gain |
|
|
(1,149 |
) |
|
|
(1,115 |
) |
|
|
(293 |
) |
|
Other income (loss) |
|
|
367 |
|
|
|
915 |
|
|
|
(47 |
) |
|
Total other expense |
|
|
(7,280 |
) |
|
|
(8,029 |
) |
|
|
(6,781 |
) |
|
Loss before income taxes and loss in non-marketable equity interest from continuing operations |
|
|
(7,545 |
) |
|
|
(18,003 |
) |
|
|
(7,069 |
) |
|
Income tax expense (benefit) from continuing operations |
|
|
(118 |
) |
|
|
(566 |
) |
|
|
(1,943 |
) |
|
Income (loss) in non-marketable equity interest, net of taxes |
|
|
360 |
|
|
|
(5,752 |
) |
|
|
(199 |
) |
|
Loss from continuing operations |
|
|
(7,067 |
) |
|
|
(23,189 |
) |
|
|
(5,325 |
) |
|
Discontinued operations: |
|
|
|
|
|
|
|
|
|
|
|
|
|
(Loss) income from discontinued operations, net of income tax (benefit) expense of ($23), $37, and $475 in 2017, 2016 and 2015, respectively |
|
|
(737 |
) |
|
|
(14,478 |
) |
|
|
1 |
|
|
Net loss |
|
$ |
(7,804 |
) |
|
$ |
(37,667 |
) |
|
$ |
(5,324 |
) |
|
(Loss) income attributable to noncontrolling interest |
|
|
(274 |
) |
|
|
574 |
|
|
|
(48 |
) |
|
Loss attributable to shareholders of Manitex International, Inc. |
|
$ |
(8,078 |
) |
|
$ |
(37,093 |
) |
|
$ |
(5,372 |
) |
The above results include the results for companies acquired from their respective effective dates of acquisition: December 16, 2014 for Lift Ventures, December 20, 2014 for ASV, January15, 2015 for PM Group and March 12, 2015 for Columbia Tanks.
Year Ended December 31, 2017 from Continuing Operations Compared to Year Ended December 31, 2016 from Continuing Operations
Net loss from continuing operations
For the year ended December 31, 2017, net loss was $7.1 million, which consists of revenue of $213.1 million, cost of sales of $176.3 million, research and development costs of $2.6 million, SG&A costs of $34.5 million, interest expense of $6.5 million, foreign currency transaction loss of $1.1 million, other income of $0.4 million, income in non-marketable equity interest of $0.4 million and income tax benefit of $0.1 million.
For the year ended December 31, 2016, net loss was $23.2 million, which consists of revenue of $173.2 million, cost of sales of $143.3 million, research and development costs of $2.9 million, SG&A costs of $37.0 million, interest expense of $7.8 million (including debt issuance costs of $1.4 million), foreign currency transaction loss of $1.1 million, other income of $0.9 million, loss in non-marketable equity interest of $5.8 million and income tax benefit of $0.6 million.
23
Net revenue and gross profit —For the year ended December 31, 2017, net revenue and gross profit were $213.1 million and $36.8 million, respectively. Gross profit as a percent of sales was 17.3% for the year ended December 31, 2017. For the year ended December 31, 2016, net revenue and gross profit were $173.2 million and $29.9 million, respectively. Gross profit as a percent of sales was 17.3% for the year ended December 31, 2016.
For 2017 revenues increased $39.9 million or 23.0% from $173.2 million for 2016 to $213.1 million for 2017. The increase is primarily due to an increase in straight mast cranes revenues. The increase is due to an improvement in market conditions addressed above under the heading “Economic Conditions”. The revenues for the year ended December 31, 2017 were also favorably impacted by a stronger Euro, which accounted for approximately $1.0 million of the increase in revenue.
Gross profit as a percent of net revenues was 17.3% for the year ended December 31, 2017, which is equal to the gross profit for the year ended December 31, 2016 year. The gross margin percent for the year ended December 31, 2017 was affected by $1.7 million in inventory reserve adjustments in the third and fourth quarters of 2017.
Research and development —Research and development for the year ended December 31, 2017 was $2.6 million compared to $2.9 million for the comparable period in 2016. Research and development expenditures were relatively consistent with the prior period. The Company’s research and development spending continues to reflect our commitment to develop and introduce new products that give the Company a competitive advantage.
Selling, general and administrative expense —Selling, general and administrative expense for the year ended December 31, 2017 was $34.5 million compared to $37.0 million for the comparable period in 2016, a decrease of $2.4 million. The three months ended March 31, 2017 included expenses of $0.5 million incurred in connection with our participation at the 2017 Con Expo trade show. The Con Expo show, which is held every three years, was held in Las Vegas in March of this year. This show is an international gathering place for the construction industries. It is estimated that 130,000 professionals from around the world attended the show.
Selling, general and administrative expenses decreased $2.9 million when Con Expo expenses are excluded. The decrease is primarily related to the Company’s continued cost cutting programs.
Operating loss —The Company had an operating loss of $0.3 million for the year ended December 31, 2017 compared to an operating loss of $10.0 million in the prior year. Operating income increased due to changes in revenue, cost of sales and operating expenses explained above.
Interest expense —Interest expense was $6.5 million and $7.8 million for the years ended December 31, 2017 and 2016, respectively. A non-recurring expense in 2016 of $1.4 million accounts for the majority of the decrease. The non-recurring charge was the result of expensing deferred financing costs when debt was refinanced.
As the majority of the Company’s debt is variable interest rate debt, the modest increases in market interest rates including LIBOR and the U.S. prime rates were mostly offset by a decrease in outstanding debt.
Foreign currency transaction loss — Foreign currency loss was $1.1 million for both years ended December 31, 2017 and 2016. As stated in the past, the Company attempts to purchase forward currency exchange contracts such that the exchange gains and losses on the assets and liabilities denominated in other than the reporting units’ functional currency will be offset by the changes in the market value of the forward currency exchange contracts it holds. Currency risks can be reduced but not eliminated in part because the Company has not been able to identify a strategy to effectively hedge the currency risks related to the Argentinian peso. The Company records at the balance sheet date the forward currency exchange contracts at their market value with any associated gain or loss being recorded in current earnings as a currency gain or loss.
A substantial portion of the 2017 loss is attributable to exchange losses related to the Argentinian peso. As previously stated, the Company has not been able to identify a strategy to effectively hedge currency risks related to the Argentinian peso.
The 2016 currency loss also reflects the recognition of deferred loss of $0.2 million related to an intercompany receivable. The loss had been previously deferred in other comprehensive income as there was an intercompany receivable that was not expected to be repaid. The repayment of the receivable resulted in the recognition of the previously deferred loss.
Other income (loss) — For the years ended December 31, 2017 and 2016, the Company had other income of $0.4 million and $0.9 million, respectively. For the year ended December 31, 2017, other income is the result of revaluing a contingent acquisition liability related to an option to acquire certain PM bank debt. The fair market value of the contingent acquisition liability is subject to revaluation on a recurring basis. The revaluation that will be performed for March 31, 2018 will take into account the effect of PM debt restructuring that happened in the first quarter of 2018.
24
During 2016, the fair value of this liability was recalculated based on updated 2017 EBITDA projections. This revaluation resulted in a gain of approximately $0.9 million.
Income tax — On December 22, 2017, the Tax Cuts and Jobs Act (the “Act”) was enacted into law. The Act makes comprehensive changes to the U.S. tax code, including, but not limited to, reducing the U.S. federal corporate tax rate from 35% to 21%, changes to the rules related to uses and limitations of net operating loss carryforwards created in tax years beginning after December 31, 2017, immediate expensing of certain qualified property, creation of a new limitation on deductible interest expense, repeal of the U.S. corporate minimum tax (“AMT”), and changes in the manner in which international operations are taxed in the U.S. Although the majority of the changes resulting from the Act are effective beginning in 2018, U.S. GAAP requires that certain impacts of the Act be recognized in the income tax provision in the period of enactment.
In response to the enactment of the Act, the SEC issued Staff Accounting Bulletin (“SAB”) 118, which provides guidance on accounting for the tax effects of the Act. SAB 118 provides a measurement period that should not extend beyond one year from the Act enactment date for companies to complete the accounting under ASC 740. To the extent that a company’s accounting for certain income tax effects of the Act is incomplete but is able to determine a reasonable estimate, it must record a provisional estimate in the financial statements. At December 31, 2017, we have not completed our accounting for the tax effects of the enactment of the Act; however, in certain cases, as described in Note 14, Income Taxes, we have made a reasonable estimate of the effects on our existing deferred tax balances and one-time transition tax.
Income tax (benefit) from continuing operations was $(0.1) million and $(0.6) million for the years ended December 31, 2017 and 2016, respectively. The income tax benefit is attributed to a pre-tax loss of $7.2 million and $23.8 million from continuing operations for the years ended December 31, 2017 and December 31, 2016, respectively. The Company’s effective rate decreased to 1.64% for 2017 from 2.38% for 2016. The decrease in the effective tax rate is due primarily to the tax effects related to the Tax Cuts and Jobs Act, a decrease in the valuation allowance, a decrease in deferred tax liabilities related to indefinite lived intangible assets as well as the mix of domestic and foreign earnings.
Income (loss) in equity investments — The Company had income (loss) related to its equity investment of $0.4 million and ($5.8) million for the years ended December 31, 2017 and 2016, respectively. Income for the year ended December 31, 2017 was from earnings from our equity investment in ASV Holdings. The loss in 2016 is result of recognizing an impairment charge of $5.6 million to write off our entire investment in Lift Ventures LLC during 2016. See Note 26 to the financial statements for additional information related this impairment.
Net loss from continuing operations —Net loss for the years ended December 31, 2017 and 2016 was $7.1 million and $23.2 million, respectively. The change is explained above.
Year Ended December 31, 2016 from Continuing Operations Compared to Year Ended December 31, 2015 from Continuing Operations
Net loss from continuing operations
For the year ended December 31, 2016, net loss was $23.2 million, which consists of revenue of $173.2 million, cost of sales of $143.3 million, research and development costs of $2.9 million, SG&A costs of $37.0 million, interest expense of $6.4 million, interest expense related to the write-off of debt issuance costs of $1.4 million, foreign currency transaction loss of $1.1 million, other income of $0.9 million, loss in non-marketable equity interest of $5.8 million and income tax benefit of $0.6 million.
For the year ended December 31, 2015, net loss was $5.3 million, which consists of revenue of $202.7 million, cost of sales of $160.8 million, research and development costs of $3.1 million, SG&A costs of $39.2 million, interest expense of $6.4 million, foreign currency transaction loss of $0.3 million, loss in non-marketable equity interest of $0.2 million and income tax benefit of $1.9 million.
Net revenue and gross profit —For the year ended December 31, 2016, net revenue and gross profit were $173.2 million and $29.9 million, respectively. Gross profit as a percent of sales was 17.3% for the year ended December 31, 2016. For the year ended December 31, 2015, net revenue and gross profit were $202.7 million and $42.0 million, respectively. Gross profit as a percent of sales was 20.7% for the year ended December 31, 2015.
For 2016 revenues decreased $29.6 million or 14.6% from $202.7 million for 2015 to $173.2 million for 2016. The decrease in revenues is largely attributed to the effect that lower oil prices had on our markets. Although, all the product lines experienced year over year revenues declines, the decrease in boom truck sales had the most significant impact. This occurred as boom truck is one of our major product lines which was significantly impacted by the drop in oil prices. The sales decrease related to the knuckle boom product line, another one of our significant product lines, was not nearly as significant. The decrease in revenues for knuckle boom cranes was not a significant as it is not nearly as affected the drop in oil prices.
25
Gross profit as a percent of net revenues decreased 3.4% to 17.3% for the year ended December 31, 2016 from 20.7% for the comparable 2015 period. The decrease in gross profit is attributed to lower volumes, change in product mix including a shift towards lower capacity boom truck and aggressive sales pricing especially towards at the end of the year in effort to move existing finished goods inventory. The sale of finished goods inventory at less than our normal margins was consistent with our priority of reducing debt in 2016. Partially offsetting other factors is the beneficial impact that an increase in part sales as percent of total revenues had. Part sales, which have significantly higher gross margins, increased from 10% to 13% of total revenues from 2015 to 2016.
Research and development —Research and development for the year ended December 31, 2016 was $2.9 million compared to $3.1 million for the comparable period in 2015. Research and development expenditures were relatively consistent with the prior period. The Company’s research and development spending continues to reflect our commitment to develop and introduce new products that give the Company a competitive advantage.
Selling, general and administrative expense —Selling, general and administrative expense for the year ended December 31, 2016 was $37.0 million compared to $39.2 million for the comparable period in 2015, a decrease of $2.2 million. The decrease is principally attributed to cost reductions made in response to decreased revenues and to lower variable selling expenses.
Operating (loss) income —The Company had an operating loss of $10.0 million for the year ended December 31, 2016 compared to an operating loss of $0.3 million in the prior year. The adverse change in operating income is the result of decrease in gross profit of $12.1 million, the result of a decrease in revenues and lower gross profit margin. The decrease in gross margin was partially offset by a $2.4 million decrease in operating expenses.
Interest expense —Interest expense was $7.8 million, inclusive of $1.4 million related to the write-off of debt issuance costs, and $6.4 million for the years ended December 31, 2016 and 2015, respectively. Interest expense increased in 2016 because interest expense includes $1.4 million of deferred financing costs that were expensed when associated debt was refinanced in the second and fourth quarters of 2016. Interest expense for 2016 and 2015 excluding $1.4 for the write-off deferred financing cost was consistent. The additional interest incurred on the SVW debt was offset by other decreases in interest expense, the result of decreases in other debt that occurred during 2016.
Foreign currency transaction loss — Foreign currency loss was $1.1 million and $0.3 million for the years ended December 31, 2016 and 2015, respectively. As stated in the past, the Company attempts to purchase forward currency exchange contracts such that the exchange gains and losses on the assets and liabilities denominated in other than the reporting units’ functional currency will be offset by the changes in the market value of the forward currency exchange contracts it holds. Currency risks can be reduced but not eliminated in part because the Company has not been able to identify a strategy to effectively hedge the currency risks related to the Argentinian peso. The Company records at the balance sheet date the forward currency exchange contracts at their market value with any associated gain or loss being recorded in current earnings as a currency gain or loss.
A substantial portion of the 2016 loss is attributable to exchange losses related to the Argentinian peso. As previously stated, the Company has not been able to identify a strategy to effectively hedge currency risks related to the Argentinian peso. The 2016 currency loss also reflects the recognition of deferred loss of $0.2 million related to an intercompany receivable. The loss had been previously deferred in other comprehensive income as there was an intercompany receivable that was not expected to be repaid. The repayment of the receivable resulted in the recognition of the previously deferred loss.
Other income (loss) — In 2016, the Company had other income of $0.9 million. The other income is the result of revaluing a contingent acquisition liability related to an option to acquire certain PM bank debt. The contingent liability is related to a potential future payment, which is based on PM’s 2017 earnings before interest, taxes, depreciation and amortization (EBITDA). During 2016, the fair value of this liability was recalculated based on updated 2017 EBITDA projections.
Income tax — Income tax (benefit) for continuing operations was $(0.6) million and $(1.9) million for the years ended December 31, 2016 and 2015, respectively. The income tax benefit is attributed to a pre-tax loss of $23.8 million and $7.3 million from continuing operations for the years ended December 31, 2016 and December 31, 2015, respectively. The Company’s effective rate decreased to 2.38% for 2016 from 26.74% for 2015. The decrease in the effective tax rate is due primarily to the establishment of a full valuation allowance against the portion of its net U.S. deferred tax assets that that could not be realized by carrying back the 2016 tax loss for a refund of taxes paid in prior years.
Loss in non-marketable equity interest — The Company had losses related its non-marketable equity investment of $5.8 million and $0.2 million for the years ended December 31, 2016 and 2015, respectively. The increase in the loss is result of recognizing an impairment charge of $5.6 million to write off its entire investment in Lift Ventures LLC during 2016. See Note 26 to the financial statements for additional information related this impairment.
26
Net loss from continuing operations —Net loss for the years ended December 31, 2016 and 2015 was $23.2 million and $5.3 million, respectively. The change is explained above.
Liquidity and Capital Resources
Cash, cash equivalents and restricted cash were $5.4 million and $5.3 million at December 31, 2017 and December 31, 2016, respectively. In addition, the Company has a U.S. revolving credit facility with a maturity date of July 20, 2019. At December 31, 2017 the Company had approximately $8.8 million available to borrow under its revolving credit facility.
At December 31, 2017, the PM Group had established working capital facilities with seven Italian and seven South American banks. Under these facilities, the PM Group can borrow $31.6 million against orders, invoices and letters of credit. At December 31, 2017, the PM Group had received advances of $24.6 million. Future advances are dependent on having available collateral.
Subsequent to December 31, 2017, the Company entered into a debt restructuring agreement as disclosed in Note 27, which modified the terms of the working capital debt facilities as follows:
|
|
• |
The facilities were extended until December 31, 2021. |
|
|
• |
€220 of the facility was expired. |
|
|
• |
€100 of the working capital facility to be repaid within 2018 through advanced trade receivables collection |
|
|
• |
The guarantee facilities are available to any kind of creditor, not solely suppliers. |
The Company needs cash to meet its working capital needs as the business grows, to acquire capital equipment, and to fund acquisitions and debt repayment. We intend to use cash flows from operations and existing availability under the current revolving credit facilities to fund operations. However, additional capital may be required if our business expands. The Company thought it prudent to put a mechanism in place by which supplemental liquidity can be provided to address working capital requirements or other capital requirements that may arise. On January 23, 2017, Manitex International Inc. entered into a Controlled Equity Offering Sales Agreement (“Sales Agreement”) with Cantor Fitzgerald & Co. (“Cantor”) pursuant to which the Company may offer and sell shares of its common stock, no par value per share, having an aggregate offering price up to $20.0 millon through Cantor. Funds provided through the Sales Agreement totaled $2.6 million in January 2017 from the sale of 294,524 shares of the Company's common stock. Due to the late filing of its Quarterly Report on Form 10-Q for the nine months ended September 30, 2017, the Company currently cannot issue shares under this program. The Company may be eligible to issue shares under the program, when the Company has been current in its filings with the Securities Exchange Commission for the past twelve months.
On May 17, 2017, the Company and ASV Holdings completed an underwritten initial public offering (the “Offering”) of 3,800,000 shares of ASV Holdings’ common stock, including 2,000,000 shares sold by the Company. The Company received proceeds net of commissions of $13.0 million from the Offering. Because the Company’s ownership interest has decreased below 50%, it no longer has a controlling financial interest in ASV Holdings and deconsolidated ASV Holdings from the financial statements and results of operations of the Company, effective May 17, 2017, in accordance with Accounting Standard Codification, or ASC, 810-10-40, Derecognition.
Over the period from February 26-28, 2018, the Company sold an aggregate of 1,000,000 shares of ASV Holdings in privately-negotiated transactions with institutional purchasers. All such shares were sold for $7.00 per share. Following such sale transactions, the Company owns an aggregate of 1,080,000 shares of ASV Holdings
Nevertheless, our availability under our credit lines is limited, it is important that we manage our working capital. The Company may need to raise additional capital through debt or equity financings to support our long-term growth strategy, which may include additional acquisitions. There is no assurance that such financing will be available or, if available, on acceptable terms.
27
Outstanding borrowings and required payments
The following is a summary of our outstanding borrowings at December 31, 2017:
(In millions)
|
|
|
Outstanding Balance |
|
|
Interest Rate |
|
Interest Paid |
|
Principal Payment |
|
|
U.S. Revolver |
|
$ |
12.9 |
|
|
4.49 to 5.50% |
|
Monthly |
|
July 20, 2019 maturity |
|
Note Bank (insurance premiums) |
|
|
0.6 |
|
|
5.26% |
|
Monthly |
|
February 2018 and August 2018 Maturity |
|
Convertible note—Terex |
|
|
7.0 |
|
|
7.5% |
|
Semi-Annual |
|
January 1, 2021 maturity |
|
Convertible note—Perella |
|
|
14.6 |
|
|
7.5% |
|
Semi-Annual |
|
January 7, 2021 maturity |
|
Capital lease—cranes for sale |
|
|
0.7 |
|
|
5.5% |
|
Monthly |
|
January 13, 2021 maturity |
|
Capital lease—Georgetown facility |
|
|
5.2 |
|
|
12.50% |
|
Monthly |
|
$0.06 million monthly payment includes interest. April 30, 2028 maturity |
|
Badger note payable |
|
|
0.5 |
|
|
8.00% |
|
Monthly |
|
$0.1 million monthly |
|
PM unsecured borrowings |
|
|
16.7 |
|
|
2.17% |
|
Semi-Annual |
|
Variable semi-annual starting June 2017 through December 2021 |
|
PM Autogru term loan |
|
|
0.3 |
|
|
3.00% |
|
Monthly |
|
$0.1 million monthly through October 2020 |
|
PM Autogru term loan |
|
|
0.5 |
|
|
2.50% |
|
Annually |
|
$0.5 million payment due June 2018 |
|
PM Argentina Note |
|
|
0.2 |
|
|
29.0% |
|
Single Paymemt |
|
April 2018 |
|
PM Argentina Note |
|
|
0.5 |
|
|
28.5% |
|
Quarterly |
|
5 payments beginning April 2018 |
|
PM term loans with related accrued interest, interest rate swaps and FMV adjustments |
|
|
11.2 |
|
|
0 to 3.50% |
|
Annual |
|
Variable semi-annual starting June 2019 through December 2021. No principal payments scheduled for 2018 |
|
PM short-term working capital borrowings |
|
|
24.6 |
|
|
1.42 to 24.0% |
|
Monthly |
|
Upon payment of invoice |
|
Valla note payable |
|
|
0.1 |
|
|
4.37% |
|
Quarterly |
|
Over 14 quarterly payments |
|
Valla short-term working capital borrowings |
|
|
1.0 |
|
|
4.50 to 4.75% |
|
Monthly |
|
Upon payment of invoice or letter of credit |
|
|
|
|
96.6 |
|
|
|
|
|
|
|
|
Debt issuance costs |
|
|
(0.7 |
) |
|
|
|
|
|
|
|
Debt net of issuance costs |
|
$ |
95.9 |
|
|
|
|
|
|
|
The debt has various maturity dates. See Notes 11 through 13 to the financial statements for additional details.
Change in outstanding debt
In 2017, our total debt was reduced by $11.0 million (excluding $0.6 million deferred interest reclassification). The primary difference is attributed to a decrease in SVW debt of $11.2 million which was paid off during the year.
28
The following is a summary of changes in debt related to continuing operations:
(In millions)
|
|
|
Increase/ (decrease) |
|
|
|
U.S. Revolver |
|
$ |
(7.1 |
) |
|
Notes payable-Terex |
|
|
(1.0 |
) |
|
Capital leases—buildings |
|
|
(0.6 |
) |
|
Capital leases—equipment |
|
|
0.2 |
|
|
Convertible note—Terex |
|
|
0.1 |
|
|
Convertible note—Perella |
|
|
0.1 |
|
|
Comerica Term loan |
|
|
— |
|
|
Badger notes payable |
|
|
0.5 |
|
|
Valla notes payable |
|
|
1.1 |
|
|
PM |
|
|
6.5 |
|
|
Note payable-SVW |
|
|
(11.2 |
) |
|
|
|
|
(11.4 |
) |
|
Reclassification of deferred Interest |
|
|
0.6 |
|
|
Debt issuance costs |
|
|
0.4 |
|
|
|
|
$ |
(10.4 |
) |
2017
Operating activities generated $9.1 million of cash for the year ended December 31, 2017 and is comprised of non-cash items of $6.9 million and a decrease in working capital of $10.0 million, both of which generated cash, offset by a net loss of $7.8 million which consumed cash. The following are principal non-cash items that increased cash flows from operating activities: depreciation and amortization of $5.1 million, the non-cash loss on sale of discontinued operations of $1.3 million, stock-based compensation of $0.8 million, an increase in inventory reserves of $1.1 million, amortization of deferred financing costs of $0.6 million, and amortization of debt discount of $0.4 million. The following items consumed cash: a decrease in deferred tax liabilities of $1.5 million, a change in interest rate swaps of $0.4 million, non-cash income from an equity investment of $0.4 million and $0.3 million gain related to the revaluation of contingent acquisition liability. Other less significant non-cash items in aggregated generated $0.3 million of cash.
The change in assets and liabilities generated $10.0 million in cash. The changes in assets and liabilities related to continuing operations and discontinued operations consumed $6.3 million and $3.7 million, respectively. The changes in the items related to continuing operations had the following impact on cash flows: accounts receivable consumed $11.1 million, inventory generated $17.1 million, prepaid expenses generated $2.6 million, other assets generated $0.1 million, accounts payable consumed $2.6 million, accrued expenses consumed $0.4 million, and other current liabilities generated $0.7 million. The increase in accounts receivable is due to the fact that sales for the fourth quarter 2017 are significantly higher when compared to sales for the quarter ended December 31, 2016. The 2017 decrease in inventory includes the sale of the $9.5 million of SVW inventory that was held at the end of 2016. The remaining decrease in inventory of $7.6 million is primarily the result of a decrease in finished goods inventory that is in part attributed an improved market for the Company’s products. The decrease in prepaid expense is primarily related to the receipt of a United States Income Tax refund. The decrease in accounts payable is attributed the timing of vendor payments.
Cash flows related to investing activities generated $11.7 million of cash for the year ended December 31, 2017. The Company generated $12.9 million through the sale of non-core operations offset by the purchase of capital equipment of $1.0 million. Discontinued operations consumed $0.1 million. The amount spent for capital equipment was spread throughout the organization and no expenditure individually was significant.
Financing activities consumed $20.9 million in cash for the year ended December 31, 2017. Financing activities of continuing operations consumed $15.8 million and discontinued operations consumed another $5.1 million of cash. The principal sources of cash for continuing operations that in aggregate total $11.1 million include new borrowing of $2.6 million, proceeds from sales and leasebacks of $0.9 million, an increase in working capital borrowings of $3.4 million and $2.4 received in connection with a stock offering. The principal uses of cash by continuing operations which aggregated $25.1 million include a reduction in borrowing under the U.S. credit facility of $7.1 million, debt payments of $16.5 million, capital lease payments of $1.4 million and $0.2 million used to repurchase shares from employees to satisfy their withholding tax liability related to the vesting of shares. The 2017 debt payments include approximately $11.2 million that was used to retire all SVW related debt.
29
2016
Operating activities consumed $18.6 million of cash for the year ended December 31, 2016, and is comprised of non-cash items of $30.3 million, offset by a net loss of $37.7 million and an increase in working capital of $11.3 million both of which consumed cash. The following are principal non-cash items that increased cash flow from operating activities: depreciation and amortization of $6.6 million, the non-cash loss on sale of discontinued operations of $14.5 million, an impairment charge related to Lift Venture investment of $5.6 million, stock based compensation of $1.1 million, an increase in inventory reserves of $0.3 million, amortization of deferred financing costs of $2.0 million, amortization of debt discount of $0.5 million, and an increase net deferred tax liabilities of $1.2 million. A change in interest rate swaps of $0.8 million and $0.9 million gain related to the revaluation of contingent acquisition liability both consumed cash. Other less significant non-cash items in aggregated offset each other. The amortization of deferred financing costs includes approximately $1.4 million that was expensed in connection with refinancing of debt.
The change in assets and liabilities consumed $11.3 million in cash. The changes in assets and liabilities related to continuing operations and discontinued operations consumed $7.4 million and $3.8 million, respectively. The changes in the items related to continuing operations had the following impact on cash flows: accounts receivable generated $1.6 million, inventory consumed $3.8 million, prepaid expenses consumed $0.3 million, other assets generated $0.2 million, accounts payable consumed $4.5 million, accrued expenses consumed $0.9 million, other current liabilities generated $0.2 million, and other long-term liabilities generated $0.2 million. The decrease in accounts receivable is due to the fact that sales for the fourth quarter 2016 are lower when compared to sales for the quarter ended December 31, 2015. This impact was largely offset by a longer collection cycle. The lengthening of the collection cycle is result of an increase in foreign receivables, which traditionally take longer to collect. The increase in inventory is attributed to an increase in finished goods inventory, principally boom trucks. The increase in finished goods inventory was significantly impacted by reversing the sale of cranes that before the restatement had been incorrectly accounted as for being sold. With the reversal of the sale, these cranes are now included in the Company’s inventory at December 31, 2016. The decrease in accounts payable is attributed the timing of vendor payments.
Cash flows related to investing activities generated $18.4 million of cash for the year ended December 31, 2016. The Company generated $19.1 million through the sale of non-core operations and another $0.4 million by discontinued operations offset by the purchase of capital equipment of $1.2 million. Other investing activity in aggregate totaled $0.1 million. The amount spent for capital equipment was spread throughout the organization and no expenditure individually was significant.
Financing activities consumed $3.4 million in cash for the year ended December 31, 2016. Financing activities of continuing operations generated $1.5 million which was more than offset as financing activities of discontinued operations consumed $4.9 million. The principal sources of cash for continuing operations that in aggregate total $18.8 million include new borrowing of $12.9 million, proceeds from sales and leasebacks of $4.1 million. and an increase in working capital borrowings of $1.8 million. The new borrowings include $12.2 million of new debt incurred by the consolidated VIE. The repayment of debt by continuing operations consumed $15.4 million of cash. During the year, payments of $2.2 million were made to pay of the balance of the 2015 term loan, borrowing under the U.S. credit facility was reduced by $6.5 million, principal payments of $1.0 related to the VIE debt were made and capital lease payments totaled $0.5 million. The remaining debt payments totaled $5.7 million, which includes $4.6 million of principal payments made against Italian term debt. Additionally, $1.3 million was used to pay bank fees and costs associated with refinancing the U.S. revolving credit facility and obtaining the VIE financing.
Contingencies
The Company is involved in various legal proceedings, including product liability and workers’ compensation matters which have arisen in the normal course of operations. Certain cases are at a preliminary stage, and it is not possible to estimate the amount or timing of any cost to the Company.
The Company does not believe that these contingencies in aggregate will have a material adverse effect on the Company.
Additionally, the Company has been named as a defendant in several multi-defendant asbestos related product liability lawsuits. In certain instances, the Company is indemnified by a former owner of the product line in question. In the remaining cases the plaintiff has, to date, not been able to establish any exposure by the plaintiff to the Company’s products. The Company is uninsured with respect to these claims but believes that it will not incur any material liability with respect to these to claims.
When it is probable that a loss has been incurred and possible to make a reasonable estimate of the Company’s liability with respect to such matters, a provision is recorded for the amount of such estimate or the minimum amount of a range of estimates when it is not possible to estimate the amount within the range that is most likely to occur. The Company established reserves for several ASV and PM lawsuits in conjunction with the purchase accounting for these two acquisitions.
As described in Note 14, Income Taxes, the Company increased its unrecognized tax benefits in connection with the Romanian tax audit and pending legal proceedings.
30
Residual Value Guarantees
The Company issues partial residual value guarantees to support a customer’s financing of equipment purchased from the Company. A residual value guarantee involves a guarantee that a piece of equipment will have a minimum fair market value at a future date if certain conditions are met by the customer. The Company has issued partial residual guarantees that have maximum exposure of approximately $1.6 million. The Company, however, does not have any reason to believe that any exposure from such a guarantee is probable at this time and accordingly, no liability has been recorded. The Company’s lability from its guarantees may be affected by economic conditions in used equipment markets at the time of loss.
Income Taxes
The Company records accrued interest related to income tax matters in the provision for income taxes in the accompanying consolidated statement of income. For the years ended December 31, 2017 and 2016, interest and penalties recognized on unrecognized tax benefits were $69 and $40, respectively. The accrued balance as of December 31 2017 and 2016 was $382 and $294, respectively. Included in the unrecognized tax benefits is a liability for the PM Group’s potential IRES and IRAP (Italian Income Taxes) audit adjustments for the tax year 2013 and Romania for tax years 2012-2016. Depending upon the final resolution of these audits, the liability could be higher or lower than the amount recorded at December 31, 2017. As of December 31, 2017, we don’t anticipate a significant change in unrecognized tax benefits within 12 months of the reporting date.
The Company files income tax returns in the United States, Romania and Italy as well as various state and local tax jurisdictions with varying statutes of limitations. With few exceptions, as of December 31, 2017, the Company is no longer subject to U.S. federal, state or foreign examinations by tax authorities for years before 2014. In July 2017, the Company received notification from the Internal Revenue Service that its tax return for the year ended December 31, 2015 has been selected for examination.
SEC Inquiry
The Company has received an inquiry from the SEC requesting certain information in connection with the Company’s previously announced restatement of prior financial statements, and is complying with such request.
Off Balance Sheet Arrangements
CIBC has issued 2 standby letters of credit at December 31, 2017. The first standby letter of credit is $0.6 million in favor of an insurance carrier to secure obligations which may arise in connection with future deductibles payments that may be incurred under the Company’s worker’s compensation insurance policies. The second standby letter of credit is $20 thousand in favor of a governmental agency to secure obligations which may arise in connection with worker’s compensation claims. During the fourth quarter of 2015 and first quarter of 2016, the Company entered into four 60 month equipment operating leases in sales and lease back transactions. In connection with these transactions, the Company received $6.7 million, i.e., $2.6 million for the one executed in 2015 and a total of $4.1 million for the three executed in 2016.
The Company has issued partial residual value guarantees to support a customer’s financing. A residual value guarantee involves a guarantee that a piece of equipment will have a minimum fair market value at a future date if certain conditions are met by the customer. The Company has issued partial residual guarantees that have maximum exposure of approximately $1.6 million in aggregate. The Company, however, does not have any reason to believe that any exposure from any such guarantees is either probable or estimable at this time, as such, no liability has been recorded.
See Note 23 – “Legal Proceedings and other Contingencies” in the Notes to the Consolidated Financial Statements for further information regarding our guarantees.
31
Contractual Obligations
The following is a schedule as of December 31, 2017 of our long-term contractual commitments, future minimum lease payments under non-cancelable operating lease arrangements and other long-term obligations.
(in thousands)
|
|
|
Payments due by period |
|
|||||||||||||||||
|
|
|
Total |
|
|
2018 |
|
|
2019- 2020 |
|
|
2021- 2022 |
|
|
Thereafter |
|
|||||
|
Revolving credit facilities (4) |
|
$ |
16,528 |
|
|
$ |
583 |
|
|
$ |
15,945 |
|
|
$ |
— |
|
|
$ |
— |
|
|
Working capital borrowings (3) |
|
|
25,756 |
|
|
|
25,756 |
|
|
|
— |
|
|
|
— |
|
|
|
— |
|
|
Term loans (4) |
|
|
65,291 |
|
|
|
7,090 |
|
|
|
19,100 |
|
|
|
24,009 |
|
|
|
15,092 |
|
|
Operating lease obligations |
|
|
4,840 |
|
|
|
1,762 |
|
|
|
2,907 |
|
|
|
171 |
|
|
|
— |
|
|
Capital lease obligations (3) |
|
|
10,242 |
|
|
|
1,026 |
|
|
|
2,110 |
|
|
|
1,803 |
|
|
|
5,303 |
|
|
Legal settlement (see Note 23) (3) |
|
|
1,330 |
|
|
|
95 |
|
|
|
190 |
|
|
|
190 |
|
|
|
855 |
|
|
Service agreements |
|
|
144 |
|
|
|
72 |
|
|
|
72 |
|
|
|
— |
|
|
|
— |
|
|
Purchase obligations (1) |
|
|
1,142 |
|
|
|
1,142 |
|
|
|
— |
|
|
|
— |
|
|
|
— |
|
|
Total |
|
$ |
125,273 |
|
|
$ |
37,526 |
|
|
$ |
40,324 |
|
|
$ |
26,173 |
|
|
$ |
21,250 |
|
|
(1) |
Except for a very insignificant amount, purchase obligations are for inventory items. Purchase obligations not for inventory would include research and development materials, supplies and services. |
|
(2) |
At December 31, 2017, the Company had a reserve for unrecognized tax benefits of $1.0 million for which the Company is unable to make reasonably reliable estimates of the period of cash settlement with the respective tax authority. Thus, these liabilities (reserves) have not been included in the contractual obligations table. (see Note 14). |
|
(3) |
PM working capital borrowing, Capital lease obligations and legal settlement include imputed interest. |
|
(4) |
Long-term debt obligations include expected interest expense. Interest expense is calculated using current interest rates for indebtedness as of December 31, 2017. |
Related Party Transactions
For a description of the Company’s related party transactions, please see Note 22 to the Company’s consolidated financial statements entitled “Transactions between the Company and Related Parties.”
Critical Accounting Policies and Estimates
The preparation of our financial statements and related disclosures in conformity with accounting principles generally accepted in the United States of America requires management to make estimates and judgments that affect our reported amounts of assets and liabilities, revenues and expenses, and related disclosures of contingent assets and liabilities. On an on-going basis, we evaluate our estimates and assumptions based upon historical experience and various other factors and circumstances. Management believes that our estimates and assumptions are reasonable under the circumstances; however, actual results may vary from these estimates and assumptions under different future circumstances. We have identified the following critical accounting policies that affect the more significant judgments and estimates used in the preparation of our consolidated financial statements.
Principals of Consolidation. The Company consolidates all entities that we control by ownership of a majority voting interest. Additionally, there are situations in which consolidation is required even though the usual condition of consolidation (ownership of a majority voting interest) does not apply. Generally, this occurs when an entity holds an interest in another business enterprise that was achieved through arrangements that do not involve voting interests, which results in a disproportionate relationship between such entity's voting interests in, and its exposure to the economic risks and potential rewards of, the other business enterprise. This disproportionate relationship results in what is known as a variable interest, and the entity in which we have the variable interest is referred to as a "VIE." An enterprise must consolidate a VIE if it is determined to be the primary beneficiary of the VIE. The primary beneficiary has both (1) the power to direct the activities of the VIE that most significantly impact the entity's economic performance, and (2) the obligation to absorb losses or the right to receive benefits from the VIE that could potentially be significant to the VIE.
Although the Company does not have an ownership interest in S.V.W. Crane & Equipment Company and its wholly owned subsidiary Rental Consulting Service Company (collectively “SVW”), the Company has the power to direct the activities of SVW that most significantly impact its economic performance and is absorbing the losses. SVW has obtained financing and has remitted the proceeds to the Company using inventory (cranes) owned by the Company as collateral. The finance companies that hold the loans have a perfected security interest in the inventory and therefore have recourse against this specific inventory. Furthermore, the debt taken on by SVW was effectively guaranteed by the Company pursuant to certain related agreements.
32
Income and losses related to VIE’s are typically shown in a company’s financial statements as being attributed to a non-controlling interest. Other than its transactions between SVW and the Company, SVW had no other substantial business operations. Furthermore, the Company exercised control and absorbed all losses and received all the income from SVW operations. Therefore, the Company has concluded that income and losses related to the VIE are attributable to the Shareholders of the Company.
The Company eliminates from our financial results all significant intercompany transactions, including the intercompany transactions with consolidated SVW.
Revenue Recognition. Revenue and related costs are recognized when title passes and risk of loss passes to our customers which generally occurs upon shipment depending upon the terms of the contract. Under certain contracts with our customers title passes to the customers when the units are completed. The units are segregated from our inventory and identified as belonging to the customer, the customer is notified that the units are complete and awaiting pick up or delivery as specified by the customer before income is recognized. Additionally, the customer is requested to sign an “Invoice Authorization Form” which acknowledges the contract terms and acknowledges that the customer has economic ownership and control over the unit. It also acknowledges that we are going to invoice the unit per terms of the contract. The Company insures any custodial risk that it may retain.
For FOB contracts, customers may be invoiced prior to the time customers take physical possession. Revenue is recognized in such cases only when the customer has a fixed commitment to purchase the units, the units have been completed, tested and made available to the customer for pickup or delivery, and the customer has authorized in writing that we hold the units for pickup or delivery at a time specified by the customer. In such cases, the units are invoiced under our customary billing terms, title to the units and risks of ownership pass to the customer upon invoicing, the units are segregated from our inventory and identified as belonging to the customer and we have no further obligations under the order. The Company insures any custodial risk that it may retain.
In addition, our policy requires in all instances certain minimum criteria be met in order to recognize revenue, specifically:
|
a) |
Persuasive evidence that an arrangement exists; |
|
b) |
The price to the buyer is fixed or determinable; |
|
c) |
Collectability is reasonably assured; and |
|
d) |
We have no significant obligations for future performance. |
Interest Rate Swap Contracts. The Company enters into derivative instruments to manage its exposure to interest rate risk related to certain foreign term loans. Derivatives are initially recognized at fair value at the date the contract is entered into and are subsequently remeasured to their fair value at the end of each reporting period. The resulting gain or loss is recognized in current earnings immediately unless the derivative is designated and effective as a hedging instrument, in which case the effective portion of the gain or loss is recognized and is reported as a component of other comprehensive income and reclassified into earnings in the same period or periods during which the hedging instrument affects earnings (date of sale). As part of the acquisition of PM Group, which was acquired on January 15, 2015, the Company acquired interest rate swap contracts, which manage the exposure to interest rate risk related to term loans with certain financial institutions in Italy. These contracts have been determined not to be hedge instruments under ASC 815-10. Further details of derivative financial instruments are disclosed in Notes 5 and 6 to the Company’s consolidated financial statements.
Allowance for Doubtful Accounts. Accounts Receivable is reduced by an allowance for amounts that may become uncollectible in the future. The Company’s estimate for the allowance for doubtful accounts related to trade receivables includes evaluation of specific accounts where we have information that the customer may have an inability to meet its financial obligations.
Guarantees. The Company has issued partial residual guarantees to financial institutions related to a customer financing of equipment purchased by the customer. The Company must assess the probability of losses if the fair market value is less than the guaranteed residual value.
A residual value guarantee involves a guarantee that a piece of equipment will have a minimum fair market value at a future date. The Company will record a liability for the estimated fair value of guarantees issued pursuant to Financial Accounting Standards Board (“FASB”) Accounting Standards Codification (“ASC”) 460, “Guarantees” (“ASC 460”). We recognize a loss under a guarantee when the obligation to make payment under the guarantee is probable and the amount of the loss can be estimated. If the expected equipment value is less than its guaranteed residual value, the Company would recognize a liability for the amount of the short-fall up to the amount of its partial guarantee. The Company is not responsible for any short-fall in excess of its partial guarantee.
Inventories and Related Reserve for Obsolete and Excess Inventory. Inventories are valued at the lower of cost or net realizable value and are reduced by a reserve for excess and obsolete inventories. The estimated reserve is based upon specific identification of excess or obsolete inventories.
33
Other Intangible Assets. The Company accounts for Other Intangible Assets under the guidance of ASC 350, “Intangibles—Goodwill and Other”. The Company capitalizes certain costs related to patent technology. Additionally, a substantial portion of the purchase price related to the Company’s acquisitions has been assigned to patents or unpatented technology, trade name, customer backlog, and customer relationships. Under the guidance, Other Intangible Assets with definite lives are amortized over their estimated useful lives. Intangible assets with indefinite lives are tested annually for impairment.
Goodwill. Goodwill, representing the difference between the total purchase price and the fair value of assets (tangible and intangible) and liabilities at the date of acquisition, is reviewed for impairment annually, and more frequently as circumstances warrant, and written down only in the period in which the recorded value of such assets exceed their fair value. The Company does not amortize goodwill in accordance with Financial Accounting Standards Board (the “FASB”) Accounting Standards Codification (“ASC”) 350, “Intangibles—Goodwill and Other” (“ASC 350”). The Company selected October 1 as the date for the required annual impairment test.
Goodwill is tested for impairment at reporting unit level (reporting segment). For 2017, this is at the fully consolidated level excluding discontinued operations, as the Company now operates in a single business segment. For 2016 as well as for 2015 Goodwill was tested at the three previously reported segment levels that were in effect at that time, i.e., Lifting Equipment, Equipment Distribution and ASV. The Company’s Chief Operating Decision Maker (“CODM”) reviewed C&M and C&M Leasing operations only to determine their impact on the entire Company. As such, the Company has now concluded it is not appropriate to reflect C&M and C&M Leasing as a separate reportable segment.
Under ASU 2011-08, entities are provided with the option of first performing a qualitative assessment on none, some, or all of its reporting units to determine whether it is more likely than not that the fair value of a reporting unit is less than its carrying value. If after completing a qualitative analysis, it is determined that it is more likely than not that the fair value of a reporting unit is less than its carrying value a quantitative analysis is required.
For 2017, 2016, 2015 the Company evaluated its consolidated goodwill using the quantitative two step approach. The first step used to identify potential impairment involves comparing the reporting unit’s estimated fair value to its carrying value, including goodwill. During the first step testing, the Company evaluates goodwill for impairment using a business valuation method, which is calculated as of a measurement date by determining the present value of debt-free, after-tax projected future cash flows, discounted at the weighted average cost of capital of a hypothetical third-party buyer. The market approach was also considered in evaluating the potential for impairment by calculating fair value based on multiples of earnings before interest, taxes, depreciation and amortization (EBITDA) of comparable, publicly traded companies. The Company also observed implied EBITDA multiples from relatively recent merger and acquisition activity in the industry, which was used to test the reasonableness of the results.
The second step of the process involves the calculation of an implied fair value of goodwill for each reporting unit for which step one indicated impairment. The implied fair value of goodwill is determined by measuring the excess of the estimated fair value of the reporting unit over the estimated fair values of the individual assets, liabilities and identifiable intangibles as if the reporting unit was being acquired in a business combination. If the implied fair value of goodwill exceeds the carrying value of goodwill assigned to the reporting unit, there is no impairment. If the carrying value of goodwill assigned to a reporting unit exceeds the implied fair value of the goodwill, an impairment charge is recorded for the excess. An impairment loss cannot exceed the carrying value of goodwill assigned to a reporting unit and the subsequent reversal of goodwill impairment losses is not permitted.
For 2017 and 2015, the first step did not indicate any impairment of goodwill, For 2016, the second step was necessary for the Equipment Distribution segment. This further analysis indicated that the Equipment Distribution segment goodwill was impaired and a $275 impairment charge was recognized in 2016 to fully write off the Equipment Distribution segment’s goodwill.
The determination of fair value requires the Company to make significant estimates and assumptions. These estimates and assumptions primarily include, but are not limited to, revenue growth and operating earnings projections, discount rates, terminal growth rates, and required capital expenditure projections. Our projections make certain assumptions including expanding PM market share in North America, a normalization of energy markets over time and a continued expansion of dealer networks. If our progress in meeting these and other assumptions is slower or different than what was anticipated, it may impact our ability to meet the projections. Due to the inherent uncertainty involved in making these estimates, actual results could differ materially from those estimates. Deterioration in the market or actual results as compared with the projections (including not meeting near term projections) may result in impairment in the near term. In the event the Company determines that goodwill is impaired in the future the Company would need to recognize a non-cash impairment charge.
34
Impairment of Long Lived Assets. The Company’s policy is to assess the realizability of its long-lived assets, including intangible assets, and to evaluate such assets for impairment whenever events or changes in circumstances indicate that the carrying amount of such assets (or group of assets) may not be recoverable. Impairment is determined to exist if the estimated future undiscounted cash flows are less than the carrying value. Future cash flow projections include assumptions for future sales levels, the impact of cost reduction programs, and the level of working capital needed to support each business. The amount of any impairment then recognized would be calculated as the difference between the estimated fair value and the carrying value of the asset. The Company did not have any impairment for the years ended December 31, 2017, 2016 and 2015.
Warranty Expense. The Company establishes reserves for future warranty expense at the point when revenue is recognized by the Company and is based on a percentage of revenues. The provision for estimated warranty claims, which is included in cost of sales, is based on sales.
Retirement Benefit Costs and Termination Benefits. Payments to defined contribution retirement benefit plans are recognized as an expense when employees have rendered service entitling them to the contributions. For defined benefit retirement benefit plans, the cost of providing benefits is determined using the projected unit credit method, with actuarial valuations being carried out at the end of each annual reporting period. Remeasurement, comprising actuarial gains and losses, the effect of the changes to the asset ceiling (if applicable) and the return on plan assets (excluding interest), is reflected immediately in the statement of financial position with a charge or credit recognized in other comprehensive income in the period in which they occur. Remeasurement recognized in other comprehensive income is reflected immediately in retained earnings and will not be reclassified to profit or loss. Past service cost is recognized in profit or loss in the period of a plan amendment. Net interest is calculated by applying the discount rate at the beginning of the period to the net defined benefit liability or asset. Defined benefit costs are categorized as follows:
|
|
• |
service cost (including current service cost, past service cost, as well as gains and losses on curtailments and settlements); |
|
|
• |
net interest expense or income; and |
|
|
• |
remeasurement. |
The PM Group presents the first two components of defined benefit costs in profit or loss in the line item personnel. Curtailment gains and losses are accounted for as past service costs. The retirement benefit obligation recognized in the consolidated statement of financial position represents the actual deficit or surplus in PM Group’s defined benefit plans. Any surplus resulting from this calculation is limited to the present value of any economic benefits available in the form of refunds from the plans or reductions in future contributions to the plans. A liability for a termination benefit is recognized at the earlier of when the entity can no longer withdraw the offer of the termination benefit and when the entity recognizes any related restructuring costs.
Litigation Claims. In determining whether liabilities should be recorded for pending litigation claims, the Company must assess the allegations and the likelihood that it will successfully defend itself. When the Company believes it is probable that it will not prevail in a particular matter, it will then make an estimate of the amount of liability based, in part, on the advice of outside legal counsel.
Income Taxes. The Company accounts for income taxes under the provisions of ASC 740 “Income Taxes,” which requires recognition of income taxes based on amounts payable with respect to the current year and the effects of deferred taxes for the expected future tax consequences of events that have been included in the Company’s financial statements or tax returns. Under this method, deferred tax assets and liabilities are determined based on the differences between the financial accounting and tax basis of assets and liabilities, as well as for operating losses and tax credit carryforwards using enacted tax rates in effect for the year in which the differences are expected to reverse. Valuation allowances are recorded to reduce deferred tax assets when it is more likely than not a tax benefit will not be realized.
ASC 740 also prescribes a recognition threshold and measurement attribute for the financial statement recognition and measurement of a tax position taken or expected to be taken in a tax return, as well as guidance on derecognition, classification, interest and penalties, accounting in interim periods, disclosure and transition.
In assessing the realizability of deferred tax assets, management considers whether it is more likely than not that some portion or all of the deferred tax assets will be realized. The ultimate realization of deferred tax assets is dependent upon the generation of future taxable income prior to the expiration of any net operating loss carryforwards. See Note 14 to our Consolidated Financial Statements for further details.
Comprehensive Income. Reporting “Comprehensive Income” requires reporting and displaying comprehensive income and its components. Comprehensive income includes, in addition to net earnings, other items that are reported as direct adjustments to stockholder’s equity. Currently, the comprehensive income adjustment required for the Company has two components. First is a foreign currency translation adjustment, the result of consolidating its foreign subsidiaries. The second component is a derivative instrument fair market value adjustment (net of income taxes) related to forward currency contracts designated as a cash flow hedge.
35
Business Combinations. The Company accounts for acquisitions in accordance with guidance found in ASC 805, Business Combinations. The guidance requires consideration given, including contingent consideration, assets acquired and liabilities assumed to be valued at their fair market values at the acquisition date. The guidance further provides that: (1) in-process research and development will be recorded at fair value as an indefinite-lived intangible asset; (2) acquisition costs will generally be expensed as incurred, (3) restructuring costs associated with a business combination will generally be expensed subsequent to the acquisition date; and (4) changes in deferred tax asset valuation allowances and income tax uncertainties after the acquisition date generally will affect income tax expense.
ASC 805 requires that any excess of purchase price over fair value of assets acquired, including identifiable intangibles and liabilities assumed be recognized as goodwill. In accordance with ASC 805, any excess of fair value of acquired net assets, including identifiable intangibles assets, over the acquisition consideration results in a bargain purchase gain. Prior to recording a gain, the acquiring entity must reassess whether all acquired assets and assumed liabilities have been identified and recognized and perform re-measurements to verify that the consideration paid, assets acquired and liabilities assumed have been properly valued.
PM Group and Columbia Tank results are included in the Company’s results from their respective dates of acquisition of January 15, 2015 and March 12, 2015.
Recently Adopted Accounting Guidance
Recently Issued Pronouncements – Not Adopted
In February 2016, the FASB issued ASU 2016-02, “Leases (Topic 842),” (“ASU 2016-02”), which requires lessees to recognize assets and liabilities for leases with lease terms of more than 12 months and disclose key information about leasing arrangements. Consistent with current U.S. GAAP, the recognition, measurement, and presentation of expenses and cash flows arising from a lease by a lessee primarily will depend on its classification as a finance or operating lease. The update is effective for reporting periods beginning after December 15, 2018. Early adoption is permitted. The Company is in the process of evaluating the impact of this update on its consolidated financial statements.
In January 2017, the FASB issued ASU 2017-04, “Intangibles - Goodwill and Other (Topic 350): Simplifying the Test for Goodwill Impairment,” (“ASU 2017-04”). ASU 2017-04 eliminates Step 2 from the goodwill impairment test. Instead, an entity should perform its annual, or interim, goodwill impairment test by comparing the fair value of a reporting unit with its carrying amount. An entity should recognize an impairment charge for the amount by which the carrying amount exceeds the reporting unit’s fair value, if any. The loss recognized should not exceed the total amount of goodwill allocated to that reporting unit. Additionally, an entity should consider income tax effects from any tax deductible goodwill on the carrying amount of the reporting unit when measuring the goodwill impairment. The effective date will be the first quarter of fiscal year 2020, with early adoption permitted in 2017. The Company is evaluating the impact that adoption of this new standard will have on its consolidated financial statements.
Recently Adopted Accounting Guidance
In May 2014, the FASB issued ASU 2014-09, “Revenue from Contracts with Customers,” (“ASU 2014-09”). ASU 2014-09 outlines a new, single comprehensive model for entities to use in accounting for revenue arising from contracts with customers and supersedes most current revenue recognition guidance, including industry-specific guidance. This new revenue recognition model provides a five-step analysis in determining when and how revenue is recognized. The new model will require revenue recognition to depict the transfer of promised goods or services to customers in an amount that reflects the consideration a company expects to receive in exchange for those goods or services. In August 2015, the FASB issued ASU 2015-14, “Deferral of the Effective Date”, which amends ASU 2014-09. As a result, the effective date is the first quarter of 2018, with early adoption permitted. The Company has adopted this guidance during the quarter ended March 31, 2018 on a modified retrospective basis. The adoption of this guidance did not have a significant impact on the operating results when adopted.
In July 2015, the FASB issued ASU 2015-11, “Simplifying the Measurement of Inventory,” (“ASU 2015-11”). ASU 2015-11 requires inventory be measured at the lower of cost and net realizable value and options that currently exist for market value be eliminated. ASU 2015-11 defines net realizable value as estimated selling prices in the ordinary course of business, less reasonably predictable costs of completion, disposal, and transportation. The guidance is effective for reporting periods beginning after December 15, 2016 and interim periods within those fiscal years with early adoption permitted. The Company has adopted this guidance during the quarter ended March 31, 2017 on a prospective basis. The adoption of this guidance did not have a significant impact on the operating results when adopted.
36
In January 2016, the FASB issued ASU 2016-01, "Financial Instruments-Overall (Subtopic 825-10): Recognition and Measurement of Financial Assets and Financial Liabilities." The amendments in ASU 2016-01, among other things, require equity investments (except those accounted for under the equity method of accounting, or those that result in consolidation of the investee) to be measured at fair value with changes in fair value recognized in net income; requires public business entities to use the exit price notion when measuring fair value of financial instruments for disclosure purposes; requires separate presentation of financial assets and financial liabilities by measurement category and form of financial asset (i.e., securities or loans and receivables); and eliminates the requirement for public business entities to disclose the method(s) and significant assumptions used to estimate fair value that is required to be disclosed for financial instruments measured at amortized cost. The effective date will be the first quarter of fiscal year 2018. The Company has adopted this guidance during the quarter ended March 31, 2018. The adoption of this guidance did not have a significant impact on the operating results when adopted.
In March 2016, the FASB issued ASU 2016-05, “Derivatives and Hedging (Topic 815)” (“ASU 2016-05”). ASU 2016-05 provides guidance clarifying that novation of a derivative contract (i.e. a change in counterparty) in a hedge accounting relationship does not, in and of itself, require designation of that hedge accounting relationship. The Company adopted this guidance during the quarter ended March 31, 2017. The adoption of this guidance did not have an impact on the operating results when adopted.
In March 2016, the FASB issued ASU 2016-06, “Derivatives and Hedging (Topic 815)” (“ASU 2016-06”). ASU 2016-06 simplifies the embedded derivative analysis for debt instruments containing contingent call or put options by clarifying that an exercise contingency does not need to be evaluated to determine whether it relates to interest rates and credit risk in an embedded derivative analysis. The effective date will be the first quarter of fiscal year 2017, with early adoption permitted. The Company has adopted this guidance during the quarter ended March 31, 2017. The adoption of this guidance did not have an impact on the operating results when adopted.
In March 2016, the FASB issued ASU 2016-08, “Revenue from Contracts with Customers (Topic 606) Principal versus Agent Considerations (Reporting Revenue Gross versus Net),” (“ASU 2016-08”). ASU 2016-08 further clarifies principal and agent relationships within ASU 2014-09. Similar to ASU 2014-09, the effective date will be the first quarter of fiscal year 2018 with early adoption permitted in the first quarter of fiscal year 2017. The Company has adopted this guidance during the quarter ended March 31, 2018 on a modified retrospective basis. The adoption of this guidance did not have a significant impact on the operating results when adopted.
In March 2016, the FASB issued ASU 2016-09, “Compensation-Stock Compensation (Topic 718), Improvements to Employee Share-Based Payment Accounting,” (“ASU 2016-09”). ASU 2016-09 is intended to simplify several aspects of accounting for share-based payment awards. The effective date will be the first quarter of fiscal year 2017, with early adoption permitted. The Company has adopted the guidance for the year ended December 31, 2017. The adoption of this guidance did not have an impact on the operating results when adopted.
In April 2016, the FASB issued ASU 2016-10, “Revenue from Contracts with Customers (Topic 606), Identifying Performance Obligations and Licensing” (“ASU 2016-10”). The amendments in ASU 2016-10 are expected to reduce the cost and complexity of applying the guidance on identifying promised goods or services in contracts with customers and to improve the operability and understandability of licensing implementation guidance related to the entity's intellectual property. Similar to ASU 2014-09, the effective date will be the first quarter of fiscal year 2018 with early adoption permitted in the first quarter of fiscal year 2017. The Company has adopted this guidance during the quarter ended March 31, 2018 on a modified retrospective basis. The adoption of this guidance did not have a significant impact on the operating results when adopted.
In August 2016, the FASB issued ASU 2016-15, “Statement of Cash Flows (Topic 230) Classification of Certain Cash Receipts and Cash Payments,” (“ASU 2016-15”). ASU 2016-15 reduces the existing diversity in practice in financial reporting by clarifying existing principles in ASC 230, “Statement of Cash Flows,” and provides specific guidance on certain cash flow classification issues. The effective date for ASU 2016-15 will be the first quarter of fiscal year 2018 with early adoption permitted. The Company made an election to use the “Cumulative Earning Approach” to classify distributions received from equity investments. Other than the aforementioned election (which may have a future impact), the adoption of this guidance during the quarter ended March 31, 2018, did not have an impact on the Company’s Statement of Cash Flows.
In October 2016, the FASB issued ASU 2016-16, “Income Taxes (Topic 740) - Intra-Entity Transfer of Assets Other than Inventory,” (“ASU 2016-16”). ASU 2016-16 requires recognition of current and deferred income taxes resulting from an intra-entity transfer of any asset (excluding inventory) when the transfer occurs. This is a change from existing GAAP which prohibits recognition of current and deferred income taxes until the asset is sold to a third party. The effective date for ASU 2016-16 will be the first quarter of fiscal year 2018 with early adoption permitted. The Company has adopted this guidance during the quarter ended March 31, 2018. The adoption of this guidance did not have a significant impact on the operating results when adopted.
37
In January 2017, the FASB issued ASU 2017-01, “Business Combinations (Topic 805): Clarifying the Definition of a Business,” (“ASU 2017-01”). ASU 2017-01 provides guidance in ascertaining whether a collection of assets and activities is considered a business. The effective date will be the first quarter of fiscal year 2018, with prospective application. The Company is evaluating the impact that adoption of this new standard will have on its consolidated financial statements. The Company has adopted this guidance during the quarter ended March 31, 2018. The adoption of this guidance did not have an impact on the operating results when adopted.
In May 2017, the FASB issued ASU 2017-09, “Compensation-Stock Compensation (Topic 718): Scope of Modification Accounting,” (“ASU 2017-09”). ASU 2017-09 clarifies when changes to the terms or conditions of a share-based payment award must be accounted for as modifications. The new guidance will reduce diversity in practice and result in fewer changes to the terms of an award being accounted for as modifications. Under ASU 2017-09, an entity will not apply modification accounting to a share-based payment award if the award’s fair value, vesting conditions and classification as an equity or liability instrument are the same immediately before and after the change. ASU 2017-09 will be applied prospectively to awards modified on or after the adoption date. The effective date will be the first quarter of fiscal year 2018 and early adoption is permitted. Adoption is not expected to have a material effect on the Company’s consolidated financial statements.
Except as noted above, the guidance issued by the FASB is not expected to have a material effect on the Company’s consolidated financial statements.
The Company is exposed to certain market risks that exist as part of our ongoing business operations and the Company’s use of derivative financial instruments, where appropriate, to manage our foreign change risks. As a matter of policy, the Company does not engage in trading or speculative transactions. For further information on accounting policies related to derivative financial instruments, refer to Note 6 - “Derivative Financial Instruments” in our Consolidated Financial Statements.
Foreign Exchange Risk
The Company is exposed to fluctuations in foreign currency cash flows related to third-party purchases and sales, intercompany product shipments and intercompany loans. The Company is also exposed to fluctuations in the value of foreign currency investments in subsidiaries and cash flows related to repatriation of these investments. Additionally, the Company is exposed to volatility in the translation of foreign currency earnings to U.S. Dollars. Primary exposures include the U.S. Dollar when compared to functional currencies of our major foreign subsidiaries, primarily the Euro. The Company assesses foreign currency risk based on transactional cash flows, identifies naturally offsetting positions and purchases hedging instruments to partially offset anticipated exposures. At December 31, 2017, the Company had no outstanding foreign currency exchange contracts being used to hedge future sale that would qualify as cash flow hedges. The Company, however, has foreign currency exchange contract to sell 1.5 billion Chilean pesos. This contract is intended to hedge an intercompany receivable that PM has from its Chilean subsidiary. This forward currency exchange contract has been determined not to be considered a hedge under ASC 815-10, as such aggregate changes in the translation effect of foreign currency exchange rate changes would have on our operating income. At December 31, 2017, the Company performed a sensitivity analysis on the effect that exchange rate changes would have on the Company. Based on this sensitivity analysis, we have determined that a change in the value of the U.S. dollar relative to currencies outside the U.S. by 10% to amounts already incorporated in the financial statements for the year ended December 31, 2017 would have $0.1 million impact on the translation effect of foreign currency exchange rate changes already included in our reported operating income for the period.
Interest Rate Risk
The Company is exposed to interest rate volatility with regard to future issuances of fixed rate debt and existing issuances of variable rate debt. Primary exposure includes movements in the U.S. prime rate and EURIBOR. At December 31, 2017, the Company had approximately $89.9 million of variable interest debt with average weighted average interest rate at year end of approximately 3.84%. The Company’s PM subsidiary had interest rate swaps on €0.3 million of its debt. The fair value of the interest rate swaps, which represents the cost to settle these arrangements at December 31, 2017 was approximately $0.01 million. At December 31, 2017, the Company performed a sensitivity analysis to determine the impact that an increase in interest rates would have. Based on this sensitivity analysis, the Company has determined that an increase of 10% in our average floating interest rates at December 31, 2017 would increase interest expense by approximately $0.3 million.
38
Commodities Risk
Principal materials and components that the Company uses in our various manufacturing processes include steel, castings, engines, tires, hydraulics, cylinders, drive trains, electric controls and motors, and a variety of other commodities and fabricated or manufactured items. Extreme movements in the cost and availability of these materials and components may affect the Company’s financial performance. Changes to input costs did not have a significant effect on the Company’s operating performance in 2017. During 2017, raw materials and components were generally available to meet our production schedules and had no significant impact on 2017 revenues.
In the absence of labor strikes or other unusual circumstances, substantially all materials and components are normally available from multiple suppliers. However, certain businesses receive materials and components from a single source supplier, although alternative suppliers of such materials may be generally available. Current and potential suppliers are evaluated on a regular basis on their ability to meet our requirements and standards. The Company actively manages our material supply sourcing, and may employ various methods to limit risk associated with commodity cost fluctuations and availability. The inability of suppliers, especially any single source suppliers for a particular business, to deliver materials and components promptly could result in production delays and increased costs to manufacture the Company’s products. To mitigate the impact of these risks, the Company continues to search for acceptable alternative supply sources and less expensive supply options on a regular basis, including improving the globalization.
The report of the Company’s independent registered public accounting firm and the Company’s Consolidated Financial Statements are filed pursuant to this Item 8 and are included in this report. See the Index to Financial Statements.
39
Index to Financial Statements
The financial statements of the registrant required to be included in Item 8 are listed below:
40
Report of Independent Registered Public Accounting Firm
To the Board of Directors and
Shareholders of Manitex International, Inc.
Opinion on the Financial Statements
We have audited the accompanying consolidated balance sheets of Manitex International, Inc. and Subsidiaries (the Company) as of December 31, 2017 and 2016, and the related consolidated statements of operations, comprehensive income (loss), shareholders’ equity, and cash flows for each of the years in the three-year period ended December 31, 2017, and the related notes (collectively referred to as the consolidated financial statements). In our opinion, the consolidated financial statements present fairly, in all material respects, the financial position of the Company as of December 31, 2017 and 2016, and the results of its operations and its cash flows for each of the years in the three-year period ended December 31, 2017, in conformity with accounting principles generally accepted in the United States of America.
We also have audited, in accordance with the standards of the Public Company Accounting Oversight Board (United States) (PCAOB), the Company’s internal control over financial reporting as of December 31, 2017, based on criteria established in Internal Control—Integrated Framework (2013) issued by the Committee of Sponsoring Organizations of the Treadway Commission (COSO), and our report dated April 10, 2018, expressed an adverse opinion.
Basis for Opinion
These consolidated financial statements are the responsibility of the Company’s management. Our responsibility is to express an opinion on the Company’s consolidated financial statements based on our audits. We are a public accounting firm registered with the PCAOB and are required to be independent with respect to the Company in accordance with the U.S. federal securities laws and the applicable rules and regulations of the Securities and Exchange Commission and the PCAOB.
We conducted our audits in accordance with the standards of the PCAOB. Those standards require that we plan and perform the audits to obtain reasonable assurance about whether the consolidated financial statements are free of material misstatement, whether due to error or fraud. Our audits included performing procedures to assess the risks of material misstatement of the consolidated financial statements, whether due to error or fraud, and performing procedures that respond to those risks. Such procedures included examining, on a test basis, evidence regarding the amounts and disclosures in the consolidated financial statements. Our audits also included evaluating the accounting principles used and significant estimates made by management, as well as evaluating the overall presentation of the consolidated financial statements. We believe that our audits provide a reasonable basis for our opinion.
We have served as the Company’s auditor since 2006.
|
/s/ UHY LLP |
|
UHY LLP |
|
|
|
Sterling Heights, Michigan |
|
April 10, 2018 |
41
REPORT OF INDEPENDENT REGISTERED PUBLIC ACCOUNTING FIRM
To the Board of Directors
and Shareholders of Manitex International, Inc.
Adverse Opinion on Internal Control over Financial Reporting
We have audited Manitex International, Inc. and Subsidiaries’ (the “Company’s”) internal control over financial reporting as of December 31, 2017, based on criteria established in Internal Control—Integrated Framework (2013) issued by the Committee of Sponsoring Organizations of the Treadway Commission (COSO). In our opinion, because of the effect of the material weaknesses described in the following paragraph on the achievement of the objectives of the control criteria, the Company has not maintained effective internal control over financial reporting as of December 31, 2017, based on criteria established in Internal Control—Integrated Framework (2013) issued by COSO.
A material weakness is a control deficiency, or a combination of deficiencies, in internal control over financial reporting, such that there is a reasonable possibility that a material misstatement of the Company’s annual or interim financial statements will not be prevented or detected on a timely basis. The following material weaknesses have been identified and included in management’s assessment: (1) inadequate review of new contracts, customers and vendors (2) inadequate entity-level controls (3) insufficient controls over revenue recognition and accounting for bill and hold transactions (4) inadequate policy for inventory reserves for excess and obsolete inventory and (5) insufficient communication regarding ethics and whistleblower policies. These material weaknesses were considered in determining the nature, timing, and extent of audit tests applied in our audit of the 2017 consolidated financial statements, and this report does not affect our report dated April 10, 2018, on those financial statements.
We also have audited, in accordance with the standards of the Public Company Accounting Oversight Board (United States) (PCAOB), the consolidated balance sheets and the related consolidated statements of operations, comprehensive income (loss), shareholders’ equity, and cash flows of the Company, and our report dated April 10, 2018, expressed an unqualified opinion.
Basis for Opinion
The Company’s management is responsible for maintaining effective internal control over financial reporting, and for its assessment of the effectiveness of internal control over financial reporting, included in the accompanying Management’s Report on Internal Control Over Financial Reporting. Our responsibility is to express an opinion on the Company’s internal control over financial reporting based on our audit. We are a public accounting firm registered with the PCAOB and are required to be independent with respect to the Company in accordance with the U.S. federal securities laws and the applicable rules and regulations of the Securities and Exchange Commission and the PCAOB.
We conducted our audit in accordance with the standards of the PCAOB. Those standards require that we plan and perform the audit to obtain reasonable assurance about whether effective internal control over financial reporting was maintained in all material respects. Our audit of internal control over financial reporting included obtaining an understanding of internal control over financial reporting, assessing the risk that a material weakness exists, and testing and evaluating the design and operating effectiveness of internal control based on the assessed risk. Our audit also included performing such other procedures as we considered necessary in the circumstances. We believe that our audit provides a reasonable basis for our opinion.
42
To the Board of Directors and
Shareholders of Manitex International, Inc.
Page Two
Definition and Limitations of Internal Control over Financial Reporting
A company’s internal control over financial reporting is a process designed to provide reasonable assurance regarding the reliability of financial reporting and the preparation of financial statements for external purposes in accordance with generally accepted accounting principles. A company’s internal control over financial reporting includes those policies and procedures that (1) pertain to the maintenance of records that, in reasonable detail, accurately and fairly reflect the transactions and dispositions of the assets of the company; (2) provide reasonable assurance that transactions are recorded as necessary to permit preparation of financial statements in accordance with generally accepted accounting principles, and that receipts and expenditures of the company are being made only in accordance with authorizations of management and directors of the company; and (3) provide reasonable assurance regarding prevention or timely detection of unauthorized acquisition, use, or disposition of the company’s assets that could have a material effect on the financial statements.
Because of its inherent limitations, internal control over financial reporting may not prevent or detect misstatements. Also, projections of any evaluation of effectiveness to future periods are subject to the risk that controls may become inadequate because of changes in conditions, or that the degree of compliance with the policies or procedures may deteriorate.
|
/s/ UHY LLP |
|
UHY LLP |
|
|
|
Sterling Heights, Michigan |
|
April 10, 2018 |
43
MANITEX INTERNATIONAL, INC.
(In thousands, except share and per share data)
|
|
|
As of December 31, |
|
|||||
|
|
|
2017 |
|
|
2016 |
|
||
|
ASSETS |
|
|
|
|
|
|
|
|
|
Current assets |
|
|
|
|
|
|
|
|
|
Cash |
|
$ |
5,014 |
|
|
$ |
4,541 |
|
|
Cash - restricted |
|
|
352 |
|
|
|
773 |
|
|
Trade receivables (net) |
|
|
46,633 |
|
|
|
32,982 |
|
|
Other receivables |
|
|
1,946 |
|
|
|
1,082 |
|
|
Inventory (net) |
|
|
54,360 |
|
|
|
69,487 |
|
|
Prepaid expense and other |
|
|
2,017 |
|
|
|
4,624 |
|
|
Current assets of discontinued operations |
|
|
— |
|
|
|
46,645 |
|
|
Total current assets |
|
|
110,322 |
|
|
|
160,134 |
|
|
Total fixed assets (net) |
|
|
22,038 |
|
|
|
21,839 |
|
|
Intangible assets (net) |
|
|
31,014 |
|
|
|
30,985 |
|
|
Goodwill |
|
|
43,569 |
|
|
|
39,669 |
|
|
Equity investment in ASV Holdings, Inc. |
|
|
14,931 |
|
|
|
— |
|
|
Other long-term assets |
|
|
1,475 |
|
|
|
1,605 |
|
|
Deferred tax asset |
|
|
1,839 |
|
|
|
545 |
|
|
Long-term assets of discontinued operations |
|
|
— |
|
|
|
72,177 |
|
|
Total assets |
|
$ |
225,188 |
|
|
$ |
326,954 |
|
|
LIABILITIES AND EQUITY |
|
|
|
|
|
|
|
|
|
Current liabilities |
|
|
|
|
|
|
|
|
|
Notes payable |
|
$ |
29,131 |
|
|
$ |
26,204 |
|
|
Current portion of capital lease obligations |
|
|
378 |
|
|
|
338 |
|
|
Accounts payable |
|
|
35,386 |
|
|
|
33,801 |
|
|
Accounts payable related parties |
|
|
1,331 |
|
|
|
2,098 |
|
|
Accrued expenses |
|
|
10,070 |
|
|
|
10,278 |
|
|
Other current liabilities |
|
|
3,132 |
|
|
|
2,150 |
|
|
Current liabilities of discontinued operations |
|
|
— |
|
|
|
23,631 |
|
|
Total current liabilities |
|
|
79,428 |
|
|
|
98,500 |
|
|
Long-term liabilities |
|
|
|
|
|
|
|
|
|
Revolving term credit facilities |
|
|
12,893 |
|
|
|
19,957 |
|
|
Notes payable |
|
|
26,656 |
|
|
|
32,832 |
|
|
Capital lease obligations |
|
|
5,483 |
|
|
|
6,004 |
|
|
Convertible note-related party (net) |
|
|
7,005 |
|
|
|
6,862 |
|
|
Convertible note (net) |
|
|
14,310 |
|
|
|
14,098 |
|
|
Deferred gain on sale of building |
|
|
969 |
|
|
|
1,058 |
|
|
Deferred tax liability |
|
|
3,384 |
|
|
|
3,242 |
|
|
Other long-term liabilities |
|
|
4,215 |
|
|
|
4,127 |
|
|
Long-term liabilities of discontinued operations |
|
|
— |
|
|
|
42,645 |
|
|
Total long-term liabilities |
|
|
74,915 |
|
|
|
130,825 |
|
|
Total liabilities |
|
|
154,343 |
|
|
|
229,325 |
|
|
Commitments and contingencies |
|
|
|
|
|
|
|
|
|
Equity |
|
|
|
|
|
|
|
|
|
Preferred Stock—Authorized 150,000 shares, no shares issued or outstanding at December 31, 2017 and December 31, 2016 |
|
|
— |
|
|
|
— |
|
|
Common Stock—no par value 25,000,000 shares authorized, 16,617,932 and 16,200,294 shares issued and outstanding at December 31, 2017 and December 31, 2016, respectively |
|
|
97,661 |
|
|
|
94,324 |
|
|
Paid in capital |
|
|
2,802 |
|
|
|
2,918 |
|
|
Retained deficit |
|
|
(28,583 |
) |
|
|
(20,505 |
) |
|
Accumulated other comprehensive loss |
|
|
(1,035 |
) |
|
|
(4,272 |
) |
|
Equity attributable to shareholders of Manitex International, Inc. |
|
|
70,845 |
|
|
|
72,465 |
|
|
Equity attributable to noncontrolling interest |
|
|
— |
|
|
|
25,164 |
|
|
Total equity |
|
|
70,845 |
|
|
|
97,629 |
|
|
Total liabilities and equity |
|
$ |
225,188 |
|
|
$ |
326,954 |
|
The accompanying notes are an integral part of these financial statements
44
CONSOLIDATED STATEMENTS OF OPERATIONS
(In thousands, except share and per share data)
|
|
|
|
|
|
|
|
|
|
|
|
|
|
|
|
|
For the years ended December 31, |
|
|||||||||
|
|
|
2017 |
|
|
2016 |
|
|
2015 |
|
|||
|
|
|
|
|
|
|
|
|
|
|
|
|
|
|
Net revenues |
|
$ |
213,112 |
|
|
$ |
173,197 |
|
|
$ |
202,747 |
|
|
Cost of sales |
|
|
176,266 |
|
|
$ |
143,260 |
|
|
$ |
160,752 |
|
|
Gross profit |
|
|
36,846 |
|
|
|
29,937 |
|
|
|
41,995 |
|
|
Operating expenses |
|
|
|
|
|
|
|
|
|
|
|
|
|
Research and development costs |
|
|
2,564 |
|
|
|
2,939 |
|
|
|
3,123 |
|
|
Selling, general and administrative expenses |
|
|
34,547 |
|
|
|
36,972 |
|
|
|
39,160 |
|
|
Total operating expenses |
|
|
37,111 |
|
|
|
39,911 |
|
|
|
42,283 |
|
|
Operating loss |
|
|
(265 |
) |
|
|
(9,974 |
) |
|
|
(288 |
) |
|
Other income (expense) |
|
|
|
|
|
|
|
|
|
|
|
|
|
Interest expense |
|
|
(6,498 |
) |
|
|
(6,390 |
) |
|
|
(6,441 |
) |
|
Interest expense related to write off of debt issuance costs |
|
|
— |
|
|
|
(1,439 |
) |
|
|
— |
|
|
Foreign currency transaction loss |
|
|
(1,149 |
) |
|
|
(1,115 |
) |
|
|
(293 |
) |
|
Other income (loss) |
|
|
367 |
|
|
|
915 |
|
|
|
(47 |
) |
|
Total other expense |
|
|
(7,280 |
) |
|
|
(8,029 |
) |
|
|
(6,781 |
) |
|
Loss before income taxes and loss in non-marketable equity interest from continuing operations |
|
|
(7,545 |
) |
|
|
(18,003 |
) |
|
|
(7,069 |
) |
|
Income tax benefit from continuing operations |
|
|
(118 |
) |
|
|
(566 |
) |
|
|
(1,943 |
) |
|
Income (loss) in equity investments, net of taxes |
|
|
360 |
|
|
|
(5,752 |
) |
|
|
(199 |
) |
|
Loss from continuing operations |
|
|
(7,067 |
) |
|
|
(23,189 |
) |
|
|
(5,325 |
) |
|
Discontinued operations: (Note 25) |
|
|
|
|
|
|
|
|
|
|
|
|
|
(Loss) income from operations of discontinued operations (including loss on disposal of $1,302, $14,418 and $2,142 in 2017, 2016 and 2015, respectively) |
|
|
(742 |
) |
|
|
(14,441 |
) |
|
|
476 |
|
|
Income tax (benefit) expense |
|
|
(5 |
) |
|
|
37 |
|
|
|
475 |
|
|
(Loss) income on discontinued operations |
|
|
(737 |
) |
|
|
(14,478 |
) |
|
|
1 |
|
|
Net loss |
|
|
(7,804 |
) |
|
|
(37,667 |
) |
|
|
(5,324 |
) |
|
(Loss) income attributable to noncontrolling interest |
|
|
(274 |
) |
|
|
574 |
|
|
|
(48 |
) |
|
Loss attributable to shareholders of Manitex International, Inc. |
|
$ |
(8,078 |
) |
|
$ |
(37,093 |
) |
|
$ |
(5,372 |
) |
|
Earnings (loss) Per Share |
|
|
|
|
|
|
|
|
|
|
|
|
|
Basic |
|
|
|
|
|
|
|
|
|
|
|
|
|
Loss from continuing operations attributable to shareholders of Manitex International, Inc. |
|
$ |
(0.43 |
) |
|
$ |
(1.44 |
) |
|
$ |
(0.33 |
) |
|
Loss from discontinued operations attributable to shareholders of Manitex International, Inc. |
|
$ |
(0.06 |
) |
|
$ |
(0.86 |
) |
|
$ |
— |
|
|
Loss attributable to shareholders of Manitex International, Inc. |
|
$ |
(0.49 |
) |
|
$ |
(2.30 |
) |
|
$ |
(0.34 |
) |
|
Diluted |
|
|
|
|
|
|
|
|
|
|
|
|
|
Loss from continuing operations attributable to shareholders of Manitex International, Inc. |
|
$ |
(0.43 |
) |
|
$ |
(1.44 |
) |
|
$ |
(0.33 |
) |
|
Loss from discontinued operations attributable to shareholders of Manitex International, Inc. |
|
$ |
(0.06 |
) |
|
$ |
(0.86 |
) |
|
$ |
— |
|
|
Loss attributable to shareholders of Manitex International, Inc. |
|
$ |
(0.49 |
) |
|
$ |
(2.30 |
) |
|
$ |
(0.34 |
) |
|
Weighted average common shares outstanding |
|
|
|
|
|
|
|
|
|
|
|
|
|
Basic |
|
|
16,548,444 |
|
|
|
16,133,284 |
|
|
|
15,970,074 |
|
|
Diluted |
|
|
16,548,444 |
|
|
|
16,133,284 |
|
|
|
15,970,074 |
|
The accompanying notes are an integral part of these financial statements
45
MANITEX INTERNATIONAL, INC.
CONSOLIDATED STATEMENTS OF COMPREHENSIVE INCOME (LOSS)
(In thousands)
|
|
|
For the Year Ended December 31, |
|
|||||||||
|
|
|
2017 |
|
|
2016 |
|
|
2015 |
|
|||
|
Net loss: |
|
$ |
(7,804 |
) |
|
$ |
(37,667 |
) |
|
$ |
(5,324 |
) |
|
Other comprehensive income (loss) |
|
|
|
|
|
|
|
|
|
|
|
|
|
Foreign currency translation adjustments |
|
|
3,237 |
|
|
|
1,120 |
|
|
|
(4,369 |
) |
|
Total other comprehensive income (loss) |
|
|
3,237 |
|
|
|
1,120 |
|
|
|
(4,369 |
) |
|
Comprehensive loss |
|
|
(4,567 |
) |
|
|
(36,547 |
) |
|
|
(9,693 |
) |
|
Comprehensive (income) loss attributable to noncontrolling interest |
|
|
(274 |
) |
|
|
574 |
|
|
|
(48 |
) |
|
Total comprehensive loss attributable to shareholders of Manitex International, Inc. |
|
$ |
(4,841 |
) |
|
$ |
(35,973 |
) |
|
$ |
(9,741 |
) |
The accompanying notes are an integral part of these financial statements
46
MANITEX INTERNATIONAL, INC.
CONSOLIDATED STATEMENT OF SHAREHOLDERS’ EQUITY
(In thousands, except per share data)
|
|
|
For the years ended December 31, |
|
|||||||||
|
|
|
2017 |
|
|
2016 |
|
|
2015 |
|
|||
|
Number of common shares outstanding |
|
|
|
|
|
|
|
|
|
|
|
|
|
Balance at beginning of the year |
|
|
16,200,294 |
|
|
|
16,072,100 |
|
|
|
14,989,694 |
|
|
Employee 2004 incentive plan grant |
|
|
124,151 |
|
|
|
68,876 |
|
|
|
100,441 |
|
|
Repurchase to satisfy withholding and cancelled |
|
|
(22,820 |
) |
|
|
(13,055 |
) |
|
|
(12,518 |
) |
|
Shares issued under ATM program |
|
|
294,524 |
|
|
|
— |
|
|
|
— |
|
|
Stock issued in connection with asset purchase (see Note 19) |
|
|
21,783 |
|
|
|
— |
|
|
|
994,483 |
|
|
Shares issued to pay rent |
|
|
— |
|
|
|
41,948 |
|
|
|
— |
|
|
Shares issued to repay debt |
|
|
— |
|
|
|
30,425 |
|
|
|
— |
|
|
Balance end of year |
|
|
16,617,932 |
|
|
|
16,200,294 |
|
|
|
16,072,100 |
|
|
Common Stock |
|
|
|
|
|
|
|
|
|
|
|
|
|
Balance at beginning of the year |
|
$ |
94,324 |
|
|
$ |
93,186 |
|
|
$ |
82,040 |
|
|
Employee 2004 incentive plan grant |
|
|
925 |
|
|
|
841 |
|
|
|
1,097 |
|
|
Repurchase to satisfy withholding and cancelled |
|
|
(168 |
) |
|
|
(80 |
) |
|
|
(75 |
) |
|
Shares issued under ATM program |
|
|
2,426 |
|
|
|
— |
|
|
|
— |
|
|
Stock issued in connection with asset purchase (see Note 19) |
|
|
— |
|
|
|
— |
|
|
|
10,124 |
|
|
Shares issued to pay rent |
|
|
154 |
|
|
|
227 |
|
|
|
— |
|
|
Shares issued to repay debt |
|
|
— |
|
|
|
150 |
|
|
|
— |
|
|
Balance end of year |
|
$ |
97,661 |
|
|
$ |
94,324 |
|
|
$ |
93,186 |
|
|
Paid in Capital |
|
|
|
|
|
|
|
|
|
|
|
|
|
Balance at beginning of the year |
|
$ |
2,918 |
|
|
$ |
2,630 |
|
|
$ |
1,789 |
|
|
Equity component of Convertible debt issuance |
|
|
— |
|
|
|
— |
|
|
|
457 |
|
|
Proportional share of increase in equity investments' paid in capital |
|
|
11 |
|
|
|
— |
|
|
|
— |
|
|
Employee 2004 incentive plan grant |
|
|
(127 |
) |
|
|
288 |
|
|
|
384 |
|
|
Balance end of year |
|
$ |
2,802 |
|
|
$ |
2,918 |
|
|
$ |
2,630 |
|
|
Retained Earnings |
|
|
|
|
|
|
|
|
|
|
|
|
|
Balance (deficit) at beginning of the year |
|
$ |
(20,505 |
) |
|
$ |
16,588 |
|
|
$ |
21,960 |
|
|
Net loss attributable to shareholders of Manitex International, Inc. |
|
|
(8,078 |
) |
|
|
(37,093 |
) |
|
|
(5,372 |
) |
|
Balance (deficit) end of year |
|
$ |
(28,583 |
) |
|
$ |
(20,505 |
) |
|
$ |
16,588 |
|
|
Accumulated Other Comprehensive Loss |
|
|
|
|
|
|
|
|
|
|
|
|
|
Balance (deficit) at beginning of the year |
|
$ |
(4,272 |
) |
|
$ |
(5,392 |
) |
|
$ |
(1,023 |
) |
|
Gain (loss) on foreign currency translation |
|
|
3,237 |
|
|
|
1,120 |
|
|
|
(4,369 |
) |
|
Balance (deficit) end of year |
|
$ |
(1,035 |
) |
|
$ |
(4,272 |
) |
|
$ |
(5,392 |
) |
|
Equity Attributable to Noncontrolling Interest |
|
|
|
|
|
|
|
|
|
|
|
|
|
Balance at beginning of the year |
|
$ |
25,164 |
|
|
$ |
23,288 |
|
|
$ |
23,240 |
|
|
Investment received from noncontrolling interest |
|
|
— |
|
|
|
2,450 |
|
|
|
— |
|
|
Deconsolidation of ASV |
|
|
(24,890 |
) |
|
|
— |
|
|
|
— |
|
|
Net (loss) income attributable to noncontrolling interest |
|
|
(274 |
) |
|
|
(574 |
) |
|
|
48 |
|
|
Balance end of year |
|
$ |
— |
|
|
$ |
25,164 |
|
|
$ |
23,288 |
|
The accompanying notes are an integral part of these financial statements
47
MANITEX INTERNATIONAL, INC.
CONSOLIDATED STATEMENT OF CASH FLOWS
(In thousands)
|
|
|
For the years ended December 31, |
|
|||||||||
|
|
|
2017 |
|
|
2016 |
|
|
2015 |
|
|||
|
Cash flows from operating activities: |
|
|
|
|
|
|
|
|
|
|
|
|
|
Net loss |
|
$ |
(7,804 |
) |
|
$ |
(37,667 |
) |
|
$ |
(5,324 |
) |
|
Adjustments to reconcile net income to cash (used) provide by for operating activities: |
|
|
|
|
|
|
|
|
|
|
|
|
|
Depreciation and amortization |
|
|
5,107 |
|
|
|
6,636 |
|
|
|
6,946 |
|
|
Changes in allowances for doubtful accounts |
|
|
20 |
|
|
|
(225 |
) |
|
|
(1 |
) |
|
Loss (gain) on disposal of assets |
|
|
90 |
|
|
|
18 |
|
|
|
(136 |
) |
|
Changes in inventory reserves |
|
|
1,089 |
|
|
|
333 |
|
|
|
482 |
|
|
Deferred income taxes |
|
|
(1,509 |
) |
|
|
1,178 |
|
|
|
(2,074 |
) |
|
Amortization of deferred financing cost |
|
|
632 |
|
|
|
1,978 |
|
|
|
669 |
|
|
Revaluation of contingent acquisition liability |
|
|
(346 |
) |
|
|
(915 |
) |
|
|
— |
|
|
Write down of goodwill |
|
|
— |
|
|
|
275 |
|
|
|
— |
|
|
Amortization of debt discount |
|
|
446 |
|
|
|
528 |
|
|
|
743 |
|
|
Change in value of interest rate swaps |
|
|
(428 |
) |
|
|
(776 |
) |
|
|
(706 |
) |
|
Income (loss ) in equity investments |
|
|
(360 |
) |
|
|
5,752 |
|
|
|
199 |
|
|
Share-based compensation |
|
|
798 |
|
|
|
1,129 |
|
|
|
1,481 |
|
|
Deferred gain on sale and lease back |
|
|
(9 |
) |
|
|
(124 |
) |
|
|
301 |
|
|
Reserves for uncertain tax provisions |
|
|
49 |
|
|
|
54 |
|
|
|
60 |
|
|
Loss on sale of discontinued operations |
|
|
1,290 |
|
|
|
14,458 |
|
|
|
1,375 |
|
|
Rent paid in stock |
|
|
154 |
|
|
|
227 |
|
|
|
— |
|
|
Changes in operating assets and liabilities: |
|
|
|
|
|
|
|
|
|
|
|
|
|
(Increase) decrease in accounts receivable |
|
|
(11,130 |
) |
|
|
1,607 |
|
|
|
14,872 |
|
|
(Increase) decrease in inventory |
|
|
17,068 |
|
|
|
(3,828 |
) |
|
|
(6,279 |
) |
|
(Increase) decrease in prepaid expenses |
|
|
2,641 |
|
|
|
(345 |
) |
|
|
(3,223 |
) |
|
(Increase) decrease in other assets |
|
|
99 |
|
|
|
189 |
|
|
|
111 |
|
|
Increase (decrease) in accounts payable |
|
|
(2,619 |
) |
|
|
(4,475 |
) |
|
|
5,713 |
|
|
Increase (decrease) in accrued expense |
|
|
(412 |
) |
|
|
(1,165 |
) |
|
|
(875 |
) |
|
Increase (decrease) in other current liabilities |
|
|
679 |
|
|
|
171 |
|
|
|
(658 |
) |
|
Increase (decrease) in other long-term liabilities |
|
|
24 |
|
|
|
172 |
|
|
|
(65 |
) |
|
Discontinued operations - cash provided by (used for) operating activities |
|
|
3,508 |
|
|
|
(3,824 |
) |
|
|
(7,239 |
) |
|
Net cash provided by (used for) operating activities |
|
|
9,077 |
|
|
|
(18,639 |
) |
|
|
6,372 |
|
|
|
|
|
|
|
|
|
|
|
|
|
|
|
|
Cash flows from investing activities: |
|
|
|
|
|
|
|
|
|
|
|
|
|
|
|
|
|
|
|
|
|
|
|
|
|
|
|
Acquisition of businesses, net of cash acquired |
|
|
— |
|
|
|
— |
|
|
|
(13,747 |
) |
|
Proceeds from the sale of fixed assets |
|
|
15 |
|
|
|
206 |
|
|
|
518 |
|
|
Purchase of property and equipment |
|
|
(1,023 |
) |
|
|
(1,157 |
) |
|
|
(2,011 |
) |
|
Investment in intangibles other than goodwill |
|
|
(65 |
) |
|
|
(97 |
) |
|
|
(233 |
) |
|
Proceeds from the sale of discontinued operations |
|
|
12,892 |
|
|
|
19,074 |
|
|
|
6,525 |
|
|
Discontinued operations - cash provided by (used for) investing activities |
|
|
(84 |
) |
|
|
417 |
|
|
|
(454 |
) |
|
Net cash provided by (used for) investing activities |
|
|
11,735 |
|
|
|
18,443 |
|
|
|
(9,402 |
) |
|
Cash flows from financing activities: |
|
|
|
|
|
|
|
|
|
|
|
|
|
Borrowings on 2015 term loan |
|
|
— |
|
|
|
— |
|
|
|
14,000 |
|
|
Repayment of 2015 term loan |
|
|
— |
|
|
|
(2,200 |
) |
|
|
(11,800 |
) |
|
Net proceeds from stock offering |
|
|
2,426 |
|
|
|
— |
|
|
|
— |
|
|
New borrowings—convertible notes |
|
|
— |
|
|
|
— |
|
|
|
15,000 |
|
|
(Payments) Borrowing on revolving term credit facilities |
|
|
(7,064 |
) |
|
|
(6,543 |
) |
|
|
(7,718 |
) |
|
Net borrowings (repayments) on working capital facilities |
|
|
3,397 |
|
|
|
1,828 |
|
|
|
(4,274 |
) |
|
New borrowings—except 2015 term loan |
|
|
2,600 |
|
|
|
12,892 |
|
|
|
2,446 |
|
|
Note payments |
|
|
(16,465 |
) |
|
|
(6,678 |
) |
|
|
(6,119 |
) |
|
Bank fees and cost related to new financing |
|
|
(50 |
) |
|
|
(1,255 |
) |
|
|
(1,274 |
) |
|
Shares repurchased for income tax withholding on share-based compensation |
|
|
(168 |
) |
|
|
(80 |
) |
|
|
(75 |
) |
|
Proceeds from sale and leaseback |
|
|
896 |
|
|
|
4,080 |
|
|
|
— |
|
|
Payments on capital lease obligations |
|
|
(1,381 |
) |
|
|
(510 |
) |
|
|
(1,446 |
) |
|
Discontinued operations - cash provided by (used for) financing activities |
|
|
(5,058 |
) |
|
|
(4,941 |
) |
|
|
7,200 |
|
|
Net cash provided by (used for) financing activities |
|
|
(20,867 |
) |
|
|
(3,407 |
) |
|
|
5,940 |
|
|
Net (decrease) increase in cash and cash equivalents |
|
|
(55 |
) |
|
|
(3,603 |
) |
|
|
2,910 |
|
|
Effect of exchange rate changes on cash |
|
|
107 |
|
|
|
2,999 |
|
|
|
(1,360 |
) |
|
Cash and cash equivalents at the beginning of the year |
|
|
5,314 |
|
|
|
5,918 |
|
|
|
4,368 |
|
|
Cash and cash equivalents at end of period |
|
$ |
5,366 |
|
|
$ |
5,314 |
|
|
$ |
5,918 |
|
(See Note 15 for other supplemental cash flow information)
The accompanying notes are an integral part of these financial statements
48
MANITEX INTERNATIONAL INC.
NOTES TO CONSOLIDATED FINANCIAL STATEMENTS
(In thousands, except per share data)
Note 1. Nature of Operations
The Company is a leading provider of engineered lifting solutions. The Company operates in a single business segment.
The Company designs, manufactures and distributes a diverse group of products that serve different functions and are used in a variety of industries. Through its Manitex, Inc. (“Manitex”) subsidiary it markets a comprehensive line of boom trucks, truck cranes and sign cranes. Manitex’s boom trucks and crane products are primarily used for industrial projects, energy exploration and infrastructure development, including, roads, bridges and commercial construction. Badger Equipment Company (“Badger”) is a manufacturer of specialized rough terrain cranes and material handling products. Badger primarily serves the needs of the construction, municipality and railroad industries.
PM Group S.p.A. (“PM”) is a leading Italian manufacturer of truck mounted hydraulic knuckle boom cranes with a 50-year history of technology and innovation, and a product range spanning more than 50 models. Its largest subsidiary, Oil & Steel (“O&S”), is a manufacturer of truck-mounted aerial platforms with a diverse product line and an international client base.
Our Valla product line of industrial cranes is a full range of precision pick and carry cranes using electric, diesel, and hybrid power options. Its cranes offer wheeled or tracked, and fixed or swing boom configurations, with special applications designed specifically to meet the needs of its customers. The product is sold internationally through dealers and into the rental distribution channel.
Sabre Manufacturing, LLC, (“Sabre”) which is located in Knox, Indiana. Sabre manufactures a comprehensive line of specialized mobile tanks for liquid and solid storage and containment solutions with capacities from 8,000 to 21,000 gallons. Its mobile tanks are sold to specialized independent tank rental companies and through the Company’s existing dealer network. The tanks are used in a variety of end markets such as petrochemical, waste management and oil and gas drilling.
Crane and Machinery, Inc. (“C&M”) is a distributor of the Company’s products as well as Terex’s rough terrain and truck cranes.
Crane and Machinery Leasing, Inc. (“C&M Leasing”) rents equipment manufactured by the Company as well limited amount of equipment manufactured by third parties. Although C&M is a distributor of Terex rough terrain and truck cranes; C&M’s primary business is the distribution of products manufactured by the Company. C&M Leasing’s primary business is the facilitation of sales of products manufactured by the Company through its rent to own program. As C&M and C&M Leasing’s primary business is the facilitation of Company manufactured product sales, discrete financial information is not available.
Change in Reporting Segments
In its Annual Report on Form 10-K filed on March 10, 2017, the Company reported its operations in three segments: the Lifting Equipment segment, the ASV segment and the Equipment Distribution segment. Since 2015, the Company has sought to redefine itself strategically and operationally, including through a series of divestitures. ASV Holdings is reported as a discontinued operation and as such is no longer a reporting segment.
As stated above C&M and C&M Leasing primary business is facilitation of sale of products manufactured by the Company. Further, the Company’s Chief Operating Decision Maker (“CODM”) reviews C&M and C&M Leasing operations only to determine their impact on the entire Company. As such, the Company has now concluded that it is not appropriate to reflect C&M and C&M Leasing as a separate reportable segment.
Consolidated Variable Interest Entity
Even though it has no ownership interest in SVW Crane & Equipment Company (together with its wholly owned subsidiary, Rental Consulting Service Company, “SVW”), the Company has the power to direct the activities that most significantly impact SVW’s economic performance. Additionally, the Company was the primary beneficiary of the SVW relationship. SVW obtained third party financing, which was effectively guaranteed by the Company, on specific cranes the Company manufactured and remitted the loan proceeds to the Company. Other than its business transactions described herein, SVW had no other substantial business operations. The Company has determined that SVW is a Variable Interest Entity (“VIE”) that under current accounting guidance needs to consolidate in the Company’s financial results.
49
Discontinued Operations
ASV is located in Grand Rapids, Minnesota manufactures a line of high quality compact track and skid steer loaders. The products are used in site clearing, general construction, forestry, golf course maintenance and landscaping industries, with general construction being the largest. ASV’s financial results are included in the Company’s consolidated results beginning on December 20, 2014.
Prior to the quarter ended June 30, 2017, the Company owned a 51% interest in ASV Holdings, Inc., which was formerly known as A.S.V., LLC (“ASV Holdings”). On May 11, 2017, in anticipation of an initial public offering, ASV Holdings converted from an LLC to a C-Corporation and the Company’s 51% interest was converted to 4,080,000 common shares of ASV Holdings. On May 17, 2017, in connection within its initial public offering, ASV Holdings sold 1,800,000 of its own shares and the Company sold 2,000,000 shares of ASV Holdings common stock. At December 31, 2017, the Company held a 21.2% interest in ASV Holdings, but no longer has a controlling interest in ASV Holdings. ASV Holdings was deconsolidated during the quarter ended June 30, 2017 and is recorded as an equity investment starting with quarter ended June 30, 2017. Financial information (related to periods before June 2017) included in this 10-K reflect ASV Holdings as a discontinued operation.
CVS Ferrari, srl (“CVS”) designed and manufactured a range of reach stackers and associated lifting equipment for the global container handling market. CVS was sold on December 22, 2016 and is presented as a discontinued operation.
Manitex Liftking ULC (“Manitex Liftking” or “Liftking”) sold a complete line of rough terrain forklifts, a line of stand-up electric forklifts, cushioned tiered forklifts with lifting capacities from 18 thousand to 40 thousand pounds and special mission oriented vehicles, as well as other specialized carriers, heavy material handling transporters and steel mill equipment. Liftking was sold on September 30, 2016, and is presented as a discontinued operation.
Manitex Load King, LLC (“Load King”) manufactured specialized custom trailers and hauling systems typically used for transporting heavy equipment. Load King trailers served niche markets in the commercial construction, railroad, military and equipment rental industries through a dealer network. Load King was sold on December 28, 2015 and is presented as a discontinued operation.
Note 2. Basis of Presentation
The consolidated financial statements, included herein, have been prepared by the Company pursuant to the rules and regulations of the United States Securities and Exchange Commission. Pursuant to these rules and regulations, the financial statements are prepared in accordance with accounting principles generally accepted in the United States of America. ASV, PM and Columbia Tank have been included in the Company’s financial results from their respective effective date of acquisition which are December 20, 2014, January 15, 2015 and March 12, 2015, respectively. The Company owned 25% of Lift Ventures LLC (“Lift Ventures”) and accounted for it as an unconsolidated equity investment. The investment was determined to be completely impaired in 2016 and a charge of $5,647 shown on the Statement of Operations line titled “equity investments, net of tax” was taken to write the investment down to zero. See Note 26, Impairment of Lift Venture Investment, for additional details. The financial statements for all periods presented classify Load King, Liftking, CVS and ASV as discontinued operations.
Financial statements are presented in thousands of dollars except for per share amounts.
Note 3. Summary of Significant Accounting Policies
The summary of significant accounting policies of Manitex International, Inc. is presented to assist in understanding the Company’s financial statements. The financial statements and notes are representations of the Company’s management who is responsible for their integrity and objectivity. These accounting policies conform to generally accepted accounting principles and have been consistently applied in the preparation of the financial statements.
Principals of Consolidation—The Company consolidates all entities that we control by ownership of a majority voting interest. Additionally, there are situations in which consolidation is required even though the usual condition of consolidation (ownership of a majority voting interest) does not apply. Generally, this occurs when an entity holds an interest in another business enterprise that was achieved through arrangements that do not involve voting interests, which results in a disproportionate relationship between such entity's voting interests in, and its exposure to the economic risks and potential rewards of, the other business enterprise. This disproportionate relationship results in what is known as a variable interest, and the entity in which we have this interest is referred to as a Variable Interest Entity (“VIE”). An enterprise must consolidate a VIE if it is determined to be the primary beneficiary of the VIE. The primary beneficiary has both (1) the power to direct the activities of the VIE that most significantly impact the entity's economic performance, and (2) the obligation to absorb losses or the right to receive benefits from the VIE that could potentially be significant to the VIE.
50
Although the Company does not have an ownership interest in S.V.W. Equipment Crane Company and its wholly owned subsidiary Rental Consulting Services Corporation (collectively “SVW”), the Company has the power to direct the activities of SVW that most significantly impact its economic performance and is absorbing the losses. As such, the Company has determined that SVW is a VIE that requires consolidation. SVW has obtained financing and has remitted the proceeds to the Company using inventory (cranes) owned by the Company as collateral. The finance companies that hold the loans have a perfected security interest in the inventory and therefore have recourse against this specific inventory. Furthermore, the debt taken on by the SVW was effectively guaranteed by the Company pursuant to certain related agreements.
Income and losses related to VIE’s are typically shown in a company’s financial statements as being attributed to a non-controlling interest. Other than its transactions between SVW and the Company, SVW had no other substantial business operations. Furthermore, the Company exercised control and absorbed all losses and received all the income from SVW operations. Therefore, the Company has concluded that income and losses related to the VIE are attributable to the Shareholders of the Company.
The Company eliminates from the Company’s financial results all significant intercompany transactions, including the intercompany transactions with consolidated VIEs.
Cash and Cash Equivalents —For purposes of the statement of cash flows, the Company considers all short-term securities purchased with maturity dates of three months or less to be cash equivalents.
Restricted Cash—Certain of the Company’s lending arrangements require the Company to post collateral or maintain minimum cash balances in escrow. These cash amounts are reported as current assets on the balance sheets based on when the cash will be contractually released. Total restricted cash was $352 and $773 at December 31, 2017 and 2016, respectively.
Revenue Recognition —Revenue and related costs are recognized when title passes and risk of loss pass to our customers which generally occurs upon shipment depending upon the terms of the contract. Under certain contracts with our customers title passes to the customers when the units are completed. The units are segregated from our inventory and identified as belonging to the customer, the customer is notified that the units are complete and awaiting pick up or delivery as specified by the customer before income is recognized. Additionally, the customer is requested to sign an “Invoice Authorization Form” which acknowledges the contract terms and acknowledges that the customer has economic ownership and control over the unit. It also acknowledges that we are going to invoice the unit per terms of the contract. The Company insures any custodial risk that it may retain.
For FOB contracts, customers may be invoiced prior to the time customers take physical possession. Revenue is recognized in such cases only when the customer has a fixed commitment to purchase the units, the units have been completed, tested and made available to the customer for pickup or delivery, and the customer has authorized in writing that we hold the units for pickup or delivery at a time specified by the customer. In such cases, the units are invoiced under our customary billing terms, title to the units and risks of ownership pass to the customer upon invoicing, the units are segregated from our inventory and identified as belonging to the customer and we have no further obligations under the order. The Company insures any custodial risk that it may retain.
In addition, our policy requires in all instances certain minimum criteria be met in order to recognize revenue, specifically:
|
a) |
Persuasive evidence that an arrangement exists; |
|
b) |
The price to the buyer is fixed or determinable; |
|
c) |
Collectability is reasonably assured; and |
|
d) |
We have no significant obligations for future performance. |
Investment—Equity Method of Accounting —Our non-marketable equity investments are investments we have made in privately-held companies accounted for under the equity method. We periodically review our non-marketable equity investments for impairment. In September 2016, the Company determined its investment in Lift Ventures was impaired and has recognized an impairment charge to write off its entire investment in Lift Ventures (See Note 26). There was no impairment related to this investment in prior periods.
Allowance for Doubtful Accounts —Accounts receivable are stated at the amounts the Company’s customers are invoiced and do not bear interest. The Company has adopted a policy consistent with U.S. GAAP for the periodic review of its accounts receivable to determine whether the establishment of an allowance for doubtful accounts is warranted based on the Company’s assessment of the collectability of the accounts. The Company established an allowance for bad debt of $82 and $7 at December 31, 2017 and 2016, respectively. The Company also has in some instances a security interest in its accounts receivable until payment is received.
51
Guarantees — The Company has issued partial residual guarantees to financial institutions related to a customer financing of equipment purchases by the customer. The Company must assess the probability of losses if the fair market value is less than the guaranteed residual value.
A residual value guarantee involves a guarantee that a piece of equipment will have a minimum fair market value at a future date. The Company will record a liability for the estimated fair value of guarantees issued pursuant to Financial Accounting Standards Board (“FASB”) Accounting Standards Codification (“ASC”) 460, “Guarantees” (“ASC 460”). We recognize a loss under a guarantee when the obligation to make payment under the guarantee is probable and the amount of the loss can be estimated. If the expected equipment value is less than its guaranteed residual value, the Company would recognize a liability for the amount of the short-fall up to the amount of its partial guarantee. The Company is not responsible for any short-fall in excess of its partial guarantee.
Property, Equipment and Depreciation —Property and equipment are stated at cost or the fair market value at date of acquisition for property and equipment acquired in connection with the acquisition of a company. Depreciation of property and equipment is provided over the following useful lives:
|
Asset Category |
|
Depreciable Life |
|
Buildings |
|
12 –33 years |
|
Machinery and equipment |
|
3 – 15 years |
|
Furniture and fixtures |
|
3 – 7 years |
|
Leasehold improvements |
|
1 – 33 years |
Expenditures for major renewals and betterments that extend the useful lives of property and equipment are capitalized. Expenditures for maintenance and repairs are charged to expense as incurred. Depreciation expense for the years ended December 31, 2017, 2016 and 2015 was $2,380, $2,846 and $2,694, respectively.
Other Intangible Assets —The Company accounts for Other Intangible Assets under the guidance of ASC 350, “Intangibles—Goodwill and Other”. The Company capitalizes certain costs related to patent technology. Additionally, a substantial portion of the purchase price related to the Company’s acquisitions has been assigned to patents or unpatented technology, trade name, customer backlog, and customer relationships. Under the guidance, Other Intangible Assets with definite lives are amortized over their estimated useful lives. Intangible assets with indefinite lives are tested annually for impairment.
Goodwill — Goodwill, representing the difference between the total purchase price and the fair value of assets (tangible and intangible) and liabilities at the date of acquisition, is reviewed for impairment annually, and more frequently as circumstances warrant, and written down only in the period in which the recorded value of such assets exceed their fair value. The Company does not amortize goodwill in accordance with Financial Accounting Standards Board (the “FASB”) Accounting Standards Codification (“ASC”) 350, “Intangibles—Goodwill and Other” (“ASC 350”). The Company selected October 1 as the date for the required annual impairment test.
Goodwill is tested for impairment at reporting unit level (reporting segment). For 2017, this is at the fully consolidated level excluding discontinued operations, as the Company now operates in a single business segment. For 2016 as well as for 2015 Goodwill was tested at the three previously reported segment levels that were in effect at that time, i.e., Lifting Equipment, Equipment Distribution and ASV. The Company’s Chief Operating Decision Maker (“CODM”) reviews C&M and C&M Leasing operations only to determine their impact on the entire Company. As such, the Company has now concluded that it is not appropriate to reflect C&M and C&M Leasing as a separate reportable segment.
Under ASU 2011-08, entities are provided with the option of first performing a qualitative assessment on none, some, or all of its reporting units to determine whether it is more likely than not that the fair value of a reporting unit is less than its carrying value. If after completing a qualitative analysis, it is determined that it is more likely than not that the fair value of a reporting unit is less than its carrying value a quantitative analysis is required.
For 2017, 2016, 2015 the Company evaluated its consolidated goodwill using the quantitative two step approach. The first step used to identify potential impairment involves comparing the reporting unit’s estimated fair value to its carrying value, including goodwill. During the first step testing, the Company evaluates goodwill for impairment using a business valuation method, which is calculated as of a measurement date by determining the present value of debt-free, after-tax projected future cash flows, discounted at the weighted average cost of capital of a historical third-party buyer. The market approach was also considered in evaluating the potential for impairment by calculating fair value based on multiples of earnings before interest, taxes, depreciation and amortization (EBITDA) of comparable, publicly traded companies. The Company also observed implied EBITDA multiples from relatively recent merger and acquisition activity in the industry, which was used to test the reasonableness of the results.
52
The second step of the process involves the calculation of an implied fair value of goodwill for each reporting unit for which step one indicated impairment. The implied fair value of goodwill is determined by measuring the excess of the estimated fair value of the reporting unit over the estimated fair values of the individual assets, liabilities and identifiable intangibles as if the reporting unit was being acquired in a business combination. If the implied fair value of goodwill exceeds the carrying value of goodwill assigned to the reporting unit, there is no impairment. If the carrying value of goodwill assigned to a reporting unit exceeds the implied fair value of the goodwill, an impairment charge is recorded for the excess. An impairment loss cannot exceed the carrying value of goodwill assigned to a reporting unit and the subsequent reversal of goodwill impairment losses is not permitted.
For 2017 and 2015, the first step did not indicate any impairment of goodwill, For 2016, the second step was necessary for the Equipment Distribution segment. This further analysis indicated that the Equipment Distribution segment goodwill was impaired and a $275 impairment charge was recognized in 2016 to fully write off the Equipment Distribution segment’s goodwill.
The determination of fair value requires the Company to make significant estimates and assumptions. These estimates and assumptions primarily include, but are not limited to, revenue growth and operating earnings projections, discount rates, terminal growth rates, and required capital expenditure projections. Our projections make certain assumptions including expanding PM market share in North America, a normalization of energy markets over time and a continued expansion of dealer networks. If our progress in meeting these and other assumptions is slower or different than what was anticipated, it may impact our ability to meet the projections. Due to the inherent uncertainty involved in making these estimates, actual results could differ materially from those estimates. Deterioration in the market or actual results as compared with the projections (including not meeting near term projections) may result in impairment in the near term. In the event the Company determines that goodwill is impaired in the future the Company would need to recognize a non-cash impairment charge.
Impairment of Long Lived Assets —The Company’s policy is to assess the realizability of its long-lived assets, including intangible assets, and to evaluate such assets for impairment whenever events or changes in circumstances indicate that the carrying amount of such assets (or group of assets) may not be recoverable. Impairment is determined to exist if the estimated future undiscounted cash flows are less than the carrying value. Future cash flow projections include assumptions for future sales levels, the impact of cost reduction programs, and the level of working capital needed to support each business. The amount of any impairment then recognized would be calculated as the difference between estimated fair value and the carrying value of the asset. The Company did not have any impairment for the years ended December 31, 2017, 2016 and 2015.
Inventory —Inventory consists of stock materials and equipment stated at the lower of cost (first in, first out) or net realizable value. All equipment classified as inventory is available for sale. The company records excess and obsolete inventory reserves. The estimated reserve is based upon specific identification of excess or obsolete inventories. Selling, general and administrative expenses are expensed as incurred and are not capitalized as a component of inventory.
Foreign Currency Translation and Transactions —The financial statements of the Company’s non-U.S. subsidiaries are translated using the current exchange rate for assets and liabilities and the weighted-average exchange rate for the year for income and expense items. Resulting translation adjustments are recorded to accumulated other comprehensive income (OCI) as a component of shareholders’ equity.
The Company converts receivables and payables denominated in other than the Company’s functional currency at the exchange rate as of the balance sheet date. The resulting transaction exchange gains or losses, except for certain transaction gains or loss related to intercompany receivable and payables, are included in other income and expense. Transaction gains and losses related to intercompany receivables and payables not anticipated to be settled in the foreseeable future are excluded from the determination of net income and are recorded as a translation adjustment (with consideration to the tax effect) to accumulated other comprehensive income (OCI) as a component of shareholders’ equity.
Derivatives—Forward Currency Exchange Contracts —When the Company enters into forward currency exchange contracts it does so in relationship such that the exchange gains and losses on the assets and liabilities that are being hedged which are denominated in other than the reporting units’ functional currency would be offset by the changes in the market value of the forward currency exchange contracts it holds. The forward currency exchange contracts that the Company has to offset existing assets and liabilities denominated in other than the reporting units’ functional currency have been determined not to be considered a hedge under ASC 815-10. The Company records at the balance sheet date the forward currency exchange contracts at its market value with any associated gain or loss being recorded in current earnings. Both realized and unrealized gains and losses related to forward currency contracts are included in current earnings and are reflected in the Statement of Operations in the other income expense section on the line titled foreign currency transaction gain (loss).
53
The forward currency contracts to hedge future sales are designated as cash flow hedges under ASC 815-10. As required, forward currency contracts are recognized as an asset or liability at fair value on the Company’s Consolidated Balance Sheet. For derivative instruments that are designated and qualify as cash flow hedges, the effective portion of the gain or loss on the derivative is reported as a component of other comprehensive income and reclassified into earnings in the same period or periods during which the hedged transaction affects earnings (date of sale). Gains or losses on cash flow hedges when recognized into income are included in net revenues.
Interest Rate Swap Contracts—The Company enters into derivative instruments to manage its exposure to interest rate risk related to certain foreign term loans. Derivatives are initially recognized at fair value at the date the contract is entered into and are subsequently remeasured to their fair value at the end of each reporting period. The resulting gain or loss is recognized in current earnings immediately unless the derivative is designated and effective as a hedging instrument, in which case the effective portion of the gain or loss is recognized and is reported as a component of other comprehensive income and reclassified into earnings in the same period or periods during which the hedging instrument affects earnings (date of sale). As part of the acquisition of PM Group, which was acquired on January 15, 2015, the Company acquired interest rate swap contracts, which manage the exposure to interest rate risk related to term loans with certain financial institutions in Italy. These contracts have been determined not to be hedge instruments under ASC 815-10.
Credit Risk Concentrations — Financial instruments which potentially subject the Company to concentrations of credit risk consist primarily of cash, trade receivables and payables. The Company maintains its cash balances principally at a bank located in Chicago, Illinois as well as several separate Italian banks. At December 31, 2017 and 2016, the Company had uninsured balances of $5,116 and $3,755, respectively. Revenues for the year ended December 31, 2017 included one customer, Rush Truck Center that represented approximately 12.0% of total revenue. No other customer represented more than 10% of revenues for the year ended December 31, 2017. In 2016 and 2015, no one customer accounted for 10% or more of total company’s revenues.
For the years ended December 31, 2017 and 2016, no customers accounted for 10% or more of total Company’s accounts receivable.
For 2017, 2016 and 2015 purchases from any single supplier did not exceed 10% of total purchases.
Research and Development Expenses— The Company expenses research and development costs, as incurred. For the periods ended December 31, 2017, 2016 and 2015 expenses were $2,564, $2,939 and $3,123, respectively.
Advertising —Advertising costs are expensed as incurred and were $994, $950 and $830 for the years ended December 31, 2017, 2016 and 2015, respectively.
Retirement Benefit Costs and Termination Benefits —Payments to defined contribution retirement benefit plans are recognized as an expense when employees have rendered service entitling them to the contributions. For defined benefit retirement benefit plans, the cost of providing benefits is determined using the projected unit credit method, with actuarial valuations being carried out at the end of each annual reporting period. Remeasurement, comprising actuarial gains and losses, the effect of the changes to the asset ceiling (if applicable) and the return on plan assets (excluding interest), is reflected immediately in the statement of financial position with a charge or credit recognized in other comprehensive income in the period in which they occur. Remeasurement recognized in other comprehensive income is reflected immediately in retained earnings and will not be reclassified to profit or loss. Past service cost is recognized in profit or loss in the period of a plan amendment. Net interest is calculated by applying the discount rate at the beginning of the period to the net defined benefit liability or asset. Defined benefit costs are categorized as follows:
|
|
• |
service cost (including current service cost, past service cost, as well as gains and losses on curtailments and settlements); |
|
|
• |
net interest expense or income; and |
|
|
• |
remeasurement. |
Curtailment gains and losses are accounted for as past service costs. The retirement benefit obligation recognized in the consolidated statement of financial position represents the actual deficit or surplus in PM Group’s defined benefit plans. Any surplus resulting from this calculation is limited to the present value of any economic benefits available in the form of refunds from the plans or reductions in future contributions to the plans. A liability for a termination benefit is recognized at the earlier of when the entity can no longer withdraw the offer of the termination benefit and when the entity recognizes any related restructuring costs.
Litigation Claims —In determining whether liabilities should be recorded for pending litigation claims, the Company must assess the allegations and the likelihood that it will successfully defend itself. When the Company believes it is probable that it will not prevail in a particular matter, it will then record an estimate of the amount of liability based, in part, on advice of outside legal counsel.
54
Shipping and Handling —The Company records the amount of shipping and handling costs billed to customers as revenue. The cost incurred for shipping and handling is included in the cost of sales.
Use of Estimates —The preparation of financial statements in conformity with accounting principles generally accepted in the United States of America requires management to make estimates and assumptions that affect certain reported amounts and disclosures. Accordingly, actual results could differ from those estimates.
Income Taxes —The Company accounts for income taxes under the provisions of ASC 740 “ Income Taxes,” which requires recognition of income taxes based on amounts payable with respect to the current year and the effects of deferred taxes for the expected future tax consequences of events that have been included in the Company’s financial statements or tax returns. Under this method, deferred tax assets and liabilities are determined based on the differences between the financial accounting and tax basis of assets and liabilities, as well as for operating losses and tax credit carryforwards using enacted tax rates in effect for the year in which the differences are expected to reverse. Valuation allowances are recorded to reduce deferred tax assets when it is more likely than not a tax benefit will not be realized.
ASC 740 also prescribes a recognition threshold and measurement attribute for the financial statement recognition and measurement of a tax position taken or expected to be taken in a tax return, as well as guidance on derecognition, classification, interest and penalties, accounting in interim periods, disclosure and transition.
In assessing the realizability of deferred tax assets, management considers whether it is more likely than not that some portion or all of the deferred tax assets will be realized. The ultimate realization of deferred tax assets is dependent upon the generation of future taxable income prior to the expiration of any net operating loss carryforwards. See Note 14, Income Taxes, for further details.
Accrued Warranties —Warranty costs are accrued at the time revenue is recognized. The Company’s products are typically sold with a warranty covering defects that arise during a fixed period of time. The specific warranty offered is a function of customer expectations and competitive forces. The Equipment Distribution segment does not accrue for warranty costs at the time of sales, as they are reimbursed by the manufacturers for any warranty that they provide to their customers.
A liability for estimated warranty claims is accrued at the time of sale. The liability is established using historical warranty claim experience. Historical warranty experience is, however, reviewed by management. The current provision may be adjusted to take into account unusual or non-recurring events in the past or anticipated changes in future warranty claims. Adjustments to the initial warranty accrual are recorded if actual claim experience indicates that adjustments are necessary. Warranty reserves are reviewed to ensure critical assumptions are updated for known events that may impact the potential warranty liability.
Debt Issuance Costs —Debt issuance costs incurred in securing the Company’s financing arrangements are capitalized and amortized over the term of the associated debt. Deferred financing costs associated with long-term debt are presented in the balance sheet as direct deduction from the carrying amount of that debt liability, consistent with debt discount. Deferred financing costs associated with revolving lines of credit are included with other long-term assets on the Company’s balance sheet.
Sale and Leaseback —In accordance with ASC 840-40 Sales-Leaseback Transactions, the Company has recorded deferred gain in relationship to the sale and leaseback of one of the Company’s operating facilities and on certain equipment. As such, the gains have been deferred and are being amortized on a straight line basis over the life of the leases.
Computation of EPS —Basic Earnings per Share (“EPS”) was computed by dividing net income (loss) by the weighted average number of common shares outstanding during the period.
The number of shares related to options, warrants, restricted stock, convertible debt and similar instruments included in diluted EPS (“EPS”) is based on the “Treasury Stock Method” prescribed in ASC 260-10, Earnings per Share. This method assumes theoretical repurchase of shares using proceeds of the respective stock option or warrant exercised, and for restricted stock the amount of compensation cost attributed to future services which has not yet been recognized and the amount of current and deferred tax benefit, if any, that would be credited to additional paid in capital upon the vesting of the restricted stock, at a price equal to the issuer’s average stock price during the related earnings period. Accordingly, the number of shares includable in the calculation of EPS in respect of the stock options, warrants, restricted stock, convertible debt and similar instruments is dependent on this average stock price and will increase as the average stock price increases.
Stock Based Compensation —In accordance with ASC 718 Compensation-Stock Compensation, share-based payments to employees, including grants of restricted stock units, are measured at fair value as of the date of grant and are expensed in the consolidated statement of income over the service period (generally the vesting period).
55
Comprehensive Income —“Reporting Comprehensive Income” requires reporting and displaying comprehensive income and its components. Comprehensive income includes, in addition to net earnings, other items that are reported as direct adjustments to shareholder’s equity. Currently, the comprehensive income adjustment required for the Company has two components. First is a foreign currency translation adjustment, the result of consolidating its foreign subsidiary. The second component is a derivative instrument fair market value adjustment (net of income taxes) related to forward currency contracts designated as a cash flow hedge.
For derivative instruments that are designated and qualify as cash flow hedges, the effective portion of the gain or loss on the derivative is reported as a component of other comprehensive income and reclassified into earnings in the same period or periods during which the hedged transaction affects earnings (date of sale). See Note 6 for additional details.
Business Combinations —The Company accounts for acquisitions in accordance with guidance found in ASC 805, Business Combinations. The guidance requires consideration given, including contingent consideration, assets acquired and liabilities assumed to be valued at their fair market values at the acquisition date. The guidance further provides that: (1) in-process research and development will be recorded at fair value as an indefinite-lived intangible asset; (2) acquisition costs will generally be expensed as incurred, (3) restructuring costs associated with a business combination will generally be expensed subsequent to the acquisition date; and (4) changes in deferred tax asset valuation allowances and income tax uncertainties after the acquisition date generally will affect income tax expense.
ASC 805 requires that any excess of purchase price over fair value of assets acquired, including identifiable intangibles and liabilities assumed be recognized as goodwill. In accordance with ASC 805, any excess of fair value of acquired net assets, including identifiable intangibles assets, over the acquisition consideration results in a bargain purchase gain. Prior to recording a gain, the acquiring entity must reassess whether all acquired assets and assumed liabilities have been identified and recognized and perform re-measurements to verify that the consideration paid, assets acquired and liabilities assumed have been properly valued.
56
Note 4. Earnings per Common Share
Basic net earnings per share is computed by dividing net income by the weighted average number of common shares outstanding for the period. Diluted earnings per share reflects the potential dilution of restricted stock units. Details of the calculations are as follows:
|
|
|
For the Years Ended December 31, |
|
|||||||||
|
|
|
2017 |
|
|
2016 |
|
|
2015 |
|
|||
|
Net (loss) income attributable to shareholders of Manitex International, Inc. |
|
|
|
|
|
|
|
|
|
|
|
|
|
Loss from continuing operations |
|
$ |
(7,067 |
) |
|
$ |
(23,189 |
) |
|
$ |
(5,325 |
) |
|
Discontinued operations: |
|
|
|
|
|
|
|
|
|
|
|
|
|
Income (loss) from operations of discontinued operations, net of income taxes |
|
|
553 |
|
|
|
(20 |
) |
|
|
1,376 |
|
|
(Loss) income attributable to noncontrolling interest |
|
|
(274 |
) |
|
|
574 |
|
|
|
(48 |
) |
|
Income from operations of discontinued operations,net of income taxes attributable to shareholders of Manitex International, Inc. |
|
|
279 |
|
|
|
554 |
|
|
|
1,328 |
|
|
Loss on sale of discontinued operations, net of income taxes |
|
|
(1,290 |
) |
|
|
(14,458 |
) |
|
|
(1,375 |
) |
|
Loss from discontinued operations attributable Shareholders of Manitex International, Inc. |
|
|
(1,011 |
) |
|
|
(13,904 |
) |
|
|
(47 |
) |
|
Loss attributable to shareholders of Manitex International, Inc. |
|
$ |
(8,078 |
) |
|
$ |
(37,093 |
) |
|
$ |
(5,372 |
) |
|
(Loss) earnings per share |
|
|
|
|
|
|
|
|
|
|
|
|
|
Basic |
|
|
|
|
|
|
|
|
|
|
|
|
|
Loss from continuing operations attributable to shareholders' of Manitex International, Inc. |
|
$ |
(0.43 |
) |
|
$ |
(1.44 |
) |
|
$ |
(0.33 |
) |
|
Earnings (loss) from operations of discontinued operations attributable to shareholders of Manitex International, Inc., net of income taxes |
|
$ |
0.02 |
|
|
$ |
0.03 |
|
|
$ |
0.08 |
|
|
Loss on sale of discontinued operations attributable to shareholders of Manitex International, Inc., net of income taxes |
|
$ |
(0.08 |
) |
|
$ |
(0.90 |
) |
|
$ |
(0.09 |
) |
|
Loss attributable to shareholders of Manitex International, Inc. |
|
$ |
(0.49 |
) |
|
$ |
(2.30 |
) |
|
$ |
(0.34 |
) |
|
Diluted |
|
|
|
|
|
|
|
|
|
|
|
|
|
Loss from continuing operations attributable to shareholders' of Manitex International, Inc. |
|
$ |
(0.43 |
) |
|
$ |
(1.44 |
) |
|
$ |
(0.33 |
) |
|
Loss from operations of discontinued operations attributable to shareholders of Manitex International, Inc., net of income taxes |
|
$ |
0.02 |
|
|
$ |
0.03 |
|
|
$ |
0.08 |
|
|
Loss on sale of discontinued operations attributable to shareholders of Manitex International, Inc., net of income taxes |
|
$ |
(0.08 |
) |
|
$ |
(0.90 |
) |
|
$ |
(0.09 |
) |
|
Loss attributable to shareholders of Manitex International, Inc. |
|
$ |
(0.49 |
) |
|
$ |
(2.30 |
) |
|
$ |
(0.34 |
) |
|
Weighted average common shares outstanding |
|
|
|
|
|
|
|
|
|
|
|
|
|
Basic |
|
|
16,548,444 |
|
|
|
16,133,284 |
|
|
|
15,970,074 |
|
|
Diluted |
|
|
|
|
|
|
|
|
|
|
|
|
|
Basic |
|
|
16,548,444 |
|
|
|
16,133,284 |
|
|
|
15,970,074 |
|
|
Dilutive effect of warrants |
|
|
— |
|
|
|
— |
|
|
|
— |
|
|
Dilutive effect of restricted stock units |
|
|
— |
|
|
|
— |
|
|
|
— |
|
|
|
|
|
16,548,444 |
|
|
|
16,133,284 |
|
|
|
15,970,074 |
|
There are 204,072; 342,004 and 118,773 restricted stock units which are anti-dilutive and therefore are not included in the average number of diluted shares shown above for the years ended December 31, 2017, 2016 and 2015, respectively.
57
Note 5. Fair Value Measurements
The following tables set forth the Company’s financial assets and liabilities that were accounted for at fair value by level with the fair value hierarchy. As required by ASC 820-10, financial assets and liabilities are classified in their entirety based on the lowest level of input that is significant to the fair value measurement. Except as noted the below assets and liabilities are valued at fair market on a recurring basis,
The following is a summary of items that the Company measured at fair value during the periods:
|
|
|
Fair Value at December 31, 2017 |
|
|||||||||||||
|
|
|
Level 1 |
|
|
Level 2 |
|
|
Level 3 |
|
|
Total |
|
||||
|
Liabilities: |
|
|
|
|
|
|
|
|
|
|
|
|
|
|
|
|
|
PM contingent liabilities |
|
$ |
— |
|
|
$ |
— |
|
|
$ |
— |
|
|
$ |
— |
|
|
Valla contingent consideration |
|
|
— |
|
|
|
— |
|
|
|
220 |
|
|
|
220 |
|
|
Forward currency exchange contracts |
|
|
— |
|
|
|
213 |
|
|
|
— |
|
|
|
213 |
|
|
Interest rate swap contracts |
|
|
— |
|
|
|
6 |
|
|
|
— |
|
|
|
6 |
|
|
Total liabilities at fair value |
|
$ |
— |
|
|
$ |
219 |
|
|
$ |
220 |
|
|
$ |
439 |
|
|
|
|
|
|
|
|
|
|
|
|
|
|
|
|
|
|
|
|
|
|
|
|
|
|
|
|
|
|
|
|
|
|
|
|
|
|
|
|
Fair Value at December 31, 2016 |
|
|||||||||||||
|
Liabilities: |
|
Level 1 |
|
|
Level 2 |
|
|
Level 3 |
|
|
Total |
|
||||
|
Forward currency exchange contracts |
|
$ |
— |
|
|
$ |
159 |
|
|
$ |
— |
|
|
$ |
159 |
|
|
Interest rate swap contracts |
|
|
— |
|
|
|
405 |
|
|
|
— |
|
|
|
405 |
|
|
PM contingent liabilities |
|
|
— |
|
|
|
— |
|
|
|
316 |
|
|
|
316 |
|
|
Valla contingent consideration |
|
|
— |
|
|
|
— |
|
|
|
193 |
|
|
|
193 |
|
|
Total liabilities at fair value |
|
$ |
— |
|
|
$ |
564 |
|
|
$ |
509 |
|
|
$ |
1,073 |
|
|
|
|
Fair Value Measurements Using Significant Unobservable Inputs (level 3) |
|
|||||||||
|
Liabilities: |
|
PM Contingent Liability |
|
|
Valla Contingent Consideration |
|
|
Total |
|
|||
|
Balance at December 31, 2016 |
|
$ |
316 |
|
|
$ |
193 |
|
|
$ |
509 |
|
|
Effect of change in exchange rates |
|
|
— |
|
|
|
27 |
|
|
$ |
27 |
|
|
Change in fair value during the period |
|
|
(316 |
) |
|
|
— |
|
|
|
(316 |
) |
|
Balance at December 31, 2017 |
|
$ |
— |
|
|
$ |
220 |
|
|
$ |
220 |
|
In 2016, the fair value of PM Contingent Liability a Level III items was based on an option pricing framework more specifically a Monte Carlo simulation. The original fair value of Valla contingent consideration was also determined was using an option pricing framework more specifically a Monte Carlo simulation at the acquisition date.
In 2017, the Company qualitatively evaluated the PM contingent liability. During 2017, the Company determined that based on 2017 expected EBITDA there was virtual certainty that no payment would be required and determined that there was no liability. Final 2017 EBITDA did not meet the threshold for a payment.
The Company has qualitatively evaluated the Valla contingent liability from the date of acquisition.
The carrying value of the amounts reported in the Consolidated Balance Sheets for cash, accounts receivable, accounts payable and short-term variable debt, including any amounts outstanding under the Company’s revolving credit facilities and working capital borrowing, approximate fair value due to the short periods during which these amounts are outstanding.
58
The book and fair value of the Company’s term debt was $29,629 and $29,629 for the year ended December 31, 2017, respectively, and $39,765 and $39,765 for the year ending December 31, 2016, respectively. The book and fair value of the Company’s capital leases was $5,861 and $7,679 for the year ended December 31, 2017, respectively and $6,342 and $8,386 for the year ending December 31, 2016, respectively. There is no difference between the book value and the fair value for amount recorded in connection with a long-term legal settlement, which was $890 and $926 for the years ending December 31, 2017 and 2016, respectively.
Fair Value Measurements
ASC 820-10 classifies the inputs used to measure fair value into the following hierarchy:
|
|
|
|
|
|
|
|
Level 1 |
- |
|
Unadjusted quoted prices in active markets that are accessible at the measurement date for identical, unrestricted assets or liabilities; |
||
|
|
|
|
|
||
|
Level 2 |
- |
|
Quoted prices in markets that are not active, or inputs which are observable, either directly or indirectly, for substantially the full term of the asset or liability; and |
||
|
|
|
|
|
||
|
Level 3 |
- |
|
Prices or valuation techniques that require inputs that are both significant to the fair value measurement and unobservable (i.e., supported by little or no market activity) |
||
Fair value of the forward currency contracts are determined on the last day of each reporting period using observable inputs, which are supplied to the Company by the foreign currency trading operation of its bank and are Level 2 items.
Note 6. Derivative Financial Instruments
The Company’s risk management objective is to use the most efficient and effective methods available to us to minimize, eliminate, reduce or transfer the risks which are associated with fluctuation of exchange rates between the Euro, Chilean Peso and the U.S. dollar.
Forward Currency Contracts
When the Company receives a significant order in other than the operating unit’s functional currency, management may evaluate different options that are available to mitigate future currency exchange risks. The decision to hedge future sales is not automatic and is decided case by case. The Company only uses hedge instruments to hedge firm existing sales orders and not estimated exposure, when management determines that exchange risks exceed desired risk tolerance levels. The forward currency contracts used to hedge future sales are designated as cash flow hedges under ASC 815-10 provided certain criteria are met. For derivative instruments that are designated and qualify as cash flow hedges, the effective portion of the gain or loss on the derivative is reported as a component of other comprehensive income and reclassified into earnings in the same period or periods during which the hedged transaction affects earnings (date of sale). Gains or losses on cash flow hedges when recognized into income are included in net revenues. Gains and losses on the derivative instruments representing either hedge ineffectiveness or hedge components excluded from the assessment of effectiveness are recognized in current earnings. The Company expects minimal ineffectiveness as the Company has hedged only firm sales orders and has not hedged estimated exposures. As of December 31, 2017, the Company had no outstanding forward currency contracts that were in place to hedge future sales. Therefore, there are currently no unrealized pre-tax gains or loss which will reclassified from other comprehensive income into earnings during the next 12 months.
In addition, the Company enters into forward currency exchange contracts in relationship such that the exchange gains and losses on the assets and liabilities denominated in other than the reporting units’ functional currency would be offset by the changes in the market value of the forward currency exchange contracts it holds. The forward currency exchange contracts that the Company has to offset existing assets and liabilities denominated in other than the reporting units’ functional currency have been determined not to be considered a hedge under ASC 815-10. The Company records at the balance sheet date the forward currency exchange contracts at its market value with any associated gain or loss being recorded in current earnings. Both realized and unrealized gains and losses related to forward currency contracts are included in current earnings and are reflected in the Statement of Income in the other income expense section on the line titled foreign currency transaction gains (losses). Items denominated in other than a reporting unit functional currency include certain intercompany receivables due from the Company’s Italian subsidiaries and accounts receivable and accounts payable of our Italian subsidiaries and their subsidiaries
PM Group has an intercompany receivable denominated in Euros from its Chilean subsidiary. At December 31, 2017, the Company had entered into a forward currency exchange contract that matures on January 29, 2018. Under the contract the Company is obligated to sell 1,500,000 Chilean pesos for 2,084 euros. The purpose of the forward contract is to mitigate the income effect related to this intercompany receivable that results with a change in exchange rate between the Euro and the Chilean peso.
59
Interest Rate Swap Contracts
The Company uses financial instruments available on the market, including derivatives, solely to minimize its cost of borrowing and hedge the risk of interest rate and exchange rate fluctuation. In January 2009, prior to the January 15, 2015 acquisition date, PM Group entered into contracts in order to hedge the interest rate risk related to its term loans.
A contract was signed by PM Group, for an original notional amount of € 482 (€ 579 at December 31, 2017), maturing on October 1, 2020 with interest paid monthly. PM pays interest at a rate of 3.90% and receives from the counterparties interest at the “Euribor” rate for the period in question if greater than 0.90%.
As of December 31, 2017, the Company had the following forward currency contracts and interest rate swaps:
|
Nature of Derivative |
|
Currency |
|
Amount |
|
|
Type |
|
|
Forward currency sales contracts |
|
Chilean peso |
|
|
1,500,000 |
|
|
Not designated as hedge instrument |
|
Interest rate swap contracts |
|
Euro |
|
|
482 |
|
|
Not designated as hedge instrument |
The following table provides the location and fair value amounts of derivative instruments that are reported in the Consolidated Balance Sheet as of December 31, 2017 and 2016:
Total derivatives not designated as a hedge instrument
|
|
|
|
|
Fair Value |
|
|||||
|
|
|
|
|
As of December 31, |
|
|||||
|
|
|
Balance Sheet Location |
|
2017 |
|
|
2016 |
|
||
|
Liabilities Derivatives |
|
|
|
|
|
|
|
|
|
|
|
Foreign currency Exchange Contracts |
|
Accrued expense |
|
$ |
213 |
|
|
$ |
159 |
|
|
Interest rate swap contracts |
|
Notes payable-Short term |
|
|
6 |
|
|
|
405 |
|
|
Total derivative liabilities |
|
|
|
$ |
219 |
|
|
$ |
564 |
|
The following tables provide the effect of derivative instruments on the Consolidated Statement of Income for 2017, 2016 and 2015:
|
Derivatives not designated as Hedge Instrument |
|
Location of gain or (loss) recognized in Income Statement |
|
Years ended December 31, |
|
|||||||||
|
|
|
|
|
2017 |
|
|
2016 |
|
|
2015 |
|
|||
|
Forward currency contracts |
|
Foreign currency transaction gains (losses) |
|
$ |
15 |
|
|
$ |
(483 |
) |
|
$ |
395 |
|
|
Forward currency contracts |
|
Loss from operations of discontinued operations |
|
— |
|
|
|
54 |
|
|
|
(430 |
) |
|
|
Interest rate swap contracts |
|
Interest expense |
|
|
1 |
|
|
|
(41 |
) |
|
|
(56 |
) |
|
Total derivatives (loss) gain |
|
|
|
$ |
16 |
|
|
$ |
(470 |
) |
|
$ |
(91 |
) |
During 2017, 2016 and 2015, there were no forward currency contracts designated as cash flow hedges. As such, all gains and loss related to forward currency contracts during 2017 and 2016 were recorded in current earnings and did not impact other comprehensive income.
Note 7. Inventory
The components of inventory at December 31, are summarized as follows:
|
|
|
|
|
|
|
|
|
|
|
|
|
2017 |
|
|
2016 |
|
||
|
Raw materials and purchased parts |
|
$ |
35,205 |
|
|
$ |
35,855 |
|
|
Work in process |
|
|
4,513 |
|
|
|
4,231 |
|
|
Finished goods and replacement parts |
|
|
14,642 |
|
|
|
29,401 |
|
|
Inventories, net |
|
$ |
54,360 |
|
|
$ |
69,487 |
|
60
The Company has established reserves for obsolete and excess inventory of $3,462 and $1,886 as of December 31, 2017 and 2016, respectively.
Note 8. Property, Plant and Equipment
Property, plant and equipment consist of the following at December 31:
|
|
|
2017 |
|
|
2016 |
|
||
|
Land |
|
$ |
4,396 |
|
|
$ |
3,939 |
|
|
Buildings |
|
|
14,370 |
|
|
|
13,331 |
|
|
Machinery and equipment |
|
|
13,070 |
|
|
|
10,871 |
|
|
Furniture and fixtures |
|
|
311 |
|
|
|
465 |
|
|
Leasehold improvements |
|
|
996 |
|
|
|
814 |
|
|
Computer software & equipment |
|
|
1,343 |
|
|
|
1,246 |
|
|
Motor vehicles |
|
|
413 |
|
|
|
392 |
|
|
Construction in progress |
|
|
60 |
|
|
|
54 |
|
|
Totals |
|
|
34,959 |
|
|
|
31,112 |
|
|
Less: accumulated depreciation |
|
|
(12,921 |
) |
|
|
(9,273 |
) |
|
Net property and equipment |
|
$ |
22,038 |
|
|
$ |
21,839 |
|
Depreciation expense was $2,380 (net of $80 amortization of deferred gain on building), $2,846 (net of $106 amortization of deferred gain on building), and $2,694 (net of $281 amortization of deferred gain on building) in 2017, 2016 and 2015, respectively. See Note 12 for information regarding capital leases.
Note 9. Goodwill and Other Intangible Assets
The Company accounts for Other Intangible Assets under the guidance in ASC 350, Intangibles—Goodwill and Other. Under the guidance intangible assets with definite lives are amortized over their estimated useful lives. Indefinite lived intangible assets are subject to annual impairment testing. The Company capitalizes certain costs related to patent technology. Additionally, a substantial portion of the purchase price related to the Company’s acquisitions has been assigned to patents or unpatented technology, trade name, customer backlog and customer relationships. The intangibles acquired in acquisitions have been valued using a discounted cash flow approach. Intangibles, except goodwill, are being amortized over their estimated useful lives.
Intangible assets were comprised of the following as of December 31:
|
|
|
2017 |
|
|
2016 |
|
|
Useful Lives |
||
|
Patented and unpatented technology |
|
$ |
18,458 |
|
|
$ |
17,409 |
|
|
10 years |
|
Amortization |
|
|
(12,011 |
) |
|
|
(11,004 |
) |
|
|
|
Customer relationships |
|
|
23,837 |
|
|
|
22,444 |
|
|
5-20 years |
|
Amortization |
|
|
(9,907 |
) |
|
|
(7,870 |
) |
|
|
|
Trade names and trademarks |
|
|
12,724 |
|
|
|
11,892 |
|
|
25 years - Indefinite |
|
Amortization |
|
|
(2,090 |
) |
|
|
(1,894 |
) |
|
|
|
Non-competition agreements |
|
|
50 |
|
|
|
50 |
|
|
2-5 years |
|
Amortization |
|
|
(47 |
) |
|
|
(42 |
) |
|
|
|
Customer backlog |
|
|
370 |
|
|
|
370 |
|
|
< 1 year |
|
Amortization |
|
|
(370 |
) |
|
|
(370 |
) |
|
|
|
Total Intangible assets |
|
$ |
31,014 |
|
|
$ |
30,985 |
|
|
|
Amortization expense was $2,727, $3,790 and $4,184 for the periods ended December 31, 2017, 2016 and 2015, respectively.
61
Estimated amortization expense for the next five years and subsequent is as follows:
|
|
|
Amount |
|
|
|
2018 |
|
$ |
3,054 |
|
|
2019 |
|
|
2,905 |
|
|
2020 |
|
|
2,860 |
|
|
2021 |
|
|
2,853 |
|
|
2022 |
|
|
2,826 |
|
|
And subsequent |
|
|
8,622 |
|
|
Total intangibles currently to be amortized |
|
|
23,120 |
|
|
Intangibles with indefinite lives not amortized |
|
|
7,894 |
|
|
Total intangible assets |
|
$ |
31,014 |
|
Changes in the Company’s goodwill are as follows:
|
|
|
Goodwill |
|
|
|
|
$ |
40,758 |
|
|
|
Goodwill impairment |
|
|
(275 |
) |
|
Effects of change in exchange rate |
|
|
(814 |
) |
|
Balance December 31, 2016 |
|
$ |
39,669 |
|
|
Effects of change in exchange rate |
|
|
3,900 |
|
|
Balance December 31, 2017 |
|
$ |
43,569 |
|
Note 10. Accrued Expenses
|
|
|
As of December 31, |
|
|||||
|
|
|
2017 |
|
|
2016 |
|
||
|
Accrued payroll |
|
$ |
1,198 |
|
|
$ |
914 |
|
|
Accrued employee benefits |
|
|
1,317 |
|
|
|
1,215 |
|
|
Accrued bonuses |
|
|
180 |
|
|
|
401 |
|
|
Accrued vacation expense |
|
|
1,214 |
|
|
|
979 |
|
|
Accrued interest |
|
|
414 |
|
|
|
1,753 |
|
|
Accrued commissions |
|
|
560 |
|
|
|
351 |
|
|
Accrued expenses—other |
|
|
2,045 |
|
|
|
1,052 |
|
|
Accrued warranty |
|
|
2,030 |
|
|
|
1,568 |
|
|
Accrued taxes other than income taxes |
|
|
969 |
|
|
|
1,950 |
|
|
Accrued product liability and workers compensation claims |
|
|
143 |
|
|
|
95 |
|
|
Total accrued expenses |
|
$ |
10,070 |
|
|
$ |
10,278 |
|
Note 11. Revolving Term Credit Facilities and Debt
U.S. Credit Facilities
At December 31, 2017, the Company and its U.S. subsidiaries have a Loan and Security Agreement, as amended, (the “Loan Agreement”) with CIBC Bank USA (“CIBC”). The Loan Agreement provides a revolving credit facility with a maturity date of July 20, 2019. The aggregate amount of the facility is $25,000.
The maximum borrowing available to the Company under the Loan Agreement is limited to: (1) 85% of eligible receivables; plus (2) 50% of eligible inventory valued at the lower of cost or market subject to a $17,500 limit; plus (3) 80% of eligible used equipment, as defined, valued at the lower of cost or market subject to a $2,000 limit. At December 31, 2017, the maximum the Company could borrow based on available collateral was $22,386. At December 31, 2017, the Company had borrowed $12,893 under this facility. The Company’s collateral is subject to a $5,000 reserve until the Fixed Charge Coverage ratio exceeds 1.10 to 1.00. The indebtedness under the Loan Agreement is collateralized by substantially all of the Company’s assets, except for the assets of certain of the Company’s subsidiaries.
62
The Loan Agreement provides that the Company can opt to pay interest on the revolving credit at either a base rate plus a spread, or a LIBOR rate plus a spread. The base rate spread ranges from 0.25% to 1.00% depending on the Senior Leverage Ratio (as defined in the Loan Agreement). The LIBOR spread ranges from 2.25% to 3.00% also depending on the Senior Leverage Ratio. Funds borrowed under the LIBOR option can be borrowed for periods of one, two, or three months and are limited to four LIBOR contracts outstanding at any time.
The underlying reference rate for our base rate borrowings at December 31, 2017 was 5.5%. At December 31, 2017, the Company had four outstanding advances with interest tied to LIBOR. The contracts had underlying LIBOR rates of 4.49%. In addition, CIBC assesses a 0.50% unused line fee that is payable monthly.
The Loan Agreement subjects the Company and its domestic subsidiaries to an Adjusted EBITDA covenant (as defined). The quarterly EBITDA covenant (as defined) are $(1,000) for the quarter ended at March 31, 2017, $0 for the quarter ended June 30, 2017, and $2,000 for all quarters starting with the quarter ended September 30, 2017 through the end of the agreement. Additionally, the Company and its domestic subsidiaries are subject to a Fixed Charge Coverage ratio of 1.05 to 1.00 measured on an annual basis beginning December 31, 2017, followed by a Fixed Charge Coverage ratio of 1.15 to 1.00 measured quarterly starting March 31, 2018 (based on a trailing twelve-month basis) through the term of the agreement. The Loan Agreement contains customary affirmative and negative covenants, including covenants that limit or restrict the Company’s ability to, among other things, incur additional indebtedness, grant liens, merge or consolidate, dispose of assets, make investments, make acquisitions, pay dividends or make distributions, repurchase stock, in each case subject to customary exceptions for a credit facility of this size. The Company received a waiver related to non-compliance with certain covenants and defaults under its U.S. credit facilities.
The Loan Agreement has a Letter of Credit facility of $3,000, which is fully reserved against availability.
Notes Payable – SVW
At December 31, 2016, SVW had five loans outstanding with four financial institutions. The Company was not a loan party but had included the debt associated with these loans in its consolidated financial statements as SVW was determined to be a VIE that required consolidation (see Note 3). SVW obtained financing using cranes that were included in the Company’s inventory as collateral because of SVW's status as a VIE. The funds borrowed by SVW been have remitted to the Company. The finance companies that held the loans had a perfected security interest in the inventory and therefore had recourse against this specific inventory. For accounting purposes, the Company did not recognize a sale and continued to include these cranes in its inventory, until sold to third parties. However, the finance companies had taken legal title to the Cranes used as collateral for the borrowings. The Company had entered into agreements to repurchase the Cranes from the lenders in the event that SVW defaulted on any of these loans. Additionally, the SVW debt was also effectively guaranteed by the Company pursuant to certain related agreements. At December 31, 2016, the four financial institutions in aggerate were owed $11,218. During 2017, the Company borrowed an additional $233 from one of the financial institutions.
All the SVW loans were repaid in full before December 31, 2017.
Note Payable—Bank
At December 31, 2017, the Company has a $626 term note payable to a bank. The Company is required to make eleven monthly payments of $35 that began on October 1, 2017 and a $182 payment in January and February 2018. The note dated October 1, 2017 had an original principal amount of $719 and an annual interest rate of 5.26%. Proceeds from the note were used to pay annual premiums for certain insurance policies carried by the Company. The holder of the note has a security interest in the insurance policies it financed and has the right upon default to cancel these policies and receive any unearned premiums.
Note Payable—Winona Facility Purchase
At December 31, 2017, Badger has balance on note payable to Avis Industrial Corporation of $466. Badger is required to make 60 monthly payments of $10 that began on August 1, 2017. The note dated July 26, 2017, had an original principal amount of $500 and annual interest rate of 8.00%. The note is guaranteed by the Company.
Notes Payable —Terex
At December 31, 2016, the Company had note payable to Terex Corporation with a balance of $1,594. The note was paid in full before December 31, 2017.
63
PM Group Short-Term Working Capital Borrowings
At December 31, 2017, PM Group had established demand credit and overdraft facilities with seven Italian banks and seven banks in South America. Under the facilities, PM Group can borrow up to approximately €26,260 ($31,570) for advances against invoices, and letter of credit and bank overdrafts. Interest on the Italian working capital facilities is charged at the 3-month or 6-month Euribor plus 200 basis points, while interest on overdraft facilities is charged at the 3 month Euribor plus 350 basis points. Interest on the South American facilities is charged at a flat rate of points for advances on invoices ranging from 10% - 32%.
At December 31, 2017, the Italian banks had advanced PM Group €17,931 ($21,556), at variable interest rates, which currently range from 1.42% to 1.67%. At December 31, 2017, the South American banks had advanced PM Group €2,515 ($3,024). Total short-term borrowings for PM Group were €20,446 ($24,580) at December 31, 2017.
PM Group Term Loans
At December 31, 2017, PM Group has a €9,609 ($11,552) term loan with two Italian banks, BPER and Unicredit. The term loan is split into three separate notes and is secured by PM Group’s common stock. Debt issuance costs offset against these term loans totaled €341 ($410) at December 31, 2017.
The first note has an outstanding principal balance of €3,528 ($4,242), is charged interest at the 6-month Euribor plus 236 basis points, effective rate of 2.09% at December 31, 2017. The note is payable in semi-annual installments beginning June 2017 and ending December 2021. The second note has an outstanding principal balance of €3,922 ($4,715), is charged interest at the 6-month Euribor plus 286 basis points, effective rate of 2.59% at December 31, 2017. The note is payable in semi-annual installments beginning June 2017 and ending December 2021. The third note has an outstanding principal balance of €2,500 ($3,005) and is non-interest bearing. The note is payable in semi-annual installments beginning June 2016 and ending December 2017 and a final balloon payment in December 2022.
An adjustment in the purchase accounting to value the non-interest bearing debt at its fair market value was made. At January 15, 2015 it was determined that the fair value of the debt was €1,460 or $1,562 less than the book value. This reduction is not reflected in the above descriptions of PM debt. This discount is being amortized over the life of the debt and being charged to interest expense. As of December 31, 2017 the remaining balance was €625 or $751 and has been offset to the debt.
PM Group is subject to certain financial covenants as defined by the debt restructuring agreement with BPER and Unicredit including maintaining (1) Net debt to EBITDA, (2) Net debt to equity, and (3) EBITDA to net financial charges ratios. The covenants are measured on a semi-annual basis. PM Group was not in compliance with these covenants at December 31, 2017.
Subsequent to December 31, 2017, the Company entered into a debt restructuring agreement as disclosed in Note 27, which modified the terms of the above disclosed debt as follows:
|
|
• |
The notes are being charged interest at 3.5%; |
|
|
• |
The term loan is now split into two separate tranches totaling €7,449 ($8,956) and €3,002 ($3,609); |
|
|
• |
The first tranche is payable in annual installments of principal €958 for 2019, €991 for 2020, €1,026 for 2021, €1,062 for 2022, €1,099 for 2023, €1,137 for 2024, and €1,177 for 2025; |
|
|
• |
The second tranche is payable in a single payment of €3,002 in 2026; and |
|
|
• |
The effect of PM not meeting its December 31, 2017 financial covenants was cured by the debt restructuring agreement. |
At December 31, 2017 PM Group has unsecured borrowings with four Italian banks totaling €13,015 ($15,647). Interest on the unsecured notes is charged at the 3-month Euribor plus 250 basis points, effective rate of 2.17% at December 31, 2017. Principal payments are due on a semi-annual basis beginning June 2019 and ending December 2021. Accrued interest on these borrowings through the date of acquisition at January 15, 2015, totaled €358 ($430) and is payable in semi-annual installments beginning June 2019 and ending December 2019.
Subsequent to December 31, 2017, the Company entered into a debt restructuring agreement as disclosed in Note 27, which modified the terms of the above disclosed unsecured borrowings as follows:
|
|
• |
The unsecured notes are charged interest at 3.5%; |
|
|
• |
€450 of the remaining €900 principal was forgiven, with the remaining principal payment of €450 plus accrued interest of €358 being payable during the six months ending December 31, 2018; and |
|
|
• |
Annual payments of €1,731 are payable beginning in 2019 and ending in 2025. |
64
At December 31, 2017 Autogru PM RO, a subsidiary of PM Group, has two notes. The first note is payable in 60 monthly principal installments of €8 ($10), plus interest at the 1-month Euribor plus 300 basis points, effective rate of 3.00% at December 31, 2017, maturing October 2020. At December 31, 2017, the outstanding principal balance of the note was €288 ($346). The second new note is payable in three instalment of €6 ($7) starting from October 2017 and ending in December 2017, three installments of €9 ($11) starting from January 2018 and ending in March 2018 and one final installment of €395 ($475) in March 2018. The note is charged interest at the 1-month Euribor plus 250 basis points, effective rate of 2.50% at December 31, 2017. At December 31, 2017, the outstanding principal balance of the note was €422 ($507).
PM has interest rate swaps with a fair market value at December 31, 2017 of €5 ($6) which has been included in debt.
At December 31, 2017 PM Argentina Sistemas de Elevacion, a subsidiary of PM Group has two notes. The first note is payable in one balloon payment in April 2018. At December 31, 2017, the outstanding balance of the note was €154 ($185) plus interest at 29%. The second new note is payable in five quarterly installments of €79 ($95) starting from April 2018 and ending in April 2019, the note is charged interest at 28.50% at December 31, 2017. At December 31, 2017, the outstanding principal balance of the note was €397 ($478).
Valla Short-Term Working Capital Borrowings
At December 31, 2017, Valla had established demand credit and overdraft facilities with three Italian banks. Under the facilities, Valla can borrow up to approximately €1,343 ($1,615) for advances against orders, invoices and bank overdrafts. Interest on the Italian working capital facilities is charged at a flat percentage rate for advances on invoices and orders ranging from 2% - 5%. At December 31, 2017, the Italian banks had advanced Valla €824 ($991).
Valla Term Loans
At December 31, 2017, Valla has a term loan with Carisbo. The note is payable in quarterly principal installments beginning on October 30, 2017 of €8 ($10), plus interest at the 3-month Euribor plus 470 basis points, effective rate of 4.37% at December 31, 2017. The note matures on January 2021. At December 31, 2017, the outstanding principal balance of the note was €102 ($123).
Schedule of Debt Maturities
Scheduled annual maturities of the principal portion of debt outstanding at December 31, 2017 in the next five years and the remaining maturity in aggregate are summarized below. Amounts shown include the debt described above in this footnote and the convertible notes disclosed in Note 13—Convertible Notes at their face amount of $22,500.
|
|
|
North America |
|
|
Italy |
|
|
Total |
|
|||
|
2018 |
|
$ |
714 |
|
|
$ |
28,417 |
|
|
$ |
29,131 |
|
|
2019 |
|
|
12,988 |
|
|
|
3,390 |
|
|
|
16,378 |
|
|
2020 |
|
|
7,602 |
|
|
|
3,411 |
|
|
|
11,013 |
|
|
2021 |
|
|
15,111 |
|
|
|
3,323 |
|
|
|
18,434 |
|
|
2022 |
|
|
69 |
|
|
|
3,356 |
|
|
|
3,425 |
|
|
Thereafter |
|
|
— |
|
|
|
13,954 |
|
|
|
13,954 |
|
|
|
|
|
36,484 |
|
|
|
55,851 |
|
|
|
92,335 |
|
|
Interest rate swaps |
|
|
— |
|
|
|
6 |
|
|
|
6 |
|
|
Debt discount related to non-interest bearing debt |
|
|
— |
|
|
|
(751 |
) |
|
|
(751 |
) |
|
Debt issuance cost |
|
|
(294 |
) |
|
|
(410 |
) |
|
|
(704 |
) |
|
Debt discounts related to convertible notes |
|
|
(891 |
) |
|
|
— |
|
|
|
(891 |
) |
|
Total |
|
$ |
35,299 |
|
|
$ |
54,696 |
|
|
$ |
89,995 |
|
Note 12. Leases
Capital leases
Georgetown facility
The Company leases its Georgetown facility under capital lease that was amended and extended on September 1, 2015. The amended lease expires on April 28, 2028. The monthly rent is currently $66 and is increased by 3% annually on September 1 during the term of the lease.
65
The present value of the future minimum lease payments (including the annual increase) was determined using a 12.5% discount rate (the discount rate used to record the original lease which was signed in April 2006). At December 31, 2017, the outstanding capital lease obligation is $5,189.
Equipment
The Company has entered into a lease agreement with a bank pursuant to which the Company is permitted to borrow 100% of the cost of new equipment with 49 month repayment periods, respectively. At the conclusion of the lease period, for each piece of equipment the Company is required to purchase that piece of leased equipment for one dollar.
The equipment, which is acquired in ordinary course of the Company’s business, is available for sale and rental prior to sale.
Under the lease agreement the Company can elect to exercise an early buyout option at any time, and pay the bank the present value of the remaining rental payments discounted by a specified Index Rate established at the time of leasing. The early buyout option results in a prepayment penalty which progressively decreases during the term of the lease. Alternatively, the Company under the like-kind provisions in the agreement can elect to replace or substitute different equipment in place of equipment subject to the early buyout without incurring a penalty.
The following is a summary of amounts financed under equipment capital lease agreements:
|
|
|
Amount Borrowed |
|
|
Repayment Period |
|
|
Amount of Monthly Payment |
|
|
Balance As of December 31, 2017 |
|
||||
|
New equipment |
|
$ |
896 |
|
|
|
49 |
|
|
$ |
18 |
|
|
$ |
658 |
|
Future Minimum Lease Payments are:
|
Years |
|
Operating Leases |
|
|
Capital Leases |
|
||
|
2018 |
|
$ |
1,762 |
|
|
$ |
1,026 |
|
|
2019 |
|
|
1,453 |
|
|
|
1,055 |
|
|
2020 |
|
|
1,453 |
|
|
|
1,055 |
|
|
2021 |
|
|
86 |
|
|
|
902 |
|
|
2022 |
|
|
86 |
|
|
|
902 |
|
|
Subsequent |
|
|
0 |
|
|
|
5,302 |
|
|
Total Minimum Lease Payments |
|
$ |
4,840 |
|
|
|
10,242 |
|
|
Less: imputed interest |
|
|
|
|
|
|
(4,381 |
) |
|
Present value of minimum lease payment |
|
|
|
|
|
$ |
5,861 |
|
|
Less: current portion |
|
|
|
|
|
|
(378 |
) |
|
Long-term capital lease obligations |
|
|
|
|
|
$ |
5,483 |
|
|
Capital Items—as of or for the year ended December 31, 2017 |
|
Cost |
|
|
Accumulated Depreciation |
|
|
Depreciation Expense |
|
|
Interest Expense |
|
||||
|
Building—Georgetown, TX |
|
$ |
4,881 |
|
|
$ |
894 |
|
|
$ |
382 |
|
|
$ |
657 |
|
|
Other Capitalized leases |
|
|
896 |
|
|
|
— |
|
|
|
— |
|
|
|
10 |
|
|
Totals |
|
$ |
5,777 |
|
|
$ |
894 |
|
|
$ |
382 |
|
|
$ |
667 |
|
|
|
|
|
|
|
|
|
|
|
|
|
|
|
|
|
|
|
|
Capital Items—as of or for the year ended December 31, 2016 |
|
Cost |
|
|
Accumulated Depreciation |
|
|
Depreciation Expense |
|
|
Interest Expense |
|
||||
|
Building—Georgetown, TX |
|
$ |
4,881 |
|
|
$ |
512 |
|
|
$ |
385 |
|
|
$ |
670 |
|
|
Land & Building—Winona, MN |
|
|
1,700 |
|
|
|
424 |
|
|
|
57 |
|
|
|
— |
|
|
Other Capitalized leases |
|
|
1,166 |
|
|
|
— |
|
|
|
— |
|
|
|
33 |
|
|
Totals |
|
$ |
7,747 |
|
|
$ |
936 |
|
|
$ |
442 |
|
|
$ |
703 |
|
Sales and Leaseback—In accordance with ASC 840-40 Sales- Leaseback Transaction, at December 31, 2017 and 2016, the Company has deferred gain of $969 and $1,058, respectively, related to the sale and leaseback of Georgetown operating facilities and certain equipment. The deferred gain is being amortized over the life of the leases which reduces depreciation expense $80 annually through April 2028 and will also increase revenue by $37 for the next four years.
66
The Company leases its 40,000 sq. ft. Bridgeview facility from an entity controlled by Mr. David Langevin, the Company’s Chairman and CEO. Pursuant to the terms of the lease, the Company makes monthly lease payments of $22. The Company is also responsible for all the associated operations expenses, including insurance, property taxes, and repairs. The lease will expire on June 30, 2020 and has a provision for six one year extension periods. The lease contains a rental escalation clause under which annual rent is increased during the initial lease term by the lesser of the increase in the Consumer Price Increase or 2.0%. Rent for any extension period shall, however, be the then-market rate for similar industrial buildings within the market area.
The Company has the option to purchase the building by giving the landlord written notice at any time prior to the date that is 180 days prior to the expiration of the lease or any extension period. The landlord can require the Company to purchase the building if a change of Control Event, as defined in the lease, occurs by giving written notice to the Company at any time prior to the date that is 180 days prior to the expiration of the lease or any extension period. The purchase price, regardless whether the purchase is initiated by the Company or the landlord, will be the Fair Market Value as of the closing date of said sale. Rent expense for the current and former Bridgeview facility was $263, $259 and $256 for the years ended December 31, 2017, 2016 and 2015, respectively.
The Company leases its Knox, Indiana facility under two operating leases. The leases which expire on August 19, 2020, currently provides for monthly rent of $11 and $3, respectively. The leases contain a rental escalation clause under which annual rent is increased during the lease term by the lesser of the increase in the Consumer Price Increase or 2.0%. The Company is also responsible for all the associated operations expenses, including insurance, property taxes, and repairs. The Company has an option to extend the leases for an additional five year period. The Company has the right to purchase the facility at a negotiated price any time during the lease period. If the parties are unable to agree on purchase price, the purchase price under the terms of the lease will be the average of two appraisals of the premises performed by independent third-party appraisers, one selected by the landlord and one selected by the Company. Total rent expense related to the leases was $163, $163 and $163 for the year ended December 31, 2017, 2016 and 2015, respectively.
The Company leases a number of boom trucks and other equipment under five year operating leases. The Company entered into the leases to provide financing for equipment some of which was manufactured by our Manitex subsidiary that will be in Equipment Distribution’s rental fleet. The Company has the option to purchase the equipment at the end of the lease for the higher residual value or then fair market value of the equipment. The following table provides additional information:
|
Lease Inception |
|
Lease Term |
|
Monthly Payment |
|
|
Residual Value |
|
||
|
December 29, 2015 |
|
60 months |
|
$ |
15 |
|
|
$ |
173 |
|
|
January 19, 2016 |
|
60 months |
|
|
37 |
|
|
|
639 |
|
|
February 5, 2016 |
|
60 months |
|
|
49 |
|
|
|
642 |
|
|
|
|
|
|
$ |
101 |
|
|
$ |
1,454 |
|
At December 31, 2017, PM leases forklifts under three operating leases. Two of the leases which expire on February 28, 2023 provide for monthly rental payments of $2 and $4 respectively. Another lease which expires on April 30, 2020, provides for monthly rental payments of $8.
Additionally, PM leases automobiles for a number of its employees. The leases expire at various times between 2018 and 2021. Currently, the aggregate monthly rent is approximately $20. Future monthly rents will change as leases expire and new leases are executed.
The Company has various operating equipment leases with monthly payments of $4 with various expiration dates through 2020. Total rent expense under these additional leases was $107, $154 and $125 for the years ended December 31, 2017, 2016 and 2015.
Note 13. Convertible Notes
Related Party
On December 19, 2014, the Company issued a subordinated convertible debenture with a $7,500 face amount payable to Terex, a related party. The convertible debenture is subordinated, carries a 5% per annum coupon, and is convertible into Company common stock at a conversion price of $13.65 per share or a total of 549,451 shares, subject to customary adjustment provisions. The debenture has a December 19, 2020 maturity date.
From and after the third anniversary of the original issuance date, the Company may redeem the convertible debenture in full (but not in part) at any time that the last reported sale price of the Company’s common stock equals at least 130% of the Conversion Price (as defined in the debenture) for at least 20 of any 30 consecutive trading days. Following an election by the holder to convert the
67
debenture into common stock of the Company in accordance with the terms of the debenture, the Company has the discretion to deliver to the holder either (i) shares of common stock, (ii) a cash payment, or (iii) a combination of cash and stock.
In accounting for the issuance of the note, the Company separated the note into liability and equity components. The carrying amount of the liability component was calculated by measuring the estimated fair value of a similar liability that does not have an associated convertible feature. The carrying amount of the equity component representing the conversion option was determined by deducting the fair value of the liability component from the face value of the Note as a whole. The excess of the principal amount of the liability component over its carrying amount (“debt discount”) is amortized to interest expense over the term of the note using the effective interest method with an effective interest rate of 7.5 percent per annum. The equity component is not remeasured as long as it continues to meet the conditions for equity classification.
On December 19, 2014, the components of the note was as follows:
|
Liability component |
|
$ |
6,607 |
|
|
Equity component (a component of paid in capital) |
|
|
893 |
|
|
|
|
$ |
7,500 |
|
Additionally, in connection with the transaction a $321 deferred tax liability was established and was recorded as a deduction to paid in capital. The deferred tax liability was recognized as the excess of the principal amount being amortized and charged to interest expenses is not tax deductible.
As of December 31, 2017, the note had a remaining principal balance of $7,005 and an unamortized discount of $495. The difference between this amount and the amount initially recorded represents $398 of discount amortization.
The Terex agreement included obligations on the part of the Company to timely file with the SEC its reports that are required to be filed pursuant to the Exchange Act. The Company has obtained waivers from Terex with respect to any breaches, defaults or events of default that may have been or may be triggered in connection with the Company’s failure to timely file its reports with the SEC. See Note 27, Subsequent Events for additional details.
Perella Notes
On January 7, 2015, the Company entered into a Note Purchase Agreement (the “Perella Note Purchase Agreement”) with MI Convert Holdings LLC (which is owned by investment funds constituting part of the Perella Weinberg Partners Asset Based Value Strategy) and Invemed Associates LLC (together, the “Investors”), pursuant to which the Company agreed to issue $15,000 in aggregate principal amount of convertible notes due January 7, 2021 (the “Perella Notes”) to the Investors. The Notes are subordinated, carry a 6.50% per annum coupon, and are convertible, at the holder’s option, into shares of Company common stock, based on an initial conversion price of $15.00 per share, subject to customary adjustments. Following an election by the holder to convert the debenture into common stock of the Company in accordance with the terms of the debenture, the Company has the discretion to deliver to the holder either (i) shares of common stock, (ii) a cash payment, or (iii) a combination of cash and stock. Upon the occurrence of certain fundamental corporate changes, the Perella Notes are redeemable at the option of the holders of the Perella Notes. The Perella Notes are not redeemable at the Company’s option prior to the maturity date, and the payment of principal is subject to acceleration upon an event of default. The issuance of the Perella Notes by the Company was made in reliance upon the exemptions from registration provided by Rule 506 and Section 4(2) of the Securities Act of 1933.
In connection with the issuance of the Perella Notes, on January 7, 2015, the Company entered into a Registration Rights Agreement with the Investors (the “Registration Rights Agreement”). Pursuant to the Registration Rights Agreement, the Company has agreed to register the resale of the shares of common stock issuable upon conversion of the Perella Notes. The Company filed a Registration Statement on Form S-3 to register the shares with the Securities and Exchange Commission, which was declared effective on February 23, 2015.
In accounting for the issuance of the note, the Company separated the note into liability and equity components. The carrying amount of the liability component was calculated by measuring the estimated fair value of a similar liability that does not have an associated convertible feature. The carrying amount of the equity component representing the conversion option was determined by deducting the fair value of the liability component from the face value of the Note as a whole. The excess of the principal amount of the liability component over its carrying amount (“debt discount”) is amortized to interest expense over the term of the note using the effective interest method with an effective interest rate of 7.5 percent per annum. The equity component is not remeasured as long as it continues to meet the conditions for equity classification.
68
On January 7, 2015, the components of the note were as follows:
|
Liability component |
|
$ |
14,286 |
|
|
Equity component (a component of paid in capital) |
|
|
714 |
|
|
|
|
$ |
15,000 |
|
Additionally, in connection with the transaction a $257 deferred tax liability was established and was recorded as a deduction to paid in capital. The deferred tax liability was recognized as the excess of the principal amount being amortized and charged to interest expense and is not tax deductible.
As of December 31, 2017, the note had a remaining principal balance of $14,604 (less $294 debt issuance for a debt $14,310) and an unamortized discount of $396. The difference between this amount and the amount initially recorded represents $318 of discount amortization.
The Perella agreements included obligations on the part of the Company to timely file with the SEC its reports that are required to be filed pursuant to the Exchange Act. The Company has obtained waivers from the Holders with respect to any breaches, defaults or events of default that may have been or may be triggered in connection with the Company’s failure to timely file its reports with the SEC. See Note 27, Subsequent Events for additional details.
Note 14. Income Taxes
On December 22, 2017, the Tax Cuts and Jobs Act (the “Act”) was enacted into law. The Act makes comprehensive changes to the U.S. tax code, including, but not limited to, reducing the U.S. federal corporate tax rate from 35% to 21%, changes to the rules related to uses and limitations of net operating loss carryforwards created in tax years beginning after December 31, 2017, immediate expensing of certain qualified property, creation of a new limitation on deductible interest expense, repeal of the U.S. corporate minimum tax (“AMT”), and changes in the manner in which international operations are taxed in the U.S. Although the majority of the changes resulting from the Act are effective beginning in 2018, U.S. GAAP requires that certain impacts of the Act be recognized in the income tax provision in the period of enactment.
In response to the enactment of the Act, the SEC issued Staff Accounting Bulletin (“SAB”) 118, which provides guidance on accounting for the tax effects of the Act. SAB 118 provides a measurement period that should not extend beyond one year from the Act enactment date for companies to complete the accounting under ASC 740. To the extent that a company’s accounting for certain income tax effects of the Act is incomplete but is able to determine a reasonable estimate, it must record a provisional estimate in the financial statements.
In connection with the enactment of the Act, during the fourth quarter of 2017, we recorded a provisional increase in our net U.S. deferred tax asset by approximately $0.4 million. The remeasurement of our U.S. deferred tax asset at the reduced U.S. federal corporate tax rate of 21% was mainly offset by a reduction in the valuation allowance. The increase in our net deferred tax asset of $.4 million is primarily attributed to deferred tax liabilities related to indefinite lived intangible assets that became available as a source of taxable income to offset existing deferred tax assets due to the modification providing for the indefinite carryforward of net operating losses arising in tax years beginning after December 31, 2017 and the recognition of refundable alternative minimum tax credits as provided for in the Act.
The Act includes a mandatory one-time tax on accumulated earnings of foreign subsidiaries. As a result, all previously unremitted earnings for which no U.S. deferred tax liability had been accrued are now subject to U.S. tax. In accordance with the guidelines provided by the Act, we have aggregated the estimated untaxed foreign earnings and profits and utilized participation exemption deductions in arriving at a provisional taxable income inclusion. The Company recorded a provisional amount for the one-time transition tax liability for all of its foreign subsidiaries resulting in an income tax expense of approximately $.5 million, which is offset by a reduction in the valuation allowance. Notwithstanding the U.S. taxation of these amounts, we intend to continue to invest these earnings indefinitely outside the U.S.
The Company has not made a policy election with respect to the income tax effects of the new GILTI provision. Under US GAAP, companies can either account for taxes on GILTI as a current period expense or recognize deferred taxes when basis differences exist that are expected to affect the amount of GILTI inclusion upon reversal. Due to the complexity of these new tax rules, we are continuing to evaluate the potential impact on the U.S. taxation of foreign operations. In accordance with SAB 118, we have not included an estimate of the tax expense/benefit related to GILTI for the period ended December 31, 2017.
69
While we are able to make a reasonable estimate of the impact of the reduction in the U.S. federal corporate tax rate, the provisional amounts could change for a variety of factors, including but not limited to, (i) anticipated guidance from the U.S. Department of Treasury about implementing the Act, (ii) potential additional guidance from the Securities and Exchange Commission related to the Act, and (iii) the Company’s further assessment of the Act and related regulatory guidance.
The determination of the taxable inclusion related to the deemed repatriation of accumulated foreign earnings requires further analysis regarding the amount and composition of the Company’s untaxed earnings and profits which is expected to be complete in the second half of 2018.
We are continuing to evaluate the Act and its requirements, as well as its application to our business and its impact on our effective tax rate.
Information pertaining to the Company’s income before income taxes from continuing operations is as follows:
|
|
|
Years ended December 31, |
|
|||||||||
|
|
|
2017 |
|
|
2016 |
|
|
2015 |
|
|||
|
Income (loss) before income taxes: |
|
|
|
|
|
|
|
|
|
|
|
|
|
Domestic |
|
$ |
(6,289 |
) |
|
$ |
(24,795 |
) |
|
$ |
(7,072 |
) |
|
Foreign |
|
|
(896 |
) |
|
|
1,040 |
|
|
|
(196 |
) |
|
Total net loss from continuing operations before income taxes |
|
$ |
(7,185 |
) |
|
$ |
(23,755 |
) |
|
$ |
(7,268 |
) |
Information pertaining to the Company’s provision (benefit) for income taxes for continuing operations is as follows:
|
|
|
Years ended December 31, |
|
|||||||||
|
|
|
2017 |
|
|
2016 |
|
|
2015 |
|
|||
|
Provision (benefit) for income taxes: |
|
|
|
|
|
|
|
|
|
|
|
|
|
Current: |
|
|
|
|
|
|
|
|
|
|
|
|
|
Federal |
|
$ |
262 |
|
|
$ |
(2,033 |
) |
|
$ |
(1,644 |
) |
|
State and local |
|
|
79 |
|
|
|
(27 |
) |
|
|
80 |
|
|
Foreign |
|
|
448 |
|
|
|
(310 |
) |
|
|
687 |
|
|
|
|
|
789 |
|
|
|
(2,370 |
) |
|
|
(877 |
) |
|
Deferred: |
|
|
|
|
|
|
|
|
|
|
|
|
|
Federal |
|
|
(389 |
) |
|
|
(136 |
) |
|
|
(369 |
) |
|
State and local |
|
|
(954 |
) |
|
|
1,163 |
|
|
|
(110 |
) |
|
Foreign |
|
|
436 |
|
|
|
777 |
|
|
|
(587 |
) |
|
|
|
|
(907 |
) |
|
|
1,804 |
|
|
|
(1,066 |
) |
|
Total provision (benefit) for income taxes |
|
$ |
(118 |
) |
|
$ |
(566 |
) |
|
$ |
(1,943 |
) |
70
Deferred income taxes reflect the net tax effects of temporary differences between the carrying amounts of assets and liabilities for financial reporting purposes and income tax purposes. Significant components of the Company’s deferred tax assets and liabilities are as follows:
|
|
|
Year ended December 31, |
|
|||||
|
|
2017 |
|
|
2016 |
|
|||
|
Deferred tax assets: |
|
|
|
|
|
|
|
|
|
Accrued expenses |
|
$ |
1,092 |
|
|
$ |
1,084 |
|
|
Inventory |
|
|
2,046 |
|
|
|
2,830 |
|
|
Other liabilities |
|
|
432 |
|
|
|
641 |
|
|
Deferred gain |
|
|
245 |
|
|
|
464 |
|
|
Net operating loss carryforwards |
|
|
7,463 |
|
|
|
4,570 |
|
|
Tax credit carryforwards |
|
|
1,271 |
|
|
|
1,434 |
|
|
Capital loss carryforwards |
|
|
188 |
|
|
|
— |
|
|
Unrealized foreign currency loss |
|
|
137 |
|
|
|
317 |
|
|
Investment in Partnerships |
|
|
— |
|
|
|
262 |
|
|
Interest expense |
|
|
2,026 |
|
|
|
1,625 |
|
|
Restructuring cost |
|
|
559 |
|
|
|
736 |
|
|
Property, plant and equipment |
|
|
1,240 |
|
|
|
948 |
|
|
Total deferred tax asset |
|
|
16,699 |
|
|
|
14,911 |
|
|
Deferred tax liabilities: |
|
|
|
|
|
|
|
|
|
Intangibles |
|
|
10,077 |
|
|
|
8,266 |
|
|
Discount on convertible notes |
|
|
200 |
|
|
|
418 |
|
|
Deferred State Income Tax |
|
|
386 |
|
|
|
598 |
|
|
Investments |
|
|
176 |
|
|
|
— |
|
|
Total deferred tax liability |
|
|
10,839 |
|
|
|
9,282 |
|
|
Valuation allowance |
|
|
(7,405 |
) |
|
|
(8,326 |
) |
|
Net deferred tax liability |
|
$ |
(1,545 |
) |
|
$ |
(2,697 |
) |
In assessing the realizability of deferred tax assets, we evaluate whether it is more likely than not (more than 50%) that some portion or all of the deferred tax assets will be realized. The ultimate realization of deferred tax assets is dependent upon the generation of future taxable income in those periods in which temporary differences become deductible and/or net operating losses can be utilized. We assess all positive and negative evidence when determining the amount of the net deferred tax assets that are more likely than not to be realized. This evidence includes, but is not limited to, prior earnings history, scheduled reversal of taxable temporary differences, tax planning strategies and projected future taxable income. Significant weight is given to positive and negative evidence that is objectively verifiable. We have cumulative domestic losses for the three year period ending December 31, 2017, which is considered to be a significant piece of negative evidence.
Based on these factors, most notably the three year cumulative loss, the Company maintains a valuation allowance against the majority of its U.S. net deferred tax asset. The Company has determined that its AMT credit carryforward of $0.1 million and Texas Margin Tax Credit carryforward of $1.1 million are realizable. With the elimination of the U.S. corporate alternative minimum tax (“AMT”), the Act provides for a refund of AMT credit carryforwards. Irrespective of the Act, we released the remaining valuation allowance attributable to the Texas Margin Tax Credit, as the Company is a taxpayer, and based on an increasing business presence in the jurisdiction, we expect to utilize the credit carryforward prior to its expiration. Accordingly, we released the remaining valuation allowance and recognized a tax benefit in 2017 of approximately of $0.9 million in continuing operations.
As of December 31, 2017, the Company had U.S. federal and foreign net operating loss carryforwards of approximately $20.3 million and $11.4 million, respectively. The U.S. net operating loss carryforwards expire in 2036 and 2037. The majority of the foreign loss carryforwards are available for carryforward indefinitely. The Company also had state net operating losses of approximately $0.6 million that are set to expire at varying periods between 2026 and 2037 if not utilized. As of December 31, 2017, the Company has a Texas Margin Tax Credit of $1.1 million that may be utilized through 2026.
For the year-ended December 31, 2017, the valuation allowance decreased by $921. The valuation allowance increased for current year losses not benefited and adjustments to foreign net operating losses offset by a decrease for enactment of the Act, and release of the valuation allowance related to the Texas Margin Tax Credit.
71
The effective tax rate before income taxes varies from the current U.S. federal statutory income tax rate as follows:
|
|
|
Years ended December 31, |
|
|||||
|
|
|
2017 |
|
|
2016 |
|
||
|
Statutory rate |
|
|
35.00 |
% |
|
|
35.00 |
% |
|
State and local taxes |
|
|
1.07 |
% |
|
|
1.04 |
% |
|
Permanent differences |
|
|
-5.55 |
% |
|
|
-1.39 |
% |
|
Tax credits |
|
|
0.09 |
% |
|
|
0.96 |
% |
|
Foreign operations |
|
|
-13.05 |
% |
|
|
-0.32 |
% |
|
Uncertain tax positions |
|
|
-0.66 |
% |
|
|
-0.22 |
% |
|
Remeasurement of deferred taxes |
|
|
-49.35 |
% |
|
|
— |
|
|
Valuation allowance |
|
|
30.97 |
% |
|
|
-29.64 |
% |
|
Other |
|
|
3.12 |
% |
|
|
-3.05 |
% |
|
|
|
|
1.64 |
% |
|
|
2.38 |
% |
A reconciliation of the beginning and ending amount of unrecognized tax benefits, including interest and penalties, is as follows:
|
|
|
2017 |
|
|
2016 |
|
||
|
Balance at January 1, |
|
$ |
741 |
|
|
$ |
715 |
|
|
Increases in tax positions for prior years |
|
|
673 |
|
|
|
42 |
|
|
Decreases in tax positions for prior years |
|
|
(8 |
) |
|
|
— |
|
|
Other |
|
|
66 |
|
|
|
(16 |
) |
|
Settlements |
|
|
(456 |
) |
|
|
— |
|
|
Balance at December 31, |
|
$ |
1,016 |
|
|
$ |
741 |
|
Of the amounts reflected in the above table at December 31, 2017, the entire amount would reduce the Company’s annual effective tax rate if recognized. The Company records accrued interest related to income tax matters in the provision for income taxes in the accompanying consolidated statement of income. For the years ended December 31, 2017, 2016 and 2015, interest and penalties recognized on unrecognized tax benefits were $69, $40 and $20, respectively. The accrued balance as of December 31, 2017 and 2016 was $382 and $294, respectively. Included in the unrecognized tax benefits is a liability for the PM Group’s potential IRES and IRAP (Italian Income Taxes) audit adjustments for the tax year 2013 and Romania for tax years 2012-2016. Depending upon the final resolution of these audits, the liability could be higher or lower than the amount recorded at December 31, 2017. As of December 31, 2017, we don’t anticipate a significant change in unrecognized tax benefits within 12 months of the reporting date.
The Company files income tax returns in the United States, Romania and Italy as well as various state and local tax jurisdictions with varying statutes of limitations. With few exceptions, as of December 31, 2017, the Company is no longer subject to U.S. federal, state or foreign examinations by tax authorities for years before 2014. In July 2017, the Company received notification from the Internal Revenue Service that its tax return for the year ended December 31, 2015 has been selected for examination.
Note 15. Supplemental Cash Flow Disclosures
Interest received and paid, income taxes paid and non-cash transactions incurred during the years ended December 31, 2017, 2016 and 2015 were as follows:
|
|
|
2017 |
|
|
2016 |
|
|
2015 |
|
|||
|
Interest paid in cash |
|
$ |
7,234 |
|
|
$ |
10,576 |
|
|
$ |
11,040 |
|
|
Income tax (refunds) payments in cash |
|
|
1,729 |
|
|
|
(1,322 |
) |
|
|
2,059 |
|
|
Non-Cash Transactions: |
|
|
|
|
|
|
|
|
|
|
|
|
|
Proportional share of increase in equity investments' paid in capital |
|
|
11 |
|
|
|
— |
|
|
|
— |
|
|
Capital leases |
|
|
896 |
|
|
|
— |
|
|
|
3,607 |
|
|
Issuance of stock in connection with PM acquisition (see Note 20) |
|
|
— |
|
|
|
— |
|
|
|
10,124 |
|
|
Terex note payment paid in stock (see Note20) |
|
|
|
|
|
|
150 |
|
|
|
— |
|
72
Note 16. Employee Benefits
The Company’s sponsors a 401(k) plan. The plan is intended to cover all non-union United States based employees. The plan is open to employees 21 years of age and older. There is no minimum employment duration required before eligibility. The plan allows for monthly enrollment and contribution changes.
The Company currently matches dollar for dollar participants’ contributions up to 3% of the participants’ gross income and a 50% match on the next 2% of gross income. There is no dollar limit regarding matched funds and the plan also calls for immediate vesting of the employer contribution component. The employer match is paid when payroll is processed.
The amount paid in matching contributions by the company for 2017, 2016 and 2015 were $235, $375 and $386, respectively.
Movements on the PM Group’s employee severance indemnity / TFR provision during the periods, including the effects of the actuarial valuation of the TFR, were as follows:
|
|
Balance As of December 31, 2016 |
|
|
Increases |
|
|
Decreases |
|
|
Balance As of December 31, 2017 |
|
||||
|
Employee severance indemnity/TFR |
$ |
1,377 |
|
|
$ |
919 |
|
|
$ |
853 |
|
|
$ |
1,443 |
|
|
|
|
|
|
|
|
|
|
|
|
|
|
|
|
|
|
|
|
Balance As of December 31, 2015 |
|
|
Increases |
|
|
Decreases |
|
|
Balance As of December 31, 2016 |
|
||||
|
Employee severance indemnity/TFR |
$ |
1,487 |
|
|
$ |
668 |
|
|
$ |
778 |
|
|
$ |
1,377 |
|
The estimates, demographic and economic/financial assumptions made, with the support of an independent actuary, for the actuarial calculation used to determine the defined benefit plans in relation to postemployment benefits (Employee severance indemnity provision) can be detailed as follows:
|
Annual Discount Rate |
|
|
Annual Rate of Inflation |
|
|
Annual Increase Rate |
|
|
Probability of Employee Leaving Group |
|
|
Probability of Advance Payment of TFR |
|
|||||
|
|
0.87 |
% |
|
|
1.50 |
% |
|
|
2.63 |
% |
|
|
10.00 |
% |
|
|
3.00 |
% |
The amount allocated to the Employee severance indemnity provision in 2017, 2016 and 2015 were $728, $668 and $698.
A reconciliation of the defined benefit obligation is set out below:
|
|
|
Years ended December 31, |
|
|||||
|
|
|
2017 |
|
|
2016 |
|
||
|
Past Service Liability at beginning of the period |
|
$ |
1,377 |
|
|
$ |
1,487 |
|
|
Effect of change in exchange rate |
|
|
191 |
|
|
|
(42 |
) |
|
Interest cost |
|
|
14 |
|
|
|
8 |
|
|
Actuarial (Gain)/Loss |
|
|
10 |
|
|
|
(1 |
) |
|
Payments |
|
|
(149 |
) |
|
|
(75 |
) |
|
Past Service Liability at end of the period |
|
$ |
1,443 |
|
|
$ |
1,377 |
|
|
|
|
|
|
|
|
|
|
|
|
|
|
|
|
|
|
|
|
|
|
|
|
Years ended December 31, |
|
|||||
|
|
|
2017 |
|
|
2016 |
|
||
|
Actuarial gains and losses arising from changes in financial assumptions |
|
$ |
10 |
|
|
$ |
17 |
|
|
Actuarial gains and losses arising from experience assumptions |
|
|
— |
|
|
|
(18 |
) |
|
Actuarial (Gain)/Loss |
|
$ |
10 |
|
|
$ |
(1 |
) |
|
|
|
|
|
|
|
|
|
|
Employees in Italy are entitled to Trattamento di Fine Rapporto (“TFR”) commonly referred to as an employee leaving indemnity), which represents deferred compensation for employees in the private sector. Under Italian law, an entity is obligated to accrue for TFR
73
on an individual employee basis payable to each individual upon termination of employment (including both voluntary and involuntary dismissal). The annual accrual is approximately 7% of total pay, with no ceiling, and is revalued each year by applying a pre-established rate of return of 1.50%, plus 75% of the Consumer Price Index, and is recorded by a book reserve. TFR is an unfunded plan.
In October 2006, the Italian Government passed a law, effective January 1, 2007, which reformed the current TFR system, in which employees are given the ability to make choices as to the destination of the investment of the TFR compensation. In particular, the new change allowed the employee to direct the TFR funds to a chosen pension fund, such as an industry fund, an existing company pension plan, open funds, and individual insurance policies, subject to Company agreement. If no choice was made, the TFR allocations were made automatically to the default pension fund, which may be the industry wide fund, a specific employer-sponsored plan, or, absent of these alternatives, the employee’s contributions were invested into a “residual” pension fund managed by the National Social Insurance Institute (INPS). Each Employee had until June 30, 2007 to make a decision as to the destination of his TFR allocation.
Note 17. Accrued Warranties
A liability for estimated warranty claims is accrued at the time of sale. The liability is established using historical warranty claim experience. Historical warranty experience is, however, reviewed by management.
The current provision may be adjusted to take into account unusual or non-recurring events in the past or anticipated changes in future warranty claims. Adjustments to the initial warranty accrual are recorded if actual claim experience indicates that adjustments are necessary. Warranty reserves are reviewed to ensure critical assumptions are updated for known events that may impact the potential warranty liability.
The following table summarizes the changes in product warranty liability:
|
|
|
2017 |
|
|
2016 |
|
||
|
Balance January 1, |
|
$ |
1,568 |
|
|
$ |
1,368 |
|
|
Business Acquired |
|
|
— |
|
|
|
— |
|
|
Accrual for warranties issued during the year |
|
|
2,192 |
|
|
|
1,812 |
|
|
Warranty services provided |
|
|
(1,839 |
) |
|
|
(1,695 |
) |
|
Changes in estimates |
|
|
64 |
|
|
|
108 |
|
|
Foreign currency translation |
|
|
45 |
|
|
|
(25 |
) |
|
Balance December 31, |
|
$ |
2,030 |
|
|
$ |
1,568 |
|
Note 18. Geographic Information
Company attributes revenue to different geographic areas based on where items are shipped or services are performed.
74
The following table provides detail of revenues by geographic area for the years ended December 31:
|
|
|
2017 |
|
|
2016 |
|
|
2015 |
|
|||
|
United States |
|
$ |
102,718 |
|
|
$ |
75,639 |
|
|
$ |
95,569 |
|
|
Canada |
|
|
18,205 |
|
|
|
11,332 |
|
|
|
15,102 |
|
|
Italy |
|
|
18,759 |
|
|
|
24,983 |
|
|
|
23,174 |
|
|
Argentina |
|
|
16,101 |
|
|
|
7,662 |
|
|
|
9,617 |
|
|
Chile |
|
|
7,919 |
|
|
|
5,692 |
|
|
|
5,323 |
|
|
United Kingdom |
|
|
6,985 |
|
|
|
9,410 |
|
|
|
8,590 |
|
|
France |
|
|
6,085 |
|
|
|
5,756 |
|
|
|
3,925 |
|
|
Spain |
|
|
4,243 |
|
|
|
2,604 |
|
|
|
3,122 |
|
|
Israel |
|
|
3,660 |
|
|
|
1,069 |
|
|
|
2,333 |
|
|
Germany |
|
|
3,166 |
|
|
|
2,229 |
|
|
|
1,494 |
|
|
Finland |
|
|
2,793 |
|
|
|
3,513 |
|
|
|
1,802 |
|
|
Mexico |
|
|
1,642 |
|
|
|
2,499 |
|
|
|
1,461 |
|
|
Czech Republic |
|
|
1,431 |
|
|
|
818 |
|
|
|
1,875 |
|
|
Ubekistan |
|
|
1,387 |
|
|
|
— |
|
|
|
— |
|
|
Singapore |
|
|
1,138 |
|
|
|
564 |
|
|
|
— |
|
|
South Africa |
|
|
1,082 |
|
|
|
1,282 |
|
|
|
411 |
|
|
Netherlands |
|
|
893 |
|
|
|
1,659 |
|
|
|
570 |
|
|
Hong Kong |
|
|
871 |
|
|
|
1,339 |
|
|
|
2,532 |
|
|
Malaysia |
|
|
804 |
|
|
|
1,173 |
|
|
|
688 |
|
|
United Arab Emirates |
|
|
773 |
|
|
|
937 |
|
|
|
943 |
|
|
Ukraine |
|
|
693 |
|
|
|
693 |
|
|
|
— |
|
|
Saudi Arabia |
|
|
683 |
|
|
|
860 |
|
|
|
1,748 |
|
|
Denmark |
|
|
681 |
|
|
|
471 |
|
|
|
— |
|
|
Indonesia |
|
|
615 |
|
|
|
359 |
|
|
|
— |
|
|
Russia |
|
|
554 |
|
|
|
— |
|
|
|
262 |
|
|
Peru |
|
|
439 |
|
|
|
170 |
|
|
|
1 |
|
|
Switzerland |
|
|
429 |
|
|
|
339 |
|
|
|
439 |
|
|
Morocco |
|
|
425 |
|
|
|
123 |
|
|
|
740 |
|
|
Trinidad and Tobago |
|
|
425 |
|
|
|
— |
|
|
|
— |
|
|
Ireland |
|
|
410 |
|
|
|
535 |
|
|
|
418 |
|
|
Romania |
|
|
362 |
|
|
|
97 |
|
|
|
2,209 |
|
|
Columbia |
|
|
348 |
|
|
|
686 |
|
|
|
— |
|
|
Guadeloupe |
|
|
312 |
|
|
|
— |
|
|
|
— |
|
|
Hungry |
|
|
307 |
|
|
|
— |
|
|
|
— |
|
|
Martinique |
|
|
304 |
|
|
|
— |
|
|
|
— |
|
|
Greece |
|
|
303 |
|
|
|
— |
|
|
|
— |
|
|
Thailand |
|
|
267 |
|
|
|
— |
|
|
|
— |
|
|
Sweden |
|
|
261 |
|
|
|
— |
|
|
|
— |
|
|
Taiwan |
|
|
229 |
|
|
|
— |
|
|
|
— |
|
|
Turkey |
|
|
202 |
|
|
|
476 |
|
|
|
5,003 |
|
|
Kuwait |
|
|
173 |
|
|
|
721 |
|
|
|
— |
|
|
Oman |
|
|
163 |
|
|
|
— |
|
|
|
— |
|
|
Australia |
|
|
157 |
|
|
|
313 |
|
|
|
164 |
|
|
Portugal |
|
|
156 |
|
|
|
— |
|
|
|
— |
|
|
Estonia |
|
|
151 |
|
|
|
— |
|
|
|
— |
|
|
Poland |
|
|
151 |
|
|
|
83 |
|
|
|
347 |
|
|
Bulgaria |
|
|
125 |
|
|
|
— |
|
|
|
- |
|
|
Norway |
|
|
125 |
|
|
|
650 |
|
|
|
1,112 |
|
|
Lebanon |
|
|
88 |
|
|
|
— |
|
|
|
682 |
|
|
New Zealand |
|
|
81 |
|
|
|
276 |
|
|
|
687 |
|
|
Brazil |
|
|
74 |
|
|
|
1 |
|
|
|
— |
|
|
Algeria |
|
|
56 |
|
|
|
89 |
|
|
|
— |
|
|
Korea |
|
|
— |
|
|
|
785 |
|
|
|
— |
|
|
Bahrain |
|
|
— |
|
|
|
530 |
|
|
|
— |
|
|
Iraq |
|
|
— |
|
|
|
— |
|
|
|
5,302 |
|
|
Japan |
|
|
— |
|
|
|
— |
|
|
|
6 |
|
|
Kenya |
|
|
— |
|
|
|
— |
|
|
|
1,903 |
|
|
Qatar |
|
|
— |
|
|
|
— |
|
|
|
1,944 |
|
|
Slovakia |
|
|
— |
|
|
|
— |
|
|
|
93 |
|
|
Venezuela |
|
|
— |
|
|
|
— |
|
|
|
128 |
|
|
Other |
|
|
2,708 |
|
|
|
4,780 |
|
|
|
1,028 |
|
|
|
|
$ |
213,112 |
|
|
$ |
173,197 |
|
|
$ |
202,747 |
|
Company attributes revenue to different geographic areas based on where items are shipped or services are performed.
75
Long Lived Assets
|
|
|
2017 |
|
|
2016 |
|
||
|
United States |
|
|
34,547 |
|
|
|
20,180 |
|
|
Italy |
|
|
79,025 |
|
|
|
74,463 |
|
|
Long-term assets of discontinued operations |
|
|
— |
|
|
|
72,177 |
|
|
Total Long-Lived Assets |
|
$ |
113,572 |
|
|
$ |
166,820 |
|
Long-Lived Assets are based on where the operating unit is domiciled.
Note 19. Acquisition and Investment
PM Group
On July 21, 2014 Manitex International, Inc. (the “Company”) entered into a series of agreements to acquire PM S.p.A, (“PM Group”), a manufacturer of truck mounted cranes based in San Cesario sul Panaro, Modena, Italy. On January 15, 2015, the Company’s acquisition of PM closed.
The fair value of the purchase consideration is shown below:
|
|
|
Fair Value Euros |
|
|
Fair Value U.S. Dollars |
|
||
|
Cash |
|
€ |
17,142 |
|
|
$ |
20,312 |
|
|
994,483 shares of common stock of Manitex International, Inc. |
|
|
8,710 |
|
|
|
10,124 |
|
|
Total purchase consideration |
|
€ |
25,852 |
|
|
$ |
30,436 |
|
Under the acquisition method of accounting, in accordance ASC 805, Business Combinations, the assets acquired and liabilities assumed are valued based on their estimated fair values as of the date of the acquisition. The excess of the purchase price over the aggregate estimated fair value of net assets acquired was allocated to goodwill. During the year ended December 31, 2015, it was stated that the purchase price allocation was preliminary and was subject to final review of certain items including inventory, accrual and receivable balances. During the year ended December 31, 2015, the purchase price allocation was adjusted. Adjustments for the following reasons to the previously reported provisional assets or liabilities were made. The adjustment had the following impact on goodwill:
|
Adjustment to reduce the value of certain accounts receivables based on obtaining additional information |
|
$ |
260 |
|
|
Eliminate value assigned to fixed assets determined not to exist at date of acquisition |
|
|
392 |
|
|
Adjustments to deferred tax assets to reflect corrected value |
|
|
(1,187 |
) |
|
Adjustment to assumed non-recourse debt to reflect correct value |
|
|
(344 |
) |
|
Net impact on goodwill |
|
$ |
(879 |
) |
The balance sheet at January 15, 2015 was restated to reflect the above changes to PM Group purchase price allocations as follows:
|
Account |
|
Provisional amounts recorded as of January 15, 2015 |
|
|
Adjustment to purchase price allocation |
|
|
Revised amount recorded as of January 15, 2015 |
|
|||
|
Goodwill |
|
$ |
31,052 |
|
|
$ |
(879 |
) |
|
$ |
30,173 |
|
|
Accounts receivable |
|
|
22,475 |
|
|
|
(260 |
) |
|
|
22,215 |
|
|
Fixed assets |
|
|
17,344 |
|
|
|
(392 |
) |
|
|
16,952 |
|
|
Deferred tax asset |
|
|
9,680 |
|
|
|
1,187 |
|
|
|
10,867 |
|
|
Assumed non-recourse debt |
|
|
(60,702 |
) |
|
|
344 |
|
|
|
(60,358 |
) |
The above adjustments are non-cash items and, therefore, do not have an impact on the Statement of Cash Flows for the period ended December 31, 2015.
76
The following table summarizes the revised allocation of the PM Group acquisition consideration to the fair value of the assets acquired and liabilities assumed at the date of acquisition:
Purchase price allocation:
|
Cash invested in PM |
|
€ |
5,994 |
|
|
$ |
6,965 |
|
|
Trade receivables |
|
|
18,795 |
|
|
|
22,215 |
|
|
Inventory |
|
|
20,088 |
|
|
|
23,743 |
|
|
Other receivables and prepaid expenses |
|
|
3,746 |
|
|
|
4,428 |
|
|
Total fixed assets |
|
|
14,342 |
|
|
|
16,952 |
|
|
Customer relationships |
|
|
10,841 |
|
|
|
12,813 |
|
|
Trade name and trademarks |
|
|
5,850 |
|
|
|
6,914 |
|
|
Patented & Unpatented Technology |
|
|
7,657 |
|
|
|
9,050 |
|
|
Goodwill |
|
|
25,528 |
|
|
|
30,173 |
|
|
Deferred net tax assets |
|
|
9,195 |
|
|
|
10,867 |
|
|
Other long term assets |
|
|
2 |
|
|
|
2 |
|
|
Accounts payable |
|
|
(22,020 |
) |
|
|
(26,026 |
) |
|
Accrued expenses |
|
|
(7,343 |
) |
|
|
(8,679 |
) |
|
Other current liabilities |
|
|
(1,188 |
) |
|
|
(1,404 |
) |
|
Deferred tax liability |
|
|
(11,595 |
) |
|
|
(13,705 |
) |
|
Other long term liabilities |
|
|
(2,973 |
) |
|
|
(3,514 |
) |
|
Assumed non-recourse debt |
|
|
(51,067 |
) |
|
|
(60,358 |
) |
|
Net assets acquired |
|
€ |
25,852 |
|
|
$ |
30,436 |
|
Contingent Liability: In accordance with ASC 805, the acquirer is to recognize the acquisition date fair value of contingent liability. The Company entered into an Option Agreement with one of the PM Group senior banks under which the bank will sell to the Company PM debt with a face value of €5,000. Under the Option Agreement, the bank shall receive €2,500 if PM has 2017 EBITDA, as defined in the agreement, of between €14,500 and €16,500, and €5,000 if 2017 EBITDA exceeds €16,500. If 2017 EBITDA, as defined in the agreement, is less than €14,500, the bank is to sell the debt to the Company for €0.001. Given the disparity between the EBITDA threshold and the Company’s projected financial results, it was determined that a Monte Carlo simulation analysis was appropriate to determine the fair value of contingent consideration. It was determined that the probability weighted average payment is €1,093 or $1,270. Based thereon, we determined the fair value of the contingent liability to be €1,093 or $1,270. This amount is included in other long-term liabilities in the above table.
Non-recourse PM debt: Under the transaction, PM remains obligated for the following debt:
|
Term debt—interest bearing |
|
€ |
22,956 |
|
|
$ |
27,133 |
|
|
Term debt—non-interest bearing |
|
|
10,289 |
|
|
|
12,161 |
|
|
Fair market adjustment for non-interest bearing debt |
|
|
(1,460 |
) |
|
|
(1,726 |
) |
|
Working capital borrowings |
|
|
18,827 |
|
|
|
22,252 |
|
|
Interest rate swap derivative contract |
|
|
1,720 |
|
|
|
2,033 |
|
|
Debt issuance costs |
|
|
(1,265 |
) |
|
|
(1,495 |
) |
|
Total assumed non-recourse debt |
|
€ |
51,067 |
|
|
$ |
60,358 |
|
Non-interest bearing debt: In connection with the acquisition, the Company assumed non-interest bearing debt of €10,289. The fair value of the non-interest bearing debt was determined to be €8,829 or $10,435. The fair value of the non-interest bearing debt was calculated to equal the present value of future debt payments discounted at a market rate of return commensurate with similar debt instruments with comparable levels of risk and marketability. A rate of 5.24% was determined to be the appropriate rate following an assessment of the risk inherent in the debt issued and the market rate for debt of this nature using corporate credit ratings.
The interest rate swap derivative was valued at its fair value, which is based on quotes from a financial institution.
Tangible assets and liabilities: The tangible assets and liabilities were valued at their respective carrying values by PM, except for certain adjustments necessary to state such amounts at their estimated fair values at the acquisition date. Significant fair market adjustments were made to decrease accounts receivable by $260, increase inventory by $911, decrease fixed assets by $4,699 and to decrease liabilities by $345.
77
Intangible assets: There are three fundamental methods applied to value intangible assets outlined in FASB ASC 820. These methods include the Cost Approach, the Market Approach, and the Income Approach. Each of these valuation approaches were considered in our estimation of value.
Trade names and trademarks, patented and unpatented technology: Valued using the Relief from Royalty method, a form of both the Market Approach and the Income Approach. Because the Company has established trade names and trademarks and has developed patented and unpatented technology, we estimated the benefit of ownership as the relief from the royalty expense that would need to be incurred in absence of ownership.
Customer relationships: Because there is a specific earnings stream that can be associated with customer relationships, we determined the fair value of these relationships based on the excess earnings method, a form of the Income Approach.
Goodwill: Goodwill represents the excess of total consideration paid and the fair value of net assets acquired. The recognition of goodwill of $30,173 reflects the inherent value in the PM reputation, which has been built since being founded in 1959 and the prospects for significant future earnings.
In calculating the Company’s deferred tax liabilities the fact that goodwill is not deductible was considered.
Acquisition transaction costs: Cost and expenses related to the acquisition have been expensed as incurred and recorded in selling, general and administrative expenses. The Company incurred fees of $194 for legal services, $750 for acquisition related bonus payments, $347 for accounting services in connection with the prior year audit of PM financial statements and $294 for other costs related to the acquisition.
The results of the acquired PM operations have been included in our consolidated statement of operations since the acquisition date. PM is included in the Lifting Equipment segment for segment reporting purposes.
Note 20. Equity
Issuance of Common Stock
On July 25, 2017, the Company issued 21,783 shares of common stock with a value of $154 to Avis Industrial Corporation. The shares were issued as part of the consideration paid to purchase the Winona manufacturing facility.
On October 14, 2016 the Company issued 41,948 shares of common stock with a value of $227 to Avis Industrial Corporation as payment for rent of the Company’s Winona, Minnesota facility. The shares were valued based on closing price on October 14, 2016 of $5.41.
At the Market Program
On January 23, 2017, Manitex International Inc. entered into a Controlled Equity Offering Sales Agreement (“Sales Agreement”) with Cantor Fitzgerald & Co. (“Cantor”) pursuant to which the Company may offer and sell shares of its common stock, no par value per share, having an aggregate offering price up to $20 million through Cantor. The Company thought it prudent to put a mechanism in place by which supplemental liquidity can be provided to address working capital requirements or other capital requirements that may arise in conjunction with production requirements. Under the program, the Company’s stock is issued at the current market price and the Company pays a 7% commission to Cantor.
The following table contains information regarding stock issued under the program:
|
Date of Issue |
|
Shares Issued |
|
|
Shares Price |
|
|
Value of Shares Issued |
|
|
Commissions |
|
|
Net Proceeds |
|
|||||
|
January 25, 2017 |
|
|
247,604 |
|
|
$ |
8.8750 |
|
|
$ |
2,197 |
|
|
$ |
154 |
|
|
$ |
2,043 |
|
|
January 27, 2017 |
|
|
27,120 |
|
|
$ |
8.8376 |
|
|
$ |
240 |
|
|
$ |
17 |
|
|
$ |
223 |
|
|
January 30, 2017 |
|
|
1,100 |
|
|
$ |
8.6464 |
|
|
$ |
10 |
|
|
$ |
1 |
|
|
$ |
9 |
|
|
January 31, 2017 |
|
|
18,700 |
|
|
$ |
8.6451 |
|
|
$ |
162 |
|
|
$ |
11 |
|
|
$ |
151 |
|
|
|
|
|
294,524 |
|
|
|
|
|
|
$ |
2,609 |
|
|
$ |
183 |
|
|
$ |
2,426 |
|
78
Shares issued to Terex Corporation
On March 1, 2016, the Company issued 30,425 shares of common stock to Terex Corporation as the Company elected to pay $150 of the final principal payment due March 1, 2016 in shares of the Company’s common stock. The share price for the transaction was $4.93 which was determined based upon the average closing price for the twenty trading days ending the day before the payment was due.
Shares issued to PM Group
On January 15, 2015, the Company’s acquisition of PM Group closed. The aggregate consideration paid by the Company for PM Group was $30,436 which reflects exchange rates in effect at the closing. The consideration consisted of $20,312 of cash, and 994,483 shares of Company common stock valued at $10,124.
Stock issued to employees and Directors
The Company issued shares of common stock to employees and Directors at various times in 2017, 2016 and 2015 as restricted stock units issued under the Company’s 2004 Incentive Plan vested. Upon issuance entries were recorded to increase common stock and decrease paid in capital for the amounts shown below. The following is a summary of stock issuances that occurred during the three year period:
|
Date of Issue |
|
Employees or Director |
|
Shares Issued |
|
|
Value of Shares Issued |
|
||
|
January 1, 2017 |
|
Directors |
|
|
4,290 |
|
|
$ |
54 |
|
|
January 1, 2017 |
|
Employees |
|
|
20,932 |
|
|
|
266 |
|
|
January 4, 2017 |
|
Directors |
|
|
7,675 |
|
|
|
47 |
|
|
January 4, 2017 |
|
Employees |
|
|
42,533 |
|
|
|
258 |
|
|
June 1, 2017 |
|
Employees |
|
|
4,493 |
|
|
|
32 |
|
|
September 15, 2017 |
|
Directors |
|
|
6,600 |
|
|
|
35 |
|
|
October 16, 2017 |
|
Directors |
|
|
6,600 |
|
|
|
59 |
|
|
December 14, 2017 |
|
Directors |
|
|
7,675 |
|
|
|
43 |
|
|
December 14, 2017 |
|
Employees |
|
|
23,353 |
|
|
|
131 |
|
|
|
|
|
|
|
124,151 |
|
|
$ |
925 |
|
|
|
|
|
|
|
|
|
|
|
|
|
|
Date of Issue |
|
Employees or Director |
|
Shares Issued |
|
|
Value of Shares Issued |
|
||
|
January 1, 2016 |
|
Directors |
|
|
4,290 |
|
|
$ |
55 |
|
|
January 1, 2016 |
|
Employees |
|
|
25,920 |
|
|
|
329 |
|
|
June 5, 2016 |
|
Employees |
|
|
642 |
|
|
|
7 |
|
|
September 15, 2016 |
|
Directors |
|
|
6,800 |
|
|
|
36 |
|
|
September 30, 2016 |
|
Employees |
|
|
7,511 |
|
|
|
68 |
|
|
December 31, 2016 |
|
Directors |
|
|
9,915 |
|
|
|
128 |
|
|
December 31, 2016 |
|
Employees |
|
|
13,798 |
|
|
|
218 |
|
|
|
|
|
|
|
68,876 |
|
|
$ |
841 |
|
|
|
|
|
|
|
|
|
|
|
|
|
|
|
|
|
|
|
|
|
|
|
|
|
|
Date of Issue |
|
Employees or Director |
|
Shares Issued |
|
|
Value of Shares Issued |
|
||
|
March 4, 2015 |
|
Directors |
|
|
6,800 |
|
|
$ |
77 |
|
|
March 13, 2015 |
|
Employees |
|
|
22,868 |
|
|
|
212 |
|
|
June 5, 2015 |
|
Employees |
|
|
749 |
|
|
|
12 |
|
|
December 31, 2015 |
|
Employees |
|
|
36,886 |
|
|
|
219 |
|
|
December 31, 2015 |
|
Directors |
|
|
20,620 |
|
|
|
123 |
|
|
|
|
|
|
|
87,923 |
|
|
$ |
643 |
|
79
Stock Repurchase
The Company purchased shares of Common Stock at various times from certain employees at the closing price on date of purchase. The stock was purchased from the employees to satisfy employees’ withholding tax obligations related to stock issuances described above. The following is a summary of common stock purchased during 2017, 2016 and 2015:
|
Date of Purchase |
|
Shares Purchased |
|
|
Closing Price on Date of Purchase |
|
||
|
January 1, 2017 |
|
|
6,312 |
|
|
$ |
6.86 |
|
|
January 4,2017 |
|
|
11,750 |
|
|
$ |
7.27 |
|
|
December 14, 2017 |
|
|
4,758 |
|
|
$ |
8.35 |
|
|
|
|
|
22,820 |
|
|
|
|
|
|
|
|
|
|
|
|
|
|
|
|
January 1, 2016 |
|
|
7,074 |
|
|
$ |
5.95 |
|
|
June 5, 2016 |
|
|
197 |
|
|
$ |
6.75 |
|
|
September 30, 2016 |
|
|
2,254 |
|
|
$ |
5.51 |
|
|
December 31, 2016 |
|
|
3,530 |
|
|
$ |
6.86 |
|
|
|
|
|
13,055 |
|
|
|
|
|
|
|
|
|
|
|
|
|
|
|
|
June 5, 2015 |
|
|
393 |
|
|
$ |
8.54 |
|
|
December 31, 2015 |
|
|
12,125 |
|
|
$ |
5.95 |
|
|
|
|
|
12,518 |
|
|
|
|
|
2004 Equity Incentive Plan
In 2004, the Company adopted the 2004 Equity Incentive Plan and subsequently amended and restated the plan on September 13, 2007, May 28, 2009, June 5, 2013 and June 2, 2016. The maximum number of shares of common stock reserved for issuance under the plan is 1,329,364 shares. The total number of shares reserved for issuance however, can be adjusted to reflect certain corporate transactions or changes in the Company’s capital structure. The Company’s employees and members of the board of directors who are not our employees or employees of our affiliates are eligible to participate in the plan. The plan is administered by a committee of the board comprised of members who are outside directors. The plan provides that the committee has the authority to, among other things, select plan participants, determine the type and amount of awards, determine award terms, fix all other conditions of any awards, interpret the plan and any plan awards. Under the plan, the committee can grant stock options, stock appreciation rights, restricted stock, restricted stock units, performance shares and performance units, except Directors may not be granted stock appreciation rights, performance shares and performance units. During any calendar year, participants are limited in the number of grants they may receive under the plan. In any year, an individual may not receive options for more than 15,000 shares, stock appreciation rights with respect to more than 20,000 shares, more than 20,000 shares of restricted stock and/or an award for more than 10,000 performance shares or restricted stock units or performance units. The plan requires that the exercise price for stock options and stock appreciation rights be not less than fair market value of the Company’s common stock on date of grant.
The Company awarded under the Amended and Restated 2004 Equity Incentive Plan a total of 24,493; 329,325; and 145,979 restricted stock units to employees and directors during 2017, 2016 and 2015, respectively. The restricted stock units are subject to the same conditions as the restricted stock awards except the restricted stock units will not have voting rights and the common stock will not be issued until the vesting criteria are satisfied.
Compensation expense in 2017, 2016 and 2015 includes $798, $1,129 and $1,481 related to restricted stock units, respectively. Compensation expense related to restricted stock units will be $463 and $155 for 2018 and 2019, respectively.
80
The following is a summary of restricted stock units that were awarded during 2017, 2016 and 2015:
|
2017 Grants |
|
Vesting Date |
|
Number of Restricted Stock Units |
|
|
Closing Price on Date of Grant |
|
|
Value of Restricted Stock Units Issued |
|
|||
|
June 1, 2017 |
|
June 1, 2017 4,493 units |
|
|
4,493 |
|
|
$ |
7.01 |
|
|
$ |
31 |
|
|
October 9, 2017 |
|
October 16, 2017 6,600 units; January 15, 2018 6,600 units and October 15, 2018 6,800 units |
|
|
20,000 |
|
|
$ |
9.00 |
|
|
$ |
180 |
|
|
|
|
|
|
|
24,493 |
|
|
|
|
|
|
$ |
211 |
|
|
|
|
|
|
|
|
|
|
|
|
|
|
|
|
|
|
2016 Grants |
|
Vesting Date |
|
Number of Restricted Stock Units |
|
|
Closing Price on Date of Grant |
|
|
Value of Restricted Stock Units Issued |
|
|||
|
January 4, 2016 |
|
January 4, 2017 60,671 units; January 4, 2018 60,671 units and 62,508 units January 4, 2019 |
|
|
183,850 |
|
|
$ |
6.07 |
|
|
$ |
1,116 |
|
|
September 15, 2016 |
|
September 15, 2016 6,800 units; September 15, 2017 6,600 units and September 15, 2018 6,600 units |
|
|
20,000 |
|
|
$ |
5.32 |
|
|
$ |
106 |
|
|
December 14, 2016 |
|
December 14, 2017 41,407 units; December14, 2018 41,407 units and December 14, 2019 42,661 units |
|
|
125,475 |
|
|
$ |
5.60 |
|
|
$ |
703 |
|
|
|
|
|
|
|
329,325 |
|
|
|
|
|
|
$ |
1,925 |
|
|
|
|
|
|
|
|
|
|
|
|
|
|
|
|
|
|
2015 Grants |
|
Vesting Date |
|
Number of Restricted Stock Units |
|
|
Closing Price on Date of Grant |
|
|
Value of Restricted Stock Units Issued |
|
|||
|
January 1, 2015 |
|
January 1, 2016 34,027 units; January 1, 2017 34,027 units and 35,057 units January 1, 2018 |
|
|
103,111 |
|
|
$ |
12.71 |
|
|
$ |
1,311 |
|
|
March 4, 2015 |
|
March 4, 2015 6,800 units, December 31, 2015 6,600 units and December 31, 2016 6,600 units |
|
|
20,000 |
|
|
$ |
11.39 |
|
|
$ |
228 |
|
|
March 13, 2015 |
|
March 13, 2015 22,868 units |
|
|
22,868 |
|
|
$ |
9.25 |
|
|
$ |
212 |
|
|
|
|
|
|
|
145,979 |
|
|
|
|
|
|
$ |
1,751 |
|
The following table contains information regarding restricted stock units for the years ended December 31, 2017, 2016 and 2015, respectively:
|
|
|
Restricted Stock Units |
|
|||||||||
|
|
|
2017 |
|
|
|
2016 |
|
|
|
2015 |
|
|
|
Outstanding on January 1, |
|
|
342,004 |
|
|
|
118,773 |
|
|
|
85,384 |
|
|
Units granted during period |
|
|
24,493 |
|
|
|
329,325 |
|
|
|
145,979 |
|
|
Vested and issued |
|
|
(101,331 |
) |
|
|
(55,821 |
) |
|
|
(87,923 |
) |
|
Vested—issued and repurchased for income tax withholding |
|
|
(22,820 |
) |
|
|
(13,055 |
) |
|
|
(12,518 |
) |
|
Forfeited |
|
|
(73,583 |
) |
|
|
(37,218 |
) |
|
|
(12,149 |
) |
|
Outstanding on December 31 |
|
|
168,763 |
|
|
|
342,004 |
|
|
|
118,773 |
|
Note 21. Recent Accounting Guidance
Recently Issued Pronouncements – Not Adopted
In February 2016, the FASB issued ASU 2016-02, “Leases (Topic 842),” (“ASU 2016-02”), which requires lessees to recognize assets and liabilities for leases with lease terms of more than 12 months and disclose key information about leasing arrangements. Consistent with current U.S. GAAP, the recognition, measurement, and presentation of expenses and cash flows arising from a lease by a lessee primarily will depend on its classification as a finance or operating lease. The update is effective for reporting periods beginning after December 15, 2018. Early adoption is permitted. The Company is in the process of evaluating the impact of this update on its consolidated financial statements.
81
In January 2017, the FASB issued ASU 2017-04, “Intangibles - Goodwill and Other (Topic 350): Simplifying the Test for Goodwill Impairment,” (“ASU 2017-04”). ASU 2017-04 eliminates Step 2 from the goodwill impairment test. Instead, an entity should perform its annual, or interim, goodwill impairment test by comparing the fair value of a reporting unit with its carrying amount. An entity should recognize an impairment charge for the amount by which the carrying amount exceeds the reporting unit’s fair value, if any. The loss recognized should not exceed the total amount of goodwill allocated to that reporting unit. Additionally, an entity should consider income tax effects from any tax deductible goodwill on the carrying amount of the reporting unit when measuring the goodwill impairment. The effective date will be the first quarter of fiscal year 2020, with early adoption permitted in 2017. The Company is evaluating the impact that adoption of this new standard will have on its consolidated financial statements.
Recently Adopted Accounting Guidance
In May 2014, the FASB issued ASU 2014-09, “Revenue from Contracts with Customers,” (“ASU 2014-09”). ASU 2014-09 outlines a new, single comprehensive model for entities to use in accounting for revenue arising from contracts with customers and supersedes most current revenue recognition guidance, including industry-specific guidance. This new revenue recognition model provides a five-step analysis in determining when and how revenue is recognized. The new model will require revenue recognition to depict the transfer of promised goods or services to customers in an amount that reflects the consideration a company expects to receive in exchange for those goods or services. In August 2015, the FASB issued ASU 2015-14, “Deferral of the Effective Date”, which amends ASU 2014-09. As a result, the effective date is the first quarter of 2018, with early adoption permitted. The Company has adopted this guidance during the quarter ended March 31, 2018 on a modified retrospective basis. The adoption of this guidance did not have a significant impact on the operating results when adopted.
In July 2015, the FASB issued ASU 2015-11, “Simplifying the Measurement of Inventory,” (“ASU 2015-11”). ASU 2015-11 requires inventory be measured at the lower of cost and net realizable value and options that currently exist for market value be eliminated. ASU 2015-11 defines net realizable value as estimated selling prices in the ordinary course of business, less reasonably predictable costs of completion, disposal, and transportation. The guidance is effective for reporting periods beginning after December 15, 2016 and interim periods within those fiscal years with early adoption permitted. The Company has adopted this guidance during the quarter ended March 31, 2017 on a prospective basis. The adoption of this guidance did not have a significant impact on the operating results when adopted.
In January 2016, the FASB issued ASU 2016-01, "Financial Instruments-Overall (Subtopic 825-10): Recognition and Measurement of Financial Assets and Financial Liabilities." The amendments in ASU 2016-01, among other things, require equity investments (except those accounted for under the equity method of accounting, or those that result in consolidation of the investee) to be measured at fair value with changes in fair value recognized in net income; requires public business entities to use the exit price notion when measuring fair value of financial instruments for disclosure purposes; requires separate presentation of financial assets and financial liabilities by measurement category and form of financial asset (i.e., securities or loans and receivables); and eliminates the requirement for public business entities to disclose the method(s) and significant assumptions used to estimate fair value that is required to be disclosed for financial instruments measured at amortized cost. The effective date will be the first quarter of fiscal year 2018. The Company has adopted this guidance during the quarter ended March 31, 2018. The adoption of this guidance did not have a significant impact on the operating results when adopted.
In March 2016, the FASB issued ASU 2016-05, “Derivatives and Hedging (Topic 815),” (“ASU 2016-05”). ASU 2016-05 provides guidance clarifying that novation of a derivative contract (i.e. a change in counterparty) in a hedge accounting relationship does not, in and of itself, require designation of that hedge accounting relationship. The Company adopted this guidance during the quarter ended March 31, 2017. The adoption of this guidance did not have an impact on the operating results when adopted.
In March 2016, the FASB issued ASU 2016-06, “Derivatives and Hedging (Topic 815),” (“ASU 2016-06”). ASU 2016-06 simplifies the embedded derivative analysis for debt instruments containing contingent call or put options by clarifying that an exercise contingency does not need to be evaluated to determine whether it relates to interest rates and credit risk in an embedded derivative analysis. The effective date will be the first quarter of fiscal year 2017, with early adoption permitted. The Company has adopted this guidance during the quarter ended March 31, 2017. The adoption of this guidance did not have an impact on the operating results when adopted.
In March 2016, the FASB issued ASU 2016-08, “Revenue from Contracts with Customers (Topic 606) Principal versus Agent Considerations (Reporting Revenue Gross versus Net),” (“ASU 2016-08”). ASU 2016-08 further clarifies principal and agent relationships within ASU 2014-09. Similar to ASU 2014-09, the effective date will be the first quarter of fiscal year 2018 with early adoption permitted in the first quarter of fiscal year 2017. The Company has adopted this guidance during the quarter ended March 31, 2018 on a modified retrospective basis. The adoption of this guidance did not have a significant impact on the operating results when adopted.
82
In March 2016, the FASB issued ASU 2016-09, “Compensation-Stock Compensation (Topic 718), Improvements to Employee Share-Based Payment Accounting,” (“ASU 2016-09”). ASU 2016-09 is intended to simplify several aspects of accounting for share-based payment awards. The effective date will be the first quarter of fiscal year 2017, with early adoption permitted. The Company has adopted the guidance for the year ended December 31, 2017. The adoption of this guidance did not have an impact on the operating results when adopted.
In April 2016, the FASB issued ASU 2016-10, “Revenue from Contracts with Customers (Topic 606), Identifying Performance Obligations and Licensing” (“ASU 2016-10”). The amendments in ASU 2016-10 are expected to reduce the cost and complexity of applying the guidance on identifying promised goods or services in contracts with customers and to improve the operability and understandability of licensing implementation guidance related to the entity's intellectual property. Similar to ASU 2014-09, the effective date will be the first quarter of fiscal year 2018 with early adoption permitted in the first quarter of fiscal year 2017. The Company has adopted this guidance during the quarter ended March 31, 2018 on a modified retrospective basis. The adoption of this guidance did not have a significant impact on the operating results when adopted.
In August 2016, the FASB issued ASU 2016-15, “Statement of Cash Flows (Topic 230) Classification of Certain Cash Receipts and Cash Payments,” (“ASU 2016-15”). ASU 2016-15 reduces the existing diversity in practice in financial reporting by clarifying existing principles in ASC 230, “Statement of Cash Flows,” and provides specific guidance on certain cash flow classification issues. The effective date for ASU 2016-15 will be the first quarter of fiscal year 2018 with early adoption permitted. The Company made an election to use the “Cumulative Earning Approach” to classify distributions received from equity investments. Other than the aforementioned election (which may have a future impact), the adoption of this guidance during the quarter ended March 31, 2018, did not have an impact on the Company’s Statement of Cash Flows.
In October 2016, the FASB issued ASU 2016-16, “Income Taxes (Topic 740) - Intra-Entity Transfer of Assets Other than Inventory,” (“ASU 2016-16”). ASU 2016-16 requires recognition of current and deferred income taxes resulting from an intra-entity transfer of any asset (excluding inventory) when the transfer occurs. This is a change from existing GAAP which prohibits recognition of current and deferred income taxes until the asset is sold to a third party. The effective date for ASU 2016-16 will be the first quarter of fiscal year 2018 with early adoption permitted. The Company has adopted this guidance during the quarter ended March 31, 2018. The adoption of this guidance did not have a significant impact on the operating results when adopted.
In January 2017, the FASB issued ASU 2017-01, “Business Combinations (Topic 805): Clarifying the Definition of a Business,” (“ASU 2017-01”). ASU 2017-01 provides guidance in ascertaining whether a collection of assets and activities is considered a business. The effective date will be the first quarter of fiscal year 2018, with prospective application. The Company is evaluating the impact that adoption of this new standard will have on its consolidated financial statements. The Company has adopted this guidance during the quarter ended March 31, 2018. The adoption of this guidance did not have an impact on the operating results when adopted.
In May 2017, the FASB issued ASU 2017-09, “Compensation-Stock Compensation (Topic 718): Scope of Modification Accounting,” (“ASU 2017-09”). ASU 2017-09 clarifies when changes to the terms or conditions of a share-based payment award must be accounted for as modifications. The new guidance will reduce diversity in practice and result in fewer changes to the terms of an award being accounted for as modifications. Under ASU 2017-09, an entity will not apply modification accounting to a share-based payment award if the award’s fair value, vesting conditions and classification as an equity or liability instrument are the same immediately before and after the change. ASU 2017-09 will be applied prospectively to awards modified on or after the adoption date. The effective date will be the first quarter of fiscal year 2018 and early adoption is permitted. Adoption is not expected to have a material effect on the Company’s consolidated financial statements.
Except as noted above, the guidance issued by the FASB during the current year is not expected to have a material effect on the Company’s consolidated financial statements.
Note 22. Transactions between the Company and Related Parties
In the course of conducting its business, the Company has entered into certain related party transactions.
On December 16, 2014, Manitex International, Inc. (the “Company”), BGI USA Inc. (“BGI”), Movedesign SRL and R & S Advisory S.r.l., entered into an operating agreement (the “Operating Agreement”) for Lift Ventures LLC (“Lift Ventures”), a joint venture entity. The purposes for which Lift Ventures is organized are the manufacturing and selling of certain products and components, including the Schaeff line of electric forklifts and certain LiftKing products. Pursuant to the Operating Agreement, the Company was granted a 25% equity stake in the Lift Ventures in exchange for the contribution of certain inventory and a license of certain intellectual property related to the Company’s products.
83
As a result of the sale, in the third quarter of 2016, of the Company's Liftking subsidiary, Lift Ventures LLC will no longer have the right to sell Schaeff and Liftking products in the future. Additionally, as a result of certain financial difficulties experienced by the partner, who was to contribute design services, it will not be able to provide such services. As a result of these events, the Company has determined that its investment in the Lift Ventures has become impaired and has recognized an impairment charge of $5,647 to write off its entire investment in Lift Ventures LLC.
The Company, through its Manitex and Manitex Liftking subsidiaries, purchases and sells parts to BGI USA, Inc. (“BGI”) including its subsidiary SL Industries, Ltd (“SL”). BGI is a distributor of assembly parts used to manufacture various lifting equipment. SL Industries, Ltd is a Bulgarian subsidiary of BGI that manufactures fabricated and welded components used to manufacture various lifting equipment. The former President of Manufacturing Operations is the majority owner of BGI.
The Company through its Manitex Liftking subsidiary provides parts and services to LiftMaster, Ltd (“LiftMaster”) or purchases parts or services from LiftMaster. LiftMaster is a rental company that rents and services rough terrain forklifts. LiftMaster is owned by the Vice President of a wholly owned subsidiary of the Company, Manitex Liftking, ULC, and a relative of his.
As of December 31, 2017 the Company had an accounts receivable of $28 and $26 from SL and ASV, respectively and accounts payable of $1,060, $225 and $100 to BGI, SL and Terex, respectively. As of December 31, 2016 the Company had an accounts receivable of $47 and $22 from SL and Lift Ventures, respectively and accounts payable of $471, $749, $7 and $940 to SL, Lift Ventures, BGI and Terex, respectively. As of December 31, 2015 the Company had an accounts receivable of $157 and $41 from SL and Lift Ventures, respectively and accounts payable of $150, $244 and $2 to SL, Lift Ventures and BGI respectively.
The following is a summary of the amounts attributable to certain related party transactions as described in the footnotes to the table, for the periods indicated:
|
|
|
2017 |
|
|
2016 |
|
|
|
2015 |
|
||
|
Bridgeview Facility (1) |
|
$ |
263 |
|
|
$ |
259 |
|
|
$ |
256 |
|
|
Sales to: |
|
|
|
|
|
|
|
|
|
|
|
|
|
SL Industries, Ltd |
|
|
8 |
|
|
|
1 |
|
|
|
4 |
|
|
Terex |
|
|
34 |
|
|
|
— |
|
|
|
— |
|
|
BGI |
|
|
— |
|
|
|
— |
|
|
|
3 |
|
|
Lift Ventures |
|
|
— |
|
|
|
14 |
|
|
|
— |
|
|
LiftMaster (2) |
|
|
|
|
|
|
— |
|
|
|
1 |
|
|
Total Sales |
|
|
42 |
|
|
|
15 |
|
|
|
8 |
|
|
Inventory Purchases from: |
|
|
|
|
|
|
|
|
|
|
|
|
|
SL Industries, Ltd |
|
|
564 |
|
|
|
15 |
|
|
|
1,872 |
|
|
Lift Ventures |
|
|
618 |
|
|
|
1,985 |
|
|
|
524 |
|
|
BGI |
|
|
2,886 |
|
|
|
— |
|
|
|
7 |
|
|
Terex |
|
|
990 |
|
|
|
1,723 |
|
|
|
647 |
|
|
Total Inventory Purchases |
|
$ |
5,058 |
|
|
$ |
3,723 |
|
|
$ |
3,050 |
|
|
(1) |
The Company leases its 40,000 sq. ft. Bridgeview facility from an entity controlled by Mr. David Langevin, the Company’s Chairman and CEO. Pursuant to the terms of the lease, the Company makes monthly lease payments of $22. The Company is also responsible for all the associated operations expenses, including insurance, property taxes, and repairs. The lease will expire on June 30, 2020 and has a provision for six one year extension periods. The lease contains a rental escalation clause under which annual rent is increased during the initial lease term by the lesser of the increase in the Consumer Price Increase or 2.0%. Rent for any extension period shall however, be the then-market rate for similar industrial buildings within the market area. The Company has the option, to purchase the building by giving the Landlord written notice at any time prior to the date that is 180 days prior to the expiration of the lease or any extension period. The Landlord can require the Company to purchase the building if a change of Control Event, as defined in the agreement occurs by giving written notice to the Company at any time prior to the date that is 180 days prior to the expiration of the lease or any extension period. The purchase price regardless whether the purchase is initiated by the Company or the landlord will be the Fair Market Value as of the closing date of said sale. |
|
(2) |
The Company provided parts and services to LiftMaster, Inc. LiftMaster is a rental company that rents and services rough terrain forklifts. LiftMaster is owned by a relative of an Officer of Manitex Liftking, ULC, before it was sold on September 30, 2016. |
84
Transactions with Terex
On December 19, 2014, Terex became a related party. At December 31, 2017 and 2016, the Company has the following notes payable to Terex:
|
|
|
Years Ended December 31, |
|
|||||
|
|
|
2017 |
|
|
2016 |
|
||
|
Note payable related to ASV acquisition |
|
$ |
— |
|
|
$ |
1,594 |
|
|
Convertible note |
|
$ |
7,005 |
|
|
$ |
6,862 |
|
See Note 11 and Note 13 for additional details regarding the above debt obligations.
On March 4, 2016, CVS and Terex Operations Italy S.R.L. (“TOI”) entered into an agreement whereby TOI acquired certain inventories and intellectual property related to CVS’ terminal tractor line. The transaction totaled €2,839 ($3,119) inclusive of VAT taxes and resulted in a gain of €1,987 ($2,212), which is included in loss on sale of discontinued operations. The transaction also contained a contract manufacturing requirement for CVS to continue production of the terminal tractor line for TOI for a period of nine months. After this period of time CVS will have the access to terminal tractor equipment directly from TOI under a private label agreement.
Note 23. Legal Proceedings and Other Contingencies
The Company is involved in various legal proceedings, including product liability, employment related issues, and workers’ compensation matters which have arisen in the normal course of operations. The Company has product liability insurance with self-insurance retention that range from $50 to $500.
Certain cases are at a preliminary stage, and it is not possible to estimate the amount or timing of any cost to the Company. However, the Company does not believe that these contingencies, in the aggregate, will have a material adverse effect on the Company.
Additionally, the Company has been named as a defendant in several multi-defendant asbestos related product liability lawsuits. In certain instances, the Company is indemnified by a former owner of the product line in question. In the remaining cases the plaintiff has, to date, not been able to establish any exposure by the plaintiff to the Company’s products. The Company is uninsured with respect to these claims but believes that it will not incur any material liability with respect to these to claims.
When it is probable that a loss has been incurred and possible to make a reasonable estimate of the Company’s liability with respect to such matters, a provision is recorded for the amount of such estimate or the minimum amount of a range of estimates when it is not possible to estimate the amount within the range that is most likely to occur. The Company established reserves for several PM lawsuits in conjunction with the accounting for this acquisition.
Additionally beginning on December 31, 2011, the Company’s worker’s compensation insurance policy has per claim deductible of $250 and annual aggregates of $1,000 to $1,875 depending on the policy year. The Company is fully insured for any amount on any individual claim that exceeds the deductible and for any additional amounts of all claims once the aggregate is reached. The Company currently has several worker’s compensation claims related to injuries that occurred after December 31, 2011 and therefore are subject to a deductible. The Company does not believe that the contingencies associated with these worker compensation claims in aggregate will have a material adverse effect on the Company.
On May 5, 2011, Company entered into two separate settlement agreements with two plaintiffs. As of December 31, 2017, the Company has a remaining obligation under the agreements to pay the plaintiffs $1,330 without interest in 14 annual installments of $95 on or before May 22 each year. The Company has recorded a liability for the net present value of the liability. The difference between the net present value and the total payment will be charged to interest expense over payment period.
It is reasonably possible that the “Estimated Reserve for Product Liability Claims” may change within the next 12 months. A change in estimate could occur if a case is settled for more or less than anticipated, or if additional information becomes known to the Company.
Romania Income Tax Audit
As described in Note 14, Income Taxes, the Company increased its unrecognized tax benefits in connection with the Romanian tax audit and pending legal proceedings.
85
Residual Value Guarantees
The Company issues partial residual value guarantees to support a customer’s financing of equipment purchased from the Company. A residual value guarantee involves a guarantee that a piece of equipment will have a minimum fair market value at a future date if certain conditions are met by the customer. The Company has issued partial residual guarantees that have maximum exposure of approximately $1.6 million in the aggregate. The Company does not have any reason to believe that any exposure from such a guarantee is either probable or estimable at this time, as such, no liability has been recorded. The Company’s ability to recover losses experienced from its guarantees may be affected by economic conditions in used equipment markets at the time of loss.
SEC Inquiry
The Company has received an inquiry from the SEC requesting certain information in connection with the Company’s previously announced restatement of prior financial statements, and is complying with such request.
Note 24. Unaudited Quarterly Financial Data
Summarized quarterly financial data for 2017 and 2016 are as follows (in thousands, except per share amounts).
|
|
|
2017 |
|
|
2016 |
|
||||||||||||||||||||||||||
|
|
|
1st Qtr |
|
|
2nd Qtr |
|
|
3rd Qtr |
|
|
4th Qtr |
|
|
1st Qtr |
|
|
2nd Qtr |
|
|
3rd Qtr |
|
|
4th Qtr |
|
||||||||
|
Net revenues |
|
$ |
40,119 |
|
|
$ |
52,051 |
|
|
$ |
56,464 |
|
|
$ |
64,478 |
|
|
$ |
47,230 |
|
|
$ |
45,745 |
|
|
$ |
39,131 |
|
|
$ |
41,091 |
|
|
Gross Profit |
|
|
7,392 |
|
|
|
9,404 |
|
|
|
9,873 |
|
|
|
10,177 |
|
|
|
8,745 |
|
|
|
8,161 |
|
|
|
6,542 |
|
|
|
6,489 |
|
|
Net (loss) income from continuing operations attributable to shareholders of Manitex International,Inc. |
|
|
(3,425 |
) |
|
|
(1,490 |
) |
|
|
(1,522 |
) |
|
|
(630 |
) |
|
|
(2,700 |
) |
|
|
(5,192 |
) |
|
|
(9,335 |
) |
|
|
(5,962 |
) |
|
Net income (loss) from discontinued operations attributable to shareholders of Manitex International, Inc. |
|
|
137 |
|
|
|
(971 |
) |
|
|
15 |
|
|
|
(192 |
) |
|
|
2,655 |
|
|
|
4,822 |
|
|
|
(14,047 |
) |
|
|
(7,334 |
) |
|
Net loss attributable to shareholders of Manitex International, Inc. |
|
$ |
(3,288 |
) |
|
$ |
(2,461 |
) |
|
$ |
(1,507 |
) |
|
$ |
(822 |
) |
|
$ |
(45 |
) |
|
$ |
(370 |
) |
|
$ |
(23,382 |
) |
|
$ |
(13,296 |
) |
|
Earnings (Loss) per Share |
|
|
|
|
|
|
|
|
|
|
|
|
|
|
|
|
|
|
|
|
|
|
|
|
|
|
|
|
|
|
|
|
|
Basic |
|
|
|
|
|
|
|
|
|
|
|
|
|
|
|
|
|
|
|
|
|
|
|
|
|
|
|
|
|
|
|
|
|
Loss from continuing operations attributable to shareholders of Manitex International, Inc. |
|
$ |
(0.21 |
) |
|
$ |
(0.09 |
) |
|
$ |
(0.09 |
) |
|
$ |
(0.04 |
) |
|
$ |
(0.17 |
) |
|
$ |
(0.32 |
) |
|
$ |
(0.58 |
) |
|
$ |
(0.37 |
) |
|
Earnings (Loss) from discontinued operations attributable to shareholders of Manitex International, Inc. |
|
$ |
0.01 |
|
|
$ |
(0.06 |
) |
|
$ |
0.00 |
|
|
$ |
(0.01 |
) |
|
$ |
0.16 |
|
|
$ |
0.30 |
|
|
$ |
(0.87 |
) |
|
$ |
(0.45 |
) |
|
Loss attributable to shareholders of Manitex International, Inc. |
|
$ |
(0.20 |
) |
|
$ |
(0.15 |
) |
|
$ |
(0.09 |
) |
|
$ |
(0.05 |
) |
|
$ |
(0.00 |
) |
|
$ |
(0.02 |
) |
|
$ |
(1.45 |
) |
|
$ |
(0.82 |
) |
|
Diluted |
|
|
|
|
|
|
|
|
|
|
|
|
|
|
|
|
|
|
|
|
|
|
|
|
|
|
|
|
|
|
|
|
|
Loss from continuing operations attributable to shareholders of Manitex International, Inc. |
|
$ |
(0.21 |
) |
|
$ |
(0.09 |
) |
|
$ |
(0.09 |
) |
|
$ |
(0.04 |
) |
|
$ |
(0.17 |
) |
|
$ |
(0.32 |
) |
|
$ |
(0.58 |
) |
|
$ |
(0.37 |
) |
|
Earnings (Loss) from discontinued operations attributable to shareholders of Manitex International, Inc. |
|
$ |
0.01 |
|
|
$ |
(0.06 |
) |
|
$ |
0.00 |
|
|
$ |
(0.01 |
) |
|
$ |
0.16 |
|
|
$ |
0.30 |
|
|
$ |
(0.87 |
) |
|
$ |
(0.45 |
) |
|
Loss attributable to shareholders of Manitex International, Inc. |
|
$ |
(0.20 |
) |
|
$ |
(0.15 |
) |
|
$ |
(0.09 |
) |
|
$ |
(0.05 |
) |
|
$ |
(0.00 |
) |
|
$ |
(0.02 |
) |
|
$ |
(1.45 |
) |
|
$ |
(0.82 |
) |
|
Shares outstanding |
|
|
|
|
|
|
|
|
|
|
|
|
|
|
|
|
|
|
|
|
|
|
|
|
|
|
|
|
|
|
|
|
|
Basic |
|
|
16,559,343 |
|
|
|
16,553,667 |
|
|
|
16,573,927 |
|
|
|
16,595,726 |
|
|
|
16,105,601 |
|
|
|
16,125,788 |
|
|
|
16,127,346 |
|
|
|
16,174,403 |
|
|
Diluted |
|
|
16,559,343 |
|
|
|
16,553,667 |
|
|
|
16,573,927 |
|
|
|
16,595,726 |
|
|
|
16,105,601 |
|
|
|
16,125,788 |
|
|
|
16,127,346 |
|
|
|
16,174,403 |
|
Note 25. Discontinued Operations
Company Sells Load King
On December 28, 2015, the Company completed the sale of the membership interests of Load King, LLC, a Michigan limited liability company previously known as Manitex Load King, Inc. (“Load King”) pursuant to a Purchase Agreement (the “Purchase Agreement”) with Utility One Source Forestry Equipment LLC, a Delaware limited liability company (the “Buyer”). The Company owned all of the outstanding membership interests of Load King prior to the completion of the transaction.
The Company received cash consideration of $6,525 in connection with sale of Load King. The company recognized a pre-tax loss of $2,142 on the sale including transaction expenses of $720, with a corresponding tax benefit of $764.
86
Company Sells Liftking
On September 30, 2016, the Company completed the sale of Manitex Liftking, ULC, an Alberta unlimited liability corporation pursuant to a Share Purchase Agreement (the “Liftking Purchase Agreement”) with Mi-Jack Products, Inc. and its wholly-owned subsidiary Liftking Acquisition ULC.
The Company received cash consideration of $14 million. The Company recognized a pre-tax loss of $9,296 on the sale including transaction expenses of $551. The pre-tax loss includes a non-cash portion related to intangible assets and goodwill write-offs of $2,710 and $3,686, respectively. The aforementioned intangible and goodwill represents an allocation of a portion of the Lifting Equipment segment’s intangibles and goodwill that existed on the date of sale. The allocation percentage was arrived at by computing the full value of the Lifting Equipment segment and subtracting the value of the cash consideration that the Company received related to the Liftking disposition. The Company did record an income tax benefit of $453 attributable to this transaction.
Company Sells CVS
On December 22, 2016, Manitex International, Inc. (the “Company”) completed the sale of its CVS Ferrari srl (“CVS”) subsidiary to two Italian companies BP S.r.l. and NEIP III S.p.A. (collectively the “Purchasers”) for $5 million in cash, less $1.3 million payable for inventory due in 2017, and the assumption of $14 million of net CVS debt (the “Transaction”). The Transaction was consummated pursuant to a Sale and Purchase Agreement between the Company and the Purchasers (the “Purchase Agreement”). The Purchasers are privately-held manufacturers and service providers for terminal handling equipment provided around the world. As part of the transaction, the Company retained the operations of CVS’s Valla division, which offers a full range of electric precision pick and carry cranes.
The Company recognized a pre-tax loss of $7,984 on the sale including transaction expenses of $650. The pre-tax loss includes a non-cash portion related to intangible assets and goodwill write-offs of $2,649 and $4,358, respectively. The aforementioned intangible and goodwill represents an allocation of a portion of CVS’s segment’s intangibles and goodwill that existed on the date of sale. The allocation percentage was arrived at by computing the full value of the Lifting Equipment segment and subtracting the value of the cash consideration that the Company received related to the CVS disposition. The Company did record an income tax benefit of $100 attributable to this transaction.
As disclosed in Note 22, in March 2016 the Company recognized a gain of $2,212 from the sale of inventory and intellectual property related to CVS’s terminal tractor line.
Sale of ASV Shares
On May 11, 2017, in anticipation of an initial public offering, ASV Holdings converted from an LLC to a C-Corporation and the Company’s 51% interest was converted to 4,080,000 common shares of ASV Holdings. On May 17, 2017, in connection within its initial public offering (“IPO”), ASV Holdings sold 1,800,000 of its own shares and the Company sold 2,000,000 shares of ASV Holdings common stock. After the IPO, the Company held a 21.2% interest in ASV Holdings, but no longer has a controlling interest in ASV holdings. ASV Holdings was deconsolidated during the quarter ended June 30, 2017 and is recorded as an equity investment starting with quarter ended June 30, 2017. The Company recognized a loss of $1,133 in connection with the sale of these shares.
Following the sale of the above referenced shares, the Company had significant continuing involvement with ASV in the form of an equity investment (21.2% ownership in ASV). At the time of the above transaction, the Company plans were to hold the remaining shares it owned in ASV for an indefinite period. Although the Company had no plans to sell additional shares, the sale of additional shares in the future remained an option. If the Company were to sell more than 117,600 shares, the Company would cease to account for its investment in ASV as an Equity Investment.
87
Over the period from February 26-28, 2018, the Company sold an aggregate of 1,000,000 shares of ASV Holdings, Inc. in privately-negotiated transactions with institutional purchasers. All such shares were sold for $7.00 per share. Following such sale transactions, the Company owns an aggregate of 1,080,000 shares of ASV Holdings, Inc., which equates to an ownership of approximately 11%. After the sale of the shares, the Company no longer accounts for the investment in ASV using the equity method of accounting. The Company incurred a loss of $205 on the sale these shares.
The following is the detail of major classes of assets and liabilities of discontinued operations that were summarized on the Company’s Consolidated Balance Sheets:
|
|
|
December 31, 2016 |
|
|
|
ASSETS |
|
|
|
|
|
Current assets |
|
|
|
|
|
Cash |
|
$ |
573 |
|
|
Restricted cash |
|
|
535 |
|
|
Trade receivables (net) |
|
|
13,603 |
|
|
Accounts receivable from related parties |
|
|
501 |
|
|
Other receivables |
|
|
— |
|
|
Inventory, net |
|
|
30,922 |
|
|
Prepaid expense and other |
|
|
511 |
|
|
Total current assets of discontinued operations |
|
|
46,645 |
|
|
Long-term assets |
|
|
|
|
|
Total fixed assets (net) |
|
|
15,402 |
|
|
Intangible assets (net) |
|
|
25,824 |
|
|
Goodwill |
|
|
30,579 |
|
|
Other long-term assets |
|
|
372 |
|
|
Total long-term assets of discontinued operations |
|
|
72,177 |
|
|
Total assets of discontinued operations |
|
$ |
118,822 |
|
|
|
|
|
|
|
|
Current liabilities |
|
|
|
|
|
Notes payable—short-term |
|
$ |
3,000 |
|
|
Revolving credit facilities |
|
|
— |
|
|
Accounts payable |
|
|
11,976 |
|
|
Accounts payable related paries |
|
|
2,275 |
|
|
Accrued expenses |
|
|
6,380 |
|
|
Other current liabilities |
|
|
— |
|
|
Total current liabilities of discontinued operations |
|
|
23,631 |
|
|
Long-term liabilities |
|
|
|
|
|
Notes payable - long-term |
|
|
26,267 |
|
|
Revolving credit facilities |
|
|
15,605 |
|
|
Other long-term liabilities |
|
|
773 |
|
|
Total long-term liabilities of discontinued operations |
|
|
42,645 |
|
|
Total liabilities of discontinued operations |
|
$ |
66,276 |
|
88
The following is the detail of major line items that constitute the loss from discontinued operations:
|
|
|
For the Year Ended December 31, |
|
|||||||||
|
|
|
2017 |
|
|
2016 |
|
|
2015 |
|
|||
|
Net revenues |
|
$ |
38,357 |
|
|
$ |
170,340 |
|
|
$ |
183,990 |
|
|
Cost of sales |
|
|
32,403 |
|
|
|
143,656 |
|
|
|
156,479 |
|
|
Research and development costs |
|
|
694 |
|
|
|
2,667 |
|
|
|
2,706 |
|
|
Selling, general and administrative expenses |
|
|
3,504 |
|
|
|
16,064 |
|
|
|
15,294 |
|
|
Interest expense |
|
|
1,156 |
|
|
|
8,094 |
|
|
|
6,542 |
|
|
Other (income) expense |
|
|
(40 |
) |
|
|
(118 |
) |
|
|
351 |
|
|
Income (loss) from discontinued operations before income taxes |
|
|
560 |
|
|
|
(23 |
) |
|
|
2,618 |
|
|
Loss on sale of discontinued operations including transactions expense of $128, $551 and $720, in 2017, 2016 and 2015 respectively |
|
|
(1,302 |
) |
|
|
(14,418 |
) |
|
|
(2,142 |
) |
|
Total (loss) gain on discontinued operations before income taxes |
|
|
(742 |
) |
|
|
(14,441 |
) |
|
|
476 |
|
|
Income tax expense related to discontinued operations |
|
|
(5 |
) |
|
|
37 |
|
|
|
475 |
|
|
Net loss on discontinued operations |
|
$ |
(737 |
) |
|
$ |
(14,478 |
) |
|
$ |
1 |
|
26. Impairment of Lift Venture Investment
In December 2014, the Company entered into a joint venture agreement pursuant to which Lift Ventures LLC was formed. The joint venture was formed to manufacture and sell certain products and components, including the Company's Schaeff electric forklift business, which was operated by the Company's Liftking subsidiary and certain other Liftking products. One of the other partners in the joint venture contributed design services which were to be used to develop additional new products for the joint venture.
As a result of the sale, in the third quarter of 2016, of the Company's Liftking subsidiary, Lift Ventures LLC will no longer have the right to sell Schaeff and Liftking products in the future. Additionally, as a result of certain financial difficulties experienced by the partner, who was to contribute design services, it will not be able to provide such services. As a result of these events, the Company has determined that its investment in the Lift Ventures has become impaired and has recognized an impairment charge of $5,647 to write off its entire investment in Lift Ventures LLC.
27. Subsequent Events
Sale of Additional ASV Shares
Over the period from February 26-28, 2018, the Company sold an aggregate of 1,000,000 shares of ASV Holdings, Inc. in privately-negotiated transactions with institutional purchasers. All such shares were sold for $7.00 per share. Following such sale transactions, the Company owns an aggregate of 1,080,000 shares of ASV Holdings, Inc., which equates to an ownership of approximately 11%. After the sale of the shares, the Company no longer accounts for the investment in ASV using the equity method of accounting.
PM Debt Restructuring
On March 6, 2018, PM Group and Oil & Steel S.p.A. (PM Group’s subsidiary) entered into a Debt Restructuring Agreement (the “Restructuring Agreement”) with Banca Monte dei Paschi di Siena S.p.A., Banca Nazionale del Lavoro S.p.A., BPER Banca S.p.A., Cassa di Risparmio in Bologna S.p.A. and Unicredit S.p.A. (collectively the “Lenders”), and Loan Agency Services S.r.l. (the “Agent”). The Restructuring Agreement, which replaces the previous debt restructuring agreement with the Lenders entered into in 2014, provides for, among other things:
|
|
• |
The provision of subordinated shareholders’ loans by the Company to PM Group, consisting of (i) conversion of an existing trade receivable in the amount of €3.1 million into a loan; (ii) an additional subordinated shareholders’ loan in the aggregate maximum amount of up to €2.4 million, to be made currently; and (iii) a further loan of €1.8 million to be made by December 31, 2018, in each case to be used to repay a portion of PM Group’s outstanding obligations to the Lenders; |
89
|
|
• |
Amendments to the 2014 put and call options agreement with BPER to, among other things, extend the exercise of the options until the approval of PM Group’s financial statements for the 2021 fiscal year and permit the assignment of certain subordinated receivables to the Company. The fair market value of this liability is subject to revaluation on a recurring basis. The revaluation that will be performed for March 31, 2018 will take into account the effect of PM debt restructuring, and |
|
|
• |
New amortization and repayment schedules for amounts owed by PM Group to the Lenders under the various outstanding tranches of indebtedness, along with revised interest rates and financial covenants. Under the Debt Restructuring Agreement term debt is repaid over a nine-year period starting in 2018 and ending in 2026 (2022 prior to Debt Restructuring Agreement); and |
|
|
• |
The effect of PM not meeting its December 31, 2017 financial covenants was cured by the Debt Restructuring Agreement |
Bank Amendment No. 6
As previously disclosed, on July 20, 2016, the Company and certain of its subsidiaries entered into a Loan and Security Agreement (as amended, the “Loan Agreement”) with The Private Bank and Trust Company, now known as CIBC Bank USA (“CIBC”). The Loan Agreement provides the Company with a revolving credit facility, which has a maturity date of July 20, 2019. The Loan Agreement was subsequently amended by a First Amendment dated as of August 2, 2016, a Second Amendment dated as of September 30, 2016, a Third Amendment dated as of November 8, 2016, a Fourth Amendment dated February 10, 2017 and a Fifth Amendment dated April 26, 2017. On March 9, 2018, the parties to the Loan Agreement entered into a sixth amendment to the Loan Agreement (the “Sixth Amendment”). The main modifications to the Loan Agreement resulting from the Sixth Amendment are as follows:
|
|
• |
a consent to the intercompany loan in the amount of $1,500,000 made to PM Group, in December 2017; |
|
|
• |
a waiver of certain Defaults or Events of Default that may have been caused by the Company’s financial restatement; |
|
|
• |
amendments to the definitions of “EBITDA” and “Fixed Charges” to account for certain impacts arising from the financial restatement; |
|
|
• |
a consent to the sale by the Company of up to all of its equity interests in ASV, provided that the proceeds are used to repay outstanding revolving loans under the Loan Agreement; |
|
|
• |
a consent to an additional equity investment in, or intercompany loan to, PM Group from the Company, using all or a portion of the remaining proceeds from the sale of the Company’s equity interests in ASV; and |
|
|
• |
additional limitations on investments by the Company in foreign subsidiaries, other than the transactions with PM Group described above. |
Promissory Note Waivers
Pursuant to a Common Stock and Convertible Debenture Purchase Agreement by and between the Company and Terex Corporation (“Terex”), dated as of October 29, 2014, the Company previously issued a Convertible Subordinated Promissory Note dated December 19, 2014 to Terex, which note remains outstanding as of the date hereof. In addition, the Company, MI Convert Holdings LLC and Invemed Associates LLC (together, the “Holders”) are parties to both a Note Purchase Agreement and a Registration Rights Agreement, each dated as of January 7, 2015, pursuant to which the Holders purchased certain notes from the Company. Each of the foregoing agreements included obligations on the part of the Company to timely file with the SEC its reports that are required to be filed pursuant to the Exchange Act. The Company has obtained waivers from each of Terex and the Holders with respect to any breaches, defaults or events of default that may have been or may be triggered in connection with (i) the Company’s failure to timely file its Quarterly Report on Form 10-Q for the quarterly period ended September 30, 2017, or its Annual Report on Form 10-K for the year ended December 31, 2017, and (ii) the amendment by the Company of its previously-filed Annual Report on Form 10-K for the year ended December 31, 2016, Quarterly Report on Form 10-Q for the quarterly period ended March 31, 2017 and Quarterly Report on Form 10-Q for the Quarterly Report on Form 10-Q for the quarterly period ended June 30, 2017.
90
None.
Background
As previously disclosed in the Company’s Current Report on Form 8-K filed on November 6, 2017, the Audit Committee of the Board of Directors of the Company, in consultation with the Company’s management and UHY LLP, the Company’s independent registered public accounting firm, determined that the Company’s previously issued financial statements for the quarters ended March 31, June 30 and September 30, 2016, year ended December 31, 2016 and quarters ended March 31 and June 30, 2017 included in the Company’s Annual Reports on Form 10-K and Quarterly Reports on Form 10-Q for such periods and together with all three, six and nine-month financial information contained therein (the “Non-Reliance Periods”) could no longer be relied upon. The Company filed its restated annual and quarterly financial statements for the Non-Reliance Periods on April 3, 2018. See Part II—Item 7—Management’s Discussion and Analysis of Financial Condition and Results of Operations—Background on the Restatement and Note 3, Restatement of Previously Issued Financial Statements and Note 25, Unaudited Quarterly Financial Data of the Notes to Consolidated Financial Statements included in Part II—Item 8—Financial Statements and Supplementary Data.
Evaluation of Disclosure Controls and Procedures
Under the supervision of and with the participation of management and the Audit Committee of the Board of Directors, the Company conducted an evaluation of the effectiveness of the design and operation of our disclosure controls and procedures, as defined in Rules 13a-15(e) and 15d-15(e) of the Securities and Exchange Act of 1934, as amended (the “Exchange Act”), as of December 31, 2017. The Company’s evaluation has identified certain material weaknesses in its internal control over financial reporting as noted below in Management’s Report on Internal Control over Financial Reporting. Based on the evaluation of these material weaknesses, the Company has concluded that the Company’s disclosure controls and procedures were not effective as of December 31, 2017 to ensure that information required to be disclosed by the Company in the reports that it files or submits under the Exchange Act is recorded, processed, summarized and reported, within the time periods specified in the SEC’s rules and forms. Based on a number of factors, including the completion of the Audit Committee’s internal investigation, our internal review that identified revisions to our previously issued financial statements, and efforts to remediate the material weaknesses in internal control over financial reporting described below we believe the consolidated financial statements in this Annual Report fairly present, in all material respects, our financial position, results of operations and cash flows as of the dates, and for the periods, presented, in conformity with GAAP.
Management’s Report on Internal Control Over Financial Reporting
Management is responsible for establishing and maintaining adequate internal control over financial reporting, as defined in Rules 13a-15(f) and 15d-15(f) of the Exchange Act. The Company’s internal control over financial reporting is a process designed to provide reasonable assurance regarding the reliability of its financial reporting and the preparation of its financial statements for external purposes in accordance with GAAP and includes those policies and procedures that: (i) pertain to the maintenance of records that, in reasonable detail, accurately and fairly reflect the transactions and dispositions of the assets of the Company; (ii) provide reasonable assurance that transactions are recorded as necessary to permit preparation of financial statements in accordance with generally accepted accounting principles, and that receipts and expenditures of the Company are being made only in accordance with authorizations of management and directors of the Company; and (iii) provide reasonable assurance regarding prevention or timely detection of unauthorized acquisition, use, or disposition of the Company’s assets that could have a material effect on the financial statements. Because of its inherent limitations, internal control over financial reporting may not prevent or detect misstatements. Also, projections of any evaluation of effectiveness to future periods are subject to the risk that controls may become inadequate because of changes in conditions or that the degree of compliance with the policies or procedures may deteriorate.
Under the supervision of and with the participation of management, the Company conducted an evaluation of the effectiveness of its internal control over financial reporting based on the criteria in Internal Control—Integrated Framework issued by the Committee of Sponsoring Organizations of the Treadway Commission (“COSO”). A material weakness is a control deficiency, or combination of control deficiencies, such that there is a reasonable possibility that a material misstatement to the annual or interim financial statements will not be prevented or detected on a timely basis. Based upon that evaluation, management identified the following material weaknesses as of December 31, 2017 in the Company’s internal control over financial reporting, principally related to the Company’s period-end financial reporting and consolidation processes:
|
|
1. |
We did not maintain an adequate process for the intake of new contracts, customers and vendors, particularly for contracts involving unique transaction structures or unusual obligations on the part of the Company, to ensure that all contracts are appropriately reviewed and approved, and the associated financial reporting requirements associated with such contracts and transactions structures are properly identified and complied with in accordance with Generally Accepted Accounting Principles. |
91
|
|
2. |
We did not maintain adequate entity-level controls with respect to ensuring adequate supporting documentation for journal entries and review procedures with respect to journal entries and disbursements that were unusual in nature and of significant amounts. |
|
|
3. |
We did not maintain an adequate review process with respect to the accounting of bill-and-hold transactions and ensuring proper revenue recognition. |
|
|
4. |
We did not maintain a formal and consistent policy for establishing inventory reserves for excess and obsolete inventory. |
|
|
5. |
We did not maintain an adequate communication policy with respect to compliance with the Company’s Code of Ethics and availability of the Company’s whistleblower hotline to report compliance issues. |
As a result of the material weaknesses in internal control over financial reporting described above, management concluded that the Company’s internal control over financial reporting was not effective as of December 31, 2017 based on the criteria established in Internal Control—Integrated Framework issued by the COSO. Additionally, these material weaknesses could result in a misstatement of the aforementioned account balances or disclosures that would result in a material misstatement to the annual or interim consolidated financial statements that would not be prevented or detected.
Management’s assessment of the effectiveness of the Company’s internal control over financial reporting as of December 31, 2017 has been audited by UHY LLP, our independent registered public accounting firm, as stated in their report which appears herein.
Changes in Internal Control over Financial Reporting
During the fourth quarter of 2017, there were no changes in our internal control over financial reporting that have materially affected, or are reasonably likely to materially affect, our internal control over financial reporting.
Plan for Remediation of the Material Weaknesses in Internal Control Over Financial Reporting
Management has been actively engaged in the planning for, and implementation of, remediation efforts to address the material weaknesses, as well as other identified areas of risk. These remediation efforts, outlined below, are intended both to address the identified material weaknesses and to enhance the Company’s overall financial control environment. Management’s planned actions to further address these issues in fiscal 2018 include:
|
|
• |
Review of existing policies and procedures against a standard list of criteria to ensure that new business relationships and atypical transaction structures are properly vetted (including for any related party transaction issues), and related accounting and other requirements are clearly identified and complied with in accordance with Generally Accepted Accounting Principles, including with respect to all new customers and business relationships beginning with the 1st quarter of 2018; |
|
|
• |
Establish controls to prevent anyone in a senior management position from being able to post manual journal entries, and require all manual journal entries to be reviewed and approved by an appropriate individual other than the preparer; |
|
|
• |
Closely review all bill-and-hold transactions to ensure that the appropriate documentation is maintained in order to properly recognize revenue, and implement controls to ensure that goods are shipped prior to invoicing, unless it is being recognized on a valid bill-and-hold basis; |
|
|
• |
Implement a formal and consistent policy for establishing inventory reserves for excess and obsolete inventory and situations where net realizable value is less than inventory cost; |
|
|
• |
The existing whistleblower hotline will be rolled out again, with related training to be conducted for all employees every 2 years going forward; |
|
|
• |
Other control improvements will include employee retraining with respect to the Company’s Code of Ethics; and |
|
|
• |
Executive oversight will be improved through additional reporting requirements and meetings. |
The audit committee has directed management to develop a detailed plan and timetable for the implementation of the foregoing remedial measures (to the extent not already completed) and will monitor their implementation. In addition, under the direction of the audit committee, management will continue to review and make necessary changes to the overall design of the Company’s internal control environment, as well as policies and procedures to improve the overall effectiveness of internal control over financial reporting.
92
Management believes the measures described above and others that will be implemented will remediate the control deficiencies the Company has identified and strengthen its internal control over financial reporting. Management is committed to continuous improvement of the Company’s internal control processes and will continue to diligently review the Company’s financial reporting controls and procedures. As management continues to evaluate and work to improve internal control over financial reporting, the Company may determine to take additional measures to address control deficiencies or determine to modify, or in appropriate circumstances not to complete, certain of the remediation measures described above.
None.
93
Certain information required by Part III is omitted from this Form 10-K as the Company intends to file with the Commission its definitive Proxy Statement for its 2017 Annual Meeting of Shareholders (the “2017 Proxy Statement”) pursuant to Regulation 14A of the Securities Exchange Act of 1934, as amended, not later than 120 days after December 31, 2017.
The information under the headings “Nominees to Serve Until the 2018 Annual Meeting,” “Executive Officers of the Company who are not also Directors,” “Section 16(a) Beneficial Ownership Reporting Compliance,” “Committee on Directors and Board Governance,” and “Audit Committee” in our 2018 Proxy Statement is incorporated herein by reference.
Our directors, executive officers and stockholders with ownership of 10% or greater are required, under Section 16(a) of the Securities Exchange Act of 1934, to file reports of their ownership and changes to their ownership of our securities with the SEC. Based solely on our review of the reports and any written representations we received that no other reports were required, we believe that, during the year ended December 31, 2017, all of our officers, directors and stockholders with ownership of 10% or greater complied with all Section 16(a) filing requirements applicable.
Code of Ethics
The Company has adopted a code of ethics applicable to our principal executive officer and principal financial and accounting officer, in accordance with Section 406 of the Sarbanes-Oxley Act of 2002, the rules of the SEC promulgated thereunder, and the NASDAQ rules. The code of ethics also applies to all employees of the Company as well as the Board of Directors. In the event that any changes are made or any waivers from the provisions of the code of ethics are made, these events would be disclosed on the Company’s website or in a report on Form 8-K within four business days of such event. The code of ethics is posted on our website at www.manitexinternational.com. Copies of the code of ethics will be provided free of charge upon written request directed to Investor Relations, Manitex International, Inc., 9725 Industrial Drive, Bridgeview, Illinois 60455.
The information under the headings “Compensation Committee Interlocks and Insider Participation,” “Compensation Committee Report” on Executive Compensation “COMPENSATION DISCUSSION AND ANALYSIS” “EXECUTIVE COMPENSATION,” and “DIRECTOR COMPENSATION” in our 2018 Proxy Statement is incorporated herein by reference.
|
ITEM 12. |
SECURITY OWNERSHIP OF CERTAIN BENEFICIAL OWNERS AND MANAGEMENT AND RELATED STOCKHOLDER MATTERS |
The information under the headings “Equity Compensation Plan Information” and “PRINCIPAL STOCKHOLDERS” in our 2018 Proxy Statement is incorporated herein by reference.
The information under the headings “Transactions with Related Persons,” “Corporate Governance,” “Compensation Committee,” and “Audit Committee” in our 2018 Proxy Statement is incorporated herein by reference.
The information under the heading “Audit Committee” in our 2018 Proxy Statement is incorporated herein by reference.
94
|
(a) |
The following documents are filed as part of this Report: |
|
|
(1) |
Financial Statements |
See Index to Financial Statements on page 40.
|
|
(2) |
Supplemental Schedules |
None.
All schedules have been omitted because the required information is not present in amounts sufficient to require submission of the schedules, or because the required information is included in the consolidated financial statements or notes thereto.
|
(b) |
Exhibits |
See the Exhibit Index following the signature page.
|
(c) |
Financial Statement Schedules |
All information for which provision is made in the applicable accounting regulations of the SEC is either included in the financial statements, is not required under the related instructions or is inapplicable, and therefore has been omitted.
95
|
Exhibit No. |
|
|
Description |
|
|
|
|
|
|
1.1 |
|
|
|
|
|
|
|
|
|
2.1 |
|
|
|
|
|
|
|
|
|
2.2 |
|
|
|
|
|
|
|
|
|
2.3 |
|
|
|
|
|
|
|
|
|
2.4 |
|
|
|
|
|
|
|
|
|
|
|
|
|
|
|
|
|
|
|
|
|
|
|
|
|
|
|
|
|
3.1 |
|
|
|
|
|
|
|
|
|
3.2 |
|
|
|
|
|
|
|
|
|
4.1 |
|
|
|
|
|
|
|
|
|
4.2 |
|
|
|
|
|
|
|
|
|
4.3 |
|
|
|
|
|
|
|
|
|
10.1 |
* |
|
|
|
|
|
|
|
|
10.2 |
* |
|
|
|
|
|
|
|
|
10.3 |
* |
|
|
|
|
|
|
|
|
10.4 |
* |
|
|
|
|
|
|
|
|
10.5 |
* |
|
|
|
|
|
|
|
|
10.6 |
|
|
|
|
|
|
|
|
|
10.7 |
|
|
96
|
Exhibit No. |
|
|
Description |
|
|
|
|
|
|
10.8 |
|
|
|
|
|
|
|
|
|
10.9 |
|
|
|
|
|
|
|
|
|
10.10 |
|
|
|
|
|
|
|
|
|
10.11 |
|
|
|
|
|
|
|
|
|
10.12 |
|
|
|
|
|
|
|
|
|
10.13 |
|
|
|
|
|
|
|
|
|
10.14 |
|
|
|
|
|
|
|
|
|
10.15 |
|
|
|
|
|
|
|
|
|
10.16 |
|
|
|
|
|
|
|
|
|
10.17 |
|
|
|
|
|
|
|
|
|
10.18 |
|
|
|
|
|
|
|
|
|
10.19 |
|
|
|
|
|
|
|
|
|
10.20 |
|
|
|
|
|
|
|
|
|
10.21 |
|
|
|
|
|
|
|
|
|
10.22 |
|
|
|
|
|
|
|
|
|
10.23 |
|
|
|
|
|
|
|
|
|
10.24 |
|
|
|
|
|
|
|
|
|
10.25 |
|
|
97
|
Exhibit No. |
|
|
Description |
|
|
|
|
|
|
10.26 |
|
|
|
|
|
|
|
|
|
10.27 |
|
|
|
|
|
|
|
|
|
10.28 |
|
|
|
|
|
|
|
|
|
10.29 |
|
|
|
|
|
|
|
|
|
10.30 |
|
|
|
|
|
|
|
|
|
10.31 |
|
|
|
|
|
|
|
|
|
10.32 |
|
|
|
|
|
|
|
|
|
10.33 |
|
|
|
|
|
|
|
|
|
10.34 |
|
|
|
|
|
|
|
|
|
10.35 |
|
|
|
|
|
|
|
|
|
10.36 |
|
|
|
|
|
|
|
|
|
10.37 |
|
|
|
|
|
|
|
|
|
10.35 |
|
|
|
|
|
|
|
|
|
10.38 |
|
|
|
|
|
|
|
|
|
10.39 |
|
|
98
|
Exhibit No. |
|
|
Description |
|
|
|
|
|
|
|
|
|
|
|
10.40 |
|
|
|
|
|
|
|
|
|
10.41 |
|
|
|
|
|
|
|
|
|
10.42 |
|
|
|
|
|
|
|
|
|
10.43 |
|
|
|
|
|
|
|
|
|
10.44 |
|
|
|
|
|
|
|
|
|
10.45 |
|
|
|
|
|
|
|
|
|
10.46 |
|
|
|
|
|
|
|
|
|
10.47 |
|
|
|
|
|
|
|
|
|
10.48 |
|
|
|
|
|
|
|
|
|
10.49 |
|
|
|
|
|
|
|
|
|
10.50 |
|
|
|
|
|
|
|
|
|
10.51 |
|
|
|
|
|
|
|
|
|
10.52 |
|
|
|
|
|
|
|
|
|
10.53 |
|
|
|
|
|
|
|
|
|
10.54 |
|
|
|
|
|
|
|
|
|
10.55 |
|
|
|
|
|
|
|
|
|
10.56 |
|
|
99
|
Exhibit No. |
|
|
Description |
|
|
|
|
|
|
10.57 |
|
|
|
|
|
|
|
|
|
10.58 |
|
|
|
|
|
|
|
|
|
10.59 |
|
|
|
|
|
|
|
|
|
10.60 |
|
|
|
|
|
|
|
|
|
10.61 |
|
|
|
|
|
|
|
|
|
10.62 |
|
|
|
|
|
|
|
|
|
10.63 |
|
|
|
|
|
|
|
|
|
10.64 |
|
|
|
|
|
|
|
|
|
10.65 |
* |
|
|
|
|
|
|
|
|
10.66 |
|
|
|
|
|
|
|
|
|
10.67 |
|
|
|
|
|
|
|
|
|
10.68 |
|
|
|
|
|
|
|
|
|
10.69 |
|
|
|
|
|
|
|
|
|
10.70 |
|
|
|
|
|
|
|
|
|
10.71 |
|
|
|
|
|
|
|
|
|
10.72 |
|
|
|
|
|
|
|
|
|
10.73 |
|
|
|
|
|
|
|
|
|
10.74 |
|
|
100
|
Exhibit No. |
|
|
Description |
|
|
|
|
|
|
10.75 |
|
|
|
|
|
|
|
|
|
10.76 |
|
|
|
|
|
|
|
|
|
10.77 |
|
|
|
|
|
|
|
|
|
10.78 |
|
|
|
|
|
|
|
|
|
10.79 |
|
|
|
|
|
|
|
|
|
10.80 |
|
|
|
|
|
|
|
|
|
10.81 |
|
|
|
|
|
|
|
|
|
10.82 |
|
|
|
|
|
|
|
|
|
10.83 |
|
|
|
|
10.84 |
|
|
|
|
|
|
|
|
|
21.1 |
(1) |
|
|
|
|
|
|
|
|
23.1 |
(1) |
|
|
|
|
|
|
|
|
24.1 |
(1) |
|
|
|
|
|
|
|
|
31.1 |
(1) |
|
|
|
|
|
|
|
|
31.2 |
(1) |
|
|
|
|
|
|
|
|
32.1 |
(1) |
|
|
|
|
|
|
|
|
101 |
(1) |
|
The following financial information from the Company’s Annual Report on Form 10-K for the fiscal year ended December 31, 2017, formatted in XBRL (eXtensible Business Reporting Language): (i) Consolidated Statements of Income for the fiscal years ended December 31, 2017, 2016 and 2015, (ii) Consolidated Balance Sheets as of December 31, 2017 and 2016, (iii) Consolidated Statements of Shareholders Equity and Comprehensive Income, (iv) Consolidated Statements of Cash Flows and (v) Notes to Consolidated Financial Statements. |
|
* |
Denotes a management contract or compensatory plan or arrangement. |
|
(1) |
Filed herewith. |
101
Pursuant to the requirements of Section 13 or 15(d) of the Securities Exchange Act of 1934, the registrant has duly caused this report to be signed on its behalf by the undersigned, thereunto duly authorized.
Dated: April 10, 2018
|
MANITEX INTERNATIONAL, INC. |
||
|
|
|
|
|
By: |
|
/s/ SHERMAN JUNG |
|
|
|
Sherman Jung |
|
|
|
Vice President of Financial Reporting |
|
|
|
(On behalf of the Registrant and as Principal Financial and Accounting Officer) |
KNOW ALL PERSONS BY THESE PRESENTS, that each person whose signature appears below constitutes and appoint David J. Langevin his or her attorneys-in-fact, each with the power of substitution, for him in any and all capacities, to sign any amendments to this Annual Report on Form 10-K, and to file the same, with Exhibits thereto and other documents in connection therewith with the Securities and Exchange Commission, hereby ratifying and confirming all that each of said attorneys-in-fact, or substitute or substitutes may do or cause to be done by virtue hereof.
Pursuant to the requirements of the Securities Exchange Act of 1934, this report has been signed below by the following persons on behalf of the registrant and in the capacities and on the dates indicated.
|
/s/ D AVID J. LANGEVIN |
|
April 10, 2018 |
|
David J. Langevin, Chairman and Chief Executive Officer (Principal Executive Officer) |
|
|
|
|
|
|
|
/s/ SHERMAN JUNG |
|
April 10, 2018 |
|
Sherman Jung Vice President of Financial Reporting (Principal Financial and Accounting Officer) |
|
|
|
|
|
|
|
/s/ R ONALD M. CLARK |
|
April 10, 2018 |
|
Ronald M. Clark, Director |
|
|
|
|
|
|
|
/s/ R OBERT S. GIGLIOTTI |
|
April 10, 2018 |
|
Robert S. Gigliotti, Director |
|
|
|
|
|
|
|
/s/ F REDERICK B. K NOX |
|
April 10, 2018 |
|
Frederick B. Knox, Director |
|
|
|
|
|
|
|
/s/ M ARVIN B. ROSENBERG |
|
April 10, 2018 |
|
Marvin B. Rosenberg, Director |
|
|
|
|
|
|
|
/s/ S TEPHEN J. TOBER |
|
April 10, 2018 |
|
Stephen J. Tober, Director |
|
|
102