Attached files
| file | filename |
|---|---|
| EX-99.1 - EX-99.1 - R1 RCM INC. | a991-q32020pressrelease.htm |
| 8-K - 8-K - R1 RCM INC. | achi-20201103.htm |

Exhibit 99.2 Third Quarter 2020 Results Conference Call November 3, 2020

Forward-Looking Statements and Non-GAAP Financial Measures This presentation includes information that may constitute “forward-looking statements,” made pursuant to the safe harbor provisions of the Private Securities Litigation Reform Act of 1995. Forward-looking statements relate to future, not past, events and often address our expected future growth, plans and performance or forecasts. These forward-looking statements are often identified by the use of words such as “anticipate,” “believe,” “designed,” “estimate,” “expect,” “forecast,” “intend,” “may,” “plan,” “predict,” “project,” “target,” “will,” or “would,” and similar expressions or variations, although not all forward-looking statements contain these identifying words. These forward-looking statements include, among other things, statements about the potential impacts of the COVID-19 pandemic, our strategic initiatives, our capital plans, our costs, our ability to successfully deliver on our commitments to our customers, our ability to deploy new business as planned, our ability to successfully implement new technologies, our future financial performance and our liquidity. Such forward-looking statements are based on management’s current expectations about future events as of the date hereof and involve many risks and uncertainties that could cause our actual results to differ materially from those expressed or implied in our forward-looking statements. Subsequent events and developments, including actual results or changes in our assumptions, may cause our views to change. We do not undertake to update our forward-looking statements except to the extent required by applicable law. Readers are cautioned not to place undue reliance on such forward-looking statements. All forward-looking statements included herein are expressly qualified in their entirety by these cautionary statements. Our actual results and outcomes could differ materially from those included in these forward-looking statements as a result of various factors, including, but not limited to, the severity, magnitude and duration of the COVID-19 pandemic; responses to the pandemic by the government and healthcare providers and the direct and indirect impacts of the pandemic on our customers and personnel; the disruption of national, state and local economies as a result of the pandemic; the impact of the pandemic on our financial results, including possible lost revenue and increased expenses; and the factors discussed under the heading “Risk Factors” in our annual report on Form 10-K for the year ended December 31, 2019, our quarterly reports on Form 10-Q and any other periodic reports that the Company files with the Securities and Exchange Commission. This presentation includes the following non-GAAP financial measures: adjusted EBITDA, non-GAAP cost of services, non-GAAP SG&A expense and net debt. Please refer to the Appendix located at the end of this presentation for a reconciliation of the non-GAAP financial measures to the most directly comparable GAAP financial measures. 2
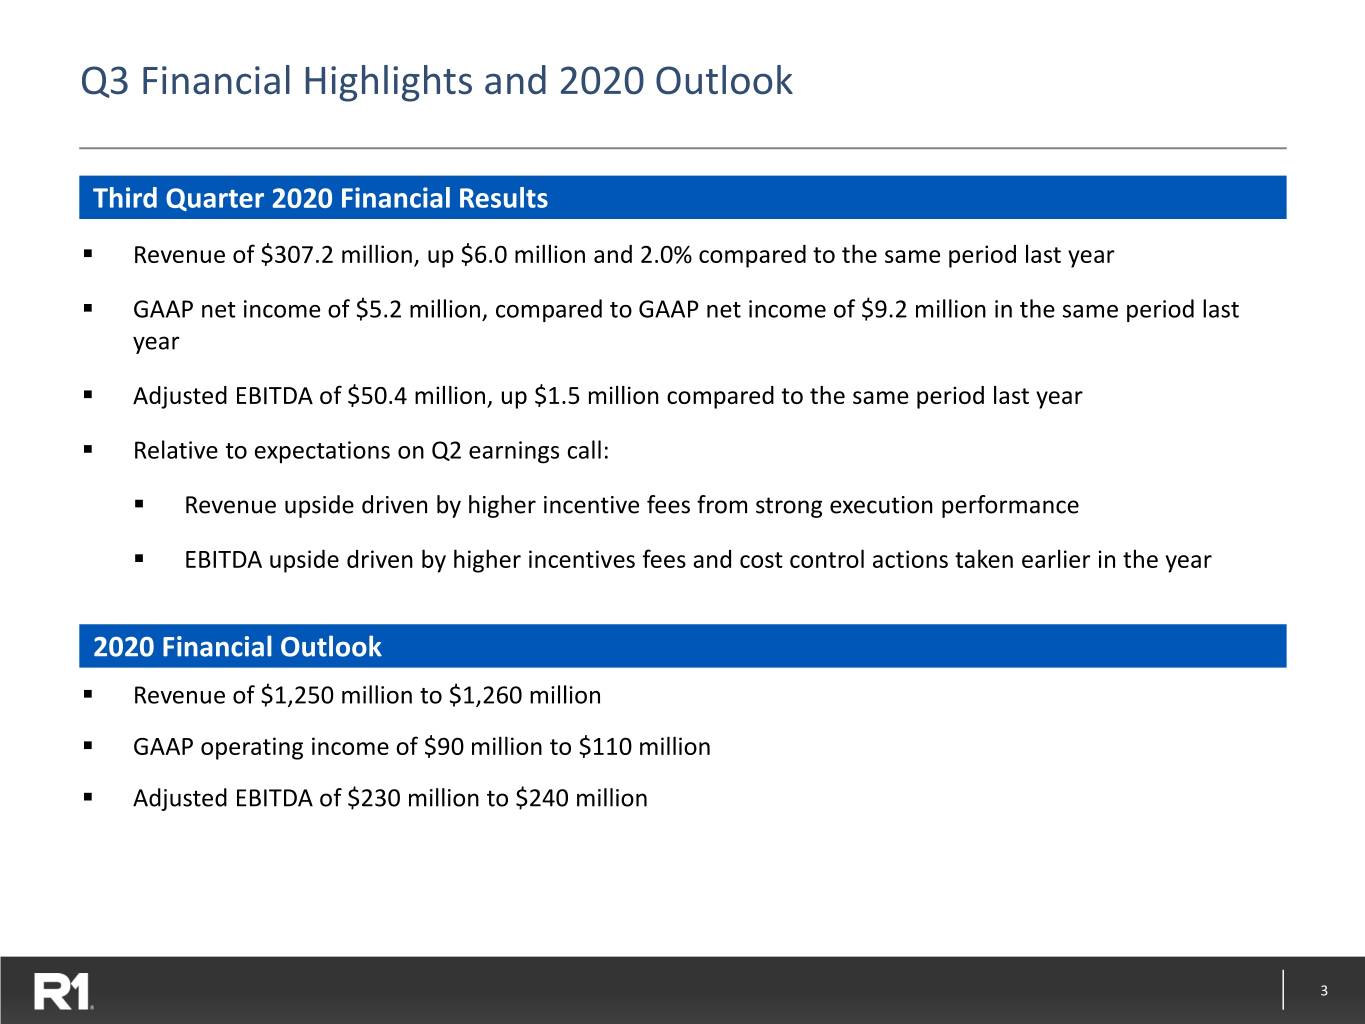
Q3 Financial Highlights and 2020 Outlook ThirdThird Quarter Quarter 2020 2020 Financial Financial Highlights Results ▪ Revenue of $307.2 million, up $6.0 million and 2.0% compared to the same period last year ▪ GAAP net income of $5.2 million, compared to GAAP net income of $9.2 million in the same period last year ▪ Adjusted EBITDA of $50.4 million, up $1.5 million compared to the same period last year ▪ Relative to expectations on Q2 earnings call: ▪ Revenue upside driven by higher incentive fees from strong execution performance ▪ EBITDA upside driven by higher incentives fees and cost control actions taken earlier in the year 20202020 Financial Financial Outlook Outlook ▪ Revenue of $1,250 million to $1,260 million ▪ GAAP operating income of $90 million to $110 million ▪ Adjusted EBITDA of $230 million to $240 million 3
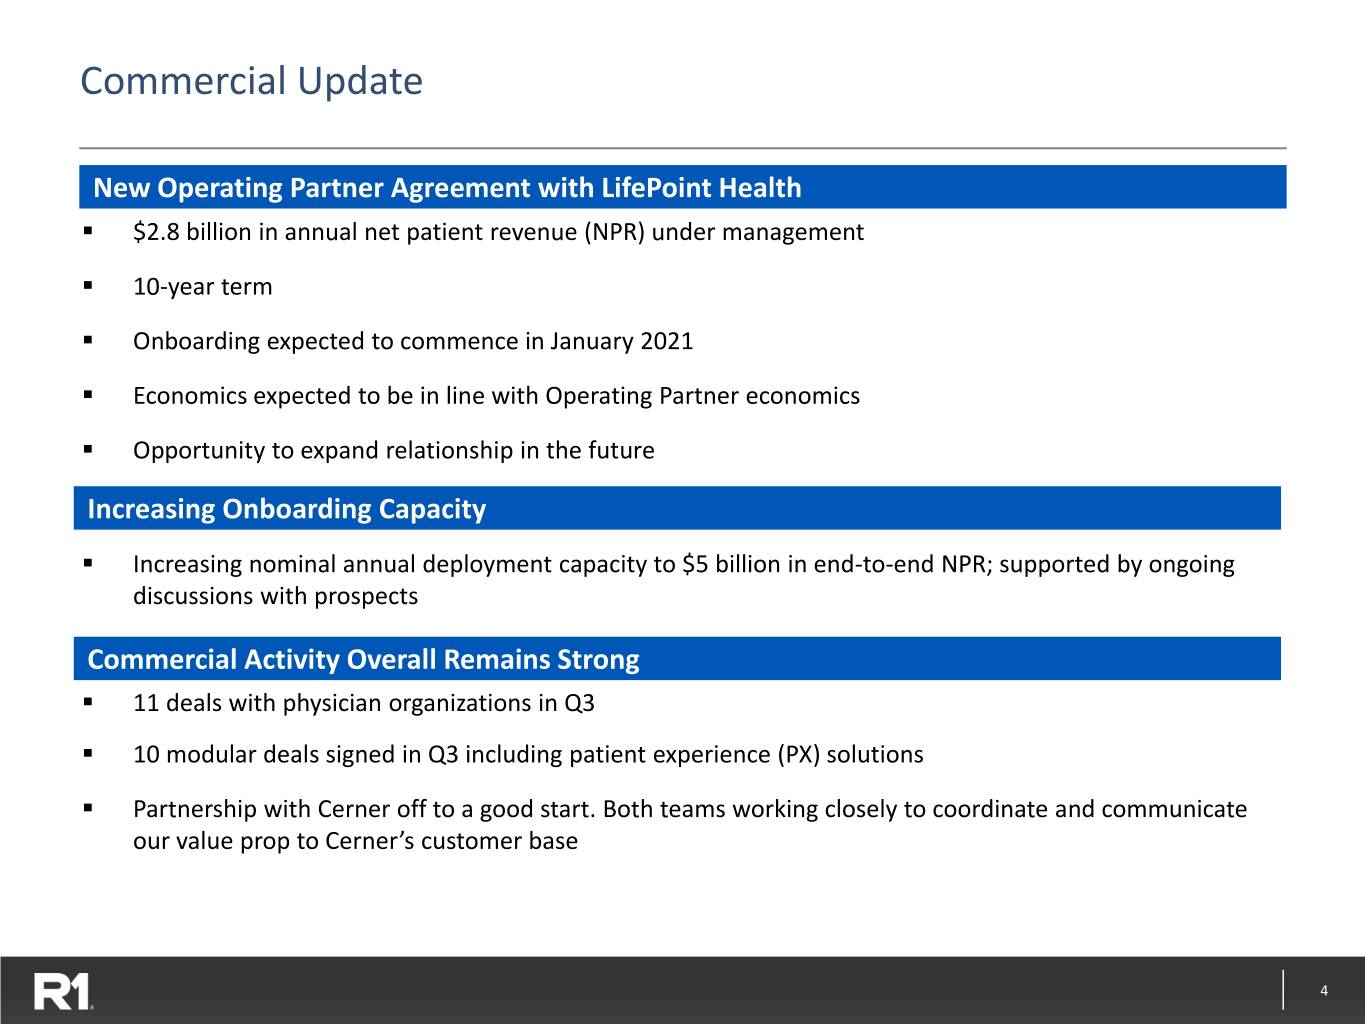
Commercial Update NewNew Operating Operating Partner Partner Agreement Agreement with with LifePoint LifePoint Health Health ▪ $2.8 billion in annual net patient revenue (NPR) under management ▪ 10-year term ▪ Onboarding expected to commence in January 2021 ▪ Economics expected to be in line with Operating Partner economics ▪ Opportunity to expand relationship in the future IncreasingIncreasing OnboardingOnboarding CapacityCapacity ▪ Increasing nominal annual deployment capacity to $5 billion in end-to-end NPR; supported by ongoing discussions with prospects CommercialCommercial ActivityActivity OverallOverall RemainsRemains StrongStrong ▪ 11 deals with physician organizations in Q3 ▪ 10 modular deals signed in Q3 including patient experience (PX) solutions ▪ Partnership with Cerner off to a good start. Both teams working closely to coordinate and communicate our value prop to Cerner’s customer base 4
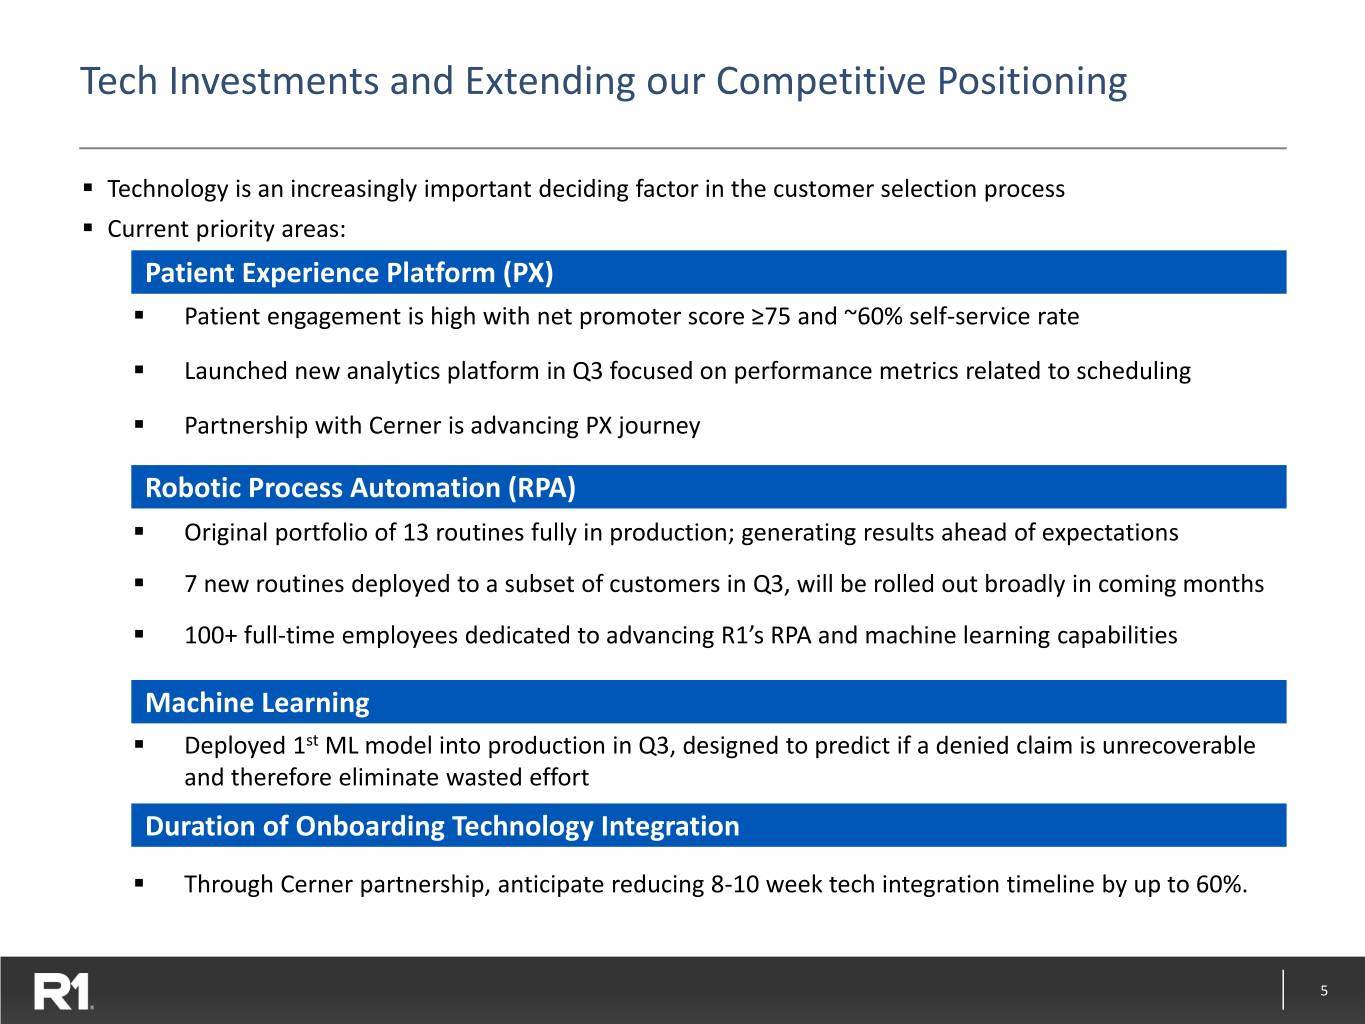
Tech Investments and Extending our Competitive Positioning ▪ Technology is an increasingly important deciding factor in the customer selection process ▪ Current priority areas: 1.PatientPatient Experience Experience Platform Platform (PX) (PX) ▪ Patient engagement is high with net promoter score ≥75 and ~60% self-service rate ▪ Launched new analytics platform in Q3 focused on performance metrics related to scheduling ▪ Partnership with Cerner is advancing PX journey 2.RoboticRobotic Process Process Automation Automation (RPA) (RPA) ▪ Original portfolio of 13 routines fully in production; generating results ahead of expectations ▪ 7 new routines deployed to a subset of customers in Q3, will be rolled out broadly in coming months ▪ 100+ full-time employees dedicated to advancing R1’s RPA and machine learning capabilities 3.MachineMachine Learning Learning ▪ Deployed 1st ML model into production in Q3, designed to predict if a denied claim is unrecoverable and therefore eliminate wasted effort 4.Duration Technology of Onboarding Integration Technology During Onboarding Integration ▪ Through Cerner partnership, anticipate reducing 8-10 week tech integration timeline by up to 60%. 5

Deployment and M&A Update Deployment Activity Penn State Health ▪ Initiated onboarding activities in May, on track to be completed by Q1 2021 ▪ Both teams have collaborated extremely well under a virtual model, early results are very positive Rush University System for Health (RUSH) ▪ Continues to progress on schedule, expect to complete remaining onboarding activities by year-end $700 million NPR Physician Customer (signed in 3Q 2019) ▪ Currently 90% through deployment plan, expect to complete onboarding in Q1 2021 M&A Update SCI Solutions ▪ Integration on track; Roadmap in place to develop the most comprehensive platform for digital engagement with patients and providers RevWorks ▪ Continues to progress on schedule. Ahead of plan in consolidating work performed by third-party vendors Emergency Medical Services (EMS) ▪ Divestiture completed on October 30, 2020 6

COVID-19 Update and Volume Trends Health and Safety of Workforce Remains Top Priority ▪ Vast majority of employees continue to work from home ▪ Productivity, engagement and retention remain at satisfactory levels Operating Environment Remains Dynamic ▪ Patient volumes have trended at 90-95% of pre-Covid levels in recent weeks ▪ Volumes are dynamic given recent rise in cases in many geographies ▪ Working assumption is that volumes remain at current levels until economic activity returns to normal ▪ We and our customers are generally much better prepared to navigate and mitigate the challenges presented by Covid ▪ We remain vigilant and ready to adapt to changes in the operating environment in a way that balances the long-term opportunity we see in the market with near-term conditions 7
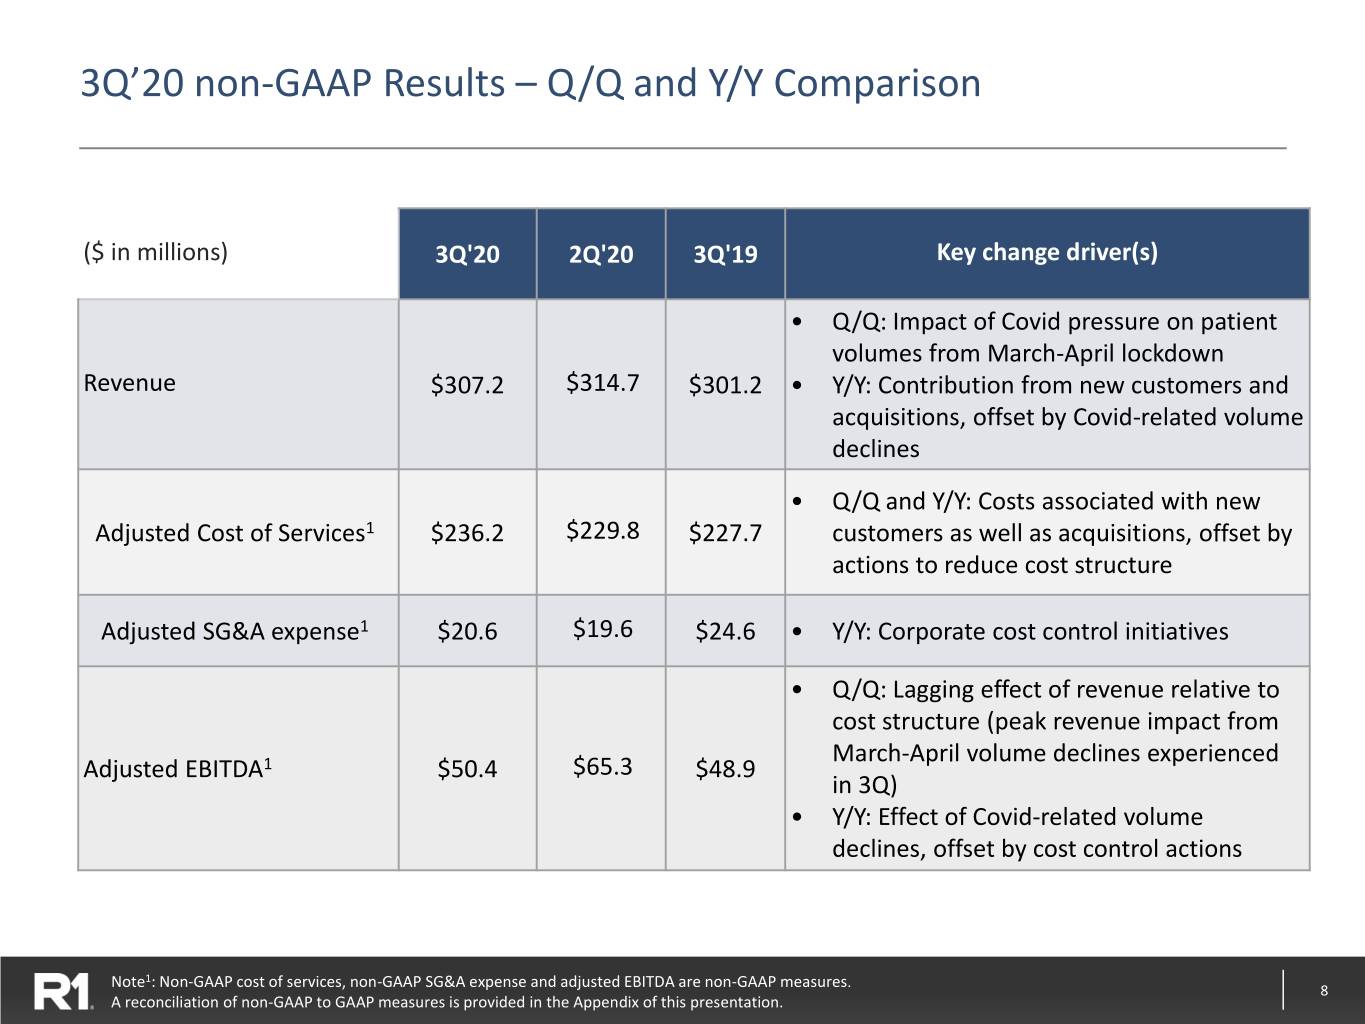
3Q’20 non-GAAP Results – Q/Q and Y/Y Comparison ($ in millions) 3Q'20 2Q'20 3Q'19 Key change driver(s) • Q/Q: Impact of Covid pressure on patient volumes from March-April lockdown Revenue $307.2 $314.7 $301.2 • Y/Y: Contribution from new customers and acquisitions, offset by Covid-related volume declines • Q/Q and Y/Y: Costs associated with new Adjusted Cost of Services1 $236.2 $229.8 $227.7 customers as well as acquisitions, offset by actions to reduce cost structure Adjusted SG&A expense1 $20.6 $19.6 $24.6 • Y/Y: Corporate cost control initiatives • Q/Q: Lagging effect of revenue relative to cost structure (peak revenue impact from March-April volume declines experienced Adjusted EBITDA1 $50.4 $65.3 $48.9 in 3Q) • Y/Y: Effect of Covid-related volume declines, offset by cost control actions Note1: Non-GAAP cost of services, non-GAAP SG&A expense and adjusted EBITDA are non-GAAP measures. 8 A reconciliation of non-GAAP to GAAP measures is provided in the Appendix of this presentation.
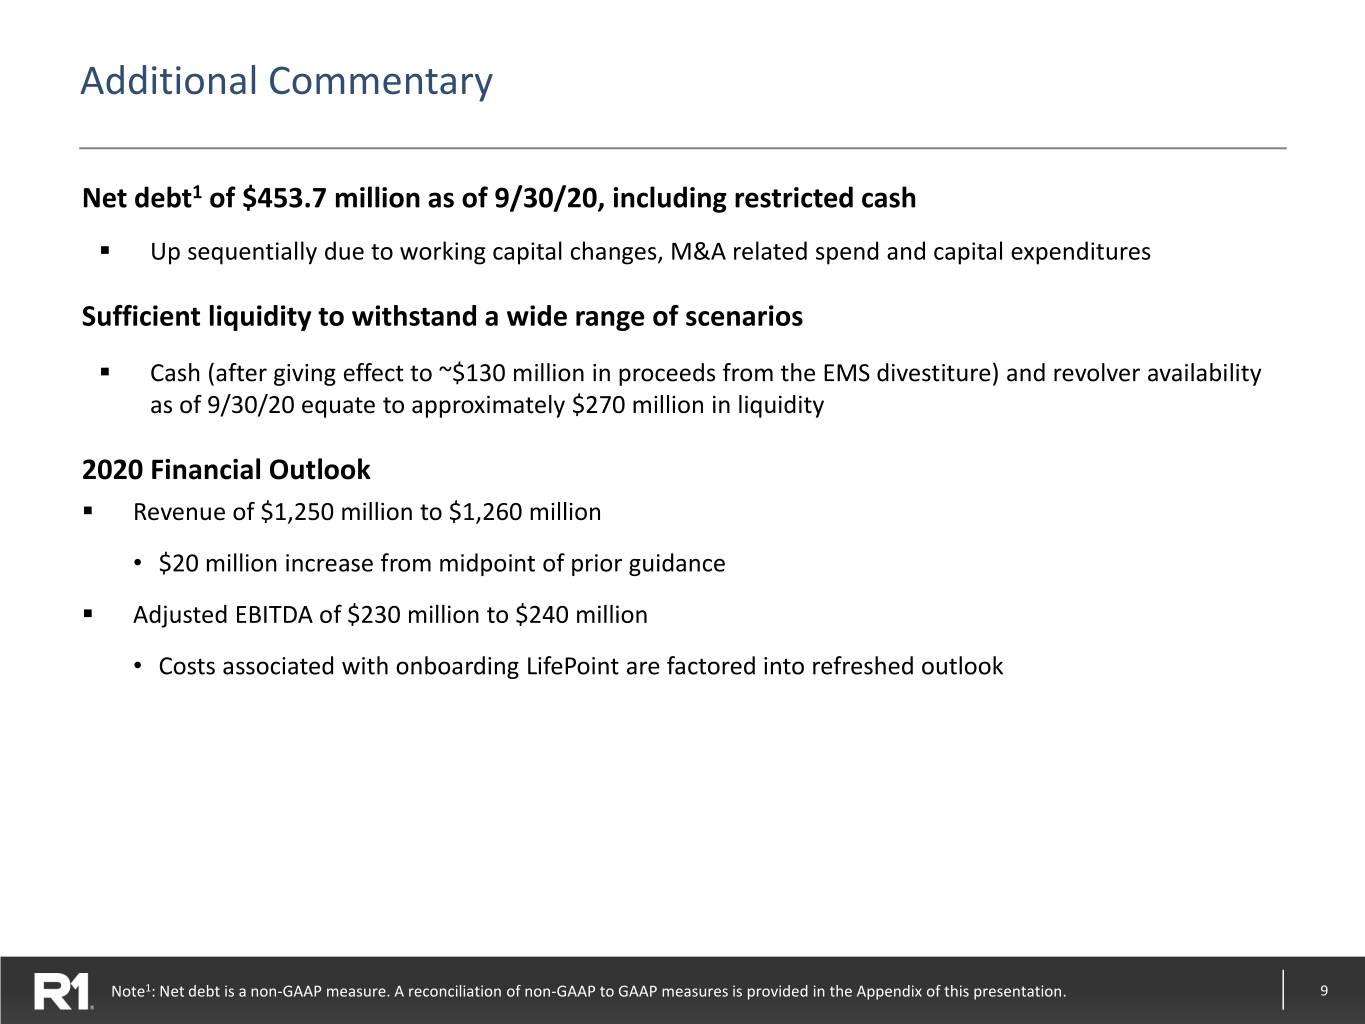
Additional Commentary Net debt1 of $453.7 million as of 9/30/20, including restricted cash ▪ Up sequentially due to working capital changes, M&A related spend and capital expenditures Sufficient liquidity to withstand a wide range of scenarios ▪ Cash (after giving effect to ~$130 million in proceeds from the EMS divestiture) and revolver availability as of 9/30/20 equate to approximately $270 million in liquidity 2020 Financial Outlook ▪ Revenue of $1,250 million to $1,260 million • $20 million increase from midpoint of prior guidance ▪ Adjusted EBITDA of $230 million to $240 million • Costs associated with onboarding LifePoint are factored into refreshed outlook Note1: Net debt is a non-GAAP measure. A reconciliation of non-GAAP to GAAP measures is provided in the Appendix of this presentation. 9

Appendix 10

Use of Non-GAAP Financial Measures ▪ In order to provide a more comprehensive understanding of the information used by R1’s management team in financial and operational decision making, the Company supplements its GAAP consolidated financial statements with certain non-GAAP financial performance measures, including adjusted EBITDA, adjusted cost of services, adjusted SG&A expense and net debt. Adjusted EBITDA is defined as GAAP net income before net interest income/expense, income tax provision/benefit, depreciation and amortization expense, share-based compensation expense, expense arising from debt extinguishment, severance and related employee benefits, strategic initiatives costs, transitioned employee restructuring expense, digital transformation office expenses, certain COVID-19 related expenses, and certain other items. Adjusted cost of services is defined as GAAP cost of services before share-based compensation expense and depreciation and amortization expense. Adjusted SG&A expense is defined as GAAP SG&A expense before share-based compensation expense and depreciation and amortization expense. Net debt is defined as total debt less cash and cash equivalents, and restricted cash. ▪ Our board of directors and management team use adjusted EBITDA as (i) one of the primary methods for planning and forecasting overall expectations and for evaluating actual results against such expectations and (ii) a performance evaluation metric in determining achievement of certain executive incentive compensation programs, as well as for incentive compensation programs for employees. ▪ A reconciliation of GAAP net income to non-GAAP adjusted EBITDA, GAAP cost of services to non-GAAP cost of services, GAAP SG&A expense to non- GAAP SG&A expense and total debt to net debt is provided on the following slides. Adjusted EBITDA, adjusted cost of services, adjusted SG&A expense and net debt should be considered in addition to, but not as a substitute for, the information presented in accordance with GAAP. 11

Reconciliation of GAAP to non-GAAP Financials $ in millions Reconciliation of GAAP Net Income to non-GAAP Adjusted EBITDA Three Months Ended Three Months Ended September 30, June 30, 2020 2019 2020 Net income $ 5.2 $ 9.2 $ 15.1 Net interest expense 4.4 5.0 4.8 Income tax provision 1.0 9.4 5.2 Depreciation and amortization expense 17.3 14.1 17.9 Share-based compensation expense 6.8 3.8 4.3 Other expenses1 15.7 7.4 18.0 Adjusted EBITDA (non-GAAP) $ 50.4 $ 48.9 $ 65.3 Reconciliation of GAAP Cost of Services to Non-GAAP Cost of Services Three Months Ended Three Months Ended September 30, June 30, 2020 2019 2020 Cost of services $ 255.2 $ 241.9 $ 248.3 Less: Share-based compensation expense 2.7 1.5 1.5 Depreciation and amortization expense 16.3 12.7 17.0 Non-GAAP cost of services $ 236.2 $ 227.7 $ 229.8 Reconciliation of GAAP SG&A to Non-GAAP SG&A Three Months Ended Three Months Ended September 30, June 30, 2020 2019 2020 Selling, general and administrative $ 25.7 $ 28.3 $ 23.3 Less: Share-based compensation expense 4.1 2.3 2.8 Depreciation and amortization expense 1.0 1.4 0.9 Non-GAAP selling, general and administrative $ 20.6 $ 24.6 $ 19.6 Note (1): Other expenses are comprised of severance and related employee benefits, strategic initiatives costs, transitioned employees restructuring expense, a portion 12 of DTO costs and appreciation bonuses for the Company’s front-line employees and pandemic response mobilization efforts related to the COVID-19 pandemic.

Reconciliation of GAAP to non-GAAP Financials $ in millions Reconciliation of GAAP Operating Income Guidance to Non-GAAP Adjusted EBITDA Guidance 2020 GAAP Operating Income Guidance $90-110 Plus: Depreciation and amortization expense $65-75 Share-based compensation expense $20-25 Strategic initiatives, severance and other costs $45-50 Adjusted EBITDA Guidance $230-240 Reconciliation of Total Debt to Net Debt September 30, December 31, 2020 2019 Senior Revolver $ 70.0 $ 40.0 Senior Term Loan 491.0 316.9 561.0 356.9 Less: Cash and cash equivalents 106.3 92.0 Non-current portion of restricted cash equivalents 1.0 0.5 Net Debt $ 453.7 $ 264.4 13
