Attached files
Table of Contents
UNITED STATES
SECURITIES AND EXCHANGE COMMISSION
Washington, D.C. 20549
Form 10-K
| x | ANNUAL REPORT PURSUANT TO SECTION 13 OR 15(d) OF THE SECURITIES EXCHANGE ACT OF 1934 |
For the fiscal year ended December 31, 2013
OR
| ¨ | TRANSITION REPORT PURSUANT TO SECTION 13 OR 15(d) OF THE SECURITIES EXCHANGE ACT OF 1934 |
For the transition period from to
Commission file number 001-34746
Accretive Health, Inc.
(Exact name of registrant as specified in its charter)
| Delaware | 02-0698101 | |
| (State or other jurisdiction of incorporation or organization) |
(I.R.S. Employer Identification No.) | |
| 401 North Michigan Avenue Suite 2700 Chicago, Illinois |
60611 | |
| (Address of principal executive offices) | (Zip Code) | |
Registrant’s telephone number, including area code
(312) 324-7820
Securities registered pursuant to Section 12(b) of the Act:
| Title of each class: |
Name of each exchange on which registered: | |
| None | None |
Securities registered pursuant to Section 12(g) of the Act:
Common Stock, $0.01 par value
Indicate by check mark if the registrant is a well-known seasoned issuer, as defined in Rule 405 of the Securities Act. Yes ¨ No x
Indicate by check mark if the registrant is not required to file reports pursuant to Section 13 or Section 15(d) of the Act. Yes ¨ No x
Indicate by check mark whether the registrant (1) has filed all reports required to be filed by Section 13 or 15(d) of the Securities Exchange Act of 1934 during the preceding 12 months (or for such shorter period that the registrant was required to file such reports), and (2) has been subject to such filing requirements for the past 90 days. Yes ¨ No x
Indicate by check mark whether the registrant has submitted electronically and posted on its corporate website, if any, every Interactive Data File required to be submitted and posted pursuant to Rule 405 of Regulation S-T (§ 232.405 of this chapter) during the preceding 12 months (or for such shorter period that the registrant was required to submit and post such files). Yes ¨ No x
Indicate by check mark if disclosure of delinquent filers pursuant to Item 405 of Regulation S-K is not contained herein, and will not be contained, to the best of registrant’s knowledge, in definitive proxy or information statements incorporated by reference in Part III of this Form 10-K or any amendment to this Form 10-K. x
Indicate by check mark whether the registrant is a large accelerated filer, an accelerated filer, a non-accelerated filer, or a smaller reporting company. See the definitions of “large accelerated filer,” “accelerated filer” and “smaller reporting company” in Rule 12b-2 of the Exchange Act. (Check one):
| Large accelerated filer | x | Accelerated filer | ¨ | |||
| Non-accelerated filer | ¨ (Do not check if a smaller reporting company) | Smaller reporting company | ¨ | |||
Indicate by check mark whether the registrant is a shell company (as defined in Rule 12b-2 of the Exchange Act). Yes ¨ No x
Aggregate market value of the voting and non-voting common equity held by non-affiliates of the registrant, based on the last sale price for such stock on June 28, 2013: $ 668,398,785
The number of shares outstanding of each of the registrant’s classes of common stock, as of December 1, 2014:
| Common Stock, $0.01 par value |
98,308,643 |
Table of Contents
EXPLANATORY NOTE
Unless the context indicates otherwise, references in this Annual Report to “Accretive Health,” “Accretive,” “the Company,” “we,” “our,” and “us” mean Accretive Health, Inc. and its subsidiaries.
On March 4, 2013, the Audit Committee of our Board of Directors, based on the recommendation of management and after consultation with our independent registered public accounting firm, determined that we will restate our previously issued consolidated financial statements.
This is our first periodic report since our Quarterly Report on Form 10-Q for the period ended September 30, 2012. This report covers the fiscal years ended December 31, 2013, 2012 and 2011 (as restated), and is in lieu of filing separate reports for 2013 and 2012 and an amended report for 2011. In addition, we are restating certain financial statement line items and making other corrective adjustments to certain of our previously filed historical consolidated financial statements and related information.
Within this report, we have included restated audited results for the year ended December 31, 2011, as well as restated unaudited condensed consolidated financial statements for the quarterly periods in 2012 and 2011, which we refer to as the Restatement. Our consolidated financial statements as of and for the year ended December 31, 2011 included in this report have been restated from the consolidated financial statements included in our Annual Report on Form 10-K for the year ended December 31, 2011. The Restatement corrects accounting errors related to timing of recognition of net service revenue, as well as the presentation of net service revenue and cost of services, and also certain capitalized costs for internal use software, goodwill, timing and recording of various accruals, income taxes and other miscellaneous items. We have also included the restated unaudited consolidated financial statements for the years ended December 31, 2010 and 2009 in “Part II – Item 6 – Selected Consolidated Financial Data.”
For additional discussion of the accounting errors identified, and the Restatement adjustments, see “Part II – Item 7 – Management’s Discussion and Analysis of Financial Condition and Results of Operations” and Note 2, Restatement of Previously Issued Consolidated Financial Statements included in “Part II – Item 8 – Consolidated Financial Statements and Supplementary Data.” “Part II – Item 6 – Selected Consolidated Financial Data” summarizes the effects of the Restatement adjustments on 2010 and 2009, and Note 14, Quarterly Financial Information (Unaudited), to the consolidated financial statements included in this Annual Report on Form 10-K presents consolidated quarterly information for 2013, 2012 and 2011. The cumulative impact of the restated financial results at the beginning of 2009, as well as the impacts to 2009 through 2013, are presented in “Part II – Item 6 – Selected Consolidated Financial Data.” For a description of the material weaknesses identified by management as a result of our internal reviews, and management’s plan to remediate those deficiencies, see “Part II – Item 9A – Controls and Procedures.”
As a result of the Restatement and review of the accounting for the related transactions, we have been unable to timely file our annual and quarterly reports with the Securities and Exchange Commission, or SEC, for the periods ended after September 30, 2012. We do not intend to file Quarterly Reports on Form 10-Q for any of the quarters for the year ended December 31, 2013, although we have included in Note 14, Quarterly Financial Information (Unaudited), to the consolidated financial statements included in this Annual Report on Form 10-K certain disclosures for those periods in this report. We have not amended, and do not intend to amend, our Quarterly Reports on Form 10-Q for 2012, 2011 or for any prior periods affected by the Restatement or our Annual Reports on Form 10-K for 2011 or for any prior periods affected by the Restatement (other than as noted in “Part II – Item 6 – Selected Consolidated Financial Data” and “Part II – Item 8 – Consolidated Financial Statements and Supplementary Data”). We have not obtained, and do not intend to obtain, an audit of our restated consolidated financial statements for the years ended December 31, 2010 and 2009. The consolidated financial statements and related financial information in our Quarterly Reports on Form 10-Q for 2012, 2011 or any prior periods affected by the Restatement and our Annual Reports on Form 10-K for 2011 or any prior periods should not be relied on as previously noted in our Current Report on Form 8-K, dated March 8, 2013. Any material adjustments for periods prior to 2011 have been recorded as adjustments to accumulated retained earnings as of December 31, 2010 in our consolidated financial statements. Information regarding the Restatement adjustments is included in Note 2, Restatement of Previously Issued Consolidated Financial Statements, “Part II – Item 6 – Selected Consolidated Financial Data”, and Note 14, Quarterly Financial Information (Unaudited) to the consolidated financial statements included in this Annual Report on Form 10-K. All amounts reflected in this report for periods prior to and including September 30, 2012 reflect the effects of the Restatement.
Table of Contents
ACCRETIVE HEALTH, INC.
Table of Contents
FORWARD-LOOKING STATEMENTS
This Annual Report on Form 10-K contains forward-looking statements, within the meaning of the federal securities laws, that involve substantial risks and uncertainties. You should not place undue reliance on these statements. All statements, other than statements of historical facts, included in this Annual Report on Form 10-K regarding our strategy, future operations, future financial position, future revenue, projected costs, prospects, plans, objectives of management and expected market growth are forward-looking statements. The words “anticipate”, “believe”, “estimate”, “expect”, “intend”, “may”, “plan”, “predict”, “project”, “would” and similar expressions are intended to identify forward-looking statements, although not all forward-looking statements contain these identifying words. These forward-looking statements include, among other things, statements about:
| • | our ability to regain a listing on a national securities exchange; |
| • | our ability to attract and retain customers; |
| • | our financial performance; |
| • | the advantages of our solutions as compared to those of others; |
| • | our plans to incorporate our value based reimbursement capabilities and our physician advisory services offering within our revenue cycle management service offering; |
| • | our ability to establish and maintain intellectual property rights; |
| • | our ability to retain and hire necessary employees and appropriately staff our operations; and |
| • | our estimates regarding capital requirements and needs for additional financing. |
We may not actually achieve the plans, intentions or expectations disclosed in our forward-looking statements, and you should not place undue reliance on our forward-looking statements. Actual results or events could differ materially from the plans, intentions and expectations disclosed in the forward-looking statements we make. We have included important factors in the cautionary statements included in this Annual Report, particularly in “Part I - Item 1A - Risk Factors,” that could cause actual results or events to differ materially from the forward-looking statements that we make. Our forward-looking statements do not reflect the potential impact of any future acquisitions, mergers, dispositions, joint ventures or investments we may make.
You should read this Annual Report and the documents that we have filed as exhibits to the Annual Report completely and with the understanding that our actual future results may be materially different from what we expect. We do not assume any obligation to update any forward-looking statements, whether as a result of new information, future events or otherwise, except as required by law.
1
Table of Contents
PART I
| Item 1. | Business |
Overview
Accretive Health is a leading provider of revenue cycle services that help healthcare providers generate sustainable improvements in their operating margins and cash flows while also enhancing patient, physician and staff satisfaction for our customers. We achieve these results for our customers through an integrated approach encompassing our end-to-end revenue cycle management service offering and physician advisory services. We do so by deploying a unique operating model that leverages our extensive healthcare site experience, innovative technology and process excellence.
Our primary service offering consists of revenue cycle management, or RCM, which helps healthcare providers to more efficiently manage their revenue cycles. This encompasses patient registration, insurance and benefit verification, medical treatment documentation and coding, bill preparation and collections from patients and third-party payers. Our offering is unique in that it spans our customers’ entire revenue cycle, setting us apart from competing service providers that address only partial solutions or cost reduction efforts. We assist our RCM customers in increasing the portion of the maximum potential services revenue they receive while simultaneously reducing their revenue cycle operating costs. Together, these benefits can generate significant and sustainable improvements in operating margins and cash flows for our customers. Our management and staff supplement each customer’s existing RCM process and staff, and help operate our customers’ processes. We educate and empower our customers’ employees so that over time we can jointly deliver improved results using the proprietary technology included in our applications. Once implemented, our technology applications, processes and services are deeply embedded in our customer’s day-to-day operations. We believe this service offering is adaptable to meet an evolving healthcare regulatory environment, technology standards and market trends. Importantly, our RCM agreements typically provide that we and our customers share in the benefits that are derived on behalf of our customers, particularly revenue increases and, in most cases, cost savings resulting from the application of our solutions. We believe that this sharing of benefits aligns our objectives and interests with those of our customers.
Our physician advisory services offering, introduced as an independent offering in 2009, and which we are in the process of integrating into our RCM offering, assists hospitals in complying with third-party payers’ requirements regarding whether to classify a hospital visit as an in-patient or an out-patient observation case for billing purposes and consists of both concurrent review and retrospective chart audits. We also provide customers with retrospective appeal management service support for both governmental and commercial payers. Our physicians conduct detailed retrospective reviews of medical records to identify medical necessity for hospital services and the required documentation to appropriately support an appeal. We employ trained physicians to deliver these services.
Our population health solutions offering, which we offered on a standalone basis between the third quarter of 2010 and the third quarter of 2014, and which we previously referred to as quality and total cost of care, was designed to enable healthcare providers to more effectively manage the health of a defined patient population by identifying those individuals who are most likely to experience an adverse health event and, as a result, incur high healthcare costs in the coming years. We currently do not serve any customers for our population health solutions as an independent service offering. In the fourth quarter of 2014, we began integrating capabilities from this offering into our core revenue cycle management offering in order to enhance our value-based reimbursement capabilities for our RCM customers.
We develop and refine our offerings based in part on information, processes and management experience garnered through working with some of the largest and most prestigious hospitals and healthcare systems in the United States, as well as in anticipation of regulatory and market changes that impact our customers. Our customers typically are single or multi-hospital healthcare systems, including faith-based healthcare systems,
2
Table of Contents
community healthcare systems, academic medical centers and their respective affiliated ambulatory clinics and physician practice groups, certain of which have common affiliations to larger umbrella healthcare organizations that are also parties to our customer contracts with their respective affiliates. We have developed strategic, long-term relationships with our customers and focus on providers that we believe understand the value of our operating model and have demonstrated success in both clinical and operational outcomes.
Our Strategy
We strive to be the partner of choice for U.S. healthcare providers in RCM, a strategically important service that aligns clinical, financial and administrative functions, allowing providers to focus on delivering quality care with ever-increasing efficiency. Key elements of our strategy include:
| • | Delivering tangible, long-term results through an integrated offering. Our solutions are designed to help our customers achieve sustainable economic value through improvements in their operating margins and cash flows, which provides us with performance-based revenues. Our integrated offerings alleviate the need for our customers to purchase services from multiple sources, saving them time, money and integration challenges in their efforts to improve their revenue cycle activities. |
| • | Developing, utilizing and enhancing effective and proprietary algorithms and processes to improve our customers’ revenue yield. We have developed and continue to design proprietary processes intended to help our customers to increase net revenue yields on amounts owed to them. To help improve revenue collection from third-party payers and patients, we have developed proprietary algorithms to assess risk for all of our customers’ receivables. Our methodology is designed to enable nearly 100% of outstanding claims to be reviewed, prioritized and pursued. We believe that our focus on collecting revenue from a broader range of outstanding claims and reducing the average time to collection differentiates our RCM services. |
| • | Seeking to expand the scope of services to existing customers and diversify our customer base. We benefit from long-term relationships with some of the nation’s largest health networks such as Ascension Health, which was our founding customer and remains our largest customer, as well as Intermountain Healthcare and Catholic Health East. We seek to expand the scope of our services to healthcare providers within the network of our existing customers’ hospital systems. We also focus on marketing to other healthcare providers and seek to leverage our relationships with existing customers as references to continue to attract business from new customers. |
| • | Developing enhanced service offerings that are designed to enable our customers and prospects to improve their operations and to effectively participate in new payment models. We plan to introduce new services that we believe will be attractive to both existing and prospective new customers. These include offerings to support the movement toward value-based reimbursement, or VBR, that is being driven through a confluence of government regulation, commercial third-party payer programs and benefit plan designs advanced by large employers and third-party payers. These new payment models are intended to shift the utilization of healthcare resources away from volume-based episodic care of patients who are sick or have chronic conditions to the pro-active management of patient populations to promote wellness and provision of care in lower acuity settings. We believe that the impact on providers, including our customers, will be that they will increasingly bear financial risk in clinical outcomes. We also may selectively pursue acquisitions and/or strategic relationships that will enable us to broaden our service offerings. |
Our Services
Drawing on our combination of our extensive healthcare-site expertise, innovative technology and process excellence, we seek to deliver measurable economic value to our customers across our revenue cycle management and physician advisory solutions.
3
Table of Contents
Revenue Cycle Management Offering
Our RCM service offering consists of comprehensive, integrated technology and RCM services, that address the full spectrum of revenue cycle operational issues faced by healthcare providers.
To implement our solution, we supplement each customer’s existing RCM process and staff with our qualified RCM specialists, leaders and staff and connect our proprietary technology and analytical applications to each customer’s existing technology systems. Our employees have significant experience in healthcare management, revenue cycle operations, technology, quality control and other management disciplines. Our solution is adapted to the hospital’s organizational structure to minimize disruption to existing operation and staff. We seek to integrate our technology, personnel, our accumulated body of knowledge and our culture within each customer’s revenue cycle activities, with the expectation that we will enjoy a long-term collaborative relationship with each customer.
Our RCM agreements generally provide us with the opportunity to earn two types of performance-based fees associated with achieved efficiencies and improvements in our customer’s revenue cycle processes: net operating fees and incentive fees.
Net operating fees represent the gross base fees we charge our customers for operating the revenue cycle processes included in our agreements less corresponding costs of customers’ revenue cycle operations which we undertake to pay pursuant to our RCM agreements. For some customers, the amount of our net operating fees is reduced by an agreed upon percentage of such difference, representing the customer’s share of cost reductions resulting from our services. We help our customers reduce their revenue cycle costs by implementing new practices, technology and more efficient processes. In certain cases, we work with our customers to transfer aspects of their revenue cycle operations to our shared services centers, which typically results in lower operating costs than operating those aspects of the revenue cycle at the customers’ site.
Incentive fees represent our negotiated share of the increases in our customers’ operating revenues and are earned by:
| • | Improving Net Revenue Yield. We help many of our customers improve their collection of amounts owed by third-party payers and patients for healthcare services. We refer to this as net revenue yield. We use our proprietary technology or other financial metrics to calculate their improvement in net revenue yield. When using the method of calculating this improvement that employs our proprietary technology, we compare the customer’s actual cash collections for a given instance of care to the maximum potential cash receipts that the customer should have received from the instance of care. We then aggregate these calculations for all instances of care and compare the result to the aggregate calculation for a defined period before we began to provide our services to the customer. When using other financial metrics to calculate this improvement, we typically employ metrics that are already being tracked by, or easily calculated from, our customers’ respective accounting systems and compare the results of those metrics against the results for the same metrics for a defined period before we began to provide our services to the customer. |
| • | Increasing Charge Capture. We are able to help our customers increase their charge capture by implementing optimization techniques and related processes. We use sophisticated analytics software to help improve the accuracy of claims filings and the resolution of disputed claims from third-party payers. We also overlay a range of capabilities designed to reduce missed charges, improve the clinical/reimbursement interface and produce bills that comply with third-party payer requirements and applicable healthcare regulations. |
We seek to improve our customers’ processes using a variety of techniques including:
| • | Gathering Complete Patient and Payer Information. We focus on gathering complete patient information and validating insurance eligibility and benefits so patient care services can be recorded and |
4
Table of Contents
| billed to the appropriate parties. For scheduled healthcare services, we educate patients as to their potential financial responsibilities before receiving care. Through our systems we maintain an automated electronic scorecard which measures the efficiency of up-front data capture, billing and collections throughout the life cycle of any given patient account. These scorecards are analyzed in the aggregate, and the results are used to help improve work flow processes and operational decisions for our customers. |
| • | Improving Claims Filing and Third-Party Payer Collections. Through our proprietary technology and process expertise, we identify, for each patient encounter, the amount our customer should receive from a payer if terms of the applicable contract with the payer and patient policies are followed. Over time, we compare these amounts with the actual payments collected to help identify which payers, types of medical treatments and patients represent various levels of payment risk for a customer. Using proprietary algorithms and analytics, we consider actual reimbursement patterns to predict the payment risk associated with a customer’s claims to its payers, and we then direct increased attention and time to the riskiest accounts. |
| • | Identifying Alternative Payment Sources. We use various methods to find payment sources for uninsured patients and reimbursement for services not covered by third-party payers. Our patient financial screening technology and methodologies often identify federal, state or private grant sources to help pay for healthcare services. These techniques are designed to ease the financial burden on uninsured or underinsured patients, increase the percentage of patient bills that are actually paid, and improve the total amount of reimbursement received by our customers. |
| • | Employing Proprietary Technology and Algorithms. We employ a variety of proprietary data analytics and algorithms. For example, we identify patient accounts with financial risk by applying proprietary analysis techniques to the data we have collected. Our systems are designed to streamline work processes through the use of proprietary algorithms that focus revenue cycle staff effort on those accounts deemed to have the greatest potential for improving net revenue yield or charge capture. We adjust our proprietary predictive algorithms to reflect changes in payer and patient behavior based upon the knowledge we obtain from our entire customer base. As new customers are added and payer and patient behavior changes, the information we use to create our algorithms expands, increasing the accuracy, reliability and value of those algorithms. |
| • | Using Analytical Capabilities and Operational Excellence. We draw on the experience that we have gained from working with some of the best healthcare provider systems in the United States to train our customers’ staff about new and innovative RCM practices. We use sophisticated analytical procedures to identify specific opportunities to improve business processes. |
| • | Leveraging our Shared Services Centers. We help our customers increase their revenue cycle efficiency by implementing improved practices, streamlining work flow processes and outsourcing aspects of their revenue cycle operations to our shared services centers. Examples of services that can be completed at our shared services centers in the United States and India include pre-registration, medical transcription, cash posting, reconciliation of payments to billing records, and patient and payer follow-up. By leveraging the economies of scale and experience of our shared services centers, we believe that we offer our customers better quality services at a lower cost. |
We believe that these techniques are enhanced by our proprietary and integrated technology, management experience and well-developed processes. Our proprietary technology applications include workflow automation and direct payer connection capabilities that enable revenue cycle staff to focus on problem accounts rather than on manual tasks, such as searching payer websites for insurance and benefits verification for all patients. We employ technology that identifies and isolates specific cases requiring review or action, using the same interface for all users, to automate a host of tasks that otherwise can consume a significant amount of staff time. We use real-time feedback from our customers to improve the functionality and performance of our technology and processes and incorporate these improvements into our service offerings on a regular basis. We strive to apply operational excellence throughout our customers’ entire revenue cycle.
5
Table of Contents
Physician Advisory Services Offering
Our physician advisory services offering provides concurrent level of care billing classification reviews, as well as retrospective chart audits to assist hospitals in properly billing third-party payers for selected services. These services complement our RCM offering and our ability to provide our customers end-to-end management services, and, accordingly, some of our RCM customers are also customers of our physician advisory services offering. According to the policies of the Centers for Medicare & Medicaid Services, or CMS, the decision to classify a patient as an in-patient or out-patient observation case for billing purposes is based on complex medical judgment that can only be made after the physician has considered a number of factors, including the patient’s medical history and current medical needs, the severity of signs and symptoms, the medical predictability of adverse events and the patient’s anticipated length of stay. Using our secure web portal, hospital customers transmit pertinent data about the case at hand to our trained physicians, who then leverage our proprietary diagnosis guidelines and the extensive information within our knowledge database to reach an informed billing classification judgment, which we then provide to our customers as a recommendation.
We also provide customers with retrospective appeal management service support for both governmental and commercial payers. Our physicians conduct detailed retrospective reviews of medical records to identify medical necessity for hospital services and the required documentation to appropriately support an appeal.
We believe that our physician advisory services offering provides our customers with a number of operational benefits, such as
| • | direct physician to physician contact, |
| • | improved service levels, and |
| • | real-time reporting and analytics. |
Population Health Solutions Offering
Our population health solutions services are designed to enable healthcare providers to partner with third-party payers for the creation and implementation of payment structures based on clinical success, measured at either the individual level or among a defined population of patients, and to assist providers in maximizing their financial performance under such compensation structures. These services are designed to help healthcare providers enhance the patient and physician experience and to assist healthcare providers in capturing a share of any reduction in healthcare costs they are able to achieve under revised compensation structures by helping them negotiate contracts with third-party payers that provide an equitable sharing of the savings in total medical costs among the payers and healthcare providers, and manage their revenue cycle process under such contracts. In the fourth quarter of 2014, we began integrating capabilities from this offering into our core RCM offering in order to enhance our value-based reimbursement capabilities for our RCM customers. We anticipate that our value based reimbursement capabilities will be a significant component of our end-to-end RCM offering. As of the fourth quarter of 2014, we currently have no customers for population health services on a stand alone basis.
Market Opportunity
The market for our service offerings consists primarily of multi-hospital systems and other healthcare providers in the United States. We believe that macroeconomic, regulatory and healthcare industry conditions will continue to impose financial pressures on healthcare providers and will increase the importance of managing their revenue cycle operations effectively and efficiently. New reimbursement models in the healthcare industry measure both financial and clinical performance metrics, and increasingly shift economic risk of clinical outcomes to providers. We believe our integrated revenue cycle offering can help providers adapt to, and improve reimbursement levels under, such risk-based compensation structures.
Segments
All of our significant operations are organized around the single business of providing end-to-end management services of revenue cycle operations for U.S.-based hospitals and other medical services providers.
6
Table of Contents
We view our operations and manage our business as one operating and reporting segment. All of our net services revenue and trade accounts receivable are derived from healthcare providers domiciled in the United States. The information about our business should be read together with our consolidated financial statements and related notes included elsewhere in this Annual Report on Form 10-K. See Note 12, Segments and Customer Concentrations, to our consolidated financial statements for information regarding our segment and customer concentrations.
Customers
Our customers typically are single or multi-hospital healthcare systems, including faith-based healthcare systems, community healthcare systems, academic medical centers and their respective affiliated ambulatory clinics and physician practice groups, certain of which have common affiliations to larger umbrella healthcare organizations that are also parties to our customer contracts with their respective affiliates. Our service offerings are best suited for healthcare organizations in which substantial improvements can be realized through the full implementation of our solutions. We focus our sales efforts on large acute hospitals and multi-hospital systems. We seek to develop strategic, long-term relationships with our customers and focus on providers that we believe understand the value of our operating model and have demonstrated success in both the provision of healthcare services and the ability to achieve financial and operational results.
Customer Agreements
We generally provide our RCM offering pursuant to managed services agreements with our customers. In rendering our services, we must comply with customer policies and procedures regarding charity care, personnel, data security, compliance and risk management, as well as applicable federal, state and local laws and regulations.
Our management services agreements with our RCM customers typically span three to five years. After the initial term of the agreement, many of our managed services agreements automatically renew unless terminated by either party upon prior written notice.
In general, our RCM agreements provide that:
| • | we are required to staff a sufficient number of our own employees on each customer’s premises and provide the technology necessary to implement and manage our services; |
| • | our management and staff work cooperatively with our customers’ management and staff to achieve mutually specified objectives; |
| • | we earn performance-based fees that are tied to the achievement of financial benchmarks related to increases in customer revenues and/or reductions in operating costs; |
| • | the parties provide representations and indemnities to each other; and |
| • | the agreements are subject to termination by either party in the event of a material breach which is not cured by the breaching party. |
Our agreements for physician advisory services are usually multi-year arrangements which generally vary in length between one and three years. Generally, the agreements automatically renew after their initial term unless terminated by either party upon prior written notice. Customers pay a contractually negotiated fee for this service on a per-use basis.
We currently do not have any customers for our population health solutions offering and therefore do not have any managed services agreements for that service.
Sales and Marketing
Our new business opportunities are generated through a combination of high-level industry contacts of members of our senior management team and systematic relationship building by a team of senior sales
7
Table of Contents
executives. Our sales and marketing process generally begins by engaging senior executives of the prospective hospital or healthcare system, typically followed by our assessment of the prospect’s existing operations, and a review of the findings. We begin negotiations with a standardized contract that is customized as necessary after collaborative discussions of operational and management issues and our proposed working relationship. Our sales process for RCM managed services agreements typically lasts six to 18 months from the introductory meeting to the agreement’s execution, while our sales process for our physician advisory services offering typically lasts three to four months.
Technology
Technology Development
Our technology development organization operates out of various facilities in the United States and India. We are increasing the amount of resources that we invest in the improvement of our technology in order to enhance the services that we provide our customers. All customer sites run the same base set of code. We use a beta-testing environment to develop and test new technology offerings at one or more customers, while keeping the rest of our customers on production-level code.
Our applications are deployed on a highly-scalable architecture based upon Microsoft and other industry leading platforms. We offer a common experience for end-users and believe the consistent look and feel of our applications allows our customers and staff to use our software suite quickly and easily.
We devote substantial resources to our development efforts and plan at an annual, bi-annual and quarterly release level. We employ a structured system to assess the impact that potential new technologies or enhancements will have on net service revenue, costs, efficiency and customer satisfaction. The results of this analysis are evaluated in conjunction with our overall corporate goals when making development decisions. In addition to our technology development team, our operations personnel play an integral role in setting technology priorities in support of their objective of keeping our software operating 24 hours a day, 7 days a week.
Technology Operations and Security
Our applications are hosted in data centers located in Alpharetta, Georgia; Philadelphia, Pennsylvania; and Salt Lake City, Utah; and our internal financial application suite is hosted in a data center in Minneapolis, Minnesota. These data centers are operated for us by third parties and are compliant with the Statement on Standards for Attestation Engagements, or SSAE, No. 16, Reporting on Controls at a Service Organization (formerly referred to as Statement on Auditing Standards, or SAS, 70). Our development, testing and quality assurance environment is operated from the third-party data center in Alpharetta, Georgia; with a separate server room in one of our Chicago, Illinois offices. We have agreements with our hardware and system software suppliers for support 24 hours a day, 7 days a week. Our operations personnel also use our resources located in our other U.S. facilities, as well as our India facilities.
Customers use high-speed internet connections or private network connections to access our business applications. We utilize commercially available hardware and a combination of custom-developed and commercially available software. We designed our primary application in this manner to permit scalable growth. For example, database servers can be added without adding web servers, and vice versa. We believe that this architecture enables us to scale our operations effectively and efficiently.
Our databases and servers are backed-up in full on a weekly basis and undergo incremental back-ups nightly. Databases are also backed-up frequently by automatically shipping log files with accumulated changes to separate sets of back-up servers. In addition to serving as a back-up, these log files update the data in our online analytical processing engine, enabling the data to be more current than if only refreshed overnight. Data and information regarding our customers’ patients is encrypted when transmitted over the internet or traveling off-site on portable media such as laptops or backup tapes.
8
Table of Contents
Customer system access requests are load-balanced across multiple application servers, allowing us to handle additional users on a per-customer basis without application changes. System utilization is monitored for capacity planning purposes.
Our software interacts with our customers’ software through a series of real-time and batch interfaces. We do not require changes to the customer’s core patient care delivery or financial systems. Instead of installing hardware or software in customer locations or data centers, we specify the information that a customer needs to extract from its existing systems in order to interface with our systems. This methodology enables our systems to operate with many combinations of customer systems, including custom and industry-standard implementations. We have successfully integrated our systems with 15 to 20 year old systems, with package and custom systems, and with major industry-standard products.
When these interfaces are in place, we provide an application suite across the hospital revenue cycle. For our purposes, the revenue cycle starts when a patient registers for future service or arrives at a hospital or clinic for unscheduled service, and ends when the hospital has collected all the appropriate revenue from all possible sources. Thus, we provide eligibility, address validation, skip tracing, charge capture, patient and payer follow-up, analytics and tracking, charge master management, contract modeling, contract “what if” analysis, collections and other functions throughout the customer’s revenue cycle.
Because our databases run on generally available hardware and software, we are able to use standard applications to develop, maintain and monitor our solutions. Databases for one or more customers can run on a single database server with disk storage being provided from a shared storage area network, or SAN, with physical separation maintained between customers. In the event of a server failure, we have maintenance contracts in place that require the service provider to have the server back on-line in four hours or less, or we move the customer processing to another server. The SAN is configured as a redundant array of inexpensive disks, or RAID, and this RAID configuration protects against disk failures having an impact on our operations.
In the event that a combination of events causes a system failure, we typically can isolate the failure to one or a small number of customers. We believe that no combination of failures by our systems can impact a customer’s ability to deliver patient care.
Our third-party data centers were designed to withstand many catastrophic events, such as blizzards and hurricanes. To protect against a catastrophic event in which our primary data center is completely destroyed and service cannot be restored within a few days, we store backups of our systems and databases off-site. In the event that we are required to move operations to a different data center, we would re-establish operations by provisioning new servers, restoring data from the off-site backups and re-establishing connectivity with our customers’ host systems. Because our systems are web-based, no changes would need to be made on customer workstations, and customers would be able to reconnect as our systems became available again.
We monitor the response time of our application in a number of ways. We monitor the response time of individual transactions by customer and place monitors inside our operations and at key customer sites to run synthetic transactions that demonstrate our systems’ end-to-end responsiveness. Our hosting provider reports on responsiveness server-by-server and identifies potential future capacity issues. In addition, we survey key customers regarding system response time to make sure customer-specific conditions are not impacting performance of our applications.
We dedicate significant resources to protecting our customers’ confidential and protected health information, or PHI. Our security strategy employs various practices and technology to control and protect access to sensitive information. In January 2013, we received certification status from the Health Information Trust Alliance, or HITRUST, the healthcare industry group that certifies an entity’s material compliance with the Health Insurance Portability and Accountability Act of 1996, as amended, and the regulations that have been issued under it, which we collectively refer to as HIPAA, and various states’ security and privacy laws regarding
9
Table of Contents
the creation, access, storage or exchange of personal health and financial information. Our certification status signifies that we exhibit and are able to maintain high security standards of electronic PHI. In January 2014, we received renewal of our HITRUST certification.
Proprietary Software Suites
Revenue Cycle Management. Our integrated suite of revenue cycle management technology provides a layer of analytics, rules processing and workflow capabilities that interface with provider systems to optimize process efficiency and effectiveness. These technologies power the detection of defects on patient accounts and enable staff workflow at point of service areas and business offices and our shared service centers.
| • | “AHtoAccess” powers workflow in customer central business offices and our scaled shared service centers for pre-registration, financial clearance, and financial counseling. The platform processes patient accounts through proprietary rules engines tuned to identify defects in demographic data, authorization processes, insurance benefits and eligibility, and medical necessity. Our rules engines in AHtoAccess are also used to calculate patient balance estimations and prior balance accounts receivables. For the uninsured, the platform helps staff triage patients to find coverage for their visit. Our technology enables staff to work on an exception basis eliminating the need for manual intervention on accounts with no exceptions identified. |
| • | “AHtoLink” delivers all of the insight and defect detection capabilities of our proprietary rules engines in real-time to point of service Emergency Department and registration areas within the hospitals and clinics. When defects are detected, users receive targeted messages alerting them to resolve the issue while the patient is still in front of them. |
| • | “AHtoContact,” our patient contact application, provides the workflow and data for patient contact center representatives. It enables effective financial discussions with patients on outstanding balances. The platform is integrated in to our call center, call-routing, auto-dialer capabilities and facilitates improved outcomes through propriety process and technology approaches. |
| • | “AHtoContract,” our proprietary contract modeling platform, is used to accurately calculate the maximum allowed reimbursement for each claim based upon models of the hospital’s contract with each payer. This platform is used to provide insight in to the health of payer contracts and to power portions of the workflow tools described above. |
| • | “AHtoAnalytics”, our web-based reporting and analytics platform, produces over 300 proprietary reports derived from the financial, process and productivity data that we accumulate as a result of our services, which enable us to monitor and identify areas for improvement in the efficacy of our revenue cycle management services. |
| • | “Integrated Defect Prevention” application, which we are currently in the process of deploying through a pilot program, will classify defects in a proprietary nomenclature and distribute data to back end teams for follow up and resolution. Defects will be identified and noted on accounts as they occur. Along with our “Yield-Based Follow Up” application, this platform is designed to power customer patient financial services departments and our shared services. |
These propriety technology applications run on an integrated platform built on a modern event driven architecture and rules engines that allow real-time integration of systems and operational workflows.
Physician Advisory Services. Our proprietary physician advisory services tools are designed to assist our customers in the initiation of a service request by our physician advisory team. Our platform allows for the electronic submission, tracking, reviewing and auditing of patient cases referred to us. The physician advisory services portal environment is established as a secure site that enables us to receive patient records from case managers and route them to our physicians for review. This workflow is supported by an analytics engine within the web portal that provides our customers the ability to improve their compliance and workflow with our real time reporting, dashboards and worklists.
10
Table of Contents
Value-Based Reimbursement (VBR). Our proprietary technology within our VBR capability includes a secure web-based workflow application that is designed to enable patient engagement staff, revenue cycle analysts, and physician/hospital care teams to monitor and manage gaps identified by our proprietary rules engines. Our Quality, Revenue, and Measurement Coding rules engines represent a foundational framework which leverages a central data warehouse of aggregated data from disparate sources. Gaps stemming from these rules engines will be presented in a prioritized and user-friendly manner through workflow applications that drive operational follow up and management. Our web-based application is divided across Patient Outreach, Point of Care and Reconciliation interfaces to allow for targeted resolution within operational support models across the revenue cycle. Patient Outreach leverages an auto dialer and prioritized work list to enable both proactive and reactive engagement with patients who are unscheduled, scheduled, or discharged. The Point of Care interface and report capabilities will provide actionable insights to help physicians achieve outcomes defined in value-based contracts. The Reconcile & Analyze tool allows for reporting, analysis and resolution of revenue gaps across the revenue cycle continuum. All three interfaces are supported by dashboards and analytics which enable integrated reporting and root cause analysis.
Competition
The market for our solutions is highly competitive and we expect competition to intensify in the future. We believe that competition for the services we provide is based primarily on the following factors:
| • | knowledge and understanding of the complex healthcare payment and reimbursement system in the United States; |
| • | a track record of delivering revenue improvements and efficiency gains for hospitals and healthcare systems; |
| • | the ability to deliver a solution that is fully-integrated along each step of a hospital’s revenue cycle operations; |
| • | cost-effectiveness, including the breakdown between up-front costs and pay-for-performance incentive compensation; |
| • | reliability, simplicity and flexibility of the technology platform; |
| • | understanding of the healthcare industry’s regulatory environment; and |
| • | sufficient infrastructure and financial stability. |
We also believe that several aspects of our business model differentiate us from our competitors:
| • | we focus on performance-based compensation as a way to share in the economic value that we help create for our customers; |
| • | we focus on optimizing our customers’ entire, end-to-end revenue cycle process, which we believe is more advantageous than models that merely focus on certain aspects or individual sub-processes within the revenue cycle; and |
| • | our offering integrates talented personnel with our proven business methods augmented by our proprietary technology. |
We believe that we compete effectively based upon all of these criteria, although our ability to acquire new customers has been and may continue to be adversely effected by unfavorable publicity in January 2012. See Item 1A Risk Factors – If we are unable to retain our existing customers, our financial conditions will suffer.
While we do not believe any single competitor delivers services in the same integrated manner as our revenue cycle management offering provides, we face competition from various sources. The internal RCM staffs of hospitals, who historically have performed the functions addressed by our services, in effect compete
11
Table of Contents
with us. Hospitals that previously have made investments in internally developed solutions sometimes choose to continue to rely on their own internal RCM staff.
We also compete with several categories of external market participants, most of which focus on separate components of hospital revenue cycle. External market participants include:
| • | software vendors and other technology-supported RCM business process outsourcing companies; |
| • | traditional consultants; and |
| • | information technology outsourcers. |
These types of external participants also compete with us in the field of physician advisory services. In addition, the commercial payer community can provide information or services that are intended to assist providers in transitioning to a value based reimbursement environment, and thus we indirectly compete with those commercial payers.
Although we believe that there are barriers to replicating our end-to-end RCM solution, we expect competition to intensify in the future. Other companies may develop superior or more economical service offerings that healthcare providers could find more attractive than our offerings. Moreover, the regulatory landscape may shift in a direction that is more strategically advantageous to existing and future competitors.
Government Regulation
The customers we serve are subject to a complex array of federal and state laws and regulations. These laws and regulations may change rapidly, and it is frequently unclear how they apply to our business. We devote significant efforts, through training of personnel and monitoring, to establishing and maintaining compliance with all regulatory requirements that we believe are applicable to our business and the services we offer.
Government Regulation of Health Information
Privacy and Security Regulations. HIPAA contains substantial restrictions and requirements with respect to the use and disclosure of individuals’ PHI. HIPAA prohibits a covered entity from using or disclosing an individual’s PHI unless the use or disclosure is authorized by the individual or is specifically required or permitted under HIPAA. Under HIPAA, covered entities must establish administrative, physical and technical safeguards to protect the confidentiality, integrity and availability of electronic PHI maintained or transmitted by them or by others on their behalf.
HIPAA applies to covered entities, such as healthcare providers that engage in HIPAA-defined standard electronic transactions, health plans and healthcare clearinghouses. In February 2009, HIPAA was amended by the Health Information Technology for Economic and Clinical Health, or HITECH, Act to impose certain of the HIPAA privacy and security requirements directly upon “business associates” that perform functions on behalf of, or provide services to, certain covered entities. Most of our customers are covered entities and we are a business associate to many of those customers under HIPAA as a result of our contractual obligations to perform certain functions on behalf of, and provide certain services to, those customers. As a business associate, we sometimes also act as a clearinghouse in performing certain functions for our customers. In order to provide customers with services that involve the use or disclosure of PHI, HIPAA requires our customers to enter into business associate agreements with us.
Such agreements must, among other things, provide adequate written assurances:
| • | as to how we will use and disclose the PHI; |
| • | that we will implement reasonable administrative, physical and technical safeguards to protect such information from misuse; |
12
Table of Contents
| • | that we will enter into similar agreements with our agents and subcontractors that have access to the information; |
| • | that we will report security incidents and other inappropriate uses or disclosures of the information; and |
| • | that we will assist the customer with certain of its duties under HIPAA. |
Transaction Requirements. In addition to privacy and security requirements, HIPAA also requires that certain electronic transactions related to healthcare billing be conducted using prescribed electronic formats. For example, claims for reimbursement that are transmitted electronically to third-party payers must comply with specific formatting standards, and these standards apply whether the payer is a government or a private entity. We are contractually required to structure and provide our services in a way that supports our customers’ HIPAA compliance obligations. On October 1, 2015, the International Classification of Diseases 9, or ICD-9, used to report medical diagnoses and in-patient procedures will be replaced by ICD-10. This change will affect coding for all covered entities and will require system and business changes throughout the healthcare industry. We are working collaboratively with our customers to prepare for the transition to the new code sets.
Data Security and Breaches. In recent years, there have been well-publicized data breach incidents involving the improper dissemination of personal health and other information of individuals, both within and outside of the healthcare industry. Many states have responded to these incidents by enacting laws requiring holders of personal information to maintain safeguards and to take certain actions in response to data breach incidents, such as providing prompt notification of the breach to affected individuals and government authorities. In many cases, these laws are limited to electronic data, but states are increasingly enacting or considering stricter and broader requirements. Under the HITECH Act and its implementing regulations, business associates are also required to notify covered entities, which in turn are required to notify affected individuals and government authorities of data security breaches involving unsecured PHI. In addition, the U.S. Federal Trade Commission, or FTC, has prosecuted some data breach cases as unfair and deceptive acts or practices under the Federal Trade Commission Act, or FTC Act. We have implemented and maintain physical, technical and administrative safeguards intended to protect all personal data, and have processes in place to assist us in complying with applicable laws and regulations regarding the protection of this data and properly responding to any security incidents.
State Laws. In addition to HIPAA, most states have enacted patient confidentiality laws that protect against the unauthorized disclosure of confidential medical information, and many states have adopted or are considering further legislation in this area, including privacy safeguards, security standards and data security breach notification requirements. Such state laws, if more stringent than HIPAA requirements, are not preempted by the federal requirements, and we must comply with them even though they may be subject to different interpretations by various courts and other governmental authorities.
Other Requirements. In addition to HIPAA, numerous other state and federal laws govern the collection, dissemination, use, access to and confidentiality of individually identifiable health and other information and healthcare provider information. The FTC has issued and several states have issued or are considering new regulations to require holders of certain types of personally identifiable information to implement formal policies and programs to prevent, detect and mitigate the risk of identity theft and other unauthorized access to or use of such information. Further, the U.S. Congress and a number of states have considered or are considering prohibitions or limitations on the disclosure of medical or other information to individuals or entities located outside of the United States.
Government Regulation of Reimbursement
Our customers are subject to regulation by a number of governmental agencies, including those that administer the Medicare and Medicaid programs. Accordingly, our customers are sensitive to legislative and regulatory changes in, and limitations on, the government healthcare programs and changes in reimbursement
13
Table of Contents
policies, processes and payment rates. During recent years, there have been numerous federal legislative and administrative actions that have affected government programs, including adjustments that have reduced or increased payments to physicians and other healthcare providers and adjustments that have affected the complexity of our work. For example, the Patient Protection and Affordable Care Act of 2010, or ACA, may reduce reimbursement for some healthcare providers while increasing reimbursement for others including primary care physicians. In addition, the ACA mandates the implementation of various programs and value and quality-based reimbursement incentives that may impact the amount of reimbursement for our customers. Some of these programs, such as the Medicare Value-Based Purchasing Program and the Hospital Readmission Reduction Program may be expanded in 2015 and 2016. It is possible that the federal or state governments will implement additional reductions, increases or changes in reimbursement in the future under government programs that adversely affect our customer base or increase the cost of providing our services. Any such changes could adversely affect our own financial condition by reducing the reimbursement rates of our customers.
Fraud and Abuse Laws
A number of federal and state laws, generally referred to as fraud and abuse laws, apply to healthcare providers, physicians and others that make, offer, seek or receive referrals or payments for products or services that may be paid for through any federal or state healthcare program and in some instances any private program. Given the breadth of these laws and regulations, they may affect our business, either directly or because they apply to our customers. These laws and regulations include:
Anti-Kickback Laws. There are numerous federal and state laws that govern patient referrals, physician financial relationships, and inducements to healthcare providers and patients. The federal healthcare anti-kickback law prohibits any person or entity from offering, paying, soliciting or receiving anything of value, directly or indirectly, for the referral of patients covered by Medicare, Medicaid and certain other federal healthcare programs or the leasing, purchasing, ordering or arranging for or recommending the lease, purchase or order of any item, good, facility or service covered by these programs. Courts have construed this anti-kickback law to mean that a financial arrangement may violate this law if any one of the purposes of an arrangement is to induce referrals of federal healthcare programs, patients or business, regardless of whether there are other legitimate purposes for the arrangement. There are several limited exclusions known as safe harbors that may protect certain arrangements from enforcement penalties although these safe harbors tend to be quite narrow. Penalties for federal anti-kickback violations can be severe, and include imprisonment, criminal fines, civil money penalties with triple damages and exclusion from participation in federal healthcare programs. Anti-kickback law violations also may give rise to a civil False Claims Act, or FCA, action, as described below. Many states have adopted similar prohibitions against kickbacks and other practices that are intended to induce referrals, and some of these state laws are applicable to all patients regardless of whether the patient is covered under a governmental health program or private health plan.
False or Fraudulent Claim Laws. There are numerous federal and state laws that forbid submission of false information or the failure to disclose information in connection with the submission and payment of provider claims for reimbursement. In some cases, these laws also forbid abuse of existing systems for such submission and payment, for example, by systematic over treatment or duplicate billing of the same services to collect increased or duplicate payments.
In particular, the federal FCA prohibits a person from knowingly presenting or causing to be presented a civil false or fraudulent claim for payment or approval by an officer, employee or agent of the United States. The FCA also prohibits a person from knowingly making, using, or causing to be made or used a false record or statement material to such a claim. The FCA was amended on May 20, 2009 by the Fraud Enforcement and Recovery Act of 2009, or FERA. Following the FERA amendments, the FCA’s “reverse false claim” provision also creates liability for persons who knowingly conceal an overpayment of government money or knowingly and improperly retain an overpayment of government funds. In addition, ACA requires providers to report and return overpayments and to explain the reason for the overpayment in writing within 60 days of the date on
14
Table of Contents
which the overpayment is identified, and the failure to do so is punishable under the FCA. Violations of the FCA may result in treble damages, significant monetary penalties, and other collateral consequences including, potentially, exclusion from participation in federally funded healthcare programs. The scope and implications of the FCA amendments have yet to be fully determined or adjudicated and as a result it is difficult to predict how future enforcement initiatives may impact our business.
In addition, under the Civil Monetary Penalty Act of 1981, the Department of Health and Human Services Office of Inspector General has the authority to impose administrative penalties and assessments against any person, including an organization or other entity, who knowingly presents, or causes to be presented, to a state or federal government employee or agent certain false or otherwise improper claims.
Stark Law and Similar State Laws. The Ethics in Patient Referrals Act, known as the Stark Law, prohibits certain types of referral arrangements between physicians and healthcare entities and thus potentially applies to our customers. Specifically, under the Stark Law, absent an applicable exception, a physician may not make a referral to an entity for the furnishing of designated health service, or DHS, for which payment may be made by the Medicare program if the physician or any immediate family member has a financial relationship with that entity. Further, an entity that furnishes DHS pursuant to a prohibited referral may not present or cause to be presented a claim or bill for such services to the Medicare program or to any other individual or entity. Violations of the statute can result in civil monetary penalties and/or exclusion from federal healthcare programs. Stark law violations also may give rise to a civil FCA action. Any such violations by, and penalties and exclusions imposed upon, our customers could adversely affect their financial condition and, in turn, could adversely affect our own financial condition.
Laws in many states similarly forbid billing based on referrals between individuals and/or entities that have various financial, ownership or other business relationships. These laws vary widely from state to state.
Laws Limiting Assignment of Reimbursement Claims
Various federal and state laws, including Medicare and Medicaid, forbid or limit assignments of claims for reimbursement from government funded programs. Some of these laws limit the manner in which business service companies may handle payments for such claims and prevent such companies from charging their provider customers on the basis of a percentage of collections or charges. We do not believe that the services we provide our customers result in an assignment of claims for the Medicare or Medicaid reimbursements for purposes of federal healthcare programs. Any determination to the contrary, however, could adversely affect our ability to be paid for the services we provide to our customers, require us to restructure the manner in which we are paid, or have further regulatory consequences.
Emergency Medical Treatment and Active Labor Act
The federal Emergency Medical Treatment and Active Labor Act, or EMTALA, was adopted by the U.S. Congress in response to reports of a widespread hospital emergency room practice of “patient dumping.” At the time of EMTALA’s enactment, patient dumping was considered to have occurred when a hospital capable of providing the needed care sent a patient to another facility or simply turned the patient away based on such patient’s inability to pay for his or her care. EMTALA imposes requirements as to the care that must be provided to anyone who seeks care at facilities providing emergency medical services. In addition, CMS of the U.S. Department of Health and Human Services has issued final regulations clarifying those areas within a hospital system that must provide emergency treatment, procedures to meet on-call requirements, as well as other requirements under EMTALA. Sanctions for failing to fulfill these requirements include exclusion from participation in the Medicare and Medicaid programs and civil monetary penalties. In addition, the law creates private civil remedies that enable an individual who suffers personal harm as a direct result of a violation of the law to sue the offending hospital for damages and equitable relief. A hospital that suffers a financial loss as a direct result of another participating hospital’s violation of the law also has a similar right.
15
Table of Contents
EMTALA generally applies to our customers, and we assist our customers with the intake of their patients. Although we believe that our customers’ medical screening, stabilization and transfer practices are in compliance with the law and applicable regulations, we cannot be certain that governmental officials responsible for enforcing the law or others will not assert that we or our customers are in violation of these laws nor what obligations may be imposed by regulations to be issued in the future.
Regulation of Debt Collection Activities
The federal Fair Debt Collection Practices Act, or FDCPA, regulates persons who regularly collect or attempt to collect, directly or indirectly, consumer debts owed or asserted to be owed to another person. Certain of our accounts receivable activities may be deemed to be subject to the FDCPA. The FDCPA establishes specific guidelines and procedures that debt collectors must follow in communicating with consumer debtors, including the time, place and manner of such communications. Further, it prohibits harassment or abuse by debt collectors, including the threat of violence or criminal prosecution, obscene language or repeated telephone calls made with the intent to abuse or harass. The FDCPA also places restrictions on communications with individuals other than consumer debtors in connection with the collection of any consumer debt and sets forth specific procedures to be followed when communicating with such third parties for purposes of obtaining location information about the consumer. In addition, the FDCPA contains various notice and disclosure requirements and prohibits unfair or misleading representations by debt collectors. Finally, the FDCPA imposes certain limitations on lawsuits to collect debts against consumers.
Debt collection activities are also regulated at the state level. Most states have laws regulating debt collection activities in ways that are similar to, and in some cases more stringent than, the FDCPA. In addition, some states require debt collection companies to be licensed. In all states where we operate, we believe that we currently hold all required state licenses or are exempt from licensing.
We are also subject to the Telephone Consumer Protection Act, or TCPA. In the process of communicating with our customers’ patients, we use a variety of communications methods. The TCPA places certain restrictions on companies that place telephone calls to consumers.
The FTC has the authority to investigate consumer complaints relating to the FDCPA and the TCPA, and to initiate or recommend enforcement actions, including actions to seek monetary penalties. State officials typically have authority to enforce corresponding state laws. In addition, affected consumers may bring suits, including class action suits, to seek monetary remedies (including statutory damages) for violations of the federal and state provisions discussed above.
Regulation of Credit Card Activities
We process, on behalf of our customers, credit card payments from their patients. Various federal and state laws impose privacy and information security laws and regulations with respect to the use of credit cards. If we fail to comply with these laws and regulations or experience a credit card security breach, our reputation could be damaged, possibly resulting in lost future business, and we could be subjected to additional legal or financial risk as a result of non-compliance.
Foreign Regulations
Our operations in India are subject to additional regulations that govern the creation, continuation and winding up of companies, as well as the relationships between the shareholders, the company, the public and the government.
16
Table of Contents
Intellectual Property
We rely upon a combination of patent, trademark, copyright and trade secret laws and contractual terms and conditions to protect our intellectual property rights, and have sought patent protection for aspects of our key innovations.
We have been issued three U.S. patents, which expire in 2028, 2030 and 2031, and have filed seven additional U.S. patent applications aimed at protecting the four domains of our AHtoAccess software suite: patient access, improving maximum potential reimbursement, follow-up and measurement. See “Business – Technology – Proprietary Software Suites” for more information. Legal standards relating to the validity, enforceability and scope of protection of patents can be uncertain. We do not know whether any of our pending patent applications will result in the issuance of patents or whether the examination process will require us to narrow our claims. Our patent applications may not result in the grant of patents with the scope of the claims that we seek, if at all, or the scope of the granted claims may not be sufficiently broad to protect our products and technology. Our three granted patents or any patents that may be granted in the future from pending or future applications may be opposed, contested, circumvented, designed around by a third party or found to be invalid or unenforceable. Third parties may develop technologies that are similar or superior to our proprietary technologies, duplicate or otherwise obtain and use our proprietary technologies or design around patents owned or licensed by us. If our technology is found to infringe any patent or other intellectual property right held by a third party, we could be prevented from providing our service offerings and/or subjected to significant damage awards.
We also rely, in some circumstances, on trade secrets to protect our technology. We control access to and the use of our application capabilities through a combination of internal and external controls, including contractual protections with employees, customers, contractors and business partners. We license some of our software through agreements that impose specific restrictions on our customers’ ability to use the software, such as prohibiting reverse engineering and limiting the use of copies. We also require employees and contractors to sign non-disclosure agreements and invention assignment agreements to give us ownership of intellectual property developed in the course of working for us.
On occasion, we incorporate third-party commercial or open source software products into our technology platform. Although we prefer to develop our own technology, we periodically employ third-party software in order to simplify our development and maintenance efforts, provide a “commodity” capability, support our own technology infrastructure or test a new capability.
Financial Information About Geographic Areas
All of our customers are entities organized and located within the United States. We do not derive any customer revenue from countries outside the United States.
Employees
As of November 30, 2014, we had approximately 2,830 full-time employees, as well as approximately 70 part-time employees. Of these employees, approximately 1,345 full-time and all part-time employees were located in the U.S., and approximately 1,485 full-time employees were located in India. Our employees are not represented by a labor union and we consider our current employee relations to be good.
As a services business, our employees’ skills and experience are significant assets. We expend significant effort searching for individuals with extensive experience in healthcare or revenue process management issues in complex industries. Our less experienced employees attend training sessions. In addition, all of our employees are required to undergo mandatory compliance training, including HIPAA compliance training.
17
Table of Contents
Corporate Information
We were incorporated in Delaware under the name Healthcare Services, Inc. in July 2003 and changed our name to Accretive Health, Inc. in August 2009. Our principal executive offices are located at 401 North Michigan Avenue, Suite 2700, Chicago, Illinois 60611, and our telephone number is (312) 324-7820.
Information Availability
Our Annual Reports on Form 10-K, Quarterly Reports on Form 10-Q, Current Reports on Form 8-K, and all amendments to those reports are available free of charge on our website at www.accretivehealth.com under the “Investor Relations” page as soon as reasonably practicable after such material is electronically filed with, or furnished to, the SEC. The content on any website referred to in this Annual Report on Form 10-K is not incorporated by reference into this report, unless expressly noted otherwise. Additionally, as announced on March 8, 2013, the audit committee of our board of directors determined that we would restate our consolidated financial statements for the years ended December 31, 2009, 2010 and 2011 and the quarterly periods within those years, and for the first three quarterly periods for the year ended December 31, 2012 and that our historical consolidated financial statements could not be relied upon due to questions surrounding the timing of our revenue recognition in accordance with generally accepted accounting principles in the United States of America, or GAAP. Accordingly, investors should not rely on our consolidated financial statements for the years ended December 31, 2009, 2010 and 2011 and the quarterly periods within those years, and for the first three quarterly periods for the year ended December 31, 2012 and any of our other prior financial statements, in each case as set forth in any of our Annual Reports on Form 10-K, Quarterly Reports on Form 10-Q, Current Reports on Form 8-K or any amendments to those reports filed prior to this Annual Report on Form 10-K.
| Item 1A. | Risk Factors |
Risks Related to Our Financial Reporting Processes
The Restatement of our consolidated financial statements has had, and could continue to have, a material adverse impact on us.
In connection with the Restatement, we incurred substantial unanticipated costs (primarily accounting related) of approximately $23.1 million in 2013 and approximately $44.7 million in the nine months ended September 30, 2014. In addition, we have incurred and will continue to incur in 2014 additional costs related to the Restatement and related internal control remediation. We have been required to expend significant time and resources in connection with the Restatement, and the attention of our management team has been diverted by these efforts. Because of the Restatement, and the delay in completing our financial statements for the years ended December 31, 2013 and December 31, 2012, we have been unable to timely file with the SEC the required periodic reports associated with these years and the required periodic reports for 2014. As a result of these events, we have become subject to significant risks and occurrences relating to the following matters, which are described in more detail below:
| • | possible adverse consequences of failure to file past SEC reports; |
| • | limitations on access to public debt and equity capital markets; |
| • | impacts of material weaknesses in internal control over financial reporting; |
| • | potential changes in tax liabilities; and |
| • | civil litigation. |
We have identified material weaknesses in our internal control over financial reporting which, if not corrected, could affect the reliability of our consolidated financial statements and have other adverse consequences.
Section 404 of the Sarbanes-Oxley Act and the related SEC rules require management of certain public companies to assess the effectiveness of their internal control over financial reporting annually and to include in Annual Reports on Form 10-K a management report on that assessment, together with an attestation report by an
18
Table of Contents
independent registered public accounting firm. Under Section 404 and the SEC rules, a company cannot conclude that its internal control over financial reporting is effective if there exist any material weaknesses in its financial controls. A material weakness is a deficiency, or combination of control deficiencies, in internal control over financial reporting, such that there is a reasonable possibility that a material misstatement of our annual or interim financial statements will not be prevented or detected on a timely basis.
We have identified material weaknesses in our internal control over financial reporting as of December 31, 2013. These material weaknesses are described in “Part II - Item 9A - Controls and Procedures” of this Annual Report on Form 10-K. We have taken and will continue to take actions to remediate the material weaknesses and improve the effectiveness of our internal control over financial reporting. We cannot, however, assure you that we will be able to correct these material weaknesses in a timely manner. Any failure in the effectiveness of internal control over financial reporting, particularly if it results in misstatements in our financial statements, could cause us to fail to meet our reporting obligations and could adversely affect investor perceptions of our company.
As a result of our Restatement, we face limitations in registering securities for a public offering, acquisitions or equity incentive plans, which could adversely affect our business.
As a result of the Restatement and our delayed filings, we are ineligible to use “short-form” registration statements that would allow us to incorporate by reference our SEC reports into our registration statements, or to use “shelf” registration statements until we have filed all of our periodic reports in a timely manner for a period of 12 months. This could increase the costs of selling securities publicly and could significantly delay such sales and adversely affect our business. This also has resulted in our inability to permit use of our registration statement on Form S-8, which we filed to register the issuance and sales of securities under our equity incentive plans, which could adversely affect our ability to grant awards to adequately incentivize and retain employees.
Risks Relating to our Business and Industry
We may not be able to achieve or maintain profitability.
We incurred net losses in 2012 and 2011. We expect to report additional quarterly and annual losses in future periods, in accordance with GAAP. We incurred significant expenses during 2013 and 2012 related to, among other things, legal defense, crisis management costs, and stranded personnel costs arising from the lawsuit filed in January 2012 by the Minnesota Attorney General that is described in “Part I – Item 3 – Legal Proceedings.” and that we settled in 2012. We incurred significant costs for restructuring our operations in 2013 and in connection with restating our financial statements. We have incurred, and are likely to continue to incur, additional significant costs for legal proceedings, the Restatement and restructuring activities in 2014. Further, we anticipate continuing to incur significant additional costs for technology to improve the quality and reliability of the processes used to secure patient health information. We intend to continue to increase our operating expenses associated with sales and marketing in future years in an effort to expand our business. If our revenue does not increase to offset these increases in costs, our operating results would be adversely affected. You should not consider our historical operating results as indicative of future operating results, and we cannot assure you that we will be able to achieve or maintain profitability in the future. Each of the risks described in this “Risk Factors” section, as well as other factors, may adversely affect our future operating results.
Litigation has materially adversely affected our business, financial condition, operating results and cash flows and caused unfavorable publicity and is likely to continue to do so.
We were named as a defendant in a lawsuit filed in January 2012 by the Minnesota Attorney General alleging violations of federal and Minnesota state health privacy laws and regulations, Minnesota debt collection laws and Minnesota consumer protection laws resulting from, among other things, the theft in Minnesota in 2011 of an employee’s laptop that contained PHI. In addition, in April 2012, the Attorney General released to the public a “Compliance Review” alleging, or raising questions about, our non-compliance with federal and Minnesota health privacy laws, the federal Fair Credit Reporting Act, EMTALA, federal and Minnesota debt
19
Table of Contents
collections laws and Minnesota consumer protection laws. All disputes with the Minnesota Attorney General (and related investigations by the Minnesota Department of Commerce and Minnesota Department of Human Services) were fully and finally resolved in a Settlement Agreement, Release, and Consent Order dated July 30, 2012, without any admission of liability or wrongdoing by us. There have been other inquiries related to these matters, including one by the FTC. On December 31, 2013, without any admission of liability or wrongdoing and without payment of any monetary penalty or fine, we entered into a Consent Order agreement with the FTC to resolve the FTC’s investigation. Pursuant to the Consent Order, we agreed, among other things, to maintain a comprehensive information security program reasonably designed to protect the security, confidentiality and integrity of personal information collected from or about consumers. A 30-day comment period related to the Consent Order expired on January 30, 2014 and the FTC gave final approval to the Consent Order on February 24, 2014. If we fail to maintain a comprehensive information security program, we may be subject to future inquiries or litigation.
The Minnesota-related legal matters and related inquiries led to several securities-related class action and derivative lawsuits. The securities-related class actions were settled within the limits of our insurance coverage while the derivative suits remain pending.
The Restatement has also led to litigation. A securities-related class action lawsuit has been filed and amended against us, a current director, and certain of our former officers in connection with the Restatement. The SEC’s Division of Enforcement in the Chicago Regional Office is also conducting an investigation regarding the circumstances surrounding the Restatement. In addition, one of the Minnesota-related derivative suits was amended to include claims regarding the Restatement. These lawsuits and investigation are described in “Part I – Item 3 – Legal Proceedings.” The lawsuit and investigation have resulted in, and may lead to additional, unfavorable publicity for us and may have a disruptive effect upon the operation of our business and consume the time and attention of our senior management.
In addition, we incurred substantial expenses in connection with these litigation matters, including substantial fees for attorneys. Although we maintain insurance that may provide coverage for some or all of these expenses, and we have given notice to our insurers of the claims, our insurers have responded by reserving their rights under the policies, including the rights to deny coverage under various policy exclusions. There is risk that the insurers will rescind the policies, that some or all of the claims will not be covered by such policies, or that, even if covered, our ultimate liability will exceed the available insurance.
We are unable to predict the outcome of pending legal actions. The ultimate resolution of the securities class action lawsuit related to the Restatement and the pending derivative suits related to the Minnesota-related matters and the Restatement could have a material adverse effect on our financial results, financial condition or liquidity, and on the trading price of our common stock.
The above matters and attendant publicity have resulted in widespread, unfavorable publicity for us and have materially adversely affected, and may continue to materially adversely affect, our business, financial condition, operating results and cash flows in various ways, including as follows:
| • | in 2012, we and Fairview Health Services, or Fairview, decided to amend the RCM agreement between us to transition the management of the revenue cycle operations to Fairview leadership, and we received a notice of termination from Fairview of the population health solutions agreement between us. In December 2013, following mediation, we reached a confidential agreement to resolve all of our differences with Fairview; |
| • | in 2012, in connection with the settlement of the Minnesota Attorney General lawsuit, as disclosed in “Part I – Item 3 – Legal Proceedings,” we voluntarily agreed to cease all remaining operations in Minnesota and have wound down our operations with our Minnesota customers; |
| • | other customers have terminated or may seek to terminate or modify their service agreements with us; |
20
Table of Contents
| • | we believe that potential new customers have been deterred from entering into service agreements with us, and the terms on which we are able to enter into new service agreements, or renew agreements with existing customers, in the future may be less favorable to us; |
| • | the time and attention of management has been diverted from our business; |
| • | we have encountered increased difficulty in attracting and retaining employees; |
| • | we have incurred, and will continue to incur, substantial legal and other expenses in defending the pending and settled lawsuits; and |
| • | the remaining pending lawsuits could subject us to significant liability or result in significant settlement payments. |
In addition, other governmental authorities could initiate inquiries into our business practices, and additional lawsuits may be filed against us. Additional litigation could result in the incurrence of substantial additional expense, subject us to significant liability or result in significant settlement payments, further divert management’s attention from our business, and thereby materially adversely affect our business, financial condition, operating results and cash flows.
Hospital systems affiliated with Ascension Health currently account for a significant portion of our net services revenue as well as our gross cash generated from contracting activities, and we have several other customers that have each accounted for 10% or more of our gross cash generated from contracting activities in past periods. The termination or expiration of our new master professional services agreement with Ascension Health, or any significant loss of business from our large customers, would have a material adverse effect on our business, results of operations and financial condition.
In August 2012, we entered into a new five-year master professional services agreement, or MPSA, with Ascension Health. Substantially all of the hospital systems affiliated with Ascension Health for which we previously conducted RCM operations have opted in to the MPSA by executing a new supplement agreement with us. Under our prior master services agreement with Ascension Health dated December 31, 2007, which we refer to as the Legacy Agreement, we continue to provide services to one hospital system and one physician group affiliated with Ascension Health that did not execute new supplement agreements with us. In addition we ceased providing services to one other customer under the Legacy Agreement in the second quarter of 2014, which customer did not execute a supplement agreement with us.
Hospital systems affiliated with Ascension Health have accounted for a significant portion of our net services revenue each year since our formation. In 2013, 2012 and 2011, net services revenue from hospitals affiliated with Ascension Health represented 73%, 5% and 6% of our total net services revenue, respectively, in such periods. Additionally, in 2013, 2012 and 2011, gross cash generated from customer contracting activities, as defined in Part I – Item 6 – Selected Consolidated Financial Data, with hospital systems affiliated with Ascension Health represented 42%, 47% and 50%, respectively, of our total gross cash generated from contracting activities in such periods. St. John Health (an affiliate of Ascension Health) individually accounted for 28%, 1% and 3% of our total net services revenue and 7%, 10% and 12% of our gross cash generated from contracting activities in 2013, 2012 and 2011. Additionally, in 2013, Borgess Health (another affiliate of Ascension Health) individually accounted for 12% of our total net services revenue and 5% of our gross cash generated from contracting activities.
In light of the fact that we only recognize revenues for our RCM services upon the expiration or termination of the underlying RCM customer contract, or upon other defined events in accordance with our revenue recognition policies, we believe that gross cash generated from contracting activities is a more meaningful measure of our significant customers in any given period than their respective contributions to consolidated revenue during such period. Our revenue recognition policies can result in cash flow accumulations from RCM activities over three to five years prior to a revenue recognition event, and consolidated net revenues that are
21
Table of Contents
inconsistent with the cash flows from the same underlying operations. We do not believe that the loss of any of our other customers that accounted for greater than ten percent of our consolidated revenues in 2011, 2012 or 2013 would have a material adverse effect on our operations or financial results. Any of our other customers, including hospital systems affiliated with Ascension Health, can elect not to renew their managed services agreements with us upon expiration. We intend to seek renewal of all managed service agreements with our customers, but cannot assure you that any of them will be renewed or that the terms upon which they may be renewed will be as favorable to us as the terms of the initial managed services agreements. The termination of our New Ascension Health Agreement, the loss of any of our other large customers or their failure to renew their managed services agreements with us upon expiration, or a reduction in the fees for our services for these customers could have a material adverse effect on our business, results of operations and financial condition.
The early termination of certain customer agreements, including certain customer agreement terminations in connection with the Minnesota-related legal matters described above, during 2013 and 2012 has adversely affected our financial results.
In 2012, we and Fairview decided to amend the revenue cycle operations agreement between us to transition the management of those operations to Fairview leadership and we received from Fairview a notice of termination of the population health solutions agreement between us. Fairview accounted for 8%, 5% and 6% of our net services revenue in 2013, 2012 and 2011, respectively, and for, 8%, 2% and 8% of our gross cash received from contracting activities in 2013, 2012 and 2011, respectively. In connection with the settlement of the Minnesota Attorney General lawsuit as described in “Part I – Item 3 – Legal Proceedings,” we agreed to voluntarily cease all remaining operations in Minnesota and wound down our operations with one of our Minnesota based physician advisory services customers and our two Minnesota based revenue cycle customers, one of which, Fairview, was also a population health solutions customer. In addition, during 2013 and 2012, we reached settlement agreements with two other customers which provided for early terminations of those customers’ agreements.
The loss of the customer agreements noted above adversely affected our operating results in 2013 and 2012 and will negatively impact our revenues and operating results through 2016 when the initial term under the last of these customer agreements would have reached its normal expiration.
If we are unable to retain our existing customers or acquire new customers, our financial condition will suffer.
Our success depends in part upon the retention of our customers, particularly Ascension Health and its affiliated hospitals, and our ability to acquire new customers. We derive our net services revenue primarily from managed services agreements pursuant to which we receive performance-based fees. Customers can elect not to renew their managed services agreements with us upon expiration. If a managed services agreement is not renewed for any reason, we would not derive the financial benefits that we would expect to derive by serving that customer beyond the initial term of our managed services agreement. If a managed services agreement is terminated for any reason, including for example, if we are found to be in violation of certain federal or state laws or excluded from participating in federal and state healthcare programs such as Medicare and Medicaid, we will not receive the payments we would have otherwise anticipated receiving over the life of the agreement.
Some of our managed services agreements require us to adhere to extensive, complex data security, network access and other institutional procedures and requirements of our customers, and we cannot guaranty that some of our customers will not allege that we have not complied with all such procedures and requirements. If we breach a managed services agreement or, for certain of our managed services agreements, fail to perform in accordance with contractual service levels, we may be liable to the customer for damages, and either we or the customer may generally terminate an agreement for a material uncured breach by the other. Any of these events could adversely affect our business, financial condition, operating results and cash flows.
22
Table of Contents
Ascension Health and another healthcare organization with multiple affiliates that contract with us individually under a master services agreement can also terminate their agreements with us if the receipt of services under the agreement causes or will cause a material negative impact to the customer’s brand, reputation or operations, in such customer’s good faith estimation, because of the manner in which we provided services for it or any other customer. In addition, financial issues or other changes in customer circumstances, such as a customer change in control (including as a result of increasing consolidation within the healthcare provider industry), may cause us or the customer to seek to modify or terminate a managed services agreement. Increasing consolidation within the healthcare provider industry may also make it more difficult for us to acquire new customers, as consolidated healthcare systems may be more likely to have incumbent revenue cycle management providers or significant internal revenue cycle capabilities. For example, certain of our smaller customers have been acquired by larger healthcare systems and ceased to be customers.
In 2014, two of our customers provided us with notices of termination of their respective RCM agreements with us, in accordance with the terms of those agreements. As a result of those notices, one such agreement terminated in the second quarter of 2014 and the other terminated in the third quarter of 2014. However, one of those customers entered into a new managed services agreement with us to provide revenue cycle services under new terms following the termination of its existing agreement.
Also in 2014, our RCM agreement with another customer expired, although we currently continue to provide certain services to that customer under the RCM agreement in connection with the resolution of specified third-party payer accounts receivable in exchange for a fixed fee. We also entered into a new master services agreement with that customer pursuant to which we are providing certain specified RCM services.
Our agreements with certain customers require us to offer to such customer service fees that are at least as low as the fees we charge any other customer receiving comparable services at comparable or lower volumes.
Our MPSA with Ascension Health requires us to offer to Ascension Health’s affiliated hospital systems fees for our services that are at least as low as the fees we charge any other customer receiving comparable services at lower volumes. If we were to charge lower service fees to any other customer receiving comparable services at lower volumes, we would be obligated to charge such lower fees to the hospital systems affiliated with Ascension Health effective as of the date such lower charges were first implemented for such other customer. Additionally, our RCM agreement with another customer requires us to provide that customer with a gain sharing incentive rate that is as low as the rate provided to any new customer. If we offer customers lower rates than as discussed above, it could have a material adverse effect on our results of operations and financial condition.
Our agreements with hospital systems affiliated with Ascension Health and with some other customers include provisions that could impede or delay our ability to enter into managed services agreements with new customers.
Under the terms of our agreement with Ascension Health, we cannot begin to negotiate the provision of services to certain designated competitors that are in close proximity to a hospital affiliated with Ascension Health that has executed a supplement agreement with us until we have informed and discussed the situation with such Ascension Health affiliate. In addition, our managed services agreement with one customer not affiliated with Ascension Health requires us to consult with such customer before providing services to competitors specified by such customer. The obligations described above could impede or delay our ability to enter into managed services agreements with new customers.
23
Table of Contents
The markets for our RCM service offering may develop more slowly than we expect and some potential customers for our services have been and may in the future be deterred by the lawsuit initiated against us by the Minnesota Attorney General, the Restatement, and legal proceedings resulting from these challenges, and because they previously have made or in the future will make investments in internally developed solutions and choose to continue to rely on their own internal resources, which could adversely affect our revenue and our ability to achieve or maintain our profitability.
Our success depends, in part, on the willingness of hospitals, physicians and other healthcare providers to implement integrated solutions for the areas in which we provide services. Some hospitals may be reluctant or unwilling to implement our solutions for a number of reasons, including failure to perceive the need for improved revenue cycle operations or lack of knowledge about the potential benefits our solutions provide. In addition, some potential customers for our services may be deterred by the lawsuit initiated against us by the Minnesota Attorney General that we settled in 2012, or the Restatement, and the resulting related legal proceedings.
Even if potential customers recognize the need to improve revenue cycle operations, they may not select solutions such as ours because they previously have made or in the future will make investments in internally developed solutions and choose to continue to rely on their own internal resources. As a result, the markets for integrated, end-to-end revenue cycle management services may develop more slowly than we expect, which could adversely affect our revenue and operating results.
Our business operations currently include the collection, on behalf of our customers, of medical co-pays and other payments that are due to our customers from their patients. This business practice has been perceived negatively by the public and this negative perception has adversely affected (and may continue to adversely affect) our business, results of operations and financial condition.
We currently collect, on behalf of our customers, medical co-pays and other non-defaulted payments that are due to our customers from their patients, pursuant to managed services agreements with our customers. Collection of these payments from patients may become a more significant part of our RCM services as industry trends continue to increase patient responsibility as a percentage of total compensation to healthcare providers. This business practice, which has received widespread, unfavorable publicity as a result of the lawsuit initiated against us by the Minnesota Attorney General that we settled in 2012 and resulting related legal proceedings, has been negatively perceived by the public and has led us to change aspects of our business practices, made it more difficult to retain existing customers and attract new customers, extended the time it takes to enter into service agreements with new customers, and resulted in a material adverse effect on our business, results of operations and financial condition, and it may continue to do so.
We operate in a highly competitive industry, and our current or future competitors may be able to compete more effectively than we do, which could have a material adverse effect on our business, revenue, growth rates and market share.
The market for our solutions is highly competitive and we expect competition to intensify in the future. The rapid changes in the U.S. healthcare market due to financial pressures to reduce the growth in healthcare costs and from regulatory and legislative initiatives such as the ACA are increasing the level of competition. We face competition from a steady stream of new entrants, including the internal RCM staff of hospitals, as described above, and external participants. External participants that are our competitors in the revenue cycle market include software vendors and other technology-supported RCM business process outsourcing companies; traditional consultants; and information technology outsourcers. These types of external participants also compete with us in the field of population health solutions and physician advisory services (which services are being integrated into our RCM service offering). Our competitors may be able to respond more quickly and effectively than we can to new or changing opportunities, technologies, standards, regulations or customer requirements. We may not be able to compete successfully with these companies, and these or other competitors may introduce technologies or services that render our technologies or services obsolete or less marketable. Even if our technologies and services are more effective than the offerings of our competitors, current or potential
24
Table of Contents
customers might prefer competitive technologies or services to our technologies and services. Increased competition is likely to result in pricing pressures, which could adversely affect our margins, growth rate or market share.
We face a selling cycle of variable length to secure new RCM agreements, making it difficult to predict the timing of specific new customer relationships.
We face a selling cycle of variable length, typically spanning six to 18 months or longer, to secure a new managed services agreement. Even if we succeed in developing a relationship with a potential new customer, we may not be successful in entering into a managed services agreement with that customer. In addition, we cannot accurately predict the timing of entering into managed services agreements with new customers due to the complex procurement decision processes of most healthcare providers, which often involves high-level or committee approvals. Consequently, we have only a limited ability to predict the timing of specific new customer relationships. Moreover, we believe that the unfavorable publicity we received as a result of the lawsuit initiated against us by the Minnesota Attorney General that we settled in 2012, the Restatement, and the resulting related legal proceedings have reduced our attractiveness to some potential healthcare providers and consequently, have resulted in the lengthening of the selling cycle with potential new customers.
Delayed or unsuccessful implementation of our technologies or services with our customers or implementation costs that exceed our expectations may harm our financial results.
To implement our solutions, we work with our customer’s existing vendors, management and staff and layer our proprietary technology applications on top of the customer’s existing patient accounting and clinical systems. Each customer’s situation is different, and unanticipated difficulties and delays may arise such as delays in, or the inability to, obtain approvals or access rights from our customers’ vendors. If the implementation process is not executed successfully or is delayed, our relationship with the customer may be adversely affected and our results of operations could suffer. Implementation of our solutions also requires us to integrate our own employees into the customer’s operations. The customer’s circumstances may require us to devote a larger number of our employees than anticipated, which could increase our costs and harm our financial results.
Our quarterly results of operations and cash flows fluctuate as a result of many factors, some of which may be outside of our control.
Our revenues fluctuate and will continue to fluctuate widely from quarter to quarter based on revenue recognition criteria under GAAP.
In addition, the timing of any new customer additions is not likely to be uniform throughout the year, which can also cause fluctuations in our quarterly results. Operating costs are typically higher in quarters in which we add new customers because we incur expenses to implement our operating model at those customers. Further, fees billable to customers under many of our managed services agreements experience fluctuations as they are tied contractually to the level of our customers’ cash receipts. Fees have a significant effect on our cash flows, and changes in the amount of fees can cause significant fluctuations in our quarter-to-quarter operating cash flows. Our cash flows can also be impacted by the timing of operating costs.
Our restructuring activities may negatively impact our operations.
In the second quarter of 2013, we commenced a series of measures designed to better align our operational structure and to improve efficiency. As part of these measures, we recorded approximately $5.2 million of restructuring costs in 2013, consisting primarily of employee separation costs. In the first quarter of 2014, we commenced additional restructuring actions in order to allow us to more effectively and efficiently allocate necessary resources for innovation, invest in growth and enhance customer service, which included reductions in our workforce in certain corporate, administrative and management functions and the relocation of certain corporate functions from our headquarters in Chicago, Illinois. Additionally, in the fourth quarter of 2014, we commenced
25
Table of Contents
further restructuring actions in order to align our organizational structure and resources to better support our primary business of revenue cycle management. As part of these actions, we expect to record approximately $5.3 million to $5.8 million in severance and employee benefits related expenses and $2.3 million to $2.8 million in facilities-related expenses in 2014. Reductions in personnel may adversely affect or delay various sales, marketing and product development programs and activities and could have negative effects on our internal control over financial reporting. These restructuring activities could be disruptive to our business and have a material adverse effect on our financial results.
If we lose key personnel or if we are unable to attract, hire, integrate and retain our key personnel and other necessary employees, our business could be harmed.
Our future success depends in part on our ability to attract, hire, integrate and retain key personnel. Our future success also depends in part on the continued contributions of our executive officers and other key personnel, each of whom may be difficult to replace. The loss of services of any of our executive officers or key personnel, or the inability to continue to attract qualified personnel could have a material adverse effect on our business, particularly as a result of our recent and ongoing restructuring activities. Competition for the caliber and number of employees we require is intense. We may face difficulty identifying and hiring qualified personnel at compensation levels consistent with our existing compensation and salary structure. In addition, we invest significant time and expense in training each of our employees, which increases their value to competitors who may seek to recruit them. If we fail to retain our employees, we could incur significant expenses in hiring, integrating and training their replacements, and the quality of our services and our ability to serve our customers could diminish, resulting in a material adverse effect on our business.
The imposition of legal responsibility for obligations related to our employees or our customers’ employees could adversely affect our business and subject us to liability.
Under our agreements with customers, we work with our customers’ employees engaged in the activities included in the scope of our services. Our managed services agreements establish the division of responsibilities between us and our customers for various personnel management matters, including compliance with and liability under various employment laws and regulations. We could, nevertheless, be found to have liability with our customers for actions against or by employees of our customers, including under various employment laws and regulations, such as those relating to discrimination, retaliation, wage and hour matters, occupational safety and health, family and medical leave, notice of facility closings and layoffs and labor relations, as well as similar liability with respect to our own employees, and any such liability could result in a material adverse effect on our business.
If we fail to manage our operations effectively, our business would be harmed.
We have not always been fully successful in managing the expansion of our operations which has led, at times to some customer dissatisfaction and weaknesses in our operating, internal and financial controls. To manage potential future growth, we will need to hire, integrate and retain highly skilled and motivated employees, and will need to work effectively with a growing number of customer employees engaged in revenue cycle operations. We will also need to continue to improve our financial, internal and management controls, reporting systems and procedures. If we do not effectively manage our operations, we may not be able to execute on our business plan, respond to competitive pressures, take advantage of market opportunities, satisfy customer requirements or maintain high-quality service offerings.
Disruptions in service or damage to our shared services centers and third-party operated data centers could adversely affect our business.
Our shared services centers and third-party operated data centers are essential to our business. Our operations depend on our ability to operate our shared services centers, and to maintain and protect our
26
Table of Contents
applications, which are located in data centers that are operated for us by third parties. We cannot control or assure the continued or uninterrupted availability of these third-party data centers. In addition, our information technologies and systems, as well as our data centers and shared services centers, are vulnerable to damage or interruption from various causes, including (1) acts of God and other natural disasters, war and acts of terrorism and (2) power losses, computer systems failures, internet and telecommunications or data network failures, operator error, losses of and corruption of data and similar events. We have a business continuity plan and maintain insurance against fires, floods, other natural disasters and general business interruptions to mitigate the adverse effects of a disruption, relocation or change in operating environment at one of our data centers or shared services centers, but the situations we plan for and the amount of insurance coverage we maintain may not be adequate in every particular case. In addition, the occurrence of any of these events could result in interruptions, delays or cessations in service to our customers, or in interruptions, delays or cessations in the direct connections we establish between our customers and third-party payers. Any of these events could impair or inhibit our ability to provide our services, reduce the attractiveness of our services to current or potential customers and adversely affect our financial condition and results of operations.
In addition, despite the implementation of security measures, our infrastructure, data centers, shared services centers or systems that we interface with, including the internet and related systems, may be vulnerable to physical break-ins, hackers, improper employee or contractor access, computer viruses, programming errors, denial-of-service attacks or other attacks by third parties seeking to disrupt operations or misappropriate information or similar physical or electronic breaches of security. Any of these can cause system failure, including network, software or hardware failure, which can result in service disruptions. As a result, we may be required to expend significant capital and other resources to protect against security breaches and hackers or to alleviate problems caused by such breaches.
If our security measures are breached or fail and unauthorized access is obtained to a customer’s data, our service may be perceived as not being secure, the attractiveness of our services to current or potential customers may be reduced, and we may incur significant liabilities.
Our services involve the storage and transmission of customers’ proprietary information and protected health, financial, payment and other personal information of patients. We rely on proprietary and commercially available systems, software, tools and monitoring, as well as other processes, to provide security for processing, transmission and storage of such information, and because of the sensitivity of this information, the effectiveness of such security efforts is very important. The systems currently used for transmission and approval of credit card transactions, and the technology utilized in credit cards themselves, all of which can put credit card data at risk, are determined and controlled by the payment card industry, not by us. If our security measures are breached or fail as a result of third-party action, employee error, malfeasance or otherwise, someone may be able to obtain unauthorized access to customer or patient data. Improper activities by third parties, advances in computer and software capabilities and encryption technology, new tools and discoveries and other events or developments may facilitate or result in a compromise or breach of our computer systems. Techniques used to obtain unauthorized access or to sabotage systems change frequently and generally are not recognized until launched against a target, and we may be unable to anticipate these techniques or to implement adequate preventive measures. Our security measures may not be effective in preventing these types of activities, and the security measures of our third-party data centers and service providers may not be adequate. If a breach of our security occurs, we could face damages for contract breach, penalties for violation of applicable laws or regulations, possible lawsuits by individuals affected by the breach and significant remediation costs and efforts to prevent future occurrences. In addition, whether there is an actual or a perceived breach of our security, the market perception of the effectiveness of our security measures could be harmed and we could lose current or potential customers.
27
Table of Contents
We may be liable to our customers or third parties if we make errors in providing our services, and our anticipated net services revenue may be lower if we provide poor service.
The services we offer are complex, and we make errors from time to time. Errors can result from the interface of our proprietary technology applications and a customer’s existing technologies or we may make human errors in any aspect of our service offerings. The costs incurred in correcting any material errors may be substantial and could adversely affect our operating results. Our customers, or third parties such as our customers’ patients, may assert claims against us alleging that they suffered damages due to our errors, and such claims could subject us to significant legal defense costs in excess of our existing insurance coverage and adverse publicity regardless of the merits or eventual outcome of such claims. In addition, if we provide poor service to a customer and the customer therefore realizes less improvement in revenue yield, the incentive fee payments to us from that customer will be lower than anticipated.
We offer our services in many jurisdictions and, therefore, may be subject to federal, state and local taxes that could harm our business or that we may have inadvertently failed to pay.
We may lose sales or incur significant costs should various tax jurisdictions be successful in imposing taxes on a broader range of services. Imposition of such taxes on our services could result in substantial unplanned costs, would effectively increase the cost of such services to our customers and may adversely affect our ability to retain existing customers or to gain new customers in the areas in which such taxes are imposed.
Our growing operations in India expose us to risks that could have a material adverse effect on our costs of operations.
We employ a significant number of persons in India and expect to continue to add personnel in India. While there are cost and service advantages to operating in India, significant growth in the technology sector in India has increased competition to attract and retain skilled employees and has led to a commensurate increase in compensation expense. In the future, we may not be able to hire and retain such personnel at compensation levels consistent with our existing compensation and salary structure in India. In addition, our reliance on a workforce in India exposes us to disruptions in the business, political and economic environment in that region. Maintenance of a stable political environment is important to our operations, and terrorist attacks and acts of violence or war may directly affect our physical facilities and workforce or contribute to general instability. Our operations in India require us to comply with local laws and regulatory requirements, which are complex and of which we may not always be aware, and expose us to foreign currency exchange rate risk. Our Indian operations may also subject us to trade restrictions, reduced or inadequate protection for intellectual property rights, security breaches and other factors that may adversely affect our business. Negative developments in any of these areas could increase our costs of operations or otherwise harm our business.
Negative public perception in the United States regarding offshore outsourcing and proposed legislation may increase the cost of delivering our services.
Offshore outsourcing is a politically sensitive topic in the United States. For example, various organizations and public figures in the United States have expressed concern about a perceived association between offshore outsourcing providers and the loss of jobs in the United States. In addition, there has been recent publicity about the negative experience of certain companies that use offshore outsourcing, particularly in India. Current or prospective customers may elect to perform such services themselves or may be discouraged from transferring these services from onshore to offshore providers to avoid negative perceptions that may be associated with using an offshore provider. Any slowdown or reversal of existing industry trends towards offshore outsourcing would increase the cost of delivering our services if we had to relocate aspects of our services from India to the United States where operating costs are higher.
Legislation in the United States may be enacted that is intended to discourage or restrict offshore outsourcing. In the United States, federal and state legislation has been proposed, and enacted in several states, that could restrict or discourage U.S. companies from outsourcing their services to companies outside the
28
Table of Contents
United States. It is possible that legislation could be adopted that would restrict U.S. private sector companies that have federal or state government contracts, or that receive government funding or reimbursement, such as Medicare or Medicaid payments, from outsourcing their services to offshore service providers. Any changes to existing laws or the enactment of new legislation restricting offshore outsourcing in the United States may adversely affect our ability to do business, particularly if these changes are widespread, and could have a material adverse effect on our business, results of operations, financial condition and cash flows.
Regulatory Risks
The healthcare industry is heavily regulated. Our failure to comply with regulatory requirements could create liability for us, result in adverse publicity and adversely affect our business.
The healthcare industry is heavily regulated and is subject to changing political, legislative, regulatory and other influences. Many healthcare laws are complex, and their application to specific services and relationships may not be clear. In particular, many existing healthcare laws and regulations, when enacted, did not anticipate the services that we provide. There can be no assurance that our operations will not be challenged or adversely affected by enforcement initiatives. Enforcement activity is growing and is an identified priority of federal and state governments. Our failure to accurately anticipate the application of these laws and regulations to our business, or any other failure to comply with regulatory requirements, could create liability for us, result in adverse publicity and adversely affect our business. Federal and state legislatures and agencies frequently consider proposals to revise laws that impact the healthcare industry or to revise or create additional statutory and regulatory requirements. Such proposals, if implemented, could adversely affect our operations, the attractiveness of our services to existing customers and our ability to market new services, or could create unexpected liabilities for us. We are unable to predict what changes to laws or regulations might be made in the future or how those changes could affect our business or our operating costs.
Developments in the healthcare industry, including national healthcare reform, could adversely affect our business.
The healthcare industry has changed significantly in recent years and we expect that significant changes will continue to occur. The timing and impact of developments in the healthcare industry are difficult to predict. We cannot be sure that the markets for our services will continue to exist at current levels or that we will have adequate technical, financial and marketing resources to react to changes in those markets. Many of the provisions of the ACA, which was enacted in 2010, first became effective in 2014. Therefore, it is not yet possible for us to accurately predict if, or how, these changes will impact our ability to develop increases in revenue yield for our customers, encourage more companies to enter our market, provide advantages to our competitors and result in the development of solutions that compete with ours. Moreover, healthcare reform remains a major policy issue at the federal level, and amendments to or the repeal of the existing legislation and additional healthcare legislation in the future could have adverse consequences for us or the customers we serve. Other material changes, such as the required transition by October 1, 2015 to ICD-10 will impose significant system and business changes throughout the healthcare industry, and could be disruptive to our customers and our business. Such disruption could result in, among other things, the imposition of significant new challenges to our ability to achieve performance targets specified under our customer contracts, as well as a need for us to redeploy resources or to obtain new resources in an effort to meet such challenges, all of which could adversely affect our business or our results of operations. Additionally, several reductions or changes to Medicare reimbursement have been enacted recently or will be implemented (such as the federal government sequestration reductions), which reductions and changes could reduce the amounts received by our customers and may have an adverse indirect effect on our business.
In addition, one aspect of the 2014 Medicare hospital inpatient prospective payment system final rule, or the Two- Midnight Rule, generally permits hospitals to classify Medicare patients as inpatients for billing purposes only if a physician documents a reasonable expectation that the patient will require inpatient hospital care for a continuous duration that covers two midnights. Congress has also extended a moratorium on Recovery Auditor
29
Table of Contents
Contractor, or RAC, audits of these billing classification decisions until March 2015. Many of our current and potential PAS customers believe that the combination of the Two-Midnight Rule and the congressional moratorium on RAC audits significantly simplifies many billing classification decisions and reduces risk associated with those decisions. As a result, the demand for our PAS offerings has declined substantially. Further, with CMS’ one time offer to pay out 68% on certain categories of pending appeals by providers, demand for PAS appeals services may continue to decline significantly.
Healthcare reform also is causing the transition of some payment methods and provider reimbursement from volume-based reimbursement to value-based reimbursement models, which can include risk-sharing, accountable care organizations, capitation, bundled payment and other innovative approaches. While such new reimbursement models may provide us with opportunities to provide new or additional services to our customers (e.g., our value based reimbursement capabilities within our RCM services offering) and to participate in incentive based payment arrangements for our services, there can be no assurance that such new models and approaches will prove to be profitable to our customers or to us. Further, such new models and approaches may require investment by us to develop technology or expertise to offer necessary and appropriate services or support to our customers, and the amount of such investment and the timing for return of such investment are not fully known at this time due to the uncertainties of healthcare reform and payment and reimbursement model transitions that are occurring. Certain new care delivery and reimbursement models are being offered as pilot programs or as limited or transitional programs, and there is no assurance that such programs will continue or be renewed. Any of these models and approaches, and changes generally in the healthcare industry, can impact the relationships between our customers and third-party payers, from which our customers derive revenue and with which revenue our customers pay for our services. Adoption of such new models and approaches may require compliance with a range of federal and state laws relating to fraud and abuse, insurance, reinsurance and managed care regulation, billing and collection, corporate practice of medicine restrictions and licensing, among others. Many states in which these new value-based structures are being developed lack regulatory guidance or a well-developed body of law for these new models and approaches, or may not have updated their laws or enacted legislation yet to reflect the new healthcare reform models. As a result, although we have structured, and will attempt to structure and conduct, our operations in accordance with our interpretation of current laws and regulations, new laws, regulations or guidance could have a material adverse effect on our current and future operations and could subject us to the risk of restructuring or terminating our customer agreements and arrangements, as well as the risk of regulatory enforcement, penalties and sanctions, if state enforcement agencies disagree with our interpretation of state laws.
If we violate HIPAA, the HITECH Act or state health information privacy laws, we may incur significant liabilities, and any such violations could make it more difficult to retain existing customers or attract new customers, extend the time it takes to enter into service agreements with new customers, and result in a material adverse effect on our business, results of operations and financial condition.
HIPAA contains substantial restrictions and requirements with respect to the use and disclosure of individuals’ PHI. Under HIPAA, covered entities, including health plans, healthcare providers, and healthcare clearinghouses that conduct HIPAA-defined standard electronic transactions, are restricted in how they use and disclose PHI and must establish administrative, physical and technical safeguards to protect the confidentiality, integrity and availability of electronic PHI maintained or transmitted by them or by others on their behalf. Most of our customers are covered entities and we are a business associate to many of those customers under HIPAA as a result of our contractual obligations to perform certain functions on behalf of, and to provide certain services to, those customers. As a business associate, we sometimes also act as a clearinghouse in performing certain functions for our customers. In addition, the Minnesota Attorney General’s lawsuit, which we settled in 2012, alleged that we are a “healthcare provider” as defined in HIPAA. Although we believe that we are not a healthcare provider, if we were found to be a healthcare provider, we could have liability under the provisions of HIPAA that apply to providers as well as under state health information privacy and licensing laws. Our use and disclosure of PHI is restricted by HIPAA and the business associate agreements we are required to enter into with our covered entity customers.
30
Table of Contents
In 2009, HIPAA was amended by the HITECH Act to impose certain of the HIPAA privacy and security requirements directly upon business associates of covered entities and increase significantly the monetary penalties for violations of HIPAA. The HITECH Act also requires business associates to notify covered entities, who in turn must notify affected individuals and government authorities, of data security breaches involving unsecured PHI. Since the passage of the HITECH Act, enforcement of HIPAA violations has increased, as indicated by the announcement of a number of significant settlement agreements and/or sanctions by federal authorities, the pursuit of HIPAA violations by state attorneys general, and the roll-out of a new federal audit program for covered entities (which will in the future be extended to business associates).
In addition to HIPAA, most states have enacted patient confidentiality laws that protect against the unauthorized disclosure of confidential medical information, and many states have adopted or are considering further legislation in this area, including privacy safeguards, security standards and data security breach notification requirements. Such state laws, if more stringent than HIPAA, are not preempted by the federal requirements, and we must comply with them even though such state laws may be subject to different interpretations by various courts and other governmental authorities.
We have implemented and maintain physical, technical and administrative safeguards intended to protect all personal data and have processes in place to assist us in complying with applicable laws and regulations regarding the protection of this data and properly responding to any security incidents or breaches. We voluntarily sought, and received, HITRUST certification to help ensure compliance. A knowing breach of HIPAA’s requirements could expose us to criminal liability. A breach of our safeguards and processes that is not due to reasonable cause or involves willful neglect could expose us to significant civil penalties and the possibility of civil litigation under HIPAA and applicable state law. In 2011, a laptop computer used by one of our employees that contained PHI for patients of two customers was stolen. The laptop was password-protected but was not encrypted, in violation of company policy. We notified both customers of the 2011 theft, which customers in turn notified the affected individuals as well as the appropriate regulators. The Minnesota Attorney General subsequently initiated a lawsuit against us, which we settled in 2012, for, among other things, alleged violations of federal and Minnesota state health privacy laws and regulations arising from the laptop theft. Laptop computers used by our employees that contained PHI have also been stolen on other occasions. We do not believe that any patient data has been compromised as a result of any of these thefts. Nonetheless, these incidents have made it more difficult to retain existing customers and attract new customers. They have also extended the time it takes to enter into service agreements with new customers, and could result in a material adverse effect on our business, results of operations and financial condition.
If we fail to comply with federal and state laws governing submission of false or fraudulent claims to government healthcare programs and financial relationships among healthcare providers, we may be subject to civil and criminal penalties or loss of eligibility to participate in government healthcare programs.
A number of federal and state laws, including anti-kickback restrictions and laws prohibiting the submission of false or fraudulent claims, apply to healthcare providers, physicians and others that make, offer, seek or receive payments or split fees for referrals of products or services that may be paid for through any federal or state healthcare program and, in some instances, any private program. These laws are complex and their application to our specific services and relationships may not be clear and may be applied to our business in ways that we do not anticipate. Federal and state regulatory and law enforcement authorities have recently increased enforcement activities with respect to Medicare and Medicaid fraud and abuse regulations and other healthcare reimbursement laws and rules. From time to time, participants in the healthcare industry receive inquiries or subpoenas to produce documents in connection with government investigations. We could be required to expend significant time and resources to comply with these requests, and the attention of our management team could be diverted by these efforts. Furthermore, if we are found to be in violation of any federal or state fraud and abuse laws, we could be subject to civil and criminal penalties, forced to restructure our business and excluded from participating in federal and state healthcare programs such as Medicare and Medicaid which would result in significant harm to our business and financial condition.
31
Table of Contents
The federal healthcare anti-kickback law prohibits any person or entity from offering, paying, soliciting or receiving anything of value, directly or indirectly, for the referral of patients covered by Medicare, Medicaid and other federal healthcare programs or the leasing, purchasing, ordering or arranging for or recommending the lease, purchase or order of any item, good, facility or service covered by these programs. Many states have adopted similar prohibitions against kickbacks and other practices that are intended to induce referrals, and some of these state laws are applicable to all patients regardless of whether the patient is covered under a governmental health program or private health plan. New payment structures, such as accountable care organizations and other arrangements involving combinations of hospitals, physicians and other providers who share payment savings, potentially implicate anti-kickback and other fraud and abuse laws. We seek to structure our business relationships and activities to avoid any activity that could be construed to implicate the federal healthcare anti-kickback law and similar laws. We cannot assure you, however, that our arrangements and activities will be deemed outside the scope of these laws or that increased enforcement activities will not directly or indirectly have a material adverse effect on our business, financial condition or results of operations. Any determination by a federal or state agency or court that we have violated any of these laws could subject us to civil or criminal penalties, could require us to change or terminate some portions of our operations or business, could disqualify us from providing services to healthcare providers doing business with government programs, could give our customers the right to terminate our managed services agreements with them and, thus, could have a material adverse effect on our business and results of operations. Moreover, any violations by, and resulting penalties or exclusions imposed upon, our customers could adversely affect their financial condition and, in turn, have a material adverse effect on our business and results of operations.
There are also numerous federal and state laws that forbid submission of false information or the failure to disclose information in connection with the submission and payment of healthcare provider claims for reimbursement. In particular, the federal FCA, prohibits a person from knowingly presenting or causing to be presented a false or fraudulent claim for payment or approval by an officer, employee or agent of the United States. In addition, the FCA prohibits a person from knowingly making, using, or causing to be made or used a false record or statement material to such a claim. The FCA may be enforced by the government or by private whistleblowers under the “qui tam” provisions of the statute. Whistleblowers are entitled to a share of any recovery in a FCA case. Changes to the FCA enacted as part of the ACA make it easier for whistleblowers to bring FCA claims. Violations of the FCA may result in treble damages, significant monetary penalties, and other collateral consequences including, potentially, exclusion from participation in federally funded healthcare programs. The scope and implications of the amendments to the FCA pursuant to the FERA have yet to be fully determined or adjudicated and as a result it is difficult to predict how future enforcement initiatives may affect our business.
These laws and regulations may change rapidly, and it is frequently unclear how they apply to our business. Errors created by our proprietary applications or services that relate to entry, formatting, preparation or transmission of claim or cost report information may be determined or alleged to cause the submission of false claims or otherwise be in violation of these laws and regulations. Any failure of our proprietary applications or services to comply with these laws and regulations could result in substantial civil or criminal liability and could, among other things, adversely affect demand for our services, invalidate all or portions of some of our managed services agreements with our customers, require us to change or terminate some portions of our business, require us to refund portions of our base fee revenues and incentive payment revenues, cause us to be disqualified from serving customers doing business with government payers, and give our customers the right to terminate our managed services agreements with them, any one of which could have a material adverse effect on our business.
32
Table of Contents
We cannot be certain that governmental officials responsible for enforcing EMTALA, or other parties, will not assert that our customers are in violation of EMTALA, and defending and settling allegations of EMTALA violations could have a material adverse effect on our business even if we are ultimately not found to have contributed to such violations.
EMTALA requires Medicare-participating hospitals that have emergency departments to provide a medical screening examination and stabilizing treatment to all individuals who come to the hospital seeking treatment of an emergency medical condition, regardless of the patient’s ability to pay for the care. Sanctions for failing to fulfill these requirements include exclusion from participation in the Medicare and Medicaid programs and civil monetary penalties. In addition, the law creates private civil remedies that enable an individual who suffers personal harm as a direct result of a violation of the law to sue the offending hospital for damages and equitable relief.
In 2012, the Minnesota Attorney General’s “Compliance Review” described circumstances raising potential EMTALA concerns at Fairview and raised questions as to whether our practices contributed to any such violations. An investigation by the Minnesota Department of Health on behalf of the federal government concluded in September 2012 that Fairview had violated EMTALA and required Fairview to implement a corrective action plan. Since we are not a healthcare provider, EMTALA is not applicable to us, but we cannot be certain that governmental officials responsible for enforcing EMTALA, or other parties, will not assert that our other customers are in violation of EMTALA. If our customers are found to have violated EMTALA, they may assert claims that our management practices contributed to the violation. Defending and settling allegations of EMTALA violations could have a material adverse effect on our business even if we are ultimately not found guilty of a violation.
Our failure to comply with debt collection and other consumer protection laws and regulations could subject us to fines and other liabilities, which could harm our reputation and business, and could make it more difficult to retain existing customers or attract new customers, extend the time it takes to enter into service agreements with new customers, and result in a material adverse effect on our business, results of operations and financial condition.
The FDCPA regulates persons who regularly collect or attempt to collect, directly or indirectly, consumer debts in default that are owed or asserted to be owed to another person. However, our business practices that involve collecting, or assisting our customers in collecting, non-defaulted amounts owed by patients for current and prior services activities may be determined to be subject to the FDCPA. Many states impose additional requirements on debt collection communications, and some of those requirements may be more stringent than the federal requirements. Moreover, regulations governing debt collection are subject to changing interpretations that may be inconsistent among different jurisdictions. Further, we are subject to the TCPA, which imposes certain restrictions on companies that place telephone calls to consumers.
We could incur costs or could be subject to fines or other penalties under the TCPA, the FDCPA and the FTC Act if we are determined to have violated the provisions of those regulations during the course of conducting our operations. We, or our customers, could be required to report such breaches to affected consumers or regulatory authorities, leading to disclosures that could damage our reputation or harm our business, financial position and operating results. As a result of the 2011 laptop theft giving rise to the Minnesota Attorney General’s lawsuit and the related FTC inquiry of our data security practices, in December 2013, we entered into a consent order with the FTC pursuant to which no fine or penalty was paid but in which we agreed, among other things, to maintain a comprehensive information security program reasonably designed to protect the security, confidentiality, and integrity of personal information collected from or about consumers. Future allegations of this type could require us to change aspects of our business practices, make it more difficult to retain existing customers or attract new customers, extend the time it takes to enter into service agreements with new customers, and result in a material adverse effect on our business, results of operations and financial condition.
33
Table of Contents
Potential additional regulation of the disclosure of health information outside the United States may increase our costs.
Federal or state governmental authorities may impose additional data security standards or additional privacy or other restrictions on the collection, use, transmission and other disclosures of health information. Legislation has been proposed at various times at both the federal and the state levels that would limit, forbid or regulate the use or transmission of medical information pertaining to U.S. patients outside of the United States. Such legislation, if adopted, may render our operations in India impracticable or substantially more expensive. Moving such operations to the United States may involve substantial delay in implementation and increased costs.
Risks Related to Intellectual Property
We may be unable to adequately protect our intellectual property.
Our success depends, in part, upon our ability to establish, protect and enforce our intellectual property and other proprietary rights. If we fail to establish or protect our intellectual property rights, we may lose an important advantage in the market in which we compete. We rely upon a combination of patent, trademark, copyright and trade secret law and contractual terms and conditions to protect our intellectual property rights, all of which provide only limited protection. We cannot assure you that our intellectual property rights are sufficient to protect our competitive advantages. Although we have filed seven U.S. patent applications, we cannot assure you that any patents that will be issued from these applications will provide us with the protection that we seek or that any future patents issued to us will not be challenged, invalidated or circumvented. We have also been issued three U.S. patents, but we cannot assure you that they will provide us with the protection that we seek or that they will not be challenged, invalidated or circumvented. Legal standards relating to the validity, enforceability and scope of protection of patents are uncertain. Any patents that may be issued in the future from pending or future patent applications or our three issued patents may not provide sufficiently broad protection or they may not prove to be enforceable in actions against alleged infringers. Also, we cannot assure you that any trademark registrations will be issued for pending or future applications or that any of our trademarks will be enforceable or provide adequate protection of our proprietary rights.
We also rely in some circumstances on trade secrets to protect our technology. Trade secrets may lose their value if not properly protected. We endeavor to enter into non-disclosure agreements with our employees, customers, contractors and business partners to limit access to and disclosure of our proprietary information. The steps we have taken, however, may not prevent unauthorized use of our technology, and adequate remedies may not be available in the event of unauthorized use or disclosure of our trade secrets and proprietary technology. Moreover, others may reverse engineer or independently develop technologies that are competitive to ours or infringe our intellectual property.
Accordingly, despite our efforts, we may be unable to prevent third parties from infringing or misappropriating our intellectual property and using our technology for their competitive advantage. Any such infringement or misappropriation could have a material adverse effect on our business, results of operations and financial condition. Monitoring infringement of our intellectual property rights can be difficult and costly, and enforcement of our intellectual property rights may require us to bring legal actions against infringers. Infringement actions are inherently uncertain and therefore may not be successful, even when our rights have been infringed, and even if successful may require a substantial amount of resources and divert our management’s attention.
Claims by others that we infringe their intellectual property could force us to incur significant costs or revise the way we conduct our business.
Our competitors protect their intellectual property rights by means such as patents, trade secrets, copyrights and trademarks. We have not conducted an independent review of patents issued to third parties. Additionally,
34
Table of Contents
because patent applications in the United States and many other jurisdictions are kept confidential for 18 months before they are published, we may be unaware of pending patent applications that relate to our proprietary technology. Although we have not been involved in any litigation related to intellectual property rights of others, from time to time we receive letters from other parties alleging, or inquiring about, possible breaches of their intellectual property rights. Any party asserting that we infringe its proprietary rights would force us to defend ourselves, and possibly our customers, against the alleged infringement. These claims and any resulting lawsuit, if successful, could subject us to significant liability for damages and invalidation of our proprietary rights or interruption or cessation of our operations. The software and technology industries are characterized by the existence of a large number of patents, copyrights, trademarks and trade secrets and by frequent litigation based on allegations of infringement or other violations of intellectual property rights. Moreover, the risk of such a lawsuit will likely increase as our size and scope of our services and technology platforms increase, as our geographic presence and market share expand and as the number of competitors in our market increases.
Any such claims or litigation could:
| • | be time-consuming and expensive to defend, whether meritorious or not; |
| • | require us to stop providing the services that use the technology that infringes the other party’s intellectual property; |
| • | divert the attention of our technical and managerial resources; |
| • | require us to enter into royalty or licensing agreements with third parties, which may not be available on terms that we deem acceptable, if at all; |
| • | prevent us from operating all or a portion of our business or force us to redesign our services and technology platforms, which could be difficult and expensive and may make the performance or value of our service offerings less attractive; |
| • | subject us to significant liability for damages or result in significant settlement payments; or |
| • | require us to indemnify our customers, as we are required by contract to indemnify some of our customers for certain claims based upon the infringement or alleged infringement of any third party’s intellectual property rights resulting from our customers’ use of our intellectual property. |
Intellectual property litigation can be costly. Even if we prevail, the cost of such litigation could deplete our financial resources. Litigation is also time-consuming and could divert management’s attention and resources away from our business. Furthermore, during the course of litigation, confidential information may be disclosed in the form of documents or testimony in connection with discovery requests, depositions or trial testimony. Disclosure of our confidential information and our involvement in intellectual property litigation could materially adversely affect our business. Some of our competitors may be able to sustain the costs of complex intellectual property litigation more effectively than we can because they have substantially greater resources. In addition, any uncertainties resulting from the initiation and continuation of any litigation could significantly limit our ability to continue our operations and could harm our relationships with current and prospective customers. Any of the foregoing could disrupt our business and have a material adverse effect on our operating results and financial condition.
Risks Related to the Ownership of Shares of Our Common Stock
Our common stock has been delisted from the New York Stock Exchange, or NYSE, and is not listed on any other national securities exchange, which may negatively impact the trading price of our common stock and the levels of liquidity available to our stockholders.
Our common stock was suspended from trading on the NYSE prior to the opening of the market on March 17, 2014 (and subsequently delisted) and began trading under the symbol “ACHI” through the facilities of the OTC Markets Group, Inc. on that date.
35
Table of Contents
We can provide no assurance that we will be able to relist our common stock on a national securities exchange or that the stock will continue being traded on the over-the-counter, or OTC, marketplace. The trading of our common stock on the OTC marketplace rather than the NYSE may negatively impact the trading price of our common stock and the levels of liquidity available to our stockholders.
Securities traded in the OTC market generally have significantly less liquidity than securities traded on a national securities exchange due to factors such as the reduced number of investors that will consider investing in the securities, the reduced number of market makers in the securities, and the reduced number of securities analysts that follow such securities. As a result, holders of our common stock may find it difficult to resell their shares at prices quoted in the market or at all. Furthermore, because of the limited market and low volume of trading in our common stock that could occur, the share price of our common stock could more likely be affected by broad market fluctuations, general market conditions, fluctuations in our operating results, changes in the market’s perception of our business, and announcements made by us, our competitors, parties with whom we have business relationships or third parties. The lack of liquidity in our common stock may also make it difficult for us to issue additional securities for financing or other purposes, or to otherwise arrange for any financing we may need in the future.
The trading price of our common stock has been volatile and may continue to be volatile.
Since December 31, 2010, our common stock has traded at a price per share as high as $32.82 and as low as $6.92. The trading price of our common stock is likely to continue to be highly volatile and could be subject to wide fluctuations in response to various factors. In addition to the risks described in this section, factors that may cause the market price of our common stock to fluctuate include:
| • | the Restatement and the related SEC investigation; |
| • | fluctuations in our quarterly financial results or the quarterly financial results of companies perceived to be similar to us; |
| • | changes in estimates of our financial results; |
| • | failure to meet expectations of securities analysts; |
| • | the loss of service agreements with customers; |
| • | lawsuits filed against us by governmental authorities or stockholders; |
| • | unfavorable publicity concerning our operations or business practices; |
| • | our common stock’s eligibility for stock exchange listing; |
| • | investors’ general perception of us; and |
| • | changes in general economic, industry, regulatory and market conditions. |
In addition, if the stock market in general experiences a loss of investor confidence, the trading price of our common stock could decline for reasons unrelated to our business, financial condition or results of operations.
36
Table of Contents
Anti-takeover provisions in our charter documents and Delaware law could discourage, delay or prevent a change in control of our company and may affect the trading price of our common stock.
We are a Delaware corporation and the anti-takeover provisions of the Delaware General Corporation Law may discourage, delay or prevent a change in control by prohibiting us from engaging in a business combination with an interested stockholder for a period of three years after the person becomes an interested stockholder, even if a change in control would be beneficial to our existing stockholders. In addition, our restated certificate of incorporation and amended and restated bylaws may discourage, delay or prevent a change in our management or control over us that stockholders may consider favorable. Our restated certificate of incorporation and amended and restated bylaws:
| • | authorize the issuance of “blank check” preferred stock that could be issued by our board of directors to thwart a takeover attempt; |
| • | provide for a classified board of directors, as a result of which the successors to the directors whose terms have expired will be elected to serve from the time of election and qualification until the third annual meeting following their election; |
| • | require that directors only be removed from office for cause and only upon a supermajority stockholder vote; |
| • | provide that vacancies on the board of directors, including newly created directorships, may be filled only by a majority vote of directors then in office; |
| • | limit who may call special meetings of stockholders; prohibit stockholder action by written consent, requiring all actions to be taken at a meeting of the stockholders; and |
| • | require supermajority stockholder voting to effect certain amendments to our restated certificate of incorporation and amended and restated bylaws. |
We may not pay any cash dividends on our capital stock in the foreseeable future.
Although we paid cash dividends on our capital stock prior to our May 2010 initial public offering, or IPO, there is no assurance that we will pay cash dividends on our common stock in the foreseeable future. Any future dividend payments will be within the discretion of our board of directors and will depend on, among other things, our financial condition, results of operations, capital requirements, capital expenditure requirements, contractual restrictions, provisions of applicable law and other factors that our board of directors may deem relevant. We may not generate sufficient cash from operations in the future to pay dividends on our common stock.
| Item 1B. | Unresolved Staff Comments |
None.
| Item 2. | Properties |
We lease our existing facilities and do not own any real estate property.
Our corporate headquarters occupy approximately 43,000 square feet in Chicago, Illinois under a lease expiring on August 31, 2020. In addition, we have a right of first offer to lease an additional 11,100 square feet of space on another floor in the same building. We also lease office space and other facilities in Chicago, Illinois; Kalamazoo, Michigan; Warren, Michigan; Southfield, Michigan; Birmingham, Alabama; Jupiter, Florida; Cape Girardeau, Missouri; and two facilities near New Delhi, India. Pursuant to our managed services agreements with customers, we occupy space on-site at all hospitals where we provide our RCM services. We generally do not pay customers for our use of space provided by them for our use in the provision of RCM services to that customer.
37
Table of Contents
We believe that our facilities are sufficient for our current needs. We intend to add new facilities or expand existing facilities as we add employees or expand or change our geographic markets and office locations, and we believe that suitable additional or substitute space will be available as needed to accommodate any such expansion of our operations.
| Item 3. | Legal Proceedings |
On January 19, 2012, the State of Minnesota, by its Attorney General, filed a complaint against us in the United States District Court for the District of Minnesota, alleging violations of federal and Minnesota state health privacy laws and regulations, Minnesota debt collection laws, and Minnesota consumer protection laws resulting from, among other things, the theft in Minnesota in July 2011 of an employee’s laptop that contained PHI. On January 25, 2012, the Commissioner of the Minnesota Department of Commerce served us an administrative subpoena seeking information and documents about our debt collection practices and the privacy of personal and health data within our possession or control. On February 3, 2012, we entered into a Consent Cease and Desist Order with the Commissioner, voluntarily agreeing to cease all debt collection activity in the State of Minnesota. As previously disclosed, on July 30, 2012, without any admission of liability or wrongdoing, we entered into a Settlement Agreement, Release and Order with the Minnesota Attorney General to settle the lawsuit filed by the Minnesota Attorney General and the investigation commenced by the Minnesota Department of Commerce and to resolve fully all disputes which in any way related to, arose out of, emanated from, or otherwise involved such lawsuit or investigation and all investigations by the Minnesota Attorney General, the Minnesota Department of Commerce, and the Minnesota Department of Human Services relating to us. As part of the settlement, we paid a monetary penalty of $2.5 million and voluntarily agreed to cease all remaining operations in Minnesota.
On March 27, 2012, the FTC issued us a Civil Investigative Demand, to determine whether we may have violated Section 5 of the FTC Act, as it relates to deceptive or unfair acts or practices related to consumer privacy and/or data security, or the Fair Credit Reporting Act, or the FDCPA. Pursuant to the FTC’s demand, the FTC sought documents and responses that primarily concerned the collection, use, security, and privacy of personal and health data within our possession or control, statements to consumers about such data, the use of various forms of scoring, and policies and practices regarding collection of data. On December 31, 2013, without any admission of liability or wrongdoing, and without payment of any monetary penalty or fine, we entered into a Consent Order with the FTC to resolve its demand. Pursuant to the Consent Order, we agreed, among other things, to maintain a comprehensive information security program reasonably designed to protect the security, confidentiality, and integrity of personal information collected from or about consumers. The FTC gave final approval to the Consent Order on February 24, 2014.
On April 26, 2012 and May 1, 2012, we, along with certain of our former officers, were named as a defendant in two putative securities class action lawsuits filed in the U.S. District Court for the Northern District of Illinois, which were consolidated as Wong v. Accretive Health et al. The primary allegations are that our public statements, including filings with the SEC, were false and/or misleading about our violations of certain federal and Minnesota privacy and debt collection laws. On September 26, 2013, without any admission of liability or wrongdoing, we entered into a Settlement Agreement to resolve these suits for $14 million, which has been funded into escrow by our insurance carriers. On April 30, 2014, the U.S. District Court for the Northern District of Illinois granted final approval of the Settlement Agreement. A single objector to the Settlement Agreement appealed to the U.S. Court of Appeals for the Seventh Circuit, and, on December 9, 2014, the court of appeals affirmed the district court’s approval of the settlement.
In addition, we along with certain of our directors and former officers have been named in several putative shareholder derivative lawsuits filed in the U.S. District Court for the Northern District of Illinois on May 3, 2012 and July 31, 2012 (consolidated as Maurras Trust v. Accretive Health et al.), in the Circuit Court of Cook County, Illinois on June 23, 2012 and June 27, 2012 (consolidated as In re Accretive Health, Inc. Derivative Litigation) and in the Court of Chancery of the State of Delaware on November 5, 2012 (Doyle v. Tolan et al.).
38
Table of Contents
The primary allegations are that our directors and officers breached their fiduciary duties in connection with the alleged violations of certain federal and Minnesota privacy and debt collection laws.
On July 11, 2013, the Court of Chancery of the State of Delaware granted our motion to stay Doyle v. Tolan et al., in favor of the action pending in the U.S. District Court for the Northern District of Illinois. On September 24, 2013, the U.S. District Court for the Northern District of Illinois granted our motion to dismiss without prejudice, giving plaintiffs in that case leave to file an amended consolidated complaint, which plaintiffs filed on October 22, 2013, amending their complaint to also include allegations with respect to the Restatement. We believe that we have meritorious defenses in all of these cases and intend to vigorously defend ourselves and our directors and officers against these claims. The outcome of these matters is not presently determinable.
On June 12, 2012, the Illinois Department of Financial and Professional Regulation issued an administrative complaint seeking to impose reciprocal “sister state discipline” against our Illinois debt collection license based on the February 3, 2012 Consent Cease and Desist Order, with the Commissioner of the Minnesota Department of Commerce. On September 11, 2013, an administrative law judge dismissed the complaint without prejudice.
On May 17, 2013, we along with certain of our directors and former officers were named as a defendant in a putative securities class action lawsuit filed in the U.S. District Court for the Northern District of Illinois (Hughes v. Accretive Health, Inc. et al.). The primary allegations, relating to our March 8, 2013 announcement that we would be restating our prior period financials, are that our public statements, including filings with the SEC, were false and/or misleading with respect to our revenue recognition and earnings prospects. On November 27, 2013, plaintiffs voluntarily dismissed our directors (other than Mary Tolan). On January 31, 2014, we filed a motion to dismiss the Complaint. On September 25, 2014, the Court granted our motion to dismiss without prejudice, however the plaintiffs filed a second amended complaint on October 23, 2014. We continue to believe we have meritorious defenses and intend to vigorously defend ourselves, Mary Tolan, and our former officers against these claims. The outcome is not presently determinable.
The SEC’s Division of Enforcement in the Chicago Regional Office is also conducting an investigation regarding the circumstances surrounding our March 8, 2013 announcement. We are fully cooperating with the investigation.
On February 11, 2014, we were named as a defendant in a putative class action lawsuit filed in the U.S. District Court for the Southern District of Alabama (Church v. Accretive Health, Inc.). The primary allegations are that we attempted to collect debts without providing the notice required by the FDCPA and attempted to collect debts after they were discharged in bankruptcy. We believe that we have meritorious defenses and intend to vigorously defend ourselves against these claims. The outcome is not presently determinable.
On July 22, 2014, we were named as a defendant in a putative class action lawsuit filed in the U.S. District Court for the Eastern District of Michigan (Anger v. Accretive Health, Inc.). The primary allegations are that we attempted to collect debts without providing the notice required by the FDCPA. We believe that we have meritorious defenses and intend to vigorously defend ourselves against these claims. The outcome is not presently determinable.
We have also been party to a confidential binding arbitration with Fairview Health Services. On December 31, 2013, we entered into a negotiated, confidential settlement to resolve all differences with Fairview following a confidential mediation.
From time to time we may become subject to various other legal proceedings and claims, either asserted or unasserted, which arise in the ordinary course of our business. While the outcome of these other claims cannot be predicted with certainty, we do not believe that the outcome of any of these other legal matters will have a material adverse effect on our results of operations, financial condition or cash flows.
| Item 4. | Mine Safety Disclosures |
Not applicable.
39
Table of Contents
PART II
| Item 5. | Market for Registrant’s Common Equity, Related Stockholder Matters and Issuers Purchases of Equity Securities |
Our common stock has traded on the OTC market under the symbol “ACHI” since March 17, 2014 and is quoted through the facilities of the OTC Markets Group, Inc. Our common stock traded on the NYSE under the symbol “AH” from May 20, 2010 through March 14, 2014. Our common stock was suspended from trading on the NYSE prior to the opening of the market on March 17, 2014 (and subsequently delisted) and began trading under the symbol “ACHI” through the facilities of the OTC Markets Group, Inc. on that date. Prior to May 20, 2010, there was no public market for our common stock.
The following table sets forth the high and low intraday sales prices per share of our common stock, as reported by the NYSE, for the periods indicated:
| Price Range | ||||||||
| High | Low | |||||||
| 2011 |
||||||||
| Quarter ended March 31, 2011 |
$ | 27.97 | $ | 16.00 | ||||
| Quarter ended June 30, 2011 |
$ | 30.65 | $ | 21.20 | ||||
| Quarter ended September 30, 2011 |
$ | 32.82 | $ | 20.35 | ||||
| Quarter ended December 31, 2011 |
$ | 29.10 | $ | 19.31 | ||||
| 2012 |
||||||||
| Quarter ended March 31, 2012 |
$ | 28.46 | $ | 19.40 | ||||
| Quarter ended June 30, 2012 |
$ | 20.27 | $ | 7.75 | ||||
| Quarter ended September 30, 2012 |
$ | 14.19 | $ | 9.92 | ||||
| Quarter ended December 31, 2012 |
$ | 12.68 | $ | 10.36 | ||||
| 2013 |
||||||||
| Quarter ended March 31, 2013 |
$ | 13.54 | $ | 8.55 | ||||
| Quarter ended June 30, 2013 |
$ | 11.58 | $ | 8.91 | ||||
| Quarter ended September 30, 2013 |
$ | 11.15 | $ | 8.86 | ||||
| Quarter ended December 31, 2013 |
$ | 9.55 | $ | 7.98 | ||||
The closing sale price per share of our common stock, as reported by the OTC Markets Group, Inc., on December 22, 2014 was $8.65. As of December 18, 2014, there were approximately 72 stockholders of record of our common stock and approximately 3,083 beneficial holders.
Dividends
We did not pay any dividends during the years ended December 31, 2013, 2012 and 2011. We currently intend to retain earnings, if any, to finance the growth and development of our business, and we do not expect to pay any cash dividends on our common stock in the foreseeable future. Payment of future dividends, if any, will be at the discretion of our board of directors and will depend on, among other things, our financial condition, results of operations, capital expenditure requirements, contractual restrictions, provisions of applicable law, and other factors the board deems relevant.
Equity Compensation Plan Information
We maintain a 2006 Second Amended and Restated Stock Option Plan, which we refer to as the 2006 Plan. In April 2010 in connection with our IPO, we adopted a new 2010 Stock Incentive Plan, or the 2010 Plan, and, together with the 2006 Plan, the Plans. Under the 2010 Plan we may issue (up to a maximum of 24,374,756 shares) including any shares that remained available for issuance under the 2006 Plan as of the date of the IPO and any shares subject to awards that were outstanding under the 2006 Plan as of the date of the IPO that expire, terminate or are otherwise surrendered, cancelled, forfeited or repurchased by us without the issuance of shares
40
Table of Contents
thereunder. We will not make any further grants under the 2006 Plan. The 2010 Plan provides for the grant of incentive stock options, non-statutory stock options, restricted stock awards, or RSAs, and other share-based awards. As of December 31, 2013, an aggregate of 15,944,775 shares were subject to outstanding options and RSAs under the Plans, 10,109,036 shares had been issued pursuant to the exercise of options issued under the Plans, and 2,883,113 shares were available for future grants of awards under the 2010 Plan. However, to the extent that previously granted awards under the 2006 Plan or 2010 Plan expire, terminate or are otherwise surrendered, cancelled, forfeited or repurchased by us, the number of shares available for future awards under the 2010 Plan will increase. The following table summarizes information about the securities authorized for issuance under our equity compensation plans as of December 31, 2013:
| (a) | (b) | (c) | ||||||||||
| Plan Category | Number of Securities to be Issued Upon Exercise of Outstanding Options |
Weighted- Average Exercise Price of Outstanding Options |
Number of Securities Remaining Available for Future Issuance Under Equity Compensation Plans (Excluding Securities reflected in Column (a)) |
|||||||||
| Equity compensation plans approved by stockholders (1)(2) |
15,836,472 | $ | 12.27 | 2,883,113 | ||||||||
| Equity compensation plans not approved by stockholders (3)(4) |
4,703,801 | $ | 10.09 | — | ||||||||
|
|
|
|
|
|||||||||
| Total |
20,540,273 | $ | 11.77 | 2,883,113 | ||||||||
|
|
|
|
|
|||||||||
| (1) | Includes all outstanding stock options awarded under our 2006 Plan and 2010 Plan. |
| (2) | Excludes 108,303 shares of restricted stock that were unvested and not forfeited as of December 31, 2013. |
| (3) | Represents stock option inducement grants made pursuant to the NYSE inducement grant rules. |
| (4) | Excludes 349,996 shares of restricted stock that were unvested and not forfeited as of December 31, 2013. |
We entered into a Stock Option Agreement with Stephen Schuckenbrock on April 3, 2013, as an inducement award pursuant to an exemption from the NYSE’s stockholder approval requirements in connection with Mr. Schuckenbrock’s appointment as our then-chief executive officer. Pursuant to this agreement, we granted Mr. Schuckenbrock a non-statutory stock option for the purchase of up to 2,903,801 shares of our common stock with an exercise price of $9.56 per share, which options vest in substantially equal monthly installments over 48 months subject to continued service with us (including service as a member of our board of directors). See Agreement for Mr. Stephen Schuckenbrock in Part III - Item 11 - “Executive Compensation” for more details.
We entered into a Non-Statutory Stock Option Agreement and a Restricted Stock Award Agreement with Joseph Flanagan on June 3, 2013, each as an inducement award pursuant to an exemption from the NYSE’s stockholder approval requirements in connection with Mr. Flanagan’s appointment as our chief operating officer. Pursuant to the Non-Statutory Stock Option Agreement, we granted Mr. Flanagan a non-statutory stock option for the purchase of up to 800,000 shares of our common stock with an exercise price of $11.47 per share and pursuant to the Restricted Stock Award Agreement, we granted Mr. Flanagan 400,000 shares of our common stock. These equity awards to Mr. Flanagan vest in substantially equal monthly installments over 48 months subject to continued service with us. See Agreement for Mr. Joseph Flanagan in Part III - Item 11 - “Executive Compensation” for more details.
We also entered into a Non-Statutory Stock Option Agreement with Richard Kimball on April 30, 2013, as an inducement award pursuant to an exemption from the NYSE’s stockholder approval requirements in connection with Mr. Kimball’s appointment as our then-chief strategy officer. Pursuant to this agreement, we granted Mr. Kimball a non-statutory stock option for the purchase of up to 1,000,000 shares of our common stock with an exercise price of $10.54 per share. That stock option vested with respect to the first 250,000 shares ratably on a quarterly basis during the first year of Mr. Kimball’s employment, and with respect to the remaining 750,000 shares, the stock option was to vest ratably on each of the second through fourth anniversaries of
41
Table of Contents
Mr. Kimball’s employment, in each case subject to continued service with us. Mr. Kimball resigned from our company on August 31, 2014, at which time his option had vested with respect to 250,000 of the options, and was forfeited with respect to the remaining 750,000 options. The vested portion of Mr. Kimball’s option was also terminated sixty days after Mr. Kimball’s resignation.
Sales of Unregistered Securities and Use of Proceeds
Use of IPO Proceeds. The SEC declared the Registration Statement on Form S-1 (File No. 333-162186) related to our initial public offering or IPO effective on May 19, 2010. From the effective date of the registration statement through December 31, 2013, we used all the net proceeds from our IPO in funding our operations. Please refer to “Item 7 – Management’s Discussion and Analysis of Financial Condition” and “Item 8 – Consolidated Financial Statements and Supplementary Data” for a discussion of our operating expenses.
Recent Sales of Unregistered Securities
We granted options to purchase an aggregate of 4,482,689 shares of our common stock during the nine month period ended September 30, 2014 with exercise prices ranging from $7.38 to $9.45 per share, and 7,939,600 shares of common stock during 2013 with exercise prices ranging from $8.14 to $11.47 per share. Additionally we issued 2,365,000 shares of restricted stock during the nine month period ended September 30, 2014 and 508,303 shares of restricted stock during 2013, to employees and directors pursuant to the 2010 Plan and/or in reliance upon the exemption from the registration requirements of the Securities Act of 1933, or Securities Act, provided by Section 4(a)(2) of the Securities Act as sales by an issuer not involving any public offering, as set forth in the tables below. No underwriters were involved in the foregoing transactions. All of such unregistered shares of common stock are deemed restricted securities for purposes of the Securities Act. No such options have been exercised.
The following table sets forth the dates on which such options were granted and the number of shares of common stock subject to such options, the exercise price and the number of employees and directors granted options on each date from January 1, 2014 through September 30, 2014:
| Date of Grant | Common Stock Subject to Options Granted |
Exercise Price |
Number of Employees and Directors Granted Options |
|||||||||
| 1/2/2014 |
17,376 | $ | 9.14 | 5 | ||||||||
| 1/3/2014 |
28,275 | $ | 9.09 | 4 | ||||||||
| 1/7/2014 |
218,946 | $ | 9.45 | 2 | ||||||||
| 2/4/2014 |
154,000 | $ | 8.83 | 1 | ||||||||
| 3/4/2014 |
160,000 | $ | 8.61 | 1 | ||||||||
| 4/1/2014 |
22,540 | $ | 8.38 | 6 | ||||||||
| 4/2/2014 |
13,488 | $ | 8.53 | 2 | ||||||||
| 4/29/2014 |
700,000 | $ | 8.05 | 2 | ||||||||
| 5/2/2014 |
6,526 | $ | 7.70 | 2 | ||||||||
| 6/3/2014 |
10,000 | $ | 7.38 | 2 | ||||||||
| 7/1/2014 |
23,706 | $ | 8.00 | 6 | ||||||||
| 7/2/2014 |
97,462 | $ | 8.00 | 4 | ||||||||
| 7/21/2014 |
2,700,000 | $ | 8.98 | 1 | ||||||||
| 8/4/2014 |
10,000 | $ | 8.35 | 1 | ||||||||
| 8/12/2014 |
300,000 | $ | 8.15 | 1 | ||||||||
| 9/3/2014 |
20,370 | $ | 8.10 | 1 | ||||||||
|
|
|
|||||||||||
| 4,482,689 | ||||||||||||
|
|
|
|||||||||||
42
Table of Contents
The following table sets forth the dates on which such options were granted and the number of shares of common stock subject to such options, the exercise price and the number of employees and directors granted options on each date during the year ended December 31, 2013:
| Date of Grant | Common Stock Subject to Options Granted |
Exercise Price |
Number of Employees and Directors Granted Options |
|||||||||
| 3/4/2013 |
35,000 | $ | 9.40 | 4 | ||||||||
| 4/1/2013 |
20,092 | $ | 10.25 | 6 | ||||||||
| 4/2/2013 |
168,086 | $ | 10.00 | 7 | ||||||||
| 4/3/2013 |
2,903,801 | $ | 9.56 | 1 | ||||||||
| 4/30/2013 |
1,000,000 | $ | 10.54 | 1 | ||||||||
| 5/2/2013 |
1,300,500 | $ | 10.39 | 116 | ||||||||
| 5/7/2013 |
103,174 | $ | 10.38 | 1 | ||||||||
| 6/3/2013 |
800,000 | $ | 11.47 | 1 | ||||||||
| 6/4/2013 |
100,000 | $ | 11.40 | 5 | ||||||||
| 7/1/2013 |
17,304 | $ | 11.05 | 6 | ||||||||
| 7/2/2013 |
12,782 | $ | 10.85 | 2 | ||||||||
| 8/2/2013 |
91,000 | $ | 9.98 | 8 | ||||||||
| 8/26/2013 |
300,000 | $ | 9.94 | 1 | ||||||||
| 9/4/2013 |
428,000 | $ | 9.30 | 12 | ||||||||
| 10/1/2013 |
21,028 | $ | 9.07 | 6 | ||||||||
| 10/2/2013 |
398,833 | $ | 9.04 | 7 | ||||||||
| 11/4/2013 |
15,000 | $ | 8.20 | 2 | ||||||||
| 12/3/2013 |
225,000 | $ | 8.14 | 4 | ||||||||
|
|
|
|||||||||||
| 7,939,600 | ||||||||||||
|
|
|
|||||||||||
The following table sets forth the dates on which such shares of restricted stock were granted, the number of shares of restricted stock and the number of employees and directors granted restricted stock on each date from January 1, 2014 through September 30, 2014:
| Date of Grant | Number of Shares of Restricted Common Stock Granted |
Number of Employees and Directors Granted Restricted Stock |
||||||
| 1/24/2014 |
750,000 | 19 | ||||||
| 4/29/2014 |
375,000 | 2 | ||||||
| 7/9/2014 |
40,000 | 1 | ||||||
| 7/21/2014 |
1,000,000 | 1 | ||||||
| 8/12/2014 |
200,000 | 1 | ||||||
|
|
|
|||||||
| 2,365,000 | ||||||||
|
|
|
|||||||
43
Table of Contents
The following table sets forth the dates on which such shares of restricted stock were granted, the number of shares of restricted stock and the number of employees and directors granted restricted stock on each date during the year ended December 31, 2013:
| Date of Grant | Number of Shares of Restricted Common Stock Granted |
Number of Employees and Directors Granted Restricted Stock |
||||||
| 6/3/2013 |
400,000 | 1 | ||||||
| 6/4/2013 |
108,303 | 1 | ||||||
|
|
|
|||||||
| 508,303 | ||||||||
|
|
|
|||||||
Issuer Purchases of Equity Securities
The following table provides information about our repurchases of common stock during the periods indicated (in thousands, except share and per share data):
| Period | Number of Shares Purchased |
Average Price Paid per Share |
Total Number of Shares Purchased as Part of Publicly Announced Plans or Programs(1) |
Maximum Dollar Value of Shares that May Yet be Purchased Under Publicly Announced Plans or Programs |
||||||||||||
| September 1, 2012 – September 30, 2012 |
1,127,600 | $ | 11.67 | 1,127,600 | $ | 36,886 | ||||||||||
| October 1, 2012 – October 31, 2012 |
1,362,200 | 11.65 | 1,362,200 | 20,978 | ||||||||||||
| November 1, 2012 – November 30, 2012 |
1,418,099 | 11.48 | 1,418,099 | 4,701 | ||||||||||||
| December 1, 2012 – December 31, 2012 |
399,463 | 11.77 | 399,463 | — | ||||||||||||
|
|
|
|
|
|
|
|||||||||||
| For the year ended December 31, 2012 |
4,307,362 | $ | 11.61 | 4,307,362 | — | |||||||||||
|
|
|
|
|
|
|
|||||||||||
| For the year ended December 31, 2013(2) |
— | — | — | $ | 50,000 | |||||||||||
|
|
|
|||||||||||||||
| (1) | On September 4, 2012, our board of directors authorized the repurchase of up to $50.0 million of our common stock from time to time in the open market or in privately negotiated transactions, or the 2012 Repurchase Program. The timing and amount of any shares repurchased was determined by our management based on its evaluation of market conditions and other factors. In 2012, we repurchased 4,307,362 shares of common stock valued at approximately $50.0 million, pursuant to the repurchase program. As of December 31, 2012, no common stock remained available for repurchase pursuant to the 2012 Repurchase Program. |
| (2) | On November 13, 2013, our board of directors authorized, subject to the completion of the Restatement, the repurchase of up to $50 million of our common stock from time to time in the open market or in privately negotiated transactions, or the 2013 Repurchase Program. The timing and amount of any shares repurchased under the 2013 Repurchase Program will be determined by our management based on its evaluation of market conditions and other factors. The 2013 Repurchase Program may be suspended or discontinued at any time. We currently intend to fund any repurchases from cash on hand. The 2013 Repurchase Program was not in effect during 2013 or 2014 and accordingly we did not repurchase any shares of common stock under the 2013 Repurchase Program during 2013 or 2014. |
Treasury stock also includes repurchases of our stock related to employees’ tax withholding upon vesting of RSAs. See Note 6, Share-Based Compensation, to our consolidated financial statements.
44
Table of Contents
Stock Price Performance Graph
The following graph compares the change in the cumulative total return (including the reinvestment of dividends) on our common stock to the change in the cumulative total return on the stocks included in the NYSE Composite Index and Morningstar Healthcare Information Services Index over the period from May 20, 2010, the date our shares of common stock began trading on the NYSE through December 31, 2013. The graph assumes an investment of $100 made in our common stock at a price of $12.00 per share, which was the per share price to the public in our IPO and an investment in each of the other indices on May 20, 2010, the first day of trading of our shares of common stock on the NYSE. We did not pay any dividends during the period reflected in the graph.
COMPARISON OF CUMULATIVE TOTAL RETURN
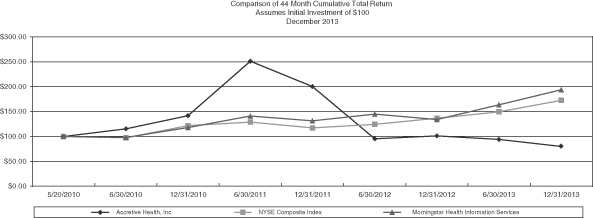
| 5/20/2010 | 6/30/2010 | 12/31/2010 | 6/30/2011 | 12/31/2011 | 6/30/2012 | 12/31/2012 | 6/30/2013 | 12/31/2013 | ||||||||||||||||||||||||||||||
| Accretive Health, Inc. |
Return % | 15.18 | 22.83 | 77.17 | -20.18 | -52.31 | 5.66 | -6.65 | -15.26 | |||||||||||||||||||||||||||||
| Cum $ | 100.00 | 115.18 | 141.47 | 250.65 | 200.06 | 95.42 | 100.82 | 94.11 | 79.75 | |||||||||||||||||||||||||||||
| NYSE Composite Index |
Return % | -2.44 | 24.63 | 5.86 | -8.91 | 5.92 | 9.76 | 9.40 | 15.53 | |||||||||||||||||||||||||||||
| Cum $ | 100.00 | 97.56 | 121.58 | 128.71 | 117.25 | 124.19 | 136.31 | 149.12 | 172.28 | |||||||||||||||||||||||||||||
| Morningstar Health Information Services |
Return % | -1.86 | 19.90 | 20.00 | -6.81 | 10.22 | -7.82 | 22.30 | 18.26 | |||||||||||||||||||||||||||||
| Cum $ | 100.00 | 98.14 | 117.67 | 141.20 | 131.59 | 145.03 | 133.69 | 163.50 | 193.37 | |||||||||||||||||||||||||||||
| Company/Market/ Peer Group |
5/20/2010 | 6/30/2010 | 12/31/2010 | 6/30/2011 | 12/31/2011 | 6/30/2012 | 12/31/2012 | 6/30/2013 | 12/31/2013 | |||||||||||||||||||||||||||
| Accretive Health, Inc. |
$ | 100.00 | $ | 115.18 | $ | 141.47 | $ | 250.65 | $ | 200.06 | $ | 95.42 | $ | 100.82 | $ | 94.11 | $ | 79.75 | ||||||||||||||||||
| NYSE Composite Index (a) |
$ | 100.00 | $ | 97.56 | $ | 121.58 | $ | 128.71 | $ | 117.25 | $ | 124.19 | $ | 136.31 | $ | 149.12 | $ | 172.28 | ||||||||||||||||||
| Morningstar Health Information Services (a) |
$ | 100.00 | $ | 98.14 | $ | 117.67 | $ | 141.20 | $ | 131.59 | $ | 145.03 | $ | 133.69 | $ | 163.50 | $ | 193.37 | ||||||||||||||||||
| (a) | Companies included in these indices change from year to year; therefore, cumulative returns for historical periods may differ from previously issued reports. |
The comparisons shown in the graph above are based on historical data and we caution that the stock price performance shown in the graph above is not indicative of, and is not intended to forecast, the potential future performance of our common stock. The information in this “Stock Price Performance Graph” section shall not be deemed to be “soliciting material” or to be “filed” with the SEC, nor shall such information be incorporated by reference into any future filing under the Securities Act of 1933, or the Securities Act, or the Securities Exchange Act of 1934, or the Exchange Act, except to the extent that we specifically incorporate it by reference into such filing.
45
Table of Contents
| Item 6. | Selected Consolidated Financial Data |
The selected consolidated financial data presented below should be read in conjunction with “Item 7, Management’s Discussion and Analysis of Financial Condition and Results of Operations,” and “Item 8, Consolidated Financial Statements and Supplementary Data,” included elsewhere in this Form 10-K. We have restated certain consolidated financial data presented in this Annual Report on Form 10-K as of, and for, the years ended, December 31, 2011, 2010 and 2009. The Restatement reflects adjustments related to revenue recognition and other items identified by management, as further described in Note 2, Restatement of Previously Issued Consolidated Financial Statements, included in “Part II – Item 8 – Consolidated Financial Statements and Supplemental Data.”
We derived the consolidated statements of operations and comprehensive income (loss) data for the years ended December 31, 2013, 2012 and 2011, and the consolidated balance sheet data as of December 31, 2013, 2012 and 2011 from our audited restated consolidated financial statements, which are included in this Annual Report on Form 10-K. We derived the consolidated statement of operations and comprehensive income (loss) data for the years ended December 31, 2010 and 2009, and the consolidated balance sheet data as of December 31, 2010 and 2009, from our unaudited restated consolidated financial statements.
The Restatement adjustments that relate to years prior to 2009 are reflected in beginning accumulated deficit for 2009. The cumulative impact of these adjusting entries, net of taxes increased our accumulated deficit by $121.6 million, at the beginning of 2009.
Selected Financial Data
| Year Ended December 31, | ||||||||||||||||||||
| 2013 | 2012 | 2011 | 2010 | 2009 | ||||||||||||||||
| As restated (1) |
As restated (1)(2) |
As restated (2) |
||||||||||||||||||
| (Unaudited) | (Unaudited) | |||||||||||||||||||
| (In thousands, except share and per share data) | ||||||||||||||||||||
| Consolidated Statement of Operations Data: |
||||||||||||||||||||
| Net services revenue |
$ | 504,768 | $ | 72,254 | $ | 101,966 | $ | 26,945 | $ | 22,045 | ||||||||||
| Operating expenses: |
||||||||||||||||||||
| Cost of services |
186,752 | 188,666 | 158,715 | 113,607 | 87,751 | |||||||||||||||
| Selling, general and administrative |
79,951 | 67,750 | 63,268 | 39,870 | 30,454 | |||||||||||||||
| Restatement and other |
33,963 | 3,714 | — | — | — | |||||||||||||||
|
|
|
|
|
|
|
|
|
|
|
|||||||||||
| Total operating expenses |
300,666 | 260,130 | 221,983 | 153,477 | 118,205 | |||||||||||||||
|
|
|
|
|
|
|
|
|
|
|
|||||||||||
| Income (loss) from operations |
204,102 | (187,876 | ) | (120,017 | ) | (126,532 | ) | (96,160 | ) | |||||||||||
| Net interest income (expense) |
330 | 141 | 26 | 29 | (9 | ) | ||||||||||||||
|
|
|
|
|
|
|
|
|
|
|
|||||||||||
| Net income (loss) before income tax provision |
204,432 | (187,735 | ) | (119,991 | ) | (126,503 | ) | (96,169 | ) | |||||||||||
| Income tax provision (benefit) |
74,349 | (67,995 | ) | (48,246 | ) | (46,586 | ) | (86,192 | ) | |||||||||||
|
|
|
|
|
|
|
|
|
|
|
|||||||||||
| Net income (loss) |
$ | 130,083 | $ | (119,740 | ) | $ | (71,745 | ) | $ | (79,917 | ) | $ | (9,977 | ) | ||||||
|
|
|
|
|
|
|
|
|
|
|
|||||||||||
| Dividends on preferred shares |
— | — | — | — | (8,044 | ) | ||||||||||||||
| Net income (loss) applicable to common shareholders |
$ | 130,083 | $ | (119,740 | ) | $ | (71,745 | ) | $ | (79,917 | ) | $ | (18,021 | ) | ||||||
|
|
|
|
|
|
|
|
|
|
|
|||||||||||
| Net income (loss) per common share |
||||||||||||||||||||
| Basic |
$ | 1.36 | $ | (1.21 | ) | $ | (0.74 | ) | $ | (1.13 | ) | $ | (0.49 | ) | ||||||
| Diluted |
$ | 1.34 | $ | (1.21 | ) | $ | (0.74 | ) | $ | (1.13 | ) | $ | (0.49 | ) | ||||||
46
Table of Contents
| As of December 31, | ||||||||||||||||||||
| 2013 | 2012 | 2011 | 2010 | 2009 | ||||||||||||||||
| As restated (1) |
As restated (2) |
As restated (2) |
||||||||||||||||||
| (Unaudited) | (Unaudited) | |||||||||||||||||||
| (In thousands) | ||||||||||||||||||||
| Consolidated Balance Sheet Data: |
||||||||||||||||||||
| Cash and cash equivalents |
$ | 228,891 | $ | 176,956 | $ | 196,725 | $ | 156,067 | $ | 43,659 | ||||||||||
| Working capital (3) |
$ | 124,045 | $ | 139,852 | $ | 161,539 | $ | 93,995 | $ | (7,263 | ) | |||||||||
| Total assets |
$ | 509,991 | $ | 557,377 | $ | 476,280 | $ | 344,602 | $ | 160,057 | ||||||||||
| Non-current liabilities |
$ | 202,799 | $ | 85,848 | $ | 65,074 | $ | 337,551 | $ | 206,742 | ||||||||||
| Total stockholders’ equity (deficit) |
$ | (85,612 | ) | $ | (236,200 | ) | $ | (101,431 | ) | $ | (95,755 | ) | $ | (124,854 | ) | |||||
| (1) | For adjustments related to 2011, see Note 2, Restatement of Previously Issued Consolidated Financial Statements, to the consolidated financial statements included in this Annual Report on Form 10-K. |
| (2) | Restated consolidated financial data related to the periods ended December 31, 2010 and 2009 has not been audited by our independent registered public accounting firm and, accordingly, has been marked as unaudited. |
| (3) | We define working capital as total current assets excluding the current portion of deferred tax assets pertaining to the current portion of deferred customer billings, less total current liabilities excluding the current portion of deferred customer billings. We exclude the current portion of deferred customer billings and related deferred tax assets from the definition of working capital due to the nature of these balances. |
47
Table of Contents
2010 and 2009 Consolidated Financial Statements (Unaudited)
The table below summarizes the effects of the Restatement adjustments on the Consolidated Balance Sheet at December 31, 2010 (in thousands):
| 2010 As reported (1) |
Adjustments | 2010 As restated |
||||||||||
| (Unaudited) | (Unaudited) | (Unaudited) | ||||||||||
| Assets |
||||||||||||
| Current assets: |
||||||||||||
| Cash and cash equivalents (2) |
$ | 155,573 | $ | 494 | $ | 156,067 | ||||||
| Accounts receivable, net |
53,894 | (48,597 | ) | 5,297 | ||||||||
| Prepaid income taxes |
11,436 | 229 | 11,665 | |||||||||
| Current deferred tax asset |
— | 16,518 | 16,518 | |||||||||
| Other current assets |
4,842 | (662 | ) | 4,180 | ||||||||
|
|
|
|
|
|
|
|||||||
| Total current assets |
225,745 | (32,018 | ) | 193,727 | ||||||||
| Property, equipment and software, net |
21,698 | (6,748 | ) | 14,950 | ||||||||
| Non-current deferred tax asset |
11,405 | 123,753 | 135,158 | |||||||||
| Goodwill and other assets, net |
3,771 | (3,004 | ) | 767 | ||||||||
|
|
|
|
|
|
|
|||||||
| Total assets |
$ | 262,619 | $ | 81,983 | $ | 344,602 | ||||||
|
|
|
|
|
|
|
|||||||
| Liabilities and stockholders’ equity (deficit) |
||||||||||||
| Current liabilities: |
||||||||||||
| Accounts payable |
$ | 30,073 | $ | (27,557 | ) | $ | 2,516 | |||||
| Current portion of customer liabilities |
60,506 | 22,436 | 82,942 | |||||||||
| Accrued compensation and benefits |
13,331 | (822 | ) | 12,509 | ||||||||
| Deferred tax liability |
6,016 | (6,016 | ) | — | ||||||||
| Other accrued expenses |
6,062 | (1,223 | ) | 4,839 | ||||||||
|
|
|
|
|
|
|
|||||||
| Total current liabilities |
115,988 | (13,182 | ) | 102,806 | ||||||||
| Non-current portion of customer liabilities |
— | 331,361 | 331,361 | |||||||||
| Other non-current liabilities |
3,912 | 2,278 | 6,190 | |||||||||
|
|
|
|
|
|
|
|||||||
| Total liabilities |
119,900 | 320,457 | 440,357 | |||||||||
|
|
|
|
|
|
|
|||||||
| Commitments and contingencies |
||||||||||||
| Stockholders’ equity (deficit): |
||||||||||||
| Common stock |
948 | — | 948 | |||||||||
| Additional paid-in capital |
159,780 | 38 | 159,818 | |||||||||
| Non-executive employee loans for stock option exercises |
(41 | ) | — | (41 | ) | |||||||
| Accumulated deficit |
(17,834 | ) | (238,661 | ) | (256,495 | ) | ||||||
| Accumulated other comprehensive income (loss) |
(134 | ) | 149 | 15 | ||||||||
|
|
|
|
|
|
|
|||||||
| Total stockholders’ equity (deficit) |
142,719 | (238,474 | ) | (95,755 | ) | |||||||
|
|
|
|
|
|
|
|||||||
| Total liabilities and stockholders’ equity (deficit) |
$ | 262,619 | $ | 81,983 | $ | 344,602 | ||||||
|
|
|
|
|
|
|
|||||||
| (1) | In connection with the Restatement, the Company has also reclassified certain amounts in the historical consolidated financial statements to conform to the current presentation. See Note 2, Restatement of Previously Issued Consolidated Financial Statements to the consolidated financial statements included in this Annual Report on Form 10-K, for further information. |
| (2) | Adjustment of $494 pertains to the incorrect classification of bank deposits as other current assets in the as reported balance sheet. |
48
Table of Contents
The table below summarizes the effects of the Restatement adjustments on the Consolidated Statement of Operations and Comprehensive Income (Loss) for the year ended December 31, 2010 (in thousands, except share and per share amounts):
| As reported (1) | Adjustments | As restated | ||||||||||
| (Unaudited) | (Unaudited) | (Unaudited) | ||||||||||
| Net services revenue |
$ | 606,294 | $ | (579,349 | ) | $ | 26,945 | |||||
| Operating expenses: |
||||||||||||
| Cost of services (4) |
542,305 | (428,698 | ) | 113,607 | ||||||||
| Selling, general and administrative (4) |
41,671 | (1,801 | ) | 39,870 | ||||||||
|
|
|
|
|
|
|
|||||||
| Total operating expenses |
583,976 | (430,499 | ) | 153,477 | ||||||||
|
|
|
|
|
|
|
|||||||
| Income (loss) from operations |
22,318 | (148,850 | ) | (126,532 | ) | |||||||
| Net interest income |
29 | — | 29 | |||||||||
|
|
|
|
|
|
|
|||||||
| Net income (loss) before income tax provision |
22,347 | (148,850 | ) | (126,503 | ) | |||||||
| Income tax provision (benefit) |
9,729 | (56,315 | ) | (46,586 | ) | |||||||
|
|
|
|
|
|
|
|||||||
| Net income (loss) |
$ | 12,618 | $ | (92,535 | ) | $ | (79,917 | ) | ||||
|
|
|
|
|
|
|
|||||||
| Net income (loss) per common share |
||||||||||||
| Basic |
$ | 0.18 | $ | (1.13 | ) | |||||||
| Diluted |
$ | 0.13 | $ | (1.13 | ) | |||||||
| Weighted-average shares used in calculating net income (loss) per common share (2), (3) |
||||||||||||
| Basic |
70,732,791 | 70,732,791 | ||||||||||
| Diluted |
94,206,677 | 70,732,791 | ||||||||||
| Other comprehensive income (loss): |
||||||||||||
| Foreign currency translation adjustments |
$ | (100 | ) | $ | 156 | $ | 56 | |||||
|
|
|
|
|
|
|
|||||||
| Comprehensive income (loss) |
$ | 12,518 | $ | (92,379 | ) | $ | (79,861 | ) | ||||
|
|
|
|
|
|
|
|||||||
| (1) | In connection with the Restatement, the Company has also reclassified certain amounts in the historical consolidated financial statements to conform to the current presentation. See Note 2, Restatement of Previously Issued Consolidated Financial Statements to the consolidated financial statements included in this Annual Report on Form 10-K, for further information. |
| (2) | Due to the net loss, 15,749,404 common share equivalents, comprised of outstanding stock options, have been excluded from the diluted net loss per common share calculation for the year ended December 31, 2010. |
| (3) | Due to the restatement and resultant loss, shares presented as the restated diluted shares are the basic weighted average shares as the as reported dilutive weighted average shares are anti-dilutive on a restated basis. |
| (4) | Share-based compensation expense of $8,262 and $8,287 is recorded in Cost of services and Selling, general and administrative, respectively, for the year ended December 31, 2010. |
49
Table of Contents
The table below summarizes the effects of the Restatement adjustments on the Consolidated Statement of Cash Flows for the year ended December 31, 2010 (in thousands):
| As reported (1) | Adjustments | As restated | ||||||||||
| (Unaudited) | (Unaudited) | (Unaudited) | ||||||||||
| Operating activities |
||||||||||||
| Net income (loss) |
$ | 12,618 | $ | (92,535 | ) | $ | (79,917 | ) | ||||
| Adjustments to reconcile net income (loss) to net cash provided by operations: |
||||||||||||
| Depreciation and amortization |
6,157 | (2,709 | ) | 3,448 | ||||||||
| Employee share-based compensation |
16,549 | — | 16,549 | |||||||||
| Provision for doubtful receivables |
— | 200 | 200 | |||||||||
| Deferred income taxes |
(3,736 | ) | (57,040 | ) | (60,776 | ) | ||||||
| Excess tax benefit from share-based awards |
(11,910 | ) | — | (11,910 | ) | |||||||
| Changes in operating assets and liabilities: |
||||||||||||
| Accounts receivable |
(26,374 | ) | 23,887 | (2,487 | ) | |||||||
| Prepaid income taxes |
3,939 | 92 | 4,031 | |||||||||
| Other assets |
(1,379 | ) | 1,894 | 515 | ||||||||
| Accounts payable |
18,093 | (16,711 | ) | 1,382 | ||||||||
| Customer liabilities |
10,154 | 138,676 | 148,830 | |||||||||
| Accrued compensation and benefits |
1,210 | (822 | ) | 388 | ||||||||
| Other liabilities |
6,675 | (1,586 | ) | 5,089 | ||||||||
|
|
|
|
|
|
|
|||||||
| Net cash provided by operating activities |
31,996 | (6,654 | ) | 25,342 | ||||||||
|
|
|
|
|
|
|
|||||||
| Investing activities |
||||||||||||
| Purchases of property, equipment, and software |
(15,025 | ) | 5,097 | (9,928 | ) | |||||||
| Proceeds from note receivable |
(1,844 | ) | 1,844 | — | ||||||||
|
|
|
|
|
|
|
|||||||
| Net cash used in investing activities |
(16,869 | ) | 6,941 | (9,928 | ) | |||||||
|
|
|
|
|
|
|
|||||||
| Financing activities |
||||||||||||
| Excess tax benefit from share-based awards |
11,910 | — | 11,910 | |||||||||
| Proceeds from IPO |
83,756 | 38 | 83,794 | |||||||||
| Exercise of vested stock options |
1,253 | — | 1,253 | |||||||||
| Liquidation preference payment |
(866 | ) | — | (866 | ) | |||||||
| Warrant exercises |
934 | — | 934 | |||||||||
| Collection of non-executive employee loans |
79 | — | 79 | |||||||||
|
|
|
|
|
|
|
|||||||
| Net cash provided by financing activities |
97,066 | 38 | 97,104 | |||||||||
|
|
|
|
|
|
|
|||||||
| Effect of exchange rate changes in cash |
(279 | ) | 169 | (110 | ) | |||||||
|
|
|
|
|
|
|
|||||||
| Net increase in cash and cash equivalents |
111,914 | 494 | 112,408 | |||||||||
| Cash and cash equivalents, at beginning of year |
43,659 | — | 43,659 | |||||||||
|
|
|
|
|
|
|
|||||||
| Cash and cash equivalents, at end of year |
$ | 155,573 | 494 | $ | 156,067 | |||||||
|
|
|
|
|
|
|
|||||||
| (1) | In connection with the Restatement, the Company also reclassified certain amounts in the historical consolidated financial statements to conform to the current presentation. See Note 2, Restatement of Previously Issued Consolidated Financial Statements to the consolidated financial statements included in this Annual Report on Form 10-K, for further information. |
50
Table of Contents
The table below summarizes the effects of the Restatement adjustments on the Consolidated Balance Sheet at December 31, 2009 (in thousands):
| As reported (1) | Adjustments | As restated | ||||||||||
| (Unaudited) | (Unaudited) | (Unaudited) | ||||||||||
| Assets |
||||||||||||
| Current assets: |
||||||||||||
| Cash and cash equivalents |
$ | 43,659 | $ | — | $ | 43,659 | ||||||
| Accounts receivable, net |
27,519 | (24,510 | ) | 3,009 | ||||||||
| Prepaid income taxes |
3,465 | — | 3,465 | |||||||||
| Current deferred tax asset |
— | 8,347 | 8,347 | |||||||||
| Other current assets |
3,402 | 4,675 | 8,077 | |||||||||
|
|
|
|
|
|
|
|||||||
| Total current assets |
78,045 | (11,488 | ) | 66,557 | ||||||||
| Property, equipment and software, net |
12,901 | (4,463 | ) | 8,438 | ||||||||
| Non-current deferred tax asset |
7,739 | 76,738 | 84,477 | |||||||||
| Goodwill and other assets, net |
4,779 | (4,194 | ) | 585 | ||||||||
|
|
|
|
|
|
|
|||||||
| Total assets |
$ | 103,464 | $ | 56,593 | $ | 160,057 | ||||||
|
|
|
|
|
|
|
|||||||
| Liabilities and stockholders’ equity (deficit) |
||||||||||||
| Current liabilities: |
||||||||||||
| Accounts payable |
$ | 11,967 | $ | (10,846 | ) | $ | 1,121 | |||||
| Current portion of customer liabilities |
50,352 | 11,056 | 61,408 | |||||||||
| Accrued compensation and benefits |
12,114 | — | 12,114 | |||||||||
| Current deferred tax liability |
4,163 | (4,163 | ) | — | ||||||||
| Other accrued expenses |
3,589 | (63 | ) | 3,526 | ||||||||
|
|
|
|
|
|
|
|||||||
| Total current liabilities |
82,185 | (4,016 | ) | 78,169 | ||||||||
| Non-current portion of customer liabilities |
— | 204,067 | 204,067 | |||||||||
| Other non-current liabilities |
— | 2,675 | 2,675 | |||||||||
|
|
|
|
|
|
|
|||||||
| Total liabilities |
82,185 | 202,726 | 284,911 | |||||||||
|
|
|
|
|
|
|
|||||||
| Commitments and contingencies |
||||||||||||
| Stockholders’ equity (deficit): |
||||||||||||
| Common stock |
95 | — | 95 | |||||||||
| Preferred stock |
13 | — | 13 | |||||||||
| Additional paid-in capital |
51,777 | — | 51,777 | |||||||||
| Non-executive employee loans for stock option exercises |
(120 | ) | — | (120 | ) | |||||||
| Accumulated deficit |
(30,452 | ) | (146,126 | ) | (176,578 | ) | ||||||
| Accumulated other comprehensive loss |
(34 | ) | (7 | ) | (41 | ) | ||||||
|
|
|
|
|
|
|
|||||||
| Total stockholders’ equity (deficit) |
21,279 | (146,133 | ) | (124,854 | ) | |||||||
|
|
|
|
|
|
|
|||||||
| Total liabilities and stockholders’ equity (deficit) |
$ | 103,464 | $ | 56,593 | $ | 160,057 | ||||||
|
|
|
|
|
|
|
|||||||
| (1) | In connection with the Restatement, the Company has also reclassified certain amounts in the historical consolidated financial statements to conform to the current presentation. See Note 2, Restatement of Previously Issued Consolidated Financial Statements to the consolidated financial statements included in this Annual Report on Form 10-K, for further information. |
51
Table of Contents
The table below summarizes the effects of the Restatement adjustments on the Consolidated Statement of Operations and Comprehensive Income (Loss) for the year ended December 31, 2009 (in thousands, except share and per share data):
| As reported (1) | Adjustments | As restated | ||||||||||
| Unaudited | (Unaudited) | (Unaudited) | ||||||||||
| Net services revenue |
$ | 510,192 | $ | (488,147 | ) | $ | 22,045 | |||||
| Operating expenses: |
||||||||||||
| Cost of services (4) |
462,474 | (374,723 | ) | 87,751 | ||||||||
| Selling, general and administrative (4) |
30,153 | 301 | 30,454 | |||||||||
|
|
|
|
|
|
|
|||||||
| Total operating expenses |
492,627 | (374,422 | ) | 118,205 | ||||||||
|
|
|
|
|
|
|
|||||||
| Income (loss) from operations |
17,565 | (113,725 | ) | (96,160 | ) | |||||||
| Net interest expense |
9 | — | 9 | |||||||||
|
|
|
|
|
|
|
|||||||
| Net income (loss) before income tax provision |
17,556 | (113,725 | ) | (96,169 | ) | |||||||
| Provision for income taxes |
2,966 | (89,158 | ) | (86,192 | ) | |||||||
|
|
|
|
|
|
|
|||||||
| Net income (loss) |
$ | 14,590 | $ | (24,567 | ) | $ | (9,977 | ) | ||||
|
|
|
|
|
|
|
|||||||
| Dividends on preferred shares |
(8,044 | ) | — | (8,044 | ) | |||||||
|
|
|
|
|
|
|
|||||||
| Net income (loss) applicable to common shareholders |
$ | 6,546 | $ | (24,567 | ) | $ | (18,021 | ) | ||||
|
|
|
|
|
|
|
|||||||
| Net income (loss) per common share |
||||||||||||
| Basic |
$ | 0.18 | $ | (0.49 | ) | |||||||
| Diluted |
$ | 0.15 | $ | (0.49 | ) | |||||||
| Weighted-average shares used in calculating net income (loss) per common share (2)(3) |
||||||||||||
| Basic |
36,725,194 | 36,725,194 | ||||||||||
| Diluted |
43,955,167 | 36,725,194 | ||||||||||
| Other comprehensive income (loss): |
||||||||||||
| Foreign currency translation adjustments |
188 | 188 | ||||||||||
|
|
|
|
|
|
|
|||||||
| Comprehensive income (loss) |
$ | 14,778 | $ | (24,567 | ) | $ | (9,789 | ) | ||||
|
|
|
|
|
|
|
|||||||
| (1) | In connection with the Restatement, the Company has also reclassified certain amounts in the historical consolidated financial statements to conform to the current presentation. See Note 2, Restatement of Previously Issued Consolidated Financial Statements, to the consolidated financial statements included in this Annual Report on Form 10-K, for further information. |
| (2) | Due to the net loss, 59,173,417 common share equivalents, comprised of convertible preferred shares, warrants, and stock options, have been excluded from the diluted net loss per common share calculation for the year ended December 31, 2009. |
| (3) | Due to the restatement and resultant loss, shares presented as the restated diluted shares are the basic weighted average shares as the as reported dilutive weighted average shares are anti-dilutive on a restated basis. |
| (4) | Share-based compensation expense of $4,064 and $2,853 is recorded in Cost of services and Selling, general and administrative, respectively, for the year ended December 31, 2009. |
52
Table of Contents
The table below summarizes the effects of the Restatement adjustments of the Consolidated Statement of Cash Flows for the year ended December 31, 2009 (in thousands):
| As reported (1) | Adjustments | As restated | ||||||||||
| (Unaudited) | (Unaudited) | (Unaudited) | ||||||||||
| Operating activities |
||||||||||||
| Net income (loss) |
$ | 14,590 | $ | (24,567 | ) | $ | (9,977 | ) | ||||
| Adjustments to reconcile net income (loss) to net cash provided by operations: |
||||||||||||
| Depreciation and amortization |
3,921 | (1,772 | ) | 2,149 | ||||||||
| Employee stock-based compensation |
6,917 | — | 6,917 | |||||||||
| Expense associated with issuance of stock warrants |
4,509 | — | 4,509 | |||||||||
| Deferred income taxes |
(3,552 | ) | (89,273 | ) | (92,825 | ) | ||||||
| Excess tax benefit from share-based awards |
(1,539 | ) | — | (1,539 | ) | |||||||
| Changes in operating assets and liabilities: |
||||||||||||
| Accounts receivable |
(7,313 | ) | 11,036 | 3,723 | ||||||||
| Prepaid income taxes |
(2,206 | ) | 119 | (2,087 | ) | |||||||
| Other assets |
528 | (94 | ) | 434 | ||||||||
| Accounts payable |
(6,113 | ) | 4,214 | (1,899 | ) | |||||||
| Customer liabilities |
3,818 | 97,223 | 101,041 | |||||||||
| Accrued compensation and benefits |
2,960 | — | 2,960 | |||||||||
| Other liabilities |
(1,421 | ) | 216 | (1,205 | ) | |||||||
|
|
|
|
|
|
|
|||||||
| Net cash provided by operating activities |
15,099 | (2,898 | ) | 12,201 | ||||||||
|
|
|
|
|
|
|
|||||||
| Investing activities |
||||||||||||
| Purchases of property, equipment, and software |
(7,862 | ) | 3,769 | (4,093 | ) | |||||||
| Other |
618 | (618 | ) | — | ||||||||
|
|
|
|
|
|
|
|||||||
| Net cash used in investing activities |
(7,244 | ) | 3,151 | (4,093 | ) | |||||||
|
|
|
|
|
|
|
|||||||
| Financing activities |
||||||||||||
| Excess tax benefit from share-based awards |
1,539 | — | 1,539 | |||||||||
| Deferred offering costs |
(2,939 | ) | — | (2,939 | ) | |||||||
| Payment of dividends |
(14,941 | ) | — | (14,941 | ) | |||||||
| Proceeds from issuance of common stock from employee stock option exercise |
214 | — | 214 | |||||||||
| Repurchase of common stock |
(13 | ) | — | (13 | ) | |||||||
| Collection of non-executive employee loans |
143 | — | 143 | |||||||||
|
|
|
|
|
|
|
|||||||
| Net cash provided by financing activities |
(15,997 | ) | — | (15,997 | ) | |||||||
|
|
|
|
|
|
|
|||||||
| Effect of exchange rate changes in cash |
145 | (126 | ) | 19 | ||||||||
|
|
|
|
|
|
|
|||||||
| Net increase in cash and cash equivalents |
(7,997 | ) | 127 | (7,870 | ) | |||||||
| Cash and cash equivalents at beginning of year |
51,656 | (127 | ) | 51,529 | ||||||||
|
|
|
|
|
|
|
|||||||
| Cash and cash equivalents at end of year |
$ | 43,659 | — | $ | 43,659 | |||||||
|
|
|
|
|
|
|
|||||||
| (1) | In connection with the Restatement, the Company has also reclassified certain amounts in the historical consolidated financial statements to conform to the current presentation. See Note 2, Restatement of Previously Issued Consolidated Financial Statements, to the consolidated financial statements included in this Annual Report on Form 10-K, for further information. |
53
Table of Contents
The following is a summary of customer liabilities at December 31, 2010 and 2009 (in thousands) (unaudited):
| December 31, | ||||||||
| 2010 | 2009 | |||||||
| Deferred customer billing, current |
$ | 5,102 | $ | 7,182 | ||||
| Accrued service costs, current |
63,068 | 36,384 | ||||||
| Customer deposits, current |
14,616 | 17,689 | ||||||
| Deferred revenue, current |
156 | 153 | ||||||
|
|
|
|
|
|||||
| Current portion of customer liabilities |
82,942 | 61,408 | ||||||
|
|
|
|
|
|||||
| Deferred customer billing, non-current |
327,816 | 199,958 | ||||||
| Deferred revenue, non-current |
3,545 | 4,109 | ||||||
|
|
|
|
|
|||||
| Non-current portion of customer liabilities |
331,361 | 204,067 | ||||||
|
|
|
|
|
|||||
| Total customer liabilities |
$ | 414,303 | $ | 265,475 | ||||
|
|
|
|
|
|||||
The table below summarizes the effects of the cumulative Restatement adjustments on previously reported net income (loss) for the years ended December 31, 2010 and 2009, with the adjustments categorized by the nature of the error (in thousands) (unaudited):
| December 31, | ||||||||
| 2010 | 2009 | |||||||
| Net income (loss), as reported |
12,618 | 14,590 | ||||||
| Revenue recognition |
||||||||
| RCM service fees |
(146,745 | ) | (110,436 | ) | ||||
| Other revenues |
(178 | ) | (1,420 | ) | ||||
|
|
|
|
|
|||||
| Revenue recognition: |
(146,923 | ) | (111,856 | ) | ||||
| Goodwill, software development and licenses |
(2,120 | ) | (1,772 | ) | ||||
| Other adjustments |
234 | (95 | ) | |||||
| Restatement tax impacts |
56,274 | 89,156 | ||||||
|
|
|
|
|
|||||
| Net impact of adjustments) |
(92,535 | ) | (24,567 | ) | ||||
|
|
|
|
|
|||||
| Net loss, as restated |
(79,917 | ) | (9,977 | ) | ||||
|
|
|
|
|
|||||
The following is the weighted average share information for 2010 and 2009 (in thousands except for share and per share information) (unaudited):
| Shares | Weighted- Average Exercise Price |
Weighted- Average Remaining Contractual Term (in years) |
Aggregate Intrinsic Value (in thousands) |
RSAs | Weighted- Average Grant Date Fair Value |
Weighted- Average Remaining Contractual Term (in years) |
||||||||||||||||||||||
| Outstanding at January 1, 2009 |
8,159,519 | $ | 3.77 | 7.9 | $ | 85,342 | — | $ | — | — | ||||||||||||||||||
| Granted |
2,757,720 | 13.37 | ||||||||||||||||||||||||||
| Exercised |
(121,520 | ) | 1.76 | |||||||||||||||||||||||||
| Cancelled |
(136,220 | ) | 1.33 | |||||||||||||||||||||||||
| Forfeited |
(457,405 | ) | 9.50 | |||||||||||||||||||||||||
|
|
|
|
|
|||||||||||||||||||||||||
| Outstanding at December 31, 2009 |
10,202,094 | 6.16 | 7.5 | 86,074 | — | — | — | |||||||||||||||||||||
| Granted |
6,763,529 | 14.06 | ||||||||||||||||||||||||||
| Exercised |
(550,695 | ) | 2.28 | |||||||||||||||||||||||||
| Cancelled |
(107,904 | ) | 10.93 | |||||||||||||||||||||||||
| Forfeited |
(557,620 | ) | 11.76 | |||||||||||||||||||||||||
|
|
|
|
|
|||||||||||||||||||||||||
| Outstanding at December 31, 2010 |
15,749,404 | 9.45 | 7.5 | 107,120 | — | — | — | |||||||||||||||||||||
|
|
|
|
|
|
|
|
|
|
|
|||||||||||||||||||
54
Table of Contents
Selected Non-GAAP Measures
The following table presents selected non-GAAP measures for each of the periods indicated. See below for an explanation of how we calculate and use these non-GAAP measures, and for a reconciliation of these non-GAAP measures to the most comparable GAAP measures.
| Year End December 31, | ||||||||||||||||||||
| 2013 | 2012 | 2011 | 2010 | 2009 | ||||||||||||||||
| (As restated) | (As restated) | (As restated) | ||||||||||||||||||
| (In thousands) | ||||||||||||||||||||
| Non-GAAP Measures: |
||||||||||||||||||||
| Adjusted EBITDA |
$ | 268,689 | $ | (152,509 | ) | $ | (89,969 | ) | $ | (106,535 | ) | $ | (82,585 | ) | ||||||
|
|
|
|
|
|
|
|
|
|
|
|||||||||||
| Net cash generated from customer contracting activities |
$ | 15,562 | $ | 47,605 | $ | 55,828 | $ | 19,243 | $ | 7,538 | ||||||||||
|
|
|
|
|
|
|
|
|
|
|
|||||||||||
| Gross cash generated from customer contracting activities |
$ | 251,641 | $ | 272,368 | $ | 247,763 | $ | 152,723 | $ | 112,168 | ||||||||||
|
|
|
|
|
|
|
|
|
|
|
|||||||||||
Use of Non-GAAP Financial Information
We typically invoice customers for net operating fees and incentive fees on a quarterly or monthly basis, and typically receive cash from customers on a similar basis. For GAAP reporting purposes, we only recognize these net operating fees and incentive fees as net services revenue to the extent that all the criteria for revenue recognition are met, which is generally upon contract renewal, termination or other contractual agreement event, as defined in Note 3, Summary of Significant Accounting Policies to the consolidated financial statements included in this Annual Report on Form 10-K. As such, net operating and incentive fees are typically recognized for GAAP purposes in periods subsequent to the periods in which the services are provided. Therefore, our net services revenue and other items in our GAAP consolidated financial statements and adjusted EBITDA will typically include the effects of billings and collections from periods prior to the period in which revenue is recognized. See Note 3, Summary of Significant Accounting Policies to the consolidated financial statements for additional information.
In order to provide a more comprehensive understanding of the information used by our management team in financial and operational decision-making, we supplement our GAAP consolidated financial statements with the following non-GAAP financial measures: gross and net cash generated from customer contracting activities, and adjusted EBITDA.
Our Board and management team use these non-GAAP measures as (i) one of the primary methods for planning and forecasting overall expectations and for evaluating actual results against such expectations; and (ii) as a performance evaluation metric in determining achievement of certain executive incentive compensation programs, as well as for incentive compensation plans for employees.
Gross and Net Cash Generated from Customer Contracting Activities
Gross and net cash generated from customer contracting activities reflect the change in the deferred customer billings, relative to GAAP net services revenue, and adjusted EBITDA (defined below), respectively. Deferred customer billings include the portion of both (i) invoiced net operating fees and (ii) cash collections of incentive fees, in each case, that have not met our revenue recognition criteria. Deferred customer billings are included in the detail of our customer liabilities balance in the consolidated balance sheet. Deferred customer billings are reduced by the amounts of revenue recognized when a revenue recognition event occurs. Gross cash generated from customer contracting activities is defined as GAAP net services revenue, plus the change in deferred customer billings. Accordingly, gross cash generated from customer contracting activities is the sum of (i) invoiced net operating fees, (ii) cash collections on incentive fees and (iii) other services fees.
55
Table of Contents
Net cash generated from customer contracting activities is defined as adjusted EBITDA, plus the change in deferred customer billings.
These non-GAAP measures are used throughout this Form 10-K including Item 7, “Management’s Discussion and Analysis of Financial Condition and Results of Operations.”
Gross and net cash generated from customer contracting activities include invoices issued to customers that may remain uncollected or may be subject to credits, and cash collected may be returned to our customers in the form of concessions or other adjustments. Customer concessions and other adjustments have occurred in the past and we cannot determine the likelihood that they will again occur in the future.
Adjusted EBITDA
We define adjusted EBITDA as net income before net interest income (expense), income tax provision, depreciation and amortization expense, share-based compensation, and certain non-recurring items (one-time costs). The use of adjusted EBITDA to measure operating and financial performance is limited by our revenue recognition criteria, pursuant to which GAAP net services revenue is recognized at the end of a contract or other contractual agreement event, as defined in Note 3, Summary of Significant Accounting Policies to the consolidated financial statements included in this Annual Report on Form 10-K. Adjusted EBITDA does not adequately match corresponding cash flows resulting from customer contracting activities. Accordingly, as described above, in order to better compare our cash flows from customer contracting activities to our operating performance, we use additional non-GAAP measures, gross and net cash generated from customer contracting activities. We use adjusted EBITDA in our reconciliation of net cash generated from customer contracting activities to our GAAP consolidated financial statements.
We understand that, although non-GAAP measures are frequently used by investors, securities analysts, and others in their evaluation of companies, these measures have limitations as analytical tools, and you should not consider them in isolation or as a substitute for analysis of our results of operations as reported under GAAP. Some of these limitations are:
| • | Gross and net cash generated from customer contracting activities include invoiced net operating fees, and invoiced as well as collected incentive fees which may be subject to adjustment or concession prior to the end of a contract or other contractual agreement event, as defined in Note 3, Summary of Significant Accounting Policies to the consolidated financial statements included in this Annual Report on Form 10-K; |
| • | Gross and net cash generated from customer contracting activities include progress billings on incentive fees that have been collected for a number of our RCM contracts. These progress billings have, from time-to-time been subject to adjustments, and the fees included in these non-GAAP measures may be subject to adjustments in the future; |
| • | Net cash generated from customer contracting activities and adjusted EBITDA do not reflect changes in, or cash requirements for, our working capital needs; |
| • | Net cash generated from customer contracting activities and adjusted EBITDA do not reflect share-based compensation expense; |
| • | Net cash generated from customer contracting activities and adjusted EBITDA do not reflect income tax expenses or cash requirements to pay taxes; |
| • | Although depreciation and amortization charges are non-cash charges, the assets being depreciated and amortized will often have to be replaced in the future, and net cash generated from customer contracting activities and adjusted EBITDA do not reflect cash requirements for such replacements or other purchase commitments, including lease commitments; and |
| • | Other companies in our industry may calculate gross or net cash generated from customer contracting activities or adjusted EBITDA differently than we do, limiting its usefulness as a comparative measure. |
56
Table of Contents
Reconciliation of GAAP and Non-GAAP Measures: The following table presents a reconciliation of adjusted EBITDA and net cash generated from customer contracting activities to net income (loss), and gross cash generated from customer contracting activities to net services revenue the most comparable GAAP measures, for each of the periods indicated.
| Year End December 31, | ||||||||||||||||||||
| 2013 | 2012 | 2011 | 2010 | 2009 | ||||||||||||||||
| As restated (1) |
As restated (1) |
As restated (1) |
||||||||||||||||||
| ( in thousands) | ||||||||||||||||||||
| Net income (loss) |
$ | 130,083 | $ | (119,740 | ) | $ | (71,745 | ) | $ | (79,917 | ) | $ | (9,977 | ) | ||||||
| Net interest (income) expense |
(330 | ) | (141 | ) | (26 | ) | (29 | ) | 9 | |||||||||||
| Income tax provision (benefit) |
74,349 | (67,995 | ) | (48,246 | ) | (46,586 | ) | (86,192 | ) | |||||||||||
| Depreciation and amortization expense |
6,823 | 6,355 | 4,862 | 3,448 | 2,149 | |||||||||||||||
| Share-based compensation expense (2) |
23,801 | 25,298 | 25,186 | 16,549 | 6,917 | |||||||||||||||
| Stock warrant expense (3) |
— | — | — | — | 4,509 | |||||||||||||||
| Restatement and other costs (3) |
33,963 | 3,714 | — | — | — | |||||||||||||||
|
|
|
|
|
|
|
|
|
|
|
|||||||||||
| Adjusted EBITDA |
268,689 | (152,509 | ) | (89,969 | ) | (106,535 | ) | (82,585 | ) | |||||||||||
| Change in deferred customer billings (4) |
(253,127 | ) | 200,114 | 145,797 | 125,778 | 90,123 | ||||||||||||||
|
|
|
|
|
|
|
|
|
|
|
|||||||||||
| Net cash generated from customer contracting activities |
$ | 15,562 | $ | 47,605 | $ | 55,828 | $ | 19,243 | $ | 7,538 | ||||||||||
|
|
|
|
|
|
|
|
|
|
|
|||||||||||
| Net services revenue (GAAP basis) |
504,768 | 72,254 | 101,966 | 26,945 | 22,045 | |||||||||||||||
| Change in deferred customer billings (4) |
(253,127 | ) | 200,114 | 145,797 | 125,778 | 90,123 | ||||||||||||||
|
|
|
|
|
|
|
|
|
|
|
|||||||||||
| Gross cash generated from customer contracting activities |
$ | 251,641 | $ | 272,368 | $ | 247,763 | $ | 152,723 | $ | 112,168 | ||||||||||
|
|
|
|
|
|
|
|
|
|
|
|||||||||||
| (1) | For adjustments related to 2011, see Note 2, Restatement of Previously Issued Consolidated Financial Statements to the consolidated financial statements included in this Annual Report on Form 10-K. |
| (2) | Share-based compensation expense represents the non-cash expense associated with stock options and restricted shares granted, as reflected in our Consolidated Statements of Operations. See Note 6, Share-Based Compensation, to the consolidated financial statements included in this Annual Report on Form 10-K for the detail of the amounts of share-based compensation expense. |
| (3) | One-time costs are comprised of restatement and other costs. In 2013, we incurred $23.1 million in restatement costs. These costs were incurred to complete this Annual Report on Form 10-K and restate historical consolidated financial statements. We also experienced a reduction in workforce in certain corporate, administrative and management functions. These costs include severance payments, healthcare benefits, and outplacement job training. In 2009, we incurred $4.5 million of expense to settle stock warrants. |
| (4) | Deferred customer billings include the portion of both (i) invoiced net operating fees and (ii) cash collections on incentive fees, in each case, that have not met our revenue recognition criteria. Deferred customer billings are included in the detail of our customer liabilities balance in the consolidated balance sheets. Deferred customer billings are reduced by revenue recognized when revenue recognition occurs. Change in deferred customer billings represents the net change in the cumulative net operating fees and incentive fees that have not met revenue recognition criteria. |
57
Table of Contents
| Item 7. | Management’s Discussion and Analysis of Financial Condition and Results of Operations |
Management’s Discussion and Analysis of Financial Condition and Results of Operations, or MD&A, should be read in conjunction with our consolidated financial statements and the related notes and other financial information included elsewhere in this Annual Report on Form 10-K. Some of the information contained in this discussion and analysis or set forth elsewhere in this Annual Report on Form 10-K, including information with respect to our plans and strategy for our business and related financing, includes forward-looking statements that involve risks and uncertainties. Please review the “Risk Factors” section of this Annual Report on Form 10-K for a discussion of important factors that could cause actual results to differ materially from the results described in or implied by the forward-looking statements contained in the following discussion and analysis.
Restatement of Previously Issued Consolidated Financial Statements
Following an internal analysis of the timing of recognition of revenue of our Revenue Cycle Management contracts, the Audit Committee of our Board of Directors determined on March 4, 2013, based on the recommendation of management and after consultation with our independent registered public accounting firm that we would restate our financial statements and that our financial statements for the years ended December 31, 2009, 2010 and 2011 and the quarterly periods within those years, and for the first three quarterly periods for the year ended December 31, 2012 and any of our other prior financial statements could not be relied upon. We determined that customer billings under our complex performance based revenue cycle management contracts did not meet the fixed or determinable criteria for revenue recognition under GAAP. We made the determination largely due to the fact that the measurement of our incentive fees in any specific period under most of these contracts is dependent upon performance metrics measured from the beginning of the contract through the end of the relevant period, and new information, or changes in facts or circumstances from prior periods, can affect the cumulative amount of fees calculated under these contracts. The initial focus of our Restatement was the timing of revenue recognition; however based on a review of our field operations we later expanded the scope to include the presentation of base fees. We also expanded the scope of our review to include the capitalization of internally developed software, lease agreements and other areas of our operations. An extensive review of our customer contracts, accounting policies, controls and field operations identified information that was not previously considered or not appropriately considered in our revenue recognition accounting previously. This extensive review also provided information to allow us to determine the appropriate application of GAAP accounting for our customer contracts and our business. The Restatement was complex in nature due to the expanded scope, the number of fiscal periods affected, the complexity of our incentive fee calculations under some of our revenue cycle management contracts, and the change in presentation of gross base fees to net operating fees.
As part of the process of completing our Restatement, including an extensive review of our customer contracts and operations, we have adopted and implemented the appropriate GAAP accounting treatment for our business, and we have identified non-GAAP measures to assist in understanding the performance of our business. We have also carried out a number of changes to our senior management, including the hiring of executives with significant additional health care industry experience, and we have added members to our Board of Directors with both health care industry and other relevant experience. Finally, we have also initiated remediation efforts to address the material weaknesses in our control environment that were identified by our management during the Restatement. See “Remediation of Material Weakness in Internal Control Over Financial Reporting” in Item – 9A – Controls and Procedures.
In connection with the Restatement, we evaluated the facts and circumstances that resulted in accounting errors, which included errors related to timing of recognition of revenue, as well as presentation of revenue and cost of services, and also certain capitalized costs for internal use software, goodwill, timing and recording of various accruals, income taxes and other miscellaneous items.
Any material adjustments for periods prior to 2011 have been recorded as adjustments to accumulated deficit as of December 31, 2010, in our consolidated financial statements. Additional information, including the
58
Table of Contents
adjustments required to correct the errors in the consolidated financial statements as a result of completing the Restatement, is described in Note 2, Restatement of Previously Issued Consolidated Financial Statements, in “Part II – Item 8 – Consolidated Financial Statements and Supplementary Data.” Accordingly, this MD&A reflects the effects of the Restatement.
Background
Our goal is to help our healthcare provider customers deliver high-quality care and serve their communities, and do so in a financially sustainable way. We help our customers more efficiently manage their revenue cycle process and strive to help prepare them for the evolving dynamics of the healthcare industry, particularly the challenges and opportunities presented by the shift to value-based reimbursement which is designed to reward the value, rather than the volume, of healthcare services provided.
While we cannot control the changes in the regulatory environment imposed on our customers, we believe that our role becomes increasingly more important to our customers as macroeconomic, regulatory and healthcare industry conditions continue to impose financial pressure on healthcare providers to manage their operations effectively and efficiently.
Revenue Cycle Management, or RCM, continues to be our primary service offering. Our RCM offering helps our customers more efficiently manage their revenue cycle process. This encompasses patient registration, insurance and benefit verification, medical treatment documentation and coding, bill preparation and collections. We focus on optimizing our customers’ entire, end-to-end revenue cycle process, which we believe is more advantageous than alternative approaches that merely focus on certain aspects or sub-processes within the revenue cycle. Physician advisory services complement our RCM offering by strengthening our customer’s compliance with certain third-party payer requirements and limiting denials of claims. For example, our physician advisory services helps customers determine whether to classify a hospital visit as an in-patient or an out-patient observation case for billing purposes. We believe that the population health capabilities we are integrating into our RCM offering will enhance our value-based reimbursement capabilities to help providers enter into risk-bearing arrangements with payers.
We operate our business as a single segment configured with our significant operations and offerings organized around the business of providing end-to-end RCM services to U.S.-based hospitals and other healthcare providers.
Summary of Operations
Through 2011, we experienced strong growth in the number of hospitals with which we had RCM agreements and in gross cash generated from customer contracting activities. We also expanded our physician advisory services offering. To support our growth, we invested in technology, shared service centers, and increased headcount.
In January 2012, the Minnesota Attorney General filed a lawsuit against us alleging violations of federal and Minnesota state health privacy laws and regulations, Minnesota debt collection laws and Minnesota consumer protection laws resulting from, among other matters, the theft in Minnesota in July 2011 of an employee’s unencrypted laptop that contained personal health information, or PHI. In connection with the settlement of the Minnesota litigation, which we reached in July 2012, we voluntarily agreed to cease all remaining business operations in Minnesota. Additionally, we lost certain RCM customers through terminations or expirations, and were not able to grow our RCM business as we had prior to 2012.
In 2012, we generated an increase in gross cash from customer contracting activities in our RCM business, driven by payments from new customers added in 2011 and maturing relationships with preexisting customers, offset in part by customer losses resulting from the Minnesota litigation, non-renewal by a customer due to a
59
Table of Contents
change in control, and a decline in a supplemental service offering that we have since exited. Our physician advisory business continued to grow in 2012. Our cost of services increased in 2012 as we invested in our Information Technology, or IT, capabilities, new shared service center capabilities and back office infrastructure to support future growth. Starting in late 2012, we incurred additional costs associated with compliance and IT investments in response to the Minnesota litigation. We also continued to invest in our population health offering. Despite these challenges, we generated $29.2 million in cash from operating activities for the year ended December 31, 2012, a portion of which was derived from changes in working capital.
In response to the Minnesota litigation, we have implemented and maintained physical, technical and administrative safeguards intended to protect all personal data and have processes in place to assist us in complying with applicable laws and regulations regarding the protection of this data and properly responding to any security incidents or breaches. Additionally, we voluntarily sought, and received, HITRUST Common Security Framework, or CSF, certified status. This status assures that we are meeting the health care industry’s highest standards in managing risk and protecting health information. We believe that achieving this status is vital as electronic health record-sharing expands, and that this designation indicates the care and diligence we take to achieve health information privacy objectives in our day-to-day work.
We continued to experience operating challenges in 2013, with the RCM business posting a decline in cash generated from customer contracting activities due to the full year effect of customer losses in 2012. Although we entered into several customer renewals in 2013, which resulted in the recognition of a significant amount of revenue related to services provided in previous years, these renewals caused downward pressure on our cash generated from customer contracting activities. Our physician advisory business continued to grow through the third quarter of 2013, but was negatively impacted starting in the fourth quarter of 2013 by the two-midnight rule, a regulatory change in the healthcare industry related to billing classifications for certain hospital patients. The revenue and profitability of our physician advisory business continued to be negatively impacted by the two-midnight rule in 2014. In the fourth quarter of 2013, we benefitted from a $14.0 million settlement agreement from one former Minnesota customer. Selling, general, and administrative expenses increased significantly in 2013 due to management changes (discussed in more detail below) which resulted in transition-related expenses, as well as additional accruals for incentive compensation. In the year ended December 31, 2013, we generated cash from operating activities of $54.4 million, substantially all of which was derived from changes in working capital.
In 2013, we focused our efforts on several key strategic and operational imperatives aimed at delivering on our critical customer obligations and continued to expand the depth and breadth of our services. During the year, we took steps to position ourselves to capture growth opportunities in the U.S. healthcare market. These steps included meetings with and solicitation of feedback from our customers, aimed at improving our service execution. In addition, we continue to pursue the following initiatives intended to create value for our customers:
| • | Increasing investment in IT: Developing new proprietary technology and investing in capabilities that enable more seamless integration with our customers’ existing technology. |
| • | Strengthening front-line teams: Improving the capabilities and quality of our workforce in the field through better training and improvements in our hiring and retention processes. |
| • | Simplifying our measurement model: Taking the complexity out of our customer measurement model to improve customer satisfaction. |
We also commenced a series of restructuring measures designed to allow us to more effectively and efficiently allocate necessary resources for innovation, growth and enhanced customer service. Specific changes include optimizing our geographic facilities footprint by transitioning certain functions housed at our headquarters to locations close to our customers or our shared service centers. Additionally, in 2013, we hired Steve Schuckenbrock as President and Chief Executive Officer, Sean Orr as Chief Financial Officer and Treasurer, and Joe Flanagan as Chief Operating Officer, and in 2014, we hired Emad Rizk, M.D. as President and Chief Executive Officer, and Peter Csapo as Chief Financial Officer and Treasurer. Mr. Schuckenbrock continues to serve on our board of directors, and Mr. Orr continues to serve as Senior Vice President, Finance.
60
Table of Contents
We believe these initiatives will position us to help our healthcare provider customers deliver high-quality care and serve their communities, and do so in a financially sustainable way. We expect to be able to grow gross cash generated from contracting activities in the RCM business in 2015 and beyond.
Net Services Revenue
Our primary service offering is our RCM offering, which helps healthcare providers to more efficiently manage their revenue cycles. Revenues from our RCM agreements consist of net operating fees and incentive fees that are primarily performance based and/or contingent fees. The vast majority of our operations relate to our RCM offering, however, the criteria for recognition of revenue for RCM services results in substantial variability in the net services revenue recognized between periods.
Other services revenue is primarily derived from our physician advisory services.
The following table summarizes the composition of our net services revenue for the years ended December 31, 2013, 2012 and 2011:
| Year ended December 31, | ||||||||||||||||||||||||
| 2013 | 2012 | 2011 | ||||||||||||||||||||||
| As restated | ||||||||||||||||||||||||
| RCM services: net operating fees |
$ | 224,937 | 44.6 | % | $ | 9,888 | 13.7 | % | $ | 34,923 | 34.2 | % | ||||||||||||
| RCM services: incentive fees |
210,303 | 41.7 | % | 928 | 1.3 | % | 25,946 | 25.5 | % | |||||||||||||||
| Other services |
69,528 | 13.7 | % | 61,438 | 85.0 | % | 41,097 | 40.3 | % | |||||||||||||||
|
|
|
|
|
|
|
|
|
|
|
|
|
|||||||||||||
| Total net services revenue |
$ | 504,768 | 100.0 | % | $ | 72,254 | 100.0 | % | $ | 101,966 | 100.0 | % | ||||||||||||
|
|
|
|
|
|
|
|
|
|
|
|
|
|||||||||||||
Cost of Services
Our cost of services includes:
| • | Infused management and technology expenses. We incur costs related to our management and staff employees who are devoted to customer operations. These expenses consist primarily of the wages, bonuses, benefits, share-based compensation, travel and other costs associated with deploying our employees to customer sites to guide and manage our customers’ revenue cycle or population health management operations. The employees we deploy to customer sites typically have significant experience in revenue cycle operations, care coordination, technology, quality control or other management disciplines. Included in these expenses is an allocation of the costs associated with maintaining, improving and deploying our integrated proprietary technology suite. |
| • | Shared services center costs. We incur expenses related to salaries and benefits of employees in our shared services centers, as well as non-payroll costs associated with operating our shared services centers. |
| • | Other expenses. We incur expenses related to our employees who manage physician advisory services and other services. These expenses consist primarily of wages, bonuses, benefits, share-based compensation and other costs. |
Selling, General and Administrative Expenses
Selling, general and administrative expenses consist primarily of expenses for executives, sales, corporate IT, legal, regulatory compliance, finance and human resources personnel, professional service fees related to external legal, tax, audit and advisory services, insurance premiums, facility charges, and other corporate expenses.
61
Table of Contents
Restatement and Other Costs
Restatement and other costs include Restatement, reorganization and other costs considered unusual in nature. Restatement-related costs were incurred starting in early 2013, following our determination to restate financial results. We also reduced our workforce in certain corporate, administrative, operations and management functions as part of a reorganization effort beginning in June 2013. Reorganization costs consist of severance payments, healthcare benefits, and outplacement job training. We continued spending on both the Restatement and reorganization in 2014.
Interest Income
Interest income is derived from the return achieved from our cash and cash equivalents.
Income Taxes
Income tax expense consists of federal and state income taxes in the United States and other local taxes in India.
Application of Critical Accounting Policies and Use of Estimates
Our consolidated financial statements reflect the assets, liabilities and results of operations of Accretive Health, Inc. and our wholly-owned subsidiaries. All intercompany transactions and balances have been eliminated in consolidation. Our consolidated financial statements have been prepared in accordance with GAAP.
The preparation of financial statements in conformity with GAAP requires us to make estimates and judgments that affect the amounts reported in our consolidated financial statements and the accompanying notes. We regularly evaluate the accounting policies and estimates we use. In general, we base estimates on historical experience and on assumptions that we believe to be reasonable given our operating environment. Estimates are based on our best knowledge of current events and the actions we may undertake in the future. Although we believe all adjustments considered necessary for fair presentation have been included, our actual results may differ materially from our estimates.
We believe that the accounting policies described below involve our more significant judgments, assumptions and estimates, and therefore, could have the greatest potential impact on our consolidated financial statements. In addition, we believe that a discussion of these policies is necessary to understand and evaluate the consolidated financial statements contained in this Annual Report on Form 10-K. For further information on our critical and other significant accounting policies, see Note 2, Restatement of Previously Issued Consolidated Financial Statements, and Note 3, Summary of Significant Accounting Policies, to the consolidated financial statements included in this Annual Report on Form 10-K.
Revenue Recognition
Revenue is generally recognized when all of the following criteria are met; (i) persuasive evidence of an arrangement exists, (ii) services have been rendered, (iii) the fee is fixed or determinable, and (iv) collectability is reasonably assured. Our primary source of revenue is RCM service fees. We also generate revenue from other fixed fee consulting or transactional fee engagements. Net service fees, as reported in the consolidated statement of operations and comprehensive income (loss), consist of: (a) RCM service fees, and (b) professional service fees earned on a fixed fee, transactional fee, or time and materials basis. RCM service fees are primarily contingent, but along with fixed fees are viewed as one deliverable. To the extent that certain RCM service fees are fixed and not subject to refund, adjustment or concession, these fees are recognized into revenue on a straight-line basis over the term of the contract.
62
Table of Contents
RCM service fees that are contingent in nature are recognized as revenue once all the criteria for revenue recognition are met, which is generally at the end of a contract or other contractual agreement events. Revenue is recognized for RCM service fees upon the contract reaching the end of its stated term (such that the customer relationship will not continue) to the extent that cash has been received for invoiced fees and there are no disputes at the conclusion of the term of the contract.
If fees or services are disputed by a customer at the end of a contract, a settlement agreement entered into with the customer triggers a revenue recognition event. An “other contractual agreement event” occurs when a renewal or amendment to an existing contract is executed in which the parties reach agreement on prior fees. We recognize revenue up to the amount covered by such agreements.
RCM service fees consist of two types of contingent fees: (i) net operating fees and (ii) incentive fees.
Net Operating Fees
We generate net operating fees to the extent that we are able to assist customers in reducing the cost of their revenue cycle operations. Our net operating fees consist of (i) gross base fees invoiced to customers; less (ii) corresponding costs of customers’ revenue cycle operations which we undertake to pay pursuant to our RCM agreements. These costs consist of salaries and benefits associated with personnel in their RCM departments, and related third-party vendor costs, less any cost savings we share with customers.
Net operating fees are recorded in deferred customer billings until we recognize revenue on a customer contract at the end of a contract or upon reaching another contractual agreement event. The amount of unpaid costs of customers’ revenue cycle operations and shared cost savings are reported as accrued service costs within customer liabilities on our consolidated balance sheet.
Incentive Fees
We also generate revenue in the form of performance-based fees when we improve our customers’ revenue yield. These performance metrics vary by customer contract. However, certain contracts contain a contract-to-date performance metric that is not resolved until the end of the term of the contract. In some cases, when a customer agreement is extended under an evergreen provision or other amendment, fees may not be considered finalized until the end of the customer relationship. Incentive fees are considered contingent fees.
Estimates of Cost of Customers’ Revenue Cycle Operations
Cost of customers’ revenue cycle operations consist of invoiced costs from customers and estimated costs not yet invoiced. These costs consist of payroll and third-party non-payroll costs. Customers’ payroll costs are reasonably estimable; however we are significantly dependent upon information generated from our customers’ records to determine the amount of third-party non-payroll costs. Furthermore, because our customers report information on a cash basis, rather than on an accrual basis, we estimate the amount of non-payroll costs incurred but not invoiced in order to properly calculate the deferred customer billings balance of the end of each reporting period. These estimated costs are based on contractually allowable expenses, historical reimbursed costs, and estimated lag in the timing of receipt of information for third-party non-payroll costs. The timing difference includes the lag between the services rendered by third-party vendors and their billings to our customers. The accruals for such costs are included in accrued service costs and are part of the net operating fees included in deferred customer billings within the customer liabilities balance in the consolidated balance sheet. These estimates are based on the best available information and are subject to future adjustments based on additional information received from our customers. Due to the variable nature of these estimates, the adjustments can have a significant impact on the deferred customer billings balance for any reporting period in the future.
63
Table of Contents
Income Taxes
We account for income taxes under the asset and liability method. We record deferred tax assets and liabilities for future income tax consequences that are attributable to differences between the carrying amount of assets and liabilities for financial statement purposes and the income tax bases of such assets and liabilities. We base the measurement of deferred tax assets and liabilities on enacted tax rates that we expect will apply to taxable income in the year we expect to settle or recover those temporary differences. We recognize the effect on deferred income tax assets and liabilities of any change in income tax rates in the period that includes the enactment date.
The carrying values of deferred income tax assets and liabilities reflect the application of our income tax accounting policies, and are based on management’s assumptions and estimates about future operating results and levels of taxable income, and judgments regarding the interpretation of the provisions of current accounting principles. We provide a valuation allowance for deferred tax assets if, based upon the weight of all available evidence, both positive and negative, it is more likely than not that some or all of the deferred tax assets will not be realized. We have established a partial valuation allowance with respect to certain separate state income net operating loss carryforward deferred tax assets.
The estimated effective tax rate for the year is applied to our quarterly operating results. In the event that there is a significant unusual or discrete item recognized, or expected to be recognized, in our quarterly operating results, the tax attributable to that item would be separately calculated and recorded at the same time as the unusual or discrete item, such as the resolution of prior-year tax matters.
We recognize the tax benefit from an uncertain tax position only if it is more likely than not that the position will be sustained on examination by taxing authorities, based on the technical merits of the position. The tax benefits recognized in the consolidated financial statements from such a position are measured based on the largest benefit that has a greater than 50% likelihood of being realized upon ultimate settlement.
Interest and penalties related to income taxes are recognized in our tax provision in the consolidated statement of operations and comprehensive income (loss). See Note 9, Income Taxes, to our consolidated financial statements incorporated into this Annual Report on Form 10-K for additional information on income taxes.
Share-Based Compensation Expense
We determine the expense for all employee share-based compensation awards by estimating their fair value and recognizing that value as an expense, on a ratable basis, in our consolidated financial statements over the requisite service period in which our employees earn the awards. We use the Black-Scholes-Merton option pricing model to determine the grant date fair value of options.
To determine the fair value of a share-based award using the Black-Scholes-Merton option pricing model, we make assumptions regarding the risk-free interest rate, expected future volatility, expected life of the award, and expected forfeitures of the awards. These inputs are subjective and generally require significant analysis and judgment to develop. We aggregate all employees into one pool for valuation purposes. The risk-free rate is based on the U.S. treasury yield curve in effect at the time of grant. We estimate the expected volatility of our share price by reviewing the historical volatility levels of our common stock in conjunction with that of public companies that operate in similar industries or are similar in terms of stage of development or size and then projecting this information toward its future expected volatility. We exercise judgment in selecting these companies, as well as in evaluating the available historical and implied volatility for these companies. We calculate the expected term in years for each stock option using a simplified method based on the average of each option’s vesting term and original contractual term. We apply an estimated forfeiture rate derived from our historical data and our estimates of the likely future actions of option holders when recognizing the share-based compensation expense of the options.
64
Table of Contents
We recognize compensation expense, net of forfeitures, using a straight-line method over the applicable vesting period. Quarterly, the share-based compensation expense is adjusted to reflect all expense for options that vested during the period.
We account for stock options issued to non-employees based on their estimated fair value determined using the Black-Scholes-Merton option pricing model. However, the fair value of the equity awards granted to non-employees is remeasured on each balance sheet date until the awards vest, and the related expense is adjusted based on the resulting change in value, if any. The non-employee share-based compensation expense is recognized over the performance period, which is the vesting period. Upon vesting, the performance of the non-employee is deemed complete and the vested awards are not remeasured subsequently.
The fair value of modifications to share-based awards is generally estimated using the Black-Scholes-Merton option pricing model. If a share-based compensation award is modified after the grant date, incremental compensation expense is recognized in an amount equal to the excess of the fair value of the modified award over the fair value of the original award immediately before the modification. Incremental compensation expense for vested awards is recognized immediately. For unvested awards, the sum of the incremental compensation expense and the remaining unrecognized compensation expense for the original award on the modification date is recognized over the modified service period.
New Accounting Standards
For additional information regarding new accounting guidance, see Note 3, Summary of Significant Accounting Policies, to our consolidated financial statements included in this Annual Report on Form 10-K, which provides a summary of our significant accounting policies and recently adopted accounting standards and disclosures.
65
Table of Contents
Year Ended December 31, 2013 Compared to Year Ended December 31, 2012
The following table provides consolidated operating results and other operating data for the periods indicated:
| Year Ended December 31, | 2013 vs. 2012 Change |
|||||||||||||||
| 2013 | 2012 | Amount | % | |||||||||||||
| (In thousands) | ||||||||||||||||
| Consolidated Statement of Operations Data: |
||||||||||||||||
| RCM service: net operating fees |
$ | 224,937 | $ | 9,888 | $ | 215,049 | n.m. | |||||||||
| RCM service: incentive fees |
210,303 | 928 | 209,375 | n.m. | ||||||||||||
| Other service fees |
69,528 | 61,438 | 8,090 | 13.2 | % | |||||||||||
|
|
|
|
|
|
|
|
|
|||||||||
| Total net services revenue |
504,768 | 72,254 | 432,514 | n.m. | ||||||||||||
| Operating expenses: |
||||||||||||||||
| Cost of services |
186,752 | 188,666 | (1,914 | ) | (1.0 | %) | ||||||||||
| Selling, general and administrative |
79,951 | 67,750 | 12,201 | 18.0 | % | |||||||||||
| Restatement and other costs |
33,963 | 3,714 | 30,249 | n.m. | ||||||||||||
|
|
|
|
|
|
|
|
|
|||||||||
| Total operating expenses |
300,666 | 260,130 | 40,536 | 15.6 | % | |||||||||||
|
|
|
|
|
|
|
|
|
|||||||||
| Income (loss) from operations |
204,102 | (187,876 | ) | 391,978 | n.m. | |||||||||||
| Net interest income |
330 | 141 | 189 | n.m. | ||||||||||||
|
|
|
|
|
|
|
|
|
|||||||||
| Net income (loss) before income tax provision |
204,432 | (187,735 | ) | 392,167 | n.m. | |||||||||||
| Income tax provision (benefit) |
74,349 | (67,995 | ) | 142,344 | n.m. | |||||||||||
|
|
|
|
|
|
|
|
|
|||||||||
| Net income (loss) |
130,083 | (119,740 | ) | 249,823 | n.m. | |||||||||||
| Net interest income |
(330 | ) | (141 | ) | (189 | ) | n.m. | |||||||||
| Income tax provision (benefit) |
74,349 | (67,995 | ) | 142,344 | n.m. | |||||||||||
| Depreciation and amortization expense |
6,823 | 6,355 | 468 | 7.4 | % | |||||||||||
| Share-based compensation expense |
23,801 | 25,298 | (1,497 | ) | (5.9 | %) | ||||||||||
| Restatement and other costs |
33,963 | 3,714 | 30,249 | n.m. | ||||||||||||
|
|
|
|
|
|
|
|
|
|||||||||
| Adjusted EBITDA |
268,689 | (152,509 | ) | 421,198 | n.m. | |||||||||||
| Change in deferred customer billings |
(253,127 | ) | 200,114 | (453,241 | ) | n.m. | ||||||||||
|
|
|
|
|
|
|
|
|
|||||||||
| Net cash generated from customer contracting activities |
$ | 15,562 | $ | 47,605 | $ | (32,043 | ) | (67.3 | %) | |||||||
|
|
|
|
|
|
|
|
|
|||||||||
| Net service revenue |
$ | 504,768 | $ | 72,254 | $ | 432,514 | n.m. | |||||||||
| Change in deferred customer billings |
(253,127 | ) | 200,114 | (453,241 | ) | n.m. | ||||||||||
|
|
|
|
|
|
|
|
|
|||||||||
| Gross cash generated from customer contracting activities |
$ | 251,641 | $ | 272,368 | $ | (20,727 | ) | (7.6 | %) | |||||||
|
|
|
|
|
|
|
|
|
|||||||||
| Components of Gross Cash Generated from Customer Contracting Activities: |
|
|||||||||||||||
| RCM service: net operating fee |
$ | 106,453 | $ | 118,030 | $ | (11,577 | ) | (9.8 | %) | |||||||
| RCM service: incentive fee |
75,660 | 92,900 | (17,240 | ) | (18.6 | %) | ||||||||||
|
|
|
|
|
|
|
|
|
|||||||||
| Total RCM service fees |
182,113 | 210,930 | (28,817 | ) | (13.7 | %) | ||||||||||
| Other service fees |
69,528 | 61,438 | 8,090 | 13.2 | % | |||||||||||
|
|
|
|
|
|
|
|
|
|||||||||
| Gross cash generated from customer contracting activities |
$ | 251,641 | $ | 272,368 | $ | (20,727 | ) | (7.6 | %) | |||||||
|
|
|
|
|
|
|
|
|
|||||||||
n.m.—Not meaningful
66
Table of Contents
Net Services Revenue
Net services revenue increased to $504.8 million for the year ended December 31, 2013, from $72.3 million for the year ended December 31, 2012. The $432.5 million increase was primarily driven by our Ascension Health RCM contractual agreement event in the quarter ended June 30, 2013, resulting in revenue recognition of $360.5 million, and $35.0 million in net service revenue attributable to other customer contractual agreement events. RCM service fees increased by $28.9 million as a result of revenue recognized in the quarter ended December 31, 2013, after reaching a settlement agreement with a former Minnesota customer. Other service fees increased by $8.1 million in 2013 as compared to 2012, driven by an $11 million increase which included an $8.2 million contribution from the settlement of a population health contract in the quarter ended December 31, 2013. This increase was partially offset by a decrease in physician advisory services revenue of approximately $2.9 million in the year ended December 31, 2013, as compared to the year ended December 31, 2012, resulting from the impact of the two-midnight rule, a regulatory change in the healthcare industry related to billing classifications for certain hospital patients. Physician advisory services revenue and profitability continue to be negatively impacted in 2014 by the two-midnight rule.
Gross Cash Generated from Customer Contracting Activities (Non-GAAP)
Gross cash generated from customer contracting activities totaled $251.6 million for 2013 compared to $272.4 million for 2012, a decrease of $20.7 million. The decrease in gross cash generated from customer contracting activities was primarily a result of credits of $20.1 million given to customers affiliated with Ascension Health during 2013 in accordance with the terms of the new agreements entered into with such customers. Gross cash generated from customer contracting activities is a non-GAAP measure. Please see “Selected Non-GAAP Measures” in “Part II – Item 6 – Selected Consolidated Financial Statements” for an explanation of how we calculate and use gross cash generated from customer contracting activities and for its reconciliation to net services revenue, the most comparable GAAP measure.
Cost of Services
Total cost of services decreased by $1.9 million, or 1.0%, from $188.7 million for the year ended December 31, 2012, to $186.8 million for the year ended December 31, 2013. The decrease in cost of services was primarily a result of lower cost of services in the population health business.
Selling, General and Administrative Expenses
Selling, general, and administrative expenses increased by $12.2 million, or 18.0%, to $80.0 million for the year ended December 31, 2013, from the year ended December 31, 2012. The $12.2 million increase was primarily due to our senior management transition costs, increased investment spending in IT, internal audit and compliance areas and short term incentive compensation costs.
Net Cash Generated from Customer Contracting Activities (Non-GAAP)
The net cash generated from customer contracting activities totaled $15.6 million in 2013 compared to a generation of $47.6 million in cash for 2012. This change of $32.0 million was primarily due to lower gross cash generated by $20.7 million and increased SG&A expenses by $12.2 million, as described above. Net cash generated from customer contracting activities is a non-GAAP measure. Please see “Selected Non-GAAP Measures” in “Part II – Item 6 – Selected Consolidated Financial Statements” for an explanation of how we calculate and use net cash generated from customer contracting activities and for its reconciliation to net income (loss), the most comparable GAAP measure.
67
Table of Contents
Restatement and other Costs
Restatement and other costs amounted to $34.0 million for the year ended December 31, 2013, compared to $3.7 million for the year ended December 31, 2012. The increase was primarily driven by Restatement related costs of $23.1 million, $3.3 million of litigation-related costs, and reorganization related costs of $5.2 million. These costs are considered unusual in nature by management and are reported separately under the caption “Restatement and other” in the accompanying consolidated statement of operations and comprehensive income (loss). We continue to experience substantial costs in 2014 related to Restatement and reorganizing activities. There were no similar costs for Restatement and other costs recorded in the years ended December 31 2011, 2010 or 2009.
Income Taxes
Tax expense increased by $142.3 million, to $74.3 million for the year ended December 31, 2013, from a $68.0 million tax benefit for the year ended December 31, 2012. The increase was attributable to our revenue recognition event for affiliates of Ascension Health (see above). Our effective tax rate for the years ended December 31, 2013 and 2012 was approximately 36% of our pre-tax income (loss).
Three Months Ended September 30, 2013 Compared to Three Months Ended September 30, 2012
The following table sets forth consolidated operating results and other operating data for the periods indicated:
| Three Months Ended September 30, | 2013 vs. 2012 Change | |||||||||||||||
| 2013 | 2012 | Amount | % | |||||||||||||
| As restated | ||||||||||||||||
| (In thousands) | ||||||||||||||||
| Consolidated Statement of Operations Data: |
||||||||||||||||
| RCM service: net operating fees |
$ | 792 | $ | 1,091 | $ | (299 | ) | (27.4 | %) | |||||||
| RCM service: incentive fees |
— | — | — | — | ||||||||||||
| Other service fees |
17,550 | 15,031 | 2,519 | 16.8 | % | |||||||||||
|
|
|
|
|
|
|
|
|
|||||||||
| Total net services revenue |
18,342 | 16,122 | 2,220 | 13.8 | % | |||||||||||
| Operating expenses: |
||||||||||||||||
| Cost of services |
47,544 | 44,948 | 2,596 | 5.8 | % | |||||||||||
| Selling, general and administrative |
22,562 | 17,718 | 4,844 | 27.3 | % | |||||||||||
| Restatement and other costs |
9,182 | 1,343 | 7,839 | n.m. | ||||||||||||
|
|
|
|
|
|
|
|
|
|||||||||
| Total operating expenses |
79,288 | 64,009 | 15,279 | 23.9 | % | |||||||||||
|
|
|
|
|
|
|
|
|
|||||||||
| Loss from operations |
(60,946 | ) | (47,887 | ) | (13,059 | ) | (27.3 | %) | ||||||||
| Net interest income |
47 | 35 | 12 | 34.3 | % | |||||||||||
|
|
|
|
|
|
|
|
|
|||||||||
| Loss before income tax provision benefit |
(60,899 | ) | (47,852 | ) | (13,047 | ) | (27.3 | %) | ||||||||
| Income tax benefit |
(23,328 | ) | (16,447 | ) | (6,881 | ) | (41.8 | %) | ||||||||
|
|
|
|
|
|
|
|
|
|||||||||
| Net Loss |
$ | (37,571 | ) | $ | (31,405 | ) | $ | (6,166 | ) | (19.6 | %) | |||||
|
|
|
|
|
|
|
|
|
|||||||||
n.m.—Not meaningful
68
Table of Contents
Reconciliation of GAAP and Non-GAAP Measures: The following table presents a reconciliation of adjusted EBITDA and gross and net cash generated from customer contracting activities to net loss, the most comparable GAAP measure, for each of the periods indicated.
| Three Months Ended September 30, | 2013 vs. 2012 Change | |||||||||||||||
| 2013 | 2012 | Amount | % | |||||||||||||
| As restated | ||||||||||||||||
| (In thousands) | ||||||||||||||||
| Net Loss |
$ | (37,571 | ) | $ | (31,405 | ) | $ | (6,166 | ) | (19.6 | %) | |||||
| Net interest income |
(47 | ) | (35 | ) | (12 | ) | (34.3 | %) | ||||||||
| Income tax benefit |
(23,328 | ) | (16,447 | ) | (6,881 | ) | (41.8 | %) | ||||||||
| Depreciation and amortization expense |
1,709 | 1,748 | (39 | ) | (2.2 | %) | ||||||||||
| Share-based compensation expense |
5,576 | 5,737 | (161 | ) | (2.8 | %) | ||||||||||
| Restatement and other costs |
9,182 | 1,343 | 7,839 | n.m. | ||||||||||||
|
|
|
|
|
|
|
|
|
|||||||||
| Adjusted EBITDA |
(44,479 | ) | (39,059 | ) | (5,420 | ) | (13.9 | %) | ||||||||
| Change in deferred customer billings |
37,800 | 53,804 | (16,004 | ) | (29.7 | %) | ||||||||||
|
|
|
|
|
|
|
|
|
|||||||||
| Net cash generated from customer contracting activities |
$ | (6,679 | ) | $ | 14,745 | $ | (21,424 | ) | n.m. | |||||||
|
|
|
|
|
|
|
|
|
|||||||||
| Net service revenue |
$ | 18,342 | $ | 16,122 | $ | 2,220 | 13.8 | % | ||||||||
| Change in deferred customer billings |
37,800 | 53,804 | (16,004 | ) | (29.7 | %) | ||||||||||
|
|
|
|
|
|
|
|
|
|||||||||
| Gross cash generated from customer contracting activities |
$ | 56,142 | $ | 69,926 | $ | (13,784 | ) | (19.7 | %) | |||||||
|
|
|
|
|
|
|
|
|
|||||||||
| Components of Gross Cash Generated from Customer Contracting Activities: |
|
|||||||||||||||
| RCM service: net operating fee |
$ | 28,105 | $ | 27,462 | $ | 643 | 2.3 | % | ||||||||
| RCM service: incentive fee |
10,487 | 27,433 | (16,946 | ) | (61.8 | %) | ||||||||||
|
|
|
|
|
|
|
|
|
|||||||||
| Total RCM service fees |
38,592 | 54,895 | (16,303 | ) | (29.7 | %) | ||||||||||
| Other service fees |
17,550 | 15,031 | 2,519 | 16.8 | % | |||||||||||
|
|
|
|
|
|
|
|
|
|||||||||
| Gross cash generated from customer contracting activities |
$ | 56,142 | $ | 69,926 | $ | (13,784 | ) | (19.7 | %) | |||||||
|
|
|
|
|
|
|
|
|
|||||||||
n.m.—Not meaningful
Net Services Revenue
Net services revenue increased by $2.2 million, or 13.8%, to $18.3 million for the three months ended September 30, 2013, from $16.1 million for the three months ended September 30, 2012. The increase was primarily attributable to other service fees, which increased by $2.5 million to $17.6 million for the three months ended September 30, 2013, due to growth in physician advisory service fees and other services.
Gross Cash Generated from Customer Contracting Activities (Non-GAAP)
Gross cash generated from customer contracting activities decreased by $13.8 million for the three months ended September 30, 2013, compared with the same period in 2012. The decrease was primarily due to lower cash received from certain RCM customers. Gross cash generated from customer contracting activities is a non-GAAP measure. Please see “Selected Non-GAAP Measures” in “Part II – Item 6 – Selected Consolidated Financial Statements” for an explanation of how we calculate and use gross cash generated from customer contracting activities and please see above for its reconciliation to net services revenue, the most comparable GAAP measure.
Cost of Services
Our cost of services increased by $2.6 million, or 5.8%, to $47.5 million for the three months ended September 30, 2013, from $44.9 million for the three months ended September 30, 2012. This increase in cost of services was primarily attributable to increased infused management expenses of approximately $2.2 million in RCM, and a $1.0 million increase in cost of services for physician advisory services.
69
Table of Contents
Selling, General and Administrative Expenses
Selling, general, and administrative expenses increased by $4.8 million or 27.3% to $22.6 million for the three months ended September 30, 2013, from $17.7 million for the three months ended September 30, 2012. This increase was primarily driven by increases in expenses associated with our management transition, salaries, benefits and incentive compensation accruals.
Net Cash Generated from Customer Contracting Activities (Non-GAAP)
The net cash generated from customer contracting activities totaled a use of $6.7 million for the three months ended September 30, 2013, compared to $14.7 million generated for the three months ended September 30, 2012. The reduction of $21.4 million in net cash generation from customer contracting activities is primarily due to lower gross cash generated from customer contracting activities, increased cost of services, and increased selling, general, and administrative expenses. Please see “Selected Non-GAAP Measures” in “Part II – Item 6 – Selected Consolidated Financial Statements” for an explanation of how we calculate and use net cash generated from customer contracting activities and for its reconciliation to net income (loss), the most comparable GAAP measure.
Restatement and other costs
Restatement and other costs amounted to $9.2 million for the three months ended September 30, 2013, compared to $1.3 million for the three months ended September 30, 2012. The increase was driven by Restatement related expenses of $7.8 million.
Income Taxes
Our income tax benefit increased by $6.9 million, to $23.3 million for the three months ended September 30, 2013, from $16.4 million for three months ended September 30, 2012. Our effective tax rate for the three months ended September 30, 2013 and 2012 were approximately 38% and 34% respectively. Our tax rate is affected by recurring items, permanent differences and state income taxes. It is also affected by discrete items that may occur in any given year, but are not consistent from year to year.
Three Months Ended June 30, 2013 Compared to Three Months Ended June 30, 2012
The following table sets forth consolidated operating results and other operating data for the periods indicated:
| Three Months Ended June 30, | 2013 vs. 2012 | Change | ||||||||||||||
| 2013 | 2012 | Amount | % | |||||||||||||
| As restated | ||||||||||||||||
| (In thousands) | ||||||||||||||||
| Consolidated Statement of Operations Data: |
||||||||||||||||
| RCM service: net operating fees |
$ | 181,503 | $ | 1,615 | $ | 179,888 | n.m. | |||||||||
| RCM service: incentive fees |
176,366 | — | 176,366 | — | ||||||||||||
| Other service fees |
16,539 | 14,659 | 1,880 | 12.8 | % | |||||||||||
|
|
|
|
|
|
|
|
|
|||||||||
| Total net services revenue |
374,408 | 16,274 | 358,134 | n.m. | ||||||||||||
| Operating expenses: |
||||||||||||||||
| Cost of services |
49,926 | 49,387 | 539 | 1.1 | % | |||||||||||
| Selling, general and administrative |
18,675 | 15,424 | 3,251 | 21.1 | % | |||||||||||
| Restatement and other costs |
8,253 | 588 | 7,665 | n.m. | ||||||||||||
|
|
|
|
|
|
|
|
|
|||||||||
| Total operating expenses |
76,854 | 65,399 | 11,455 | 17.5 | % | |||||||||||
|
|
|
|
|
|
|
|
|
|||||||||
| Income (loss) from operations |
297,554 | (49,125 | ) | 346,679 | n.m. | |||||||||||
| Net interest income |
57 | 20 | 37 | n.m. | ||||||||||||
|
|
|
|
|
|
|
|
|
|||||||||
| Net income (loss) before income tax provision |
297,611 | (49,105 | ) | 346,716 | n.m. | |||||||||||
| Income tax provision (benefit) |
109,878 | (17,734 | ) | 127,612 | n.m. | |||||||||||
|
|
|
|
|
|
|
|
|
|||||||||
| Net income (loss) |
$ | 187,733 | $ | (31,371 | ) | $ | 219,104 | n.m. | ||||||||
|
|
|
|
|
|
|
|
|
|||||||||
n.m.—Not meaningful
70
Table of Contents
Reconciliation of GAAP and Non-GAAP Measures: The following table presents a reconciliation of adjusted EBITDA and gross and net cash generated from customer contracting activities to net income (loss), the most comparable GAAP measure, for each of the periods indicated.
| Three Months Ended June 30, | 2013 vs. 2012 Change | |||||||||||||||
| 2013 | 2012 | Amount | % | |||||||||||||
| As restated | ||||||||||||||||
| (In thousands) | ||||||||||||||||
| Net income (loss) |
$ | 187,733 | $ | (31,371 | ) | $ | 219,104 | n.m. | ||||||||
| Net interest income |
(57 | ) | (20 | ) | (37 | ) | n.m. | |||||||||
| Income tax provision (benefit) |
109,878 | (17,734 | ) | 127,612 | n.m. | |||||||||||
| Depreciation and amortization expense |
1,771 | 1,430 | 341 | 23.8 | % | |||||||||||
| Share-based compensation expense |
5,876 | 5,406 | 470 | 8.7 | % | |||||||||||
| Restatement and other costs |
8,253 | 588 | 7,665 | n.m. | ||||||||||||
|
|
|
|
|
|
|
|
|
|||||||||
| Adjusted EBITDA |
313,454 | (41,701 | ) | 355,155 | n.m. | |||||||||||
| Change in deferred customer billings |
(324,930 | ) | 48,662 | (373,592 | ) | n.m. | ||||||||||
|
|
|
|
|
|
|
|
|
|||||||||
| Net cash generated from customer contracting activities |
$ | (11,476 | ) | $ | 6,961 | $ | (18,437 | ) | n.m. | |||||||
|
|
|
|
|
|
|
|
|
|||||||||
| Net service revenue |
$ | 374,408 | $ | 16,274 | $ | 358,134 | n.m. | |||||||||
| Change in deferred customer billings |
(324,930 | ) | 48,662 | (373,592 | ) | n.m. | ||||||||||
|
|
|
|
|
|
|
|
|
|||||||||
| Gross cash generated from customer contracting activities |
$ | 49,478 | $ | 64,936 | $ | (15,458 | ) | (23.8 | %) | |||||||
|
|
|
|
|
|
|
|
|
|||||||||
| Components of Gross Cash Generated from Customer Contracting Activities: |
|
|||||||||||||||
| RCM service: net operating fee |
$ | 19,984 | $ | 29,645 | $ | (9,661 | ) | (32.6 | %) | |||||||
| RCM service: incentive fee |
12,955 | 20,632 | (7,677 | ) | (37.2 | %) | ||||||||||
|
|
|
|
|
|
|
|
|
|||||||||
| Total RCM service fees |
32,939 | 50,277 | (17,338 | ) | (34.5 | %) | ||||||||||
| Other service fees |
16,539 | 14,659 | 1,880 | 12.8 | % | |||||||||||
|
|
|
|
|
|
|
|
|
|||||||||
| Gross cash generated from customer contracting activities |
$ | 49,478 | $ | 64,936 | $ | (15,458 | ) | (23.8 | %) | |||||||
|
|
|
|
|
|
|
|
|
|||||||||
n.m.—Not meaningful
Net Services Revenue
Net services revenue increased to $374.4 million for the three months ended June 30, 2013, from $16.3 million for the three months ended June 30, 2012. The increase was primarily attributable to RCM customers affiliated with Ascension Health that reached a contractual agreement event in the three months ended June 30, 2013, resulting in revenue recognition of $361.4 million.
Gross Cash Generated from Customer Contracting Activities (Non-GAAP)
Gross cash generated from customer contracting activities decreased $15.5 million for the three months ended June 30, 2013, compared to the same period in 2012. The decrease was attributable to our RCM operations, primarily as a result of credits of $15.1 million given to customers affiliated with Ascension Health in accordance with the terms of the new agreements entered into with such customers. This decrease in total gross cash generated from customer contracting activities was partly offset by a $1.6 million increase in cash generated in the physician advisory business. Gross cash generated from customer contracting activities is a non-GAAP measure. Please see “Selected Non-GAAP Measures” in “Part II – Item 6 – Selected Consolidated Financial Statements” for an explanation of how we calculate and use gross cash generated from customer contracting activities and please see above for its reconciliation to net services revenue, the most comparable GAAP measure.
71
Table of Contents
Cost of Service
Cost of services increased by $0.5 million, or 1.1%, to $49.9 million for the three months ended June 30, 2013, from $49.4 million for the three months ended June 30, 2012. The increase was primarily driven by increased infused management expenses related to RCM services.
Selling, General and Administrative Expenses
Selling, general, and administrative expenses increased by $3.3 million, or 21.1%, to $18.7 million for the three months ended June 30, 2013, from $15.4 million for the three months ended June 30, 2012. This increase was primarily related to increases in expenses associated with our management transition, salaries, benefits and incentive compensation accruals.
Net Cash Generated from Customer Contracting Activities (Non-GAAP)
The net cash generated from customer contracting activities totaled a use of $11.5 million for the three months ended June 30, 2013, compared with $7.0 million generated for the three months ended June 30, 2012. The decrease of $18.4 million in net cash generation from customer contracting activities is primarily due to lower gross cash generated from customer contracting activities and increased selling, general and administrative expenses. Please see “Selected Non-GAAP Measures” in “Part II – Item 6 – Selected Consolidated Financial Statements” for an explanation of how we calculate and use net cash generated from customer contracting activities and for its reconciliation to net income (loss), the most comparable GAAP measure.
Restatement and Other Costs
Restatement and other costs amounted to $8.3 million for the three months ended June 30, 2013, compared with $0.6 million for the three months ended June 30, 2012. The increase was driven by restatement related cost of $4.4 million and reorganization costs of $3.2 million consisting primarily of severance, modified stock based compensation and related type costs.
Income Taxes
Income tax expense increased by $127.6 million, to $109.9 million for the three months ended June 30, 2013, from a benefit of $17.7 million for the three months ended June 30, 2012. Our effective tax rate for the three months ended June 30, 2013 and 2012 were approximately 37% and 36%, respectively. Our tax rate is affected by recurring items, permanent differences and state income taxes. It is also affected by discrete items that may occur in any given year, but are not consistent from year to year.
72
Table of Contents
Three Months Ended March 31, 2013 Compared to Three Months Ended March 31, 2012
The following table sets forth consolidated operating results and other operating data for the periods indicated:
| Three Months Ended March 31, |
2013 vs. 2012 Change | |||||||||||||||
| 2013 | 2012 | Amount | % | |||||||||||||
| As restated | ||||||||||||||||
| (In thousands) | ||||||||||||||||
| Consolidated Statement of Operations Data: |
||||||||||||||||
| RCM service: net operating fees |
$ | 10,421 | $ | 5,383 | $ | 5,038 | 93.6 | % | ||||||||
| RCM service: incentive fees |
1,544 | — | 1,544 | — | ||||||||||||
| Other service fees |
16,192 | 15,711 | 481 | 3.1 | % | |||||||||||
|
|
|
|
|
|
|
|
|
|||||||||
| Total net services revenue |
28,157 | 21,094 | 7,063 | 33.5 | % | |||||||||||
| Operating expenses: |
||||||||||||||||
| Cost of services |
47,533 | 47,318 | 215 | 0.5 | % | |||||||||||
| Selling, general and administrative |
22,057 | 17,772 | 4,285 | 24.1 | % | |||||||||||
| Restatement and other costs |
1,031 | — | 1,031 | — | ||||||||||||
|
|
|
|
|
|
|
|
|
|||||||||
| Total operating expenses |
70,621 | 65,090 | 5,531 | 8.5 | % | |||||||||||
|
|
|
|
|
|
|
|
|
|||||||||
| Loss from operations |
(42,464 | ) | (43,996 | ) | 1,532 | 3.5 | % | |||||||||
| Net interest income |
61 | 22 | 39 | n.m. | ||||||||||||
|
|
|
|
|
|
|
|
|
|||||||||
| Loss before income tax benefit |
(42,403 | ) | (43,974 | ) | 1,571 | 3.6 | % | |||||||||
| Income tax benefit |
(15,938 | ) | (15,921 | ) | (17 | ) | (0.1 | %) | ||||||||
|
|
|
|
|
|
|
|
|
|||||||||
| Net loss |
$ |
(26,465 |
) |
$ |
(28,053 |
) |
$
|
1,588
|
|
|
5.7 |
% | ||||
|
|
|
|
|
|
|
|
|
|||||||||
n.m.—Not meaningful
Reconciliation of GAAP and Non-GAAP Measures: The following table presents a reconciliation of adjusted EBITDA and gross and net cash generated from customer contracting activities to net loss, the most comparable GAAP measure, for each of the periods indicated.
| Three Months Ended March 31, |
2013 vs. 2012 Change | |||||||||||||||
| 2013 | 2012 | Amount | % | |||||||||||||
| As restated | ||||||||||||||||
| (In thousands) | ||||||||||||||||
| Net Loss |
$ |
(26,465 |
) |
$ |
(28,053 |
) |
$
|
1,588
|
|
|
5.7 |
% | ||||
| Net interest income |
|
(61 |
) |
|
(22 |
) |
|
(39 |
) |
|
n.m. |
| ||||
| Income tax benefit |
(15,938 | ) | (15,921 | ) | (17 | ) | (0.1 | %) | ||||||||
| Depreciation and amortization expense |
1,751 | 1,488 | 263 | 17.7 | % | |||||||||||
| Share-based compensation expense |
6,532 | 7,913 | (1,381 | ) | (17.5 | %) | ||||||||||
| Restatement and other costs |
1,031 | — | 1,031 | |
— |
| ||||||||||
|
|
|
|
|
|
|
|
|
|||||||||
| Adjusted EBITDA |
(33,150 | ) | (34,595 | ) | 1,445 | 4.2 | % | |||||||||
| Change in deferred customer billings |
|
30,792 |
|
|
36,252 |
|
|
(5,460 |
) |
|
(15.1 |
%) | ||||
|
|
|
|
|
|
|
|
|
|||||||||
| Net cash generated from customer contracting activities |
$ | (2,358 | ) | $ | 1,657 | $ | (4,015 | ) | |
n.m. |
| |||||
|
|
|
|
|
|
|
|
|
|||||||||
| Net service revenue |
$ | 28,157 | $ | 21,094 | $ | 7,063 | 33.5 | % | ||||||||
| Change in deferred customer billings |
30,792 | 36,252 | (5,460 | ) | (15.1 | %) | ||||||||||
|
|
|
|
|
|
|
|
|
|||||||||
| Gross cash generated from customer contracting activities |
$ | 58,949 | $ | 57,346 | $ | 1,603 | 2.8 | % | ||||||||
|
|
|
|
|
|
|
|
|
|||||||||
| Components of Gross Cash Generated from Customer Contracting Activities: |
|
|||||||||||||||
| RCM service: net operating fee |
$ | 29,529 | $ | 31,123 | $ | (1,594 | ) | (5.1 | %) | |||||||
| RCM service: incentive fee |
13,228 | 10,512 | 2,716 | 25.8 | % | |||||||||||
|
|
|
|
|
|
|
|
|
|||||||||
| Total RCM service fees |
42,757 | 41,635 | 1,122 | 2.7 | % | |||||||||||
| Other service fees |
|
16,192 |
|
|
15,711 |
|
|
481 |
|
|
3.1 |
% | ||||
|
|
|
|
|
|
|
|
|
|||||||||
| Gross cash generated from customer contracting activities |
$ | 58,949 | $ | 57,346 | $ | 1,603 | 2.8 | % | ||||||||
|
|
|
|
|
|
|
|
|
|||||||||
n.m.—Not meaningful
73
Table of Contents
Net Services Revenue
Net services revenue increased by $7.1 million, or 33.5%, to $28.2 million for the three months ended March 31, 2013, from $21.1 million for the three months ended March 31, 2012. The increase was primarily attributable to revenue recognized of $6.5 million as a result of reaching the end of a customer contract in the three months ended March 31, 2013.
Gross Cash Generated from Customer Contracting Activities (Non-GAAP)
Gross cash generated from customer contracting activities increased by $1.6 million for the three months ended March 31, 2013 as a result of an increase in cash received from certain RCM customers. Gross cash generated from customer contracting activities is a non-GAAP measure. Please see “Selected Non-GAAP Measures” for an explanation of how we calculate and use gross cash generated from customer contracting activities and please see above for its reconciliation to net services revenue, the most comparable GAAP measure.
Cost of Services
Cost of services increased by $0.2 million, or 0.5%, to $47.5 million for the three months ended March 31, 2013, from $47.3 million for the three months ended March 31, 2012. This increase was primarily driven by infused management expenses related to RCM services.
Selling, General and Administrative Expenses
Selling, general, and administrative expenses increased by $4.3 million, or 24.1%, to $22.1 million for the three months ended March 31, 2013, from $17.8 million for the three months ended March 31, 2012. This increase was primarily related to increases in salaries, benefits and incentive compensation accruals.
Net Cash Generated from Customer Contracting Activities (Non-GAAP)
The net cash generated from customer contracting activities totaled a use of $2.4 million for the three months ended March 31, 2013, compared with $1.7 million in net cash generation for the three months ended March 31, 2012. The decrease of $4.0 million in net cash generation from customer contracting activities is primarily due to increased selling, general and administrative expenses, partially offset by increased gross cash generated from customer contracting activities. Please see “Selected Non-GAAP Measures” in “Part II – Item 6 – Selected Consolidated Financial Statements” for an explanation of how we calculate and use net cash generated from customer contracting activities and for its reconciliation to net income (loss), the most comparable GAAP measure.
Restatement and Other Costs
Restatement and other costs amounted to $1.0 million for the three months ended March 31, 2013, primarily related to Minnesota litigation-related costs. We did not incur any restatement and other costs during the three months ended March 31, 2012.
Income Taxes
Our income tax benefit was $15.9 million for the three months ended March 31, 2013 and March 31, 2012. Our effective tax rate for the three months ended March 31, 2013 and 2012 were approximately 38% and 36%, respectively. Our tax rate is affected by recurring items, permanent differences and state income taxes. It is also affected by discrete items that may occur in any given year, but are not consistent from year to year.
74
Table of Contents
Year Ended December 31, 2012 Compared to Year Ended December 31, 2011
The following table sets forth consolidated operating results and other operating data for the periods indicated:
| Year Ended December 31, | 2012 vs. 2011 Change | |||||||||||||||
| 2012 | 2011 | Amount | % | |||||||||||||
| As restated | ||||||||||||||||
| (In thousands) | ||||||||||||||||
| Consolidated Statement of Operations Data: |
||||||||||||||||
| RCM service: net operating fees |
$ | 9,888 | $ | 34,923 | $ | (25,035 | ) | (71.7 | %) | |||||||
| RCM service: incentive fees |
928 | 25,946 | (25,018 | ) | (96.4 | %) | ||||||||||
| Other service fees |
61,438 | 41,097 | 20,341 | 49.5 | % | |||||||||||
|
|
|
|
|
|
|
|
|
|||||||||
| Total net services revenue |
72,254 | 101,966 | (29,712 | ) | (29.1 | %) | ||||||||||
| Operating expenses: |
||||||||||||||||
| Cost of services |
188,666 | 158,715 | 29,951 | 18.9 | % | |||||||||||
| Selling, general and administrative |
67,750 | 63,268 | 4,482 | 7.1 | % | |||||||||||
| Restatement and other costs |
3,714 | — | 3,714 | — | ||||||||||||
|
|
|
|
|
|
|
|
|
|||||||||
| Total operating expenses |
260,130 | 221,983 | 38,147 | 17.2 | % | |||||||||||
|
|
|
|
|
|
|
|
|
|||||||||
| Loss from operations |
(187,876 | ) | (120,017 | ) | (67,859 | ) | (56.5 | %) | ||||||||
| Net interest income |
141 | 26 | 115 | n.m. | ||||||||||||
|
|
|
|
|
|
|
|
|
|||||||||
| Loss before income tax benefit |
(187,735 | ) | (119,991 | ) | (67,744 | ) | (56.5 | %) | ||||||||
| Income tax benefit |
(67,995 | ) | (48,246 | ) | (19,749 | ) | (40.9 | %) | ||||||||
|
|
|
|
|
|
|
|
|
|||||||||
| Net Loss |
(119,740 | ) | (71,745 | ) | (47,995 | ) | (66.9 | %) | ||||||||
| Net interest income |
(141 | ) | (26 | ) | (115 | ) | n.m. | |||||||||
| Income tax benefit |
(67,995 | ) | (48,246 | ) | (19,749 | ) | (40.9 | %) | ||||||||
| Depreciation and amortization expense |
6,355 | 4,862 | 1,493 | 30.7 | % | |||||||||||
| Share-based compensation expense |
25,298 | 25,186 | 112 | 0.4 | % | |||||||||||
| Restatement and other costs |
3,714 | — | 3,714 | — | ||||||||||||
|
|
|
|
|
|
|
|
|
|||||||||
| Adjusted EBITDA |
(152,509 | ) | (89,969 | ) | (62,540 | ) | (69.5 | %) | ||||||||
| Change in deferred customer billings |
200,114 | 145,797 | 54,317 | 37.3 | % | |||||||||||
|
|
|
|
|
|
|
|
|
|||||||||
| Net cash generated from customer contracting activities |
$ | 47,605 | $ | 55,828 | $ | (8,223 | ) | (14.7 | %) | |||||||
|
|
|
|
|
|
|
|
|
|||||||||
| Net service revenue |
$ | 72,254 | $ | 101,966 | $ | (29,712 | ) | (29.1 | %) | |||||||
| Change in deferred customer billings |
200,114 | 145,797 | 54,317 | 37.3 | % | |||||||||||
|
|
|
|
|
|
|
|
|
|||||||||
| Gross cash generated from customer contracting activities |
$ | 272,368 | $ | 247,763 | $ | 24,605 | 9.9 | % | ||||||||
|
|
|
|
|
|
|
|
|
|||||||||
| Components of Gross Cash Generated from Customer Contracting Activities: |
|
|||||||||||||||
| RCM service: net operating fee |
118,030 | 121,800 | $ | (3,770 | ) | (3.1 | %) | |||||||||
| RCM service: incentive fee |
92,900 | 84,866 | 8,034 | 9.5 | % | |||||||||||
|
|
|
|
|
|
|
|
|
|||||||||
| Total RCM service fees |
210,930 | 206,666 | 4,264 | 2.1 | % | |||||||||||
| Other service fees |
61,438 | 41,097 | 20,341 | 49.5 | % | |||||||||||
|
|
|
|
|
|
|
|
|
|||||||||
| Gross cash generated from customer contracting activities |
$ | 272,368 | $ | 247,763 | $ | 24,605 | 9.9 | % | ||||||||
|
|
|
|
|
|
|
|
|
|||||||||
n.m.—Not meaningful
75
Table of Contents
Net Services Revenue
Net services revenue decreased by $29.7 million, or 29.1%, to $72.3 million for the year ended December 31, 2012, from $102.0 million for the year ended December 31, 2011. The decrease of $50.0 million in RCM fees was primarily attributable to revenue recognized as a result of two customers reaching the end of their contracts in the year ended December 31, 2011.
This decrease was offset in part by an increase in other service fees of $20.3 million to $61.4 million for the year ended December 31, 2012, from $41.1 million for the year ended December 31, 2011. This increase is primarily attributed to physician advisory service fees in 2012 resulting in $56.5 million revenue in 2012 as compared to $30.5 revenue in 2011.
Gross Cash Generated from Customer Contracting Activities (Non-GAAP)
Gross cash generated from customer contracting activities increased by $24.6 million for the year ended December 31, 2012, compared to the year ended December 31, 2011. The increase was primarily a result of an increase in other services revenue of $20.3 million due to continued growth in the physician advisory services. Gross cash generated from customer contracting activities is a non-GAAP measure. Please see “Selected Non-GAAP Measures” in “Part II – Item 6 – Selected Consolidated Financial Statements” for an explanation of how we calculate and us gross cash generated from customer contractive activities and for its reconciliation to net services revenue, the most comparable GAAP measure.
Cost of Services
Our cost of services increased by $30.0 million, or 18.9%, to $188.7 million for the year ending December 31, 2012, from $158.7 million for the year ended December 31, 2011. This increase was primarily attributable to a $9.2 million increase in physician advisory services costs, an $11.0 million increase in shared services costs, and a $10.6 million increase in infused management costs.
Selling, General and Administrative Expenses
Selling, general and administrative, or SG&A, expenses increased by $4.5 million, or 7.1%, to $67.8 million for the year ended December 31, 2012, from $63.3 million for the year ended December 31, 2011. This increase was driven by increases in salaries, benefits and incentive compensation accruals.
Net Cash Generated from Customer Contracting Activities (Non-GAAP)
The net cash generated from customer contracting activities totaled $47.6 million in 2012 compared to $55.8 million generated in 2011. The reduction of $8.2 million was primarily due to increased spending in cost of services, SG&A, and litigation (as discussed above), during fiscal 2013, partially offset by increases in deferred customer billings. Net cash generated from customer contracting activities is a non-GAAP measure. Please see “Selected Non-GAAP Measures” in “Part II – Item 6 – Selected Consolidated Financial Statements” for an explanation of how we calculate and use net cash generated from customer contracting activities and for its reconciliation to net income (loss), the most comparable GAAP measure.
Restatement and Other Costs
For the year ended December 31, 2012, we incurred costs arising from the Minnesota litigation totaling $3.7 million, net of insurance recoveries, comprising primarily of legal costs. We did not incur any Restatement and related similar costs for the year ended December 31, 2011.
Income Taxes
Our tax benefit increased by $19.7 million, to $68.0 million for the year ended December 31, 2012, from $48.2 million for the year ended December 31, 2011. The decrease in our effective tax rate from 40% for the year ended December 31, 2011, to 36% for the year ended December 31, 2012, was primarily attributable to the enactment of lower state tax rates in State of Michigan.
76
Table of Contents
Three Months Ended September 30, 2012, Compared to Three Months Ended September 30, 2011
The following table sets forth consolidated operating results and other operating data for the periods indicated:
| Three Months Ended September 30, | 2012 vs. 2011 Change | |||||||||||||||
| 2012 | 2011 | Amount | % | |||||||||||||
| As restated | As restated | |||||||||||||||
| (In thousands) | ||||||||||||||||
| Consolidated Statement of Operations Data: |
||||||||||||||||
| RCM service: net operating fees |
$ | 1,091 | $ | 3,310 | $ | (2,219 | ) | (67.0 | %) | |||||||
| RCM service: incentive fees |
— | — | — | — | ||||||||||||
| Other service fees |
15,031 | 14,717 | 314 | 2.1 | % | |||||||||||
|
|
|
|
|
|
|
|
|
|||||||||
| Total net services revenue |
16,122 | 18,027 | (1,905 | ) | (10.6 | %) | ||||||||||
| Operating expenses: |
||||||||||||||||
| Cost of services |
44,948 | 40,571 | 4,377 | 10.8 | % | |||||||||||
| Selling, general and administrative |
17,718 | 14,881 | 2,837 | 19.1 | % | |||||||||||
| Restatement and other costs |
1,343 | — | 1,343 | — | ||||||||||||
|
|
|
|
|
|
|
|
|
|||||||||
| Total operating expenses |
64,009 | 55,452 | 8,557 | 15.4 | % | |||||||||||
|
|
|
|
|
|
|
|
|
|||||||||
| Loss from operations |
(47,887 | ) | (37,425 | ) | (10,462 | ) | (28.0 | %) | ||||||||
| Net interest income |
35 | 5 | 30 | n.m. | ||||||||||||
|
|
|
|
|
|
|
|
|
|||||||||
| Loss before income tax benefit |
(47,852 | ) | (37,420 | ) | (10,432 | ) | (27.9 | %) | ||||||||
| Income tax benefit |
(16,447 | ) | (15,197 | ) | (1,250 | ) | (8.2 | %) | ||||||||
|
|
|
|
|
|
|
|
|
|||||||||
| Net loss |
$ | (31,405 | ) | $ | (22,223 | ) | $ | (9,182 | ) | (41.3 | %) | |||||
|
|
|
|
|
|
|
|
|
|||||||||
n.m.—Not meaningful
Reconciliation of GAAP and Non-GAAP Measures: The following table presents a reconciliation of adjusted EBITDA and gross and net cash generated from customer contracting activities to net loss, the most comparable GAAP measure, for each of the periods indicated.
| Three Months Ended September 30, | 2012 vs. 2011 Change | |||||||||||||||
| 2012 | 2011 | Amount | % | |||||||||||||
| As restated | As restated | |||||||||||||||
| (In thousands) | ||||||||||||||||
| Net Loss |
$ | (31,405 | ) | $ | (22,223 | ) | $ | (9,182 | ) | (41.3 | %) | |||||
| Net interest income |
(35 | ) | (5 | ) | (30 | ) | n.m. | |||||||||
| Income tax benefit |
(16,447 | ) | (15,197 | ) | (1,250 | ) | (8.2 | %) | ||||||||
| Depreciation and amortization expense |
1,748 | 1,239 | 509 | 41.1 | % | |||||||||||
| Share-based compensation expense |
5,737 | 7,298 | (1,561 | ) | (21.4 | %) | ||||||||||
| Restatement and other costs |
1,343 | — | 1,343 | — | ||||||||||||
|
|
|
|
|
|
|
|
|
|||||||||
| Adjusted EBITDA |
(39,059 | ) | (28,888 | ) | (10,171 | ) | (35.2 | %) | ||||||||
| Change in deferred customer billings |
53,804 | 48,744 | 5,060 | 10.4 | % | |||||||||||
|
|
|
|
|
|
|
|
|
|||||||||
| Net cash generated from customer contracting activities |
$ | 14,745 | $ | 19,856 | $ | (5,111 | ) | (25.7 | %) | |||||||
|
|
|
|
|
|
|
|
|
|||||||||
| Net service revenue |
$ | 16,122 | $ | 18,027 | $ | (1,905 | ) | (10.6 | %) | |||||||
| Change in deferred customer billings |
53,804 | 48,744 | 5,060 | 10.4 | % | |||||||||||
|
|
|
|
|
|
|
|
|
|||||||||
| Gross cash generated from customer contracting activities |
$ | 69,926 | $ | 66,771 | $ | 3,155 | 4.7 | % | ||||||||
|
|
|
|
|
|
|
|
|
|||||||||
| Components of Gross Cash Generated from Customer Contracting Activities: |
|
|||||||||||||||
| RCM service: net operating fee |
$ | 27,462 | $ | 28,288 | $ | (826 | ) | (2.9 | %) | |||||||
| RCM service: incentive fee |
27,433 | 23,766 | 3,667 | 15.4 | % | |||||||||||
|
|
|
|
|
|
|
|
|
|||||||||
| Total RCM service fees |
54,895 | 52,054 | 2,841 | 5.5 | % | |||||||||||
| Other service fees |
15,031 | 14,717 | 314 | 2.1 | % | |||||||||||
|
|
|
|
|
|
|
|
|
|||||||||
| Gross cash generated from customer contracting activities |
$ | 69,926 | $ | 66,771 | $ | 3,155 | 4.7 | % | ||||||||
|
|
|
|
|
|
|
|
|
|||||||||
n.m.—Not meaningful
77
Table of Contents
Net Services Revenue
Net services revenue decreased by $1.9 million, or 10.6%, to $16.1 million for the three months ended September 30, 2012, from $18.0 million for the three months ended September 30, 2011. The decrease was primarily due to recognition of fixed fee RCM revenue of $1.8 million during the three months ended September 30, 2011. During the three months ended September 30, 2012, no fixed fee RCM revenue was recognized from this customer.
Gross Cash Generated from Customer Contracting Activities (Non-GAAP)
Gross cash generated from customer contracting activities increased $3.2 million for the three months ended September 30, 2012 compared to the three months ended September 30, 2011. The increase was attributable to growth in physician advisory services of $4.1 million. Gross cash generated from customer contracting activities is a non-GAAP measure. Please see “Selected Non-GAAP Measures” in “Part II – Item 6 – Selected Consolidated Financial Statements” for an explanation of how we calculate and use gross cash generated from customer contracting activities and please see above for its reconciliation to net services revenue, the most comparable GAAP measure.
Cost of Services
Cost of services increased $4.4 million, or 10.8%, to $44.9 million for the three months ended September 30, 2012, from $40.6 million for the three months ended September 30, 2011. This change was primarily related to a $2.9 million increase in infused management expenses, and a $2.8 million increase in costs associated with shared service centers, offset by lower costs in the population health business.
Selling, General and Administrative Expenses
Selling, general and administrative expenses increased by $2.8 million, or 19.1%, to $17.7 million for the three months ended September 30, 2012, from $14.9 million for the three months ended September 30, 2011. The increase was primarily attributed to increases in salaries, benefits and incentive compensation accruals.
Net Cash Generated from Customer Contracting Activities (Non-GAAP)
The net cash generated from customer contracting activities totaled $14.7 million for the three months ended September 30, 2012, compared with $19.9 million in net cash generation for the three months ended September 30, 2011. The decrease of $5.1 million in net cash generation from customer contracting activities is primarily due to increased cost of services and increased selling, general, and administrative expenses, partially offset by increased gross cash generated from customer contracting activities. Please see “Selected Non-GAAP Measures” in “Part II – Item 6 – Selected Consolidated Financial Statements” for an explanation of how we calculate and use net cash generated from customer contracting activities and for its reconciliation to net income (loss), the most comparable GAAP measure.
Restatement and other Costs
Restatement and other costs for the three months ended September 30, 2012, were related to the Minnesota litigation matters and comprised of net charges of $1.3 million after insurance recoveries. There were no similar costs for the three months ended September 30, 2011.
Income Taxes
Our tax benefit increased by $1.3 million, to $16.4 million for the three months ended September 30, 2012 from $15.2 million for the three months ended September 30, 2011. Our effective tax rate for the periods September 30, 2012 and September 30, 2011 are 34% and 41% respectively. Our tax rate is affected by recurring items, permanent differences and state income taxes. It is also affected by discrete items that may occur in any given year, but are not consistent from year to year.
78
Table of Contents
Three Months Ended June 30, 2012 Compared to Three Months Ended June 30, 2011
The following table sets forth consolidated operating results and other operating data for the periods indicated:
| Three Months Ended June 30, |
2012 vs. 2011 Change |
|||||||||||||||
| 2012 | 2011 | Amount | % | |||||||||||||
| As restated |
As restated |
|||||||||||||||
| (In thousands) |
||||||||||||||||
| Consolidated Statement of Operations Data: |
||||||||||||||||
| RCM service: net operating fees |
$ | 1,615 | $ | 3,018 | $ | (1,403 | ) | (46.5 | %) | |||||||
| RCM service: incentive fees |
— | — | — | — | ||||||||||||
| Other service fees |
14,659 | 7,734 | 6,925 | 89.5 | % | |||||||||||
|
|
|
|
|
|
|
|
|
|||||||||
| Total net services revenue |
16,274 | 10,752 | 5,522 | 51.4 | % | |||||||||||
| Operating expenses: |
||||||||||||||||
| Cost of services |
49,387 | 38,739 | 10,648 | 27.5 | % | |||||||||||
| Selling, general and administrative |
15,424 | 12,718 | 2,706 | 21.3 | % | |||||||||||
| Restatement and other costs |
588 | — | 588 | — | ||||||||||||
|
|
|
|
|
|
|
|
|
|||||||||
| Total operating expenses |
65,399 | 51,457 | 13,942 | 27.1 | % | |||||||||||
|
|
|
|
|
|
|
|
|
|||||||||
| Loss from operations |
(49,125 | ) | (40,705 | ) | (8,420 | ) | (20.7 | %) | ||||||||
| Net interest income |
20 | 6 | 14 | n.m. | ||||||||||||
|
|
|
|
|
|
|
|
|
|||||||||
| Loss before provision for income taxes |
(49,105 | ) | (40,699 | ) | (8,406 | ) | (20.7 | %) | ||||||||
| Income tax benefit |
(17,734 | ) | (16,743 | ) | (991 | ) | (5.9 | %) | ||||||||
|
|
|
|
|
|
|
|
|
|||||||||
| Net loss |
$ | (31,371 | ) | $ | (23,956 | ) | $ | (7,415 | ) | (31.0 | %) | |||||
|
|
|
|
|
|
|
|
|
|||||||||
n.m.—Not meaningful
Reconciliation of GAAP and Non-GAAP Measures: The following table presents a reconciliation of adjusted EBITDA and gross and net cash generated from customer contracting activities to net loss, the most comparable GAAP measure, for each of the periods indicated.
| Three Months Ended June 30, |
2012 vs. 2011 Change |
|||||||||||||||
| 2012 | 2011 | Amount | % | |||||||||||||
| As restated |
As restated |
|||||||||||||||
| (In thousands) |
||||||||||||||||
| Net Loss |
$ | (31,371 | ) | $ | (23,956 | ) | $ | (7,415 | ) | (31.0 | %) | |||||
| Net interest income |
(20 | ) | (6 | ) | (14 | ) | n.m. | |||||||||
| Income tax benefit |
(17,734 | ) | (16,743 | ) | (991 | ) | (5.9 | %) | ||||||||
| Depreciation and amortization expense |
1,430 | 1,238 | 192 | 15.5 | % | |||||||||||
| Share-based compensation expense |
5,406 | 5,387 | 19 | 0.4 | % | |||||||||||
| Restatement and other costs |
588 | — | 588 | — | ||||||||||||
|
|
|
|
|
|
|
|
|
|||||||||
| Adjusted EBITDA |
(41,701 | ) | (34,080 | ) | (7,621 | ) | (22.4 | %) | ||||||||
| Change in deferred customer billings |
48,662 | 44,055 | 4,607 | 10.5 | % | |||||||||||
|
|
|
|
|
|
|
|
|
|||||||||
| Net cash generated from customer contracting activities |
$ | 6,961 | $ | 9,975 | $ | (3,014 | ) | (30.2 | %) | |||||||
|
|
|
|
|
|
|
|
|
|||||||||
| Net service revenue |
$ | 16,274 | $ | 10,752 | $ | 5,522 | 51.4 | % | ||||||||
| Change in deferred customer billings |
48,662 | 44,055 | 4,607 | 10.5 | % | |||||||||||
|
|
|
|
|
|
|
|
|
|||||||||
| Gross cash generated from customer contracting activities |
$ | 64,936 | $ | 54,807 | $ | 10,129 | 18.5 | % | ||||||||
|
|
|
|
|
|
|
|
|
|||||||||
| Components of Gross Cash Generated from Customer Contracting Activities: |
| |||||||||||||||
| RCM service: net operating fee |
$ | 29,645 | $ | 31,617 | $ | (1,972 | ) | (6.2 | %) | |||||||
| RCM service: incentive fee |
20,632 | 15,456 | 5,176 | 33.5 | % | |||||||||||
|
|
|
|
|
|
|
|
|
|||||||||
| Total RCM service fees |
50,277 | 47,073 | 3,204 | 6.8 | % | |||||||||||
| Other service fees |
14,659 | 7,734 | 6,925 | 89.5 | % | |||||||||||
|
|
|
|
|
|
|
|
|
|||||||||
| Gross cash generated from customer contracting activities |
$ | 64,936 | $ | 54,807 | $ | 10,129 | 18.5 | % | ||||||||
|
|
|
|
|
|
|
|
|
|||||||||
n.m.—Not meaningful
79
Table of Contents
Net Services Revenue
Net services revenue increased by $5.5 million or 51.4% to $16.3 million for the three months ended June 30, 2012, from $10.8 million for the three months ended June 30, 2011. Net services revenue increased primarily as a result of service fees generated from physician advisory services and other service revenue of $6.9 million.
Gross Cash Generated from Customer Contracting Activities (Non-GAAP)
Gross cash generated from customer contracting activities increased $10.1 million for the three months ended June 30, 2012, compared to the three months ended June 30, 2011. The increase was driven by a $6.9 million increase in physician advisory services and a $3.2 million increase in RCM fees. Gross cash generated from customer contracting activities is a non-GAAP measure. Please see “Selected Non-GAAP Measures” in “Part II – Item 6 – Selected Consolidated Financial Statements” for an explanation of how we calculate and use gross cash generated from customer contracting activities and please see above for its reconciliation to net services revenue, the most comparable GAAP measure.
Cost of Services
Cost of services increased by $10.6 million, or 27.5%, to $49.4 million for the three months ended June 30, 2012, from $38.7 million for the three months ended June 30, 2011. This increase is primarily related to an increase in shared services costs of $3.4 million, infused management costs of $3.2 million, physician advisory services costs of $3.2 million and population health services costs of $1.8 million.
Selling, General and Administrative Expenses
Selling, general and administrative expenses increased by $2.7 million, or 21.3%, to $15.4 million for the three months ended June 30, 2012, from $12.7 million for the three months ended June 30, 2011. This increase was primarily attributed to increased selling and business development expenses.
Net Cash Generated from Customer Contracting Activities (Non-GAAP)
The net cash generated from customer contracting activities totaled $7.0 million for the three months ended June 30, 2012, compared with $10.0 million in net cash generation for the three months ended June 30, 2011. The decrease of $3.0 million in net cash generation from customer contracting activities is primarily due to increased costs of services and increased selling, general and administrative expenses, partially offset by increased gross cash generated from customer contracting activities. Please see “Selected Non-GAAP Measures” in “Part II – Item 6 – Selected Consolidated Financial Statements” for an explanation of how we calculate and use net cash generated from customer contracting activities and for its reconciliation to net income (loss), the most comparable GAAP measure.
Restatement and Other Costs
We reported restatement and other costs of $0.6 million for the three months ended June 30, 2012, which was related to the Minnesota litigation. There were no similar costs for the three months ended June 30, 2011.
Income Taxes
Our tax benefit increased by $1.0 million, to $17.7 million for the three months ended June 30, 2012 from $16.7 million for the three months ended June 30, 2011. Our effective tax rate for the periods June 30, 2012 and June 30, 2011 are 36% and 41% respectively. Our tax rate is affected by recurring items, permanent differences and state income taxes. It is also affected by discrete items that may occur in any given year, but are not consistent from year to year.
80
Table of Contents
Three Months Ended March 31, 2012 Compared to Three Months Ended March 31, 2011
The following table sets forth consolidated operating results and other operating data for the periods indicated:
| Three Months Ended |
2012 vs. 2011 Change |
|||||||||||||||
| 2012 | 2011 | Amount | % | |||||||||||||
| As restated |
As restated |
|||||||||||||||
| (In thousands) |
||||||||||||||||
| Consolidated Statement of Operations Data: |
||||||||||||||||
| RCM service: net operating fees |
$ | 5,383 | $ | 2,477 | $ | 2,906 | n.m. | |||||||||
| RCM service: incentive fees |
— | — | — | — | ||||||||||||
| Other service fees |
15,711 | 4,195 | 11,516 | n.m. | ||||||||||||
|
|
|
|
|
|
|
|
|
|||||||||
| Total net services revenue |
21,094 | 6,672 | 14,422 | n.m. | ||||||||||||
| Operating expenses: |
||||||||||||||||
| Cost of services |
47,318 | 34,276 | 13,042 | 38.0 | % | |||||||||||
| Selling, general and administrative |
17,772 | 14,349 | 3,423 | 23.9 | % | |||||||||||
|
|
|
|
|
|
|
|
|
|||||||||
| Total operating expenses |
65,090 | 48,625 | 16,465 | 33.9 | % | |||||||||||
|
|
|
|
|
|
|
|
|
|||||||||
| Loss from operations |
(43,996 | ) | (41,953 | ) | (2,043 | ) | (4.9 | %) | ||||||||
| Net interest income |
22 | 9 | 13 | n.m. | ||||||||||||
|
|
|
|
|
|
|
|
|
|||||||||
| Loss before income tax benefit |
(43,974 | ) | (41,944 | ) | (2,030 | ) | (4.8 | %) | ||||||||
| Income tax benefit |
(15,921 | ) | (16,986 | ) | 1,065 | 6.3 | % | |||||||||
|
|
|
|
|
|
|
|
|
|||||||||
| Net loss |
$ | (28,053 | ) | $ | (24,958 | ) | $ | (3,095 | ) | (12.4 | %) | |||||
|
|
|
|
|
|
|
|
|
|||||||||
n.m.—Not meaningful
Reconciliation of GAAP and Non-GAAP Measures: The following table presents a reconciliation of adjusted EBITDA and gross and net cash generated from customer contracting activities to net loss, the most comparable GAAP measure, for each of the periods indicated.
| Three Months Ended |
2012 vs. 2011 Change |
|||||||||||||||
| 2012 | 2011 | Amount | % | |||||||||||||
| As restated |
As restated |
|||||||||||||||
| (In thousands) |
||||||||||||||||
| Net Loss |
$ | (28,053 | ) | $ | (24,958 | ) | $ | (3,095 | ) | (12.4 | %) | |||||
| Net interest income |
(22 | ) | (9 | ) | (13 | ) | n.m. | |||||||||
| Income tax benefit |
(15,921 | ) | (16,986 | ) | 1,065 | 6.3 | % | |||||||||
| Depreciation and amortization expense |
1,488 | 1,128 | 360 | 31.9 | % | |||||||||||
| Share-based compensation expense |
7,913 | 5,976 | 1,937 | 32.4 | % | |||||||||||
|
|
|
|
|
|
|
|
|
|||||||||
| Adjusted EBITDA |
(34,595 | ) | (34,849 | ) | 254 | 0.7 | % | |||||||||
| Change in deferred customer billings |
36,252 | 42,564 | (6,312 | ) | (14.8 | %) | ||||||||||
|
|
|
|
|
|
|
|
|
|||||||||
| Net cash generated from customer contracting activities |
$ | 1,657 | $ | 7,715 | $ | (6,058 | ) | (78.5 | %) | |||||||
|
|
|
|
|
|
|
|
|
|||||||||
| Net service revenue |
$ | 21,094 | $ | 6,672 | $ | 14,422 | n.m. | |||||||||
| Change in deferred customer billings |
36,252 | 42,564 | (6,312 | ) | (14.8 | %) | ||||||||||
|
|
|
|
|
|
|
|
|
|||||||||
| Gross cash generated from customer contracting activities |
$ | 57,346 | $ | 49,236 | $ | 8,110 | 16.5 | % | ||||||||
|
|
|
|
|
|
|
|
|
|||||||||
| Components of Gross Cash Generated from Customer Contracting Activities: |
| |||||||||||||||
| RCM service: net operating fee |
$ | 31,123 | $ | 30,724 | $ | 399 | 1.3 | % | ||||||||
| RCM service: incentive fee |
10,512 | 14,317 | (3,805 | ) | (26.6 | %) | ||||||||||
|
|
|
|
|
|
|
|
|
|||||||||
| Total RCM service fees |
41,635 | 45,041 | (3,406 | ) | (7.6 | %) | ||||||||||
| Other service fees |
15,711 | 4,195 | 11,516 | n.m. | ||||||||||||
|
|
|
|
|
|
|
|
|
|||||||||
| Gross cash generated from customer contracting activities |
$ | 57,346 | $ | 49,236 | $ | 8,110 | 16.5 | % | ||||||||
|
|
|
|
|
|
|
|
|
|||||||||
n.m.—Not meaningful
81
Table of Contents
Net Services Revenue
Net services revenue increased by $14.4 million to $21.1 million for the three months ended March 31, 2012, from $6.7 million for the three months ended March 31, 2011. The increase was primarily from an increase in fees for physician advisory services of $10.4 million. Additional increase of $2.9 million in net service revenue is attributable to other customer contractual agreement events resulting in revenue recognition.
Gross Cash Generated from Customer Contracting Activities (Non-GAAP)
Gross cash generated from customer contracting activities increased $8.1 million for the three months ended March 31, 2012, compared to the three months ended March 31, 2011. The increase was primarily a result of an $11.5 million increase in other services due to strong growth in physician advisory services. The increase was partially offset by a decrease of $3.4 million as a result of lower cash received from certain RCM customers. Gross cash generated from customer contracting activities is a non-GAAP measure. Please see “Selected Non-GAAP Measures” in “Part II – Item 6 – Selected Consolidated Financial Statements” for an explanation of how we calculate and use gross cash generated from customer contracting activities and please see above for its reconciliation to net services revenue, the most comparable GAAP measure.
Cost of Services
Cost of services increased by $13.0 million, or 38.0%, to $47.3 million for the three months ended March 31, 2012, from $34.3 million for the three months ended March 31, 2011. This increase is primarily related to increased costs of $5.3 million associated with physician advisory services, $2.4 million associated with expanding our shared service center footprint, additional infused management expenditures of $2.3 million, and an increase of $2.1 million associated with population health.
Selling, General and Administrative Expenses
Selling, general and administrative expenses increased by $3.4 million, or 23.9%, to $17.8 million for the three months ended March 31, 2012, from $14.3 million for the three months ended March 31, 2011. This increase was primarily attributed to increased selling and business development expenses to drive growth of the business.
Net Cash Generated from Customer Contracting Activities (Non-GAAP)
The net cash generated from customer contracting activities totaled $1.7 million for the three months ended March 31, 2012, compared with $7.7 million in net cash generation for the three months ended March 31, 2011. The decrease of $6.0 million in net cash generation from customer contracting activities is primarily due to an increase in costs of services and an increase in selling, general and administrative expenses, partially offset by increased gross cash generated from customer contracting activities. Please see “Selected Non-GAAP Measures” in “Part II – Item 6 – Selected Consolidated Financial Statements” for an explanation of how we calculate and use net cash generated from customer contracting activities and for its reconciliation to net income (loss), the most comparable GAAP measure.
Income Taxes
Our tax benefit decreased by $1.1 million, to $15.9 million for the three months ended March 31, 2012 from $17.0 million for the three months ended March 31, 2011. Our effective tax rate for the periods March 31, 2012 and March 31, 2011 are 36% and 40% respectively. Our tax rate is affected by recurring items, permanent differences and state income taxes. It is also affected by discrete items that may occur in any given year, but are not consistent from year to year.
82
Table of Contents
Liquidity and Capital Resources
Cash flows from operating, investing and financing activities, as reflected in our Consolidated Statements of Cash Flows, are summarized in the following table:
| Year Ended December 31, | ||||||||||||
| 2013 | 2012 | 2011 | ||||||||||
| As restated | ||||||||||||
| (In thousands) | ||||||||||||
| Net cash provided by operating activities |
$ | 54,423 | $ | 29,166 | $ | 11,701 | ||||||
| Net cash used in investing activities |
(1,877 | ) | (10,544 | ) | (7,405 | ) | ||||||
| Net cash used in financing activities |
(100 | ) | (38,361 | ) | 36,700 | |||||||
| Effect of exchange rate changes on cash |
(511 | ) | (30 | ) | (338 | ) | ||||||
|
|
|
|
|
|
|
|||||||
| Net increase (decrease) in cash and cash equivalents |
$ | 51,935 | $ | (19,769 | ) | $ | 40,658 | |||||
|
|
|
|
|
|
|
|||||||
Our primary source of liquidity is cash flows from operations. For the years ended December 31, 2013, 2012 and 2011, we generated positive cash flows from operations.
As of December 31, 2013, 2012 and 2011, we had cash and cash equivalents of $228.9 million, $177.0 million, and $196.7 million, respectively. Theses balances consist primarily of highly liquid money market funds. Our cash and cash equivalents, at any time, include amounts paid to us in advance by customers for the purpose of reimbursing their revenue cycle operations costs. See Note 3, Summary of Significant Accounting Policies, to our consolidated financial statements included in this Annual Report on Form 10-K for additional information.
We expect that the combination of our current liquidity and expected additional cash generated from operations will be sufficient to satisfy our anticipated cash requirements through at least the next 12 months.
Year Ended December 31, 2013 Compared to Year Ended December 31, 2012
Cash flows from operating, investing and financing activities in 2013 and 2012, as reflected in our quarterly Consolidated Statements of Cash Flows, are summarized in the following tables:
| First Quarter | Second Quarter | Third Quarter | ||||||||||||||
| March 31, 2013 | June 30, 2013 | September 30, 2013 |
Year Ended 2013 |
|||||||||||||
| (Unaudited) | (Unaudited) | (Unaudited) | (Audited) | |||||||||||||
| Net cash provided by operating activities |
$ | 6,093 | $ | 21,796 | $ | 17,134 | $ | 54,423 | ||||||||
| Net cash used in investing activities |
(193 | ) | (585 | ) | (343 | ) | (1,877 | ) | ||||||||
| Net cash provided by (used in) financing activities |
41 | — | (86 | ) | (100 | ) | ||||||||||
| Effect of exchange rate changes on cash |
81 | (462 | ) | (261 | ) | (511 | ) | |||||||||
|
|
|
|
|
|
|
|
|
|||||||||
| Net increase in cash and cash equivalents |
$ | 6,022 | $ | 20,749 | $ | 16,444 | $ | 51,935 | ||||||||
|
|
|
|
|
|
|
|
|
|||||||||
| First Quarter | Second Quarter | Third Quarter | ||||||||||||||
| March 31, 2012 | June 30, 2012 | September 30, 2012 |
Year Ended 2012 |
|||||||||||||
| As restated | As restated | As restated | ||||||||||||||
| (Unaudited) | (Unaudited) | (Unaudited) | (Audited) | |||||||||||||
| Net cash provided by (used in) operating activities |
$ | 12,997 | $ | (11,358 | ) | $ | 11,527 | $ | 29,166 | |||||||
| Net cash used in investing activities |
(2,981 | ) | (2,365 | ) | (4,732 | ) | (10,544 | ) | ||||||||
| Net cash provided by (used in) financing activities |
7,649 | 320 | (11,495 | ) | (38,361 | ) | ||||||||||
| Effect of exchange rate changes on cash |
84 | (193 | ) | 197 | (30 | ) | ||||||||||
|
|
|
|
|
|
|
|
|
|||||||||
| Net increase (decrease) in cash and cash equivalents |
$ | 17,749 | $ | (13,596 | ) | $ | (4,503 | ) | $ | (19,769 | ) | |||||
|
|
|
|
|
|
|
|
|
|||||||||
83
Table of Contents
Operating Activities
Cash provided by operating activities increased $25.2 million from $29.2 million for the year ended December 31, 2012, to $54.4 million for the year ended December 31, 2013. The increase in cash provided by operations in 2013 as compared to 2012 was primarily attributable to higher cash receipts from customers and lower legal payments (net of insurance proceeds) related to the Minnesota litigation. The increase in cash provided by cash receipts from customers was largely attributed to execution of new supplemental agreements between us and hospital systems affiliated with Ascension Health, which occurred in the second quarter of 2013. The execution of these agreements resulted in the collection of certain fees which were finalized in conjunction with the agreements and that pertained to services provided in 2012. These increases were partially offset by increased expenditures of $23.1 million related to the Restatement and $6.0 million related to other expenses in 2013 when compared to 2012.
Investing Activities
Cash used in investing activities decreased $8.6 million from $10.5 million for the year ended December 31, 2012, to $1.9 million for the year ended December 31, 2013. This decrease was primarily attributed to fewer capital expenditures being made in 2013 compared to 2012. Use of cash for investing activities in 2012 was primarily related to purchases of hardware and software related to the build-out of our technology infrastructure and to support our customers, as well as leasehold improvements to align our office space with the growth in headcount required to support our physician advisory services offering, and related to the build-out of our shared services centers. These investments were substantially complete by 2013.
Financing Activities
Cash used in financing activities decreased $38.3 million from $38.4 million for the year ended December 31, 2012, to $0.1 million for the year ended December 31, 2013. The cash used in 2012 related to our $50.0 million stock buyback plan which was completed in the third and fourth quarters of 2012, offset by the receipt of $7.4 million in proceeds and $2.5 million in associated tax benefits from our employees’ stock option exercises.
Year Ended December 31, 2012 Compared to Year Ended December 31, 2011
Cash flows from operating, investing and financing activities in 2012 and 2011, as reflected in our quarterly Consolidated Statements of Cash Flows, are summarized in the following tables:
| First Quarter March 31, 2012 |
Second Quarter June 30, 2012 |
Third Quarter September 30, 2012 |
Year Ended 2012 |
|||||||||||||
| As restated | As restated | As restated | ||||||||||||||
| (Unaudited) | (Unaudited) | (Unaudited) | (Audited) | |||||||||||||
| Net cash provided by (used in) operating activities |
$ | 12,997 | $ | (11,358 | ) | $ | 11,527 | $ | 29,166 | |||||||
| Net cash used in investing activities |
(2,981 | ) | (2,365 | ) | (4,732 | ) | (10,544 | ) | ||||||||
| Net cash provided by (used in) financing activities |
7,649 | 320 | (11,495 | ) | (38,361 | ) | ||||||||||
| Effect of exchange rate changes on cash |
84 | (193 | ) | 197 | (30 | ) | ||||||||||
|
|
|
|
|
|
|
|
|
|||||||||
| Net increase (decrease) in cash and cash equivalents |
$ | 17,749 | $ | (13,596 | ) | $ | (4,503 | ) | $ | (19,769 | ) | |||||
|
|
|
|
|
|
|
|
|
|||||||||
| First Quarter March 31, 2011 |
Second Quarter June 30, 2011 |
Third Quarter September 30, 2011 |
Year Ended 2011 |
|||||||||||||
| As restated |
As restated | As restated | As restated | |||||||||||||
| (Unaudited) | (Unaudited) | (Unaudited) | ||||||||||||||
| Net cash provided by (used in) operating activities |
$ | (46,261 | ) | $ | 14,899 | $ | 30,427 | $ | 11,701 | |||||||
| Net cash used in investing activities |
(940 | ) | (2,628 | ) | (894 | ) | (7,405 | ) | ||||||||
| Net cash provided by financing activities |
9,812 | 19,286 | (2,525 | ) | 36,700 | |||||||||||
| Effect of exchange rate changes on cash |
72 | (10 | ) | (211 | ) | (338 | ) | |||||||||
|
|
|
|
|
|
|
|
|
|||||||||
| Net increase (decrease) in cash and cash equivalents |
$ | (37,317 | ) | $ | 31,547 | $ | 26,797 | $ | 40,658 | |||||||
|
|
|
|
|
|
|
|
|
|||||||||
84
Table of Contents
Operating Activities
Cash provided by operating activities increased $17.5 million from $11.7 million for the year ended December 31, 2011, to $29.2 million for the year ended December 31, 2012. The increase in cash provided by operations in 2012 as compared with 2011 was primarily attributable to increased fees collected in 2012 associated with new customers acquired at the end of 2011 and additional fees collected from existing customers who expanded their use of our shared services centers. These increases are partially offset by decreased cash receipts resulting from the wind down of operations in Minnesota and increased legal payments (net of insurance proceeds) related to the Minnesota litigation.
Investing Activities
Cash used in investing activities increased by $3.1 million from $7.4 million for the year ended December 31, 2011, to $10.5 million for the year ended December 31, 2012. The increase is primarily attributed to purchases of hardware and software related to the continued build-out of our technology infrastructure to support our customers, as well as additional leasehold improvements to align our office space with the growth in headcount required to support our physician advisory services offering, and related to the build-out of our shared services centers.
Financing Activities
Cash used in financing activities increased $75.1 million from net proceeds of $36.7 million for the year ended December 31, 2011 to net cash used of $38.4 million for the year ended December 31, 2012. This increase in cash used is primarily attributed to our $50.0 million stock buyback plan which was completed in the third and fourth quarters of 2012, offset by the receipt of $7.4 million in proceeds and $2.5 million in associated tax benefits from stock option exercises by our employees. In 2011, we generated net proceeds of $36.5 million primarily related to our receipt of $18.2 million in proceeds and $23.8 million in tax benefits from stock option exercises by our employees, partially offset by a $5.0 million payment in the fourth quarter related to our demand deposit with the Bank of Montreal to secure our $3.0 million line of credit.
Revolving Credit Facility
In September 2011, we reduced our outstanding line of credit with the Bank of Montreal from $15.0 million to $3.0 million. The $3.0 million line of credit can only be utilized in the form of letters of credit and is secured by a $5 million demand deposit with the Bank of Montreal. The line of credit has an initial term of three years and is renewable annually thereafter. As of December 31, 2013, 2012 and 2011, we had outstanding letters of credit of approximately $0.9 million, $1.8 million, and $2.5 million, respectively, which reduced the available line of credit to $2.1 million, $2.0 million and $1.1 million, respectively.
Future Capital Needs
On November 13, 2013, our board of directors authorized a repurchase of up to $50.0 million of our common stock from time to time in the open market or in privately negotiated transactions following the completion of the Restatement. We will determine the timing and amount of any shares repurchased based on our evaluation of market conditions and other factors, and we intend to fund the repurchases from cash on hand. No shares of common stock had been repurchased under this plan as of the date of this Annual report on Form 10-K. Any repurchased shares will be available for use in connection with our stock plans and for other corporate purposes. The repurchase program may be suspended or discontinued at any time.
In connection with our strategic initiatives, we plan to continue to strengthen front-line teams by redeploying certain corporate resources to our teams at customer sites, to enhance execution and customer engagement. As part of these initiatives, we have launched a certification process for on-site employees to ensure that they are providing best-in-class support and services. Also, as part of our initiative to enhance customer
85
Table of Contents
service, we plan to continue to increase our investment in technology to enable our systems to more effectively integrate with our customers’ existing technologies. We plan to continue to deploy resources to bolster our information technology infrastructure in order to drive additional value for our customers.
Additionally, new business development remains a priority as we plan to continue to boost our sales and marketing efforts. We plan to continue to add experienced personnel to our sales organization, develop more disciplined sales processes, and create an integrated marketing capability. As part of these efforts, we have integrated our physician advisory services clinical sales capabilities into our RCM sales organization.
In connection with the Restatement, we incurred costs (primarily accounting-related) of approximately $23.1 million in 2013, and approximately $44.7 million during the nine months ended September 30, 2014. We expect to continue to incur significant costs for this matter through the remainder of 2014.
During 2013 and 2014 we incurred costs to better align our personnel with customer needs, and incurred restructuring costs to reduce the workforce in certain corporate, administrative and management functions and to move certain corporate functions from our headquarters in Chicago, Illinois to Michigan. This is a continuation of our ongoing reorganization efforts which were initiated in 2013. We incurred $5.2 million and $7.7 million in 2013 and the nine months ended September 30, 2014, respectively, in restructuring costs. We expect to complete our restructuring plan by December 31, 2014.
Contractual Obligations
Leases
The following table presents our obligations and commitments to make future minimum rental payments under all non-cancelable operating leases having remaining terms in excess of one year as of December 31, 2013 (in thousands):
| Year Ended December 31, | ||||||||||||||||||||||||||||
| 2014 | 2015 | 2016 | 2017 | 2018 | Thereafter | Total | ||||||||||||||||||||||
| Future minimum rental payments |
$ | 4,012 | $ | 4,258 | $ | 2,988 | $ | 3,697 | $ | 3,490 | $ | 9,170 | $ | 27,615 | ||||||||||||||
We rent office space and equipment under a series of operating leases, primarily for our Chicago corporate office, shared services centers and India operations. Our leases contain various rent holidays and rent escalation clauses and entitlements for tenant improvement allowances. Lease payments are amortized to expense on a straight-line basis over the lease term.
Uncertain Tax Positions
We have a $1.3 million liability for uncertain tax positions as of December 31, 2013. These have been excluded from the “Contractual Obligations” table as we cannot reasonably estimate the period of cash settlement for the tax positions classified as noncurrent liabilities.
Off-Balance Sheet Arrangements
Other than operating leases for office space and the revolving credit facility as noted above, there were no off-balance sheet transactions, arrangements or other relationships with other persons in 2013, 2012 and 2011 that would have affected our liquidity or the availability of, or requirements for, capital resources.
86
Table of Contents
| Item 7A. | Qualitative and Quantitative Disclosures about Market Risk |
Interest Rate Sensitivity. Our interest income is primarily generated from interest earned on operating cash accounts. Our exposure to market risks related to interest expense is limited to outstanding letters of credit under the revolving line of credit, which bear interest at the greater of the bank-established prime commercial rate, a LIBOR plus 1% rate, or a rate that combines the characteristics of both. We do not enter into interest rate swaps, caps or collars or other hedging instruments. As a result, we believe that the risk of a significant impact on our operating income from interest rate fluctuations is not substantial.
Foreign Currency Exchange Risk. Our results of operations and cash flows are subject to fluctuations due to changes in the Indian rupee because a portion of our operating expenses are incurred by our subsidiary in India and are denominated in Indian rupees. However, we do not generate any revenues outside of the United States. For the years ended December 31, 2013, 2012, and 2011, 4%, 5% and 5%, respectively, of our expenses were denominated in Indian rupees. As a result, we believe that the risk of a significant impact on our operating income from foreign currency fluctuations is not substantial.
| Item 8. | Consolidated Financial Statements and Supplementary Data |
The financial statements required by this Item are located beginning on page F-1 of this report.
| Item 9. | Changes in and Disagreements with Accountants on Accounting and Financial Disclosure |
None
87
Table of Contents
| Item 9A. | Controls and Procedures |
This Item 9A includes information concerning the controls and controls evaluation referred to in the certifications of our Chief Executive Officer and Chief Financial Officer required by Rule 13a-14 of the Exchange Act included in this Annual Report as Exhibits 31.1 and 31.2.
Overview
As previously announced on March 8, 2013, the Audit Committee of our Board of Directors (the “Audit Committee”) determined that it would be necessary for us to restate our consolidated financial statements. The Audit Committee made this determination following consultation with and upon the recommendation of management and following consultation with Ernst & Young LLP. Refer to “Part II – Item 7 – Management’s Discussion and Analysis of Financial Condition and Results of Operations” and Note 2, Restatement of Previously Issued Consolidated Financial Statements, included in “Part II – Item 8 – Consolidated Financial Statements and Supplementary Data” for a more detailed description of the financial statement restatement.
Notwithstanding the existence of the material weaknesses described below, we believe that the consolidated financial statements in this Annual Report fairly present, in all material respects, our financial position, results of operations and cash flows as of the dates, and for the periods, presented, in conformity with GAAP.
Management’s Report on Internal Control Over Financial Reporting
Management, under the supervision of our Chief Executive Officer and Chief Financial Officer, is responsible for establishing and maintaining adequate internal control over financial reporting (as defined in Rules 13a-15(f) under the Exchange Act). Internal control over financial reporting is designed to provide reasonable assurance regarding the reliability of financial reporting and the preparation of financial statements for external reporting purposes in accordance with GAAP, and includes those policies and procedures that:
| • | pertain to the maintenance of records that in reasonable detail accurately and fairly reflect our transactions and dispositions of our assets; |
| • | provide reasonable assurance that transactions are recorded as necessary to permit preparation of financial statements in accordance with generally accepted accounting principles, and that our receipts and expenditures are being made only in accordance with authorizations of our management and directors; and |
| • | provide reasonable assurance regarding prevention or timely detection of unauthorized acquisition, use or disposition of our assets that could have a material effect on our financial statements. |
Because of its inherent limitations, internal control over financial reporting may not prevent or detect misstatements. Also, projections of any evaluation of effectiveness to future periods are subject to the risk that controls may become inadequate because of changes in conditions, or that the degree of compliance with the policies or procedures may deteriorate. A material weakness is a deficiency, or a combination of deficiencies, in internal control over financial reporting, such that there is a reasonable possibility that a material misstatement of our annual or interim financial statements will not be prevented or detected on a timely basis.
Our management conducted a process to assess the effectiveness of our internal control over financial reporting as of December 31, 2013, based on the criteria established in Internal Control – Integrated Framework (1992) issued by the Committee of Sponsoring Organizations of the Treadway Commission, or COSO. This framework highlights that the control environment sets the tone of the organization, influences the control consciousness of its people, and is the foundation for all other components of internal control over financial reporting.
During the assessment process, we identified material weaknesses in our control environment related to establishing and maintaining accounting policies and procedures, process-level controls and accountability for recording complex transactions.
88
Table of Contents
The material weaknesses in the control environment described above contributed to material weaknesses at the control-activity level as we did not:
| • | design and maintain adequate procedures or controls over the accurate recording, presentation and disclosure of revenue and related costs of our complex customer contracts and agreements; |
| • | maintain adequate review and approval procedures over the recording of certain tangible and intangible assets and proper valuation of allowances for doubtful accounts receivable; or |
| • | maintain a sufficient complement of personnel with appropriate levels of accounting knowledge, experience, and training commensurate with the nature and complexity of our business and contract activity. |
The material weaknesses described above contributed to accounting errors that required the restatement of our consolidated financial statements for the fiscal year ended December 31, 2011 as well as the first three quarterly periods of the year ended December 31, 2012.
As a result of the material weaknesses described above, management has concluded that, as of December 31, 2013, our internal control over financial reporting was not effective. The “Report of Independent Registered Public Accounting Firm” relating to internal control over financial reporting as of December 31, 2013, is presented on page 91.
Evaluation of Disclosure Controls and Procedures
Disclosure controls and procedures (as defined in Rules 13a-15(e) and 15d-15(e) of the Exchange Act) are designed to ensure that information required to be disclosed by us in reports filed or submitted under the Exchange Act is recorded, processed, summarized and reported within the time periods specified in SEC rules and forms and that such information is accumulated and communicated to management including its principal executive officer and principal financial officer to allow timely decisions regarding required disclosures.
In connection with the preparation of this report, our management, under the supervision and with the participation of the current Chief Executive Officer and Chief Financial Officer, evaluated the effectiveness of our disclosure controls and procedures as of December 31, 2013. Based on the restatement of previously issued consolidated financial statements noted above, our identification of material weaknesses in internal control over financial reporting described above (which we view as an integral part of our disclosure controls) our inability to file our Annual Reports on Form 10-K for the fiscal years ended December 31, 2013 and December 31, 2012 and our Quarterly Report on Form 10-Q for the quarterly periods since September 30, 2012 within the statutory time periods, and the evaluation that we have performed, our current Chief Executive Officer and Chief Financial Officer concluded that, as of December 31, 2013, our disclosure controls and procedures were not effective.
Remediation of Material Weakness in Internal Control Over Financial Reporting
Our management is committed to the planning and implementation of remediation efforts to address all material weaknesses as well as other identified areas of risk. These remediation efforts, summarized below, which are implemented, in the process of being implemented or are planned for implementation, are intended to address the identified material weaknesses and to enhance our overall financial control environment.
During 2013 and 2014, numerous changes were made throughout our organization and significant actions have been taken to reinforce the importance of a strong control environment, including training and other steps designed to strengthen and enhance our control culture.
To remediate the control environment deficiencies identified herein, our leadership team, including the current Chief Executive Officer, and the current Chief Financial Officer, has reaffirmed and reemphasized the importance of internal control, control consciousness and a strong control environment.
89
Table of Contents
To date we have:
| • | adopted new accounting policies for revenue recognition and software capitalization; |
| • | established a contract governance committee to oversee all contracting activity; |
| • | appointed experienced professionals to key leadership positions; |
| • | established a new reporting structure with more clearly defined accountabilities; and |
| • | implemented a new internal reporting model and performance metrics based on cash flow performance. |
Our management believes that meaningful progress has been made against remaining remediation efforts; although timetables vary, management regards successful completion as an important priority. Remaining remediation activities include:
| • | restructuring key revenue, cost and related reimbursement accounting policies and processes; |
| • | centralizing certain accounting functions and revising organizational structures to enhance accurate reporting and ensure appropriate accountability; |
| • | hiring additional accounting personnel with appropriate backgrounds and skill sets; |
| • | completing the implementation of a more robust contract governance structure to assure appropriate administration, compliance and accounting treatment for new or amended contract terms; |
| • | establishing a contracting boundaries matrix to clarify the delegation of contracting authority to personnel involved in establishing customer contract terms; |
| • | establishing additional programs to provide appropriate accounting and controls training to financial, operations and sales staff and corporate executives on an ongoing basis; |
| • | establishing a formal delegation of authority from the Board of Directors to management with further delegation to accountable personnel; |
| • | expanding the use of our financial reporting systems to facilitate more robust analysis of operating performance, budgeting and forecasting; |
| • | enhancing our Sarbanes-Oxley compliance procedures; and |
| • | strengthening our current disclosure committee with formalized processes to enhance the transparency of our external financial reporting. |
When fully implemented and operational, our management believes the measures described above will remediate the control deficiencies we have identified and strengthen our internal control over financial reporting. We are committed to improving our internal control processes and intend to continue to review and improve our financial reporting controls and procedures. As we continue to evaluate and work to improve our internal control over financial reporting, we may take additional measures to address control deficiencies or determine to modify, or in appropriate circumstances not to complete, certain of the remediation measures described above.
Changes in Internal Control Over Financial Reporting
Other than matters discussed in this Item 9A, there have been no changes in our internal control over financial reporting since our last Quarterly Report filed on Form 10-Q for the period ended September 30, 2012 that have materially affected, or are reasonably likely to materially affect, our internal control over financial reporting.
90
Table of Contents
Report of Independent Registered Public Accounting Firm
To the Board of Directors and Stockholders
of Accretive Health, Inc.
We have audited Accretive Health, Inc.’s internal control over financial reporting as of December 31, 2013 based on criteria established in Internal Control-Integrated Framework issued by the Committee of Sponsoring Organizations of the Treadway Commission (1992 framework) (the COSO criteria). Accretive Health, Inc.’s management is responsible for maintaining effective internal control over financial reporting, and for its assessment of the effectiveness of internal control over financial reporting included in the accompanying Management’s Report on Internal Control over Financial Reporting. Our responsibility is to express an opinion on the company’s internal control over financial reporting based on our audit.
We conducted our audit in accordance with the standards of the Public Company Accounting Oversight Board (United States). Those standards require that we plan and perform the audit to obtain reasonable assurance about whether effective internal control over financial reporting was maintained in all material respects. Our audit included obtaining an understanding of internal control over financial reporting, assessing the risk that a material weakness exists, testing and evaluating the design and operating effectiveness of internal control based on the assessed risk, and performing such other procedures as we considered necessary in the circumstances. We believe that our audit provides a reasonable basis for our opinion.
A company’s internal control over financial reporting is a process designed to provide reasonable assurance regarding the reliability of financial reporting and the preparation of financial statements for external purposes in accordance with generally accepted accounting principles. A company’s internal control over financial reporting includes those policies and procedures that (1) pertain to the maintenance of records that, in reasonable detail, accurately and fairly reflect the transactions and dispositions of the assets of the company; (2) provide reasonable assurance that transactions are recorded as necessary to permit preparation of financial statements in accordance with generally accepted accounting principles, and that receipts and expenditures of the company are being made only in accordance with authorizations of management and directors of the company; and (3) provide reasonable assurance regarding prevention or timely detection of unauthorized acquisition, use or disposition of the company’s assets that could have a material effect on the financial statements.
Because of its inherent limitations, internal control over financial reporting may not prevent or detect misstatements. Also, projections of any evaluation of effectiveness to future periods are subject to the risk that controls may become inadequate because of changes in conditions, or that the degree of compliance with the policies or procedures may deteriorate.
A material weakness is a deficiency, or combination of deficiencies, in internal control over financial reporting, such that there is a reasonable possibility that a material misstatement of the company’s annual or interim financial statements will not be prevented or detected on a timely basis. The following material weaknesses have been identified and included in management’s assessment. Management has identified material weaknesses in its control environment related to establishing and maintaining accounting policies and procedures, process-level controls and accountability for recording complex transactions. Management has also identified material weaknesses at the control-activity level as it did not design and maintain adequate procedures or controls over the accurate recording, presentation and disclosure of revenue and related costs of its complex customer contracts and agreements, did not maintain adequate review and approval procedures over the recording of certain tangible and intangible assets and proper valuation of allowances for doubtful accounts receivable and did not maintain a sufficient complement of personnel with appropriate levels of accounting knowledge, experience, and training commensurate with the nature and complexity of its business and contract activity. We also have audited, in accordance with the standards of the Public Company Accounting Oversight Board (United States), the consolidated balance sheets of Accretive Health, Inc. as of December 31, 2013, 2012 and 2011 (as restated) and the related consolidated statements of operations and comprehensive income (loss), stockholders’ equity (deficit), and cash flows for each of the three years in the period ended December 31, 2013. These material weaknesses were considered in determining the nature, timing and extent of audit tests applied in our audits of the Company’s
91
Table of Contents
financial statements for the years ended December 31, 2013, 2012 and 2011, and this report does not affect our report dated December 30, 2014, which expressed an unqualified opinion on those financial statements.
In our opinion, because of the effect of the material weaknesses described above on the achievement of the objectives of the control criteria Accretive Health, Inc. has not maintained effective internal control over financial reporting as of December 31, 2013, based on the COSO criteria.
/s/ Ernst & Young LLP
Chicago, Illinois
December 30, 2014
| Item 9B. | Other Information |
None
92
Table of Contents
PART III
| Item 10. | Directors, Executive Officers and Corporate Governance |
Our Board of Directors
Set forth below is information about each member of our board of directors. This information includes each director’s age as of November 1, 2014, and length of service as a director of our company, his or her principal occupation and business experience for at least the past five years and the names of other publicly held companies of which he or she serves as a director. There are no family relationships among any of our directors, nominees for director or executive officers.
The term for each of our directors will expire in 2015 at our next annual meeting of stockholders. Directors that are elected into Class I of our board of directors at our next annual meeting of stockholders will be elected for a term of two years, directors that are elected into Class II of our board of directors at our next annual meeting of stockholders will be elected for a term of three years and directors that are elected into Class III of our board of directors at our next annual meeting of stockholders will be elected for a term of one year.
Class I Directors
J. Michael Cline. Age 54. Mr. Cline, a founder of Accretive Health, has been a member of our board of directors since August 2003 and served as chairman of the board from July 2009 through March 2013. Mr. Cline has served as the founding managing partner of Accretive, LLC, a private equity firm, since founding that firm in December 1999. From 1989 to 1999, Mr. Cline served as a general partner of General Atlantic Partners, LLC, a private equity firm. Mr. Cline serves on the boards of several privately-held companies. He also serves on the advisory board of the Harvard Business School Rock Center for Entrepreneurship, on the board of the National Fish and Wildlife Foundation and as a trustee of Panthera, an organization devoted to the preservation of the world’s wild cat species where he also chairs Panthera’s Tigers Forever initiative. We believe Mr. Cline’s career in private equity investing, his experience as a director of public and private companies, and his experience as a founder of our company provide him with sharp business acumen, financial expertise and deep experience providing strategic guidance to complex organizations.
Denis J. Nayden. Age 60. Mr. Nayden has been a member of our board of directors since October 2003 and served as co-chairman of our board until July 2009. Mr. Nayden has served as a managing partner of Oak Hill Capital Management, LLC, a private equity firm, since 2003. From 2000 to 2002, he was chairman and chief executive officer of GE Capital Corporation, the financing unit of General Electric Company, and prior to that had a 25-year tenure at General Electric. Mr. Nayden is a director of Genpact Limited, a publicly-held global provider of business process services; RSC Holdings Inc., a publicly-held equipment rental provider; and several privately-held companies. He also serves on the board of trustees of the University of Connecticut. We believe Mr. Nayden’s experience as chief executive of several large organizations, his experience in private equity investing and his experience as a director of public and private companies qualify him to serve on our board.
Emad Rizk, M.D., Age 52. Dr. Rizk has served as our president and chief executive officer and as a member of our board of directors since July 2014. From 2003 to June 2014, Dr. Rizk served as the president of McKesson Health Solutions, a division of McKesson Corporation, a healthcare services company. Prior to joining McKesson Health Solutions, Dr. Rizk served as the lead partner and global director, medical management/pharmacy for Deloitte Consulting from 1994 to 2003. Dr. Rizk currently serves on the board of directors of Accuray Incorporated, a publicly-held corporation, and the National Alliance for Hispanic Health, a nonprofit organization, and served as vice-chairman of the National Clinical Advisory Board, a healthcare organization focused on providing insight into the future direction of healthcare, management and delivery of patient care, from 1994 to 2000. We believe that Dr. Rizk’s experience as president of a division of a large, publicly-held corporation in the healthcare industry, together with his experience as a director of a publicly-held corporation, qualify him to serve on our board.
93
Table of Contents
Steve Shulman. Age 63. Mr. Shulman has been a member of our board of directors since April 2013, and was appointed Chairman of the Board of Directors effective April 2, 2014. Mr. Shulman has been an operating partner at Water Street Health Partners, a healthcare-focused private equity firm, since April 2008. Since 2008, Mr. Shulman has served as business executive at Shulman Family Ventures, a private equity firm. From 2008 until December 2013, Mr. Shulman served as operating partner at Tower Three Partners LLC, a private equity firm. From December 2002 to February 2008, Mr. Shulman served as chairman and chief executive officer of Magellan Health Services, a specialty healthcare management organization. From 2000 to 2002, he served as chairman and chief executive officer of Internet Healthcare Group (IHCG), an early-stage healthcare services and technology venture fund that he founded. From 1997 to 1999, Mr. Shulman served as chairman, president and chief executive officer of Prudential Healthcare, Inc. Mr. Shulman serves on the boards of several privately-held companies. He also serves on the Dean’s Council at the State University of New York at Stony Brook. We believe that Mr. Shulman’s experience in private equity investment, his experience as an operating partner for a healthcare private equity firm and his experience as chief executive of several large organizations in the healthcare industry, as well as his experience as a director of several privately held companies, qualifies him to serve on our board.
Mary A. Tolan. Age 54. Ms. Tolan, a founder of Accretive Health, has served as a member of our board of directors since November 2003 and served as our president and chief executive officer from November 2003 through April 2013, and as non-executive chairman of the board from April 2013 through April 1, 2014. Since January 2013, Ms. Tolan has served as a founding managing partner of Chicago Pacific Founders, a healthcare focused investment firm. Prior to joining our company, Ms. Tolan spent 21 years at Accenture Ltd, a leading global management consulting, technology services and outsourcing company. At Accenture, Ms. Tolan served in several leadership roles, including group chief executive for the resources operating group that had approximately $2 billion in annual revenue, and as a member of Accenture’s executive committee and management committee. She serves on the board of trustees of the University of Chicago, Loyola University and the Lyric Opera of Chicago. We believe Ms. Tolan is qualified to serve as a director because of her leadership experience, skill and depth of understanding of our business and market gained from serving as our chief executive officer and founding our company. Further, Ms. Tolan’s experience as a director of both public and private companies provides her with sharp business acumen, financial expertise and deep experience providing strategic guidance to complex organizations.
Class II Directors
Edgar Bronfman, Jr. Age 59. Mr. Bronfman has been a member of our board of directors since October 2006. Mr. Bronfman is General Partner of Accretive LLC, a private equity firm, which he joined in 2002. From early 2004 until January, 2012, Mr. Bronfman served as chairman and chief executive officer of Warner Music Group, a publicly-held record company. Before joining Warner Music Group in March 2004, Mr. Bronfman served as chairman and chief executive officer of Lexa Partners LLC, a management venture capital group which he founded in April 2002. Mr. Bronfman was vice chairman of the board of directors of Vivendi Universal, S.A. from December 2000 until December 2003 and also served as an executive officer of Vivendi Universal from December 2000 until December 2001. Prior to the formation of Vivendi, Mr. Bronfman served as president and chief executive officer of The Seagram Company Ltd. from June 1994 until December 2000 and as president and chief operating officer of Seagram from 1989 until June 1994. Mr. Bronfman is a director of Warner Music Group, and IAC/InterActiveCorp, a publicly-held operator of Internet businesses. Mr. Bronfman is also a member of the board of trustees of the New York University Medical Center, and a member of the Council on Foreign Relations. We believe Mr. Bronfman’s experience as chief executive of several large organizations, his experience in venture capital and private equity investing and his experience as a director of public and private companies qualify him to serve on our board.
APPAC, a minority shareholder group of Vivendi Universal, initiated an inquiry in the Paris Court of Appeal into various issues relating to Vivendi, including Vivendi’s financial disclosures, the appropriateness of executive compensation, and trading in Vivendi stock by certain individuals previously associated with Vivendi. The inquiry has encompassed certain trading by Mr. Bronfman in Vivendi stock. Several individuals, including
94
Table of Contents
Mr. Bronfman and the former CEO, CFO and COO of Vivendi, had been given the status of “mis en examen” in connection with the inquiry. Although there is no equivalent to “mis en examen” in the U.S. system of jurisprudence, it is a preliminary stage of proceedings that does not entail any filing of charges. In January 2009, the Paris public prosecutor formally recommended that no charges be filed and that Mr. Bronfman not be referred for trial. On October 22, 2009, the investigating magistrate rejected the prosecutor’s recommendation and released an order referring for trial Mr. Bronfman and six other individuals, including the former CEO, CFO and COO of Vivendi. While the inquiry encompassed various issues, Mr. Bronfman was referred for trial solely with respect to certain trading in Vivendi stock. In June 2010, Mr. Bronfman was part of a trial in the Trial Court in Paris at which the public prosecutor and the lead civil claimant both took the position that Mr. Bronfman should be acquitted. On January 21, 2011, the court found Mr. Bronfman guilty of the charge relating to his trading in Vivendi stock, found him not liable to the civil claimants, and imposed a fine of 5 million euros and a suspended sentence of 15 months. Mr. Bronfman appealed the Trial Court decision to the Paris Court of Appeal. In November 2013, Mr. Bronfman participated in a re-trial before a new judicial panel as part of his appeal of the Paris Trial Court’s 2011 ruling. In May 2014, the new judicial panel rendered its decision. The new judicial panel affirmed the Paris Trial Court’s finding that Mr. Bronfman was guilty of the charge, but stated that its finding would appear only in French judicial records and not Mr. Bronfman’s public record, removed the suspended sentence imposed by the Paris Trial Court and suspended 2.5 million Euros of the original fine of 5 million Euros. The new judicial panel affirmed the Paris Trial Court’s finding that Mr. Bronfman was not liable to the civil claimants. Mr. Bronfman has appealed the verdict and believes that his trading in Vivendi stock was proper. Under French law, the penalty is suspended pending the final outcome of the case.
Steven N. Kaplan. Age 54. Mr. Kaplan has been a member of our board of directors since July 2004. Since 1988, Mr. Kaplan has served as a professor at the University of Chicago Booth School of Business, where he currently is the Neubauer Family Professor of Entrepreneurship and Finance and serves as the faculty director of the Polsky Center for Entrepreneurship. Mr. Kaplan also serves as a director of Morningstar, Inc., a publicly-held provider of independent investment research, and on the boards of trustees of the Columbia Acorn Trust and Wanger Asset Trust. We believe Mr. Kaplan’s experience as a public and private company director and his experience in the field of entrepreneurship and management qualifies him to serve on our board.
Stephen F. Schuckenbrock. Age 54. Mr. Schuckenbrock has been a member of our board of directors since April 2013, served as our president and chief executive officer from April 2013 until July 2014 and continued to serve as an employee of Accretive Health until October 2014. Mr. Schuckenbrock has also served on the board of directors of Compuware Corporation since August 2013, where he serves as a member of its audit committee. From 2007 to March 2013, Mr. Schuckenbrock served in various positions at Dell, a global information technology company, including as President, Services from January 2011 to December 2012, President, Large Enterprise from January 2009 until January 2011, Chief Information Officer from September 2007 to January 2009, and Senior Vice President and President, Global Services from January to September 2007. From 2003 to 2007, Mr. Schuckenbrock was Co-Chief Operating Officer and Executive Vice President of Global Sales and Services for Electronic Data Systems Corporation, a global information technology company. From 2000 to 2003, he was Chief Operating Officer of The Feld Group, an information technology consulting firm. Mr. Schuckenbrock served as Global Chief Information Officer at PepsiCo from 1995 to 2000. We believe that Mr. Schuckenbrock’s experience as an executive at a large, publicly-held company, as well as his experience as president of certain large, complex divisions of a global publicly-held company, qualify him to serve on our board.
Robert V. Stanek. Age 61. Mr. Stanek has been a member of our board of directors since November 2013. Mr. Stanek joined the senior management team of Catholic Health East, a national healthcare system, in 1997 and served as its President and Chief Executive Officer from 2003 until his retirement in 2010. From 1992 to 1997, Mr. Stanek served in a variety of roles with the Mercy Health System of Western New York, including as its President and Chief Executive Officer. Mr. Stanek was elected to the board of trustees of the Catholic Health Association of the United States, the largest group of non-profit healthcare providers in the United States, in 2006, served as its Chairman from June 2011 through June 2012 and served as Speaker of the Assembly from
95
Table of Contents
June 2012 through June 2013. Mr. Stanek is currently a member of the board of directors of Accumen and Seamless Health. We believe that Mr. Stanek’s experience as president and chief executive officer and as a member of the board of trustees of a large, national hospital system qualifies him to serve on our board.
Class III Directors
Stanley N. Logan. Age 59. Mr. Logan has been a member of our board of directors since April 2011. Mr. Logan was a partner and chief operating officer of Sikich LLP, a management consulting firm, from February 2012 to October 2013. Previously, Mr. Logan served as a managing director in the forensic accounting practice of LECG Corporation, a global business advisory services consulting firm, from February 2010 until March 2011. From 2006 until 2009, Mr. Logan served as a vice president of Huron Consulting Group, a consulting firm. From 2003 to 2006, Mr. Logan was managing partner of KPMG LLP’s Chicago office and he was national sector leader for consumer products at KPMG in 2002. From 1980 to 2002, Mr. Logan held various positions at Arthur Andersen LLP, including audit partner, manager and senior accountant. Mr. Logan was a certified public accountant. From 2007 to July 2014, he served on the board of directors of Schawk, Inc. and was also a member of Schawk’s audit committee. From 2003 until 2007, Mr. Logan served on the boards of directors of The Field Museum, where he served as a member of its finance committee, and Ravinia Festival Association, where he served as a member of its audit committee. Currently, Mr. Logan is an independent advisor who consults with businesses on financial and operational matters. We believe that Mr. Logan’s extensive financial and accounting experience qualifies him to serve on our board.
Alex J. Mandl. Age 70. Mr. Mandl has been a member of our board of directors since November 2013. Mr. Mandl is currently the non-Executive Chairman of Gemalto N.V., a digital security company resulting from the merger of Axalto Holding N.V. and Gemplus International S.A. Mr. Mandl is also a director of Levan Power Corp., a privately held company. From June 2006 until December 2007, Mr. Mandl served as Executive Chairman of Gemalto. From 2002 to June 2006, Mr. Mandl was President, Chief Executive Officer and a member of the board of directors of Gemplus. He has served as Principal of ASM Investments, a company focusing on early stage funding in the technology sector, since 2001. From 1996 to 2001, Mr. Mandl was Chairman and CEO of Teligent, Inc., a telecommunications company. Mr. Mandl was AT&T’s President and Chief Operating Officer from 1994 to 1996, and its Executive Vice President and Chief Financial Officer from 1991 to 1993. From 1988 to 1991, Mr. Mandl was Chairman and Chief Executive Officer of Sea-Land Services Inc. Mr. Mandl served as a director of Dell Inc. from 1997 to October 2013. Mr. Mandl served from 2007 to 2010 as a director of Hewitt Associates, Inc. and from March 2008 to October 2010 as a director of Visteon Corporation. Mr. Mandl was a member of the board of directors of Horizon Lines, Inc. from January 2007 and became the Chairman in February 2011, retiring in April 2012. Mr. Mandl is currently a member of the board of directors of Gemalto N.V., Arise Virtual Solutions Inc. and Genpact Limited. We believe that Mr. Mandl’s experience as chief executive officer of several large organizations, as well as his experience as a director of private and publicly-held corporations qualify him to serve on our board.
Arthur H. Spiegel, III. Age 75. Mr. Spiegel has been a member of our board of directors since October 2003 and served as co-chairman of our board until July 2009. Since 2002, Mr. Spiegel has been a private investor. From 1996 until 2002, Mr. Spiegel was President of CSC Healthcare Group, which offered consulting, system integration, claims processing software and business process and IT outsourcing services to the healthcare industry. Mr. Spiegel founded APM Management Consultants, a healthcare consulting firm, in 1974 and served as its CEO until it was acquired by Computer Science Corporation in 1996. He serves on the boards of several privately-held companies. We believe Mr. Spiegel’s experience as an executive and director of several companies, together with his deep knowledge of healthcare IT and consulting qualify him to serve on our board.
Mark A. Wolfson. Age 62. Mr. Wolfson has been a member of our board of directors since October 2003. Mr. Wolfson is a senior advisor of Oak Hill Capital Management, LLC, a private equity firm, and is a founder and managing partner of Jasper Ridge Partners, L.P. (formerly known as Oak Hill Investment Management, L.P.). Mr. Wolfson has been on the faculty of the Stanford University Graduate School of Business since 1977, has served as its associate dean, and has held the title of consulting professor since 2001. He has been a research
96
Table of Contents
associate of the National Bureau of Economic Research since 1988 and serves on the executive committee of the Stanford Institute for Economic Policy Research. From 1999 to 2013, Mr. Wolfson served as a director of eGain Communications Corporation, a publicly-held provider of multi-channel customer service and knowledge management software and from 1999 to 2012, Mr. Wolfson served as a director of Financial Engines, Inc., a publicly-held provider of portfolio management and retirement services and investment advice; and several privately-held companies. He is also an advisor to the investment committee of the William and Flora Hewlett Foundation. We believe Mr. Wolfson’s experience as a public and private company director and his experience in the fields of economics and management qualifies him to serve on our board.
Our Executive Officers
Our executive officers and their respective ages and positions as of November 1, 2014, are described below. Our officers serve until they resign or the board terminates their position. There are no family relationships among any of our directors, nominees for director and executive officers.
Emad Rizk, M.D., Age 52. President and Chief Executive Officer. For more information, see “Our Board of Directors” above.
Peter Csapo. Age 43. Chief Financial Officer and Treasurer. Mr. Csapo has served as our chief financial officer since August 2014. From August 2011 through September 2013, Mr. Csapo served as the chief financial officer and area senior vice president of VHA Inc., a national network of not-for-profit healthcare organizations that work together to improve performance and efficiency in clinical, financial and operational management. From October 2004 through January 2011, Mr. Csapo was chief financial officer at McKesson Health Solutions, a division of diversified healthcare company McKesson Corporation, a healthcare services company. In addition to his role as Chief Financial Officer, Mr. Csapo also held various operating roles at McKesson Health Solutions from 2004 through 2011, including vice president of healthcare informatics from February 2007 through January 2010, and vice president of customer operations from February 2010 through January 2011. McKesson Health Solutions focuses on aligning providers and payers through cost and quality initiatives such as care management services and medical management and payment solutions software. From February 2011 through July 2011, and from October 2013 through July 2014, Mr. Csapo focused on personal investments and various community activities.
Joseph G. Flanagan, Age 43, Chief Operating Officer. Mr. Flanagan has served as our chief operating officer since May 2013. From February 2010 to April 2013, Mr. Flanagan served as senior vice president of Worldwide Operations at Applied Materials, Inc., which provides manufacturing solutions for the semiconductor, flat panel display and solar photovoltaic industries. From April 2006 to February 2010, Mr. Flanagan served in various capacities at Nortel Networks, a telecommunication company, including, from March 2009 to February 2010, as president of Nortel Business Services and senior vice president of Global Operations. Mr. Flanagan served most of his career at General Electric where he most recently was general manager of the organization’s Power Controls Division from February 2005 to April 2006. Prior to that, from June 1993 to February 2005, Mr. Flanagan held a number of positions including general manager, operations, GE Consumer and Industrial EMEA; general manager, mergers and acquisitions, GE Digital Energy; and general manager, Industrial Controls.
Section 16(a) Beneficial Ownership Reporting Compliance
Section 16(a) of the Exchange Act requires our directors, executive officers and the holders of more than 10% of our common stock to file with the SEC initial reports of ownership of our common stock and other equity securities on a Form 3 and reports of changes in such ownership on a Form 4 or Form 5. Officers, directors and 10% stockholders are required by SEC regulations to furnish us with copies of all Section 16(a) forms they file. To our knowledge, based solely on a review of our records and representations by the persons required to file these reports that no other reports were required, during the years ended December 31, 2012 and 2013, the reporting persons complied with all Section 16(a) filing requirements.
97
Table of Contents
Code of Business Conduct and Ethics
Our board of directors has adopted a written code of business conduct and ethics that applies to our directors, officers and employees, including our principal executive officer, principal financial officer, principal accounting officer or controller, or persons performing similar functions. A copy of the code of business conduct and ethics is posted on the Investor Relations section of our website, which is located at www.accretivehealth.com.
Audit Committee
Our board of directors has established a standing audit committee. The members of our audit committee are Messrs. Logan (chair), Kaplan and Wolfson. Our board of directors has determined that each of the members of our audit committee satisfies the requirements for financial literacy under the current requirements of NYSE rules and regulations. Our board of directors has further determined that Mr. Logan is an “audit committee financial expert” as such term is defined in Item 407(d)(5) of Regulation S-K.
| Item 11. | Executive Compensation |
COMPENSATION DISCUSSION AND ANALYSIS
This Compensation Discussion and Analysis, or CD&A, provides information about our executive compensation philosophy and the components of our compensation programs, including information about how we align the compensation for our named executive officers, or NEOs, with our goals and performance. The CD&A is intended to help readers better understand the information found in the tables and narrative that follow.
Due to our financial restatement, this CD&A describes the executive compensation decisions for both 2012 and 2013, as well as executive compensation decisions made to date in 2014. This CD&A focuses on the following current and former executive officers:
| 2012 NEOs |
2013 NEOs |
2014 CEOs, CFOs and COO | ||
| Mary Tolan Founder. Then President and Chief Executive Officer John Staton, Then Chief Financial Officer and Treasurer Richard Gillette Then Senior Vice President Gregory Kazarian Then Senior Vice President Andrew Appel Then Senior Vice President |
Stephen Schuckenbrock Then President and Chief Executive Officer Sean Orr Then Senior Vice President, Chief Financial Officer and Treasurer Joseph Flanagan Chief Operating Officer Mary Tolan Founder. Then President and Chief Executive Officer John Staton Then Chief Financial Officer and Treasurer Richard Gillette Then Senior Vice President Gregory Kazarian Then Senior Vice President |
Dr. Emad Rizk President and Chief Executive Officer Peter Csapo Chief Financial Officer and Treasurer Joseph Flanagan Chief Operating Officer Stephen Schuckenbrock Former President and Chief Executive Officer Sean Orr Senior Vice President and former Chief Financial Officer and Treasurer |
98
Table of Contents
Leadership Transitions Since 2012
We believe that having strong leadership in place is critical as we navigate challenges in the current dynamic healthcare market, and as we emerge from the financial restatement and other business challenges we have faced in recent years. Since 2012, we have focused on restructuring our leadership team in an effort to more effectively and efficiently allocate our resources for innovation, growth and improved customer service, as outlined below:
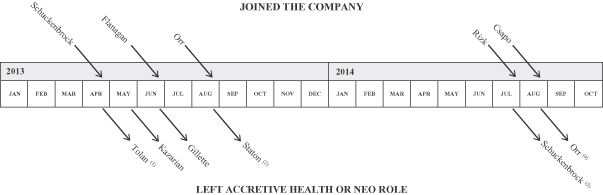
| (1) | Ms. Tolan became non-Executive Chairman in April 2013 and resigned from that role in April 2014. |
| (2) | In August 2013, Mr. Staton transitioned from the Chief Financial Officer to Senior Vice President, Provider Business Solutions. Mr. Staton left Accretive Health in April 2014. |
| (3) | Mr. Schuckenbrock joined Accretive Health in April 2013 as President and Chief Executive Officer and resigned from those roles in July 2014, when he became an advisor to the new Chief Executive Officer, Dr. Rizk. In October 2014, Mr. Schuckenbrock resigned as an employee of Accretive Health and remains on the Board of Directors. |
| 4) | Mr. Orr joined Accretive Health in August 2013 as Chief Financial Officer and Treasurer and left this position in August 2014, assuming the position of Senior Vice President, Finance. |
Compensation Objectives and Philosophy
| Our compensation programs aim to attract and retain highly talented executives by providing competitive pay and benefits, and rewarding our executives for performance that aligns with our operating and strategic goals, with the ultimate objective of increasing stockholder value. The structure of our programs enables us to provide a competitive total compensation package that ties a portion of each executive’s overall compensation to key corporate financial goals and significant accomplishments.
| ||
| At least 75% of target total direct executive compensation is in the form of short-term and long-term financial incentives. Both the short-term and long-term incentives are intended to align executives with stockholder interests and the successful execution of long-term strategic plans.
We attract and retain executives by providing a market competitive compensation program consisting of base salary, annual bonus and long-term incentives, coupled with benefits to support health, wellness and other life events. The box at the right highlights the key considerations behind the development, review and approval of our named executive officers’ compensation. |
Our named executive officer compensation program is designed to:
• Align the interests of our executives with those of our stockholders
• Pay for performance by rewarding the achievement of our annual and long-term operating and strategic goals
• Recognize individual contributions
• Attract, retain and motivate highly talented individuals who have the breadth and experience to successfully execute our business strategy | |
99
Table of Contents
Company Achievements
| Throughout our efforts to complete our financial restatement, we have used elements of our compensation program to help focus our named executive officers on restructuring, profitability and both current and future growth. During this period, our executives have achieved important goals including:
• Renewing our commercial relationship with multiple customers sharing a common affiliation, launching our first Net Promoter Score (NPS) survey with our customers, and putting new frontline management and operating processes and systems in place.
• Implementing restructuring actions to strengthen our foundation, which has improved organizational effectiveness, reduced cost and created a structure to drive customer focus and field engagement.
• Taking steps to position us to capture growth opportunities within the U.S. healthcare marketplace, including: |
Linking Pay with Performance
While we have made significant progress in strengthening our foundation, it has continued to be a challenging period during which we have fallen short of our financial targets. These results are, therefore, reflected in the awards our executives have received:
• As a result of our performance in 2012, named executive officers received no annual bonus, and were not granted any long-term incentives, for that year.
• As a result of our performance in 2013, incentive plans for our named executive officers paid below target levels, and they were not granted any long-term incentives, for that year.
Executive compensation for 2012 and 2013 was consistent with our compensation objectives and reflects our operating performance, demonstrating our commitment to pay our executives for the performance they deliver.
|
| • | Strengthening front-line teams – We have redeployed corporate resources to front-line teams at customer sites, including the relocation of resources closer to customers, to enhance operational execution and customer engagement. |
| • | Increasing investment in IT – We are investing over one-third of our 2014 information technology budget in technologies to enable us to more seamlessly integrate with customers’ existing technologies. |
| • | Simplifying the measurement model – We have made progress in simplifying our model to measure results for customers. |
| • | Improving the consistency of results for customers – We have developed a more rigorous and systematic approach to gather and apply the insights we gain from daily operations across the entire customer base. |
| • | Boosting sales and marketing efforts – New business development remains a priority and we have continued to recruit new sales personnel in recent months. |
| • | Making significant progress towards completing our financial restatement and substantially resolving our accounting issues. |
2012 and 2013 Compensation Decisions and Actions, and 2014 Decisions to Date
| Factors Guiding Our Decisions |
• Executive compensation program objectives and philosophy
• Operating performance
• Recommendations of the Chief Executive Officer for other named executive officers
• Advice of an independent compensation consultant
• Competitive market practices
• The need to attract critical, top tier talent at a challenging time for our company
|
100
Table of Contents
| 2011 Say-on-Pay Vote |
Our advisory, non-binding “say-on-pay” vote regarding the compensation of our named executive officers received a 99.8% favorable vote at our annual meeting of stockholders, in 2011. We did not make any changes to our 2012, 2013 or 2014 executive compensation programs as a result of that vote. | |
| Key Compensation Decisions
(see Analysis of 2012 and 2013 Compensation Decisions and 2014 Planned Compensation for details)
|
We have faced significant business challenges since 2012, which have informed our executive compensation decision making. The significant compensation decisions made during 2012, 2013 and 2014, as outlined below, demonstrate our commitment to recruit and retain the high caliber executives required to address our company’s challenges, and provide incentives tied to improved financial and stock performance.
2012 Base Salary
We increased the base salaries for Ms. Tolan and Mr. Appel by 3% each in 2012, based on a review of average salary increases reported through leading salary surveys. The base salaries of Messrs. Staton, Gillette and Kazarian were increased to $400,000 each in order to adjust their pay to the market level compensation being paid to senior executives with comparable responsibility and experience.
Annual Incentive
Based on our company’s performance in 2012, the Compensation Committee determined that no bonus awards would be made to named executive officers for this performance period.
Long-Term Incentives
Due to the financial restatement activity, and based on our company’s performance, no long-term incentives were granted to named executive officers in 2012.
2013 2013 was a year of transition, as we recruited and hired new executives to replace outgoing members of our executive team.
Base Salary
In February 2013, we increased the base salaries for Ms. Tolan, Mr. Staton, Mr. Gillette and Mr. Kazarian by 3% based on a review of average salary increases reported through leading salary surveys.
Base salaries for the new executive officers Messrs. Schuckenbrock, Orr and Flanagan, were $595,000, $450,000 and $595,000 respectively and were determined based on a negotiating process that reflected the need for executives capable of addressing the challenging issues facing the organization as well as competitive market data for similar positions in other technology, business process outsourcing and healthcare services companies. | |
101
Table of Contents
| Annual Incentive
Based on our performance during 2013, including significant accomplishments critical to the continued viability of the organization, the Compensation Committee determined that bonus payouts would be 70% of the target for Messrs. Schuckenbrock and Orr, and 80% of the target for Mr. Flanagan. Bonus targets for these named executive officers were prorated based on their 2013 dates of hire.
Long-Term Incentives
As part of the offer of employment, Messrs. Schuckenbrock, Orr and Flanagan each received substantial long-term incentive grants in the form of stock options and Mr. Flanagan also received restricted shares, to create an immediate and significant alignment between their interests and those of our stockholders, and to create a powerful incentive to increase the value of the organization and our stock price. Mr. Schuckenbrock received a stock option grant valued at $15,941,867; Mr. Orr received a stock option grant valued at $1,494,000; and Mr. Flanagan received a stock option grant valued at $4,392,000 and a restricted stock award grant valued at $4,588,000.
No other long-term incentives were granted to named executive officers in 2013.
2014 2014 has been another year of transition as new, highly experienced leadership members were recruited and hired to replace certain key executives including the Chief Executive Officer. Therefore, the decisions below reflect both the outgoing named executive officers as well as those newly hired.
Base Salary
No increases were made to the base salary of current named executive officers.
Salaries for the new named executive officers, Dr. Rizk and Mr. Csapo, are $750,000 and $470,000 respectively, and were determined based on competitive compensation data for similar positions and the need to attract leaders with the experience to meet our current business challenges.
Annual Incentive
Annual incentive decisions will be made at the beginning of 2015 based on our 2014 performance.
Long-Term Incentives
As part of the offer of employment, Dr. Rizk and Mr. Csapo each received long-term incentive grants in the form of stock options and restricted shares to provide a significant amount of their total compensation packages as variable pay and create an immediate alignment between their interests and those of our stockholders, and to provide a powerful incentive to increase our stock price and the value of the organization. Dr. Rizk received a stock option grant valued |
102
Table of Contents
| at $12,150,000, a time-based restricted stock award grant valued at $4,490,000 and a performance-based restricted stock grant valued at $3,620,000; Mr. Csapo received a stock option grant valued at $1,221,000 and a restricted stock award valued at $1,630,000.
No other long-term incentives were granted to named executive officers to date in 2014. | ||
Chairman of the Board of Directors Agreement
In March 2014, the NYSE, suspended trading of our stock and initiated delisting proceedings which resulted in our stock being delisted from trading on the NYSE in August 2014. These events, in concert with the continuing effects of both the negative publicity regarding our company in connection with the lawsuit filed against us in January 2012 by the Minnesota Attorney General and the restatement process, created an environment of volatility and uncertainty.
Since being appointed as Chairman of our Board of Directors in April 2014, Steven Shulman has played a pivotal role in assisting us in navigating this challenging business environment, including by leading and successfully concluding the search for our new Chief Executive Officer, Dr. Rizk, as well as assisting us to strengthen our relationships with certain of our key customers and helping to provide strategic direction for our company. In light of these circumstances, and the fact that we viewed, and continue to view, the leadership of Mr. Shulman as critical to our successful navigation of these significant business obstacles and as a valuable resource to assist our new Chief Executive Officer in developing and executing our strategy, in March 2014 our Board of Directors offered Mr. Shulman a substantial compensation package, which included a substantial equity component. The terms of that arrangement were negotiated between our Board of Directors and Mr. Shulman, and agreed upon in principle during late March and April 2014, however the Chairman Services Agreement embodying the terms of that arrangement was not executed until November 2014. Details of the Chairman Services Agreement are listed under Employee and Other Agreements in this Item 11—Executive Compensation.
Flanagan Retention Agreement
As an important incentive for Mr. Flanagan to remain with us during a critical juncture in our Chief Executive Officer transition process, we entered into an amended offer of employment agreement with Mr. Flanagan in April 2014. This arrangement provided for cash and equity compensation elements. The material terms of this agreement are described under Employee and Other Agreements in this Item 11—Executive Compensation.
103
Table of Contents
Aligning Pay with Performance
Pay-for-performance is one of the objectives of our executive compensation philosophy. Named executive officers earn target compensation only to the extent we achieve our corporate goals. Our incentive compensation programs for named executive officers are designed to link total compensation with achievement of our business goals, some of which are short-term, while others take several years to achieve. While adhering to this philosophy, we have used a non-formulaic approach in determining incentive awards for 2012 and 2013 in light of the restatement and attendant volatility.
|
Short-Term (Cash) Annual Cash Incentive Bonus |
Long-Term (Equity) Stock Options |
Long-Term (Equity) Restricted Stock Awards | ||||
| Objective |
Short-term business performance | Stockholder value creation | Stockholder value creation | |||
| Time Horizon |
1 year | Vests over 4 years Exercisable over 10 years |
Vests over 4 years | |||
| Metrics |
Specific tactical, strategic and financial business objectives
Individual performance |
Stock price | Stock price |
Our compensation decisions in recent years have been affected by our efforts to create a leadership team that will help ensure our company performs at its highest level. This focus, however, has not changed our strong emphasis on pay-for-performance. While we require competitive compensation packages to attract new leaders who will help Accretive Health perform well both internally and externally, we follow a compensation strategy that heavily emphasizes performance.
For our Chief Executive Officer, this means that a majority of his or her compensation is in the form of incentive compensation, and the majority of this is focused on delivering long-term performance.
During the leadership transitions we have experienced from 2012 through 2014, we have made decisions to ensure that the majority of long-term incentives are focused on our stockholders as well as our company’s future, leveraging our plans to build stockholder value. By making the greatest portion of our Chief Executive Officer’s compensation package in the form of stock options, with value directly tied to the increase in value of Accretive Health’s stock price, we aim to ensure that our compensation packages are strongly focused on pay-for-performance, not merely attraction and retention. The chart below shows the breakdown of Dr. Rizk’s 2014 compensation package, highlighting the emphasis on long-term incentives.
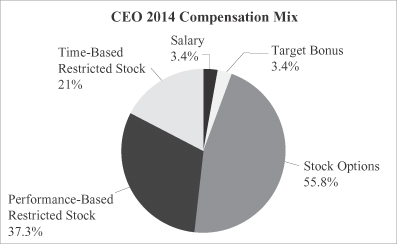
104
Table of Contents
Consideration of “Say-on-Pay” Vote
Our stockholders approved the non-binding advisory proposal on the compensation of our named executive officers with a 99.8% favorable vote at our 2011 annual meeting of stockholders. Based on this approval from stockholders, and in light of the financial restatement activity, the Compensation Committee determined that no changes to our compensation programs were warranted as a result of the stockholder advisory vote.
Also at our 2011 annual meeting of stockholders, our stockholders voted to adopt the recommendation of our Board of Directors to conduct future advisory votes on the compensation of our named executive officers every three years. Accordingly, the next stockholder advisory vote on the compensation of our named executive officers will be held at our next annual meeting of stockholders, currently expected to take place in 2015.
Determining Compensation
In determining compensation changes for named executive officers from year to year, the Compensation Committee generally focuses on total executive compensation, which consists of base salary, annual cash incentive bonus and long-term equity incentive awards.
Factors Guiding Decisions
| • | Compensation program objectives and philosophy |
| • | Company financial performance and important achievements |
| • | Assessment of leaders’ adherence to company values, their leadership traits and achievement of individual objectives |
| • | Recommendations of the Chief Executive Officer for other named executive officers |
| • | Stockholder input, including “say-on-pay” vote |
| • | Advice of an independent compensation consultant on market and peer group pay practices |
Role of Compensation Committee
Our Compensation Committee oversees our executive compensation program and has done so historically. In this role, the Compensation Committee has reviewed all compensation decisions relating to our named executive officers and has made recommendations to the Board of Directors. Our Compensation Committee has the authority, without approval of the Board of Directors, to retain and terminate an independent compensation consultant to assist in the evaluation of executive officer compensation.
Our Board of Directors has determined that each of the members of our Compensation Committee is independent as defined under the rules of the NYSE. Our Compensation Committee periodically works with an independent compensation consulting firm, Towers Watson, as described in “Roles of the Compensation Consultant” below.
Role of Chief Executive Officer
Our Chief Executive Officer annually reviews the performance of each of our other executive officers, and, based on these reviews, provides recommendations to the Compensation Committee and the Board of Directors with respect to salary adjustments, annual cash incentive bonus targets and awards and equity incentive awards. Our Compensation Committee meets with our Chief Executive Officer annually to discuss and review the Chief Executive Officer’s recommendations regarding executive compensation for our executive officers, excluding the Chief Executive Officer. These recommendations are forwarded to the Board of Directors, which typically meets in executive session to discuss those recommendations and to consider the compensation of the Chief Executive
105
Table of Contents
Officer. Our Chief Executive Officer is not present for Board of Directors or Compensation Committee discussions regarding the Chief Executive Officer’s compensation. Our Chief Executive Officer is authorized by the Compensation Committee to grant options to employees who are not directors or executive officers of our company and determine the number of shares covered by, and the timing of, option grants. The Board of Directors has, and it exercises, the ability to materially increase or decrease amounts of compensation payable to our executive officers pursuant to recommendations made by our Chief Executive Officer.
Roles of the Compensation Consultant
The Compensation Committee engages an independent compensation consulting firm from time to time to provide advice regarding our executive compensation program and general information regarding executive compensation practices in our industry. At the Compensation Committee’s request, the independent compensation consulting firm, The Delves Group (which became part of Towers Watson in 2013) and then Towers Watson advised the Compensation Committee in 2013 and 2014, but not in 2012, and provided advice on an ad hoc basis on some, but not all, executive compensation actions and decisions. The Compensation Committee and Board of Directors consider the compensation consulting firm’s advice regarding our executive compensation program, and then, ultimately, make their own decisions about these matters.
Executive Compensation Peer Group
This peer group is a select group of companies that our Compensation Committee believes are representative of the talent market in which we compete. Starting in 2013, the Compensation Committee has used and/or considered compensation data from this peer group as one of several inputs to help shape our compensation programs to make sure we continue to provide total compensation that is competitively positioned in the marketplace. The Compensation Committee has approved a set of peer companies which were selected based on the following criteria:
| • | Similar revenues and complexity of business model; |
| • | In the technology, business process outsourcing or health care services industries; and |
| • | Publicly traded in the United States. |
The Peer Group consists of the following companies for 2013 and 2014:
| Allscripts Healthcare Solutions |
Cognizant Technology Solutions | MAXIMUS | ||
| athenahealth |
Genpact | MedAssets | ||
| Catamaran (formerly SXC Health Solutions)
Cerner |
Global Payments | Quality Systems | ||
| Huron Consulting Group | salesforce.com | |||
| WNS Holdings | ||||
While the Board of Directors and Compensation Committee consider peer group data in determining the competitiveness of executive compensation, it is only one factor taken into consideration when determining the total compensation for our named executive officers. The Board of Directors and Compensation Committee also consider the other factors listed in “Factors Guiding Decisions” above.
Risk Considerations in our Compensation Program
The Compensation Committee provides a mix of executive compensation elements, as well as the design of such elements, in order to discourage management from assuming excessive risk. We believe that risks arising from our compensation policies and practices for our employees are not reasonably likely to have a material adverse effect on our business. In addition, the Compensation Committee believes that the mix and design of the components of executive compensation do not encourage management to assume excessive risks.
106
Table of Contents
Elements of the Executive Compensation Program
The following table describes how elements of compensation are intended to satisfy our compensation objectives.
| Purpose | Type of Compensation |
Important Features | ||||
| Base Salary | Fixed level of cash compensation to attract and retain key talent in a competitive marketplace | Cash |
• Determined based on evaluation of individual’s experience, position, current performance, internal pay equity, peer group compensation data and external market competitive data | |||
| Annual Incentive Bonus | Target cash incentive opportunity (set as a percentage of base salary) that encourages executives to achieve annual company operating plan goals | Cash |
• Provides compensation based on achievement of our operating plan goals, as well as individual performance against specific corporate objectives
• No minimum guaranteed payout | |||
| Long-Term Equity Incentive Awards | Helps ensure executive pay is directly linked to the achievement of our long-term objectives
Creates an ownership culture by aligning the interests of our named executive officers with the creation of value for our stockholders
Furthers our goal of executive retention |
Long-Term Equity |
• Provides our named executive officers with a strong link to our long-term performance by enhancing their accountability for long-term decision making
• Delivered through stock options and/or restricted stock awards
• Vests ratably over a four-year period | |||
| Benefits | Important element of a total rewards program and helps attract and retain executive talent | Benefit |
• Same broad-based benefits that are provided to all employees, including our 401(k) retirement plan, a medical care plan, vacation, short- and long-term disability coverage and standard company holidays
• Our named executive officers do not receive a matching 401(k) contribution from Accretive Health | |||
| Change of Control Benefits | Attracts and retains employees in a competitive market | Benefit | • Combination of “single trigger” and “double trigger” vesting, along with severance | |||
| Employment Agreements | Ensures continued dedication of employees in case of personal uncertainties or risk of job loss
Provides confidentiality and non-compete protections |
Benefit | • Specific for the individual | |||
107
Table of Contents
Analysis of 2012 and 2013 Compensation Decisions and 2014 Planned Compensation
| Annualized Base Salary | ||||||||
| Named Executive Officer |
2011 | 2012 | ||||||
| Mary Tolan |
$ | 710,500 | $ | 731,815 | ||||
| John Staton |
$ | 334,950 | $ | 400,000 | ||||
| Richard Gillette |
$ | 300,000 | $ | 400,000 | ||||
| Gregory Kazarian |
$ | 293,200 | $ | 400,000 | ||||
| Andrew Appel* |
$ | 600,000 | $ | 618,000 | ||||
| * | Mr. Appel left Accretive Health in May 2012. |
2013 Base Salary Decisions
In February 2013, our Compensation Committee elected to increase the 2013 base salaries for Ms. Tolan and Messrs. Staton, Gillette and Kazarian by 3% based on a review of average salary increases reported through leading salary surveys.
Salaries for the new executive team members, including named executive officers Messrs. Schuckenbrock, Orr and Flanagan, were determined based in part on competitive market data for similar positions in other technology, business process outsourcing and healthcare service companies. Individual negotiations during the recruiting and hiring process were also a factor in determining base salaries, which reflected the significant business challenges facing our company at the time.
108
Table of Contents
| Annualized Base Salary | ||||||||
| Named Executive Officer |
2012 | 2013 | ||||||
| Stephen Schuckenbrock |
N/A | $ | 595,000 | |||||
| Sean Orr |
N/A | $ | 450,000 | |||||
| Joseph Flanagan |
N/A | $ | 595,000 | |||||
| Mary Tolan |
$ | 731,815 | $ | 753,769 | ||||
| John Staton |
$ | 400,000 | $ | 412,000 | ||||
| Richard Gillette |
$ | 400,000 | $ | 412,000 | ||||
| Gregory Kazarian |
$ | 400,000 | $ | 412,000 | ||||
2014 Base Salary Decisions
In February 2014, our Compensation Committee elected not to increase base salaries for any named executive officers.
Salaries for the new executive team members, including named executive officers Dr. Rizk and Mr. Csapo, were determined based on competitive market data for similar positions and the need to attract leaders with the experience to meet our current business challenges. Individual negotiations during the recruiting and hiring process were a major factor in determining base salaries, which reflected the significant business challenges facing our company at the time.
| Annualized Base Salary | ||||||||
| Named Executive Officer |
2013 | 2014 | ||||||
| Emad Rizk |
N/A | $ | 750,000 | |||||
| Peter Csapo |
N/A | $ | 470,000 | |||||
| Stephen Schuckenbrock* |
$ | 595,000 | $ | 595,000 | ||||
| Sean Orr* |
$ | 450,000 | $ | 450,000 | ||||
| Joseph Flanagan |
$ | 595,000 | $ | 595,000 | ||||
| Mary Tolan* |
$ | 753,769 | $0 | |||||
| John Staton* |
$ | 412,000 | $ | 412,000 | ||||
| * | Ms. Tolan left Accretive Health in 2013 and Messrs. Schuckenbrock and Staton left in 2014. Mr. Orr resigned as Chief Financial Officer in August 2014 and is no longer an executive officer. |
109
Table of Contents
Annual Cash Incentive Bonus Design
| • | Our annual cash incentive bonus awards have varied significantly from year to year, and we expect that they will continue to vary, depending on actual corporate and individual performance results. |
| • | At the beginning of each year, our Board of Directors establishes our corporate financial and operational goals and individual incentive bonus targets. The goals established by the Board of Directors are based on our historical operating results and growth rates, as well as our expected future results, and are designed to require significant effort and operational success on the part of our named executive officers and Accretive Health. However, during the course of the year, the Board of Directors and our Compensation Committee may (based in part on recommendations of our Chief Executive Officer, with respect to our other named executive officers) adjust such goals as they deem appropriate. |
| • | Each named executive officer’s initial target annual bonus is established upon commencement of employment as part of the executive’s overall compensation package. The target annual bonus amount is then reviewed and may be adjusted in each subsequent year, if appropriate, based on external market data to ensure that the values reflect external competitiveness and internal equity. The Compensation Committee’s independent compensation consultant, using the same approach as described for annual base salary, periodically reviews the competitive range for annual cash incentive pay for the Chief Executive Officer and each named executive officer (which is set as a percentage of annual base salary) and provides such data to the Compensation Committee, which determines annual bonus targets. |
| • | If growth and performance expectations are exceeded, bonuses above target can be awarded and if they are not met, then bonuses below target, or no bonuses at all, may be awarded. Prior years’ performance and corresponding bonus award levels are considered when setting target bonuses for subsequent years. We believe this helps to calibrate incentive compensation with our performance. |
| • | The Board of Directors approves actual annual cash incentive bonuses, which are based on the recommendations of our Compensation Committee along with input from our Chief Executive Officer in the case of named executive officers other than the Chief Executive Officer. There are no minimum or maximum payout levels, and our Board of Directors has broad discretion to make adjustments to the awards. |
| • | For the years ended December 31, 2012 and 2013, our corporate financial goals were not based on a formulaic approach given the effects of the ongoing financial restatement and changes in our business. Instead, the Committee, in consultation with the Chief Executive Officer, developed a combination of specific financial, operational and tactical goals and milestones to be achieved to stabilize our company, assure its long-term viability and establish a solid foundation for profitable growth. |
| • | In light of our 2012 financial performance, management and the Board of Directors determined that we would forgo the payment of any cash bonuses for the year 2012 for employees with the title of senior vice president and above. However, in order to retain key employees, we made commitments to grant restricted stock awards to our senior vice presidents (but not to any of our executive officers or any other direct reports of our chief executive officer). Employees at the level of vice president and below received a cash bonus for 2012 based on an aggregate, company-wide bonus payout equal to 50% of target. |
| • | In 2013, although we missed our financial goals, the Compensation Committee believed that many of the effects of our ongoing financial restatement, such as increased challenges to obtaining new customers, were beyond management’s control. The compensation committee further believed that the management team performed well with regard to stabilizing our company and meeting other non-financial goals and therefore awarded bonuses equal to 70% to 80% of target. |
110
Table of Contents
2012 Annual Cash Incentive Bonus Decisions
Based on 2012 performance that fell below expectations and substantially short of our $120 million Adjusted EBITDA target, the Compensation Committee determined that no bonus awards would be made to named executive officers for this performance period. The table below shows the named executive officers’ target and actual bonuses for 2012:
| Annual Cash Incentive Bonus | ||||||||||||||||
| Named Executive Officer |
Target for 2012 | Target for 2012 as a Percent of Base Salary |
Actual Bonus Awarded in March 2013 for 2012 Performance |
Actual Bonus Award as Percent of 2013 Target Award |
||||||||||||
| Mary Tolan |
$ | 950,000 | 130 | % | $ | 0 | 0 | % | ||||||||
| John Staton |
$ | 300,000 | 75 | % | $ | 0 | 0 | % | ||||||||
| Richard Gillette |
$ | 300,000 | 75 | % | $ | 0 | 0 | % | ||||||||
| Gregory Kazarian |
$ | 300,000 | 75 | % | $ | 0 | 0 | % | ||||||||
| Andrew Appel* |
$ | 200,000 | 32 | % | $ | 0 | 0 | % | ||||||||
| * | Named executive officers who left Accretive Health during 2012 were not eligible to receive a bonus award for 2012. |
2013 Annual Cash Incentive Bonus Decisions
We reward our named executive officers to the extent they meet or exceed pre-established individual and corporate performance goals. For 2013, the Compensation Committee based annual cash incentive bonus decisions on progress towards the following goals:
| Drive Top-line Growth |
• Execute new RCM deals
• Secure major customer renewals | |
| Achieve Financial Goals |
• Deliver planned financial commitments for 2013 based upon revised mid-year budget (using an internal definition of Adjusted EBITDA that does not reflect changes to our revenue recognition policies resulting from our restatement)
• Establish foundation for sustained improvement in 2014 and beyond based on our restructuring/reorganization plan for 2013 and new financial projections | |
| Improve Customer Engagement |
• Implement specific Net Promoter Score (NPS) tools
• Implement patient engagement best practices | |
| Drive Organization / Employee Engagement |
• Achieve improvement in employee attrition for operating sites, call centers and shared service centers. Achieve improved cycle time to fill critical roles for operating sites, call centers and shared service centers
• Rollout employee engagement survey | |
| Get Bad News Behind Us |
• Resolve outstanding customer disputes and related litigation by year-end
• Complete financial restatement | |
Based on performance that fell below expectations in 2013, the Compensation Committee funded our company-wide bonus pool at 70% of target and granted bonus awards in February 2014 to the then-current named executive officers that ranged from 70% to 80% of target. In determining this level of award, the Compensation
111
Table of Contents
Committee took into account additional factors beyond company performance, including that, although the new leadership team had been in place only for a partial year, achievements had been made as described below:
Basis for 70% Bonus Pool Funding for 2013
Positive Factors Considered by the Compensation Committee in Determining the Bonus Pool
| • | New leadership team was in place for only part of the year |
| • | Our company was continuing to overcome significant issues from the past |
| • | Our company continued to work on completing the restatement, and continued to confront significant new accounting issues in the second half of 2013, which extended the restatement process |
Important Achievements
| • | Level of performance achieved (94% of achievable budgeted Adjusted EBITDA target exclusive of non-controllable regulatory and/or external impacts) |
| • | Net Promoter Score (NPS) measured and significant actions taken to improve |
| • | New management and operating systems in place |
| • | Shared services (including India) becoming a competitive advantage |
| • | Employee survey completed with actions underway; reduced attrition rates reflect improving environment |
| • | Satisfaction at numerous customers had improved |
| • | Significant progress had been made on the restatement; all significant policy issues resolved |
| • | Restructuring actions were resulting in meaningful cost reduction and improvements in organizational effectiveness |
| • | New sales team recruited and the sales process had been re-launched |
| • | Significant progress was made in getting the past customer disputes and litigation behind us |
| • | New financial model is designed to reduce overhead, deliver more profit flow through, and fund increased investment in technology and capabilities |
Our Compensation Committee awarded cash bonuses for 2013 to four of our then-current named executive officers, and three of these bonus awards were prorated based on the number of months of employment with us. The table below shows the named executive officers’ annual target, prorated target for 2013 and actual bonus for 2013:
| Annual Cash Incentive Bonus | ||||||||||||||||||||
| Named Executive Officer |
Target for 2013 |
Target for 2013 as a Percent of Base Salary |
Prorated 2013 Target* |
Actual Bonus Awarded in March 2014 for 2013 Performance |
Actual Bonus Award as Percent of 2013 Target (Prorated Target) Award |
|||||||||||||||
| Stephen Schuckenbrock |
$ | 595,000 | 100 | % | $ | 446,250 | $ | 312,375 | 70 | % | ||||||||||
| Sean Orr |
$ | 350,000 | 78 | % | $ | 116,667 | $81,667 | 70 | % | |||||||||||
| Joseph Flanagan |
$ | 595,000 | 100 | % | $ | 347,083 | $ | 277,667 | 80 | % | ||||||||||
| Mary Tolan** |
$ | 950,000 | 126 | % | N/A | $0 | 0 | % | ||||||||||||
| John Staton |
$ | 300,000 | 73 | % | N/A | $150,000 | 50 | % | ||||||||||||
| Richard Gillette** |
$ | 300,000 | 73 | % | N/A | $0 | 0 | % | ||||||||||||
| Gregory Kazarian** |
$ | 300,000 | 73 | % | N/A | $0 | 0 | % | ||||||||||||
| * | Prorated 2013 target bonus is based on the number of months of employment during that calendar year. |
| ** | Named executive officers who left Accretive Health during 2013 were not eligible to receive a bonus award. |
112
Table of Contents
2014 Annual Cash Incentive Target Bonuses
For 2014, the Compensation Committee will base annual cash incentive bonus decisions on progress towards the following goals. These goals are designed to help us build critical infrastructure and consistent operational execution capability to support sustainable growth in the future.
| Operations and Technology |
• Build and deliver multiyear profitability roadmap
• Achieve significant improvement in customer satisfaction as measured by Net Promoter Score
• Launch upgraded claims-denial reduction program
• Deliver reduction in customers’ operations costs as measured by growth in Net Operating Fees
• Achieve improvements in shared service center penetration rate and capabilities
• Develop integrated operations and technology scorecard metrics for 2014 | |
| Financial |
• Deliver financial commitments as measured by the 2014 budget (using an internal definition of Adjusted EBITDA that does not reflect changes to our revenue recognition policies resulting from our restatement) | |
| Controls |
• Achieve key elements of internal control remediation plan | |
| Strategy/Growth |
• Integrate physician advisory service into RCM service
• Increase operating focus on Value Based Reimbursement
• Achieve qualitative and quantitative improvement in sales | |
| People and Customers |
• Roll out company-wide talent management process, including specific focus on site talent and succession
• Continue to build critical skills with focus on customer facing roles and sales
• Review organizational structures to help ensure proper alignment | |
Based on our performance during 2014 and the named executive officer’s performance, the Compensation Committee will determine whether bonus awards will be made to the current named executive officers for 2014, with any such awards to be paid in March 2015. The table below shows the named executive officers’ annual target bonuses for 2014:
| Annual Cash Incentive Bonus | ||||||||
| Named Executive Officer |
Target for 2014 |
Target for 2014 as a Percent of Base Salary |
||||||
| Emad Rizk* |
$ | 750,000 | 100 | % | ||||
| Peter Csapo* |
$ | 376,000 | 80 | % | ||||
| Stephen Schuckenbrock** |
$ | 595,000 | 100 | % | ||||
| Sean Orr |
$ | 350,000 | 78 | % | ||||
| Joseph Flanagan |
$ | 595,000 | 100 | % | ||||
| John Staton** |
$ | 300,000 | 73 | % | ||||
| * | 2014 target bonus will be prorated based on the number of months of employment during that calendar year. |
| ** | Named executive officers who left Accretive Health during 2014 are not eligible to receive a bonus award. |
113
Table of Contents
Our Board of Directors uses our unaudited financial results to make initial performance determinations under our annual cash incentive bonus program, and those results may be adjusted in connection with the preparation of our audited consolidated financial statements. The purpose of the goals listed above was to establish a method for determining the payment of cash incentive bonuses. These performance goals are not intended as a prediction of our future performance.
Equity Incentive Awards
| • | Provide our named executive officers with a strong link to our long-term performance by enhancing their accountability for long-term decision making; |
| • | Help balance the short-term orientation of our annual cash incentive bonus program; |
| • | Create an ownership culture by aligning the interests of our named executive officers with the creation of value for our stockholders; and |
| • | Further our goal of executive retention. |
In determining the size of equity incentive awards to named executive officers, our Compensation Committee generally considers the executive’s experience, skills, level and scope of responsibilities, competitive practices for similar positions, and internal comparisons to other comparable positions in our company.
Stock Options
Stock options are a performance-based compensation component that only provide value when the market price exceeds the exercise price, tying executive compensation to stock price value and stockholder appreciation. Stock option grant date value is estimated using the Black-Scholes-Merton method of stock option valuation. Information about Accretive Health’s Black-Sholes valuation is presented as part of the summary compensation tables. Stock options are generally granted for a four-year vesting period, vesting ratably on each of the first four anniversaries of the applicable grant date.
Restricted Stock Awards
Restricted stock awards are time-based or performance-based. Time-based restricted stock awards generally vest ratably over four years. Time-based restricted stock awards are valued on an actual basis and their valuation is presented as part of the summary compensation tables.
Performance-based restricted stock awards vest at the end of the performance period, subject to the achievement of specified stock price goals. Performance-based restricted stock awards are valued on an actual basis (assuming that the applicable performance target has been fully achieved).
2012 Equity Incentive Decisions
Due to the financial restatement activity, and based on our performance, no additional equity awards were granted to our named executive officers in 2012.
114
Table of Contents
2013 Equity Incentive Decisions
Having been awarded grants in 2010 in connection with our initial public offering, no additional equity awards were awarded to Ms. Tolan or Messrs. Staton, Gillette, or Kazarian during 2013.
In connection with their offers of employment, Messrs. Schuckenbrock, Orr and Flanagan each received long-term incentive grants in the form of stock options and/or restricted stock as described below. These initial grants were determined as the result of a negotiating process, the need for highly skilled and experienced executives to address significant organizational and performance challenges and to provide an incentive to increase the value of the organization and price of our stock. The grants made to Messrs. Schuckenbrock and Flanagan were awarded outside our 2010 Stock Incentive Plan, or Plan, as employment inducement grants in accordance with the rules of the New York Stock Exchange.
No other long-term incentives were granted to named executive officers in 2013.
| Long-Term Incentive Awards | ||||||||||||||||||||
| Named Executive Officer |
Number of Stock Options |
Exercise Price |
Value of Stock Options |
Number of Restricted Stock Awards |
Value of Restricted Stock Awards |
|||||||||||||||
| Stephen Schuckenbrock* |
2,903,801 | $ | 9.56 | $ | 15,941,867 | N/A | N/A | |||||||||||||
| Sean Orr** |
300,000 | $ | 9.94 | $ | 1,494,000 | N/A | N/A | |||||||||||||
| Joseph Flanagan*** |
800,000 | $ | 11.47 | $ | 4,392,000 | 400,000 | $ | 4,588,000 | ||||||||||||
| * | Mr. Schuckenbrock’s stock options vest ratably over four years on a monthly basis. |
| ** | Mr. Orr’s stock options vest in equal annual installments over four years. |
| *** | Mr. Flanagan’s stock options and restricted shares vest in equal monthly installments over four years. |
2014 Equity Incentive Decisions
In connection with their offers of employment, Dr. Rizk and Mr. Csapo each received long-term incentive grants in the form of stock options and restricted shares in 2014, as specified below. These initial grants were determined as the result of a negotiating process, the need for highly skilled and experienced executives to address significant organizational and performance challenges and to provide a substantial incentive to significantly increase the value of the organization and price of the stock. These grants were awarded outside the Plan as employment inducement grants. As a result of Mr. Flanagan’s revised employment terms, the board granted him a one-time long-term incentive grant in December 2014, which grant is contingent upon the approval by our stockholders of an amendment to the Plan increasing the number of shares authorized for issuance under our plan to an amount sufficient to cover these grants.
No other long-term incentives were granted to named executive officers to date in 2014.
| Long-Term Incentive Awards | ||||||||||||||||||||
| Named Executive Officer |
Number of Stock Options |
Exercise Price |
Value of Stock Options |
Number of Restricted Stock Awards |
Value of Restricted Stock Awards |
|||||||||||||||
| Emad Rizk* Performance-Based |
— | — | — | 500,000 | $ | 3,620,000 | ||||||||||||||
| Emad Rizk*Time-Based |
2,700,000 | $ | 8.98 | $ | 12,150,000 | 500,000 | $ | 4,490,000 | ||||||||||||
| Peter Csapo** |
300,000 | $ | 8.15 | $ | 1,221,000 | 200,000 | $ | 1,630,000 | ||||||||||||
| Joseph Flanagan*** |
500,000 | $ | 8.05 | 2,025,000 | 300,000 | 2,415,000 | ||||||||||||||
| * | Dr. Rizk’s stock options vest in equal annual installments over four years. Half of his restricted stock vests in equal installments over four years and the remaining half vests based on a stock price performance goal achievement of $17.96 (which goal represents two times the closing price of a share of Accretive Health’s common stock on the grant date) which must be equaled or exceeded for at least 20 consecutive trading days. |
| ** | Mr. Csapo’s stock options and restricted shares vest in equal annual installments over four years. |
| *** | Mr. Flanagan’s stock options and restricted shares vest in equal monthly installments over two years. |
115
Table of Contents
Other Employee Benefits
We maintain broad-based benefits that are provided to all employees, including our 401(k) retirement plan, flexible spending accounts, a medical care plan, vacation, short- and long-term disability insurance and standard company holidays. Our named executive officers are eligible to participate in each of these programs on the same terms as non-executive employees; however, we do not provide a matching 401(k) contribution for any of our named executive officers.
Employee and Other Agreements
Special Agreement for Mr. Steven Shulman, the Chairman of the Board of Directors
As part of our strategy to navigate significant business challenges in March 2014, including the initiation of NYSE delisting proceedings and the continuing effects of both the negative publicity in connection with the lawsuit filed against us in January 2012 by the Minnesota Attorney General and the restatement process, our Board of Directors appointed Steven Shulman as our Chairman on April 2, 2014, and negotiated a substantial compensation package for Mr. Shulman’s services as our Chairman. Since being appointed as our Chairman, Mr. Shulman has played a pivotal role in assisting us in navigating this challenging business environment, including by leading and successfully concluding the search for our new Chief Executive Officer, Dr. Rizk, as well as assisting us to strengthen our relationships with certain of our key customers and helping to provide strategic direction for our company.
Our Chairman Services Agreement with Mr. Shulman, which reflects terms that were agreed upon in principle during late March and April 2014, but which was not executed until November 2014, provides for the following benefits to Mr. Shulman:
| • | Annual cash fee of $500,000; |
| • | A one-time payment of $291,667 in respect of services provided by Mr. Shulman between April 2, 2014 (the date of Mr. Shulman’s appointment as Chairman of our Board of Directors) and the date of execution of the Chairman Services Agreement; |
| • | A restricted stock award of 2,250,000 shares of our common stock, subject to approval by our stockholders at our next annual meeting of stockholders of an amendment to our 2010 Stock Incentive Plan (which we refer to as our 2010 Plan) increasing the number of shares authorized for issuance under our Plan to an amount sufficient to cover the grant of these shares of restricted stock to Mr. Shulman. |
| • | Of these 2,250,000 shares, 1,750,000 generally will vest in equal annual installments on each of the first three anniversaries of the date Mr. Shulman was appointed as our Chairman, subject to Mr. Shulman’s continued service as Chairman. These shares will also vest upon a termination of Mr. Shulman’s Chairman Agreement by us without cause, as defined in the Chairman Services Agreement. |
| • | The remaining 500,000 shares will vest on the third anniversary of the date Mr. Shulman was appointed as our Chairman (or upon a change in control transaction or our termination of the Chairman Services Agreement without cause, as defined in the Chairman Services Agreement), subject to (i) Mr. Shulman’s continued service as Chairman and (ii) the average closing price of our common stock as reported on the New York Stock Exchange (or if not then traded on NYSE, the principal national securities exchange in the United States on which our common stock is then traded), measured over ninety days exceeding 200% of the closing price of a share of our common stock on April 2, 2014 (or, if the average trading price of our common stock measured over a ninety day period exceeds the closing price of our common stock on April 2, 2014 by less than 200%, a pro-rata portion of these 500,000 shares of restricted common stock will vest based on |
116
Table of Contents
| the percentage of the closing price of our common stock on April 2, 2014 represented by such average trading price, using a linear interpolation between 100% and 200%). |
| • | In the event that (i) our stockholders do not approve an amendment to our 2010 Plan increasing the number of shares authorized for issuance under our 2010 Plan at our next annual meeting of stockholders in an amount sufficient to allow for the restricted stock award described above, (ii) our next annual stockholders meeting is not held prior to April 1, 2015 and either party terminates the Chairman Services Agreement within sixty days thereafter, or (iii) as of the first business day following our next annual meeting of stockholders, the company is subject to an agreement which provides for a change in control, and such agreement is terminated prior to its consummation, then Mr. Shulman would be entitled to receive a one-time payment equal to $400,000 for each month then-elapsed between April 2, 2014 and the first business day following our next annual stockholders meeting (pro-rated for partial months), less the portion of any annual fees he received during such time. |
If, as of the first business day following our next annual meeting of stockholders, we have either consummated a change in control transaction, or are subject to an agreement providing for a change in control transaction which is consummated after that date, then Mr. Shulman is entitled to receive a cash payment equal to the value of the shares of common stock which would have vested on or prior to the time of such change of control under his restricted stock award described above, had the restricted stock award been made on April 2, 2014, together with the value of any dividends that would have been paid on such shares prior to the change of control transaction.
Agreement for Dr. Emad Rizk
In connection with his appointment to Chief Executive Officer, in July 2014, we entered into an offer letter agreement with Dr. Rizk that provides him the following:
| • | Annual base salary of $750,000; |
| • | Annual target bonus opportunity of at least 100% of base salary; |
| • | Eligibility to participate in the employee benefit programs generally available to senior executives of our company; and |
| • | A non-statutory stock option to purchase up to 2,700,000 shares of our common stock at a per share exercise price equal to the closing price of our common stock on the grant date, and a restricted stock award for 1,000,000 shares of our common stock. |
| • | The stock option generally will vest in equal annual installments over four years following the grant date, subject to continued service with our company. |
| • | One-half of the restricted stock award generally will vest in equal annual installments over four years following the grant date, subject to continued service with our company. The remaining one-half of the restricted stock award generally will vest based on a stock price performance goal of two times the closing price of a share of our common stock on the grant date, which must be equaled or exceeded for at least 20 consecutive trading days based on the average closing price for such 20-consecutive trading day period. |
In the event that Dr. Rizk’s employment is terminated by us without “cause” or by Dr. Rizk for “good reason” (as defined in the offer letter agreement), in addition to any earned but unpaid salary and his accrued and vested benefits under our employee benefit programs, which are payable upon any termination of employment, Dr. Rizk also will be entitled to receive the following payments and benefits:
| • | A cash amount equal to two times Dr. Rizk’s base salary plus two times his target bonus, paid monthly for a period of 24 months following such termination, subject to Dr. Rizk’s timely execution of a general release of claims in favor of us and our affiliates; |
117
Table of Contents
| • | Continued company-subsidized health benefits for a period of 24 months following the date of such termination, subject to Dr. Rizk’s timely execution of a general release of claims in favor of us and our affiliates; |
| • | A pro-rata portion of an annual bonus for the calendar year in which such termination occurs based on actual results for such year; |
| • | A pro-rata portion of the time-based vesting equity awards will become vested and exercisable (as applicable) on such termination determined by multiplying the number of shares of common stock underlying such time-based vesting equity awards that would have become vested and exercisable (as applicable) on the anniversary of the grant date immediately following the date of such termination had such termination not occurred, by a fraction, the numerator of which is the number of days during which Dr. Rizk was employed by us for the period beginning on the anniversary of the grant date immediately preceding the date of such termination (or the grant date, if such termination occurs prior to the first anniversary of the grant date) and ending on the date of such termination, and the denominator of which is 365; |
| • | An additional portion of the time-based vesting equity awards will become vested and exercisable (as applicable) with respect to 25% of the shares of common stock underlying such time-based vesting equity awards; |
| • | The performance vesting restricted stock will vest or be forfeited on such termination based on achievement of the stock price goal, except that if such termination occurs prior to the second anniversary of the grant date, the two times stock price goal multiple will be replaced with a 1.5 times multiple, if such termination occurs prior to the first anniversary of the grant date, or a 1.75 times multiple, if such termination occurs on or following the first anniversary of the grant date but prior to the second anniversary of the grant date; and |
| • | In the case of such termination upon or within two years following the occurrence of a “change in control” (as defined in the offer letter agreement) of our company, full accelerated vesting of the outstanding, unvested portion of the time-based vesting equity awards. |
In addition, with regard to the performance vesting restricted stock, upon the occurrence of the first change in control to occur following the date of grant and while Dr. Rizk remains in our continued employment, to the extent that the stock price goal has not previously been achieved, the performance vesting restricted stock will vest or be forfeited upon the occurrence of such change in control based on the achievement of the stock price goal in relation to the highest per share price for our common stock in the change of control, except that if such change in control occurs prior to the second anniversary of the grant date, the two times stock price goal multiple will be replaced with a 1.5 times multiple, if such change in control occurs prior to the first anniversary of the grant date, or a 1.75 times multiple, if such change in control occurs on or following the first anniversary of the grant date but prior to the second anniversary of the grant date.
Agreement for Mr. Peter Csapo
In connection with his appointment to Chief Financial Officer and Treasurer, in August 2014 we and Mr. Csapo entered into an offer letter agreement that provides him the following:
| • | Annual base salary of $470,000; |
| • | Annual target bonus opportunity of at least 80% of base salary; |
| • | Eligibility to participate in the employee benefit programs generally available to senior executives of our company; and |
| • | A non-statutory stock option to purchase up to 300,000 shares of our common stock at a per share exercise price equal to the closing price of our common stock on the grant date, and a restricted stock award for 200,000 shares of our common stock, both of which will vest in equal annual installments over four years following the grant date, subject to continued service with us. These incentive equity grants were issued outside of our 2010 Stock Incentive Plan as employment inducement grants in accordance with the rules of the New York Stock Exchange. |
118
Table of Contents
In the event that Mr. Csapo’s employment is terminated by us without “cause” or by Mr. Csapo for “good reason” (as defined in the offer letter agreement), in addition to any earned but unpaid salary and his accrued and vested benefits under the employee benefit programs of our company, which are payable upon any termination of employment, Mr. Csapo also is entitled to receive the following payments and benefits:
| • | A cash amount equal Mr. Csapo’s base salary rate, paid monthly for a period of 12 months following the date of such termination, subject to Mr. Csapo’s timely execution of a general release of claims in favor of us and our affiliates; |
| • | Continued company-subsidized health benefits for a period of 12 months following the date of such termination, subject to Mr. Csapo’s timely execution of a general release of claims in favor of us and our affiliates; |
| • | If Mr. Csapo’s annual bonus for the fiscal year preceding the date of termination has not been paid prior to such termination, an annual bonus for such fiscal year equal to the amount of Mr. Csapo’s target bonus opportunity multiplied by the payout percentage that is approved by our Board of Directors for company-wide bonus payouts with respect to such fiscal year; |
| • | A pro-rata portion (based on the number of days that Mr. Csapo was employed by us during the fiscal year in which such termination occurred) of an annual bonus for the fiscal year in which such termination occurs based on actual results for such year, payable at the same time as it would have otherwise been paid had such termination not occurred; |
| • | A pro-rata portion (based on the number of days that Mr. Csapo was employed by us following the anniversary of the grant date immediately preceding the date of such termination (or following the grant date, if such termination occurs prior to the first anniversary of the grant date) divided by 365) of the unvested portion of his incentive equity awards outstanding at the time of termination that would have become vested and exercisable (as applicable) on the anniversary of the grant date immediately following the date of such termination had such termination not occurred will become vested and exercisable (as applicable) as of the date of such termination; |
| • | In the case of such termination upon or within the 90 days immediately preceding, or within one year following, the occurrence of a “change in control” (as defined in the offer letter agreement) of our company, full accelerated vesting of the outstanding, unvested portion of his incentive equity awards. |
Agreement for Mr. Joseph Flanagan
In connection with his appointment to Chief Operating Officer, in May 2013 we and Mr. Flanagan entered into an offer letter agreement that provides him the following:
| • | Annual base salary of $595,000; |
| • | Annual target bonus opportunity of at least 100% of base salary; |
| • | A $400,000 sign-on bonus; |
| • | A one-time payment of $30,000 (less required deductions) for relocation expenses in addition to relocation expense benefits commensurate with his position in accordance with our relocation program (which additional relocation expense benefits amounted to $266,680, and included reimbursement for expenses and losses incurred in connection with the sale of Mr. Flanagan’s then current residence in Singapore); |
| • | Eligibility to participate in the employee benefit programs generally available to our senior executives; and |
| • | A nonstatutory stock option to purchase up to 800,000 shares of our common stock at a per share exercise price equal to the closing price of the common stock on the grant date, and a restricted stock award for 400,000 shares of our common stock, both of which generally vest in equal monthly installments over 48 months, subject to continued service with us. These incentive equity awards were issued outside of our 2010 Stock Incentive Plan as employment inducement grants in accordance with the rules of the New York Stock Exchange. |
119
Table of Contents
| • | One-half of the unvested portion of these incentive equity awards will be subject to accelerated vesting upon the occurrence of a “change in control” (as defined in the offer letter agreement) of our company while Mr. Flanagan remains in the continued employment. |
In the event that Mr. Flanagan’s employment is terminated by us without “cause” or by Mr. Flanagan for “good reason,” in addition to any earned but unpaid salary and his accrued and vested benefits under our employee benefit programs, which are payable upon any termination of employment, Mr. Flanagan also will be entitled to receive:
| • | Continued salary and health benefits for a period of 12 months following the date of such termination, subject to Mr. Flanagan’s timely execution of a general release of claims in favor of us and our affiliates; |
| • | In the case of such termination prior to the first anniversary of the grant date of the equity awards, accelerated vesting of the outstanding, unvested portion of the equity awards that would have become vested on or prior to the first anniversary of the date of such termination; and |
| • | In the case of such termination upon or within one year following the occurrence of a “change in control” of our company, full accelerated vesting of the outstanding, unvested portion of Mr. Flanagan’s incentive equity awards. |
Amendment for Mr. Joseph Flanagan
As an incentive for Mr. Flanagan to remain with Accretive Health during a critical juncture during our Chief Executive Officer transition process in 2014, we amended his employment terms to provide him the following additional compensation and benefits:
| • | Monthly supplemental cash retention bonus of $25,000 for the duration of Mr. Flanagan’s employment; |
| • | One-time cash retention bonus of $1,700,000, payable on the April 29, 2016, which is the second anniversary of the date on which the agreement was signed; |
| • | Retention equity awards of a one-time non-statutory stock option to purchase up to 500,000 shares of our common stock at a per share exercise price equal to the closing price of our common stock on the grant date, and 300,000 shares of restricted stock, which incentive equity awards generally vest ratably on a monthly basis over a two year period, subject to the approval by our stockholders of an amendment to our 2010 Plan increasing the number of shares authorized for issuance under our Plan to an amount sufficient to cover these grants; |
| • | If our stockholders do not approve the amendment to our 2010 Plan described above prior to December 31, 2014, then in lieu of the incentive equity awards described above, Mr. Flanagan shall be entitled to receive cash payments from us following each date that any portion of such incentive equity grants would have otherwise vested equal to the value of each option (based on the difference between the exercise price and the closing price of our common stock on the applicable vesting date) and each share of restricted stock (based on the closing price of our common stock on the applicable vesting date) that would have otherwise vested on such date. |
| • | In the event that Mr. Flanagan’s employment is terminated by us without “cause” or by Mr. Flanagan for “good reason,” (each, as defined in Mr. Flanagan’s employment offer letter agreement) 100% of the unvested portion of Mr. Flanagan’s incentive equity grants made in connection with the amendment to Mr. Flanagan’s employment terms shall become vested. |
| • | In the event of a “change in control” (as defined in Mr. Flanagan’s applicable incentive equity award agreements), 50% of Mr. Flanagan’s then unvested incentive equity grants made in connection with the amendment to Mr. Flanagan’s employment terms shall become vested. |
120
Table of Contents
| • | Relocation expense benefits, including reimbursement for expenses and losses incurred in connection with the sale of Mr. Flanagan’s then-current residence in Dallas, Texas (which relocation expense benefits amounted to $372,961), plus a reimbursement of up to $6,000 per month in housing expenses for a period of two years; |
| • | Reimbursement of up to $50,000 for legal fees in connection with the negotiation and documentation of his employment agreement; and |
| • | An extension, under specified circumstances, of the period of time during which Mr. Flanagan may exercise the stock option that we awarded to him at the commencement of his employment in April 2013. This extension would be triggered upon a termination of Mr. Flanagan’s employment by us without cause or by Mr. Flanagan for good reason. If the extension is triggered, the then-vested portion of the stock option would remain exercisable for a period of time equal to sixty days plus the number of days that Mr. Flanagan is employed by us, but not longer than two years or until the stock option otherwise expires, if earlier. |
In addition to the compensation and benefits described above, we also provided Mr. Flanagan with $443,740 of additional relocation expense benefits between November 2013 and May 2014 in connection with our intended move of certain corporate functions from Chicago, Illinois to Plano, Texas (which move did not occur), which relocation expense benefits included reimbursement for expenses and losses incurred in connection with the sale of Mr. Flanagan’s then-current residence in Chicago, Illinois.
Agreement for Mr. Stephen Schuckenbrock
In connection with his appointment to Chief Executive Officer, in April 2013 we and Mr. Schuckenbrock entered into an offer letter agreement that provided him the following:
| • | Annual base salary of $595,000; |
| • | Annual target bonus opportunity of at least 100% of base salary; |
| • | Eligibility to participate in the employee benefit programs generally available to senior executives of our company; and |
| • | A non-statutory stock option to purchase up to 2,903,801 shares of our common stock with an exercise price of $9.56, which was the closing price of our common stock reported on the New York Stock Exchange on the grant date. |
| • | The stock option will vest and become exercisable on a ratable monthly basis over 48 months based on continued service to our company (including service as a member of our board of directors), subject to acceleration in specified circumstances, and will expire on the tenth anniversary of grant. The stock option was issued outside of our 2010 Stock Incentive Plan as an employment inducement grant in accordance with the rules of the New York Stock Exchange. |
In the case of a termination of Mr. Schuckenbrock’s service as a member of the Board, the stock option will be subject to the following treatment:
| • | In the event of a termination due to death or “disability” (as defined in the employment agreement), the stock option will be subject to one year of accelerated vesting, and the vested portion of the stock option as of the termination date after taking into account such accelerated vesting will remain exercisable for the remaining term of the stock option. |
| • | In the event of a termination for “cause” (as defined in the employment agreement), the vested portion of the Stock Option as of the termination date will remain exercisable for a period equal to the lesser of 30 days following such termination and the remaining term of the stock option. |
| • | In the event of a termination by us without cause or as a result of a “constructive termination without cause” by Mr. Schuckenbrock (as defined in the employment agreement), the stock option will be subject to (i) one year of accelerated vesting, in the case of a termination of employment, (ii) two years of accelerated vesting, |
121
Table of Contents
| in the case of a termination of his service on the Board, or (iii) full accelerated vesting, if such termination occurs upon or within six months prior to a “change in control” (as defined in the employment agreement), and the vested portion of the stock option as of the termination date after taking into account such accelerated vesting will remain exercisable for the remaining term of the stock option. |
| • | In the event of a voluntary resignation of Mr. Schuckenbrock, the vested portion of the stock option as of the termination date will remain exercisable (i) for a period equal to the lesser of 90 days following such termination and the remaining term of the stock option, if such termination occurs prior to the first anniversary of the start date, or (ii) for the remaining term of the stock option, if such termination occurs on or after the first anniversary of the start date. |
| • | In the event of a termination due to the scheduled expiration of the remaining term of employment or term of service on the Board in accordance with the employment agreement, the vested portion of the stock option as of the termination date will remain exercisable for the remaining term of the stock option. |
| • | The stock option will become fully vested and exercisable upon the occurrence of a change in control. |
Agreement for Mr. Sean Orr
In connection with his appointment to Chief Financial Officer and Treasurer, in August 2013 Mr. Orr and Accretive Health entered into an offer letter agreement that provides him the following:
| • | Annual base salary of $450,000; |
| • | Annual target bonus opportunity of $350,000; |
| • | One-time transition bonus of $50,000 and relocation benefits commensurate with his position in accordance with the company relocation program; |
| • | Eligibility to participate in the employee benefit programs generally available to senior executives of our company; and |
| • | A non-statutory stock option to purchase up to 300,000 shares of our common stock at a per share exercise price equal to the closing price of our common stock on the grant date; |
| • | The award generally vests 25% each year over four years, subject to continued service with us. |
In the event that Mr. Orr’s employment is terminated by us without cause, in addition to any earned but unpaid salary and his accrued and vested benefits under the employee benefit programs which are payable upon any termination of employment, Mr. Orr will also be entitled to receive continued salary and health benefits for a period of 12 months following the date of such termination, subject to Mr. Orr’s timely execution of a general release of claims in favor of us and our affiliates. Additionally, in connection with Mr. Orr’s resignation as our Chief Financial Officer, on August 6, 2014 we agreed that Mr. Orr shall also be entitled to the same severance benefits in the event of his voluntary resignation from our company.
Agreements for Ms. Mary Tolan
We entered into an at-will employment agreement with Mary Tolan, then President and Chief Executive Officer, in January 2004. Pursuant to the agreement, Ms. Tolan was entitled to:
| • | An annual base salary of at least $400,000, subject to adjustment by our Board of Directors; |
| • | A one-time cash performance bonus of $200,000 based on customer procurement during 2004 consistent with our business plan; and |
| • | 11,760,000 shares of restricted stock, which vested in equal monthly installments over four years ending November 2007. |
122
Table of Contents
Per her agreement, if Ms. Tolan’s employment was terminated due to her death or “disability,” if we terminated Ms. Tolan’s employment without “cause” or if Ms. Tolan terminated her employment for “good reason,” as defined in her employment agreement, Ms. Tolan was entitled to receive her base salary paid in accordance with our payroll practices during the 12 months following such termination, subject to a reduction for any compensation she earned from any new employment during the severance period, and Ms. Tolan’s outstanding stock-based awards would continue to vest until the earlier of 12 months following her termination or the end of the applicable award’s vesting period.
Ms. Tolan’s agreement also stated that in the event of a “change in control,” as defined in her employment agreement, 50% of all unvested shares of Ms. Tolan’s stock-based awards would accelerate and vest in full as of the effective date of the “change in control.” If Ms. Tolan’s employment was terminated without “cause” or if Ms. Tolan terminated her employment for “good reason” within 12 months after a “change in control,” the remaining 50% of all unvested shares of Ms. Tolan’s stock-based awards would accelerate and vest in full.
If Ms. Tolan was terminated for “cause,” she agreed to execute a limited stock power transferring all rights to vote the 11,760,000 shares of restricted stock granted to her pursuant to the employment agreement to a person we designated in our sole discretion. Ms. Tolan’s employment agreement restricted her from engaging in activities competitive with us, soliciting our employees and consultants, and diverting business from us for a period of 12 months following her termination.
In April 2013, Ms. Tolan and Accretive Health mutually agreed to transition the role of Chief Executive Officer to her successor, Stephen F. Schuckenbrock, and to have Ms. Tolan voluntarily resign all of her other roles as an employee and officer of our company. In connection with this transition, Accretive Health and Ms. Tolan entered into a Chairman’s Agreement and a related Mutual General Release Agreement, each dated April 24, 2013.
In connection with her service as non-executive Chairman, Ms. Tolan was entitled to the following compensation and benefits:
| • | An annual retainer of $731,000, for the duration of Ms. Tolan’s engagement as our non-executive Chairman; |
| • | Continued health benefits entirely subsidized by Accretive Health, pursuant to the Consolidated Omnibus Budget Reconciliation Act of 1985, for a period of up to 18 months following April 3, 2013; and |
| • | Continued vesting and exercisability of the outstanding stock options held by Ms. Tolan as of April 3, 2013, in accordance with the terms and conditions of the applicable equity award documentation, for the duration of her continued service to Accretive Health. Following termination of her continued service with us, the vested stock options held by Ms. Tolan remained exercisable for the remainder of the maximum stated term of the stock options. |
Agreement for Mr. John Staton
We entered into an at-will employment agreement with Mr. Staton, then Chief Financial Officer and Treasurer, effective June 2005. This agreement entitled Mr. Staton to:
| • | An annual base salary of at least $300,000, subject to adjustment by our Board of Directors and our Chief Executive Officer; |
| • | An annual performance bonus of up to $100,000 per year, with the full $100,000 guaranteed for each of his first two years of employment; and |
| • | An option to purchase 1,173,236 shares of our common stock at an exercise price of $0.77 per share, vesting in equal monthly installments over four years ending September 2009. |
123
Table of Contents
Per the agreement, if we terminated Mr. Staton’s employment without “cause” or if Mr. Staton terminated his employment for “good reason,” as those terms are defined in his employment agreement, Mr. Staton was entitled to receive $33,333 per month during the 18 months following such termination, subject to a reduction for any compensation he earned from any new employment during the severance period. The agreement also stated that if Mr. Staton’s employment was terminated without “cause” or if Mr. Staton terminated his employment for “good reason,” Mr. Staton and his family were entitled to continue to participate in our health insurance plan during the 18 months following termination to the extent of his participation prior to termination, and we were to pay the premiums that we paid prior to termination. Mr. Staton’s employment agreement restricted him from engaging in activities competitive with us, soliciting our employees and consultants, and diverting business from us for a period of 18 months following his termination.
In connection with Mr. Staton’s resignation of employment from our company on March 18, 2014, we amended our employment agreement with Mr. Staton to provide that Mr. Staton is entitled to receive the same benefits provided for in his employment agreement as if Mr. Staton’s employment had been terminated without cause.
Agreement for Mr. Gregory Kazarian
We entered into an offer letter with Mr. Kazarian, then senior vice president, in December 2003. This offer letter entitled Mr. Kazarian to:
| • | An annual base salary of $225,000; |
| • | A one-time cash performance bonus of $75,000 based on customer procurement; and |
| • | An option to purchase shares of our common stock then representing 1.5% of our common stock. In lieu of the option, in June 2004, our Board of Directors awarded Mr. Kazarian 980,000 shares of common stock, then representing 1.5% of our common stock, which vested in equal monthly installments over four years ending before January 2008. |
Per the offer letter, if we terminated Mr. Kazarian’s employment without cause, he was entitled to receive his current monthly base salary during the 12 months following such termination, subject to a reduction for any compensation he earned from any new employment during the severance period.
We entered into a Transition Agreement with Mr. Kazarian on April 24, 2013, in connection with Mr. Kazarian’s resignation from our company effective May 31, 2014. Pursuant to the Transition Agreement, Mr. Kazarian became entitled to up to one year’s post-employment compensation at Mr. Kazarian’s then current base salary of $412,000 and continued medical benefits for up to one year entirely subsidized by our company for the period ending on May 31, 2014. We also extended the exercise period under Mr. Kazarian’s vested options until May 31, 2014.
Agreement for Mr. Richard Gillette
We entered into an offer letter with Mr. Gillette, then senior vice president, in November 2004. This offer letter entitled Mr. Gillette to:
| • | An annual base salary of $190,000; |
| • | An annual bonus target of $60,000; and |
| • | An option to purchase 352,800 shares of our common stock at an exercise price of $0.29 per share, vesting in equal annual installments over four years ending December 2008. |
We entered into a Severance Agreement and Release of Claims with Mr. Gillette on June 28, 2013 in connection with the termination of Mr. Gillette’s employment. Pursuant to that agreement, Mr. Gillette became
124
Table of Contents
entitled to six months of post-employment compensation at his then-current base salary of $412,000 per annum, and continued medical benefits for six months, entirely subsidized by our Company. We also agreed to extend the exercise period under Mr. Gillette’s vested options until the later of (i) December 31, 2013 and (ii) the sixtieth day following the Company’s filing of its annual report on Form 10-K for the fiscal year 2012, but in either case, no later than the expiration of such options in accordance with their terms.
Agreement for Mr. Andrew Appel
We entered into an offer letter with Mr. Appel, then senior vice president, in July 2011. This offer letter entitled Mr. Appel to:
| • | An annual base salary of $600,000; |
| • | An annual bonus target of $200,000; and |
| • | An option to purchase 500,000 shares of our common stock at an exercise price of $30.14 per share, vesting in equal annual installments over four years ending July 2015. |
Per the offer letter, if we terminated Mr. Appel’s employment without cause, he was entitled to receive his current monthly base salary and benefits during the 12 months following such termination, subject to mitigation upon re-employment and an obligation to pursue re-employment options with reasonable diligence.
Severance and Change-of-Control Arrangements
Change-of-control incentives can encourage our executives to objectively evaluate potential transactions that may be in stockholders’ best interests, further aligning the interests of our executives with those of our stockholders. We have designed our change-of-control compensation provisions to:
| 1. | Protect the compensation already earned by executives and help ensure they will be treated fairly in the event of a change of control, and |
| 2. | Help ensure the retention and focus of key executives who are critical to ongoing operations of Accretive Health. |
We have employment agreements with each of Emad Rizk, our Chief Executive Officer, Peter Csapo, our Chief Financial Officer, and Stephen Schuckenbrock, our former Chief Executive Officer and a member of our Board of Directors, that provide for “double trigger” benefits in connection with a change of control of our company together with the termination of employment and an employment agreement with Joseph Flanagan, our Chief Operating Officer, that provides for both “single trigger” and “double trigger” benefits in connection with a change in control of our company together (with respect to the “double trigger” benefits) with the termination of Mr. Flanagan’s employment. Details of these agreements are listed under “Employee and Other Agreements”.
Deductibility of Executive Compensation
Section 162(m) of the Internal Revenue Code generally disallows a tax deduction for compensation in excess of $1.0 million paid to our Chief Executive Officer and our three other officers (other than our Chief Executive Officer and our Chief Financial Officer), whose compensation is required to be reported to our stockholders pursuant to the Exchange Act by reason of being among the three other most highly paid executive officers. Qualifying performance-based compensation is not subject to the deduction limitation if specified requirements are met. Our Board of Directors or Compensation Committee may, in their judgment, authorize compensation payments that are not exempt under Section 162(m) when they believe that such payments are appropriate to attract and retain executive talent.
125
Table of Contents
Summary Compensation Table for 2012
The following table sets forth information regarding compensation earned by our chief executive officer, our chief financial officer and the three most highly compensated executive officers during fiscal year 2012 (other than our chief executive officer and chief financial officer) who were serving as executive officers at the end of our fiscal year ended December 31, 2012. We refer to these individuals as our 2012 named executive officers.
| Name and Principal Position |
Year | Salary ($) |
Bonus ($) |
Stock Awards (1) ($) |
Option Awards (1) ($) |
Non-Equity Incentive Plan Compensation(6) ($) |
All Other Compensation ($) |
Total ($) |
||||||||||||||||||||||||
| Mary A. Tolan |
2012 | $ | 731,815 | $ | — | $ | — | $ | — | $ | — | $ | 4,399 | (3) | $ | 736,214 | ||||||||||||||||
| Founder, Then President and |
2011 | $ | 710,500 | $ | — | $ | — | $ | — | $ | 855,000 | $ | 5,866 | (3) | $ | 1,571,366 | ||||||||||||||||
| Chief Executive Officer (2) |
2010 | $ | 700,000 | $ | — | $ | — | $ | 8,852,105 | $ | 760,000 | $ | 4,883 | (3) | $ | 10,316,988 | ||||||||||||||||
| John T. Staton |
2012 | $ | 400,000 | $ | — | $ | — | $ | — | $ | — | $ | 3,350 | (3) | $ | 403,350 | ||||||||||||||||
| Then Chief Financial Officer |
2011 | $ | 334,950 | $ | — | $ | — | $ | — | $ | 232,200 | $ | 4,083 | (3) | $ | 571,233 | ||||||||||||||||
| & Treasurer |
2010 | $ | 330,000 | $ | — | $ | — | $ | 3,393,307 | $ | 206,400 | $ | 3,404 | (3) | $ | 3,933,111 | ||||||||||||||||
| Richard E. Gillette |
2012 | $ | 400,000 | $ | — | $ | — | $ | — | $ | — | $ | 43,869 | (4) | $ | 443,869 | ||||||||||||||||
| Then Senior Vice President |
2011 | $ | 300,000 | $ | — | $ | — | $ | 1,384,660 | $ | 219,600 | $ | 57,864 | (4) | $ | 1,962,124 | ||||||||||||||||
| 2010 | $ | 256,750 | $ | — | $ | — | $ | 2,124,505 | $ | 244,000 | $ | 73,063 | (4) | $ | 2,698,318 | |||||||||||||||||
| Gregory N. Kazarian |
2012 | $ | 400,000 | $ | — | $ | — | $ | — | $ | — | — | $ | 400,000 | ||||||||||||||||||
| Then Senior Vice President |
2011 | $ | 293,183 | $ | — | $ | — | $ | — | $ | 182,025 | $ | — | $ | 475,208 | |||||||||||||||||
| 2010 | $ | 288,850 | $ | — | $ | — | $ | 2,124,505 | $ | 160,000 | $ | — | $ | 2,573,355 | ||||||||||||||||||
| Andrew M. Appel (5) |
2012 | $ | 250,766 | $ | — | $ | — | $ | — | $ | — | — | $ | 250,766 | ||||||||||||||||||
| Then Senior Vice President |
2011 | $ | 295,769 | $ | — | $ | — | $ | 7,470,950 | $ | 90,000 | $ | — | $ | 7,856,719 | |||||||||||||||||
| (1) | Valuation of these option awards is based on the dollar amount of share-based compensation expense that we recognized for financial statement reporting purposes in 2010, 2011 and 2012 computed in accordance with ASC 718, excluding the impact of estimated forfeitures related to service-based vesting conditions. These amounts do not represent the actual amounts paid to or realized by the named executive officer during 2010, 2011 and 2012. The assumptions used by us with respect to the valuation of option awards are the same as those set forth in Note 6, Share-Based Compensation, to our consolidated financial statements included in this Annual Report on Form 10-K. |
| (2) | Ms. Tolan is also a member of our board of directors but did not receive any additional compensation in her capacity as a director while also serving as CEO. |
| (3) | For Ms. Tolan and Mr. Staton, these amounts represent long-term disability insurance premiums paid by us on behalf of each such named executive officer. |
| (4) | For Mr. Gillette in fiscal year 2012 this amount represents the aggregate incremental cost to us for reimbursing Mr. Gillette for travel, lodging and related expenses for the commute between his residence and our offices and customers in Michigan. For fiscal years 2010 and 2011 this amount represents reimbursement of Mr. Gillette’s travel expenses, a portion of which were commuting expenses reimbursed to him as a benefit and a portion of which were business expenses reimbursed to him. |
| (5) | Mr. Appel’s 2011 bonus payout was pro-rated for the year ended December 31, 2011 because he joined our company in July 2011. Mr. Appel left our company in 2012 and is not entitled to the non-equity incentive plan compensation listed in the table. |
| (6) | Represents payments to named executive officers under our annual cash incentive bonus program. |
126
Table of Contents
Summary Compensation Table for 2013
The following table sets forth information regarding compensation earned by our chief executive officer, our chief financial officer and the three most highly compensated executive officers during fiscal year 2013 (other than our chief executive officer and chief financial officer) who were serving as executive officers at the end of our fiscal year ended December 31, 2013. We refer to these individuals as our 2013 named executive officers.
| Name and Principal |
Year | Salary ($) |
Bonus ($) |
Stock Awards (1) ($) |
Option Awards (1) ($) |
Non-Equity Incentive Plan Compensation (15) ($) |
All Other Compensation ($) |
Total ($) |
||||||||||||||||||||||||
| Stephen F. Schuckenbrock (2) |
2013 | $ | 422,054 | $ | — | $ | — | $ | 15,941,867 | $ | 312,375 | $ | 62,961 | (9) | $ | 16,739,257 | ||||||||||||||||
| Then President and Chief Executive Officer |
||||||||||||||||||||||||||||||||
| Sean F. Orr (3) |
2013 | $ | 158,654 | $ | 50,000 | $ | — | $ | 1,494,000 | $ | 81,667 | $ | 112,561 | (10) | $ | 1,896,882 | ||||||||||||||||
| Then Senior Vice President, Chief Financial Officer & Treasurer |
||||||||||||||||||||||||||||||||
| Joseph Flanagan (4) |
2013 | $ | 345,175 | $ | 400,000 | $ | 4,588,000 | $ | 4,392,000 | $ | 277,667 | $ | 312,935 | (10) | $ | 10,315,777 | ||||||||||||||||
| Chief Operating Officer |
||||||||||||||||||||||||||||||||
| Mary A. Tolan (5) |
2013 | $ | 251,256 | $ | — | $ | — | $ | — | $ | — | $ | 545,609 | (11) | $ | 796,865 | ||||||||||||||||
| Founder, Then President & |
2012 | $ | 731,815 | $ | — | $ | — | $ | — | $ | — | $ | 4,399 | (11) | $ | 736,214 | ||||||||||||||||
| Chief Executive Officer |
2011 | $ | 710,500 | $ | — | $ | — | $ | — | $ | 855,000 | $ | 5,866 | (11) | $ | 1,571,366 | ||||||||||||||||
| John T. Staton (6) |
2013 | $ | 413,000 | $ | — | $ | — | $ | — | $ | 150,000 | $ | 2,792 | (11) | $ | 565,792 | ||||||||||||||||
| Then Chief Financial |
2012 | $ | 400,000 | $ | — | $ | — | $ | — | $ | — | $ | 3,350 | (11) | $ | 403,350 | ||||||||||||||||
| Officer & Treasurer |
2011 | $ | 334,950 | $ | — | $ | — | $ | — | $ | 232,200 | $ | 4,083 | (11) | $ | 571,233 | ||||||||||||||||
| Richard E. Gillette (7) |
2013 | $ | 223,208 | $ | — | $ | — | $ | — | $ | — | $ | 250,803 | (12) | $ | 474,011 | ||||||||||||||||
| Then Senior Vice President |
2012 | $ | 400,000 | $ | — | $ | — | $ | — | $ | — | $ | 43,869 | (13) | $ | 443,869 | ||||||||||||||||
| 2011 | $ | 300,000 | $ | — | $ | — | $ | 1,384,660 | $ | 219,600 | $ | 57,864 | (13) | $ | 1,962,124 | |||||||||||||||||
| Gregory N. Kazarian (8) |
2013 | $ | 171,666 | $ | — | $ | — | $ | — | $ | — | $ | 240,330 | (14) | $ | 411,996 | ||||||||||||||||
| Then Senior Vice President |
2012 | $ | 400,000 | $ | — | $ | — | $ | — | $ | — | — | $ | 400,000 | ||||||||||||||||||
| 2011 | $ | 293,183 | $ | — | $ | — | $ | — | $ | 182,025 | $ | — | $ | 475,208 | ||||||||||||||||||
| (1) | Valuation of these option and stock awards is based on the dollar amount of share-based compensation expense that we recognized for financial statement reporting purposes in 2011, 2012 and 2013 computed in accordance with ASC 718, excluding the impact of estimated forfeitures related to service-based vesting conditions. These amounts do not represent the actual amounts paid to or realized by the named executive officer during 2011, 2012 and 2013. The assumptions used by us with respect to the valuation of option awards are the same as those set forth in Note 6, Share-Based Compensation, to our consolidated financial statements included in this Annual Report on Form 10-K. |
| (2) | Mr. Schuckenbrock joined our company on April 3, 2013. |
| (3) | Mr. Orr joined our company on August 24, 2013. |
| (4) | Mr. Flanagan joined our company on June 3, 2013. |
| (5) | Ms. Tolan resigned from her role as President & Chief Executive Officer on April 3, 2013. |
| (6) | Mr. Staton resigned from his role as Chief Financial Officer & Treasurer. Mr. Staton remained with our company and assumed the role of Senior Vice President, Provider Business Solutions. |
| (7) | Mr. Gillette resigned from his role as Senior Vice President on June 28, 2013. |
| (8) | Mr. Kazarian resigned from his role as Senior Vice President on May 31, 2013. |
| (9) | For Mr. Schuckenbrock this amount represents the aggregate incremental cost to our company for reimbursing Mr. Schuckenbrock for travel, lodging and related expenses for the commute between his residence and our company’s headquarters in Chicago. |
| (10) | These amounts for Messrs. Orr and Flanagan represent expenses incurred as part of relocation benefits paid in 2013. |
| (11) | For Ms. Tolan and Mr. Staton, these amounts represent long-term disability insurance premiums paid by us on behalf of each such named executive officer. For fiscal year 2013, this amount includes $543,410 of fees paid to Ms. Tolan as a Director pursuant to the Chairman’s Agreement between us and Ms. Tolan. See “Agreements for Ms. Mary Tolan” in this Item 11 – Executive Compensation for more information. |
| (12) | For Mr. Gillette this amount represents his severance payments following his resignation from Accretive Health. |
| (13) | For Mr. Gillette in fiscal year 2012 this amount represents the aggregate incremental cost to us for reimbursing Mr. Gillette for travel, lodging and related expenses for the commute between his residence and our offices and customers in Michigan. For fiscal year 2011 this amount represents reimbursement of Mr. Gillette’s travel expenses, a portion of which were commuting expenses reimbursed to him as a benefit and a portion of which were business expenses reimbursed to him. |
| (14) | For Mr. Kazarian this amount represents severance payments following his resignation from Accretive Health. |
| (15) | Represents payments to named executive officers under our annual cash incentive bonus program. |
127
Table of Contents
Grants of Plan-Based Awards in 2012
The following table sets forth information regarding grants of compensation in the form of plan-based awards made during 2012 to our 2012 named executive officers.
| Estimated Future Payouts Under Non-Equity Incentive Plan Awards (1) |
||||||||||||||||
| Name |
Grant Date |
Threshold ($) |
Target ($) |
Maximum ($) |
||||||||||||
| Mary A. Tolan |
N/A | $ | — | $ | 950,000 | $ | — | |||||||||
| John T. Staton |
N/A | $ | — | $ | 300,000 | $ | — | |||||||||
| Richard E. Gillette |
N/A | $ | — | $ | 300,000 | $ | — | |||||||||
| Gregory N. Kazarian |
N/A | $ | — | $ | 300,000 | $ | — | |||||||||
| Andrew M. Appel |
N/A | $ | — | $ | 200,000 | $ | — | |||||||||
| (1) | Actual annual cash incentive bonuses paid under the annual cash incentive bonus program for 2012, if any, are disclosed in the “Summary Compensation Table”. There are no minimum or maximum payout levels, and our Board has broad discretion to make adjustments to the awards based on the factors discussed under the caption “Annual Cash Incentive Bonus.” |
Grants of Plan-Based Awards in 2013
The following table sets forth information for 2013 regarding grants of compensation in the form of plan-based awards made during 2013 to our 2013 named executive officers.
| Estimated Future Payouts Under Non-Equity Incentive Plan Awards (1) |
All Other Stock Awards: Number of Shares of Stock or Units (#) |
All Other Option Awards: Number of Securities Underlying Options (#)(3) |
Exercise or Base Price of Option Awards ($) |
Grant Date Fair Value of Stock and Option Awards ($)(4) |
||||||||||||||||||||||||||||
| Name |
Grant Date |
Threshold ($) |
Target ($) |
Maximum ($) |
||||||||||||||||||||||||||||
| Stephen F. Schuckenbrock |
N/A | $ | — | $ | 595,000 | $ | — | |||||||||||||||||||||||||
| 04/03/2013 | 2,903,801 | $ | 9.56 | $ | 15,941,867 | |||||||||||||||||||||||||||
| Sean F. Orr |
N/A | $ | — | $ | 350,000 | $ | — | |||||||||||||||||||||||||
| 08/26/2013 | 300,000 | $ | 9.94 | $ | 1,494,000 | |||||||||||||||||||||||||||
| Joseph Flanagan |
N/A | $ | — | $ | 595,000 | $ | — | |||||||||||||||||||||||||
| 06/03/2013 | 400,000 | (2) | $ | 4,588,000 | ||||||||||||||||||||||||||||
| 06/03/2013 | 800,000 | $ | 11.47 | $ | 4,392,000 | |||||||||||||||||||||||||||
| Mary A. Tolan |
N/A | $ | — | $ | 950,000 | $ | — | |||||||||||||||||||||||||
| John T. Staton |
N/A | $ | — | $ | 300,000 | $ | — | |||||||||||||||||||||||||
| Richard E. Gillette |
N/A | $ | — | $ | 300,000 | $ | — | |||||||||||||||||||||||||
| Gregory N. Kazarian |
N/A | $ | — | $ | 300,000 | $ | — | |||||||||||||||||||||||||
| (1) | Actual annual cash incentive bonuses paid under the annual cash incentive bonus program for 2013, if any, are disclosed in the “Summary Compensation Table.” There are no minimum or maximum payout levels, and our Board has broad discretion to make adjustments to the awards based on the factors discussed under the caption “Annual Cash Incentive Bonus.” |
| (2) | These restricted shares vest in equal monthly installments over four years, beginning one month from date of grant, based on continued employment. |
| (3) | For Mr. Schuckenbrock these options vest in equal monthly installments over four years, beginning on the date of the grant, based on continued service with us, including as a member of our board of directors. For |
128
Table of Contents
| Mr. Orr these options vest in equal annual installments over four years, beginning on the first anniversary of the date of grant, based on continued employment. For Mr. Flanagan these options vest in equal monthly installments over four years, beginning one month from date of grant, based on continued employment. |
| (4) | Valuation of these option and stock awards are based on the dollar amount of share-based compensation expense that we recognized for financial statement reporting purposes in 2013 computed in accordance with ASC 718, excluding the impact of estimated forfeitures related to service-based vesting conditions. These amounts do not represent the actual amounts paid to or realized by the executive officer during 2013. The assumptions used by us with respect to the valuation of option awards are the same as those set forth in Note 6 , Share-Based Compensation, to our consolidated financial statements included in this Annual Report on Form 10-K. |
Outstanding Equity Awards at Year Ended December 31, 2012
The following table sets forth information regarding stock options held by our named executive officers as of December 31, 2012. None of our 2012 named executive officers held any stock awards as of December 2012 or exercised any stock options and no restricted stock awards held by our 2012 named executive officers became vested during the fiscal year ended December 31, 2012.
| Option Awards | ||||||||||||||||
| Name |
Number of Securities Underlying Unexercised Options (#) Exercisable |
Number of Securities Underlying Unexercised Options (#) Unexercisable |
Option Exercise Price ($) |
Option Expiration Date |
||||||||||||
| Mary A. Tolan |
1,176,000 | (1) | — | $ | 14.71 | 02/03/2020 | ||||||||||
| John T. Stanton |
781,236 | (2) | — | $ | 0.77 | 09/01/2015 | ||||||||||
| 450,800 | (1) | — | $ | 14.71 | 02/03/2020 | |||||||||||
| Richard E. Gillette |
25,000 | (3) | 75,000 | (3) | $ | 27.08 | 04/04/2021 | |||||||||
| 282,240 | (1) | — | $ | 14.71 | 02/03/2020 | |||||||||||
| 78,400 | (1) | — | $ | 4.43 | 10/15/2017 | |||||||||||
| 78,400 | (1) | — | $ | 13.02 | 04/01/2019 | |||||||||||
| Gregory N. Kazarian |
282,240 | (1) | — | $ | 14.71 | 02/03/2020 | ||||||||||
| Andrew Appel (4) |
— | — | ||||||||||||||
| (1) | These options vested in four equal annual installments based on continued employment, and were immediately exercisable, provided that upon exercise the shares issued are subject to the same vesting and repurchase provisions that applied before exercise. |
| (2) | This option was immediately exercisable upon grant, and was fully vested as of September 1, 2009. |
| (3) | This option was subject to vesting in four equal annual installments based on continued employment. This option is not exercisable before vesting. |
| (4) | Mr. Appel left our company on May 25, 2012 and forfeited all options. Therefore, Mr. Appel had no outstanding options as of December 31, 2012. |
129
Table of Contents
Outstanding Equity Awards at Year Ended December 31, 2013
The following table sets forth information regarding stock options and stock held by our 2013 named executive officers as of December 31, 2013.
| Option Awards | Stock Awards | |||||||||||||||||||||||
| Name |
Number of Securities Underlying Unexercised Options (#) Exercisable |
Number of Securities Underlying Unexercised Options (#) Unexercisable |
Option Exercise Price ($) |
Option Expiration Date |
Number of Shares or Units of Stock That Have Not Vested (#) |
Market Value of Shares or Units of Stock That Have Not Vested ($) |
||||||||||||||||||
| Stephen F. Schuckenbrock |
483,960 | (1) | 2,419,841 | (1) | $ | 9.56 | 04/03/2023 | |||||||||||||||||
| Sean F. Orr |
— | 300,000 | (2) | $ | 9.94 | 08/26/2023 | ||||||||||||||||||
| Joseph Flanagan |
100,000 | (3) | 700,000 | (3) | $ | 11.47 | 06/03/2023 | |||||||||||||||||
| 350,000 | (4) | $ | 4,104,500 | |||||||||||||||||||||
| Mary A. Tolan |
1,176,000 | (5) | — | $ | 14.71 | 02/03/2020 | ||||||||||||||||||
| John T. Stanton |
781,236 | (6) | — | $ | 0.77 | 09/01/2015 | ||||||||||||||||||
| 450,800 | (5) | — | $ | 14.71 | 02/03/2020 | |||||||||||||||||||
| Richard E. Gillette |
50,000 | (7)(8) | — | $ | 27.08 | 04/04/2021 | ||||||||||||||||||
| 211,680 | (5)(9) | — | $ | 14.71 | 02/03/2020 | |||||||||||||||||||
| 78,400 | (5) | — | $ | 4.43 | 10/15/2017 | |||||||||||||||||||
| 78,400 | (5) | — | $ | 13.02 | 04/01/2019 | |||||||||||||||||||
| Gregory N. Kazarian |
211,680 | (5)(10) | — | $ | 14.71 | 02/03/2020 | ||||||||||||||||||
| (1) | These options vest in equal monthly installments over four years, beginning on the date of grant, based on continued service with us, including service as a member of our board of directors. |
| (2) | These options vest in equal annual installments over four years, beginning on the first anniversary of the date of grant, based on continued employment. |
| (3) | These options vest in equal monthly installments over four years, beginning one month from date of grant, based on continued employment. |
| (4) | These restricted shares vest in equal monthly installments over four years, beginning one month from date of grant, based on continued employment |
| (5) | These options vested equal annual installments based on continued employment, and were immediately exercisable, provided that upon exercise the shares issued are subject to the same vesting and repurchase provisions that applied before exercise. |
| (6) | This option was immediately exercisable upon grant, and as of September 1, 2009, was fully vested. |
| (7) | This option vests in four equal annual installments based on continued employment. This option is not exercisable before vesting. |
| (8) | This option was granted for a total of 100,000 shares, of which 50,000 were vested and exercisable at the time Mr. Gillette left the company. The exercise period of this option was extended and the option remains exercisable. |
| (9) | This option was granted for a total of 282,240 shares, of which 211,680 were vested and exercisable at the time Mr. Gillette left our company. The exercise period of this option was extended and the option remains exercisable. |
| (10) | This option was granted for a total of 282,240 shares, of which 211,680 were vested and exercisable at the time Mr. Kazarian left our company. The exercise period of this option was extended and the option remains exercisable. |
130
Table of Contents
Vested Shares of Restricted Stock at Year Ended December 31, 2013
The following table sets forth information regarding stock acquired upon vesting by our named executive officers during the year ended December 31, 2013.
| Stock Awards(1) | ||||||||
| Name |
Number of Shares Acquired on Vesting (#) |
Value Realized on Vesting ($)(2) |
||||||
| Stephen F. Schuckenbrock |
— | — | ||||||
| Sean F. Orr |
— | — | ||||||
| Joseph Flanagan |
50,000 | $ | 463,037 | |||||
| Mary A. Tolan |
— | — | ||||||
| John T. Stanton |
— | — | ||||||
| Richard E. Gillette |
— | — | ||||||
| Gregory N. Kazarian |
— | — | ||||||
| (1) | Represents shares of restricted stock that vested during the year ended December 31, 2013. |
| (2) | Based on the fair market value of the shares on the date of vesting. |
Director Compensation
We pay each non-employee director a $60,000 annual retainer. The chairs of the board of directors and the audit committee receive an additional annual retainer of $20,000, and the chairs of the compensation committee and the nominating and corporate governance committee receive an additional annual retainer of $10,000. There are no additional fees for attending board or board committee meetings. Cash fees are paid quarterly in arrears to the non-employee directors who were serving as directors at the end of a quarter.
In lieu of cash fees, non-employee directors may elect to receive fully-vested options to purchase shares of our common stock. Elections must be received by the 75th day of a quarter and apply to all subsequent quarterly cash fees until a new election is received. Such options are granted on the first trading day of each quarter with respect to the fees payable for the preceding quarter, and the exercise price equals the fair market value of the common stock on the date of grant. The number of shares subject to such options is calculated by dividing the dollar amount of the cash fees for the quarter by the Black-Scholes-Merton option value we used for purposes of determining the share-based compensation expense that we recognized for financial statement reporting purposes in that quarter.
In addition, under the Chairman’s Agreement between us and Ms. Mary Tolan, Ms. Tolan was entitled to additional compensation and benefits for her services as Chairman of our board of directors from April 2013 through April 2014, as described under “Agreements for Ms. Mary Tolan” of this Item 11 – Executive Compensation. Also, under the Chairman Services Agreement between us and Mr. Steven Shulman, Mr. Shulman is entitled to additional compensation and benefits for his services as Chairman of our board of directors as described under “Special Agreement for Mr. Steven Shulman, the Chairman of the Board of Directors” of this Item 11 Executive Compensation.
131
Table of Contents
Director Compensation for Year Ended December 31, 2012
The following table sets forth, for each of our non-employee directors, information concerning compensation earned or paid for services in all capacities during the fiscal year ended December 31, 2012. Information for our employee directors is set forth in the Summary Compensation Table above.
| Name |
Fees Earned or Paid in Cash ($) |
Option Awards ($)(1) |
Total ($) |
|||||||||
| Edgar Bronfman |
$ | — | $ | 70,000 | $ | 70,000 | ||||||
| Michael Cline |
$ | — | $ | 80,000 | $ | 80,000 | ||||||
| Steven Kaplan |
$ | — | $ | 70,000 | $ | 70,000 | ||||||
| Stanley Logan |
$ | 80,000 | $ | — | $ | 80,000 | ||||||
| Denis Nayden |
$ | — | $ | 60,000 | $ | 60,000 | ||||||
| George Shultz |
$ | — | $ | 60,000 | $ | 60,000 | ||||||
| Art Spiegel |
$ | — | $ | 60,000 | $ | 60,000 | ||||||
| Mark Wolfson |
$ | — | $ | 60,000 | $ | 60,000 | ||||||
| (1) | Valuation of these options awards is based on the dollar amount of share-based compensation expense that we recognized for financial statement reporting purposes in 2012 computed in accordance with ASC 718, excluding the impact of estimated forfeitures related to service-based vesting conditions. These amounts do not represent the actual amounts paid to or realized by the director during 2012. The assumptions used by us with respect to the valuation of option awards are the same as those set forth in Note 6, Share-Based Compensation, to our consolidated financial statements included in this Annual Report on Form 10-K. |
As of December 31, 2012, our non-employee directors held the following options to acquire shares of our common stock:
| Name |
Aggregate Option Awards Outstanding as of December 31, 2012 |
|||
| Edgar Bronfman |
72,844 | |||
| Michael Cline |
77,294 | |||
| Steven Kaplan |
75,484 | |||
| Stanley Logan |
43,283 | |||
| Denis Nayden |
72,355 | |||
| George Shultz |
72,355 | |||
| Art Spiegel |
71,036 | |||
| Mark Wolfson |
71,036 | |||
132
Table of Contents
Director Compensation for Year Ended December 31, 2013
The following table sets forth, for each of our non-employee directors, information concerning compensation earned or paid for services in all capacities during the fiscal year ended December 31, 2013. Information for our employee directors is set forth in the Summary Compensation Table above.
| Name |
Fees Earned or Paid in Cash ($) |
Option Awards ($)(1) |
Total ($) |
|||||||||
| Edgar Bronfman |
$ | — | $ | 70,000 | $ | 70,000 | ||||||
| Michael Cline |
$ | — | $ | 70,000 | $ | 70,000 | ||||||
| Steven Kaplan |
$ | — | $ | 70,000 | $ | 70,000 | ||||||
| Stanley Logan |
$ | 80,000 | $ | — | $ | 80,000 | ||||||
| Alex Mandl |
$ | 15,000 | $ | — | $ | 15,000 | ||||||
| Denis Nayden |
$ | — | $ | 60,000 | $ | 60,000 | ||||||
| Steven Shulman |
$ | 30,000 | $ | 520,000 | $ | 550,000 | ||||||
| George Shultz |
$ | — | $ | 15,000 | $ | 15,000 | ||||||
| Art Spiegel |
$ | — | $ | 60,000 | $ | 60,000 | ||||||
| Robert Stanek |
$ | 15,000 | $ | — | $ | 15,000 | ||||||
| Mark Wolfson |
$ | — | $ | 60,000 | $ | 60,000 | ||||||
| (1) | Valuation of these options awards is based on the dollar amount of share-based compensation expense that we recognized for financial statement reporting purposes in 2013 computed in accordance with ASC 718, excluding the impact of estimated forfeitures related to service-based vesting conditions. These amounts do not represent the actual amounts paid to or realized by the director during 2013. The assumptions used by us with respect to the valuation of option awards are the same as those set forth in Note 6, Share-Based Compensation, to our consolidated financial statements included in this Annual Report on Form 10-K. |
As of December 31, 2013, our non-employee directors held the following options to acquire shares of our common stock:
| Name |
Aggregate Option Awards Outstanding as of December 31, 2013 |
|||
| Edgar Bronfman |
86,501 | |||
| Michael Cline |
90,883 | |||
| Steven Kaplan |
89,141 | |||
| Stanley Logan |
43,283 | |||
| Alex Mandl |
— | |||
| Denis Nayden |
84,060 | |||
| Steve Shulman |
103,174 | |||
| George Shultz |
74,994 | |||
| Art Spiegel |
82,741 | |||
| Robert Stanek |
— | |||
| Mark Wolfson |
82,741 | |||
133
Table of Contents
| Item 12. | Security Ownership of Certain Beneficial Owners and Management and Related Stockholder Matters |
The information required by this item with regard to securities authorized for issuance under equity incentive plans as of December 31, 2013 is contained in Item 5 of this Annual Report on Form 10-K.
The following table contains information as of November 1, 2014 about the beneficial ownership of shares of our common stock by:
| • | each person, or group of affiliated persons, who is known by us to beneficially own more than 5% of our common stock; |
| • | each of our directors and nominees for director; |
| • | each of our named executive officers; and |
| • | all of our directors and executive officers as a group. |
For purposes of the table below, and in accordance with SEC rules, we deem shares of common stock subject to options that are currently exercisable or exercisable within 60 days of November 1, 2014 to be outstanding and beneficially owned by the person holding the options for the purpose of computing the percentage ownership of that person, but we do not treat them as outstanding for the purpose of computing the percentage ownership of any other person. As of November 1, 2014, there were 98,331,351 shares of our common stock outstanding. Except as otherwise noted, the persons or entities in this table have sole voting and investment power with respect to all of the shares of common stock beneficially owned by them, subject to community property laws, where applicable. Except as otherwise set forth below, the street address of the beneficial owner is c/o Accretive Health, Inc., 401 North Michigan Avenue, Suite 2700, Chicago, Illinois 60611.
| Common Stock Beneficially Owned |
||||||||
| Name | Shares | % | ||||||
| 5% Stockholders |
||||||||
| FMR, LLC (1) |
14,589,861 | 14.8 | % | |||||
| Jasper Ridge Partners, L.P. (2) |
8,101,774 | 8.2 | % | |||||
| Directors and Executive Officers |
||||||||
| Mary A. Tolan (3) |
11,161,128 | 11.4 | % | |||||
| Andrew M. Appel |
— | * | ||||||
| John T. Staton (4) |
313,600 | * | ||||||
| Emad Rizk |
— | * | ||||||
| Steve Schuckenbrock (5) |
1,330,980 | 1.4 | % | |||||
| Joseph G. Flanagan (6) |
475,019 | * | ||||||
| Sean Orr (7) |
75,000 | * | ||||||
| Richard E. Gillette (8) |
398,880 | * | ||||||
| Gregory N. Kazarian |
— | * | ||||||
| Edgar Bronfman, Jr. (9) |
3,259,338 | 3.3 | % | |||||
| J. Michael Cline (10) |
7,631,216 | 7.8 | % | |||||
| Steven N. Kaplan (11) |
494,527 | * | ||||||
| Stanley N. Logan (12) |
32,463 | * | ||||||
| Alex J. Mandl (13) |
11,095 | * | ||||||
| Denis J. Nayden (14) |
1,412,610 | 1.4 | % | |||||
| Steve Shulman (15) |
25,794 | * | ||||||
| Arthur H. Spiegel, III (16) |
3,674,030 | 3.7 | % | |||||
| Mark A. Wolfson (17) |
796,375 | * | ||||||
| Robert V. Stanek |
— | * | ||||||
| All executive officers and directors as a group (15 persons) |
31,092,055 | 31.6 | % | |||||
| * | Less than 1% |
134
Table of Contents
| (1) | Based on a voluntary disclosure as of September 30, 2014, FMR LLC reports sole voting power over 14,589,861 shares and sole investment power over 14,589,861 shares. Fidelity OTC Portfolio, an investment company registered under the Investment Company Act of 1940, has the right to receive or the power to direct the receipt of dividends from, or the proceeds from the sale of, 9,842,302 of the shares. Fidelity Management & Research Company (“Fidelity”), a wholly-owned subsidiary of FMR LLC and an investment adviser registered under Section 203 of the Investment Advisers Act of 1940, is the beneficial owner of 14,589,861 of the shares as a result of acting as investment adviser to various investment companies registered under Section 8 of the Investment Company Act of 1940. Edward C. Johnson and FMR LLC, through their control of Fidelity, and the funds each have sole investment power over the 14,589,861 shares beneficially owned by Fidelity. Members of the family of Edward C. Johnson 3d, chairman of FMR LLC, are the predominant owners, directly or through trusts, of Series B voting common shares of FMR LLC, representing 49% of the voting power of FMR LLC. The Johnson family group and all other FMR LLC Series B stockholders have entered into a stockholders’ voting agreement under which all Series B voting shares will be voted in accordance with the majority vote of Series B voting common shares. Accordingly, through their ownership of voting common shares and the execution of the shareholders’ voting agreement, members of the Johnson family may be deemed, under the Investment Company Act of 1940, to form a controlling group with respect to FMR LLC. Neither FMR LLC nor Edward C. Johnson 3d has the sole voting power or investment power over the shares owned directly by the Fidelity Funds, which powers reside with the funds’ board of trustees. Fidelity carries out the voting of the shares under written guidelines established by the funds’ boards of trustees. The address of each of FMR LLC, Fidelity OTC Portfolio and Fidelity is 82 Devonshire Street, Boston, Massachusetts 02109. 0000315066-13-002226. |
| (2) | Includes the shares beneficially owned by Jasper Ridge Partners, L.P. (formerly known as Oak Hill Investment Management, L.P.), or Jasper Ridge, that are managed by Jasper Ridge on behalf of various advisory clients pursuant to Investment Advisory Agreements. Pursuant to such agreements, Jasper Ridge has sole voting and investment power over the shares. Denis Nayden and Mark Wolfson are managers of Jasper Ridge and may be deemed to share voting and investment power with respect to all shares held by Jasper Ridge. Denis Nayden and Mark Wolfson disclaim beneficial ownership of the securities listed above except to the extent of any pecuniary interest therein. Does not include 332,835 shares owned by JRP GP Holding, L.P. (formerly known as OHIM GP Holdings, L.P.), or JP Holdings, an entity affiliated with Jasper Ridge. The address of Jasper Ridge is 201 Main Street, Suite 1000, Fort Worth, Texas 76102. |
| (3) | Includes 2,587,200 shares held by Tolan Family Trust U/A/D 6/29/03, the beneficiaries of which are Ms. Tolan’s children who share voting and investment power with respect to the shares held by this trust. Also includes 1,176,000 shares subject to options exercisable within 60 days of November 1, 2014. |
| (4) | Consists of (i) 177,094 shares held by John T. Staton Declaration of Trust; (ii) 75,158 shares held by Irrevocable 2009 Staton Children’s Trust and (iii) 61,348 shares held by John T. Staton 2010 Grantor Retained Annuity Trust. The beneficiaries of John T. Staton Declaration of Trust, Irrevocable 2009 Staton Children’s Trust, and John T. Staton 2010 Grantor Retained Annuity Trust are members of Mr. Staton’s immediate family. Mr. Staton’s spouse is the trustee of the Irrevocable 2009 Staton Children’s Trust. Mr. Staton is the trustee of the John T. Staton Declaration of Trust and John T. Staton 2010 Grantor Retained Annuity Trust and exercises sole voting and investment power with respect to the shares held by the trusts. |
| (5) | Includes 1,330,980 shares subject to options exercisable within 60 days of November 1, 2014 (of which 1,149,405 shares would be vested if purchased upon exercise of these options as of November 1, 2014). |
| (6) | Includes 316,673 shares subject to options exercisable within 60 days of November 1, 2014 (of which 283,339 shares would be vested if purchased upon exercise of these options as of November 1, 2014. |
| (7) | Includes 75,000 shares subject to options exercisable within 60 days of November 1, 2014. |
| (8) | Includes 398,880 shares subject to options exercisable within 60 days of November 1, 2014. |
| (9) | Includes 103,246 shares subject to options exercisable within 60 days of November 1, 2014. |
| (10) | Consists of (i) 7,216,016 shares beneficially owned by JMC Holdings, L.P. JMC Holdings is a Delaware limited partnership of which the Trust dated December 30, 2005 is the general partner and Mr. Cline is the trustee and beneficiary of the Trust through which Mr. Cline is deemed have beneficial ownership by reason of his sole voting and investment power with respect to the 7,216,016 shares. Mr. Cline disclaims beneficial |
135
Table of Contents
| ownership of such shares, except to the extent of his pecuniary interest therein. The address of JMC Holdings, L.P. is c/o Accretive, LLC, 51 Madison Avenue, 31st Floor, New York, New York 10010; (ii) 19,045 shares of Common Stock held directly by Accretive Associates SBIC, LLC, of which Mr. Cline is the managing member, (iii) 28,223 shares beneficially owned by The Cline Foundation, of which Mr. Cline is the trustee. As trustee of The Cline Foundation, Mr. Cline exercises sole voting and investment power with respect to such shares, however, Mr. Cline disclaims beneficial ownership of such shares, except to the extent of his pecuniary interest therein. The address of The Cline Foundation is 51 Madison Ave., 31st FL, New York, NY 10010; (iii) 60,078 shares held directly by Mr. Cline; and (iv) 90,883 shares subject to options exercisable within 60 days of November 1, 2014. |
| (11) | Includes 105,886 shares subject to options exercisable within 60 days of November 1, 2014. |
| (12) | Consists of 2,000 shares held in an investment retirement account for the benefit of Mr. Logan and his spouse, over which Mr. Logan has shared voting and investment power; 41 shares held jointly by Mr. Logan and his spouse, over which Mr. Logan has shared voting and investment power; and 20 shares held by Mr. Logan as custodian for Mr. Logan’s minor grandchild, over which Mr. Logan has voting and investment power. |
| (13) | Includes 11,095 shares subject to options exercisable within 60 days of November 1, 2014. |
| (14) | Includes (i) 505,630 shares held in a grantor retained annuity trust, or GRAT, established for estate planning purposes, and (ii) 98,413 shares subject to options exercisable within 60 days of November 1, 2014. Mr. Nayden is the sole trustee and sole annuitant of the GRAT. Also includes 249,999 shares held by Britta & Denis Nayden Charitable Foundation Ltd., or the Foundation, of which Mr. Nayden is President and a director. Mr. Nayden does not have any pecuniary interest in the shares held by the Foundation. |
| (15) | Includes 25,794 shares subject to options exercisable within 60 days of November 1, 2014. |
| (16) | Consists of 3,576,936 shares held by Spiegel Family LLC, the members of which are members of Mr. Spiegel’s immediate family and 97,094 shares subject to options exercisable within 60 days of November 1, 2014. Mr. Spiegel and his wife are the managing members of Spiegel Family LLC and exercise shared voting and investment power with respect to such shares. |
| (17) | Includes of 97,094 shares subject to options exercisable within 60 days of November 1, 2014. Mr. Wolfson is a Managing Partner of Jasper Ridge Partners, but disclaims beneficial ownership of any shares held by Jasper Ridge Partners or Jasper Ridge Partners Holdings. |
136
Table of Contents
| Item 13. | Certain Relationships and Related Transactions, and Director Independence |
Policies and Procedures for Related Person Transactions
Our board of directors has adopted a written related person transaction policy to set forth policies and procedures for the review and approval or ratification of related person transactions. This policy covers any transaction, arrangement or relationship, or any series of similar transactions, arrangements or relationships, in which we were or are to be a participant, the amount involved exceeds $120,000, and a related person had or will have a direct or indirect material interest, including, without limitation, purchases of goods or services by or from the related person or entities in which the related person has a material interest, indebtedness, guarantees of indebtedness, and employment by us of a related person. Our related person transaction policy contains exceptions for any transaction or interest that is not considered a related person transaction under SEC rules as in effect from time to time.
Any related person transaction proposed to be entered into by us must be reported to our general counsel and will be reviewed and approved by the audit committee in accordance with the terms of the policy, prior to effectiveness or consummation of the transaction whenever practicable. If our general counsel determines that advance approval of a related person transaction is not practicable under the circumstances, the audit committee will review and, in its discretion, may ratify the related person transaction at the next meeting of the audit committee.
Alternatively, our general counsel may present a related person transaction arising in the time period between meetings of the audit committee to the chair of the audit committee, who will review and may approve the related person transaction, subject to ratification by the audit committee at the next meeting of the audit committee.
In addition, any related person transaction previously approved by the audit committee or otherwise already existing that is ongoing in nature will be reviewed by the audit committee annually to ensure that such related person transaction has been conducted in accordance with the previous approval granted by the audit committee, if any, and that all required disclosures regarding the related person transaction are made.
Transactions involving compensation of executive officers will be reviewed and approved by the compensation committee in the manner specified in the charter of the compensation committee.
A related person transaction reviewed under this policy will be considered approved or ratified if it is authorized by the audit committee in accordance with the standards set forth in the policy after full disclosure of the related person’s interests in the transaction. As appropriate for the circumstances, the audit committee will review and consider:
| • | the related person’s interest in the related person transaction; |
| • | the approximate dollar value of the amount involved in the related person transaction; |
| • | the approximate dollar value of the amount of the related person’s interest in the transaction without regard to the amount of any profit or loss; |
| • | whether the transaction was undertaken in the ordinary course of business of our company; |
| • | whether the transaction with the related person is proposed to be, or was, entered into on terms no less favorable to us than the terms that could have been reached with an unrelated third party; |
| • | the purpose of, and the potential benefits to us of, the transaction; and |
| • | any other information regarding the related person transaction or the related person in the context of the proposed transaction that would be material to investors in light of the circumstances of the particular transaction. |
137
Table of Contents
The audit committee will review all relevant information available to it about the related person transaction. The audit committee may approve or ratify the related person transaction only if the audit committee determines that, under all of the circumstances, the transaction is in, or is not inconsistent with, our best interests. The audit committee may, in its sole discretion, impose such conditions as it deems appropriate on us or the related person in connection with approval of the related person transaction.
Since January 1, 2012, we have engaged in the following transactions with our directors, executive officers and holders of more than 5% of our voting securities, and affiliates or immediate family members of our directors, executive officers and 5% stockholders, in which such person had or will have a direct or indirect material interest:
Transactions with Ascension Health
In October 2004, Ascension Health became our founding customer. Since then, in exchange for its initial start-up assistance, operational laboratory services and related consulting services relative to the services we were developing, we have issued common stock and granted warrants to Ascension Health, as a result of which Ascension Health held more than 5% of our voting securities as of December 31, 2012, however as of December 31, 2013, Ascension Health held less than 5% of our voting securities. Ascension Health is the nation’s largest Catholic and largest non-profit health system. It is dedicated to its mission of serving all, with special attention to those who are poor and vulnerable. Our work on behalf of Ascension Health is done in compliance with its charity care guidelines and billing and collection policies, which recognize the human dignity of each individual and our responsibility to treat all patients with respect. A key element of our work for Ascension Health is qualifying patients for charity care and identifying potential payment sources for patients who are uninsured or underinsured.
We entered into a new five-year MPSA, with Ascension Health on August 6, 2012. The MPSA continues our relationship with Ascension Health which commenced in October 2004 and was extended under the prior five-year master services agreement, or the Legacy Agreement, dated December 13, 2007. Substantially all of the hospital systems affiliated with Ascension Health for which we previously conducted RCM operations under the Legacy Agreement have opted in to the MPSA by executing a new supplement agreement with us. We also continue to provide services under the Legacy Agreement to one hospital system and one physician group affiliated with Ascension Health that did not execute new supplement agreements with us. The MPSA includes new terms for the Ascension Health affiliated hospitals that have executed supplements under that agreement regarding the measurement of incentive payments due to us for services provided after June 30, 2012.
Certain Employment Arrangements
We employ Kyle Hupach as a director of revenue cycle operations. Mr. Hupach is the brother-in-law of Gregory N. Kazarian, who served as our senior vice president until May 31, 2013. Mr. Hupach’s current annual base salary is $210,000, and he also participates in our standard employee benefits package. In 2011, 2012 and 2013, Mr. Hupach’s total compensation, including salary, bonus and the amount of share-based compensation expense that we recognized for financial statement reporting purposes for stock options previously granted to him, was $201,200, $227,100 and $298,900, respectively.
We employed Theresa Coughlin as an employee benefits manager through January 2013, and then as an employee benefits senior manager from January 2013 through January 2014. Ms. Coughlin is the sister of Mary Tolan, who served as our Chief Executive Officer through April 2013, and who continues to serve as a member of our board of directors. Ms. Coughlin’s employment with our company ended on January 31, 2014. In 2012 and 2013, Ms. Coughlin’s total compensation, including salary, bonus and the amount of share-based compensation expense that we recognized for financial statement reporting purposes for stock options previously granted to her, was $135,104, and $148,323, respectively.
138
Table of Contents
Registration Rights
We are a party to a stockholders’ agreement with certain of our stockholders, including the following directors, former executive officers and holders of more than 5% of our voting securities and their affiliates and immediate family members: Mary A. Tolan, Etienne H. Deffarges, Gregory N. Kazarian, Irrevocable 2009 Kazarian Children’s Trust, Irrevocable 2009 Gregory N. Kazarian Trust, John T. Staton Declaration of Trust, Steven N. Kaplan, Kazarian Family, LLC, and Spiegel Family LLC. Pursuant to the stockholders’ agreement, we are required to pay all registration fees and expenses, including the reasonable fees and disbursements of one counsel for the participating stockholders, and indemnify each participating stockholder with respect to each registration of registrable shares that is affected.
Indemnification
Our restated certificate of incorporation provides that we will indemnify our directors and officers to the fullest extent permitted by Delaware law. In addition, we have entered into indemnification agreements with each of our directors and executive officers that are broader in scope than the specific indemnification provisions contained in the Delaware General Corporation Law.
Board Determination of Independence
Our securities are traded through the facilities of the OTC Markets Group, Inc., which does not have requirements that a majority of the board of directors be independent, so we apply the requirements for independence under the NYSE listing standards. Pursuant to the corporate governance listing standards of the NYSE, a director currently or recently employed by us cannot be deemed to be an “independent director”, and consequently each of Dr. Rizk, Mr. Schuckenbrock and Ms. Tolan is not an independent director. In addition, in accordance with the NYSE corporate governance listing standards, each other director will qualify as “independent” only if our board of directors affirmatively determines that he or she has no material relationship with us, either directly or as a partner, stockholder or officer of an organization that has a relationship with us. Ownership of a significant amount of our stock, by itself, does not constitute a material relationship.
Our board of directors has affirmatively determined that each of Messrs. Bronfman, Cline, Kaplan, Logan, Mandl, Nayden, Shulman, Spiegel, Stanek and Wolfson is “independent” in accordance with Section 303A.02(b) of the NYSE Listed Company Manual. In making this determination, our board of directors considered the percentage of our common stock owned by an entity affiliated with Accretive, LLC, of which Mr. Cline is the founding managing partner and Mr. Bronfman is a general partner, and the percentage of our common stock owned by Jasper Ridge Partners, L.P. (formerly known as Oak Hill Investment Management, L.P.), of which Mr. Wolfson is a managing partner. Our board also considered that Mr. Nayden is a managing partner of, and Mr. Wolfson is a senior advisor to, Oak Hill Capital Management, LLC, an entity associated with Jasper Ridge Partners, L.P. See “Security Ownership of Certain Beneficial Owners and Management.”
Our board of directors has established an audit committee, a compensation committee and a nominating and corporate governance committee. Our board of directors has determined that all of the members of each of the board’s three standing committees are independent as defined under the rules of the NYSE, including, in the case of all members of the audit committee, the independence requirements contemplated by Rule 10A-3 under the Exchange Act.
139
Table of Contents
| Item 14. | Principal Accountant Fees and Services |
We incurred the following fees from our independent registered public accounting firm, Ernst & Young LLP for the three years ended December 31, 2013 (in thousands):
| For the years ended | ||||||||||||
| 2013 | 2012 | 2011 | ||||||||||
| Fee category |
||||||||||||
| Audit and restatement fees |
$ | 12,896 | $ | 1,630 | $ | 1,482 | ||||||
| Audit-related fees |
34 | 46 | 71 | |||||||||
| Tax fees |
9 | — | 17 | |||||||||
| All other fees |
2 | 2 | 2 | |||||||||
|
|
|
|
|
|
|
|||||||
| Total fees |
$ | 12,941 | $ | 1,678 | $ | 1,572 | ||||||
|
|
|
|
|
|
|
|||||||
Audit Fees. Audit fees consisted of fees for the audit of our annual consolidated financial statements, the review of the interim consolidated financial statements, subsidiary audits and other professional services provided in connection with our filings with the SEC. The amounts presented for 2013 comprises principally the fees associated with the Restatement. Audit fees in 2011 include $281,000 which was incurred in connection with the initial public offering completed in March 2011.
Audit-Related Fees. Audit-related fees for 2013 and 2012 consisted of fees for audits of employee benefit plans and fees for 2011 also includes fees for internal control reviews.
Tax Fees. Tax fees consisted of fees for tax compliance and related regulatory filings.
All Other Fees. All other fees consisted of a subscription for access to an accounting research tool.
The audit committee of our board of directors believes that the non-audit services described above did not compromise Ernst & Young LLP’s independence. The audit committee’s charter, which you can find in the “Corporate Governance” section of the “Investor Relations” page of our website, www.accretivehealth.com, requires that all proposals to engage Ernst & Young LLP for services, and all proposed fees for these services, be submitted to the audit committee for approval before Ernst & Young LLP may provide the services. None of the above fees were approved using the “de minimis exception” under SEC rules.
Pre-Approval of Audit and Non-Audit Services
Our audit committee has adopted policies and procedures relating to the approval of all audit and non-audit services that are to be performed by our registered public accounting firm. This policy generally provides that we will not engage our registered public accounting firm to render audit or non-audit services unless the service is specifically approved in advance by our audit committee.
From time to time, our audit committee may pre-approve specified types of services that are expected to be provided to us by our registered public accounting firm during the next 12 months. Any such pre-approval is detailed as to the particular service or type of services to be provided and is also generally subject to a maximum dollar amount. Our audit committee pre-approved all of the services described under the headings “Audit-Related Fees,” “Tax Fees” and “All Other Fees” above.
140
Table of Contents
PART IV
| Item 15. | Exhibits and Financial Statement Schedules |
a) The following documents are filed as a part of this report:
(1) Financial Statements
The financial statements and notes thereto annexed to this report beginning on page F-1.
(2) Financial Statement Schedules
Schedule of Valuation and Qualifying Accounts Disclosure
141
Table of Contents
SCHEDULE II — VALUATION AND QUALIFYING ACCOUNTS
Supplemental schedules are omitted because of the absence of conditions under which they are required or because the information called for is in the Consolidated Financial Statements and notes thereto.
| (3) | Exhibits |
The list of Exhibits filed as part of this Annual Report on Form 10-K is set forth on the Exhibit Index immediately preceding such Exhibits and is incorporated herein by this reference.
142
Table of Contents
Pursuant to the requirements of Section 13 or 15(d) of the Securities Exchange Act of 1934, the registrant has duly caused this report to be signed on its behalf by the undersigned, thereunto duly authorized.
| ACCRETIVE HEALTH, INC. | ||
| By: | /s/ Emad Rizk | |
| Emad Rizk | ||
| President and Chief Executive Officer | ||
| By: | /s/ Peter Csapo | |
| Peter Csapo | ||
| Chief Financial Officer and Treasurer | ||
Date: December 30, 2014
Pursuant to the requirements of the Securities Exchange Act of 1934, this report has been signed by the following persons on behalf of the registrant in the capacities and on the dates indicated.
| Signature | Title | Date | ||
| /s/ Emad Rizk Emad Rizk |
Director, President and Chief Executive Officer (Principal Executive Officer) |
December 30, 2014 | ||
| /s/ Peter Csapo Peter Csapo |
Chief Financial Officer, Treasurer and Chief Accounting Officer (Principal Financial Officer and Principal Accounting Officer) |
December 30, 2014 | ||
| /s/ Steven J. Shulman Steven J. Shulman |
Chairman of the Board | December 30, 2014 | ||
| /s/ Edgar M. Bronfman, Jr. Edgar M. Bronfman, Jr. |
Director | December 30, 2014 | ||
| /s/ J. Michael Cline J. Michael Cline |
Founder and Director | December 30, 2014 | ||
| /s/ Steven N. Kaplan Steven N. Kaplan |
Director | December 30, 2014 | ||
| /s/ Stanley N. Logan Stanley N. Logan |
Director | December 30, 2014 | ||
| /s/ Alex J. Mandl Alex J. Mandl |
Director | December 30, 2014 | ||
| /s/ Denis J. Nayden Denis J. Nayden |
Director | December 30, 2014 | ||
| /s/ Arthur H. Spiegel, III Arthur H. Spiegel, III |
Director | December 30, 2014 | ||
1
Table of Contents
| Signature | Title | Date | ||
| /s/ Robert V. Stanek Robert V. Stanek |
Director | December 30, 2014 | ||
| /s/ Mary A. Tolan Mary A. Tolan |
Founder and Director | December 30, 2014 | ||
| /s/ Mark A. Wolfson Mark A. Wolfson |
Director | December 30, 2014 | ||
| /s/ Stephen F. Schuckenbrock Stephen F. Schuckenbrock |
Director | December 30, 2014 | ||
2
Table of Contents
Accretive Health, Inc.
Index to Consolidated Financial Statements
| Page | ||||
| Audited Consolidated Financial Statements |
||||
| F-2 | ||||
| F-3 | ||||
| Consolidated Statements of Operations and Comprehensive Income (Loss) |
F-4 | |||
| F-5 | ||||
| F-6 | ||||
| F-7 | ||||
F-1
Table of Contents
Report of Independent Registered Public Accounting Firm
To the Board of Directors and Stockholders
of Accretive Health, Inc.:
We have audited the accompanying consolidated balance sheets of Accretive Health, Inc. as of December 31, 2013, 2012 and 2011, and the related consolidated statements of operations and comprehensive income (loss), stockholders’ equity (deficit), and cash flows for each of the three years in the period ended December 31, 2013. These financial statements are the responsibility of the Company’s management. Our responsibility is to express an opinion on these financial statements based on our audits.
We conducted our audits in accordance with the standards of the Public Company Accounting Oversight Board (United States). Those standards require that we plan and perform the audit to obtain reasonable assurance about whether the financial statements are free of material misstatement. An audit includes examining, on a test basis, evidence supporting the amounts and disclosures in the financial statements. An audit also includes assessing the accounting principles used and significant estimates made by management, as well as evaluating the overall financial statement presentation. We believe that our audits provide a reasonable basis for our opinion.
In our opinion, the financial statements referred to above present fairly, in all material respects, the consolidated financial position of Accretive Health, Inc. at December 31, 2013, 2012 and 2011, and the consolidated results of its operations and its cash flows for each of the three years in the period ended December 31, 2013, in conformity with U.S. generally accepted accounting principles.
The consolidated financial statements as of and for the year ended December 31, 2011, have been restated to correct the accounting errors described in Note 2.
We also have audited, in accordance with the standards of the Public Company Accounting Oversight Board (United States), Accretive Health, Inc.’s internal control over financial reporting as of December 31, 2013, based on criteria established in Internal Control-Integrated Framework issued by the Committee of Sponsoring Organizations of the Treadway Commission (1992 framework) and our report dated December 30, 2014 expressed an adverse opinion thereon.
/s/ Ernst & Young LLP
Chicago, Illinois
December 30, 2014
F-2
Table of Contents
Accretive Health, Inc.
(In thousands, except share data)
| December 31, | ||||||||||||
| 2013 | 2012 | 2011 | ||||||||||
| As restated | ||||||||||||
| Assets |
||||||||||||
| Current assets: |
||||||||||||
| Cash and cash equivalents |
$ | 228,891 | $ | 176,956 | $ | 196,725 | ||||||
| Accounts receivable, net |
24,557 | 25,859 | 17,118 | |||||||||
| Prepaid income taxes |
9,738 | 4,986 | 7,575 | |||||||||
| Current deferred tax asset |
105,015 | 247,659 | 189,676 | |||||||||
| Other current assets |
6,943 | 21,522 | 5,894 | |||||||||
|
|
|
|
|
|
|
|||||||
| Total current assets |
375,144 | 476,982 | 416,988 | |||||||||
| Property, equipment and software, net |
16,275 | 21,354 | 17,169 | |||||||||
| Non-current deferred tax asset |
112,993 | 53,436 | 36,457 | |||||||||
| Restricted cash |
5,000 | 5,000 | 5,000 | |||||||||
| Goodwill and other assets, net |
579 | 605 | 666 | |||||||||
|
|
|
|
|
|
|
|||||||
| Total assets |
$ | 509,991 | $ | 557,377 | $ | 476,280 | ||||||
|
|
|
|
|
|
|
|||||||
| Liabilities and stockholders’ equity (deficit) |
||||||||||||
| Current liabilities: |
||||||||||||
| Accounts payable |
$ | 4,254 | $ | 900 | $ | 1,257 | ||||||
| Current portion of customer liabilities |
356,694 | 676,619 | 487,998 | |||||||||
| Accrued compensation and benefits |
11,810 | 8,004 | 15,586 | |||||||||
| Other accrued expenses |
20,046 | 22,206 | 7,796 | |||||||||
|
|
|
|
|
|
|
|||||||
| Total current liabilities |
392,804 | 707,729 | 512,637 | |||||||||
| Non-current portion of customer liabilities |
195,392 | 77,443 | 58,412 | |||||||||
| Other non-current liabilities |
7,407 | 8,405 | 6,662 | |||||||||
|
|
|
|
|
|
|
|||||||
| Total liabilities |
595,603 | 793,577 | 577,711 | |||||||||
|
|
|
|
|
|
|
|||||||
| Commitments and contingencies |
||||||||||||
| Stockholders’ equity (deficit): |
||||||||||||
| Common stock, $0.01 par value, 500,000,000 shares authorized, 100,525,241 shares issued and 96,010,911 shares outstanding at December 31, 2013; 100,007,538 shares issued and 95,670,051 shares outstanding at December 31, 2012; 98,701,161 shares issued and 98,686,357 shares outstanding at December 31, 2011 |
1,005 | 1,000 | 987 | |||||||||
| Additional paid-in capital |
283,439 | 262,075 | 226,911 | |||||||||
| Accumulated deficit |
(317,897 | ) | (447,980 | ) | (328,240 | ) | ||||||
| Accumulated other comprehensive loss |
(1,459 | ) | (756 | ) | (710 | ) | ||||||
| Treasury stock |
(50,700 | ) | (50,539 | ) | (379 | ) | ||||||
|
|
|
|
|
|
|
|||||||
| Total stockholders’ equity (deficit) |
(85,612 | ) | (236,200 | ) | (101,431 | ) | ||||||
|
|
|
|
|
|
|
|||||||
| Total liabilities and stockholders’ equity (deficit) |
$ | 509,991 | $ | 557,377 | $ | 476,280 | ||||||
|
|
|
|
|
|
|
|||||||
See accompanying notes to consolidated financial statements.
F-3
Table of Contents
Accretive Health, Inc.
Consolidated Statements of Operations and Comprehensive Income (Loss)
(In thousands, except per share data)
| Year Ended December 31, | ||||||||||||
| 2013 | 2012 | 2011 | ||||||||||
| As restated | ||||||||||||
| Net services revenue |
$ | 504,768 | $ | 72,254 | $ | 101,966 | ||||||
| Operating expenses: |
||||||||||||
| Cost of services |
186,752 | 188,666 | 158,715 | |||||||||
| Selling, general and administrative |
79,951 | 67,750 | 63,268 | |||||||||
| Restatement and other |
33,963 | 3,714 | — | |||||||||
|
|
|
|
|
|
|
|||||||
| Total operating expenses |
300,666 | 260,130 | 221,983 | |||||||||
|
|
|
|
|
|
|
|||||||
| Income (loss) from operations |
204,102 | (187,876 | ) | (120,017 | ) | |||||||
| Net interest income |
330 | 141 | 26 | |||||||||
|
|
|
|
|
|
|
|||||||
| Income (loss) before income tax provision |
204,432 | (187,735 | ) | (119,991 | ) | |||||||
| Income tax provision (benefit) |
74,349 | (67,995 | ) | (48,246 | ) | |||||||
|
|
|
|
|
|
|
|||||||
| Net income (loss) |
$ | 130,083 | $ | (119,740 | ) | $ | (71,745 | ) | ||||
|
|
|
|
|
|
|
|||||||
| Net income (loss) per common share: |
||||||||||||
| Basic |
$ | 1.36 | $ | (1.21 | ) | $ | (0.74 | ) | ||||
|
|
|
|
|
|
|
|||||||
| Diluted |
$ | 1.34 | $ | (1.21 | ) | $ | (0.74 | ) | ||||
|
|
|
|
|
|
|
|||||||
| Weighted average shares used in calculating net income (loss) per common share: |
||||||||||||
| Basic |
95,687,940 | 98,602,099 | 96,964,661 | |||||||||
| Diluted |
96,845,664 | 98,602,099 | 96,964,661 | |||||||||
| Consolidated statements of comprehensive income (loss) |
||||||||||||
| Net income (loss) |
130,083 | (119,740 | ) | (71,745 | ) | |||||||
| Other comprehensive loss |
||||||||||||
| Foreign currency translation adjustments |
(703 | ) | (46 | ) | (725 | ) | ||||||
|
|
|
|
|
|
|
|||||||
| Comprehensive income (loss) |
$ | 129,380 | $ | (119,786 | ) | $ | (72,470 | ) | ||||
|
|
|
|
|
|
|
|||||||
See accompanying notes to consolidated financial statements.
F-4
Table of Contents
Accretive Health, Inc.
Consolidated Statements of Stockholders’ Equity (Deficit)
(In thousands, except share data)
| Common Stock | Treasury Stock | Non- Executive Employee Loans for Stock Option Exercises |
Additional Paid-In Capital |
Accumulated Deficit |
Accumulated other comprehensive (loss) |
Total | ||||||||||||||||||||||||||||||
| Shares | Amount | Shares | Amount | |||||||||||||||||||||||||||||||||
| Balance at December 31, 2010, as reported |
94,826,509 | $ | 948 | — | $ | — | $ | (41 | ) | $ | 159,780 | $ | (17,834 | ) | $ | (134 | ) | $ | 142,719 | |||||||||||||||||
| Cumulative impact of Restatement |
— | — | — | — | — | 38 | (238,661 | ) | 149 | (238,474 | ) | |||||||||||||||||||||||||
|
|
|
|
|
|
|
|
|
|
|
|
|
|
|
|
|
|
|
|||||||||||||||||||
| Balance at January 1, 2011, as restated |
94,826,509 | $ | 948 | — | $ | — | $ | (41 | ) | $ | 159,818 | $ | (256,495 | ) | $ | 15 | $ | (95,755 | ) | |||||||||||||||||
| Share-based compensation expense |
— | — | — | — | — | 25,186 | — | — | 25,186 | |||||||||||||||||||||||||||
| Issuance of common stock related to share-based compensation plans |
3,874,652 | 39 | — | — | — | 18,113 | — | — | 18,152 | |||||||||||||||||||||||||||
| Excess tax benefit from share based compensation plans net of deferred tax asset write off of $92, as restated |
— | — | — | — | — | 23,794 | — | — | 23,794 | |||||||||||||||||||||||||||
| Repayments of amounts loaned to employees related to stock option exercises, net |
— | — | — | — | 41 | — | — | — | 41 | |||||||||||||||||||||||||||
| Treasury stock purchases |
— | — | (14,804 | ) | (379 | ) | — | — | — | — | (379 | ) | ||||||||||||||||||||||||
| Foreign currency translation adjustments, as restated |
— | — | — | — | — | — | — | (725 | ) | (725 | ) | |||||||||||||||||||||||||
| Net loss, as restated |
— | — | — | — | — | — | (71,745 | ) | — | (71,745 | ) | |||||||||||||||||||||||||
|
|
|
|
|
|
|
|
|
|
|
|
|
|
|
|
|
|
|
|||||||||||||||||||
| Balance at December 31, 2011, as restated |
98,701,161 | $ | 987 | (14,804 | ) | $ | (379 | ) | $ | — | $ | 226,911 | $ | (328,240 | ) | $ | (710 | ) | $ | (101,431 | ) | |||||||||||||||
| Share-based compensation expense |
— | — | — | — | — | 25,298 | — | — | 25,298 | |||||||||||||||||||||||||||
| Issuance of common stock related to share-based compensation plans |
1,306,377 | 13 | — | — | — | 7,383 | — | — | 7,396 | |||||||||||||||||||||||||||
| Excess tax benefit from share based compensation plans net of deferred tax asset write off of $1,920 |
— | — | — | — | — | 2,483 | — | — | 2,483 | |||||||||||||||||||||||||||
| Treasury stock purchases |
— | — | (4,322,683 | ) | (50,160 | ) | — | — | — | — | (50,160 | ) | ||||||||||||||||||||||||
| Foreign currency translation adjustments |
— | — | — | — | — | — | — | (46 | ) | (46 | ) | |||||||||||||||||||||||||
| Net loss |
— | — | — | — | — | — | (119,740 | ) | — | (119,740 | ) | |||||||||||||||||||||||||
|
|
|
|
|
|
|
|
|
|
|
|
|
|
|
|
|
|
|
|||||||||||||||||||
| Balance at December 31, 2012 |
100,007,538 | $ | 1,000 | (4,337,487 | ) | $ | (50,539 | ) | — | $ | 262,075 | $ | (447,980 | ) | $ | (756 | ) | $ | (236,200 | ) | ||||||||||||||||
| Share-based compensation expense |
— | — | — | — | — | 25,025 | — | — | 25,025 | |||||||||||||||||||||||||||
| Deferred tax asset write off net of excess tax benefit of $15 |
— | — | — | — | — | (3,702 | ) | — | — | (3,702 | ) | |||||||||||||||||||||||||
| Issuance of common stock related to share-based compensation plans |
517,703 | 5 | — | — | — | 41 | — | — | 46 | |||||||||||||||||||||||||||
| Treasury stock purchases |
— | — | (176,843 | ) | (161 | ) | — | — | — | — | (161 | ) | ||||||||||||||||||||||||
| Foreign currency translation adjustments |
— | — | — | — | — | — | — | (703 | ) | (703 | ) | |||||||||||||||||||||||||
| Net income |
— | — | — | — | — | — | 130,083 | — | 130,083 | |||||||||||||||||||||||||||
|
|
|
|
|
|
|
|
|
|
|
|
|
|
|
|
|
|
|
|||||||||||||||||||
| Balance at December 31, 2013 |
100,525,241 | $ | 1,005 | (4,514,330 | ) | $ | (50,700 | ) | $ | — | $ | 283,439 | $ | (317,897 | ) | $ | (1,459 | ) | $ | (85,612 | ) | |||||||||||||||
|
|
|
|
|
|
|
|
|
|
|
|
|
|
|
|
|
|
|
|||||||||||||||||||
See accompanying notes to consolidated financial statements.
F-5
Table of Contents
Accretive Health, Inc.
Consolidated Statements of Cash Flows
(In thousands)
| Year Ended December 31, | ||||||||||||
| 2013 | 2012 | 2011 | ||||||||||
| As restated | ||||||||||||
| Operating activities |
||||||||||||
| Net income (loss) |
$ | 130,083 | $ | (119,740 | ) | $ | (71,745 | ) | ||||
| Adjustments to reconcile net income (loss) to net cash provided by operations: |
||||||||||||
| Depreciation and amortization |
6,823 | 6,355 | 4,862 | |||||||||
| Employee share-based compensation |
25,025 | 25,298 | 25,186 | |||||||||
| Provision for doubtful receivables |
634 | 183 | 114 | |||||||||
| Deferred income taxes |
79,356 | (76,887 | ) | (74,544 | ) | |||||||
| Excess tax benefit from share-based awards |
(15 | ) | (4,403 | ) | (23,886 | ) | ||||||
| Changes in operating assets and liabilities: |
||||||||||||
| Accounts receivable |
658 | (8,926 | ) | (11,943 | ) | |||||||
| Prepaid income taxes |
(4,836 | ) | 6,980 | 27,890 | ||||||||
| Other assets |
14,434 | (1,571 | ) | (1,838 | ) | |||||||
| Accounts payable |
3,378 | (358 | ) | (1,214 | ) | |||||||
| Accrued compensation and benefits |
3,813 | (7,581 | ) | 3,089 | ||||||||
| Other liabilities |
(2,955 | ) | 2,166 | 3,622 | ||||||||
| Customer liabilities |
(201,975 | ) | 207,650 | 132,108 | ||||||||
|
|
|
|
|
|
|
|||||||
| Net cash provided by operating activities |
54,423 | 29,166 | 11,701 | |||||||||
|
|
|
|
|
|
|
|||||||
| Investing activities |
||||||||||||
| Purchases of property, equipment, and software |
(1,877 | ) | (10,544 | ) | (7,405 | ) | ||||||
|
|
|
|
|
|
|
|||||||
| Net cash used in investing activities |
(1,877 | ) | (10,544 | ) | (7,405 | ) | ||||||
|
|
|
|
|
|
|
|||||||
| Financing activities |
||||||||||||
| Excess tax benefit from share-based awards |
15 | 4,403 | 23,886 | |||||||||
| Exercise of vested stock options |
46 | 7,396 | 18,152 | |||||||||
| Restricted cash secured for letter of credit |
— | — | (5,000 | ) | ||||||||
| Purchase of treasury stock |
(161 | ) | (50,160 | ) | (379 | ) | ||||||
| Collection of non-executive employee loans |
— | — | 41 | |||||||||
|
|
|
|
|
|
|
|||||||
| Net cash (used in) provided by financing activities |
(100 | ) | (38,361 | ) | 36,700 | |||||||
|
|
|
|
|
|
|
|||||||
| Effect of exchange rate changes in cash |
(511 | ) | (30 | ) | (338 | ) | ||||||
|
|
|
|
|
|
|
|||||||
| Net increase (decrease) in cash and cash equivalents |
51,935 | (19,769 | ) | 40,658 | ||||||||
| Cash and cash equivalents, at beginning of year |
176,956 | 196,725 | 156,067 | |||||||||
|
|
|
|
|
|
|
|||||||
| Cash and cash equivalents, at end of year |
$ | 228,891 | $ | 176,956 | $ | 196,725 | ||||||
|
|
|
|
|
|
|
|||||||
| Supplemental disclosures of cash flow information |
||||||||||||
| Income taxes paid |
$ | (1,742 | ) | $ | (1,531 | ) | $ | (1,923 | ) | |||
| Income taxes refunded |
$ | 754 | $ | 87 | $ | 4,403 | ||||||
| Supplemental disclosure of non-cash operating activities |
||||||||||||
| Non-cash increase in litigation liability and related insurance receivable included in other liabilities and other assets, respectively |
— | $ | 14,000 | — | ||||||||
See accompanying notes to consolidated financial statements.
F-6
Table of Contents
Accretive Health, Inc.
Notes to Consolidated Financial Statements
Note 1. Description of Business
Accretive Health, Inc. is a leading provider of services that help healthcare providers generate sustainable improvements in their operating margins and cash flows while also improving patient, physician and staff satisfaction for its customers. The Company achieves these results for its customers through an integrated approach encompassing its end-to-end revenue cycle management service and physician advisory service offerings. The Company does so by deploying a unique operating model that leverages its extensive healthcare site experience, innovative technology and process excellence.
The Company’s primary service offering consists of revenue cycle management, or RCM, which helps healthcare providers to more efficiently manage their revenue cycles. This encompasses patient registration, insurance and benefit verification, medical treatment documentation and coding, bill preparation and collections from patients and third-party payers. Accretive Health’s physician advisory services offering assists hospitals in complying with third-party payers’ requirements regarding whether to classify a hospital visit as an in-patient or an out-patient observation case for billing purposes and consists of both concurrent review and retrospective chart audits. The Company also provides customers with retrospective appeal management service support for both governmental and commercial payers.
Note 2. Restatement of Previously Issued Consolidated Financial Statements
Within these financial statements, the Company has included the restated consolidated financial statements for the year ended December 31, 2011, as well as the restated unaudited condensed consolidated financial statements for the interim periods in 2012 and 2011 (see Note 14), which is referred to as the Restatement. The Restatement corrects accounting errors related to timing of recognition of net services revenue, as well as the presentation of net service revenue and cost of services, and also certain capitalized cost for internal use software, goodwill, timing and recording of various accruals, income taxes and other miscellaneous items.
Reclassifications
In connection with the Restatement, the Company has reclassified certain amounts in its historical, as reported, consolidated balance sheets, statement of operations and cash flows as of and for the year ended December 31, 2011 and the quarters ended March 31, June 30 and September 30, 2012 and 2011 (unaudited), to conform to its as restated consolidated financial statements. The reclassifications alone did not affect its net income or cash flows from operating activities on its historical, as reported, consolidated financial statements.
Below is a summary of the reclassifications:
| • | As reported infused management and technology costs were reclassified to cost of services. |
| • | As reported prepaid assets and due from related party were reclassified into other current assets. |
| • | As reported accrued service costs and current deferred revenue were reclassified into current portion of customer liabilities. |
| • | As reported accrued income taxes were moved into other accrued expenses. |
| • | As reported non-current deferred revenue was moved into non-current portion of customer liabilities. |
The Company’s historical, as reported, consolidated cash flow statements have been adjusted to conform to these reclassifications.
F-7
Table of Contents
Accretive Health, Inc.
Notes to Consolidated Financial Statements – (Continued)
The adjustments required to correct errors in the consolidated financial statements as a result of completing the Restatement are described below. The cumulative adjustments required to correct the errors in the financial statements prior to the year ended December 31, 2011, are reflected in the restated stockholders’ equity (deficit) as of December 31, 2010. The cumulative effect of those adjustments increased previously reported accumulated deficit by $238.7 million as of December 31, 2010.
F-8
Table of Contents
Accretive Health, Inc.
Notes to Consolidated Financial Statements – (Continued)
The table below summarizes the effects of the Restatement adjustments on the Consolidated Balance Sheet as of December 31, 2011 (in thousands):
| As reported (1) | Revenue recognition | Goodwill, Software Development and Licenses |
Other adjustments |
Restatement tax impacts |
As restated |
|||||||||||||||||||||||||||
| Gross to Net presentation |
RCM service fees |
Other revenues |
||||||||||||||||||||||||||||||
| Assets |
||||||||||||||||||||||||||||||||
| Current assets: |
||||||||||||||||||||||||||||||||
| Cash and cash equivalents |
$ | 196,725 | $ | — | $ | — | $ | — | $ | — | $ | — | $ | — | $ | 196,725 | ||||||||||||||||
| Accounts receivable, net |
94,106 | (11,346 | ) | (63,049 | ) | (2,593 | ) | — | |
— |
|
— | 17,118 | |||||||||||||||||||
| Prepaid income taxes |
6,026 | — | — | — | — | |
— |
|
1,549 | 7,575 | ||||||||||||||||||||||
| Current deferred tax asset |
— | — | — | 189,676 | 189,676 | |||||||||||||||||||||||||||
| Other current assets |
8,724 | — | (1,649 | ) | — | 40 | (1,221 | ) | — | 5,894 | ||||||||||||||||||||||
|
|
|
|
|
|
|
|
|
|
|
|
|
|
|
|
|
|||||||||||||||||
| Total current assets |
305,581 | (11,346 | ) | (64,698 | ) | (2,593 | ) | 40 | (1,221 | ) | 191,225 | 416,988 | ||||||||||||||||||||
| Property, equipment and software, net |
25,073 | — | (1,136 | ) | — | (8,017 | ) | 1,249 | — | 17,169 | ||||||||||||||||||||||
| Deferred income taxes |
17,878 | — | — | — | — | — | 18,579 | 36,457 | ||||||||||||||||||||||||
| Restricted cash |
5,000 | — | — | — | — | — | — | 5,000 | ||||||||||||||||||||||||
| Goodwill and other assets, net |
10,655 | — | (6,373 | ) | (269 | ) | (910 | ) | (2,362 | ) | (75 | ) | 666 | |||||||||||||||||||
|
|
|
|
|
|
|
|
|
|
|
|
|
|
|
|
|
|||||||||||||||||
| Total assets |
$ | 364,187 | $ | (11,346 | ) | $ | (72,207 | ) | $ | (2,862 | ) | $ | (8,887 | ) | $ | (2,334 | ) | $ | 209,729 | $ | 476,280 | |||||||||||
|
|
|
|
|
|
|
|
|
|
|
|
|
|
|
|
|
|||||||||||||||||
| Liabilities and stockholders’ equity (deficit) |
||||||||||||||||||||||||||||||||
| Current liabilities: |
||||||||||||||||||||||||||||||||
| Accounts payable |
$ | 15,210 | $ | (14,062 | ) | $ | — | $ | — | $ | — | $ | 109 | $ | — | $ | 1,257 | |||||||||||||||
| Current portion of customer liabilities |
73,026 | 2,716 | 412,071 | 185 | — | — | — | 487,998 | ||||||||||||||||||||||||
| Accrued compensation and benefits |
15,763 | — | — | — | — | (177 | ) | — | 15,586 | |||||||||||||||||||||||
| Other accrued expenses |
7,132 | — | — | — | — | 1,717 | (1,053 | ) | 7,796 | |||||||||||||||||||||||
| Deferred income taxes |
3,733 | — | — | — | — | — | (3,733 | ) | — | |||||||||||||||||||||||
|
|
|
|
|
|
|
|
|
|
|
|
|
|
|
|
|
|||||||||||||||||
| Total current liabilities |
114,864 | (11,346 | ) | 412,071 | 185 | — | 1,649 | (4,786 | ) | 512,637 | ||||||||||||||||||||||
|
|
|
|
|
|
|
|
|
|
|
|
|
|
|
|
|
|||||||||||||||||
| Non-current portion of customer liabilities |
7,055 | — | 51,357 | — | — | — | — | 58,412 | ||||||||||||||||||||||||
| Other non-current liabilities |
4,179 | — | — | — | — | 236 | 2,247 | 6,662 | ||||||||||||||||||||||||
|
|
|
|
|
|
|
|
|
|
|
|
|
|
|
|
|
|||||||||||||||||
| Total liabilities |
126,098 | (11,346 | ) | 463,428 | 185 | — | 1,885 | (2,539 | ) | 577,711 | ||||||||||||||||||||||
|
|
|
|
|
|
|
|
|
|
|
|
|
|
|
|
|
|||||||||||||||||
| Commitments and contingencies |
||||||||||||||||||||||||||||||||
| Stockholders’ equity (deficit) |
||||||||||||||||||||||||||||||||
| Common stock |
987 | — | — | — | — | — | — | 987 | ||||||||||||||||||||||||
| Additional paid-in capital |
227,188 | — | — | — | — | (12 | ) | (265 | ) | 226,911 | ||||||||||||||||||||||
| Accumulated deficit |
11,330 | — | (535,635 | ) | (3,047 | ) | (8,887 | ) | (4,534 | ) | 212,533 | (328,240 | ) | |||||||||||||||||||
| Accumulated other comprehensive loss |
(1,037 | ) | — | — | — | — | 327 | — | (710 | ) | ||||||||||||||||||||||
| Treasury stock |
(379 | ) | — | — | — | — | — | — | (379 | ) | ||||||||||||||||||||||
|
|
|
|
|
|
|
|
|
|
|
|
|
|
|
|
|
|||||||||||||||||
| Total stockholders’ equity (deficit) |
238,089 | |
— |
|
(535,635 | ) | (3,047 | ) | (8,887 | ) | (4,219 | ) | 212,268 | (101,431 | ) | |||||||||||||||||
|
|
|
|
|
|
|
|
|
|
|
|
|
|
|
|
|
|||||||||||||||||
| Total liabilities and stockholders’ equity (deficit) |
$ | 364,187 | $ | (11,346 | ) | $ | (72,207 | ) | $ | (2,862 | ) | $ | (8,887 | ) | $ | (2,334 | ) | $ | 209,729 | $ | 476,280 | |||||||||||
|
|
|
|
|
|
|
|
|
|
|
|
|
|
|
|
|
|||||||||||||||||
| (1) | In connection with the Restatement, the Company also reclassified certain amounts in the historical consolidated financial statements to conform to the current presentation, which are discussed in this note. |
F-9
Table of Contents
Accretive Health, Inc.
Notes to Consolidated Financial Statements – (Continued)
The table below summarizes the effects of the Restatement adjustments on the Consolidated Statement of Operations and Comprehensive Income (Loss) for the year ended December 31, 2011 (in thousands, except share and per share data):
| Revenue recognition | Goodwill, Software Development and Licenses |
|||||||||||||||||||||||||||||||
| As reported (1) |
Gross - Net presentation |
RCM service fees |
Other revenues |
Other adjustments |
Restatement tax impacts |
As restated | ||||||||||||||||||||||||||
| Net service revenue |
$ | 826,276 | $ | (546,765 | ) | $ | (178,136 | ) | $ | 591 | $ | — | $ | — | $ | — | $ | 101,966 | ||||||||||||||
| Operating expenses: |
||||||||||||||||||||||||||||||||
| Cost of services |
715,978 | (546,765 | ) | (13,061 | ) | — | 740 | 1,823 | — | 158,715 | ||||||||||||||||||||||
| Selling, general and administrative |
62,243 | — | (1,584 | ) | (213 | ) | 322 | 2,500 | — | 63,268 | ||||||||||||||||||||||
| Restatement and other nonrecurring costs |
— | — | — | — | — | — | — | — | ||||||||||||||||||||||||
|
|
|
|
|
|
|
|
|
|
|
|
|
|
|
|
|
|||||||||||||||||
| Total operating expenses |
778,221 | (546,765 | ) | (14,645 | ) | (213 | ) | 1,062 | 4,323 | — | 221,983 | |||||||||||||||||||||
|
|
|
|
|
|
|
|
|
|
|
|
|
|
|
|
|
|||||||||||||||||
| Income (loss) from operations |
48,055 | — | (163,491 | ) | 804 | (1,062 | ) | (4,323 | ) | — | (120,017 | ) | ||||||||||||||||||||
|
|
|
|
|
|
|
|
|
|
|
|
|
|
|
|
|
|||||||||||||||||
| Net interest income |
22 | — | — | — | — | 4 | — | 26 | ||||||||||||||||||||||||
|
|
|
|
|
|
|
|
|
|
|
|
|
|
|
|
|
|||||||||||||||||
| Net income (loss) before provision for income taxes |
48,077 | — | (163,491 | ) | 804 | (1,062 | ) | (4,319 | ) | — | (119,991 | ) | ||||||||||||||||||||
| Income tax provision (benefit) |
18,913 | — | — | — | — | — | (67,159 | ) | (48,246 | ) | ||||||||||||||||||||||
|
|
|
|
|
|
|
|
|
|
|
|
|
|
|
|
|
|||||||||||||||||
| Net income (loss) |
$ | 29,164 | $ | — | $ | (163,491 | ) | $ | 804 | $ | (1,062 | ) | $ | (4,319 | ) | $ | 67,159 | $ | (71,745 | ) | ||||||||||||
|
|
|
|
|
|
|
|
|
|
|
|
|
|
|
|
|
|||||||||||||||||
| Net income (loss) per common share |
||||||||||||||||||||||||||||||||
| Basic |
$ | 0.30 | $ | (0.74 | ) | |||||||||||||||||||||||||||
| Diluted |
$ | 0.29 | $ | (0.74 | ) | |||||||||||||||||||||||||||
| Weighted-average shares used in calculating net income (loss) per common share |
||||||||||||||||||||||||||||||||
| Basic |
96,964,661 | 96,964,661 | ||||||||||||||||||||||||||||||
| Diluted |
101,151,273 | 96,964,661 | ||||||||||||||||||||||||||||||
| Other comprehensive income (loss) , net of tax: |
||||||||||||||||||||||||||||||||
| Foreign currency translation adjustments |
$ | (903 | ) | $ | — | — | $ | — | $ | — | $ | 178 | $ | — | $ | (725 | ) | |||||||||||||||
|
|
|
|
|
|
|
|
|
|
|
|
|
|
|
|
|
|||||||||||||||||
| Comprehensive income (loss) |
$ | 28,261 | $ | — | $ | (163,491 | ) | $ | 804 | $ | (1,062 | ) | $ | (4,141 | ) | $ | 67,159 | $ | (72,470 | ) | ||||||||||||
|
|
|
|
|
|
|
|
|
|
|
|
|
|
|
|
|
|||||||||||||||||
| (1) | In connection with the Restatement, the Company also reclassified certain amounts in the historical consolidated financial statements to conform to the current presentation, which are discussed in this note. |
See accompanying notes to consolidated financial statements
F-10
Table of Contents
Accretive Health, Inc.
Notes to Consolidated Financial Statements – (Continued)
The table below summarizes the effects of the Restatement adjustments on the Consolidated Statement of Cash Flows for the year ended December 31, 2011 (in thousands):
| As reported(1) | Adjustments | As restated | ||||||||||
| Net income (loss) |
$ | 29,164 | $ | (100,909 | ) | $ | (71,745 | ) | ||||
| Adjustments to reconcile net income (loss) to net cash provided by operations: |
||||||||||||
| Depreciation and amortization |
8,312 | (3,450 | ) | 4,862 | ||||||||
| Employee stock-based compensation |
25,196 | (10 | ) | 25,186 | ||||||||
| Provision for doubtful receivables |
— | 114 | 114 | |||||||||
| Deferred income taxes |
(8,751 | ) | (65,793 | ) | (74,544 | ) | ||||||
| Excess tax benefit from share-based awards |
(24,101 | ) | 215 | (23,886 | ) | |||||||
| Changes in operating assets and liabilities: |
||||||||||||
| Accounts receivable |
(40,221 | ) | 28,278 | (11,943 | ) | |||||||
| Prepaid income taxes |
29,543 | (1,653 | ) | 27,890 | ||||||||
| Other assets |
(11,255 | ) | 9,417 | (1,838 | ) | |||||||
| Accounts payable |
(14,818 | ) | 13,604 | (1,214 | ) | |||||||
| Accrued compensation and benefits |
2,445 | 644 | 3,089 | |||||||||
| Other liabilities |
1,317 | 2,305 | 3,622 | |||||||||
| Customer liabilities |
19,575 | 112,533 | 132,108 | |||||||||
|
|
|
|
|
|
|
|||||||
| Net cash provided by operating activities |
16,406 | (4,705 | ) | 11,701 | ||||||||
|
|
|
|
|
|
|
|||||||
| Investing activities |
||||||||||||
| Purchases of property, equipment, and software |
(13,358 | ) | 5,953 | (7,405 | ) | |||||||
| Other |
1,706 | (1,706 | ) | — | ||||||||
|
|
|
|
|
|
|
|||||||
| Net cash used in investing activities |
(11,652 | ) | 4,247 | (7,405 | ) | |||||||
|
|
|
|
|
|
|
|||||||
| Financing activities |
||||||||||||
| Excess tax benefit from share-based awards |
24,101 | (215 | ) | 23,886 | ||||||||
| Exercise of vested stock options |
18,148 | 4 | 18,152 | |||||||||
| Restricted cash secured for letter of credit |
(5,000 | ) | — | (5,000 | ) | |||||||
| Purchase of treasury stock |
(379 | ) | — | (379 | ) | |||||||
| Collection of non-executive employee loans |
41 | — | 41 | |||||||||
|
|
|
|
|
|
|
|||||||
| Cash provided by financing activities |
36,911 | (211 | ) | 36,700 | ||||||||
|
|
|
|
|
|
|
|||||||
| Effect of exchange rate changes in cash |
(513 | ) | 175 | (338 | ) | |||||||
|
|
|
|
|
|
|
|||||||
| Net increase in cash and cash equivalents |
41,152 | (494 | ) | 40,658 | ||||||||
| Cash and cash equivalents at beginning of year |
155,573 | 494 | 156,067 | |||||||||
|
|
|
|
|
|
|
|||||||
| Cash and cash equivalents at end of year |
$ | 196,725 | $ | — | $ | 196,725 | ||||||
|
|
|
|
|
|
|
|||||||
| (1) | Reflects certain reclassifications to amounts originally reported in the Company’s historical consolidated financial statements which are discussed in this note. |
The Restatement adjustments had no impact on the cash and cash equivalents balance as of December 31, 2011. The Restatement adjustments affecting the consolidated statement of cash flows for the year ending December 31, 2011, are predominantly included in the Company’s net loss from operations, offset by non-cash adjustments to net income (loss) and changes in operating assets and liabilities. The significant non-cash adjustments include decreases to depreciation and amortization offset by adjustments to deferred tax assets. Changes in operating assets and liabilities are largely attributable to decreases in accounts receivable and increases to customer liabilities associated with revenue recognition adjustments. The decrease in cash used in investing activities primarily relates to the correction of the recording of certain acquired and developed internal use software costs, which were previously capitalized and presented as cash used in investing activities and have
F-11
Table of Contents
Accretive Health, Inc.
Notes to Consolidated Financial Statements – (Continued)
now been expensed and presented as part of net income (loss). There were no significant adjustments related to cash provided by financing activities.
The table below summarizes the effects of cumulative Restatement adjustments recorded to all periods prior to December 31, 2010 on previously reported accumulated deficit balance (in thousands):
| December 31, 2010 |
||||
| Accumulated deficit, as reported |
$ | (17,834 | ) | |
| Revenue recognition: |
||||
| RCM service fees |
(372,144 | ) | ||
| Other revenues |
(3,851 | ) | ||
|
|
|
|||
| Revenue recognition |
(375,995 | ) | ||
| Goodwill, Software Development and Licenses |
(7,825 | ) | ||
| Other adjustments |
(215 | ) | ||
| Restatement tax impacts |
145,374 | |||
|
|
|
|||
| Cumulative adjustments to accumulated deficit |
(238,661 | ) | ||
|
|
|
|||
| Accumulated deficit, as restated |
$ | (256,495 | ) | |
|
|
|
|||
The following is a discussion of the significant adjustments identified during the Restatement.
See Note 14 for the effects of the restatement adjustments on the seven previously reported quarters ended September 30, 2012.
Revenue Recognition
Gross to Net presentation
The Company has corrected the previous presentation of certain net services revenue, cost of services, receivables, payables and customer liabilities related to its RCM contracts. Under its RCM contracts, the Company infuses its management, technology and operating methodology into its customers’ existing operations to assist customers in achieving efficiencies and operating margin improvements within their revenue cycle. The Company’s RCM contracts require the Company to reimburse customers for the payroll and benefit costs of the customers’ employees, non-payroll third-party vendor and other costs associated with the customers’ revenue cycle activities. Certain third-party vendor reimbursements are made directly to such vendors on behalf of the customers. The Company does not have control over the customers’ resources and the third-party vendor relationships. The Company previously presented revenues and the cost reimbursements on a gross basis. However, since the Company’s managed services agreements do not satisfy the criteria for gross accounting treatment under ASC 605-50, Customer Payments and Incentives, the Company corrected the accounting to properly present the amounts billed to its customers net of the customer cost reimbursements incurred. The deferred customer billings within the category of customer liabilities are also presented on a net basis in the consolidated balance sheet. Accounts receivable and accrued service costs within the category of customer liabilities in the consolidated balance sheet have been restated to present the total net position with each customer after considering the amounts due from the customer and the amounts due to the customer including related accrual balances.
RCM Service fees
Revenue recognized under the Company’s RCM contracts are subject to the requirements of the Revenue Recognition Topic of ASC 605. Under this guidance, revenue is recognized when all of the following criteria have been met: (a) persuasive evidence of the sales arrangement exists, (b) delivery has occurred or services are
F-12
Table of Contents
Accretive Health, Inc.
Notes to Consolidated Financial Statements – (Continued)
rendered, (c) the arrangement fee is fixed or determinable, and (d) collectability of the resulting receivable is reasonably assured. The Company has corrected the timing of revenue recognition for the arrangements where, at the time the revenue was recognized, the arrangement fee was not considered fixed or determinable, primarily due to the following:
(i) The Company provides on-going services to its customers under multi-year agreements. Substantially all of the RCM agreements were under negotiation throughout the contract term. Due to a historical pattern of adjustments and concessions that impacts the billings from the Company to its customers, the Company has concluded that the arrangement fees do not meet the fixed or determinable criteria.
(ii) The Company’s RCM contracts contain performance based fees, in net operating and incentive fees, that are contingent in nature and are not finalized until the end of the contract or at an other contractual agreement event, as defined in Note 3, Summary of Significant Accounting Policies. Previously, the Company recorded revenue on these agreements for the estimated amount earned to date. However, in the restated consolidated financial statements, the Company corrected its accounting to defer recognition of all contingent fees until they are contractually finalized, which often occurs at the end of the contract term or at the end of the customer relationship.
For those circumstances where the Company determined that revenue was not fixed or determinable, revenue has been deferred, which resulted in decreases to accounts receivable and increases to customer liabilities. Revenue corrected for these errors impacted prior periods and have been reflected in the accumulated deficit balance at December 31, 2010. Bad debt expense that had been recorded in selling, general and administrative expenses, associated with uncollected invoices for which revenue is not fixed or determinable has been reversed. Deferral of revenues and reversal of associated bad debt expense resulted in decreases to accounts receivable and increases to deferred customer billings within the category of customer liabilities in the consolidated balance sheet. Revenue and expense corrections which impacted prior periods have been reflected in the accumulated deficit balance.
Other revenues
The Company has corrected errors in previously recognized revenue for other services where the Company had not met, at the time the revenue was originally recognized, all of the criteria of revenue recognition.
Goodwill, software development and licenses
Capitalized Software – The Company has corrected the type of costs previously capitalized for internally developed software and expensed them as incurred. The Company historically capitalized software costs related to purchased software licenses, third-party developers’ time and expense, and internal developer (employee) costs, which were amortized and reported as cost of services and selling, general and administrative expenses. This correction has the impact of reducing the net carrying value of capitalized software. Approximately $6.9 million of previously capitalized internal cost for development employee costs was attributable to prior periods and has been reflected in the accumulated deficit balance at December 31, 2010.
Licenses – The Company identified several third-party software licenses with twelve month terms that had been previously capitalized in property, equipment and software and depreciated over periods longer than the license term. As part of the Restatement process, the Company corrected the errors and reclassified those third-party software licenses to prepaid expenses. Any previously reported depreciation expense was reversed out of
F-13
Table of Contents
Accretive Health, Inc.
Notes to Consolidated Financial Statements – (Continued)
selling, general and administrative expense and accumulated depreciation balances. Reversal of depreciation expense associated with third-party software license with twelve month terms on previous years has been reflected in the accumulated deficit balance at December 31, 2010.
Goodwill – The Company made a payment of $0.9 million in 2007 to the sellers of Sure Decisions, Inc. (“SDI’), a business acquired by the Company in 2006. The Company incorrectly treated the payment as additional purchase consideration and recorded additional goodwill of $0.9 million instead of recording the expense in the income statement. The correction of the error resulted in a reduction of goodwill by $0.9 million, with a corresponding adjustment to accumulated deficit as of December 31, 2010.
Other adjustments
Grant Receivable – The Company has corrected the improper recognition of certain grants. During 2011, the Company entered into an agreement with a local municipality to receive certain grants upon satisfaction of various conditions. As of December 31, 2011, the Company had incorrectly concluded that there was reasonable assurance that the Company will comply with the conditions and the grants will be received. The Company has corrected the error and reversed the grant receivable of $2.4 million, the credit to cost of services of $1.0 million and reduced the carrying value of property, equipment and software. These adjustments are included within Other Adjustments in the table summarizing the effects of the restatement adjustments.
Uncertain Tax Positions – The Company originally recorded a tax liability associated with the SDI acquisition as a current liability as of December 31, 2011. Upon further analysis, the Company determined that the amount was long term in nature, due to the statute of limitations related to taxable events expiring in January 2015. Accordingly, the $1.1 million tax liability related to the SDI acquisition was reclassified from current to non-current liabilities in the Company’s consolidated balance sheet.
Leasehold Improvements – Historically, the Company’s policy was to amortize leasehold improvements over a period of sixty months. However, only the portion of leasehold improvements funded by the Company was capitalized as property and equipment and the landlord’s contribution was recorded as a reduction of the cost of property and equipment and not recorded as deferred rent. As a result, the Company understated its leasehold improvement assets, other non-current liabilities, and depreciation expense, as well as overstated rent expense. Adjustments were made to correct the treatment of leasehold improvements and deferred rent, and to appropriately recognize the lease incentives as a reduction of rental expense on a straight-line basis over the lease term. Correction of these errors primarily impacted periods prior to January 1, 2011. Prior period net adjustments related to rent and depreciation expense increased the accumulated deficit balance at December 31, 2010 by $0.6 million.
Other Adjustments – The Company has also corrected errors for certain accruals and other items, each of which had a corresponding increase to selling, general, and administrative expenses in 2011 by $2.5 million and an increase to cost of services by $0.8 million, and decreased the accumulated deficit balance at December 31, 2010 by $0.4 million.
Restatement Tax Impacts
The Company has recorded tax adjustments to reflect the impacts of the Restatement and to correct errors related to its tax provision including accruals for uncertain tax positions. In previously issued financial statements, the Company had established a partial valuation allowance with respect to certain separate state tax net operating loss carry forward deferred tax assets. The Company reexamined the need for a valuation allowance for deferred tax assets based upon the weight of all available evidence, both positive and negative. The ultimate
F-14
Table of Contents
Accretive Health, Inc.
Notes to Consolidated Financial Statements – (Continued)
recovery of deferred tax assets is dependent upon the amount and timing of future taxable income and other factors such as the jurisdiction in which the asset is to be recovered. A high degree of judgment is required to determine if, and the extent to which, valuation allowances should be recorded against deferred tax assets.
The Company concluded that it is more likely than not that, with the exception of certain separate state tax net operating loss carry forwards previously reserved for, the deferred tax assets will be realized. The determination that an adjustment to the valuation allowance against the deferred tax assets is not required was made taking into account the Restatement revenue recognition changes and the resulting cumulative losses incurred in recent years, the nature of the deferred tax asset balances and their expected reversal, the Company’s projected future taxable income and an evaluation of all other available positive and negative evidence.
The revision to reflect the tax impacts of the Restatement adjustments resulted in a change from the 2011 actual rate from 39% to 40%. The change in the actual rate is primarily attributable to adjustments to the Company’s accrual for contingent tax liabilities. The effect on the consolidated income tax provision to correct the errors in 2011 is a decrease to income tax expense and deferred income tax liability of $67.2 million and $3.7 million, respectively and an increase of $1.5 million, $208.2 million and $2.3 million to prepaid income taxes, deferred income tax asset (current and non-current) and income tax liability, respectively.
See Note 9, Income Taxes.
Earnings (Loss) Per Share
The table below sets forth the impact to net income (loss) per common share of all 2011 Restatement adjustments on a basic and diluted basis, including the weighted average shares used in calculating net income (loss) per common share on both a basic and diluted basis:
| Year Ended December 31, 2011 | ||||||||
| As reported | As restated (1) | |||||||
| Net income (loss) per common share |
||||||||
| Basic |
$ | 0.30 | $ | (0.74 | ) | |||
| Diluted |
$ | 0.29 | $ | (0.74 | ) | |||
| Weighted-average shares used in calculating net income (loss) per common share |
||||||||
| Basic |
96,964,661 | 96,964,661 | ||||||
| Diluted |
101,151,273 | 96,964,661 | ||||||
| (1) | Due to the restatement and resultant net loss, previously dilutive shares used to calculate the diluted net income per common share have been excluded in the calculation of the restated diluted net loss per common share. |
Note 3. Summary of Significant Accounting Policies
Basis of Presentation
The consolidated financial statements include the assets, liabilities and results of operations of the Company and its wholly owned subsidiaries. All intercompany transactions and balances have been eliminated in consolidation. The preparation of financial statements in conformity with GAAP requires management to make estimates and assumptions that affect the amounts reported in these consolidated financial statements and accompanying notes.
F-15
Table of Contents
Accretive Health, Inc.
Notes to Consolidated Financial Statements – (Continued)
Segments
Reporting segments are identified as components of an enterprise about which separate discrete financial information is available for evaluation by the chief operating decision maker, or decision-making group, in making decisions on how to allocate resources and assess performance. All of the Company’s operations are organized around the single business of providing end-to-end management services of revenue cycle operations for U.S-based hospitals and other medical providers. The Company views its operations and manages its business as one operating and reporting segment.
Use of Estimates
The Company regularly evaluates its estimates, assumptions and judgments, including those related to revenue recognition, allowance for doubtful accounts, amounts due from related party, cost reimbursements to the Company’s RCM customers, valuation of goodwill, intangible assets and other long-lived assets, share-based compensation, income taxes and related valuation allowances. Actual results could differ from these estimates and changes in estimates are reflected in the period in which they become known, unless stated otherwise.
Revenue Recognition
Revenue is generally recognized when all of the following criteria are met; (i) persuasive evidence of an arrangement exists, (ii) services have been rendered, (iii) the fee is fixed or determinable, and (iv) collectability is reasonably assured.
Net service fees, as reported in the consolidated statement of operations and comprehensive income (loss), consist of: (a) RCM service fees and (b) professional service fees earned on a fixed fee, transactional fee, or time and materials basis. The Company’s primary source of revenue is RCM service fees. RCM service fees are primarily contingent, but along with fixed fees are viewed as one deliverable. To the extent that certain RCM service fees are fixed and not subject to refund, adjustment or concession, these fees are recognized into revenue on a straight-line basis over the term of the contract. The Company also generates revenue from other fixed fee consulting or transactional fee arrangements.
RCM service fees that are contingent in nature are recognized as revenue once all the criteria for revenue recognition are met, which is generally at the end of a contract or other contractual agreement events. Revenue is recognized for RCM service fees upon the contract reaching the end of its stated term (such that the customer relationship will not continue) to the extent that: (i) cash has been received for invoiced fees; and (ii) there are no disputes at the conclusion of the term of the contract.
If fees or services are disputed by a customer at the end of a contract, a settlement agreement entered into with the customer triggers a revenue recognition event. An “other contractual agreement event” occurs when a renewal or amendment to an existing contract is executed in which the parties reach agreement on prior fees. Revenue is recognized up to the amount covered by such agreements.
RCM service fees consist of the following contingent fees: (i) Net Operating Fees and (ii) Incentive Fees
Net Operating Fees
The Company generates net operating fees to the extent that the Company is able to assist customers in reducing their revenue cycle operations cost. The Company’s net operating fees consist of:
| i) | gross base fees invoiced to customers; less |
F-16
Table of Contents
Accretive Health, Inc.
Notes to Consolidated Financial Statements – (Continued)
| ii) | corresponding costs of customers’ revenue cycle operations which the Company undertakes to pay pursuant to its RCM agreements (salaries and benefits associated with personnel in their RCM departments, and related third-party vendor costs and other costs) less |
| iii) | any cost savings the Company shares with customers. |
Net operating fees are reported as deferred customer billings until the Company recognizes revenue for a customer contract at the end of a contract or other contractual agreement event. The amount of unpaid costs of customers’ revenue cycle operations and shared cost savings are reported as accrued service costs within customer liabilities in the consolidated balance sheets.
Incentive Fees
The Company generates revenue in the form of performance-based fees when the Company improves the customers’ revenue yield. These performance metrics vary by customer contract. However, certain contracts contain a contract-to-date performance metric that is not resolved until the end of the term of the contract. Incentive fees are reported as deferred customer billings only upon cash receipt and until the Company recognizes revenue for a customer at the end of a contract or other contractual agreement event. In some cases, when a customer agreement is extended under an evergreen provision or other amendment, fees may not be considered finalized until the end of the customer relationship.
Customer Liabilities
Base fees and incentive fees are billed to customers on a quarterly basis, and fixed fees are billed on either a monthly or quarterly basis. Generally, quarterly base fees are billed in advance of each quarter. Customer liabilities include: (i) accrued service costs (amounts due and accrued for cost reimbursements net of amounts receivable for base fees from the corresponding customer), (ii) deferred customer billings (net operating fees billed and incentive fees collected that have not met all revenue recognition criteria), (iii) customer deposits (consisting of net operating fees under the Company’s RCM contracts that are paid prior to the service period and amounts due as a refund to our customers on incentive fees) and, (iv) deferred revenue (fixed fees that are being amortized to revenue over the term of the contract, if any). Deferred customer billings are classified as current based on the customer contract end dates or other termination events that fall within twelve months of the balance sheet dates. Accrued service cost, customer deposits, and deferred revenue are classified as current or non-current based on the anticipated period in which the liabilities are expected to be settled or the revenue is expected to be recognized.
| 2013 | December 31, 2012 |
2011 | ||||||||||
| As restated | ||||||||||||
| Deferred customer billing, current |
$ | 232,876 | $ | 601,386 | $ | 422,224 | ||||||
| Accrued service costs, current |
100,833 | 71,731 | 51,247 | |||||||||
| Customer deposits, current |
22,817 | 3,379 | 14,338 | |||||||||
| Deferred revenue, current |
168 | 123 | 189 | |||||||||
|
|
|
|
|
|
|
|||||||
| Current portion of customer liabilities |
356,694 | 676,619 | 487,998 | |||||||||
|
|
|
|
|
|
|
|||||||
| Deferred customer billing, non-current |
192,826 | 77,443 | 56,491 | |||||||||
| Customer deposits, non-current |
2,566 | — | — | |||||||||
| Deferred revenue, non-current |
— | — | 1,921 | |||||||||
|
|
|
|
|
|
|
|||||||
| Non current portion of customer liabilities |
195,392 | 77,443 | 58,412 | |||||||||
|
|
|
|
|
|
|
|||||||
| Total customer liabilities |
$ | 552,086 | $ | 754,062 | $ | 546,410 | ||||||
|
|
|
|
|
|
|
|||||||
F-17
Table of Contents
Accretive Health, Inc.
Notes to Consolidated Financial Statements – (Continued)
Consulting Fees, Transaction Fees and Contingent Service Fees
The Company also generates revenue from fixed-fee arrangements, transactional service contracts and contingency-fee service contracts. Provided all other criteria of revenue recognition are met under ASC 605, revenue under these arrangements is recognized as services are performed, deliverables are provided and related contingencies are removed. All related direct costs are recorded as period costs when incurred. These consulting fees, transactional fees and contingent service fees are generated from services such as physician advisory services, population health solutions, and other related consulting services.
Cost of Services
All costs associated with generating the Company’s net services revenue, including the cost of operating its shared services centers, are expensed as incurred. Cost of services consist of (i) infused management and technology costs, (ii) shared services costs and (iii) other costs to perform physician advisory services and population health solutions. Infused management and technology costs consist primarily of wages, bonuses, benefits, share-based compensation, travel and other costs associated with deploying the Company’s employees at customer sites to help manage the Company’s customers’ revenue cycle operations. The other significant portion of these expenses is an allocation of the costs associated with maintaining, improving, and deploying our integrated proprietary technology suite. Shared services costs relate to the Company’s shared services centers in the U.S. and India that perform patient scheduling and pre-registration, medical transcription, cash posting, reconciliation of payments to billing records, patient follow-up, and Medicaid eligibility determination for our customers. The Company incurs expenses related to salaries and benefits for employees in its shared services centers and non-payroll costs associated with operating its shared services centers. Other expenses consist of costs related to managing physician advisory services, population health solutions, and other services. These expenses consist primarily of wages, bonuses, benefits, share-based compensation, and facilities costs.
Comprehensive Income (Loss)
Comprehensive income (loss) is the net income (loss) of the Company combined with other changes in stockholders’ equity (deficit) not involving ownership interest changes. For the Company, such changes are foreign currency translation adjustments.
Cash and Cash Equivalents
The Company considers all highly liquid investments with a maturity of three months or less when purchased to be cash equivalents. The following table summarizes assets that are measured at fair value and are categorized using the fair value hierarchy (in thousands).
| December 31, | ||||||||||||
| 2013 | 2012 | 2011 | ||||||||||
| As restated | ||||||||||||
| Level 1 assets – |
||||||||||||
| Money market funds with maturities of less than 90 days |
$ | 217,065 | $ | 169,099 | $ | 193,016 | ||||||
|
|
|
|
|
|
|
|||||||
Accounts Receivable and Allowance for Doubtful Accounts
Accounts receivable comprises of unpaid balances pertaining to non-RCM service fees and net receivable balances for RCM customers after considering cost reimbursements owed to such customers, including related accrued balances.
The Company assesses its customers’ creditworthiness as part of its customer acceptance process. The Company maintains an estimated allowance for doubtful accounts to reduce its accounts receivable to the amount
F-18
Table of Contents
Accretive Health, Inc.
Notes to Consolidated Financial Statements – (Continued)
that it believes will be collected. This allowance is based on the Company’s historical experience, its assessment of each customer’s ability to pay, the length of time a balance has been outstanding, input from key customer resources assigned to each customer, and the status of any ongoing operations with each applicable customer.
Movements in the allowance for doubtful accounts are as follows (in thousands):
| December 31, | ||||||||||||
| 2013 | 2012 | 2011 | ||||||||||
| As restated | ||||||||||||
| Beginning balance |
$ | 183 | $ | 95 | $ | — | ||||||
| Provision |
634 | 183 | 114 | |||||||||
| Write-offs |
(77 | ) | (95 | ) | (19 | ) | ||||||
|
|
|
|
|
|
|
|||||||
| Ending balance |
$ | 740 | $ | 183 | $ | 95 | ||||||
|
|
|
|
|
|
|
|||||||
Property, Equipment and Software
Property and equipment are stated at cost, and related depreciation and amortization are calculated on the straight-line method over the estimated useful lives of the assets.
For internally developed software, the Company adheres to a development methodology where the process moves quickly between planning, design, development, testing, and then moves back to planning before the testing is complete. As such, there are short development cycles and rapid production changes. As a result, the qualifying activities to capitalize development costs are short and therefore, the Company expenses its internal development labor costs as incurred. However, the Company capitalizes qualifying third-party costs and hardware and software costs related to the Company’s software development activities in accordance with GAAP. The Company amortizes the capitalized software development costs over their estimated life on a straight-line basis.
The major classifications of property, equipment and software and their expected useful lives are as follows:
| Computers and other equipment |
3 years | |
| Leasehold improvements |
Shorter of 10 years or lease term | |
| Office furniture |
5 years | |
| Software |
3 to 5 years |
Goodwill
Goodwill represents the excess purchase price over the net assets of a business the Company acquired in May 2006. Goodwill is not subject to amortization but is subject to impairment testing at least annually. The Company’s annual impairment assessment date is October 1. The Company has $0.5 million of goodwill that is included in “Goodwill and other assets, net” in the accompanying consolidated balance sheets at 2013, 2012 and 2011.
The Company has the option to assess goodwill impairment by first performing a qualitative assessment to determine whether it is more likely than not that the fair value of a reporting unit is less than its carrying amount. If the Company determines that it is more likely than not that the fair value of a reporting unit is less than its carrying amount, the Company is required to perform a two-step goodwill impairment test. In the first step, the fair value of the reporting unit is compared to its book value including goodwill. If the fair value of the reporting unit is in excess of its book value, the related goodwill is not impaired and no further analysis is necessary. If the fair value of the reporting unit is less than its book value, there is an indication of potential impairment and a second step is performed. When required, the second step of testing involves calculating the implied fair value of goodwill for the reporting unit. The implied fair value of goodwill is determined in the same manner as goodwill
F-19
Table of Contents
Accretive Health, Inc.
Notes to Consolidated Financial Statements – (Continued)
recognized in a business combination, which is the excess of the fair value of the reporting unit determined in step one over the fair value of its net assets and identifiable intangible assets. If the carrying value of the reporting unit’s goodwill exceeds the implied fair value of that goodwill, an impairment loss is recognized in an amount equal to that excess. There were no impairments of goodwill during the years ended December 31, 2013, 2012, and 2011.
Impairment of Long-Lived Assets
Property, equipment, software and other acquired intangible assets are reviewed for impairment whenever events or changes in circumstances indicate that the carrying amount of the asset may not be recoverable. If circumstances require a long-lived asset or asset group be reviewed for possible impairment, the Company first compares undiscounted cash flows expected to be generated by each asset or asset group to its carrying value. If the carrying value of the long-lived asset or asset group is not recoverable on an undiscounted cash flow basis, an impairment charge is recognized to the extent that the carrying value exceeds the fair value. There were no impairments of property, equipment, software or other acquired intangible assets during the years ended 2013, 2012, and 2011.
Income Taxes
Income taxes are accounted for under the asset and liability method. Deferred tax assets and liabilities are recognized for the future tax consequences attributable to differences between the financial statement carrying amounts of existing assets and liabilities and their respective tax basis and operating loss and tax credit carry forwards. Deferred tax assets and liabilities are measured using current tax laws and enacted tax rates in effect for the years in which those temporary differences are expected to be recovered or settled. The effect on deferred tax assets and liabilities of a change in tax rates is recognized in income in the period that includes the enactment date. The Company records a valuation allowance for deferred tax assets if, based upon the weight of all available evidence, both positive and negative, it is more likely than not that some or all of the deferred tax assets will not be realized.
The Company recognizes the tax benefit from an uncertain tax position only if it is more likely than not that the tax position will be sustained upon examination by the tax authorities, based on the technical merits of the position. The tax benefits recognized in the consolidated financial statements from such a position are measured based on the largest amount of benefit that has a greater than fifty percent likelihood of being realized upon ultimate settlement. Interest and penalties relating to income taxes are recognized in our income tax provision in the statements of consolidated operations.
Fair Value of Financial Instruments
The Company records its financial assets and liabilities at fair value. The accounting standard for fair value (i) defines fair value as the price that would be received to sell an asset or paid to transfer a liability (an exit price) in an orderly transaction between market participants at the measurement date, (ii) establishes a framework for measuring fair value, (iii) establishes a hierarchy of fair value measurements based upon the ability to observe inputs used to value assets and liabilities, (iv) requires consideration of nonperformance risk, and (v) expands disclosures about the methods used to measure fair value. The accounting standard establishes a three-level hierarchy of measurements based upon the reliability of observable and unobservable inputs used to arrive at fair value. Observable inputs are independent market data, while unobservable inputs reflect the Company’s assumptions about valuation. The three levels of the hierarchy are defined as follows:
| • | Level 1: Observable inputs such as quoted prices in active markets for identical assets and liabilities; |
| • | Level 2: Inputs other than quoted prices that are observable for the asset or liability, either directly or indirectly. These include quoted prices for similar assets or liabilities in active markets and quoted |
F-20
Table of Contents
Accretive Health, Inc.
Notes to Consolidated Financial Statements – (Continued)
| prices for identical or similar assets or liabilities in markets that are not active, and model-derived valuations in which all significant inputs and significant value drivers are observable in active markets; and |
| • | Level 3: Valuations derived from valuation techniques in which one or more significant inputs or significant value drivers are unobservable. |
The carrying amounts of the Company’s financial instruments, which include financial assets such as cash and cash equivalents, restricted cash, accounts receivable, amounts due from related party and certain other current assets, as well as financial liabilities such as accounts payable, accrued service costs, accrued compensation and benefits and certain other accrued expenses, approximate their fair values, due to the short-term nature of these instruments. The Company’s financial assets which are required to be measured at fair value on a recurring basis consist of cash equivalents, which are highly liquid money market funds and accordingly are classified as Level 1 assets in the fair value hierarchy. The Company does not have any financial liabilities that are required to be measured at fair value on a recurring basis.
Legal and Other Contingencies
In the normal course of business, the Company is subject to regulatory investigations or legal proceedings, as well as demands, claims and threatened litigation. The Company records an estimated loss for any claim, lawsuit, investigation or proceeding when it is probable that a liability has been incurred and the amount of the loss can be reasonably estimated. Significant judgment is required in both the determination of the probability and whether the loss can be reasonably estimated. Actual expenses could differ from these estimates.
Foreign Currency Translation and Transaction Gains/(Losses)
Assets and liabilities of non-U.S. subsidiaries that operate in a local currency environment, where that local currency is the functional currency, are translated to U.S. dollars at exchange rates in effect at the balance sheet date. Income and expense accounts are translated at average exchange rates during the year which approximate the rates in effect at the transaction dates. The resulting translation adjustments are recorded as a separate component of accumulated other comprehensive income (loss).
The Company’s foreign currency transaction gains and losses are included in selling, general and administrative in the accompanying consolidated statements of operations and comprehensive income (loss).
Share-Based Compensation Expense
The Company determines the expense for all employee share-based compensation awards by estimating their fair value and recognizing that value as an expense, on a ratable basis, in the consolidated financial statements over the requisite service period in which the employees earn the awards. The Company uses the Black-Scholes-Merton option pricing model to determine the grant date fair value of options.
To determine the fair value of a share-based award using the Black-Scholes-Merton option pricing model, the Company makes assumptions regarding the risk-free interest rate, expected future volatility, expected life of the award, and expected forfeitures of the awards. These inputs are subjective and generally require significant analysis and judgment to develop. The Company aggregates all employees into one pool based on the grant date for valuation purposes. The risk-free rate is based on the U.S. treasury yield curve in effect at the time of grant. The Company estimates the expected volatility of the share price by reviewing the historical volatility levels of its common stock in conjunction with that of public companies that operate in similar industries or are similar in terms of stage of development or size and then projecting this information toward its future expected volatility. The Company exercises judgment in selecting these companies, as well as in evaluating the available historical
F-21
Table of Contents
Accretive Health, Inc.
Notes to Consolidated Financial Statements – (Continued)
and implied volatility for these companies. The Company calculates the expected term in years for each stock option using a simplified method based on the average of each option’s vesting term and original contractual term. The Company applies an estimated forfeiture rate derived from its historical data and estimates of the likely future actions of option holders when recognizing the share-based compensation expense of the options.
The Company recognizes compensation expense, net of forfeitures, using a straight-line method over the applicable vesting period. During each quarter, the share-based compensation expense is adjusted to reflect all expense for options that vested during the period.
The Company accounts for stock options issued to non-employees based on their estimated fair value determined using the Black-Scholes-Merton option pricing model. The stock options issued to non-employees vest over the arrangement period. The fair value of the equity awards granted to non-employees is remeasured on each balance sheet date until the awards vest, and the related expense is adjusted based on the resulting changes in fair value, if any. The non-employee share-based compensation expense is recognized over the performance period which is the vesting period. Upon vesting, the performance of the non-employee is deemed complete and the vested awards are not remeasured subsequently.
The fair value of modifications to share-based awards is generally estimated using the Black-Scholes-Merton option pricing model. If a share-based compensation award is modified after the grant date, incremental compensation expense is recognized in an amount equal to the excess of the fair value of the modified award over the fair value of the original award immediately before the modification. Incremental compensation expense for vested awards is recognized immediately. For unvested awards, the sum of the incremental compensation expense and the remaining unrecognized compensation expense for the original award on the modification date is recognized over the modified service period.
Treasury Stock
The Company records treasury stock at the cost to acquire such shares and includes treasury stock as a component of stockholders’ equity (deficit).
Earnings (Loss) Per Share
Basic net income (loss) per common share is computed by dividing net income (loss) by the weighted average number of common shares outstanding during the period. The diluted net income (loss) per common share computation includes the effect, if any, of common shares that would be issuable upon the exercise of outstanding stock options, unvested restricted stock, reduced by the number of common shares which are assumed to be purchased by the Company with the resulting proceeds from the exercise of stock options, at the average market price during the year, when such amounts are dilutive to the net income (loss) per share calculation.
Recently Adopted Accounting Standards and Disclosures
From time to time, new accounting pronouncements are issued by the FASB or other standard setting bodies. Unless otherwise discussed, the Company’s management believes that the impact of recently issued accounting pronouncements that are not yet effective will not have a material impact on the Company’s consolidated financial position or results of operations upon adoption.
In May 2011, the FASB issued Accounting Standards Update (“ASU”) 2011-04, Fair Value Measurement (Topic 820): Amendments to Achieve Common Fair Value Measurement and Disclosure Requirements in U.S.
F-22
Table of Contents
Accretive Health, Inc.
Notes to Consolidated Financial Statements – (Continued)
GAAP and IFRSs. The new standard does not extend the use of fair value but, rather, provides guidance about how fair value should be applied where it is already required or permitted under International Financial Reporting Standards (“IFRS”) or GAAP. For GAAP, most of the changes are clarifications of existing guidance or wording changes to align with IFRS. The ASU also requires additional disclosures for nonpublic entities to provide quantitative information about significant unobservable inputs used for all Level 3 measurements and a description of the valuation process used. The provisions of the ASU are effective for annual or interim reporting periods beginning after December 15, 2011. The Company adopted the provisions of the ASU in 2012. The adoption of ASU 2011-04 did not have an impact on the Company’s consolidated financial statements.
In June 2011, the FASB issued ASU 2011-05, Presentation of Comprehensive Income (Topic 220), and ASU 2011-12, Deferral of the Effective Date for Amendment to the Presentation of Reclassifications of Items Out of Accumulated Other Comprehensive Income in ASU 2011-05, which amended guidance for the presentation of comprehensive income. The amended guidance requires an entity to present components of net income and other comprehensive income in one continuous statement, referred to as the statement of comprehensive income, or in two separate, but consecutive statements. The prior option to report other comprehensive income and its components in the statement of stockholders’ equity has been eliminated. Although the new guidance changes the presentation of comprehensive income, there are no changes to the components that are recognized in net income or other comprehensive income under existing guidance. These ASUs are effective for interim annual reporting periods beginning after December 15, 2011 and retrospective application is required. The Company adopted the provisions of these ASUs in 2012. The adoption of these ASUs changed the Company’s financial statement presentation of comprehensive income (loss), but did not have an impact on net income, financial position, or cash flows.
In September 2011, the FASB issued ASU 2011-08, Testing Goodwill for Impairment (Topic 350), which provides an entity the option to perform a qualitative assessment to determine whether it is more-likely-than-not that the fair value of a reporting unit is less than its carrying amount prior to performing the two-step goodwill impairment test. If this is the case, the two-step goodwill impairment test is required. If it is more-likely-than-not that the fair value of a reporting unit is greater than its carrying amount, the two-step goodwill impairment test is not required.
If the two-step goodwill impairment test is required, first, the fair value of the reporting unit is compared with its carrying amount (including goodwill). If the fair value of the reporting unit is less than its carrying amount, an indication of goodwill impairment exists for the reporting unit and the entity must perform step two of the impairment test (measurement). Under step two, an impairment loss is recognized for any excess of the carrying amount of the reporting unit’s goodwill over the implied fair value of that goodwill. The implied fair value of goodwill is determined by allocating the fair value of the reporting unit in a manner similar to a purchase price allocation and the residual fair value after this allocation is the implied fair value of the reporting unit goodwill. Fair value of the reporting unit is determined using a discounted cash flow analysis. If the fair value of the reporting unit exceeds its carrying amount, step two does not need to be performed. The Company adopted provisions of this ASU in 2012. The adoption of the ASU did not have a material effect on the Company’s consolidated financial statements.
In February 2013, the FASB issued ASU 2013-02, Comprehensive Income (Topic 220): Reporting of Amounts Reclassified Out of Accumulated Other Comprehensive Income. ASU 2013-02 requires reporting entities to provide information about the amounts reclassified from accumulated other comprehensive income by component. In addition, reporting entities are required to present, either on the face of the statement of income and comprehensive income or in the footnotes to the financial statements, significant amounts reclassified from accumulated other comprehensive income by statements of income and comprehensive income line item. This ASU does not change current requirements for reporting net income or other comprehensive income in financial
F-23
Table of Contents
Accretive Health, Inc.
Notes to Consolidated Financial Statements – (Continued)
statements. ASU 2013-02 is effective for fiscal years, and interim periods within those years, beginning on or after December 15, 2012. The Company adopted the provisions of the ASU in 2013. The adoption of the ASU did not have an impact on the Company’s consolidated financial statements.
Newly Issued Accounting Standards and Disclosures
In July 2013, the FASB issued ASU 2013-11, Presentation of an Unrecognized Tax Benefit When a Net Operating Loss Carryforward, a Similar Tax Loss, or a Tax Credit Carryforward Exists. ASU 2013-11 provides guidance for presentation of an unrecognized tax benefit, or a portion of an unrecognized tax benefit. ASU 2013-11 provides that a benefit should be presented in the financial statements as a reduction to a deferred tax asset for a net operating loss carryforward, a similar tax loss, or a tax credit carryforward, except as follows. To the extent a net operating loss carryforward, a similar tax loss, or a tax credit carryforward is not available at the reporting date under the tax law of the applicable jurisdiction to settle any additional income taxes that would result from the disallowance of a tax position or the tax law of the applicable jurisdiction does not require the entity to use, and the entity does not intend to use, the deferred tax asset for such purpose, the unrecognized tax benefit should be presented in the financial statements as a liability and should not be combined with deferred tax assets. ASU 2013-11 is effective for fiscal years and interim periods within those years, beginning on or after December 15, 2013, and will be effective for the Company’s fiscal year beginning January 1, 2014. The Company does not believe that the adoption of ASU 2013-11 will have a significant impact on its consolidated financial statements.
In May 2014, the FASB issued ASU No. 2014-09, Revenue from Contracts with Customers (Topic 606), which supersedes the revenue recognition requirements in ASC 605, Revenue Recognition. This ASU is based on the principle that revenue is recognized to depict the transfer of goods or services to customers in an amount that reflects the consideration to which the entity expects to be entitled in exchange for those goods or services. The ASU also requires additional disclosure about the nature, amount, timing and uncertainty of revenue and cash flows arising from customer contracts, including significant judgments and changes in judgments and assets recognized from costs incurred to obtain or fulfill a contract. This pronouncement is effective for annual reporting periods beginning after December 15, 2016, including interim periods within that reporting period and is to be applied using one of two retrospective application methods, with early application not permitted. The Company has not yet determined the potential effects of the new standard on the consolidated financial statements, if any.
Note 4. Property, Equipment, and Software
Property, equipment, and software consist of the following (in thousands):
| December 31, | ||||||||||||
| 2013 | 2012 | 2011 | ||||||||||
| As restated | ||||||||||||
| Computer and other equipment |
$ | 16,630 | $ | 15,349 | $ | 9,593 | ||||||
| Leasehold improvements |
13,346 | 13,457 | 9,876 | |||||||||
| Software |
9,589 | 9,062 | 8,258 | |||||||||
| Office furniture |
3,258 | 3,318 | 2,978 | |||||||||
|
|
|
|
|
|
|
|||||||
| Property and equipment and software, gross |
42,823 | 41,186 | 30,705 | |||||||||
| Less accumulated depreciation and amortization |
(26,548 | ) | (19,832 | ) | (13,536 | ) | ||||||
|
|
|
|
|
|
|
|||||||
| Property and equipment and software, net |
$ | 16,275 | $ | 21,354 | $ | 17,169 | ||||||
|
|
|
|
|
|
|
|||||||
F-24
Table of Contents
Accretive Health, Inc.
Notes to Consolidated Financial Statements – (Continued)
The following table summarizes the allocation of depreciation and amortization expense between cost of services and selling, general and administrative expenses (in thousands):
| For the year ended December 31, | ||||||||||||
| 2013 | 2012 | 2011 | ||||||||||
| As restated | ||||||||||||
| Cost of services |
$ | 4,697 | $ | 3,957 | $ | 2,269 | ||||||
| Selling, general and administrative |
2,126 | 2,398 | 2,593 | |||||||||
|
|
|
|
|
|
|
|||||||
| Total depreciation and amortization |
$ | 6,823 | $ | 6,355 | $ | 4,862 | ||||||
|
|
|
|
|
|
|
|||||||
Note 5. Stockholders’ Equity (Deficit)
Preferred Stock
The Company has 5,000,000 shares of authorized preferred stock with a par value of $0.01 each. The preferred stock may be issued from time to time in one or more series. The board of directors is authorized to determine the rights, preferences, privileges and restrictions of the Company’s authorized but unissued shares of preferred stock. As of December 31, 2013, 2012 and 2011, the Company does not have any shares of preferred stock outstanding.
Common Stock
Each outstanding share of common stock is entitled to one vote per share on all matters submitted to a vote by shareholders. Subject to the rights of any preferred stock which may from time to time be outstanding, the holders of outstanding shares of common stock are entitled to receive dividends and, upon liquidation or dissolution, are entitled to receive pro rata all assets legally available for distribution to stockholders. No dividends were declared or paid on the common stock during 2013, 2012 or 2011. In March 2011, the Company completed a public offering in which 7,475,000 shares of common stock were sold by certain selling stockholders at an offering price of $23.50 per share. The Company did not sell any securities nor did it receive any of the proceeds from the sale of the shares. The offering generated gross proceeds to the selling stockholders of $175.7 million, or $167.8 million net of underwriting discounts. The Company incurred approximately $1.0 million of expenses related to this offering, which is included in selling, general and administrative expenses in the 2011 consolidated statement of operations and comprehensive income (loss).
Treasury Stock
In September 2012, the board of directors authorized a share repurchase plan allowing the Company to repurchase up to $50 million of its outstanding shares of common stock. For the year ended December 31, 2012, the Company repurchased 4,307,362 shares of its common stock under this share repurchase plan at an average price of $11.61 per share for a total of $50 million; this amount was recorded as a reduction of stockholders’ equity (deficit). As of December 31, 2012, the share repurchase plan was concluded.
On November 13, 2013, the Company’s board of directors authorized another repurchase of up to $50.0 million of the Company’s common stock in the open market or in privately negotiated transactions following the Restatement. The timing and amount of any shares repurchased will be determined by the Company based on its evaluation of market conditions and other factors. The repurchase program may be suspended or discontinued at any time at the sole discretion of the board of directors. Any repurchased shares will be available for use in connection with the Company’s stock plans and for other corporate purposes. The Company currently intends to fund the repurchases from cash on hand. No shares of common stock had been repurchased under this plan as of the date at which these consolidated financial statements were issued.
F-25
Table of Contents
Accretive Health, Inc.
Notes to Consolidated Financial Statements – (Continued)
Treasury stock also includes repurchases of Company stock related to employees’ tax withholding upon vesting of restricted shares. See Note 6, Share-Based Compensation.
Note 6. Share-Based Compensation
The Company maintains two stock incentive plans: the 2006 Amended and Restated Stock Option Plan (the “2006 Plan”) and the 2010 Stock Incentive Plan (the “2010 Plan” and, together with the 2006 Plan, the “Plans”). Under the 2010 Plan the Company could issue (up to a maximum of 24,374,756 shares) any shares that remained available for issuance under the 2006 Plan as of the date of the IPO and any shares subject to awards that were outstanding under the 2006 Plan as of the date of the IPO that expire, terminate or are otherwise surrendered, cancelled, forfeited or repurchased by the Company without the issuance of shares thereunder. The Company will not make any further grants under the 2006 Plan. The 2010 Plan provides for the grant of incentive stock options, non-statutory stock options, Restricted Stock Awards, or “RSAs,” and other share-based awards. As of December 31, 2013, an aggregate of 15,944,775 shares were outstanding as either options or RSAs under the Plans, and 2,883,113 shares were available for future grants of awards under the 2010 Plan. To the extent that previously granted awards under the 2006 Plan or 2010 Plan expire, terminate or are otherwise surrendered, cancelled, forfeited or repurchased by the Company, the number of shares available for future awards under the 2010 Plan will increase.
Under the terms of both plans, all awards will expire if they are not exercised within ten years of their grant date. Substantially all employee options and RSAs vest over four years at a rate of 25% per year on each grant date anniversary. Substantially all non-employee options vest over either one year or four years (at a rate of 25% per year). Options granted under the 2006 Plan could be exercised immediately upon grant, but upon exercise the shares issued were subject to the same vesting and repurchase provisions that applied before the exercise. There were no such exercises during the years ended December 31, 2013, 2012 and 2011. Options granted under the 2010 Plan cannot be exercised prior to vesting.
In 2013, the Company granted non-qualified options to purchase 4,703,801 shares of common stock and awarded 400,000 shares of restricted stock to key employees pursuant to NYSE inducement grant rules, of which all of the stock options and 349,996 of the shares of restricted stock were outstanding as of December 31, 2013.
The Company uses the Black-Scholes-Merton option pricing model to estimate the fair value of each option as of its grant date. The following table sets forth the significant assumptions used in the Black-Scholes-Merton option pricing model and the calculation of share-based compensation cost during 2013, 2012 and 2011:
| Year Ended December 31, | ||||||||||||
| 2013 | 2012 | 2011 | ||||||||||
| Expected dividend yield |
— | — | — | |||||||||
| Risk-free interest rate |
0.9% to 2.1 | % | 0.8% to 1.4 | % | 1.2% to 2.7 | % | ||||||
| Expected volatility |
50 | % | 50 | % | 50 | % | ||||||
| Expected term (in years) |
5.82-8.82 | 6.25 | 6.25 | |||||||||
| Forfeitures |
5.68% annually | 4.42% annually | 4.25% annually | |||||||||
F-26
Table of Contents
Accretive Health, Inc.
Notes to Consolidated Financial Statements – (Continued)
Total share-based compensation costs that have been included in the Company’s consolidated statements of operations were as follows (in thousands):
| Year ended December 31, | ||||||||||||
| 2013 | 2012 | 2011 | ||||||||||
| As restated | ||||||||||||
| Share-Based Compensation Expense Allocation Details: |
||||||||||||
| Cost of services |
$ | 10,740 | $ | 11,625 | $ | 13,119 | ||||||
| Selling, general and administrative |
13,061 | 13,673 | 12,067 | |||||||||
| Restatement and other costs |
1,224 | — | — | |||||||||
|
|
|
|
|
|
|
|||||||
| Total share-based compensation expense |
$ | 25,025 | $ | 25,298 | $ | 25,186 | ||||||
|
|
|
|
|
|
|
|||||||
There was $43.3 million, $53.5 million, and $62.9 million of total, unrecognized share-based compensation expense related to stock options and RSAs granted under the plans, which the Company expects to recognize over a weighted-average period of 2.84, 2.7 and 2.7 years as of December 31, 2013, 2012, and 2011, respectively. Refer to the consolidated statements of stockholders’ equity (deficit) for the tax benefits realized for the tax deductions from stock option exercises.
Stock options
The following table sets forth a summary of all employee and non-employee option activity under all plans and inducement grants for the years ended December 31, 2013, 2012, and 2011:
| Shares | Weighted- Average Exercise Price |
Weighted- Average Remaining Contractual Term (in years) |
Aggregate Intrinsic Value (in thousands) |
|||||||||||||
| Outstanding at January 1, 2011 |
15,749,404 | $ | 9.45 | 7.5 | $ | 107,120 | ||||||||||
| Granted |
4,438,261 | 26.19 | ||||||||||||||
| Exercised |
(3,668,257 | ) | 4.95 | |||||||||||||
| Cancelled |
(32,927 | ) | 12.79 | |||||||||||||
| Forfeited |
(1,123,732 | ) | 14.87 | |||||||||||||
|
|
|
|||||||||||||||
| Outstanding at December 31, 2011 |
15,362,749 | 14.96 | 7.7 | 138,632 | ||||||||||||
| Granted |
6,470,949 | 12.49 | ||||||||||||||
| Exercised |
(1,256,377 | ) | 5.89 | |||||||||||||
| Cancelled |
(546,100 | ) | 15.31 | |||||||||||||
| Forfeited |
(2,324,082 | ) | 21.11 | |||||||||||||
|
|
|
|||||||||||||||
| Outstanding at December 31, 2012 |
17,707,139 | 13.88 | 7.6 | 25,957 | ||||||||||||
| Granted |
8,345,437 | 10.09 | ||||||||||||||
| Exercised |
(9,400 | ) | 4.34 | |||||||||||||
| Cancelled |
(1,057,052 | ) | 17.60 | |||||||||||||
| Forfeited |
(4,445,851 | ) | 15.64 | |||||||||||||
|
|
|
|||||||||||||||
| Outstanding at December 31, 2013 |
20,540,273 | 11.77 | 7.4 | 15,673 | ||||||||||||
|
|
|
|
|
|
|
|
|
|||||||||
| Outstanding, vested and exercisable at December 31, 2011 |
5,785,383 | $ | 7.75 | 6.1 | $ | 88,273 | ||||||||||
|
|
|
|
|
|
|
|
|
|||||||||
| Outstanding, vested and exercisable at December 31, 2012 |
6,915,086 | $ | 11.47 | 6.0 | $ | 20,761 | ||||||||||
|
|
|
|
|
|
|
|
|
|||||||||
| Outstanding, vested and exercisable at December 31, 2013 |
9,605,505 | $ | 11.89 | 5.9 | $ | 15,096 | ||||||||||
|
|
|
|
|
|
|
|
|
|||||||||
F-27
Table of Contents
Accretive Health, Inc.
Notes to Consolidated Financial Statements – (Continued)
The weighted-average grant date fair value of options granted in the years ended December 31, 2013, 2012, and 2011 was $5.19, $6.05 and $13.10 per share, respectively. The total intrinsic value of the options exercised in the years ended December 31, 2013, 2012, and 2011 was $0.1 million, $15.4 million, and $71.6 million, respectively. The total fair value of options vested in the years ended December 31, 2013, 2012, and 2011 was $27.1 million, $25.4 million and $19.2 million, respectively.
Stock option activity for non-employee consultants
Included in the table and disclosures above are options to purchase 265,517, 403,712, and 306,266 shares held by non-employees as of December 31, 2013, 2012 and 2011, respectively. These options had a weighted average exercise price of $20.05, $21.88, and $25.05 at December 31, 2013, 2012 and 2011, respectively.
Restricted stock awards
In the third quarter of 2011, the Company began to grant RSAs to its employees. A summary of the activity during the years ended December 31, 2013, 2012, and 2011 is shown below:
| Shares | Weighted- Average Grant Date Fair Value |
Weighted- Average Remaining Contractual Term (in years) |
||||||||||
| Outstanding at January 1, 2011 |
— | $ | — | — | ||||||||
| Granted |
239,254 | 26.34 | ||||||||||
| Vested |
(47,315 | ) | 27.20 | |||||||||
| Forfeited |
(32,859 | ) | 27.20 | |||||||||
|
|
|
|||||||||||
| Outstanding and Unvested at December 31, 2011 |
159,080 | 25.90 | 9.7 | |||||||||
| Granted |
50,000 | 11.16 | ||||||||||
| Vested |
(48,860 | ) | 26.14 | |||||||||
| Forfeited |
— | — | ||||||||||
|
|
|
|||||||||||
| Outstanding and Unvested at December 31, 2012 |
160,220 | $ | 21.23 | 9.0 | ||||||||
| Granted |
508,303 | 11.46 | ||||||||||
| Vested |
(50,004 | ) | 11.47 | |||||||||
| Forfeited |
(160,220 | ) | 21.23 | |||||||||
|
|
|
|||||||||||
| Outstanding and Unvested at December 31, 2013 |
458,299 | $ | 11.45 | 9.4 | ||||||||
|
|
|
|||||||||||
The total fair value of RSAs vested in the years ended December 31, 2013, 2012 and 2011 was $0.6 million, $1.3 million and $1.2 million, respectively. The Company’s RSA agreements allow employees to deliver to the Company shares of stock upon vesting of their RSAs in lieu of their payment of the required personal employment-related taxes. The Company does not withhold taxes in excess of minimum required statutory requirements. During the years ended December 31, 2013, 2012 and 2011, employees delivered to the Company 16,623, 15,321 and 14,804 shares of stock, respectively, which the Company recorded at a cost of approximately $0.2 million, $0.2 million and $0.4 million, respectively. As of December 31, 2013, the Company held 46,748 shares of surrendered common stock in treasury related to the vesting of RSAs.
Forfeited and cancelled RSAs are added to treasury stock. For the year ended December 31, 2013,160,220 shares were added to treasury stock. No shares were cancelled for the years ended December 31, 2012 and 2011.
F-28
Table of Contents
Accretive Health, Inc.
Notes to Consolidated Financial Statements – (Continued)
Modifications of share-based awards
During 2013, the Company modified the terms of share-based awards held by 19 employees in connection with the 2013 restructuring plan described in Note 8. These modifications allowed for the extension of the exercise period for vested options from 60 days following each affected employee’s respective termination date to 60 days following the filing of the Company’s 2013 consolidated financial statements with the SEC, resulting in a net increase in share-based compensation expense of $1.2 million for the year ended December 31, 2013.
Additionally, during the second quarter of 2013, the Company modified the terms of an award granted to the former CEO in connection with her transition to the role of the Chairman of the Board of Directors of the Company. This modification allowed for the extension of the exercise period for options vested as of the date of the modification from 60 days following the termination of employment to the expiration of the original award (ten years from the grant date). This modification resulted in a net increase in share-based compensation expense of $1.5 million for the year ended December 31, 2013.
Note 7. Retirement Plan
The Company maintains a 401(k) retirement plan that is intended to be a tax-qualified defined contribution plan under Section 401(k) of the Internal Revenue Code. In general, all employees are eligible to participate. The 401(k) plan includes a salary deferral arrangement pursuant to which participants may elect to reduce their current compensation by up to the statutorily prescribed limit, equal to $17,500, $17,000 and $16,500 in 2013, 2012 and 2011, respectively, and have the amount of the reduction contributed to the 401(k) plan. The Company currently matches employee contributions up to 50% of the first 3% of base compensation that a participant contributes to the 401(k) plan. In 2013, 2012 and 2011, employees who were directors, vice presidents, or higher levels were excluded from the matching contribution feature of the plan. For the years ended December 31, 2013, 2012, and 2011, total Company contributions to the plan were $0.6 million, $0.6 million, and $0.4 million, respectively.
Note 8. Restatement and other costs
Restatement
In 2013, the Company incurred $23.1 million in restatement costs. These legal, accounting and consulting costs were incurred to complete the Annual Report on Form 10-K for the years ended December 31, 2013, 2012 and 2011. In 2013 and 2012, the Company incurred cost for litigation, primarily related to the Minnesota Lawsuit, of $3.3 million and $3.7 million, respectively. In 2013 the Company accrued $2.3 million for litigation settlement to shareholders of SDI.
Reorganization
In fiscal year 2013, the Company committed to a plan to reorganize its workforce in selected corporate, administrative and management functions to better serve its customers (as previously described in a Form 8-K dated June 20, 2013). The plan anticipated two separate staff reduction events, in June 2013 and December 2013. Pursuant to the plan, the Company incurred $3.9 million for severance and other costs during the year ended December 31, 2013. In addition, the Company incurred $1.2 million non-cash expense related to share based compensation for modification of existing option agreements for affected employees.
F-29
Table of Contents
Accretive Health, Inc.
Notes to Consolidated Financial Statements – (Continued)
The Company’s reorganization activity was as follows:
| December 31, 2013 |
||||
| Reorganization liability, beginning of period |
$ | — | ||
| Accrued severance & other costs |
3,949 | |||
| Payments |
(2,806 | ) | ||
|
|
|
|||
| Reorganization liability, end of period |
$ | 1,143 | ||
|
|
|
|||
| Reorganization expense consisted of the following at December 31, 2013: |
||||
| Severance & other costs |
$ | 3,949 | ||
| Share-based compensation costs |
1,224 | |||
|
|
|
|||
| Total |
$ | 5,173 | ||
|
|
|
|||
Note 9. Income Taxes
The domestic and foreign components of income (loss) before income taxes consist of the following (in thousands):
| Year ended December 31, | ||||||||||||
| 2013 | 2012 | 2011 | ||||||||||
| As restated | ||||||||||||
| Domestic |
$ | 202,222 | $ | (189,791 | ) | $ | (121,337 | ) | ||||
| Foreign |
2,210 | 2,056 | 1,346 | |||||||||
|
|
|
|
|
|
|
|||||||
| Total income (loss) before income taxes |
$ | 204,432 | $ | (187,735 | ) | $ | (119,991 | ) | ||||
|
|
|
|
|
|
|
|||||||
For the years ended December 31, 2013, 2012, and 2011, the Company’s current and deferred income tax expense (benefit) attributable to income (loss) from operations are as follows (in thousands):
| Current | Deferred | Total | ||||||||||
| Year end December 31, 2011 — As Restated |
||||||||||||
| U.S. Federal |
$ | 22,686 | $ | (65,219 | ) | $ | (42,533 | ) | ||||
| State & Local |
3,448 | (9,317 | ) | (5,869 | ) | |||||||
| Foreign |
169 | (13 | ) | 156 | ||||||||
|
|
|
|
|
|
|
|||||||
| $ | 26,303 | $ | (74,549 | ) | $ | (48,246 | ) | |||||
|
|
|
|
|
|
|
|||||||
| Year end December 31, 2012 |
||||||||||||
| U.S. Federal |
$ | 6,924 | $ | (72,244 | ) | $ | (65,320 | ) | ||||
| State & Local |
1,717 | (4,666 | ) | (2,949 | ) | |||||||
| Foreign |
247 | 27 | 274 | |||||||||
|
|
|
|
|
|
|
|||||||
| $ | 8,888 | $ | (76,883 | ) | (67,995 | ) | ||||||
|
|
|
|
|
|
|
|||||||
| Year end December 31, 2013 |
||||||||||||
| U.S. Federal |
$ | (5,060 | ) | $ | 75,737 | $ | 70,677 | |||||
| State & Local |
(330 | ) | 3,635 | 3,305 | ||||||||
| Foreign |
367 | — | 367 | |||||||||
|
|
|
|
|
|
|
|||||||
| $ | (5,023 | ) | $ | 79,372 | $ | 74,349 | ||||||
|
|
|
|
|
|
|
|||||||
F-30
Table of Contents
Accretive Health, Inc.
Notes to Consolidated Financial Statements – (Continued)
Reconciliation of the difference between the actual tax rate and the statutory U.S. federal income tax rate is as follows:
| Year ended December 31, | ||||||||||||
| 2013 | 2012 | 2011 | ||||||||||
| As restated | ||||||||||||
| Federal statutory tax rate |
35 | % | 35 | % | 35 | % | ||||||
| Increase in income tax rate resulting from: |
||||||||||||
| State and local income taxes, net of federal tax benefits |
1 | % | 1 | % | 5 | % | ||||||
|
|
|
|
|
|
|
|||||||
| Actual tax rate |
36 | % | 36 | % | 40 | % | ||||||
|
|
|
|
|
|
|
|||||||
The following table sets forth the Company’s net deferred tax assets as of December 31, 2013, 2012 and 2011 (in thousands):
| As of December 31, | ||||||||||||
| 2013 | 2012 | 2011 | ||||||||||
| As restated | ||||||||||||
| Deferred Tax assets: |
||||||||||||
| Other |
462 | 438 | 581 | |||||||||
| Stock warrants |
154 | 177 | 207 | |||||||||
| Charitable contributions |
225 | — | — | |||||||||
| R&D credit |
665 | — | 288 | |||||||||
| Net operating loss carryforwards |
5,295 | 277 | 187 | |||||||||
| Accrued bonus |
3,269 | 268 | 2,178 | |||||||||
| Employee share-based compensation |
27,257 | 20,969 | 15,235 | |||||||||
| Deferred customer billings |
181,932 | 280,343 | 210,348 | |||||||||
|
|
|
|
|
|
|
|||||||
| Total gross deferred tax assets |
219,259 | 302,472 | 229,024 | |||||||||
| Less valuation allowance |
(268 | ) | (172 | ) | (174 | ) | ||||||
|
|
|
|
|
|
|
|||||||
| Net deferred tax assets |
218,991 | 302,300 | 228,850 | |||||||||
| Deferred tax liabilities: |
||||||||||||
| Goodwill and fixed assets |
(983 | ) | (1,205 | ) | (2,717 | ) | ||||||
|
|
|
|
|
|
|
|||||||
| Total deferred tax liability |
(983 | ) | (1,205 | ) | (2,717 | ) | ||||||
|
|
|
|
|
|
|
|||||||
| Net deferred tax asset |
$ | 218,008 | $ | 301,095 | $ | 226,133 | ||||||
|
|
|
|
|
|
|
|||||||
At December 31, 2013, the Company has cumulative U.S. federal net operating loss carryforwards of approximately $11.7 million which are available to offset U.S. federal taxable income in future periods through 2033.
At December 31, 2013, the Company has cumulative state net operating carryforwards of approximately $26.0 million which are available to offset state taxable income in future periods through 2033. A valuation allowance is required to be established when, based on currently available information, it is more likely than not that all or a portion of a deferred tax asset will not be realized. The guidance on accounting for income taxes provides important factors in determining whether a deferred tax asset will be realized, including whether there has been sufficient taxable income in recent years and whether sufficient income can reasonably be expected in future years in order to utilize the deferred tax asset.
Consideration is given to the weight of all available evidence, both positive and negative. Generally, a cumulative loss in recent years is negative evidence in determining the need for a deferred tax asset valuation allowance. However, the recent cumulative losses in book income are primarily the result of a delay in revenue
F-31
Table of Contents
Accretive Health, Inc.
Notes to Consolidated Financial Statements – (Continued)
recognition on contracts that have been in place for a number of years. Under the Restatement, revenue is being deferred by the Company until a future event occurs and the revenue becomes fixed, per the terms of each contract. The Company believes that the deferred revenue from contracts that the Company has previously entered into will be recognized in the future. The majority of the deferred revenue amounts have already been reported on income tax returns filed in accordance with a previously established and approved method of accounting for federal and state income tax reporting. The significant positive evidence related to the projected realization of the deferred customer billings from existing contracts and projected taxable income outweighs the negative evidence from the cumulative losses incurred in recent years based on the Restatement. Accordingly, the Company believes that it is more likely than not that the remaining deferred tax assets will be realized.
The Company has recorded valuation allowances at December 31, 2013, 2012, and 2011, of $0.3 million, $0.2 million, and $0.2 million, respectively, based on our assessment that it is more likely than not that a portion of the Company’s separate state income tax net operating loss will not be realized.
The Company has not recognized a deferred tax liability for the undistributed earnings of its foreign subsidiaries that arose in 2013, 2012, or 2011 because the Company considers these earnings to be indefinitely reinvested outside of the United States. As of December 31, 2013, 2012, and 2011, the undistributed earnings of these subsidiaries were $5.0 million, $3.8 million, and $2.3 million respectively. It is not practicable to estimate the amount of recognized deferred tax liabilities, if any, for these undistributed foreign earnings.
The 2013, 2012 and 2011 current tax provision includes $0.4 million, $0.3 million, and $0.2 million, respectively, for income taxes arising from the pre-tax income of the Company’s India subsidiaries. The tax provisions are net of the impact of a tax holiday in India. The Company’s benefits from this tax holiday were approximately $0.4 million, for each of the years ended December 31, 2013, 2012, and 2011. The majority of these benefits are set to expire after the year ending December 31, 2018.
The Company recognizes the tax benefit from an uncertain tax position only if it is more likely than not that the tax position will be sustained on examination by taxing authorities, based on the technical merits of the position. The tax benefits recognized in the financial statements from such a position are measured based on the largest benefit that has a greater than fifty percent likelihood of being realized upon ultimate settlement. The Company’s unrecognized tax benefits as of December 31, 2013, 2012 and 2011 totaled $1.3 million, $2.4 million and $2.3 million, respectively. The following table summarizes the activity related to the unrecognized tax benefits (in thousands):
| Tax Benefit | ||||
| Unrecognized tax benefits as of January 1, 2011 (As restated) |
$ | 2,087 | ||
| Increases in positions taken in a current period |
236 | |||
| Increases in positions taken in prior period |
— | |||
| Decreases due to lapse of statute of limitations |
(10 | ) | ||
|
|
|
|||
| Unrecognized tax benefits as of December 31, 2011 (As restated) |
2,313 | |||
| Increases in positions taken in a current period |
67 | |||
| Increases in positions taken in prior period |
31 | |||
| Decreases due to lapse of statute of limitations |
— | |||
|
|
|
|||
| Unrecognized tax benefits as of December 31, 2012 |
2,411 | |||
| Increases in positions taken in a current period |
67 | |||
| Decreases in positions taken in prior period |
— | |||
| Decreases due to lapse of statute of limitations |
(1,176 | ) | ||
|
|
|
|||
| Unrecognized tax benefits as of December 31, 2013 |
$ | 1,302 | ||
|
|
|
|||
F-32
Table of Contents
Accretive Health, Inc.
Notes to Consolidated Financial Statements – (Continued)
As of December 31, 2013, approximately $1.3 million of the total gross unrecognized tax benefits represented the amount that, if recognized, would result in a reduction of the effective income tax rate in future periods.
The Company recognizes interest and penalties related to income tax matters as part of income tax expense. The Company recorded adjustments to interest and potential penalties related to these unrecognized tax benefits during 2013, and in total, as of December 31, 2013, the Company has recorded a liability for interest and potential penalties of $0.9 million. The Company anticipates changes to the reserves within the next 12 months to be primarily related to interest. The Company believes it has sufficient accruals for contingent tax liabilities.
In connection with tax return examinations, contingencies can arise that generally result from different interpretations of tax laws and regulations as they pertain to the amount, timing or inclusion of revenues and expenses in taxable income, or the ability to utilize tax credits to reduce income taxes payable. While it is probable, based on the potential outcome of the Company’s Federal and State tax examinations or the expiration of the statute of limitations for specific jurisdictions, that the liability for unrecognized tax benefits may increase or decrease within the next twelve months, the Company does not expect any such change would have a material effect on our financial condition, results of operations or cash flow.
The Company and its subsidiaries are subject to U.S. federal income tax as well as income tax of multiple state and foreign jurisdictions. U.S. federal income tax returns for 2012 and 2011 are currently open for examination. The 2013, 2012 and 2011 U.S. federal income tax return, are currently under examination. State jurisdictions vary for open tax years. The statute of limitations for most states ranges from 3 to 6 years. Local tax authorities have completed their income tax examinations of the Company’s subsidiary in India for fiscal years 2009 and 2010. The proposed adjustments in India have been appealed, and the Company believes the ultimate outcome of these appeals will not result in a material adjustment to its tax liability.
Pursuant to the acquisition of a business in May 2006, the sellers, certain of which are employees of the Company, are obligated to indemnify the Company for federal and state income taxes, including 50% of any interest and penalties incurred, related to periods up to and including the date of the acquisition. The potential amount due to the Company related to this indemnity was $1.3 million, $1.2 million and $1.2 million as of December 31, 2013, 2012 and 2011, respectively. The amount due from related party is secured by the fair value of shares and cost held by the Company in escrow. The cost and fair value of these shares was $1.0 million, $1.1 million and $1.9 million at December 31, 2013, 2012 and 2011, respectively. Given that the fair value of the shares was less than the amount due from related party in 2013, the Company recorded a reserve of $0.3 million to reflect the difference between the fair value of the shares and the receivable they securitize. No reserve was required at December 31, 2012 and 2011. The amounts due from related party in the consolidated balance sheets reflect the net realizable value of the receivable. The escrow agreement extends until June 15, 2015, unless a notice of deficiency is issued by the IRS. In such instance, the shares will be held in escrow until related tax matters are fully resolved.
F-33
Table of Contents
Accretive Health, Inc.
Notes to Consolidated Financial Statements – (Continued)
Note 10. Earnings (Loss) Per Share
Basic and diluted net income (loss) per common share are calculated as follows (in thousands, except share and per share data):
| Year ended December 31, | ||||||||||||
| 2013 | 2012 | 2011 | ||||||||||
| As restated | ||||||||||||
| Net income (loss) |
$ | 130,083 | $ | (119,740 | ) | $ | (71,745 | ) | ||||
|
|
|
|
|
|
|
|||||||
| Basic weighted-average common shares |
95,687,940 | 98,602,099 | 96,964,661 | |||||||||
| Add: Effect of dilutive securities |
1,157,724 | — | — | |||||||||
|
|
|
|
|
|
|
|||||||
| Diluted weighted-average common shares |
96,845,664 | 98,602,099 | 96,964,661 | |||||||||
|
|
|
|
|
|
|
|||||||
| Net income (loss) per common share (basic) |
$ | 1.36 | $ | (1.21 | ) | $ | (0.74 | ) | ||||
|
|
|
|
|
|
|
|||||||
| Net income (loss) per common share (diluted) |
$ | 1.34 | $ | (1.21 | ) | $ | (0.74 | ) | ||||
|
|
|
|
|
|
|
|||||||
Stock options totaling 18,450,699 were not included in the computation of diluted income per share for the year ended December 31, 2013 as the options were anti-dilutive. Due to the net loss, stock options and RSAs totaling 17,867,359 and 15,521,829 were not included in the computation of diluted income (loss) per share for the years ended December 31, 2012 and 2011, respectively. After December 31, 2013, the Company granted options to purchase an aggregate of 4,482,689 shares of its common stock and issued 2,365,000 shares of restricted stock.
Note 11. Commitments and Contingencies
Operating Leases
The Company rents office space and equipment under operating leases, primarily for its Chicago corporate office, U.S. shared services centers and India operations. Office space lease terms range from 2 to 12 years, whereas equipment lease terms range from 3 to 6 years. The Company’s leases contain various rent holidays and rent escalation clauses and entitlements for tenant improvement allowances. Lease payments are amortized to expense on a straight-line basis over the lease term. For a description of the Company’s leased properties refer to “Part I - Item 2 - Properties” of this Annual Report on Form 10-K.
Total rent expense under all operating leases was $3.8 million, $3.6 million and $2.9 million for the years ended December 31, 2013, 2012, and 2011, respectively.
The aggregate future minimum rental commitments under all noncancelable operating leases having remaining terms in excess of one year as of December 31, 2013 are as follows (in thousands):
| 2014 |
$ | 4,012 | ||
| 2015 |
4,258 | |||
| 2016 |
2,988 | |||
| 2017 |
3,697 | |||
| 2018 |
3,490 | |||
| Thereafter |
9,170 | |||
|
|
|
|||
| Total |
$ | 27,615 | ||
|
|
|
F-34
Table of Contents
Accretive Health, Inc.
Notes to Consolidated Financial Statements – (Continued)
Revolving Credit Facility
In September, 2011, the Company reduced its outstanding line of credit with the Bank of Montreal from $15 million to $3 million. The $3 million line of credit can only be utilized by the Company in the form of letters of credit and is secured by a $5 million demand deposit with the Bank of Montreal which is presented as restricted cash in the Company’s consolidated balance sheets. Any amounts outstanding under the line of credit accrue interest at the greater of (i) the bank-established prime commercial rate, (ii) a LIBOR plus 1% rate, (iii) or a rate that combines the characteristics of both. The line of credit has an initial term of three years and is renewable annually thereafter. As of December 31, 2013, 2012 and 2011, the Company had outstanding letters of credit of approximately $0.9 million, $1.8 million and $2.5 million, respectively.
Legal Proceedings
The Company is subject to various claims, other pending and possible legal actions for product liability and other damages, and other matters arising out of the conduct of the Company’s business. On a quarterly basis, the Company reviews the uninsured material legal claims against the Company. The Company accrues for the costs of such claims as appropriate and in the exercise of its judgment and experience. However, due to a lack of factual information available to the Company about a claim, or the procedural stage of a claim, it may not be possible for the Company to reasonably assess either the probability of a favorable or unfavorable outcome of the claim or to reasonably estimate the amount of loss should there be an unfavorable outcome. Therefore, for many of the claims, the Company cannot estimate a range of loss.
The Company believes, based on current knowledge and after consultation with counsel, that the outcome of such claims and actions will not have a material adverse effect on the Company’s results of operations or financial position. However, in the event of unexpected future developments, it is possible that the ultimate resolution of such matters, if unfavorable, could have a material adverse effect on the Company’s results of operations or financial position.
Other than as described below, the Company is not presently a party to any material litigation or regulatory proceeding and is not aware of any pending or threatened litigation or regulatory proceeding against the Company which, individually or in the aggregate, could have a material adverse effect on the business, operating results, financial condition or cash flows.
On January 19, 2012, the State of Minnesota, by its Attorney General, filed a complaint against the Company in the United States District Court for the District of Minnesota, alleging violations of federal and Minnesota state health privacy laws and regulations, Minnesota debt collection laws, and Minnesota consumer protection laws resulting from, among other things, the theft in Minnesota in July 2011 of an employee’s laptop that contained PHI. On January 25, 2012, the Commissioner of the Minnesota Department of Commerce served the Company an administrative subpoena seeking information and documents about its debt collection practices and the privacy of personal and health data within its possession or control. On February 3, 2012, the Company entered into a Consent Cease and Desist Order with the Commissioner, voluntarily agreeing to cease all debt collection activity in the State of Minnesota. As previously disclosed, on July 30, 2012, without any admission of liability or wrongdoing, the Company entered into a Settlement Agreement, Release and Order with the Minnesota Attorney General to settle the lawsuit filed by the Minnesota Attorney General and the investigation commenced by the Minnesota Department of Commerce and to resolve fully all disputes which in any way related to, arose out of, emanated from, or otherwise involved such lawsuit or investigation and all investigations by the Minnesota Attorney General, the Minnesota Department of Commerce, and the Minnesota Department of Human Services relating to the Company. As part of the settlement, the Company paid a monetary penalty of $2.5 million and voluntarily agreed to cease all remaining operations in Minnesota.
F-35
Table of Contents
Accretive Health, Inc.
Notes to Consolidated Financial Statements – (Continued)
On March 27, 2012, the FTC issued the Company a Civil Investigative Demand, to determine whether it may have violated Section 5 of the FTC Act, as it relates to deceptive or unfair acts or practices related to consumer privacy and/or data security, or the Fair Credit Reporting Act, or the FDCPA. Pursuant to the FTC’s demand, the FTC sought documents and responses that primarily concerned the collection, use, security, and privacy of personal and health data within its possession or control, statements to consumers about such data, the use of various forms of scoring, and policies and practices regarding collection of data. On December 31, 2013, without any admission of liability or wrongdoing, and without payment of any monetary penalty or fine, the Company entered into a Consent Order with the FTC to resolve its demand. Pursuant to the Consent Order, it agreed, among other things, to maintain a comprehensive information security program reasonably designed to protect the security, confidentiality, and integrity of personal information collected from or about consumers. The FTC gave final approval to the Consent Order on February 24, 2014.
On April 26, 2012 and May 1, 2012, the Company, along with certain of its former officers, was named as a defendant in two putative securities class action lawsuits filed in the U.S. District Court for the Northern District of Illinois, which were consolidated as Wong v. Accretive Health et al. The primary allegations are that the Company’s public statements, including filings with the SEC, were false and/or misleading about its violations of certain federal and Minnesota privacy and debt collection laws. On September 26, 2013, without any admission of liability or wrongdoing, the Company entered into a Settlement Agreement to resolve these suits for $14 million, which has been funded into escrow by its insurance carriers. On April 30, 2014, the U.S. District Court for the Northern District of Illinois granted final approval of the Settlement Agreement. A single objector to the Settlement Agreement appealed to the U.S. Court of Appeals for the Seventh Circuit, and on December 9, 2014, the court of appeals affirmed the district court’s approval of the settlement.
In addition, the Company along with certain of its directors and former officers has been named in several putative shareholder derivative lawsuits filed in the U.S. District Court for the Northern District of Illinois on May 3, 2012 and July 31, 2012 (consolidated as Maurras Trust v. Accretive Health et al.), in the Circuit Court of Cook County, Illinois on June 23, 2012 and 27, 2012 (consolidated as In re Accretive Health, Inc. Derivative Litigation) and in the Court of Chancery of the State of Delaware on November 5, 2012 (Doyle v. Tolan et al.). The primary allegations are that its directors and officers breached their fiduciary duties in connection with the alleged violations of certain federal and Minnesota privacy and debt collection laws.
On July 11, 2013, the Court of Chancery of the State of Delaware granted its motion to stay Doyle v. Tolan et al., in favor of the action pending in the U.S. District Court for the Northern District of Illinois. On September 24, 2013, the U.S. District Court for the Northern District of Illinois granted its motion to dismiss without prejudice, giving plaintiffs in that case leave to file an amended consolidated complaint, which plaintiffs filed on October 22, 2013, amending their complaint to also include allegations with respect to the Restatement. The Company believes that it has meritorious defenses in all of these cases and intend to vigorously defend itself and its directors and officers against these claims. The outcome of these matters is not presently determinable.
On June 12, 2012, the Illinois Department of Financial and Professional Regulation issued an administrative complaint seeking to impose reciprocal “sister state discipline” against the Company’s Illinois debt collection license based on the February 3, 2012 Consent Cease and Desist Order, with the Commissioner of the Minnesota Department of Commerce. On September 11, 2013, an administrative law judge dismissed the complaint without prejudice.
On May 17, 2013, the Company along with certain of its directors and former officers were named as a defendant in a putative securities class action lawsuit filed in the U.S. District Court for the Northern District of Illinois (Hughes v. Accretive Health, Inc. et al.). The primary allegations, relating to its March 8, 2013 announcement that it would be restating its prior period financials, are that its public statements, including filings with the SEC, were false and/or misleading with respect to its revenue recognition and earnings prospects. On
F-36
Table of Contents
Accretive Health, Inc.
Notes to Consolidated Financial Statements – (Continued)
November 27, 2013, plaintiffs voluntarily dismissed the Company’s directors (other than Mary Tolan). On January 31, 2014, the Company filed a motion to dismiss the Complaint. On September 25, 2014, the Court granted the Company motion to dismiss without prejudice, however the plaintiffs filed a second amended complaint on October 23, 2014. The Company continues to believe it has meritorious defenses and intend to vigorously defend itself, Mary Tolan, and its former officers against these claims. The outcome is not presently determinable.
The SEC’s Division of Enforcement in the Chicago Regional Office is also conducting an investigation regarding the circumstances surrounding our March 8, 2013 announcement. The Company is fully cooperating with the investigation.
On February 11, 2014, the Company was named as a defendant in a putative class action lawsuit filed in the U.S. District Court for the Southern District of Alabama (Church v. Accretive Health, Inc.). The primary allegations are that the Company attempted to collect debts without providing the notice required by the FDCPA and attempted to collect debts after they were discharged in bankruptcy. The Company believes that it has meritorious defenses and intends to vigorously defend itself against these claims. The outcome is not presently determinable.
On July 22, 2014, the Company was named as a defendant in a putative class action lawsuit filed in the U.S. District Court for the Eastern District of Michigan (Anger v. Accretive Health, Inc.). The primary allegations are that the Company attempted to collect debts without providing the notice required by the FDCPA. The Company believes that it has meritorious defenses and intends to vigorously defend itself against these claims. The outcome is not presently determinable.
On December 31, 2013, the Company entered into a negotiated, confidential settlement to resolve all differences with Fairview Health Services following a confidential mediation.
Note 12. Segments and Customer Concentrations
The Company has determined that it has a single operating segment in accordance with how its business activities are managed and evaluated. All of the Company’s significant operations are organized around the single business of providing end-to-end management services of revenue cycle operations for U.S.-based hospitals and other medical providers. Accordingly, for purposes of segment disclosures, the Company has only one reporting segment. All of the Company’s net services revenue and trade accounts receivable are derived from healthcare providers domiciled in the United States.
While managed independently and governed by separate contracts, several of the Company’s RCM customers are affiliated with a single healthcare system. The Company evaluates each separate affiliated contract as a customer. The Company has between 25 and 30 individual customers for RCM Services in each of the three years ended December 31, 2013, 2012 and 2011. The Company recognizes revenue on RCM services when there is a contract termination or other contractual agreement event, as defined in Note 3, Summary of Significant Accounting Policies in accordance with its accounting policy (see Note 3). The Company’s revenue is not consistent with its cash flows in that cash may be accumulated over 3 to 5 years prior to a revenue recognition event. Therefore, measuring customers as a percent of total revenue may not be meaningful.
Hospital systems affiliated with Ascension Health have accounted for a significant portion of the Company’s net services revenue each year since the Company’s formation. In 2013, 2012 and 2011, net services revenue from hospitals affiliated with Ascension Health represented 73%, 5% and 6% of the Company’s total net
F-37
Table of Contents
Accretive Health, Inc.
Notes to Consolidated Financial Statements – (Continued)
services revenue, respectively. An affiliate of Ascension Health, individually, accounted for 28%, 1% and 3% of the Company’s total net services revenue for 2013, 2012 and 2011, respectively.
The Ascension Health system, through its individual customer contracts with the Company, account for more than 55%, 73% and 78% of the Company’s total deferred customer billings at December 31, 2013, 2012 and 2011, respectively. The loss of the customers within this large health system would have a material adverse impact on the Company’s operations. There are approximately 4 individual customers that, in the aggregate, account for 46% of the total deferred customer billings at December 31, 2013, 2012 and 2011, of which three customers are part of the affiliated Ascension Health system discussed above.
The Company does not have a concentration of credit risk within accounts receivable as reported in the consolidated balance sheets with any one large customer at December 31, 2013, 2012 and 2011.
Note 13. Subsequent Events
The Company entered into settlement agreements with seven customers after the year ended December 31, 2013 which will result in revenue recognition events for the Company under its revenue recognition policy (see Note 3) in the year ending December 31, 2014. Six of the seven settled agreements had no significant adjustments to the Company’s deferred customer billings. One settlement resulted in a repayment of approximately $5.6 million in previously collected cash and a reduction in deferred customer billings. None of these agreements had a significant impact on the recorded assets and liabilities for these customers at December 31, 2013.
F-38
Table of Contents
Accretive Health, Inc.
Notes to Consolidated Financial Statements – (Continued)
Note 14. Quarterly Financial Information (Unaudited)
The following tables present Consolidated Balance Sheet data for each quarter end in 2013 (in thousands):
| March 31, 2013 |
June 30, 2013 |
September 30, 2013 |
||||||||||
| (Unaudited) | (Unaudited) | (Unaudited) | ||||||||||
| Assets |
||||||||||||
| Current assets: |
||||||||||||
| Cash and cash equivalents |
$ | 182,978 | $ | 203,727 | $ | 220,171 | ||||||
| Accounts receivable, net |
29,107 | 26,346 | 23,118 | |||||||||
| Prepaid income taxes |
5,312 | 5,490 | 5,112 | |||||||||
| Current deferred tax asset |
273,176 | 116,522 | 119,693 | |||||||||
| Other current assets (1) |
21,793 | 23,091 | 22,029 | |||||||||
|
|
|
|
|
|
|
|||||||
| Total current assets |
512,366 | 375,176 | 390,123 | |||||||||
| Property, equipment and software, net |
19,805 | 18,521 | 17,102 | |||||||||
| Non-current deferred tax asset |
43,906 | 90,721 | 110,901 | |||||||||
| Restricted cash |
5,000 | 5,000 | 5,000 | |||||||||
| Goodwill and other assets, net |
589 | 599 | 596 | |||||||||
|
|
|
|
|
|
|
|||||||
| Total assets |
$ | 581,666 | $ | 490,017 | $ | 523,722 | ||||||
|
|
|
|
|
|
|
|||||||
| Liabilities and stockholders’ equity (deficit) |
||||||||||||
| Current liabilities: |
||||||||||||
| Accounts payable |
$ | 2,160 | $ | 486 | $ | 3,038 | ||||||
| Current portion of customer liabilities |
745,455 | 371,433 | 402,944 | |||||||||
| Accrued compensation and benefits |
14,549 | 12,575 | 18,280 | |||||||||
| Other accrued expenses (1) (2) |
23,072 | 29,077 | 28,772 | |||||||||
|
|
|
|
|
|
|
|||||||
| Total current liabilities |
785,236 | 413,571 | 453,034 | |||||||||
| Non-current portion of customer liabilities |
44,155 | 130,148 | 156,772 | |||||||||
| Other non-current liabilities |
8,334 | 8,240 | 8,254 | |||||||||
|
|
|
|
|
|
|
|||||||
| Total liabilities |
837,725 | 551,959 | 618,060 | |||||||||
|
|
|
|
|
|
|
|||||||
| Commitments and contingencies |
||||||||||||
| Stockholders’ equity (deficit): |
||||||||||||
| Common stock |
1,000 | 1,005 | 1,005 | |||||||||
| Additional paid-in capital |
268,647 | 275,569 | 281,147 | |||||||||
| Accumulated deficit |
(474,445 | ) | (286,712 | ) | (324,283 | ) | ||||||
| Accumulated other comprehensive loss |
(722 | ) | (1,265 | ) | (1,581 | ) | ||||||
| Treasury stock |
(50,539 | ) | (50,539 | ) | (50,626 | ) | ||||||
|
|
|
|
|
|
|
|||||||
| Total stockholders’ equity (deficit) |
(256,059 | ) | (61,942 | ) | (94,338 | ) | ||||||
|
|
|
|
|
|
|
|||||||
| Total liabilities and stockholders’ equity (deficit) |
$ | 581,666 | $ | 490,017 | $ | 523,722 | ||||||
|
|
|
|
|
|
|
|||||||
| (1) | Other accrued expenses and other current assets include $14 million of litigation liability and the corresponding insurance receivable, respectively. |
| (2) | Refer to Note 8, Restatement and other costs for a discussion regarding the Company’s reorganization plan and the reorganization charges. Reorganization liability of $0 million, $2.0 million and $0.9 million is included within other accrued expenses as of March 31, June 30 and September 30, 2013, respectively. |
F-39
Table of Contents
Accretive Health, Inc.
Notes to Consolidated Financial Statements – (Continued)
The following tables present Consolidated Balance Sheet data for each quarter end in 2012 (in thousands), including adjustments consistent with Note 2:
| March 31, 2012 | June 30, 2012 | |||||||||||||||||||||||
| As reported (1) | Adjustments | As restated | As reported (1) | Adjustments | As restated | |||||||||||||||||||
| (Unaudited) | (Unaudited) | (Unaudited) | (Unaudited) | (Unaudited) | (Unaudited) | |||||||||||||||||||
| Assets |
||||||||||||||||||||||||
| Current assets: |
||||||||||||||||||||||||
| Cash and cash equivalents |
$ | 214,474 | $ | — | $ | 214,474 | $ | 200,878 | $ | — | $ | 200,878 | ||||||||||||
| Accounts receivable, net |
111,164 | (90,403 | ) | 20,761 | 124,869 | (101,354 | ) | 23,515 | ||||||||||||||||
| Prepaid income taxes |
6,758 | 1,548 | 8,306 | 9,785 | 1,549 | 11,334 | ||||||||||||||||||
| Current deferred tax asset |
— | 214,160 | 214,160 | — | 223,246 | 223,246 | ||||||||||||||||||
| Other current assets |
10,526 | (4,009 | ) | 6,517 | 17,321 | (4,377 | ) | 12,944 | ||||||||||||||||
|
|
|
|
|
|
|
|
|
|
|
|
|
|||||||||||||
| Total current assets |
342,922 | 121,296 | 464,218 | 352,853 | 119,064 | 471,917 | ||||||||||||||||||
| Property, equipment and software, net |
27,264 | (8,519 | ) | 18,745 | 30,129 | (10,579 | ) | 19,550 | ||||||||||||||||
| Non-current deferred tax asset |
20,082 | 10,953 | 31,035 | 22,178 | 15,254 | 37,432 | ||||||||||||||||||
| Restricted cash |
5,000 | — | 5,000 | 5,000 | — | 5,000 | ||||||||||||||||||
| Goodwill and other assets, net |
13,147 | (12,485 | ) | 662 | 12,437 | (11,784 | ) | 653 | ||||||||||||||||
|
|
|
|
|
|
|
|
|
|
|
|
|
|||||||||||||
| Total assets |
$ | 408,415 | $ | 111,245 | $ | 519,660 | $ | 422,597 | $ | 111,955 | $ | 534,552 | ||||||||||||
|
|
|
|
|
|
|
|
|
|
|
|
|
|||||||||||||
| Liabilities and stockholders’ equity (deficit) |
|
|||||||||||||||||||||||
| Current liabilities: |
||||||||||||||||||||||||
| Accounts payable |
$ | 23,356 | $ | (21,875 | ) | $ | 1,481 | $ | 35,580 | $ | (33,240 | ) | $ | 2,340 | ||||||||||
| Current portion of customer liabilities |
99,818 | 475,118 | 574,936 | 86,658 | 515,283 | 601,941 | ||||||||||||||||||
| Accrued compensation and benefits |
3,581 | (742 | ) | 2,839 | 2,950 | (883 | ) | 2,067 | ||||||||||||||||
| Deferred tax liability |
3,738 | (3,738 | ) | — | 7,224 | (7,224 | ) | — | ||||||||||||||||
| Other accrued expenses |
9,149 | 842 | 9,991 | 15,294 | (3,094 | ) | 12,200 | |||||||||||||||||
|
|
|
|
|
|
|
|
|
|
|
|
|
|||||||||||||
| Total current liabilities |
139,642 | 449,605 | 589,247 | 147,706 | 470,842 | 618,548 | ||||||||||||||||||
| Non-current portion of customer liabilities |
9,072 | 28,196 | 37,268 | 8,437 | 39,190 | 47,627 | ||||||||||||||||||
| Other non-current liabilities |
4,311 | 2,571 | 6,882 | 5,564 | 2,516 | 8,080 | ||||||||||||||||||
|
|
|
|
|
|
|
|
|
|
|
|
|
|||||||||||||
| Total liabilities |
153,025 | 480,372 | 633,397 | 161,707 | 512,548 | 674,255 | ||||||||||||||||||
|
|
|
|
|
|
|
|
|
|
|
|
|
|||||||||||||
| Commitments and contingencies |
||||||||||||||||||||||||
| Stockholders’ equity (deficit): |
||||||||||||||||||||||||
| Common stock |
993 | — | 993 | 994 | — | 994 | ||||||||||||||||||
| Additional paid-in capital |
242,912 | (444 | ) | 242,468 | 249,172 | (981 | ) | 248,191 | ||||||||||||||||
| Accumulated deficit |
12,823 | (369,116 | ) | (356,293 | ) | 12,245 | (399,909 | ) | (387,664 | ) | ||||||||||||||
| Accumulated other comprehensive loss |
(959 | ) | 433 | (526 | ) | (1,142 | ) | 297 | (845 | ) | ||||||||||||||
| Treasury stock |
(379 | ) | — | (379 | ) | (379 | ) | — | (379 | ) | ||||||||||||||
|
|
|
|
|
|
|
|
|
|
|
|
|
|||||||||||||
| Total stockholders’ equity (deficit) |
255,390 | (369,127 | ) | (113,737 | ) | 260,890 | (400,593 | ) | (139,703 | ) | ||||||||||||||
|
|
|
|
|
|
|
|
|
|
|
|
|
|||||||||||||
| Total liabilities and stockholders’ equity (deficit) |
$ | 408,415 | $ | 111,245 | $ | 519,660 | $ | 422,597 | $ | 111,955 | $ | 534,552 | ||||||||||||
|
|
|
|
|
|
|
|
|
|
|
|
|
|||||||||||||
| (1) | In connection with the Restatement, the Company also reclassified certain amounts in the historical consolidated financial statements to conform to the current presentation. See Note 2, Restatement of Previously Issued Consolidated Financial Statements for further information. |
F-40
Table of Contents
Accretive Health, Inc.
Notes to Consolidated Financial Statements – (Continued)
| September 30, 2012 | ||||||||||||
| As reported (1) | Adjustments | As restated | ||||||||||
| (Unaudited) | (Unaudited) | (Unaudited) | ||||||||||
| Assets |
||||||||||||
| Current assets: |
||||||||||||
| Cash and cash equivalents |
$ | 196,375 | $ | — | $ | 196,375 | ||||||
| Accounts receivable, net |
136,695 | (110,206 | ) | 26,489 | ||||||||
| Prepaid income taxes |
4,976 | 1,549 | 6,525 | |||||||||
| Current deferred tax asset |
— | 236,712 | 236,712 | |||||||||
| Other current assets |
14,731 | (5,520 | ) | 9,211 | ||||||||
|
|
|
|
|
|
|
|||||||
| Total current assets |
352,777 | 122,535 | 475,312 | |||||||||
| Property, equipment and software, net |
35,654 | (13,025 | ) | 22,629 | ||||||||
| Non-current deferred tax asset |
23,866 | 21,888 | 45,754 | |||||||||
| Restricted cash |
5,000 | — | 5,000 | |||||||||
| Goodwill and other assets, net |
11,693 | (11,085 | ) | 608 | ||||||||
|
|
|
|
|
|
|
|||||||
| Total assets |
$ | 428,990 | $ | 120,313 | $ | 549,303 | ||||||
|
|
|
|
|
|
|
|||||||
| Liabilities and stockholders’ equity (deficit) |
||||||||||||
| Current liabilities: |
||||||||||||
| Accounts payable |
$ | 43,395 | $ | (39,163 | ) | $ | 4,232 | |||||
| Current portion of customer liabilities |
91,105 | 542,770 | 633,875 | |||||||||
| Accrued compensation and benefits |
3,090 | (894 | ) | 2,196 | ||||||||
| Deferred tax liability |
7,224 | (7,224 | ) | — | ||||||||
| Other accrued expenses |
12,918 | (1,944 | ) | 10,974 | ||||||||
|
|
|
|
|
|
|
|||||||
| Total current liabilities |
157,732 | 493,545 | 651,277 | |||||||||
| Non-current portion of customer liabilities |
7,737 | 58,850 | 66,587 | |||||||||
| Other non-current liabilities |
5,492 | 2,529 | 8,021 | |||||||||
|
|
|
|
|
|
|
|||||||
| Total liabilities |
170,961 | 554,924 | 725,885 | |||||||||
|
|
|
|
|
|
|
|||||||
| Commitments and contingencies |
||||||||||||
| Stockholders’ equity (deficit): |
||||||||||||
| Common stock |
998 | — | 998 | |||||||||
| Additional paid-in capital |
256,707 | (956 | ) | 255,751 | ||||||||
| Accumulated deficit |
14,999 | (434,068 | ) | (419,069 | ) | |||||||
| Accumulated other comprehensive loss |
(976 | ) | 413 | (563 | ) | |||||||
| Treasury stock |
(13,699 | ) | — | (13,699 | ) | |||||||
|
|
|
|
|
|
|
|||||||
| Total stockholders’ equity (deficit) |
258,029 | (434,611 | ) | (176,582 | ) | |||||||
|
|
|
|
|
|
|
|||||||
| Total liabilities and stockholders’ equity (deficit) |
$ | 428,990 | $ | 120,313 | $ | 549,303 | ||||||
|
|
|
|
|
|
|
|||||||
| (1) | In connection with the Restatement, the Company also reclassified certain amounts in the historical consolidated financial statements to conform to the current presentation. See Note 2, Restatement of Previously Issued Consolidated Financial Statements for further information. |
F-41
Table of Contents
Accretive Health, Inc.
Notes to Consolidated Financial Statements – (Continued)
The following tables present Consolidated Balance Sheet data for each quarter end in 2011 (in thousands), including adjustments consistent with Note 2:
| March 31, 2011 |
June 30, 2011 | |||||||||||||||||||||||
| As reported (1) | Adjustments | As restated | As reported (1) | Adjustments | As restated | |||||||||||||||||||
| (Unaudited) | (Unaudited) | (Unaudited) | (Unaudited) | (Unaudited) | (Unaudited) | |||||||||||||||||||
| Assets |
||||||||||||||||||||||||
| Current assets: |
||||||||||||||||||||||||
| Cash and cash equivalents |
$ | 118,974 | $ | (224 | ) | $ | 118,750 | $ | 150,297 | $ |
— |
|
$ | 150,297 | ||||||||||
| Accounts receivable, net |
93,698 | (77,859 | ) | 15,839 | 92,007 | (80,123 | ) | 11,884 | ||||||||||||||||
| Prepaid income taxes |
16,431 | 202 | 16,633 | 24,454 | 229 | 24,683 | ||||||||||||||||||
| Current deferred tax asset |
— | 16,518 | 16,518 | — | 35,509 | 35,509 | ||||||||||||||||||
| Other current assets |
6,080 | (998 | ) | 5,082 | 7,973 | (1,876 | ) | 6,097 | ||||||||||||||||
|
|
|
|
|
|
|
|
|
|
|
|
|
|||||||||||||
| Total current assets |
235,183 | (62,361 | ) | 172,822 | 274,731 | (46,261 | ) | 228,470 | ||||||||||||||||
| Property, equipment and software, net |
21,707 | (6,941 | ) | 14,766 | 24,384 | (8,224 | ) | 16,160 | ||||||||||||||||
| Non-current deferred tax asset |
11,405 | 140,989 | 152,394 | 11,405 | 143,421 | 154,826 | ||||||||||||||||||
| Goodwill and other assets, net |
2,706 | (1,987 | ) | 719 | 2,671 | (1,988 | ) | 683 | ||||||||||||||||
|
|
|
|
|
|
|
|
|
|
|
|
|
|||||||||||||
| Total assets |
$ | 271,001 | $ | 69,700 | $ | 340,701 | $ | 313,191 | $ | 86,948 | $ | 400,139 | ||||||||||||
|
|
|
|
|
|
|
|
|
|
|
|
|
|||||||||||||
| Liabilities and stockholders’ equity (deficit) |
|
|||||||||||||||||||||||
| Current liabilities: |
||||||||||||||||||||||||
| Accounts payable |
$ | 27,123 | $ | (26,106 | ) | $ | 1,017 | $ | 30,264 | $ | (28,397 | ) | $ | 1,867 | ||||||||||
| Current portion of customer liabilities |
63,122 | (8,083 | ) | 55,039 | 62,056 | 50,077 | 112,133 | |||||||||||||||||
| Accrued compensation and benefits |
5,019 | (822 | ) | 4,197 | 13,257 | (1,116 | ) | 12,141 | ||||||||||||||||
| Deferred tax liability |
6,016 | (6,016 | ) | — | 6,016 | (6,016 | ) | — | ||||||||||||||||
| Other accrued expenses |
7,017 | (1,545 | ) | 5,472 | 5,894 | (1,880 | ) | 4,014 | ||||||||||||||||
|
|
|
|
|
|
|
|
|
|
|
|
|
|||||||||||||
| Total current liabilities |
108,297 | (42,572 | ) | 65,725 | 117,487 | 12,668 | 130,155 | |||||||||||||||||
|
|
|
|
|
|
|
|
|
|
|
|
|
|||||||||||||
| Non-current portion of customer liabilities |
— | 373,544 | 373,544 | — | 368,004 | 368,004 | ||||||||||||||||||
| Other non-current liabilities |
4,090 | 2,281 | 6,371 | 3,940 | 2,271 | 6,211 | ||||||||||||||||||
|
|
|
|
|
|
|
|
|
|
|
|
|
|||||||||||||
| Total liabilities |
112,387 | 333,253 | 445,640 | 121,427 | 382,943 | 504,370 | ||||||||||||||||||
|
|
|
|
|
|
|
|
|
|
|
|
|
|||||||||||||
| Commitments and contingencies |
||||||||||||||||||||||||
| Stockholders’ equity (deficit): |
||||||||||||||||||||||||
| Common stock |
958 | — | 958 | 974 | — | 974 | ||||||||||||||||||
| Additional paid-in capital |
175,519 | 11 | 175,530 | 200,151 | 34 | 200,185 | ||||||||||||||||||
| Accumulated deficit |
(17,674 | ) | (263,779 | ) | (281,453 | ) | (9,121 | ) | (296,288 | ) | (305,409 | ) | ||||||||||||
| Accumulated other comprehensive loss |
(189 | ) | 215 | 26 | (240 | ) | 259 | 19 | ||||||||||||||||
|
|
|
|
|
|
|
|
|
|
|
|
|
|||||||||||||
| Total stockholders’ equity (deficit) |
158,614 | (263,553 | ) | (104,939 | ) | 191,764 | (295,995 | ) | (104,231 | ) | ||||||||||||||
|
|
|
|
|
|
|
|
|
|
|
|
|
|||||||||||||
| Total liabilities and stockholders’ equity (deficit) |
$ | 271,001 | $ | 69,700 | $ | 340,701 | $ | 313,191 | $ | 86,948 | $ | 400,139 | ||||||||||||
|
|
|
|
|
|
|
|
|
|
|
|
|
|||||||||||||
| (1) | In connection with the Restatement, the Company also reclassified certain amounts in the historical consolidated financial statements to conform to the current presentation. See Note 2, Restatement of Previously Issued Consolidated Financial Statements for further information. |
F-42
Table of Contents
Accretive Health, Inc.
Notes to Consolidated Financial Statements – (Continued)
| September 30, 2011 | ||||||||||||
| As reported (1) | Adjustments | As restated | ||||||||||
| (Unaudited) | (Unaudited) | (Unaudited) | ||||||||||
| Assets |
||||||||||||
| Current assets: |
||||||||||||
| Cash and cash equivalents |
$ | 182,094 | $ | (5,000 | ) | $ | 177,094 | |||||
| Accounts receivable, net |
106,722 | (87,728 | ) | 18,994 | ||||||||
| Prepaid income taxes |
15,514 | (120 | ) | 15,394 | ||||||||
| Current deferred tax asset |
— | 37,820 | 37,820 | |||||||||
| Other current assets |
5,505 | (779 | ) | 4,726 | ||||||||
|
|
|
|
|
|
|
|||||||
| Total current assets |
309,835 | (55,807 | ) | 254,028 | ||||||||
| Property, equipment and software, net |
24,285 | (8,647 | ) | 15,638 | ||||||||
| Non-current deferred tax asset |
11,405 | 161,273 | 172,678 | |||||||||
| Restricted cash |
— | 5,000 | 5,000 | |||||||||
| Goodwill and other assets, net |
1,980 | (1,309 | ) | 671 | ||||||||
|
|
|
|
|
|
|
|||||||
| Total assets |
$ | 347,505 | $ | 100,510 | $ | 448,015 | ||||||
|
|
|
|
|
|
|
|||||||
| Liabilities and stockholders’ equity (deficit) |
||||||||||||
| Current liabilities: |
||||||||||||
| Accounts payable |
$ | 26,825 | $ | (25,952 | ) | $ | 873 | |||||
| Current portion of customer liabilities |
83,554 | 48,007 | 131,561 | |||||||||
| Accrued compensation and benefits |
9,991 | (894 | ) | 9,097 | ||||||||
| Deferred tax liability |
6,016 | (6,016 | ) | — | ||||||||
| Other accrued expenses |
8,676 | (1,731 | ) | 6,945 | ||||||||
|
|
|
|
|
|
|
|||||||
| Total current liabilities |
135,062 | 13,414 | 148,476 | |||||||||
| Non-current portion of customer liabilities |
— | 410,391 | 410,391 | |||||||||
| Other non-current liabilities |
4,003 | 2,210 | 6,213 | |||||||||
|
|
|
|
|
|
|
|||||||
| Total liabilities |
139,065 | 426,015 | 565,080 | |||||||||
|
|
|
|
|
|
|
|||||||
| Commitments and contingencies |
||||||||||||
| Stockholders’ equity (deficit): |
||||||||||||
| Common stock |
982 | — | 982 | |||||||||
| Additional paid-in capital |
210,341 | (33 | ) | 210,308 | ||||||||
| Accumulated deficit |
(1,851 | ) | (325,781 | ) | (327,632 | ) | ||||||
| Accumulated other comprehensive loss |
(653 | ) | 309 | (344 | ) | |||||||
| Treasury stock |
(379 | ) | — | (379 | ) | |||||||
|
|
|
|
|
|
|
|||||||
| Total stockholders’ equity (deficit) |
208,440 | (325,505 | ) | (117,065 | ) | |||||||
|
|
|
|
|
|
|
|||||||
| Total liabilities and stockholders’ equity (deficit) |
$ | 347,505 | $ | 100,510 | $ | 448,015 | ||||||
|
|
|
|
|
|
|
|||||||
| (1) | In connection with the Restatement, the Company also reclassified certain amounts in the historical consolidated financial statements to conform to the current presentation. See Note 2, Restatement of Previously Issued Consolidated Financial Statements for further information. |
F-43
Table of Contents
Accretive Health, Inc.
Notes to Consolidated Financial Statements – (Continued)
The following tables present Consolidated Statements of Comprehensive Income (Loss) for each quarter in 2013 (in thousands, except share and per share data):
| March 31, 2013 | June 30, 2013 | September 30, 2013 | ||||||||||
| (Unaudited) | (Unaudited) | (Unaudited) | ||||||||||
| Net services revenue |
$ | 28,157 | $ | 374,408 | $ | 18,342 | ||||||
| Operating expenses: |
||||||||||||
| Cost of services (1) |
47,533 | 49,926 | 47,544 | |||||||||
| Selling, general and administrative (1) |
22,057 | 18,675 | 22,562 | |||||||||
| Restatement and other costs (1) (4) |
1,031 | 8,253 | 9,182 | |||||||||
|
|
|
|
|
|
|
|||||||
| Total operating expenses |
70,621 | 76,854 | 79,288 | |||||||||
|
|
|
|
|
|
|
|||||||
| Income (loss) from operations |
(42,464 | ) | 297,554 | (60,946 | ) | |||||||
| Net interest income |
61 | 57 | 47 | |||||||||
|
|
|
|
|
|
|
|||||||
| Net income (loss) before provision (benefit) for income taxes |
(42,403 | ) | 297,611 | (60,899 | ) | |||||||
| Income tax provision (benefit) (3) |
(15,938 | ) | 109,878 | (23,328 | ) | |||||||
|
|
|
|
|
|
|
|||||||
| Net income (loss) |
$ | (26,465 | ) | 187,733 | $ | (37,571 | ) | |||||
|
|
|
|
|
|
|
|||||||
| Net income (loss) per common share |
||||||||||||
| Basic |
$ | (0.28 | ) | $ | 1.96 | $ | (0.39 | ) | ||||
| Diluted |
$ | (0.28 | ) | $ | 1.93 | $ | (0.39 | ) | ||||
| Weighted-average shares used in calculating net income (loss) per common share (2) |
||||||||||||
| Basic |
95,675,682 | 95,679,451 | 95,689,798 | |||||||||
| Diluted |
95,675,682 | 97,029,115 | 95,689,798 | |||||||||
| Other comprehensive income (loss): |
||||||||||||
| Foreign currency translation adjustments |
34 | (543 | ) | (316 | ) | |||||||
|
|
|
|
|
|
|
|||||||
| Comprehensive income (loss) |
$ | (26,431 | ) | $ | 187,190 | $ | (37,887 | ) | ||||
|
|
|
|
|
|
|
|||||||
| (1) | Share-based compensation expense of $2,944, $3,588, and $0; $3,256, $2,620 and $1,054; and $2,224, $3,352 and $0 is recorded in Cost of services, Selling, general and administrative and Restatement and other costs for the periods ended March 31, 2013, June 30, 2013 and September 30, 2013, respectively. |
| (2) | Stock options totaling 16,225,647 were not included in the computation of diluted income per share for the quarter ended June 30, 2013 as the options were anti-dilutive. Due to the net loss, stock options and RSAs totaling 17,570,005 and 20,998,688 were not included in the computation of diluted loss per share for quarters ended March 31 and September 30, 2013, respectively. |
| (3) | The Company’s effective tax rates were 37.6%, 36.9%, and 38.3% for the quarters ended March 31, June 30, and September 30, 2013, respectively. These rates vary from the Company’s federal statutory tax rate primarily due to permanent differences and state income taxes. |
| (4) | Refer to Note 8, Restatement and other costs for a discussion regarding the Company’s reorganization plan and the reorganization charges. Reorganization charges of $0 million, $2.1 million and $0.2 million are included within Restatement and other costs for the quarters ended March 31, June 30 and September 30, 2013, respectively. |
F-44
Table of Contents
Accretive Health, Inc.
Notes to Consolidated Financial Statements – (Continued)
The following tables present Consolidated Statements of Comprehensive Income (Loss) for each quarter in 2012 (in thousands, except share and per share data), including adjustments consistent with Note 2:
| March 31, 2012 | June 30, 2012 | |||||||||||||||||||||||
| As reported (1) | Adjustments | As restated | As reported (1) | Adjustments | As restated | |||||||||||||||||||
| (Unaudited) | (Unaudited) | (Unaudited) | (Unaudited) | (Unaudited) | (Unaudited) | |||||||||||||||||||
| Net services revenue |
$ | 253,742 | $ | (232,648 | ) | $ | 21,094 | $ | 236,687 | $ | (220,413 | ) | $ | 16,274 | ||||||||||
| Operating expenses: |
||||||||||||||||||||||||
| Cost of services (2) |
234,110 | (186,792 | ) | 47,318 | 217,364 | (167,977 | ) | 49,387 | ||||||||||||||||
| Selling, general and administrative (2) |
17,288 | 484 | 17,772 | 20,043 | (4,619 | ) | 15,424 | |||||||||||||||||
| Restatement and other costs |
— | — | — | 588 | — | 588 | ||||||||||||||||||
|
|
|
|
|
|
|
|
|
|
|
|
|
|||||||||||||
| Total operating expenses |
251,398 | (186,308 | ) | 65,090 | 237,995 | (172,596 | ) | 65,399 | ||||||||||||||||
|
|
|
|
|
|
|
|
|
|
|
|
|
|||||||||||||
| Income (loss) from operations |
2,344 | (46,340 | ) | (43,996 | ) | (1,308 | ) | (47,817 | ) | (49,125 | ) | |||||||||||||
| Net interest income |
1 | 21 | 22 | — | 20 | 20 | ||||||||||||||||||
|
|
|
|
|
|
|
|
|
|
|
|
|
|||||||||||||
| Net income (loss) before provision (benefit) for income taxes |
2,345 | (46,319 | ) | (43,974 | ) | (1,308 | ) | (47,797 | ) | (49,105 | ) | |||||||||||||
| Income tax provision (benefit) (4) |
852 | (16,773 | ) | (15,921 | ) | (730 | ) | (17,004 | ) | (17,734 | ) | |||||||||||||
|
|
|
|
|
|
|
|
|
|
|
|
|
|||||||||||||
| Net income (loss) |
$ | 1,493 | $ | (29,546 | ) | $ | (28,053 | ) | $ | (578 | ) | $ | (30,793 | ) | $ | (31,371 | ) | |||||||
|
|
|
|
|
|
|
|
|
|
|
|
|
|||||||||||||
| Net income (loss) per common share |
||||||||||||||||||||||||
| Basic |
$ | 0.02 | $ | (0.28 | ) | $ | (0.01 | ) | $ | (0.32 | ) | |||||||||||||
| Diluted |
$ | 0.01 | $ | (0.28 | ) | $ | (0.01 | ) | $ | (0.32 | ) | |||||||||||||
| Weighted-average shares used in calculating net income (loss) per common share (3) |
||||||||||||||||||||||||
| Basic |
98,923,908 | 98,923,908 | 99,354,189 | 99,354,189 | ||||||||||||||||||||
| Diluted |
102,582,322 | 98,923,908 | 99,354,189 | 99,354,189 | ||||||||||||||||||||
| Other comprehensive income (loss): |
||||||||||||||||||||||||
| Foreign currency translation adjustments |
78 | 106 | 184 | (183 | ) | (136 | ) | (319 | ) | |||||||||||||||
|
|
|
|
|
|
|
|
|
|
|
|
|
|||||||||||||
| Comprehensive income (loss) |
$ | 1,571 | $ | (29,440 | ) | $ | (27,869 | ) | $ | (761 | ) | $ | (30,929 | ) | $ | (31,690 | ) | |||||||
|
|
|
|
|
|
|
|
|
|
|
|
|
|||||||||||||
| (1) | In connection with the Restatement, the Company also reclassified certain amounts in the historical consolidated financial statements to conform to the current presentation. See Note 2, Restatement of Previously Issued Consolidated Financial Statements for further information. |
| (2) | Share-based compensation expense of $3,676 and $4,237; and $2,580 and $2,826 is recorded in Cost of Service and Selling, General and Administrative for the periods ended March 31, 2012, and June 30, 2012, respectively |
| (3) | Due to the net loss, stock options and RSAs totalling 15,534,126 and 15,983,405 have been excluded from the computation of diluted net loss per common share for the quarter ended March 31, 2012, and June 30, 2012, respectively. |
| (4) | The Company’s effective tax rates were 36.2%, and 36.1% for the quarters ended March 31, and June 30, 2012, respectively. These rates vary from the Company’s federal statutory tax rate primarily due to state taxes. |
F-45
Table of Contents
Accretive Health, Inc.
Notes to Consolidated Financial Statements – (Continued)
| September 30, 2012 | ||||||||||||
| As reported (1) | Adjustments | As restated | ||||||||||
| (Unaudited) | (Unaudited) | (Unaudited) | ||||||||||
| Net services revenue |
$ | 223,134 | $ | (207,012 | ) | $ | 16,122 | |||||
| Operating expenses: |
||||||||||||
| Cost of services (2) |
198,890 | (153,942 | ) | 44,948 | ||||||||
| Selling, general and administrative (2) |
16,492 | 1,226 | 17,718 | |||||||||
| Restatement and other costs |
1,343 | — | 1,343 | |||||||||
|
|
|
|
|
|
|
|||||||
| Total operating expenses |
216,725 | (152,716 | ) | 64,009 | ||||||||
|
|
|
|
|
|
|
|||||||
| Income (loss) from operations |
6,409 | (54,296 | ) | (47,887 | ) | |||||||
| Net interest income (expense) |
(1 | ) | 36 | 35 | ||||||||
|
|
|
|
|
|
|
|||||||
| Net income (loss) before provision (benefit) for income taxes |
6,408 | (54,260 | ) | (47,852 | ) | |||||||
| Income tax provision (benefit) |
3,653 | (20,100 | ) | (16,447 | ) | |||||||
|
|
|
|
|
|
|
|||||||
| Net income (loss) |
$ | 2,755 | $ | (34,160 | ) | $ | (31,405 | ) | ||||
|
|
|
|
|
|
|
|||||||
| Net income (loss) per common share |
||||||||||||
| Basic |
$ | 0.03 | $ | (0.32 | ) | |||||||
| Diluted |
$ | 0.03 | $ | (0.32 | ) | |||||||
| Weighted-average shares used in calculating net income (loss) per common share (3) |
||||||||||||
| Basic |
99,397,054 | 99,397,054 | ||||||||||
| Diluted |
100,845,362 | 99,397,054 | ||||||||||
| Other comprehensive income (loss): |
||||||||||||
| Foreign currency translation adjustments |
165 | 117 | 282 | |||||||||
|
|
|
|
|
|
|
|||||||
| Comprehensive income (loss) |
$ | 2,920 | $ | (34,043 | ) | $ | (31,123 | ) | ||||
|
|
|
|
|
|
|
|||||||
| (1) | In connection with the Restatement, the Company also reclassified certain amounts in the historical consolidated financial statements to conform to the current presentation. See Note 2, Restatement of Previously Issued Consolidated Financial Statements for further information. |
| (2) | Share-based compensation expense of $2,322 and $3,415 is recorded in Cost of Service and Selling, General and Administrative for the period ended September 30, 2012, respectively. |
| (3) | Due to the net loss, stock options and RSAs totalling 15,159,621, have been excluded from the computation of diluted net loss per common share calculation for the quarter ended September 30, 2012. |
F-46
Table of Contents
Accretive Health, Inc.
Notes to Consolidated Financial Statements – (Continued)
The following tables present Consolidated Statements of Comprehensive Income (Loss) for each quarter in 2011 (in thousands, except share and per share data), including adjustments consistent with Note 2:
| March 31, 2011 | June 30, 2011 | |||||||||||||||||||||||
| As reported (1) | Adjustments | As restated | As reported (1) | Adjustments | As restated | |||||||||||||||||||
| (Unaudited) |
(Unaudited) |
(Unaudited) |
(Unaudited) |
(Unaudited) |
(Unaudited) |
|||||||||||||||||||
| Net services revenue |
$ | 163,714 | $ | (157,042 | ) | $ | 6,672 | $ | 183,587 | $ | (172,835 | ) | $ | 10,752 | ||||||||||
| Operating expenses: |
||||||||||||||||||||||||
| Cost of services (2) |
149,073 | (114,797 | ) | 34,276 | 157,740 | (119,001 | ) | 38,739 | ||||||||||||||||
| Selling, general and administrative (2) |
14,240 | 109 | 14,349 | 12,618 | 100 | 12,718 | ||||||||||||||||||
|
|
|
|
|
|
|
|
|
|
|
|
|
|||||||||||||
| Total operating expenses |
163,313 | (114,688 | ) | 48,625 | 170,358 | (118,901 | ) | 51,457 | ||||||||||||||||
|
|
|
|
|
|
|
|
|
|
|
|
|
|||||||||||||
| Income (loss) from operations |
401 | (42,354 | ) | (41,953 | ) | 13,229 | (53,934 | ) | (40,705 | ) | ||||||||||||||
| Net interest income |
9 | — | 9 | 6 | — | 6 | ||||||||||||||||||
|
|
|
|
|
|
|
|
|
|
|
|
|
|||||||||||||
| Net income (loss) before income tax provision |
410 | (42,354 | ) | (41,944 | ) | 13,235 | (53,934 | ) | (40,699 | ) | ||||||||||||||
| Income tax provision (benefit) (4) |
250 | (17,236 | ) | (16,986 | ) | 4,682 | (21,425 | ) | (16,743 | ) | ||||||||||||||
|
|
|
|
|
|
|
|
|
|
|
|
|
|||||||||||||
| Net income (loss) |
$ | 160 | $ | (25,118 | ) | $ | (24,958 | ) | $ | 8,553 | $ | (32,509 | ) | $ | (23,956 | ) | ||||||||
|
|
|
|
|
|
|
|
|
|
|
|
|
|||||||||||||
| Net income (loss) per common share |
||||||||||||||||||||||||
| Basic |
$ | 0.00 | $ | (0.26 | ) | $ | 0.09 | $ | (0.25 | ) | ||||||||||||||
| Diluted |
$ | 0.00 | $ | (0.26 | ) | $ | 0.08 | $ | (0.25 | ) | ||||||||||||||
| Weighted-average shares used in calculating net income (loss) per common share (3) |
||||||||||||||||||||||||
| Basic |
95,162,411 | 95,162,411 | 96,569,081 | 96,569,081 | ||||||||||||||||||||
| Diluted |
99,178,443 | 95,162,411 | 101,064,774 | 96,569,081 | ||||||||||||||||||||
| Other comprehensive income: |
||||||||||||||||||||||||
| Foreign currency translation adjustments |
$ | (55 | ) | $ | 66 | $ | 11 | $ | 51 | $ | (58 | ) | $ | (7 | ) | |||||||||
|
|
|
|
|
|
|
|
|
|
|
|
|
|||||||||||||
| Comprehensive income (loss) |
$ | 105 | $ | (25,052 | ) | $ | (24,947 | ) | $ | 8,604 | $ | (32,567 | ) | $ | (23,963 | ) | ||||||||
|
|
|
|
|
|
|
|
|
|
|
|
|
|||||||||||||
| (1) | In connection with the Restatement, the Company also reclassified certain amounts in the historical consolidated financial statements to conform to the current presentation. See Note 2, Restatement of Previously Issued Consolidated Financial Statements for further information. |
| (2) | Share-based compensation expense of $2,644 and $3,332; $3,211 and $2,176 is recorded in Cost of Service and Selling, General and Administrative for the periods ended March 31, 2011, and June 30, 2011, respectively. |
| (3) | Due to the net loss, stock options and RSAs totalling 14,864,147 and 14,740,806 have been excluded from the computation of diluted net loss per common share for the quarters ended March 31 and June 30 2011, respectively. |
| (4) | The Company’s effective tax rates were 40.5% and 41.1% for the quarters ended March 31, and June 30, 2011, respectively. These rates vary from the Company’s federal statutory tax rate primarily due to state taxes. |
F-47
Table of Contents
Accretive Health, Inc.
Notes to Consolidated Financial Statements – (Continued)
| September 30, 2011 | ||||||||||||
| As reported (1) | Adjustments | As restated | ||||||||||
| (Unaudited) | (Unaudited) | (Unaudited) | ||||||||||
| Net services revenue |
$ | 218,893 | $ | (200,866 | ) | $ | 18,027 | |||||
| Operating expenses: |
||||||||||||
| Cost of services (2) |
191,183 | (150,612 | ) | 40,571 | ||||||||
| Selling, general and administrative (2) |
15,482 | (601 | ) | 14,881 | ||||||||
|
|
|
|
|
|
|
|||||||
| Total operating expenses |
206,665 | (151,213 | ) | 55,452 | ||||||||
|
|
|
|
|
|
|
|||||||
| Income (loss) from operations |
12,228 | (49,653 | ) | (37,425 | ) | |||||||
| Net interest income |
5 | — | 5 | |||||||||
|
|
|
|
|
|
|
|||||||
| Net income (loss) before provision (benefit) for income taxes |
12,233 | (49,653 | ) | (37,420 | ) | |||||||
| Income tax provision (benefit) (4) |
4,963 | (20,160 | ) | (15,197 | ) | |||||||
|
|
|
|
|
|
|
|||||||
| Net income (loss) |
$ | 7,270 | $ | (29,493 | ) | $ | (22,223 | ) | ||||
|
|
|
|
|
|
|
|||||||
| Net income (loss) per common share |
||||||||||||
| Basic |
$ | 0.07 | $ | (0.23 | ) | |||||||
| Diluted |
$ | 0.07 | $ | (0.23 | ) | |||||||
| Weighted-average shares used in calculating net income (loss) per common share (3) |
||||||||||||
| Basic |
97,793,262 | 97,793,262 | ||||||||||
| Diluted |
101,868,888 | 97,793,262 | ||||||||||
| Other comprehensive income: |
||||||||||||
| Foreign currency translation adjustments |
(413 | ) | 50 | (363 | ) | |||||||
|
|
|
|
|
|
|
|||||||
| Comprehensive income (loss) |
$ | 6,857 | $ | (29,443 | ) | $ | (22,586 | ) | ||||
|
|
|
|
|
|
|
|||||||
| (1) | In connection with the Restatement, the Company also reclassified certain amounts in the historical consolidated financial statements to conform to the current presentation. See Note 2, Restatement of Previously Issued Consolidated Financial Statements for further information. |
| (2) | Share-based compensation expense of $4,156 and $3,142 is recorded in Cost of Service and Selling, General and Administrative for the period ended September 30, 2011, respectively. |
| (3) | Due to the net loss, stock options and RSAs totaling 15,343,006, have been excluded from the computation of diluted net loss per common share for the quarter ended September 30, 2011. |
| (4) | The Company’s effective tax rate is 40.6% for the quarter end September 30, 2011, which is higher than the Company’s federal statutory tax rate primarily due to state taxes. |
F-48
Table of Contents
Accretive Health, Inc.
Notes to Consolidated Financial Statements – (Continued)
The following table summarizes the financial data for the fourth quarter ended (in thousands) (unaudited):
| December 31, 2013 |
December 31, 2012 |
December 31, 2011 | ||||||||||||||||||
| As reported |
Adjustments | As restated |
||||||||||||||||||
| Net services revenue |
$ | 83,861 | $ | 18,764 | $ | 260,082 | $ | (193,567 | ) | $ | 66,515 | |||||||||
| Total operating expenses |
73,903 | 65,632 | 237,885 | (171,436 | ) | 66,449 | ||||||||||||||
|
|
|
|
|
|
|
|
|
|
|
|||||||||||
| Income (loss) from operations |
9,958 | (46,868 | ) | 22,197 | (22,131 | ) | 66 | |||||||||||||
|
|
|
|
|
|
|
|
|
|
|
|||||||||||
| Net income (loss) |
$ | 6,386 | $ | (28,911 | ) | $ | 13,181 | $ | (13,789 | ) | $ | (608 | ) | |||||||
|
|
|
|
|
|
|
|
|
|
|
|||||||||||
| Net income (loss) per common share |
||||||||||||||||||||
| Basic |
$ | 0.07 | $ | (0.30 | ) | $ | 0.13 | $ | (0.01 | ) | ||||||||||
| Diluted |
$ | 0.07 | $ | (0.30 | ) | $ | 0.13 | $ | (0.01 | ) | ||||||||||
The following tables summarize the Consolidated Statements of Cash Flows for each quarter in 2013 (in thousands):
| March 31, 2013 | June 30, 2013 | September 30, 2013 | ||||||||||
| (Unaudited) | (Unaudited) | (Unaudited) | ||||||||||
| Net cash provided by operating activities |
6,093 | 21,796 | 17,134 | |||||||||
| Purchases of property, equipment, and software |
(193 | ) | (585 | ) | (343 | ) | ||||||
|
|
|
|
|
|
|
|||||||
| Net cash used in investing activities |
(193 | ) | (585 | ) | (343 | ) | ||||||
| Net cash provided by financing activities |
41 | — | (86 | ) | ||||||||
| Effect of exchange rate changes in cash |
81 | (462 | ) | (261 | ) | |||||||
|
|
|
|
|
|
|
|||||||
| Net increase in cash and cash equivalents |
6,022 | 20,749 | 16,444 | |||||||||
| Cash and cash equivalents beginning of the period |
176,956 | 182,978 | 203,727 | |||||||||
|
|
|
|
|
|
|
|||||||
| Cash and cash equivalents at end of the period |
$ | 182,978 | $ | 203,727 | $ | 220,171 | ||||||
|
|
|
|
|
|
|
|||||||
F-49
Table of Contents
Accretive Health, Inc.
Notes to Consolidated Financial Statements – (Continued)
The following tables summarize the effects of the Restatement adjustments on the Consolidated Statements of Cash Flows for each quarter in 2012 (in thousands), including adjustments consistent with Note 2:
| March 31, 2012 | ||||||||||||
| As reported (1) | Adjustments | As restated | ||||||||||
| (Unaudited) | (Unaudited) | (Unaudited) | ||||||||||
| Net cash provided by operating activities |
14,480 | (1,483 | ) | 12,997 | ||||||||
| Purchase of property, equipment and software |
(4,567 | ) | 1,586 | (2,981 | ) | |||||||
| Other |
204 | (204 | ) | — | ||||||||
|
|
|
|
|
|
|
|||||||
| Net cash used in investing activities |
(4,363 | ) | 1,382 | (2,981 | ) | |||||||
| Excess tax benefit from share-based awards |
3,186 | — | 3,186 | |||||||||
| Exercise of vested stock options |
4,463 | — | 4,463 | |||||||||
|
|
|
|
|
|
|
|||||||
| Net cash provided by financing activities |
7,649 | — | 7,649 | |||||||||
| Effect of exchange rate changes in cash |
(17 | ) | 101 | 84 | ||||||||
|
|
|
|
|
|
|
|||||||
| Net increase in cash and cash equivalents |
17,749 | — | 17,749 | |||||||||
| Cash and cash equivalents, at beginning of the period |
196,725 | — | 196,725 | |||||||||
|
|
|
|
|
|
|
|||||||
| Cash and cash equivalents, at end of the period |
$ | 214,474 | $ | — | $ | 214,474 | ||||||
|
|
|
|
|
|
|
|||||||
| June 30, 2012 | ||||||||||||
| As reported (1) | Adjustments | As restated | ||||||||||
| (Unaudited) | (Unaudited) | (Unaudited) | ||||||||||
| Net cash (used in) by operating activities |
(8,319 | ) | (3,039 | ) | (11,358 | ) | ||||||
| Purchase of property, equipment and software |
(5,609 | ) | 3,244 | (2,365 | ) | |||||||
| Other investing activities |
72 | (72 | ) | — | ||||||||
|
|
|
|
|
|
|
|||||||
| Net cash used in investing activities |
(5,537 | ) | 3,172 | (2,365 | ) | |||||||
| Net cash provided by financing activities |
320 | — | 320 | |||||||||
| Effect of exchange rate changes in cash |
(60 | ) | (133 | ) | (193 | ) | ||||||
|
|
|
|
|
|
|
|||||||
| Net decrease in cash and cash equivalents |
(13,596 | ) | — | (13,596 | ) | |||||||
| Cash and cash equivalents, at beginning of the period |
214,474 | — | 214,474 | |||||||||
|
|
|
|
|
|
|
|||||||
| Cash and cash equivalents, at end of the period |
$ | 200,878 | $ | — | $ | 200,878 | ||||||
|
|
|
|
|
|
|
|||||||
| (1) | In connection with the Restatement, the Company also reclassified certain amounts in the historical consolidated financial statements to conform to the current presentation. See Note 2, Restatement of Previously Issued Consolidated Financial Statements for further information. |
F-50
Table of Contents
Accretive Health, Inc.
Notes to Consolidated Financial Statements – (Continued)
| September 30, 2012 | ||||||||||||
| As reported (1) | Adjustments | As restated | ||||||||||
| (Unaudited) | (Unaudited) | (Unaudited) | ||||||||||
| Net cash provided by operating activities |
15,613 | (4,086 | ) | 11,527 | ||||||||
| Purchase of property, equipment and software |
(8,757 | ) | 4,025 | (4,732 | ) | |||||||
| Other |
42 | (42 | ) | — | ||||||||
|
|
|
|
|
|
|
|||||||
| Net cash (used in) investing activities |
(8,715 | ) | 3,983 | (4,732 | ) | |||||||
| Purchase of treasury shares |
(13,160 | ) | — | (13,160 | ) | |||||||
| Exercise of vested stock options |
1,650 | — | 1,650 | |||||||||
| Other |
15 | — | 15 | |||||||||
|
|
|
|
|
|
|
|||||||
| Net cash used in financing activities |
(11,495 | ) | — | (11,495 | ) | |||||||
| Effect of exchange rate changes in cash |
94 | 103 | 197 | |||||||||
|
|
|
|
|
|
|
|||||||
| Net decrease in cash and cash equivalents |
(4,503 | ) | — | (4,503 | ) | |||||||
| Cash and cash equivalents, at beginning of the period |
200,878 | — | 200,878 | |||||||||
|
|
|
|
|
|
|
|||||||
| Cash and cash equivalents, at end of the period |
$ | 196,375 | $ | — | $ | 196,375 | ||||||
|
|
|
|
|
|
|
|||||||
| (1) | In connection with the Restatement, the Company also reclassified certain amounts in the historical consolidated financial statements to conform to the current presentation. See Note 2, Restatement of Previously Issued Consolidated Financial Statements for further information. |
F-51
Table of Contents
Accretive Health, Inc.
Notes to Consolidated Financial Statements – (Continued)
The following tables summarize the effects of the Restatement adjustments on the Consolidated Statements of Cash Flows for each quarter in 2011 and for the year ended December 31, 2011 (in thousands), including adjustments consistent with Note 2:
| March 31, 2011 | ||||||||||||
| As reported (1) | Adjustments | As restated | ||||||||||
| (Unaudited) | (Unaudited) | (Unaudited) | ||||||||||
| Net cash used in operating activities |
(45,310 | ) | (951 | ) | (46,261 | ) | ||||||
| Purchases of property, equipment and software |
(1,996 | ) | 1,056 | (940 | ) | |||||||
| Other |
931 | (931 | ) | — | ||||||||
|
|
|
|
|
|
|
|||||||
| Net cash (used in) investing activities |
(1,065 | ) | 125 | (940 | ) | |||||||
| Excess tax benefit from share-based awards |
4,994 | — | 4,994 | |||||||||
| Exercise of vested stock options |
4,777 | — | 4,777 | |||||||||
| Other |
41 | — | 41 | |||||||||
|
|
|
|
|
|
|
|||||||
| Net cash provided by financing activities |
9,812 | — | 9,812 | |||||||||
| Effect of exchange rate changes in cash |
(36 | ) | 108 | 72 | ||||||||
|
|
|
|
|
|
|
|||||||
| Net increase in cash and cash equivalents |
(36,599 | ) | (718 | ) | (37,317 | ) | ||||||
| Cash and cash equivalents at beginning |
155,573 | 494 | 156,067 | |||||||||
|
|
|
|
|
|
|
|||||||
| Cash and cash equivalents at end |
$ | 118,974 | $ | (224 | ) | $ | 118,750 | |||||
|
|
|
|
|
|
|
|||||||
| June 30, 2011 | ||||||||||||
| As reported (1) | Adjustments | As restated | ||||||||||
| (Unaudited) | (Unaudited) | (Unaudited) | ||||||||||
| Net cash provided by operating activities |
16,845 | (1,946 | ) | 14,899 | ||||||||
| Purchases of property, equipment and software |
(4,785 | ) | 2,157 | (2,628 | ) | |||||||
| Other investing activities |
32 | (32 | ) | — | ||||||||
|
|
|
|
|
|
|
|||||||
| Net cash used in investing activities |
(4,753 | ) | 2,125 | (2,628 | ) | |||||||
| Exercise of vested stock options |
7,379 | — | 7,379 | |||||||||
| Excess tax benefit from share-based awards |
11,907 | — | 11,907 | |||||||||
|
|
|
|
|
|
|
|||||||
| Net cash provided by financing activities |
19,286 | — | 19,286 | |||||||||
| Effect of exchange rate changes in cash |
(55 | ) | 45 | (10 | ) | |||||||
|
|
|
|
|
|
|
|||||||
| Net increase in cash and cash equivalents |
31,323 | 224 | 31,547 | |||||||||
| Cash and cash equivalents at beginning |
118,974 | (224 | ) | 118,750 | ||||||||
|
|
|
|
|
|
|
|||||||
| Cash and cash equivalents at end |
$ | 150,297 | $ | — | $ | 150,297 | ||||||
|
|
|
|
|
|
|
|||||||
| (1) | In connection with the Restatement, the Company also reclassified certain amounts in the historical consolidated financial statements to conform to the current presentation. See Note 2, Restatement of Previously Issued Consolidated Financial Statements for further information. |
F-52
Table of Contents
Accretive Health, Inc.
Notes to Consolidated Financial Statements – (Continued)
| September 30, 2011 | ||||||||||||
| As reported (1) | Adjustments | As restated | ||||||||||
| (Unaudited) | (Unaudited) | (Unaudited) | ||||||||||
| Net cash provided by operating activities |
31,134 | (707 | ) | 30,427 | ||||||||
| Net cash used in investing activities |
(1,549 | ) | 655 | (894 | ) | |||||||
| Exercise of vested stock options |
2,883 | — | 2,883 | |||||||||
| Restricted cash secured for letter of credit |
— | (5,000 | ) | (5,000 | ) | |||||||
| Purchases of treasury stock |
(379 | ) | — | (379 | ) | |||||||
| Other |
(29 | ) | — | (29 | ) | |||||||
|
|
|
|
|
|
|
|||||||
| Net cash provided by financing activities |
2,475 | (5,000 | ) | (2,525 | ) | |||||||
| Effect of exchange rate changes in cash |
(263 | ) | 52 | (211 | ) | |||||||
|
|
|
|
|
|
|
|||||||
| Net increase in cash and cash equivalents |
31,797 | (5,000 | ) | 26,797 | ||||||||
| Cash and cash equivalents, at beginning of the period |
150,297 | — | 150,297 | |||||||||
|
|
|
|
|
|
|
|||||||
| Cash and cash equivalents, at end of the period |
$ | 182,094 | $ | (5,000 | ) | $ | 177,094 | |||||
|
|
|
|
|
|
|
|||||||
| (1) | In connection with the Restatement, the Company also reclassified certain amounts in the historical consolidated financial statements to conform to the current presentation. See Note 2, Restatement of Previously Issued Consolidated Financial Statements for further information. |
F-53
Table of Contents
Accretive Health, Inc.
Notes to Consolidated Financial Statements – (Continued)
The following is a summary of customer liabilities at the end of each of the quarterly periods in 2013, 2012 and 2011 (in thousands) (unaudited):
| September 30, 2013 |
June 30, 2013 |
March 31, 2013 |
September 30, 2012 |
June 30, 2012 |
March 31, 2012 |
September 30, 2011 |
June 30, 2011 |
March 31, 2011 |
||||||||||||||||||||||||||||
| Deferred customer billing, current |
$ | 268,286 | $ | 257,109 | $ | 665,466 | $ | 551,427 | $ | 516,964 | $ | 479,142 | $ | 60,296 | $ | 54,316 | $ | 5,102 | ||||||||||||||||||
| Accrued service costs, current |
114,125 | 104,149 | 76,704 | 75,246 | 77,553 | 78,099 | 61,068 | 44,986 | 48,219 | |||||||||||||||||||||||||||
| Customer deposits, current |
20,484 | 10,135 | 3,207 | 7,146 | 7,337 | 17,573 | 10,076 | 12,658 | 1,597 | |||||||||||||||||||||||||||
| Deferred revenue, current |
49 | 40 | 78 | 56 | 87 | 122 | 121 | 173 | 121 | |||||||||||||||||||||||||||
|
|
|
|
|
|
|
|
|
|
|
|
|
|
|
|
|
|
|
|||||||||||||||||||
| Current portion of customer liabilities |
402,944 | 371,433 | 745,455 | 633,875 | 601,941 | 574,936 | 131,561 | 112,133 | 55,039 | |||||||||||||||||||||||||||
|
|
|
|
|
|
|
|
|
|
|
|
|
|
|
|
|
|
|
|||||||||||||||||||
| Deferred customer billing, non-current |
154,204 | 127,581 | 44,155 | 66,007 | 46,666 | 35,826 | 407,986 | 365,221 | 370,380 | |||||||||||||||||||||||||||
| Customer deposits, non-current |
2,568 | 2,567 | — | — | — | — | — | — | — | |||||||||||||||||||||||||||
| Deferred revenue, non-current |
— | — | — | 580 | 961 | 1,442 | 2,405 | 2,783 | 3,164 | |||||||||||||||||||||||||||
|
|
|
|
|
|
|
|
|
|
|
|
|
|
|
|
|
|
|
|||||||||||||||||||
| Non current portion of customer liabilities |
156,772 | 130,148 | 44,155 | 66,587 | 47,627 | 37,268 | 410,391 | 368,004 | 373,544 | |||||||||||||||||||||||||||
|
|
|
|
|
|
|
|
|
|
|
|
|
|
|
|
|
|
|
|||||||||||||||||||
| Total customer liabilities |
$ | 559,716 | $ | 501,581 | $ | 789,610 | $ | 700,462 | $ | 649,568 | $ | 612,204 | $ | 541,952 | $ | 480,137 | $ | 428,583 | ||||||||||||||||||
|
|
|
|
|
|
|
|
|
|
|
|
|
|
|
|
|
|
|
|||||||||||||||||||
The table below summarizes the effects of the cumulative Restatement adjustments on previously reported quarterly net income (loss) for the seven interim quarters ended September 30, 2012, with the adjustments categorized by the nature of the error (in thousands) (unaudited):
| September 30, 2012 |
June 30, 2012 |
March 31, 2012 |
December 31, 2011 |
September 30, 2011 |
June 30, 2011 |
March 31, 2011 |
||||||||||||||||||||||
| Net income (loss), as reported |
2,755 | (578 | ) | 1,493 | 13,181 | 7,270 | 8,553 | 160 | ||||||||||||||||||||
| Revenue recognition |
||||||||||||||||||||||||||||
| RCM service fees |
(53,470 | ) | (49,881 | ) | (47,219 | ) | (16,979 | ) | (52,250 | ) | (52,398 | ) | (41,864 | ) | ||||||||||||||
| Other revenues |
1,486 | (215 | ) | 484 | (394 | ) | 2,648 | (976 | ) | (476 | ) | |||||||||||||||||
|
|
|
|
|
|
|
|
|
|
|
|
|
|
|
|||||||||||||||
| Revenue recognition: |
(51,984 | ) | (50,096 | ) | (46,735 | ) | (17,373 | ) | (49,602 | ) | (53,374 | ) | (42,340 | ) | ||||||||||||||
| Goodwill, software development and licenses |
(349 | ) | (664 | ) | (483 | ) | (293 | ) | (178 | ) | (440 | ) | (151 | ) | ||||||||||||||
| Other adjustments |
(1,820 | ) | 3,083 | 856 | (4,465 | ) | 127 | (119 | ) | 137 | ||||||||||||||||||
| Restatement tax impacts |
19,993 | 16,884 | 16,816 | 8,342 | 20,160 | 21,424 | 17,236 | |||||||||||||||||||||
|
|
|
|
|
|
|
|
|
|
|
|
|
|
|
|||||||||||||||
| Net impact of adjustments |
(34,160 | ) | (30,793 | ) | (29,546 | ) | (13,789 | ) | (29,493 | ) | (32,509 | ) | (25,118 | ) | ||||||||||||||
|
|
|
|
|
|
|
|
|
|
|
|
|
|
|
|||||||||||||||
| Net loss, as restated |
(31,405 | ) | (31,371 | ) | (28,053 | ) | (608) | (22,223 | ) | (23,956 | ) | (24,958 | ) | |||||||||||||||
|
|
|
|
|
|
|
|
|
|
|
|
|
|
|
|||||||||||||||
F-54
Table of Contents
Accretive Health, Inc.
Notes to Consolidated Financial Statements – (Continued)
The following is the weighted average share information for each of the periods (in thousands except for share and per share information) (unaudited):
| Shares | Weighted- Average Exercise Price |
Weighted- Average Remaining Contractual Term (in years) |
Aggregate Intrinsic Value (in thousands) |
RSAs | Weighted- Average Grant Date Fair Value |
Weighted- Average Remaining Contractual Term (in years) |
||||||||||||||||||||||
| Outstanding at January 1, 2011 |
15,749,404 | 9.45 | 7.5 | 107,120 | — | — | — | |||||||||||||||||||||
| Granted |
114,400 | 18.18 | ||||||||||||||||||||||||||
| Exercised |
(928,547 | ) | 5.15 | |||||||||||||||||||||||||
| Vested |
— | — | ||||||||||||||||||||||||||
| Cancelled |
— | — | ||||||||||||||||||||||||||
| Forfeited |
(71,110 | ) | 12.29 | |||||||||||||||||||||||||
|
|
|
|
|
|||||||||||||||||||||||||
| Outstanding at March 31, 2011 |
14,864,147 | 9.78 | 7.2 | 267,393 | — | — | — | |||||||||||||||||||||
| Granted |
1,935,754 | 26.38 | ||||||||||||||||||||||||||
| Exercised |
(1,684,625 | ) | 4.38 | |||||||||||||||||||||||||
| Vested |
— | — | ||||||||||||||||||||||||||
| Cancelled |
(4,900 | ) | 6.14 | |||||||||||||||||||||||||
| Forfeited |
(369,570 | ) | 14.33 | |||||||||||||||||||||||||
|
|
|
|
|
|||||||||||||||||||||||||
| Outstanding at June 30, 2011 |
14,740,806 | 12.46 | 7.7 | 240,824 | — | — | — | |||||||||||||||||||||
| Granted |
1,594,717 | 28.49 | 189,254 | 27.20 | 9.9 | |||||||||||||||||||||||
| Exercised |
(600,515 | ) | 4.80 | — | — | |||||||||||||||||||||||
| Vested |
— | — | (47,315 | ) | 27.20 | |||||||||||||||||||||||
| Cancelled |
(19,380 | ) | 8.05 | — | — | |||||||||||||||||||||||
| Forfeited |
(481,702 | ) | 15.78 | (32,859 | ) | 27.20 | ||||||||||||||||||||||
|
|
|
|
|
|
|
|
|
|||||||||||||||||||||
| Outstanding at September 30, 2011 |
15,233,926 | 14.34 | 7.8 | 126,091 | 109,080 | 27.20 | 9.9 | |||||||||||||||||||||
| Granted |
793,390 | 22.27 | 50,000 | 23.07 | 9.8 | |||||||||||||||||||||||
| Exercised |
(454,570 | ) | 6.84 | — | — | |||||||||||||||||||||||
| Vested |
— | — | — | — | ||||||||||||||||||||||||
| Cancelled |
(8,647 | ) | 27.20 | — | — | |||||||||||||||||||||||
| Forfeited |
(201,350 | ) | 14.56 | — | — | |||||||||||||||||||||||
|
|
|
|
|
|
|
|
|
|||||||||||||||||||||
| Outstanding at December 31, 2011 |
15,362,749 | 14.96 | 7.7 | 138,632 | 159,080 | 25.90 | 9.7 | |||||||||||||||||||||
| Granted |
747,377 | 26.68 | ||||||||||||||||||||||||||
| Exercised |
(619,975 | ) | 7.20 | |||||||||||||||||||||||||
| Vested |
— | — | ||||||||||||||||||||||||||
| Cancelled |
— | — | ||||||||||||||||||||||||||
| Forfeited |
(115,105 | ) | 15.15 | |||||||||||||||||||||||||
|
|
|
|
|
|
|
|
|
|||||||||||||||||||||
| Outstanding at March 31, 2012 |
15,375,046 | 15.84 | 7.6 | 95,502 | 159,080 | 25.90 | 9.4 | |||||||||||||||||||||
| Granted |
1,833,426 | 9.13 | ||||||||||||||||||||||||||
| Exercised |
(46,840 | ) | 8.13 | |||||||||||||||||||||||||
| Vested |
— | — | ||||||||||||||||||||||||||
| Cancelled |
(35,530 | ) | 17.77 | |||||||||||||||||||||||||
| Forfeited |
(1,301,777 | ) | 23.90 | |||||||||||||||||||||||||
|
|
|
|
|
|
|
|
|
|||||||||||||||||||||
| Outstanding at June 30, 2012 |
15,824,325 | 14.42 | 7.5 | 26,602 | 159,080 | 25.90 | 9.2 | |||||||||||||||||||||
| Granted |
424,588 | 11.80 | 50,000 | 11.16 | 10.0 | |||||||||||||||||||||||
| Exercised |
(393,622 | ) | 4.19 | — | — | |||||||||||||||||||||||
| Vested |
— | — | (48,860 | ) | 26.14 | |||||||||||||||||||||||
| Cancelled |
(123,210 | ) | 14.21 | — | — | |||||||||||||||||||||||
| Forfeited |
(732,680 | ) | 17.23 | — | — | |||||||||||||||||||||||
|
|
|
|
|
|
|
|
|
|
|
|
|
|
|
|||||||||||||||
| Outstanding at September 30, 2012 |
14,999,401 | 14.48 | 7.4 | 24,335 | 160,220 | 21.23 | 9.3 | |||||||||||||||||||||
| Granted |
3,465,558 | 11.29 | ||||||||||||||||||||||||||
| Exercised |
(195,940 | ) | 4.60 | |||||||||||||||||||||||||
| Vested |
— | — | ||||||||||||||||||||||||||
| Cancelled |
(387,360 | ) | 15.44 | |||||||||||||||||||||||||
| Forfeited |
(174,520 | ) | 20.52 | |||||||||||||||||||||||||
|
|
|
|
|
|
|
|
|
|||||||||||||||||||||
| Outstanding at December 31, 2012 |
17,707,139 | 13.88 | 7.6 | 25,957 | 160,220 | 21.23 | 9.0 | |||||||||||||||||||||
| Granted |
440,837 | 11.73 | ||||||||||||||||||||||||||
| Exercised |
(9,400 | ) | 4.34 | |||||||||||||||||||||||||
| Vested |
— | — | ||||||||||||||||||||||||||
| Cancelled |
(119,940 | ) | 18.85 | |||||||||||||||||||||||||
| Forfeited |
(608,851 | ) | 19.11 | |||||||||||||||||||||||||
|
|
|
|
|
|
|
|
|
|||||||||||||||||||||
F-55
Table of Contents
Accretive Health, Inc.
Notes to Consolidated Financial Statements – (Continued)
| Shares | Weighted- Average Exercise Price |
Weighted- Average Remaining Contractual Term (in years) |
Aggregate Intrinsic Value (in thousands) |
RSAs | Weighted- Average Grant Date Fair Value |
Weighted- Average Remaining Contractual Term (in years) |
||||||||||||||||||||||
| Outstanding at March 31, 2013 |
17,409,785 | 13.62 | 7.4 | 19,124 | 160,220 | 21.23 | 8.8 | |||||||||||||||||||||
| Granted |
6,395,653 | 10.18 | 508,303 | 11.46 | 9.9 | |||||||||||||||||||||||
| Exercised |
— | — | — | — | ||||||||||||||||||||||||
| Vested |
— | — | — | — | ||||||||||||||||||||||||
| Cancelled |
(249,593 | ) | 16.51 | — | — | |||||||||||||||||||||||
| Forfeited |
(2,398,250 | ) | 15.29 | (160,220 | ) | 21.23 | ||||||||||||||||||||||
|
|
|
|
|
|
|
|
|
|||||||||||||||||||||
| Outstanding at June 30, 2013 |
21,157,595 | 12.35 | 7.8 | 25,593 | 508,303 | 11.46 | 9.9 | |||||||||||||||||||||
| Granted |
849,086 | 9.66 | — | — | ||||||||||||||||||||||||
| Exercised |
— | — | — | — | ||||||||||||||||||||||||
| Vested |
— | — | (25,002 | ) | 11.47 | |||||||||||||||||||||||
| Cancelled |
(624,314 | ) | 17.30 | — | — | |||||||||||||||||||||||
| Forfeited |
(866,980 | ) | 14.94 | — | — | |||||||||||||||||||||||
|
|
|
|
|
|
|
|
|
|||||||||||||||||||||
| Outstanding at September 30, 2013 |
20,515,387 | 11.98 | 7.6 | 15,288 | 483,301 | 11.46 | 9.7 | |||||||||||||||||||||
|
|
|
|
|
|
|
|
|
|
|
|||||||||||||||||||
F-56
Table of Contents
EXHIBIT INDEX
| Exhibit Number |
Description | |
| 3.1 | Restated Certificate of Incorporation of the Registrant, as amended (incorporated by reference to Exhibit 3.2 to Amendment No. 4 to the Registration Statement on Form S-1 filed on April 26, 2010) | |
| 3.2 | Amended and Restated Bylaws of the Registrant (incorporated by reference to Exhibit 3.4 to Amendment No. 4 to the Registration Statement on Form S-1 filed on April 26, 2010) | |
| 4.1 | Specimen Certificate evidencing shares of Common Stock (incorporated by reference to Exhibit 4.1 to Amendment No. 4 to the Registration Statement on Form S-1 filed on April 26, 2010) | |
| 10.1* | Amended and Restated Stock Option Plan, as amended (incorporated by reference to Exhibit 10.1 to Amendment No. 4 to the Registration Statement on Form S-1 filed on April 26, 2010) | |
| 10.2* | Form of Acknowledgment of Grant, used to evidence option grants under the Amended and Restated Stock Option Plan (incorporated by reference to Exhibit 10.2 to the Registration Statement on Form S-1 filed on September 29, 2009) | |
| 10.3* | Restricted Stock Plan, as amended (incorporated by reference to Exhibit 10.3 to Amendment No. 4 to the Registration Statement on Form S-1 filed on April 26, 2010) | |
| 10.4* | Form of Restricted Stock Award Agreement under the Restricted Stock Plan, as amended (incorporated by reference to Exhibit 10.4 to the Registration Statement on Form S-1 filed on September 29, 2009) | |
| 10.5 | Third Amended and Restated Stockholders’ Agreement, dated as of February 22, 2009, among the Registrant and the parties named therein, as amended (incorporated by reference to Exhibit 10.5 to the Registration Statement on Form S-1 filed on March 9, 2011) | |
| 10.6 | Form of Share Exchange Agreement, entered into in February 2009, with each of Etienne H. Deffarges, Steven N. Kaplan, Gregory N. Kazarian, The Shultz 1989 Family Trust, Spiegel Family LLC and John T. Staton Declaration of Trust (incorporated by reference to Exhibit 10.6 to the Registration Statement on Form S-1 filed on September 29, 2009) | |
| 10.7 | Lease Agreement, dated as of May 4, 2005, between the Registrant and Zeller Management Corporation, as amended by First Lease Amendment, dated as of January 30, 2007, and Second Lease Amendment, dated as of November 26, 2008 (incorporated by reference to Exhibit 10.7 to the Registration Statement on Form S-1 filed on September 29, 2009) | |
| 10.8* | Employment Agreement, dated as of June 17, 2005, between the Registrant and John T. Staton, as amended (incorporated by reference to Exhibit 10.19 to the Registration Statement on Form S-1 filed on September 29, 2009) | |
| 10.9* | Form of Indemnification Agreement, entered into between the Registrant and each director and executive officer (incorporated by reference to Exhibit 10.20 to Amendment No. 1 to the Registration Statement on Form S-1 filed on November 19, 2009) | |
| 10.10* | 2010 Stock Incentive Plan (incorporated by reference to Exhibit 10.23 to Amendment No. 4 to the Registration Statement on Form S-1 filed on April 26, 2010) | |
| 10.11* | Form of Incentive Stock Option Agreement under the 2010 Stock Incentive Plan (incorporated by reference to Exhibit 10.24 to Amendment No. 4 to the Registration Statement on Form S-1 filed on April 26, 2010) | |
| 10.12* | Form of Nonstatutory Stock Option Agreement under the 2010 Stock Incentive Plan (incorporated by reference to Exhibit 10.25 to Amendment No. 4 to the Registration Statement on Form S-1 filed on April 26, 2010) | |
| 10.13+ | Master Professional Services Agreement by and between Ascension Health and Accretive Health, Inc. effective as of August 6, 2012 (filed as Exhibit to Accretive Health, Inc.’s Form 10-Q for the Quarter ended September 30, 2012 and incorporated herein by reference) | |
Table of Contents
| Exhibit Number |
Description | |
| 10.14* | Chairman’s Agreement, dated April 24, 2013, between Registrant and Mary A. Tolan | |
| 10.15* | Mutual General Release Agreement, dated April 24, 2013, between Registrant and Mary A. Tolan | |
| 10.16* | Employment Agreement, dated April 2, 2013, between Registrant and Stephen F. Schuckenbrock | |
| 10.17* | Stock Option Agreement, dated April 3, 2013, between Registrant and Stephen F. Schuckenbrock | |
| 10.18* | Offer Letter, dated April 27, 2013, between Registrant and Joseph Flanagan | |
| 10.19* | Restricted Stock Award, dated June 3, 2013, between Registrant and Joseph Flanagan | |
| 10.20* | Nonstatutory Stock Option Award Agreement, dated June 3, 2013, between Registrant and Joseph Flanagan | |
| 10.21* | Transition Agreement, dated April 24, 2013, between Registrant and Gregory N. Kazarian | |
| 10.22* | Severance Agreement and Release of Claims, dated June 28, 2013, between Registrant and Richard Gillette | |
| 10.23* | Offer Letter, dated August 24, 2013, between Registrant and Sean D. Orr | |
| 10.24* | Resignation Letter, dated March 28, 2014, between Registrant and John T. Staton | |
| 10.25* | Amendment to Offer Letter, dated April 29, 2014, between Registrant and Joseph Flanagan | |
| 10.26* | Nonstatutory Stock Option Award Agreement, dated April 29, 2014, between Registrant and Joseph Flanagan | |
| 10.27* | Restricted Stock Award Agreement, dated April 29, 2014, between Registrant and Joseph Flanagan | |
| 10.28* | Offer Letter, dated June 3, 2014, between Registrant and Thomas Gibson | |
| 10.29* | Offer Letter, dated July 10, 2014, between Registrant and Emad Rizk | |
| 10.30* | Nonstatutory Stock Option Award Agreement, dated July 21, 2014, between Registrant and Emad Rizk | |
| 10.31* | Restricted Stock Award Agreement, dated July 21, 2014, between Registrant and Emad Rizk | |
| 10.32* | Resignation Letter Agreement, dated August 6, 2014, between Registrant and Sean Orr | |
| 10.33* | Offer Letter, dated August 6, 2014, between Registrant and Peter Csapo | |
| 10.34* | Nonstatutory Stock Option Award Agreement, dated August 12, 2014, between Registrant and Peter Csapo | |
| 10.35* | Restricted Stock Award Agreement, dated August 12, 2014, between Registrant and Peter Csapo | |
| 10.36* | Chairman Services Agreement, dated November 14, 2014, between Registrant and Steve Shulman | |
| 21.1 | Subsidiaries of the Registrant (incorporated by reference to Exhibit 21.1 to Amendment No. 4 to the Registration Statement on Form S-1 filed on April 26, 2010) | |
| 23.1 | Consent of Ernst & Young LLP | |
| 31.1 | Certification of Chief Executive Officer pursuant to Rules 13a-14(a) and 15d-14(a), as adopted pursuant to Section 302 of the Sarbanes-Oxley Act of 2002 | |
| 31.2 | Certification of Chief Financial Officer pursuant to Rules 13a-14(a) and 15d-14(a), as adopted pursuant to Section 302 of the Sarbanes-Oxley Act of 2002 | |
| 32.1 | Certification of Chief Executive Officer pursuant to 18 U.S.C. Section 1350, as adopted pursuant to Section 906 of the Sarbanes-Oxley Act of 2002 | |
Table of Contents
| Exhibit Number |
Description | |
| 32.2 |
Certification of Chief Financial Officer pursuant to 18 U.S.C. Section 1350, as adopted pursuant to Section 906 of the Sarbanes-Oxley Act of 2002 | |
| 101 | The following materials from the Accretive Health, Inc.’s Annual Report on Form 10-K for the year ended December 31, 2013, formatted in eXtensible Business Reporting Language (XBRL): (i) the Consolidated Balance Sheets, (ii) the Consolidated Statements of Operations and Comprehensive Income (Loss), (iii) the Consolidated Statements of Stockholders’ Equity, (iv) the Consolidated Statements of Cash Flows, and (v) related notes. | |
| * | Management contract or compensatory plan or arrangement required to be filed pursuant to Item 15(b) of Form 10-K. |
| + | Confidential treatment requested as to certain portions, which portions have been omitted and filed separately with the Securities and Exchange Commission. |