Attached files
| file | filename |
|---|---|
| EX-99.1 - EX-99.1 - RETAIL PROPERTIES OF AMERICA, INC. | ex-9919x30x20.htm |
| 8-K - 8-K - RETAIL PROPERTIES OF AMERICA, INC. | rpai-20201102.htm |
Exhibit 99.2
T A B L E O F C O N T E N T S
| 1 | E A R N I N G S R E L E A S E.......................................................................... | ||||||||||||||||
| 2 | |||||||||||||||||
F I N A N C I A L S U M M A R Y | |||||||||||||||||
| Condensed Consolidated Balance Sheets................................................. | |||||||||||||||||
| Condensed Consolidated Statements of Operations................................ | |||||||||||||||||
| Funds From Operations Attributable to Common Shareholders, Operating FFO Attributable to Common Shareholders and Additional Information....................................................................... | |||||||||||||||||
| Supplemental Financial Statement Detail................................................. | |||||||||||||||||
| Same Store Net Operating Income............................................................ | |||||||||||||||||
| Capitalization............................................................................................. | |||||||||||||||||
| Covenants.................................................................................................. | |||||||||||||||||
| Summary of Indebtedness........................................................................ | |||||||||||||||||
| 3 | |||||||||||||||||
T R A N S A C T I O N S U M M A R Y | |||||||||||||||||
| Development Projects............................................................................... | |||||||||||||||||
| Acquisitions and Dispositions.................................................................... | |||||||||||||||||
| 4 | |||||||||||||||||
P O R T F O L I O S U M M A R Y | |||||||||||||||||
| Retail Market Summary............................................................................. | |||||||||||||||||
| Retail Operating Portfolio Occupancy....................................................... | |||||||||||||||||
| Top Retail Tenants..................................................................................... | |||||||||||||||||
| Retail Leasing Activity Summary................................................................ | |||||||||||||||||
| Retail Lease Expirations............................................................................. | |||||||||||||||||
| 5 | |||||||||||||||||
O T H E R I N F O R M A T I O N | |||||||||||||||||
| COVID-19 Disclosure – Tenant Resiliency and Rent Collections................ | |||||||||||||||||
| COVID-19 Disclosure – Supplemental Base Rent Reconciliations.............. | |||||||||||||||||
| Non-GAAP Financial Measures and Reconciliations.................................. | |||||||||||||||||
Retail Properties of America, Inc. | 2021 Spring Road, Suite 200 | Oak Brook, Illinois 60523 | 855.247.RPAI | www.rpai.com

RETAIL PROPERTIES OF AMERICA, INC. REPORTS
THIRD QUARTER AND YEAR TO DATE 2020 RESULTS
Oak Brook, IL – November 2, 2020 – Retail Properties of America, Inc. (NYSE: RPAI) (the “Company”) today reported financial and operating results for the quarter and nine months ended September 30, 2020.
FINANCIAL RESULTS
For the quarter ended September 30, 2020, the Company reported:
▪Cash collections as of October 26, 2020 of 84.2% of billed third quarter base rent, up from 73.6% of billed second quarter base rent;
▪Net loss attributable to common shareholders of $(2.3) million, or $(0.01) per diluted share, compared to $(28.2) million, or $(0.13) per diluted share, for the same period in 2019;
▪Funds from operations (FFO) attributable to common shareholders of $41.4 million, or $0.19 per diluted share, compared to $48.2 million, or $0.23 per diluted share, for the same period in 2019;
▪Operating funds from operations (Operating FFO) attributable to common shareholders of $44.8 million, or $0.21 per diluted share, compared to $57.0 million, or $0.27 per diluted share, for the same period in 2019; and
▪A $12.4 million decrease in lease income, equating to $0.06 per diluted share, compared to the same period in 2019, primarily driven by the impact on the Company’s business from the novel coronavirus (COVID-19) pandemic during the third quarter of 2020.
For the nine months ended September 30, 2020, the Company reported:
▪Net income attributable to common shareholders of $12.7 million, or $0.06 per diluted share, compared to $16.2 million, or $0.07 per diluted share, for the same period in 2019;
▪FFO attributable to common shareholders of $140.0 million, or $0.66 per diluted share, compared to $161.1 million, or $0.76 per diluted share, for the same period in 2019;
▪Operating FFO attributable to common shareholders of $138.4 million, or $0.65 per diluted share, compared to $171.2 million, or $0.80 per diluted share, for the same period in 2019; and
▪A $38.0 million decrease in lease income, equating to $0.18 per diluted share, compared to the same period in 2019, primarily driven by the impact on the Company’s business from the COVID-19 pandemic during the second and third quarters of 2020.
OPERATING RESULTS
For the quarter ended September 30, 2020, the Company’s portfolio results were as follows:
▪Portfolio square footage open: 96% based on gross leasable area and 95% based on annualized base rent (ABR) as of October 30, 2020;
▪12.4% decrease in same store net operating income (NOI) over the comparable period in 2019, primarily driven by the impact on the Company’s business from the COVID-19 pandemic;
n Retail Properties of America, Inc.
T: 855.247.RPAI
www.rpai.com 2021 Spring Road, Suite 200
Oak Brook, IL 60523
▪Retail portfolio occupancy: 92.2% at September 30, 2020, down 140 basis points from 93.6% at June 30, 2020 and down 150 basis points from 93.7% at September 30, 2019. Bankruptcy-related move-outs account for 120 basis points of the 140-basis point occupancy decline since June 30, 2020 and include the Company’s final remaining Pier 1 Imports, Justice, Catherines and Modell’s locations, which account for 80 basis points of the decline;
▪Retail portfolio percent leased, including leases signed but not commenced: 93.8% at September 30, 2020, down 110 basis points from 94.9% at June 30, 2020 and down 170 basis points from 95.5% at September 30, 2019. Bankruptcy-related move-outs account for 120 basis points of the 110-basis point decline in retail portfolio percent leased since June 30, 2020;
▪Total retail portfolio ABR per occupied square foot of $19.44 at September 30, 2020, nearly unchanged from $19.45 ABR per occupied square foot at June 30, 2020 and up 0.3% from $19.38 ABR per occupied square foot at September 30, 2019;
▪810,000 square feet of retail leasing transactions comprised of 105 new and renewal leases; and
▪A blended re-leasing spread of positive 2.6%, comprised of comparable cash leasing spreads of positive 3.2% on renewal leases and negative (1.2)% on new leases. Excluding one significant 14-year comparable lease renewal signed during the third quarter, the quarterly blended re-leasing spread measured positive 3.5% and comparable cash leasing spreads on renewal leases measured positive 4.4%.
For the nine months ended September 30, 2020, the Company’s portfolio results were as follows:
▪11.1% decrease in same store NOI over the comparable period in 2019, primarily driven by the impact on the Company’s business from the COVID-19 pandemic during the second and third quarters of 2020;
▪1,418,000 square feet of retail leasing transactions comprised of 253 new and renewal leases; and
▪A blended re-leasing spread of positive 2.6%, comprised of comparable cash leasing spreads of positive 4.1% on renewal leases and negative (5.3)% on new leases. Excluding one significant 14-year comparable lease renewal signed during the third quarter, the year-to-date blended re-leasing spread measured positive 3.1% and comparable cash leasing spreads on renewal leases measured positive 4.9%.
“During the quarter, we advanced our platform in significant areas, improving rent collections, progressing on tenant negotiations, publishing our inaugural corporate sustainability report and further strengthening our already robust capital structure position,” stated Steve Grimes, chief executive officer. “We look forward to building on this positive internal momentum through year-end and into 2021.”
ii
BUSINESS UPDATE
The Company delivered progress across many key aspects of the business during the quarter, including improving rent collection levels. As of October 26, 2020, the Company reported the following cash collection statistics:
| Q2 2020 base rent, updated: | 73.6 | % | |||
| July 2020 base rent, updated: | 80.5 | % | |||
| August 2020 base rent, updated: | 83.1 | % | |||
| September 2020 base rent: | 88.9 | % | |||
| Q3 2020 base rent: | 84.2 | % | |||
| October 2020 base rent: | 87.2 | % | |||
As of October 26, 2020, the Company has collected 73.6% of second quarter 2020 base rent, up from the previously reported 68.4% as of July 27, 2020. Further, the Company has continued to realize sequentially higher base rent collection levels throughout the third quarter of 2020, culminating in a September 2020 base rent collection rate of 88.9% as of October 26, 2020. In addition, the Company has collected 87.2% of October 2020 base rent as of October 26, 2020, which measures ahead of the daily collection pace for September 2020.
The Company’s portfolio ABR benefits from a composition of 38% from essential uses and office, including 9% from grocery/warehouse clubs as well as 7% from office tenants generally located in suburban locations above the Company’s first floor retail footprint. The Company continues to assist tenants’ efforts to operate safely and effectively in the current environment through portfolio-wide initiatives such as the enhancement of curbside pickup offerings, onsite signage, expansion of outdoor dining capacity as well as property-specific endeavors, including outdoor event marketing, digital campaigns and delivery and to-go promotions.
The Company continues to negotiate and sign lease amendments with certain tenants in the wake of the adverse impacts of the COVID-19 pandemic, as shown in the following table, with amounts reported as of October 26, 2020:
| Q3 2020 | Q2 2020 | ||||||||||
| Billed base rent collected | 84.2 | % | 73.6 | % | |||||||
| Security deposits applied | 0.1 | % | 2.7 | % | |||||||
| Executed lease amendments | 7.4 | % | 11.9 | % | |||||||
In-process lease amendments(1) | 1.6 | % | 5.3 | % | |||||||
| Total billed base rent addressed | 93.3 | % | 93.5 | % | |||||||
(1)The Company can make no assurances that the in-process lease amendments will ultimately be executed on the terms negotiated or at all.
BALANCE SHEET AND CAPITAL MARKETS ACTIVITY
The Company engaged in multiple transactions to enhance balance sheet strength and financial flexibility during the quarter. As previously announced, the Company, in underwritten public offerings, issued an additional $100.0 million aggregate principal amount of its 4.00% senior unsecured notes due 2025 in a reopening on July 21, 2020 and $400.0 million aggregate principal amount of its 4.75% senior unsecured notes due 2030 in a new issuance on August 25, 2020.
iii
The Company redeployed the vast majority of the related net proceeds from these public issuances to repay the principal of existing indebtedness as follows:
▪$135.0 million – repaid the full amount outstanding as of June 30, 2020 under the Company’s $850.0 million unsecured revolving line of credit;
▪$250.0 million – prepaid the Company’s term loan due January 2021 and terminated the related interest rate swaps that had effectively fixed this variable rate loan; and
▪$100.0 million – prepaid the Company’s private placement notes due June 2021.
Following these activities, the Company holds no debt maturities until 2022, a fully undrawn $850.0 million unsecured revolving line of credit and approximately $877.1 million in total available liquidity as of September 30, 2020, up $149.8 million from $727.3 million as of June 30, 2020.
In total, the Company had $1.8 billion of gross consolidated indebtedness with a weighted average contractual interest rate of 4.17% and a weighted average maturity of 6.1 years as of September 30, 2020, up 2.0 years from 4.1 years as of June 30, 2020. The Company continues to benefit from substantial headroom relative to its debt covenants, including a debt service coverage ratio of 3.7x, well in excess of the 1.5x requirement under its debt agreements.
DIVIDEND
As previously announced on September 8, 2020, the Company’s board of directors declared a third quarter dividend for its outstanding Class A common stock of $0.05 per common share. The Company’s board of directors had previously suspended the dividend to preserve and enhance liquidity and capital positioning. The dividend of $0.05 per common share was paid on October 9, 2020, to Class A common stockholders of record on September 25, 2020.
The Company’s board of directors will continue to monitor financial performance and declare additional dividend payments to at least cover the Company’s minimum taxable distribution requirements, aiming to grow this initial quarterly dividend amount over time as conditions further normalize. Year to date, including dividends paid in January 2020, April 2020, and October 2020, the Company has paid $81.6 million in aggregate dividends.
INVESTMENT ACTIVITY
Expansions and Redevelopments
The Company continues to make progress on the execution of its active expansion and redevelopment projects.
Active Projects
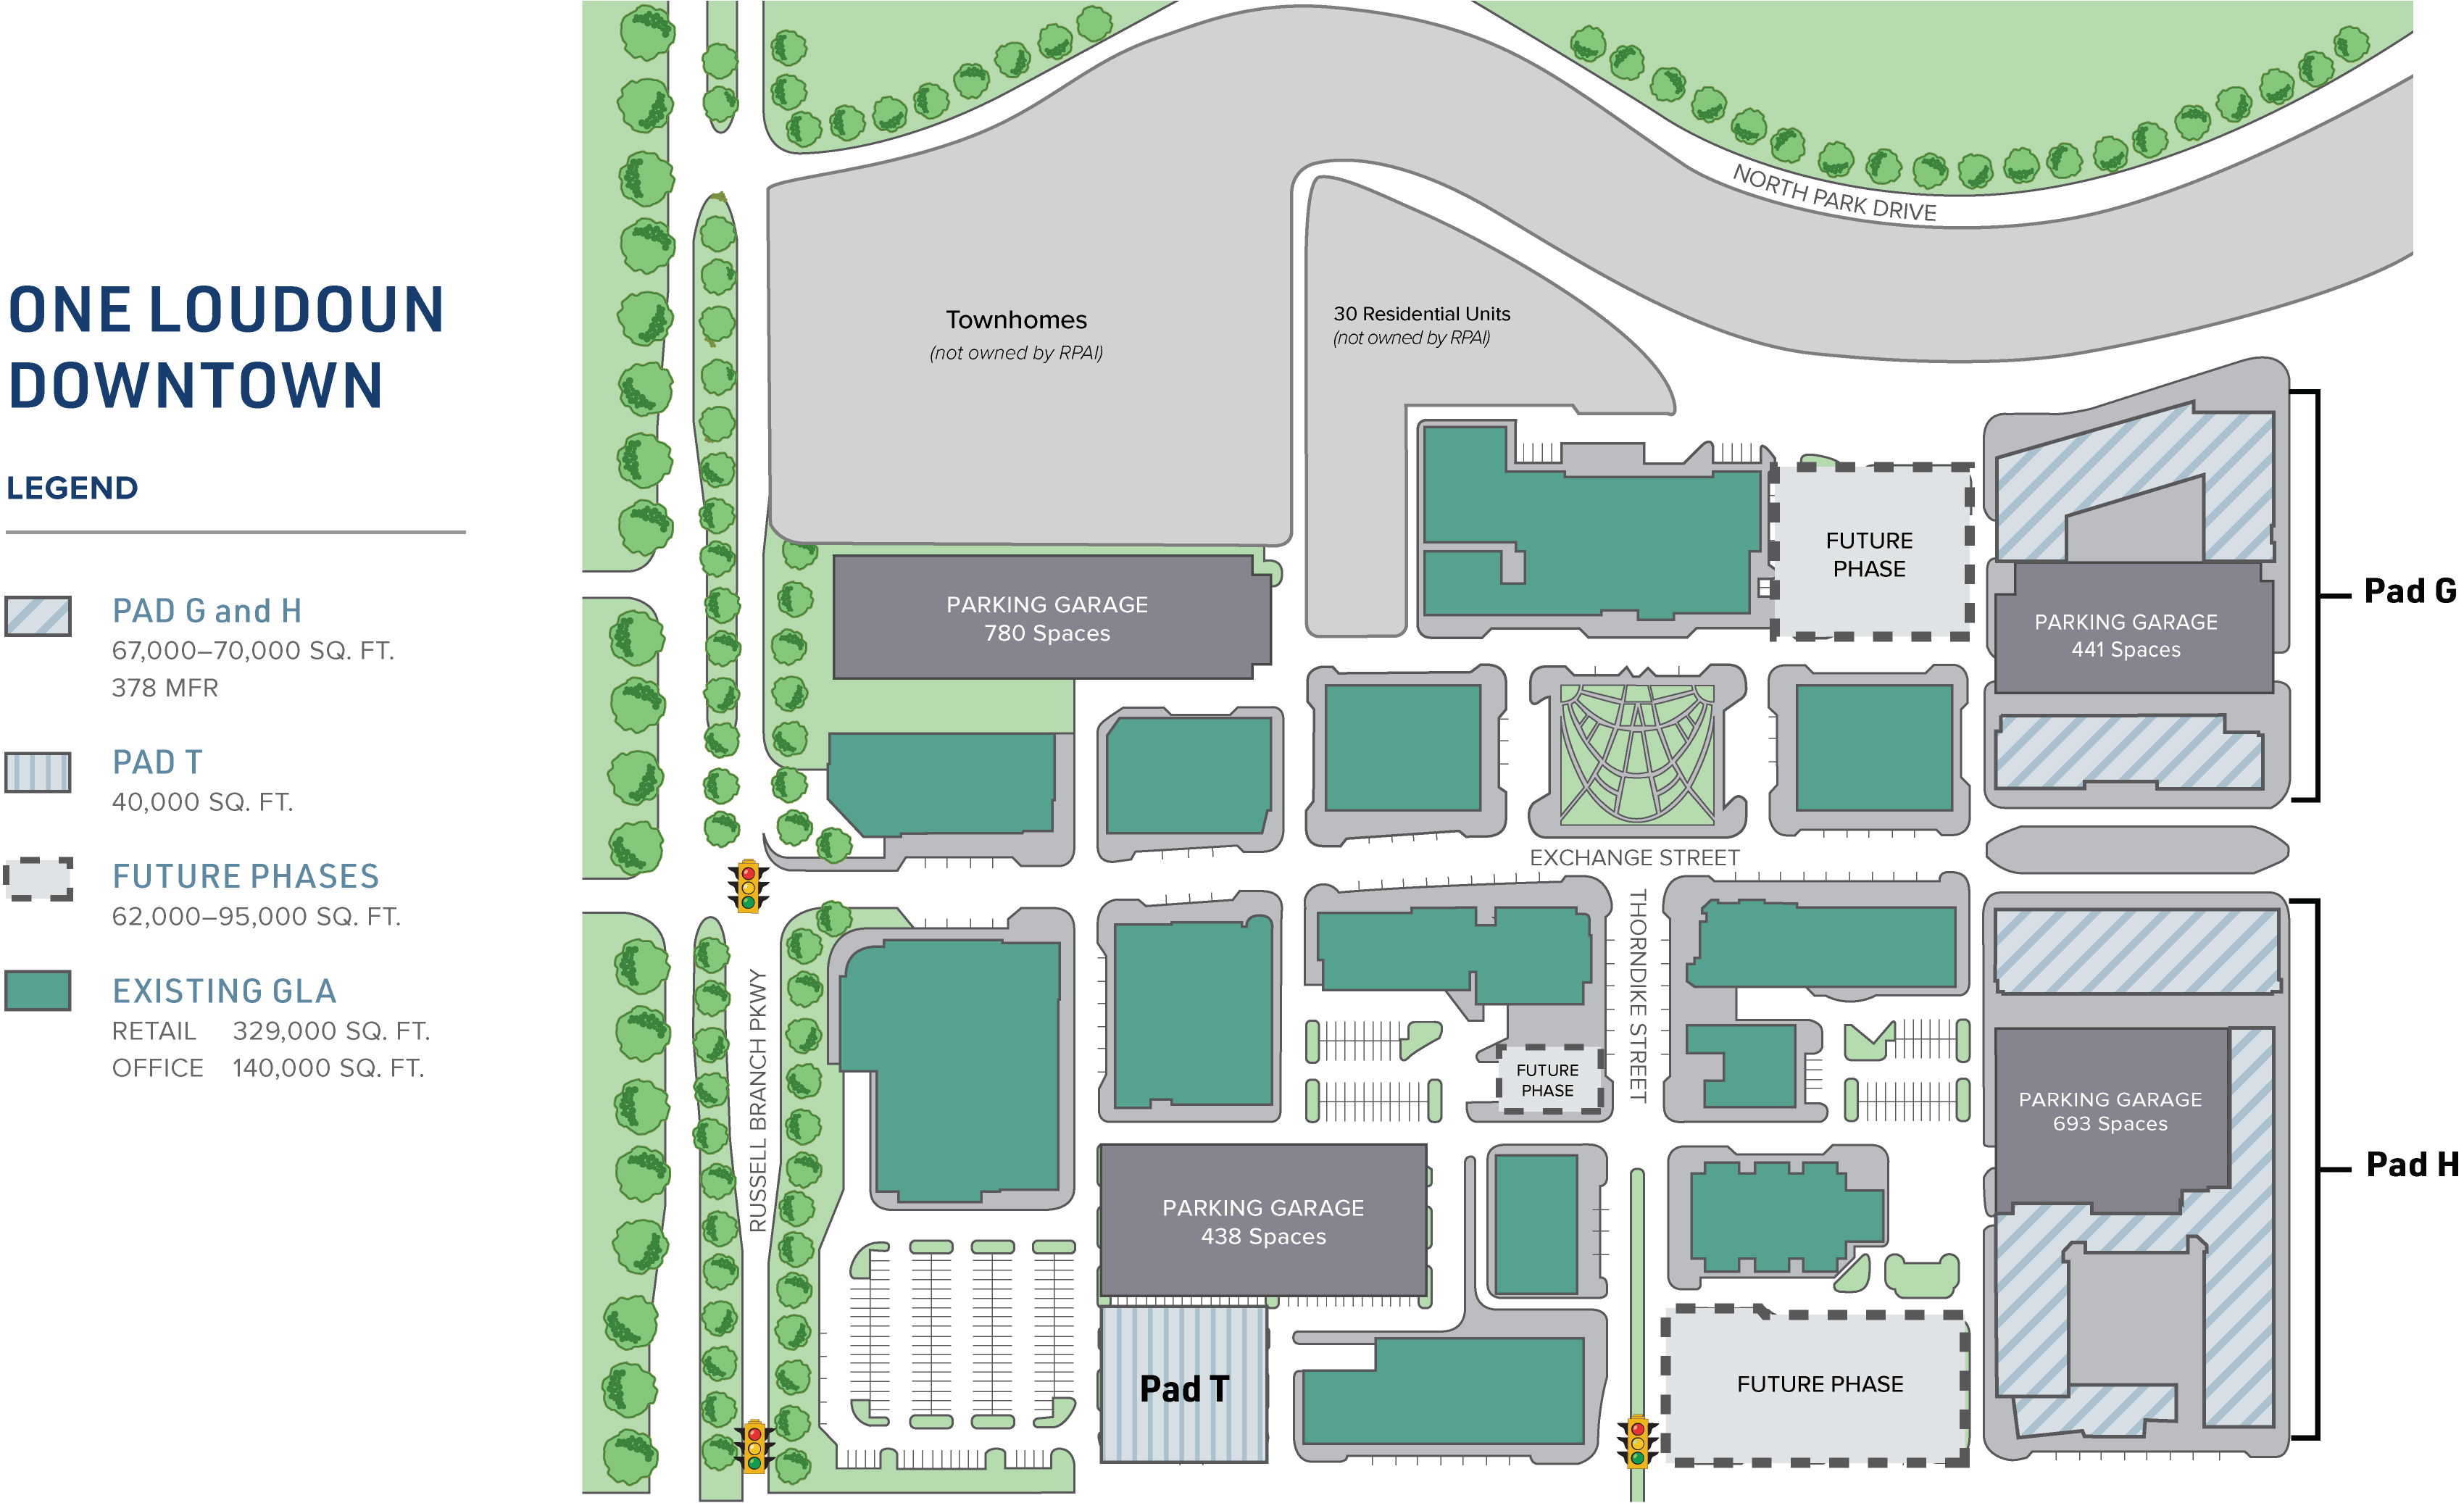
One Loudoun Downtown
During the quarter, the Company and KETTLER, its joint venture partner for the multi-family component of the mixed-use expansion of Pads G & H at its One Loudoun Downtown multi-tenant retail operating property, advanced exterior skin work, unit drywall installation and unit finishes, including cabinets, tile, and plumbing fixtures for Pad G’s multi-family residential units. For Pad G’s office component, the Company and KETTLER completed construction of the building structure and roof and advanced the installation of storefronts and windows as well as internal mechanical systems. In addition, the Company and KETTLER advanced wood frame construction, unit mechanical rough-ins and exterior skin work as well as initiated unit drywall installation for the multi-family residential units of Pad H. In the aggregate, this expansion project, located in the Washington, D.C. metropolitan statistical area (MSA), consists of up to 70,000 square feet of retail and office commercial space and 378 one- and two-bedroom multi-family rental units, which will become One Loudoun’s first apartment community, Vyne, which is anticipated to open in late spring 2021. The expansion project complements and enhances the
iv
Company’s approximately 469,000 square foot mixed-use community anchor asset, One Loudoun Downtown.
Circle East
During the quarter, the Company signed a lease with an experience-based, growing national salon for in-line space at its 80,000 square foot Circle East mixed-use project located in Towson, MD within the Baltimore MSA. Subsequent to quarter end, the Company signed one additional lease for in-line space, bringing the project to 15% leased. The Company is engaged in lease negotiations or holds letters of intent for an additional 34% of the project’s square footage. The Company continues to advance construction for the previously announced Shake Shack and Ethan Allen sites that will anchor Circle East.
Other Projects
Subsequent to quarter end, the Company delivered space for a grocer anchor tenant at The Shoppes at Quarterfield. Construction continues at the balance of that reconfiguration project as well as the single-tenant pad development at Southlake Town Square.
WEBCAST AND CONFERENCE CALL INFORMATION
The Company’s management team will hold a webcast on Tuesday, November 3, 2020 at 11:00 AM (ET), to discuss its quarterly financial results and operating performance, as well as business highlights and outlook. In addition, the Company may discuss business and financial developments and trends and other matters affecting the Company, some of which may not have been previously disclosed.
A live webcast will be available online on the Company’s website at www.rpai.com in the INVEST section. A replay of the webcast will be available. To listen to the replay, please go to www.rpai.com in the INVEST section of the website and follow the instructions.
The conference call can be accessed by dialing (877) 705-6003 or (201) 493-6725 for international participants. Please dial in at least ten minutes prior to the start of the call to register. A replay of the call will be available from 2:00 PM (ET) on November 3, 2020 until midnight (ET) on November 17, 2020. The replay can be accessed by dialing (844) 512-2921 or (412) 317-6671 for international callers and entering pin number 13708658.
SUPPLEMENTAL INFORMATION
The Company has posted supplemental financial and operating information and other data in the INVEST section of its website.
ABOUT RPAI
Retail Properties of America, Inc. is a REIT that owns and operates high quality, strategically located open-air shopping centers, including properties with a mixed-use component. As of September 30, 2020, the Company owned 102 retail operating properties in the United States representing 20.0 million square feet. The Company is publicly traded on the New York Stock Exchange under the ticker symbol RPAI. Additional information about the Company is available at www.rpai.com.
SAFE HARBOR LANGUAGE
The statements and certain other information contained in this press release, which can be identified by the use of forward-looking terminology such as “believes,” “expects,” “may,” “should,” “intends,” “plans,” “estimates” or “anticipates” and variations of such words or similar expressions or the negative of such words, constitute “forward-looking statements” within the meaning of Section 27A of the Securities Act of 1933, as amended, and Section 21E of the Securities Exchange Act of 1934, as amended, and are subject to the safe harbors created thereby. These forward-looking statements reflect the Company’s current views about its plans, intentions, expectations, strategies and prospects, which are based on the information currently available to the Company and on assumptions it has
v
made. Although the Company believes that its plans, intentions, expectations, strategies and prospects as reflected in or suggested by those forward-looking statements are reasonable, the Company can give no assurance that such plans, intentions, expectations or strategies will be attained or achieved. Furthermore, these forward-looking statements should be considered as subject to the many risks and uncertainties that exist in the Company’s operations and business environment. Such risks and uncertainties could cause actual results to differ materially from those projected. These uncertainties include, but are not limited to, economic, business and financial conditions, and changes in the Company’s industry and changes in the real estate markets in particular, economic and other developments in markets where the Company has a high concentration of properties, the Company’s business strategy, the Company’s projected operating results, rental rates and/or vacancy rates, frequency and magnitude of defaults on, early terminations of or non-renewal of leases by tenants, bankruptcy, insolvency or general downturn in the business of a major tenant or a significant number of smaller tenants, adverse impact of e-commerce developments and shifting consumer retail behavior on tenants, interest rates or operating costs, the discontinuation of London Interbank Offered Rate (LIBOR), real estate and zoning laws and changes in real property tax rates, real estate valuations, the Company’s leverage, the Company’s ability to generate sufficient cash flows to service outstanding indebtedness and make distributions to shareholders, changes in the dividend policy for the Company’s Class A common stock and its ability to resume the payment of dividends at past levels, the Company’s ability to obtain necessary outside financing, the availability, terms and deployment of capital, general volatility of the capital and credit markets and the market price of the Company’s Class A common stock, risks generally associated with real estate acquisitions and dispositions, including the Company’s ability to identify and pursue acquisition and disposition opportunities, risks generally associated with redevelopment, including the impact of construction delays and cost overruns and related impact on the Company’s estimated investments in such redevelopment, the Company’s ability to lease redeveloped space, the Company’s ability to identify and pursue redevelopment opportunities and the risk that it takes longer than expected for development assets to stabilize or that the Company does not achieve its estimated returns on such investments, the Company’s ability to enter into new leases or renew leases on favorable terms, pandemics or other public health crises, such as the COVID-19 pandemic, and the related impact on (i) the Company’s ability to manage its properties, finance its operations and perform necessary administrative and reporting functions and (ii) the ability of the Company’s tenants to operate their businesses, generate sales and meet their financial obligations, including the obligation to pay rent and other charges as specified in their leases, the Company’s ability to create long-term shareholder value, regulatory changes and other risk factors, including those detailed in the sections of the Company’s most recent Forms 10-K and 10-Q filed with the SEC titled “Risk Factors,” which you should interpret as heightened as a result of the numerous and ongoing adverse impacts of COVID-19. The extent to which COVID-19 impacts the Company and its tenants will depend on future developments, which are highly uncertain and cannot be predicted with confidence, including the scope, severity and duration of the pandemic, the actions taken to contain the pandemic or mitigate its impact, and the direct and indirect economic effects of the pandemic and containment measures, among others. The Company assumes no obligation to update publicly any forward-looking statements, whether as a result of new information, future events or otherwise.
NON-GAAP FINANCIAL MEASURES
As defined by the National Association of Real Estate Investment Trusts (NAREIT), an industry trade group, Funds From Operations (FFO) means net income computed in accordance with generally accepted accounting principles (GAAP), excluding (i) depreciation and amortization related to real estate, (ii) gains from sales of real estate assets, (iii) gains and losses from change in control and (iv) impairment write-downs of real estate assets and investments in entities directly attributable to decreases in the value of real estate held by the entity. The Company has adopted the NAREIT definition in its computation of FFO attributable to common shareholders. The Company believes that, subject to the following limitations, FFO attributable to common shareholders provides a basis for comparing its performance and operations to those of other real estate investment trusts (REITs). The Company believes that FFO attributable to common shareholders, which is a supplemental non-GAAP financial measure, provides an additional and useful means to assess the operating performance of REITs. FFO attributable to common shareholders does not represent an alternative to (i) “Net income” or “Net income attributable to common shareholders” as an indicator of the Company’s financial performance, or (ii) “Cash flows from operating activities” in accordance with GAAP as a measure of the Company’s capacity to fund cash needs, including the payment of dividends.
The Company also reports Operating FFO attributable to common shareholders, which is defined as FFO attributable to common shareholders excluding the impact of discrete non-operating transactions and other events which the Company does not consider representative of the comparable operating results of its real estate operating portfolio, which is its core business platform. Specific examples of discrete non-operating transactions and other events include, but are not limited to, the impact on earnings from gains or losses associated with the early extinguishment of debt or other liabilities, litigation involving the Company, including gains recognized as a result of settlement and costs to engage outside counsel related to litigation with former tenants, the impact on earnings from executive separation and the excess of redemption value over carrying value of preferred stock redemption, which are not otherwise adjusted in the Company’s calculation of FFO attributable to common shareholders. The Company believes that Operating FFO attributable to common shareholders, which is a supplemental non-GAAP financial measure,
vi
provides an additional and useful means to assess the operating performance of REITs. Operating FFO attributable to common shareholders does not represent an alternative to (i) “Net income” or “Net income attributable to common shareholders” as an indicator of the Company’s financial performance, or (ii) “Cash flows from operating activities” in accordance with GAAP as a measure of the Company’s capacity to fund cash needs, including the payment of dividends. Comparison of the Company’s presentation of Operating FFO attributable to common shareholders to similarly titled measures for other REITs may not necessarily be meaningful due to possible differences in definition and application by such REITs.
The Company also reports Net Operating Income (NOI), which it defines as all revenues other than (i) straight-line rental income (non-cash), (ii) amortization of lease inducements, (iii) amortization of acquired above and below market lease intangibles and (iv) lease termination fee income, less real estate taxes and all operating expenses other than lease termination fee expense and non-cash ground rent expense, which is comprised of amortization of right-of-use lease assets and amortization of lease liabilities. NOI consists of Same Store NOI and NOI from Other Investment Properties. Same Store NOI represents NOI from the Company’s same store portfolio consisting of 101 retail operating properties acquired or placed in service and stabilized prior to January 1, 2019. NOI from Other Investment Properties represents NOI primarily from (i) properties acquired or placed in service during 2019 and 2020, (ii) the multi-family rental units at Plaza del Lago, a redevelopment project that was placed in service during 2019, (iii) Circle East, which is in active redevelopment, (iv) One Loudoun Downtown – Pads G & H, which are in active development, (v) Carillon, a redevelopment project where the Company halted plans for vertical construction during the three months ended March 31, 2020 in response to current macroeconomic conditions due to the impact of the COVID-19 pandemic. As of September 30, 2020, the Company had completed the current scope of site work preparation at the property in anticipation of future vertical development at the site, (vi) The Shoppes at Quarterfield, which is in active redevelopment, (vii) properties that were sold or held for sale during 2019 and 2020, and (viii) the net income from the Company’s wholly-owned captive insurance company. The Company believes that NOI, Same Store NOI and NOI from Other Investment Properties, which are supplemental non-GAAP financial measures, provide an additional and useful operating perspective not immediately apparent from “Net income” or “Net income attributable to common shareholders” in accordance with GAAP. The Company uses these measures to evaluate its performance on a property-by-property basis because they allow management to evaluate the impact that factors such as lease structure, lease rates and tenant base have on the Company’s operating results. NOI, Same Store NOI and NOI from Other Investment Properties do not represent alternatives to “Net income” or “Net income attributable to common shareholders” in accordance with GAAP as indicators of the Company’s financial performance. Comparison of the Company’s presentation of NOI, Same Store NOI and NOI from Other Investment Properties to similarly titled measures for other REITs may not necessarily be meaningful due to possible differences in definition and application by such REITs.
CONTACT INFORMATION
Michael Gaiden
Vice President – Capital Markets and Investor Relations
Retail Properties of America, Inc.
(630) 634-4233
vii
Retail Properties of America, Inc.
Condensed Consolidated Balance Sheets
(amounts in thousands, except par value amounts)
(unaudited)
| September 30, 2020 | December 31, 2019 | ||||||||||
| Assets | |||||||||||
| Investment properties: | |||||||||||
| Land | $ | 1,075,037 | $ | 1,021,829 | |||||||
| Building and other improvements | 3,576,289 | 3,544,582 | |||||||||
| Developments in progress | 168,365 | 113,353 | |||||||||
| 4,819,691 | 4,679,764 | ||||||||||
| Less: accumulated depreciation | (1,482,583) | (1,383,274) | |||||||||
Net investment properties (includes $59,678 and $12,445 from consolidated variable interest entities, respectively) | 3,337,108 | 3,296,490 | |||||||||
| Cash and cash equivalents | 27,371 | 9,989 | |||||||||
| Accounts and notes receivable, net | 86,589 | 73,832 | |||||||||
| Acquired lease intangible assets, net | 70,837 | 79,832 | |||||||||
| Right-of-use lease assets | 43,234 | 50,241 | |||||||||
Other assets, net (includes $336 and $164 from consolidated variable interest entities, respectively) | 69,678 | 75,978 | |||||||||
| Total assets | $ | 3,634,817 | $ | 3,586,362 | |||||||
| Liabilities and Equity | |||||||||||
| Liabilities: | |||||||||||
Mortgages payable, net (includes unamortized discount of $(461) and $(493), respectively, and unamortized capitalized loan fees of $(208) and $(256), respectively) | $ | 92,075 | $ | 94,155 | |||||||
Unsecured notes payable, net (includes unamortized discount of $(6,687) and $(616), respectively, and unamortized capitalized loan fees of $(7,834) and $(3,137), respectively) | 1,185,479 | 796,247 | |||||||||
Unsecured term loans, net (includes unamortized capitalized loan fees of $(2,609) and $(3,477), respectively) | 467,391 | 716,523 | |||||||||
Unsecured revolving line of credit | — | 18,000 | |||||||||
Accounts payable and accrued expenses | 69,036 | 78,902 | |||||||||
| Distributions payable | 10,713 | 35,387 | |||||||||
| Acquired lease intangible liabilities, net | 63,591 | 63,578 | |||||||||
| Lease liabilities | 84,898 | 91,129 | |||||||||
Other liabilities (includes $7,361 and $1,707 from consolidated variable interest entities, respectively) | 74,357 | 56,368 | |||||||||
| Total liabilities | 2,047,540 | 1,950,289 | |||||||||
| Commitments and contingencies | |||||||||||
| Equity: | |||||||||||
Preferred stock, $0.001 par value, 10,000 shares authorized, none issued or outstanding | — | — | |||||||||
Class A common stock, $0.001 par value, 475,000 shares authorized, 214,253 and 213,600 shares issued and outstanding as of September 30, 2020 and December 31, 2019, respectively | 214 | 214 | |||||||||
| Additional paid-in capital | 4,517,996 | 4,510,484 | |||||||||
| Accumulated distributions in excess of earnings | (2,899,388) | (2,865,933) | |||||||||
| Accumulated other comprehensive loss | (36,052) | (12,288) | |||||||||
| Total shareholders’ equity | 1,582,770 | 1,632,477 | |||||||||
| Noncontrolling interests | 4,507 | 3,596 | |||||||||
| Total equity | 1,587,277 | 1,636,073 | |||||||||
| Total liabilities and equity | $ | 3,634,817 | $ | 3,586,362 | |||||||
| 3rd Quarter 2020 Supplemental Information | 1 | |||||||
Retail Properties of America, Inc.
Condensed Consolidated Statements of Operations
(amounts in thousands, except per share amounts)
(unaudited)
| Three Months Ended September 30, | Nine Months Ended September 30, | ||||||||||||||||||||||
| 2020 | 2019 | 2020 | 2019 | ||||||||||||||||||||
| Revenues: | |||||||||||||||||||||||
| Lease income | $ | 107,358 | $ | 119,717 | $ | 322,856 | $ | 360,869 | |||||||||||||||
| Expenses: | |||||||||||||||||||||||
| Operating expenses | 15,620 | 16,088 | 46,877 | 50,903 | |||||||||||||||||||
| Real estate taxes | 19,720 | 18,583 | 56,169 | 55,520 | |||||||||||||||||||
| Depreciation and amortization | 41,741 | 67,460 | 125,669 | 153,609 | |||||||||||||||||||
| Provision for impairment of investment properties | 2,279 | 11,177 | 2,625 | 11,177 | |||||||||||||||||||
| General and administrative expenses | 8,514 | 10,334 | 26,170 | 30,186 | |||||||||||||||||||
| Total expenses | 87,874 | 123,642 | 257,510 | 301,395 | |||||||||||||||||||
| Other (expense) income: | |||||||||||||||||||||||
| Interest expense | (21,941) | (25,084) | (58,347) | (59,877) | |||||||||||||||||||
| Gain on sales of investment properties | — | 1,969 | — | 18,872 | |||||||||||||||||||
| Gain on litigation settlement | — | — | 6,100 | — | |||||||||||||||||||
| Other income (expense), net | 169 | (1,113) | (377) | (2,244) | |||||||||||||||||||
| Net (loss) income | (2,288) | (28,153) | 12,722 | 16,225 | |||||||||||||||||||
| Net income attributable to noncontrolling interests | — | — | — | — | |||||||||||||||||||
| Net (loss) income attributable to common shareholders | $ | (2,288) | $ | (28,153) | $ | 12,722 | $ | 16,225 | |||||||||||||||
| (Loss) earnings per common share – basic and diluted: | |||||||||||||||||||||||
| Net (loss) income per common share attributable to common shareholders | $ | (0.01) | $ | (0.13) | $ | 0.06 | $ | 0.07 | |||||||||||||||
| Weighted average number of common shares outstanding – basic | 213,385 | 212,995 | 213,312 | 212,932 | |||||||||||||||||||
| Weighted average number of common shares outstanding – diluted | 213,385 | 212,995 | 213,312 | 213,056 | |||||||||||||||||||
| 3rd Quarter 2020 Supplemental Information | 2 | |||||||
Retail Properties of America, Inc.
Funds From Operations (FFO) Attributable to Common Shareholders,
Operating FFO Attributable to Common Shareholders and Additional Information
(dollar amounts in thousands, except per share amounts)
(unaudited)
| FFO attributable to common shareholders and Operating FFO attributable to common shareholders (a) | |||||||||||||||||||||||
| Three Months Ended September 30, | Nine Months Ended September 30, | ||||||||||||||||||||||
| 2020 | 2019 | 2020 | 2019 | ||||||||||||||||||||
| Net (loss) income attributable to common shareholders | $ | (2,288) | $ | (28,153) | $ | 12,722 | $ | 16,225 | |||||||||||||||
| Depreciation and amortization of real estate | 41,397 | 67,116 | 124,657 | 152,560 | |||||||||||||||||||
| Provision for impairment of investment properties | 2,279 | 11,177 | 2,625 | 11,177 | |||||||||||||||||||
| Gain on sales of investment properties | — | (1,969) | — | (18,872) | |||||||||||||||||||
| FFO attributable to common shareholders | $ | 41,388 | $ | 48,171 | $ | 140,004 | $ | 161,090 | |||||||||||||||
FFO attributable to common shareholders per common share outstanding – diluted | $ | 0.19 | $ | 0.23 | $ | 0.66 | $ | 0.76 | |||||||||||||||
| FFO attributable to common shareholders | $ | 41,388 | $ | 48,171 | $ | 140,004 | $ | 161,090 | |||||||||||||||
| Impact on earnings from the early extinguishment of debt, net | 3,464 | 7,581 | 3,464 | 7,581 | |||||||||||||||||||
| Gain on litigation settlement | — | — | (6,100) | — | |||||||||||||||||||
| Other (b) | (15) | 1,241 | 996 | 2,521 | |||||||||||||||||||
| Operating FFO attributable to common shareholders | $ | 44,837 | $ | 56,993 | $ | 138,364 | $ | 171,192 | |||||||||||||||
Operating FFO attributable to common shareholders per common share outstanding – diluted | $ | 0.21 | $ | 0.27 | $ | 0.65 | $ | 0.80 | |||||||||||||||
| Weighted average number of common shares outstanding – diluted | 213,385 | 212,995 | 213,312 | 213,056 | |||||||||||||||||||
| Dividends declared per common share | $ | 0.05 | $ | 0.165625 | $ | 0.215625 | $ | 0.496875 | |||||||||||||||
| Additional Information (c) | |||||||||||||||||||||||
| Lease-related expenditures (d) | |||||||||||||||||||||||
| Same store | $ | 7,211 | $ | 8,608 | $ | 26,822 | $ | 28,196 | |||||||||||||||
| Other investment properties | $ | 2 | $ | 16 | $ | 19 | $ | 33 | |||||||||||||||
| Capital expenditures (e) | |||||||||||||||||||||||
| Same store | $ | 7,552 | $ | 11,737 | $ | 20,908 | $ | 31,596 | |||||||||||||||
| Other investment properties | $ | 734 | $ | 565 | $ | 2,380 | $ | 882 | |||||||||||||||
| Predevelopment costs | $ | 109 | $ | 871 | $ | 613 | $ | 6,144 | |||||||||||||||
| Straight-line rental income, net (f) | $ | (269) | $ | 581 | $ | (1,212) | $ | 2,697 | |||||||||||||||
Amortization of above and below market lease intangibles and lease inducements | $ | 423 | $ | 1,127 | $ | 2,323 | $ | 3,557 | |||||||||||||||
| Non-cash ground rent expense, net | $ | 212 | $ | 333 | $ | 757 | $ | 1,023 | |||||||||||||||
Adjusted EBITDAre (a) | $ | 63,673 | $ | 73,599 | $ | 193,263 | $ | 222,016 | |||||||||||||||
(a)Refer to pages 21 – 24 for definitions and reconciliations related to FFO attributable to common shareholders, Operating FFO attributable to common shareholders and Adjusted EBITDAre.
(b)Primarily consists of the impact on earnings from litigation involving the Company, including costs to engage outside counsel related to litigation with former tenants, which is included within “Other income (expense), net” in the condensed consolidated statements of operations.
(c)The same store portfolio consists of 101 retail operating properties. Refer to pages 21 – 24 for definitions and reconciliations of non-GAAP financial measures.
(d)Consists of payments for tenant improvements, lease commissions and lease inducements and excludes active development projects, which are included within “Developments in progress” in the condensed consolidated balance sheets.
(e)Capital expenditures consist of payments for building, site and other improvements, net of anticipated recoveries, and exclude active development projects, which are included within “Developments in progress” in the condensed consolidated balance sheets. Predevelopment costs consist of payments related to future redevelopment and expansion projects incurred before each project is considered active and are included within “Other assets, net” in the condensed consolidated balance sheets.
(f)Includes changes in allowances for doubtful straight-line receivables of $(3,089) and $(710) for the three months ended September 30, 2020 and 2019, respectively, and $(5,760) and $(1,524) for the nine months ended September 30, 2020 and 2019, respectively. As of September 30, 2020, approximately 10.2% of the Company’s tenants, based on annualized base rent (ABR) of the operating portfolio, are being accounted for on the cash basis of accounting.
| 3rd Quarter 2020 Supplemental Information | 3 | |||||||
Retail Properties of America, Inc.
Supplemental Financial Statement Detail
(amounts in thousands)
(unaudited)
| Supplemental Balance Sheet Detail | September 30, 2020 | December 31, 2019 | |||||||||
| Developments in Progress | |||||||||||
| Active developments/redevelopments and Carillon (a) | $ | 142,915 | $ | 87,903 | |||||||
| Land held for future development | 25,450 | 25,450 | |||||||||
| Total | $ | 168,365 | $ | 113,353 | |||||||
| Accounts and Notes Receivable, Net | |||||||||||
| Accounts and notes receivable, net (b) | $ | 35,592 | $ | 21,781 | |||||||
| Straight-line receivables, net | 50,997 | 52,051 | |||||||||
| Total | $ | 86,589 | $ | 73,832 | |||||||
| Other Assets, Net | |||||||||||
| Deferred costs, net | $ | 37,786 | $ | 39,636 | |||||||
| Restricted cash (c) | 4,457 | 4,458 | |||||||||
| Other assets, net | 27,435 | 31,884 | |||||||||
| Total | $ | 69,678 | $ | 75,978 | |||||||
| Other Liabilities | |||||||||||
| Unearned income | $ | 14,781 | $ | 20,651 | |||||||
| Fair value of derivatives | 34,804 | 12,288 | |||||||||
| Other liabilities | 24,772 | 23,429 | |||||||||
| Total | $ | 74,357 | $ | 56,368 | |||||||
| Supplemental Statement of Operations Detail | |||||||||||||||||||||||
| Three Months Ended September 30, | Nine Months Ended September 30, | ||||||||||||||||||||||
| 2020 | 2019 | 2020 | 2019 | ||||||||||||||||||||
| Lease Income | |||||||||||||||||||||||
| Base rent (d) (e) | $ | 83,871 | $ | 89,754 | $ | 264,974 | $ | 267,823 | |||||||||||||||
| Percentage and specialty rent | 488 | 610 | 1,812 | 2,612 | |||||||||||||||||||
| Tenant recoveries (e) | 26,429 | 26,323 | 75,994 | 79,029 | |||||||||||||||||||
| Lease termination fee income | 223 | 331 | 599 | 1,751 | |||||||||||||||||||
| Other lease-related income | 1,232 | 1,560 | 3,781 | 4,446 | |||||||||||||||||||
| Uncollectible lease income, net (f) | (5,039) | (569) | (25,415) | (1,046) | |||||||||||||||||||
| Straight-line rental income, net (g) | (269) | 581 | (1,212) | 2,697 | |||||||||||||||||||
Amortization of above and below market lease intangibles and lease inducements | 423 | 1,127 | 2,323 | 3,557 | |||||||||||||||||||
| Total | $ | 107,358 | $ | 119,717 | $ | 322,856 | $ | 360,869 | |||||||||||||||
| Operating Expense Supplemental Information | |||||||||||||||||||||||
| Non-cash ground rent expense, net | $ | 212 | $ | 333 | $ | 757 | $ | 1,023 | |||||||||||||||
| General and Administrative Expense Supplemental Information | |||||||||||||||||||||||
| Non-cash amortization of stock-based compensation | $ | 2,280 | $ | 1,849 | $ | 6,734 | $ | 5,672 | |||||||||||||||
| Additional Supplemental Information | |||||||||||||||||||||||
| Capitalized compensation costs – development and capital projects | $ | 951 | $ | 1,045 | $ | 2,919 | $ | 3,070 | |||||||||||||||
| Capitalized internal leasing incentives | $ | 66 | $ | 111 | $ | 168 | $ | 247 | |||||||||||||||
| Capitalized interest | $ | 804 | $ | 570 | $ | 2,325 | $ | 940 | |||||||||||||||
(a)As of September 30, 2020, the Company has active redevelopments at Circle East, One Loudoun Downtown, The Shoppes at Quarterfield and Southlake Town Square. See page 9 for further details.
(b)Amount as of September 30, 2020 includes $11,696 representing deferrals, both signed and agreed in principle, net of related amounts reserved.
(c)Consists of funds restricted through lender or other agreements.
(d)Refer to page 20 for novel coronavirus (COVID-19) supplemental base rent reconciliations for the three months ended September 30, 2020. Amounts for the nine months ended September 30, 2020 have been presented on a consistent basis as the three months ended September 30, 2020 presentation.
(e)Base rent and tenant recoveries for the three and nine months ended September 30, 2020 are presented gross of any uncollected amounts related to cash-basis tenants. Such uncollected amounts are reflected within “Uncollectible lease income, net.”
(f)Uncollectible lease income, net is comprised of (i) uncollected amounts related to tenants being accounted for on the cash basis of accounting of $3,869 and $11,938 for the three and nine months ended September 30, 2020, respectively, (ii) a reserve, which includes the estimated impact for lease concession agreements that have not yet been executed of $4,517 for the three and nine months ended September 30, 2020, and other general reserve amounts, and (iii) the reclassification of amounts related to lease concession agreements that were executed during the current period and treated a negative variable lease adjustments, however were agreed in principle in the prior quarter of $(4,381) for the three months ended September 30, 2020.
(g)Includes changes in allowances for doubtful straight-line receivables of $(3,089) and $(710) for the three months ended September 30, 2020 and 2019, respectively, and $(5,760) and $(1,524) for the nine months ended September 30, 2020 and 2019, respectively. As of September 30, 2020, approximately 10.2% of the Company’s tenants, based on ABR of the operating portfolio, are being accounted for on the cash basis of accounting.
| 3rd Quarter 2020 Supplemental Information | 4 | |||||||
Retail Properties of America, Inc.
Same Store Net Operating Income (NOI)
(dollar amounts in thousands)
(unaudited)
| Same store portfolio (a) | |||||||||||||||||
| Based on Same store portfolio as of September 30, 2020 | |||||||||||||||||
| 2020 | 2019 | Change | |||||||||||||||
| Number of retail operating properties in same store portfolio | 101 | 101 | — | ||||||||||||||
| Occupancy | 92.2 | % | 93.6 | % | (1.4) | % | |||||||||||
| Percent leased (b) | 93.7 | % | 95.5 | % | (1.8) | % | |||||||||||
| Annualized base rent (ABR) per occupied square foot | $ | 19.52 | $ | 19.38 | 0.7 | % | |||||||||||
| Same Store NOI (c) | |||||||||||||||||||||||||||||||||||
| Three Months Ended September 30, | Nine Months Ended September 30, | ||||||||||||||||||||||||||||||||||
| 2020 | 2019 | Change | 2020 | 2019 | Change | ||||||||||||||||||||||||||||||
| Base rent (d) (e) | $ | 82,459 | $ | 88,084 | $ | 260,603 | $ | 261,757 | |||||||||||||||||||||||||||
| Percentage and specialty rent | 486 | 610 | 1,798 | 2,581 | |||||||||||||||||||||||||||||||
| Tenant recoveries (e) | 26,043 | 25,848 | 75,021 | 77,976 | |||||||||||||||||||||||||||||||
| Other lease-related income | 1,223 | 1,428 | 3,738 | 4,192 | |||||||||||||||||||||||||||||||
| Uncollectible lease income, net (f) | (4,567) | (700) | (24,714) | (1,188) | |||||||||||||||||||||||||||||||
| Property operating expenses (g) | (15,150) | (15,787) | (45,499) | (48,019) | |||||||||||||||||||||||||||||||
| Real estate taxes | (19,360) | (18,248) | (55,368) | (54,704) | |||||||||||||||||||||||||||||||
| Same Store NOI (c) | $ | 71,134 | $ | 81,235 | (12.4) | % | $ | 215,579 | $ | 242,595 | (11.1) | % | |||||||||||||||||||||||
(a)The Company’s same store portfolio consists of 101 retail operating properties acquired or placed in service and stabilized prior to January 1, 2019 and excludes the following:
▪properties acquired or placed in service and stabilized during 2019 and 2020;
▪the multi-family rental units at Plaza del Lago, a redevelopment project that was placed in service during 2019;
▪Circle East, which is in active redevelopment;
▪One Loudoun Downtown – Pads G & H, which are in active development;
▪Carillon, a redevelopment project where the Company halted plans for vertical construction during the three months ended March 31, 2020 in response to current macroeconomic conditions due to the impact of the COVID-19 pandemic. As of September 30, 2020, the Company had completed the current scope of site work preparation at the property in anticipation of future vertical development at the site;
▪The Shoppes at Quarterfield, which is in active redevelopment;
▪investment properties that were sold or classified as held for sale during 2019 and 2020; and
▪the net income from our wholly owned captive insurance company.
(b)Includes leases signed but not commenced.
(c)Refer to pages 21 – 24 for definitions and reconciliations of non-GAAP financial measures. Comparison of the Company’s presentation of Same Store NOI to similarly titled measures for other REITs may not necessarily be meaningful due to possible differences in definition and application by such REITs.
(d)Refer to page 20 for COVID-19 supplemental same store base rent reconciliations for the three months ended September 30, 2020. Amounts for the nine months ended September 30, 2020 have been presented on a consistent basis as the three months ended September 30, 2020 presentation.
(e)Base rent and tenant recoveries for the three and nine months ended September 30, 2020 are presented gross of any uncollected amounts related to cash-basis tenants. Such uncollected amounts are reflected within “Uncollectible lease income, net.”
(f)Uncollectible lease income, net is comprised of (i) uncollected amounts related to tenants being accounted for on the cash basis of accounting of $3,847 and $11,905 for the three and nine months ended September 30, 2020, respectively, (ii) a reserve, which includes the estimated impact for lease concession agreements that have not yet been executed of $4,112 for the three and nine months ended September 30, 2020, and other general reserve amounts, and (iii) the reclassification of amounts related to lease concession agreements that were executed during the current period and treated as negative variable lease adjustments, however were agreed in principle in the prior quarter of $(4,381) for the three months ended September 30, 2020.
(g)Consists of all property operating items included within “Operating expenses” in the condensed consolidated statements of operations, which includes all items other than (i) lease termination fee expense and (ii) non-cash ground rent expense, which is comprised of amortization of right-of-use lease assets and amortization of lease liabilities.
| 3rd Quarter 2020 Supplemental Information | 5 | |||||||
Retail Properties of America, Inc.
Capitalization
(dollar amounts in thousands, except share price and ratio)
| Capitalization Data | |||||||||||
| September 30, 2020 | December 31, 2019 | ||||||||||
| Equity Capitalization | |||||||||||
| Common stock shares outstanding (a) | 214,253 | 213,600 | |||||||||
| Common stock share price | $ | 5.81 | $ | 13.40 | |||||||
| Total equity capitalization | $ | 1,244,810 | $ | 2,862,240 | |||||||
| Debt Capitalization | |||||||||||
| Mortgages payable (b) | $ | 92,744 | $ | 94,904 | |||||||
| Unsecured notes payable (c) | 1,200,000 | 800,000 | |||||||||
| Unsecured term loans (d) | 470,000 | 720,000 | |||||||||
| Unsecured revolving line of credit | — | 18,000 | |||||||||
| Total debt capitalization | $ | 1,762,744 | $ | 1,632,904 | |||||||
| Total capitalization at end of period | $ | 3,007,554 | $ | 4,495,144 | |||||||
Net income for the trailing twelve months ended September 30, 2020 was $28,894, comprised of net (loss) income of $(2,288), $(7,347), $22,357 and $16,172 for the three months ended September 30, 2020, June 30, 2020, March 31, 2020 and December 31, 2019, respectively.
Calculation of Net Debt to Adjusted EBITDAre Ratio (e)
| Trailing Twelve Months Ended September 30, 2020 | Three Months Ended | |||||||||||||||||||
| September 30, 2020 | December 31, 2019 | |||||||||||||||||||
| Total debt principal at period end | $ | 1,762,744 | $ | 1,762,744 | $ | 1,632,904 | ||||||||||||||
| Less: consolidated cash and cash equivalents at period end | (27,371) | (27,371) | (9,989) | |||||||||||||||||
| Total net debt at period end | $ | 1,735,373 | $ | 1,735,373 | $ | 1,622,915 | ||||||||||||||
Adjusted EBITDAre | $ | 268,214 | (f) | $ | 254,692 | (g) | $ | 299,804 | (g) | |||||||||||
Net Debt to Adjusted EBITDAre | 6.5x | (f) | 6.8x | (g) | 5.4x | (g) | ||||||||||||||
(a)Excludes performance restricted stock units and options outstanding, which could potentially convert into common stock in the future.
(b)Mortgages payable excludes mortgage discount of $(461) and $(493) and capitalized loan fees of $(208) and $(256), net of accumulated amortization, as of September 30, 2020 and December 31, 2019, respectively.
(c)Unsecured notes payable excludes discount of $(6,687) and $(616) and capitalized loan fees of $(7,834) and $(3,137), net of accumulated amortization, as of September 30, 2020 and December 31, 2019, respectively.
(d)Unsecured term loans exclude capitalized loan fees of $(2,609) and $(3,477), net of accumulated amortization, as of September 30, 2020 and December 31, 2019, respectively.
(e)Refer to pages 21 – 24 for definitions and reconciliations of non-GAAP financial measures.
(f)For purposes of this ratio calculation, the trailing twelve months ended EBITDAre was used.
(g)For purposes of this ratio calculation, annualized three months ended EBITDAre was used.
| 3rd Quarter 2020 Supplemental Information | 6 | |||||||
Retail Properties of America, Inc.
Covenants
| Unsecured Revolving Line of Credit, Term Loans Due 2023, 2024 and 2026 and Notes Due 2024, 2026, 2028 and 2029 (a) | ||||||||||||||
| Covenant | September 30, 2020 | |||||||||||||
| Leverage ratio (b) (c) | Unsecured revolving line of credit, Term Loans Due 2023, 2024 and 2026 and Notes Due 2026, 2028 and 2029: | ≤ 60.0% | 35.9 | % | ||||||||||
| Notes Due 2024: | ≤ 60.0% | 37.6 | % | |||||||||||
| Secured leverage ratio (b) (c) | Unsecured revolving line of credit and Term Loans Due 2023, 2024 and 2026: | ≤ 45.0% | 1.9 | % | ||||||||||
| Notes Due 2024, 2026, 2028 and 2029: | ≤ 40.0% | |||||||||||||
| Fixed charge coverage ratio (b) (d) | ≥ 1.50x | 3.5x | ||||||||||||
| Interest coverage ratio (b) (e) | ≥ 1.50x | 3.6x | ||||||||||||
| Unencumbered leverage ratio (b) (c) | ≤ 60.0% | 36.0 | % | |||||||||||
| Unencumbered interest coverage ratio (b) | ≥ 1.75x | 4.1x | ||||||||||||
| Notes Due 2025 and 2030 (f) | |||||||||||
| Covenant | September 30, 2020 | ||||||||||
| Leverage ratio (g) | ≤ 60.0% | 36.7 | % | ||||||||
| Secured leverage ratio (g) | ≤ 40.0% | 1.8 | % | ||||||||
| Debt service coverage ratio (b) (h) | ≥ 1.50x | 3.7x | |||||||||
| Unencumbered assets to unsecured debt ratio | ≥ 150% | 288 | % | ||||||||
(a)For a complete listing of all covenants related to the Company’s unsecured revolving line of credit as well as covenant definitions, refer to the Fifth Amended and Restated Credit Agreement filed as Exhibit 10.2 to the Company’s Quarterly Report on Form 10-Q for the quarter ended March 31, 2018, filed on May 2, 2018 and the First Amendment to the Fifth Amended and Restated Credit Agreement filed as Exhibit 10.1 to the Company’s Quarterly Report on Form 10-Q for the quarter ended March 31, 2020, filed on May 6, 2020. For a complete listing of all covenants as well as covenant definitions related to the Company’s Term Loan Due 2023, refer to the credit agreement filed as Exhibit 10.1 to the Company’s Current Report on Form 8-K, dated November 29, 2016, the First Amendment to the Term Loan Agreement filed as Exhibit 10.4 to the Company’s Quarterly Report on Form 10-Q for the quarter ended June 30, 2018, filed on August 1, 2018, the Second Amendment to the Term Loan Agreement filed as Exhibit 10.10 to the Company’s Annual Report on Form 10-K for the year ended December 31, 2018, filed on February 13, 2019, and the Third Amendment to the Term Loan Agreement filed as Exhibit 10.2 to the Company’s Quarterly Report on Form 10-Q for the quarter ended March 31, 2020, filed on May 6, 2020. For a complete listing of all covenants as well as covenant definitions related to the Company’s Term Loan Due 2024 and Term Loan Due 2026, refer to the Term Loan Agreement filed as Exhibit 10.1 to the Company’s Current Report on Form 8-K, dated July 23, 2019 and the First Amendment to the Term Loan Agreement filed as Exhibit 10.3 to the Company’s Quarterly Report on Form 10-Q for the quarter ended March 31, 2020, filed on May 6, 2020. For a complete listing of all covenants related to the Company’s 4.58% senior unsecured notes due 2024 (Notes Due 2024) as well as covenant definitions, refer to the Note Purchase Agreement filed as Exhibit 10.1 to the Company’s Current Report on Form 8-K, dated May 22, 2014. For a complete listing of all covenants related to the Company’s 4.08% senior unsecured notes due 2026 and 4.24% senior unsecured notes due 2028 (Notes Due 2026 and 2028) as well as covenant definitions, refer to the Note Purchase Agreement filed as Exhibit 10.1 to the Company’s Current Report on Form 8-K, dated October 5, 2016. For a complete listing of all covenants related to the Company’s 4.82% senior unsecured notes due 2029 (Notes Due 2029) as well as covenant definitions, refer to the Note Purchase Agreement filed as Exhibit 10.1 to the Company’s Current Report on Form 8-K, dated April 9, 2019.
(b)Covenant calculation includes operating results, or a derivation thereof, based on the most recent four fiscal quarters of activity.
(c)Based upon a capitalization rate of 6.50% as specified in the Company’s debt agreements.
(d)Applies only to the Company’s unsecured revolving line of credit, Term Loan Due 2023, Term Loan Due 2024, Term Loan Due 2026, Notes Due 2026 and 2028 and Notes Due 2029. This ratio is based upon consolidated debt service, including interest expense and principal amortization, excluding interest expense related to defeasance costs and prepayment premiums.
(e)Applies only to the Notes Due 2024, Notes Due 2026 and 2028 and Notes Due 2029.
(f)For a complete listing of all covenants related to the Company’s 4.00% senior unsecured notes due 2025 (Notes Due 2025) as well as covenant definitions, refer to the First Supplemental Indenture filed as Exhibit 4.2 to the Company’s Current Report on Form 8-K, dated March 12, 2015, and the Second Supplemental Indenture filed as Exhibit 4.1 to the Company’s Current Report on Form 8-K, dated July 21, 2020. For a complete listing of all covenants related to the Company’s 4.75% senior unsecured notes due 2030 (Notes Due 2030) as well as covenant definitions, refer to the Third Supplemental Indenture filed as Exhibit 4.1 to the Company’s Current Report on Form 8-K, dated August 25, 2020.
(g)Based upon the book value of Total Assets as defined in the First Supplemental Indenture referenced in footnote (f) above.
(h)Based upon interest expense and excludes principal amortization. This ratio is calculated on a pro forma basis with the assumption that debt and property transactions occurred on the first day of the preceding four-quarter period.
| 3rd Quarter 2020 Supplemental Information | 7 | |||||||
Retail Properties of America, Inc.
Summary of Indebtedness as of September 30, 2020
(dollar amounts in thousands)
| Description | Balance | Interest Rate (a) | Maturity Date | WA Years to Maturity | Type | |||||||||||||||||||||||||||
| Consolidated Indebtedness | ||||||||||||||||||||||||||||||||
| Peoria Crossings | $ | 24,131 | 4.82 | % | 04/01/22 | 1.5 years | Fixed/Secured | |||||||||||||||||||||||||
| Gateway Village | 32,078 | 4.14 | % | 01/01/23 | 2.3 years | Fixed/Secured | ||||||||||||||||||||||||||
| Northgate North | 24,370 | 4.50 | % | 06/01/27 | 6.7 years | Fixed/Secured | ||||||||||||||||||||||||||
| The Shoppes at Union Hill | 12,165 | 3.75 | % | 06/01/31 | 10.7 years | Fixed/Secured | ||||||||||||||||||||||||||
| Mortgages payable (b) | 92,744 | 4.36 | % | 4.3 years | ||||||||||||||||||||||||||||
| Senior notes – 4.58% due 2024 | 150,000 | 4.58 | % | 06/30/24 | 3.8 years | Fixed/Unsecured | ||||||||||||||||||||||||||
| Senior notes – 4.00% due 2025 | 350,000 | 4.00 | % | 03/15/25 | 4.5 years | Fixed/Unsecured | ||||||||||||||||||||||||||
| Senior notes – 4.08% due 2026 | 100,000 | 4.08 | % | 09/30/26 | 6.0 years | Fixed/Unsecured | ||||||||||||||||||||||||||
| Senior notes – 4.24% due 2028 | 100,000 | 4.24 | % | 12/28/28 | 8.2 years | Fixed/Unsecured | ||||||||||||||||||||||||||
| Senior notes – 4.82% due 2029 | 100,000 | 4.82 | % | 06/28/29 | 8.7 years | Fixed/Unsecured | ||||||||||||||||||||||||||
| Senior notes – 4.75% due 2030 | 400,000 | 4.75 | % | 09/15/30 | 10.0 years | Fixed/Unsecured | ||||||||||||||||||||||||||
| Unsecured notes payable (b) | 1,200,000 | 4.42 | % | 7.0 years | ||||||||||||||||||||||||||||
| Unsecured credit facility: | ||||||||||||||||||||||||||||||||
| Revolving line of credit | — | 1.20 | % | (c) | 04/22/22 | 1.6 years | Variable/Unsecured | |||||||||||||||||||||||||
| Term Loan Due 2023 | 200,000 | 4.05 | % | (d) | 11/22/23 | 3.1 years | Fixed/Unsecured | |||||||||||||||||||||||||
| Term Loan Due 2024 | 120,000 | 2.88 | % | (e) | 07/17/24 | 3.8 years | Fixed/Unsecured | |||||||||||||||||||||||||
| Term Loan Due 2026 | 150,000 | 3.27 | % | (f) | 07/17/26 | 5.8 years | Fixed/Unsecured | |||||||||||||||||||||||||
| Unsecured term loans (b) | 470,000 | 3.50 | % | 4.2 years | ||||||||||||||||||||||||||||
| Total consolidated indebtedness | $ | 1,762,744 | 4.17 | % | 6.1 years | |||||||||||||||||||||||||||
Consolidated Debt Maturity Schedule as of September 30, 2020 | ||||||||||||||||||||||||||||||||||||||||||||
| Year | Fixed Rate (b) | WA Rates on Fixed Debt | Variable Rate | WA Rates on Variable Debt (c) | Total | % of Total | WA Rates on Total Debt (a) | |||||||||||||||||||||||||||||||||||||
| 2020 | $ | 588 | 4.08 | % | $ | — | — | $ | 588 | 0.0 | % | 4.08 | % | |||||||||||||||||||||||||||||||
| 2021 | 2,409 | 4.08 | % | — | — | 2,409 | 0.1 | % | 4.08 | % | ||||||||||||||||||||||||||||||||||
| 2022 | 26,641 | 4.81 | % | — | 1.20 | % | 26,641 | 1.5 | % | 4.81 | % | |||||||||||||||||||||||||||||||||
| 2023 | 231,758 | 4.06 | % | — | — | 231,758 | 13.1 | % | 4.06 | % | ||||||||||||||||||||||||||||||||||
| 2024 | 271,737 | 3.83 | % | — | — | 271,737 | 15.5 | % | 3.83 | % | ||||||||||||||||||||||||||||||||||
| 2025 | 351,809 | 4.00 | % | — | — | 351,809 | 20.0 | % | 4.00 | % | ||||||||||||||||||||||||||||||||||
| 2026 | 251,884 | 3.60 | % | — | — | 251,884 | 14.3 | % | 3.60 | % | ||||||||||||||||||||||||||||||||||
| 2027 | 21,410 | 4.46 | % | — | — | 21,410 | 1.2 | % | 4.46 | % | ||||||||||||||||||||||||||||||||||
| 2028 | 101,228 | 4.23 | % | — | — | 101,228 | 5.7 | % | 4.23 | % | ||||||||||||||||||||||||||||||||||
| 2029 | 101,275 | 4.81 | % | — | — | 101,275 | 5.8 | % | 4.81 | % | ||||||||||||||||||||||||||||||||||
| Thereafter | 402,005 | 4.75 | % | — | — | 402,005 | 22.8 | % | 4.75 | % | ||||||||||||||||||||||||||||||||||
| Total | $ | 1,762,744 | 4.17 | % | $ | — | 1.20 | % | $ | 1,762,744 | 100.0 | % | 4.17 | % | ||||||||||||||||||||||||||||||
(a)Interest rates presented exclude the impact of the discount and capitalized loan fee amortization. As of September 30, 2020, the Company’s overall weighted average interest rate for consolidated debt including the impact of the discount and capitalized loan fee amortization was 4.41%.
(b)Mortgages payable excludes mortgage discount of $(461) and capitalized loan fees of $(208), net of accumulated amortization, as of September 30, 2020. Unsecured notes payable excludes discount of $(6,687) and capitalized loan fees of $(7,834), net of accumulated amortization, as of September 30, 2020. Unsecured term loans exclude capitalized loan fees of $(2,609), net of accumulated amortization, as of September 30, 2020. In the consolidated debt maturity schedule, maturity amounts for each year include scheduled principal amortization payments.
(c)Represents interest rate as of September 30, 2020, however, the revolving line of credit was not drawn as of September 30, 2020.
(d)Reflects $200,000 of LIBOR-based variable rate debt that has been swapped to a fixed rate of 2.85% plus a credit spread based on a leverage grid ranging from 1.20% to 1.85% through November 22, 2023. The applicable credit spread was 1.20% as of September 30, 2020.
(e)Reflects $120,000 of LIBOR-based variable rate debt that has been swapped to a fixed rate of 1.68% plus a credit spread based on a leverage grid ranging from 1.20% to 1.70% through July 17, 2024. The applicable credit spread was 1.20% as of September 30, 2020.
(f)Reflects $150,000 of LIBOR-based variable rate debt that has been swapped to a fixed rate of 1.77% plus a credit spread based on a leverage grid ranging from 1.50% to 2.20% through July 17, 2026. The applicable credit spread was 1.50% as of September 30, 2020.
| 3rd Quarter 2020 Supplemental Information | 8 | |||||||
Retail Properties of America, Inc.
Development Projects as of September 30, 2020
(dollar amounts in thousands)
| Property Name and Metropolitan Statistical Area (MSA) | Estimated Project Commercial GLA | Estimated Project Multi-Family Rental Units (MFR) | JV / Air Rights | Estimated Net RPAI Project Investment (a) | Net RPAI Project Investment Inception to Date | Estimated Incremental Return on Investment (b) | Anticipated Commencement | Targeted Stabilization (c) | Property Included in Same Store Portfolio (d) | Project Description | ||||||||||||||||||||||||||||||||||||||||||||||||||||
| Active Projects | ||||||||||||||||||||||||||||||||||||||||||||||||||||||||||||||
Circle East (e) (Baltimore MSA) | 82,000 | 370 | MFR: Air rights sale | $42,000–$44,000 | $ | 24,915 | (f) | 7.0%–8.0% | Active | Q3–Q4 2022 | No (e) | Mixed-use redevelopment that will include dual-sided street level retail with approx. 370 third party-owned MFR above. Project is 13% leased | ||||||||||||||||||||||||||||||||||||||||||||||||||
One Loudoun Downtown – Pads G & H (Washington, D.C. MSA) | 67,000–70,000 | 378 | MFR: 90%/10% JV | $125,000–$135,000 (g) | $ | 53,441 | (g) | 6.0%–7.0% | Active | Q2–Q3 2022 | No (h) | Vacant pad development to densify and enhance existing mixed-use asset in Loudoun County. See site plan on page 12 | ||||||||||||||||||||||||||||||||||||||||||||||||||
The Shoppes at Quarterfield (Baltimore MSA) | 58,000 | — | n/a | $9,000–$10,000 | $ | 2,003 | 11.5%–12.5% | Active | Q1–Q2 2021 | No | Reconfiguration of site and building, which represents 94% of the property’s GLA. Project is 100% leased | |||||||||||||||||||||||||||||||||||||||||||||||||||
Southlake Town Square–Pad (Dallas MSA) | 4,000 | — | n/a | $2,000–$2,500 | $ | 952 | 12.0%–15.0% | Active | Q1–Q2 2021 | Yes | Vacant pad development. Project is 100% leased | |||||||||||||||||||||||||||||||||||||||||||||||||||
(a)Net project investment represents the Company’s estimated share of the project costs, net of proceeds from land sales, sales of air rights, reimbursement from third parties and excludes contributions from project partners, as applicable.
(b)Estimated Incremental Return on Investment (ROI) generally reflects only the unleveraged incremental NOI generated by the project upon stabilization and is calculated as incremental NOI divided by net project investment. Incremental NOI is the difference between NOI expected to be generated by the stabilized project and the NOI generated prior to the commencement of active redevelopment, development or expansion of the space. ROI does not include peripheral impacts, such as the impact on future lease rollover at the property or the impact on the long-term value of the property.
(c)Targeted stabilization represents the projected date of the redevelopment reaching 90% occupancy, but generally no later than one year from the completion of major construction activity.
(d)The Company’s same store portfolio consists of retail operating properties acquired or placed in service and stabilized prior to January 1, 2019. A property is removed from the Company’s same store portfolio if the project is considered to significantly impact the existing property’s NOI and activities have begun in anticipation of the project. Expansions and pad developments are generally not considered to significantly impact the existing property’s NOI, and therefore, the existing properties have not been removed from the Company’s same store portfolio if they otherwise met the criteria to be included in the Company’s same store portfolio as of September 30, 2020.
(e)Circle East is the Company’s rebranded redevelopment at Towson Circle (which has been excluded from the Company’s same store portfolio due to the ongoing redevelopment).
(f)Net project investment inception to date is net of proceeds of $11,820 received in the first quarter of 2018 from the sale of air rights to a third party to develop the MFR.
(g)Project investment includes an allocation of infrastructure costs.
(h)The property is comprised of the redevelopment project (which has been excluded from the Company’s same store portfolio due to the ongoing redevelopment) and the remaining retail operating portion of the property (which is included in the Company’s same store portfolio as of September 30, 2020).
The Company cannot guarantee that (i) ROI will be generated at the percentage listed or at all, (ii) total actual net investment associated with these projects will be equal to the total estimated net project investment, (iii) project commencement or stabilization will occur when anticipated or (iv) that the Company will ultimately complete any or all of these projects. The ROI and total estimated net project investment reflect the Company’s best estimate based upon current information, may change over time and are subject to certain conditions which are beyond the Company’s control, including, without limitation, general economic conditions, market conditions and other business factors.
| 3rd Quarter 2020 Supplemental Information | 9 | |||||||
Retail Properties of America, Inc.
Development Projects as of September 30, 2020 (continued)
(dollar amounts in thousands)
The Company has identified the following potential development, redevelopment, expansion and pad development opportunities to develop or redevelop significant portions of the property, add stand-alone buildings, convert previously under-utilized space or develop additional commercial GLA at existing properties. Executing on these opportunities may be subject to certain conditions that are beyond the Company’s control, including, without limitation, government approvals, tenant consents as well as general economic, market and other conditions and, therefore, the Company can provide no assurances that any of the development, redevelopment, expansion and pad development opportunities (i) will be executed on, (ii) will commence when anticipated or (iii) will ultimately be realized.
| Property Name | MSA | Included in Same store portfolio (a) | Entitled Commercial GLA (b) | Entitled MFR (b) | Developable Acreage | |||||||||||||||||||||||||||
| Future Projects – Entitled (b) | ||||||||||||||||||||||||||||||||
| One Loudoun Uptown – land held for future development | Washington, D.C. | No | 2,800,000 | 32 | ||||||||||||||||||||||||||||
| Carillon (c) | Washington, D.C. | No | 1,200,000 | 3,000 | 50 | |||||||||||||||||||||||||||
| One Loudoun Downtown – Pad T | Washington, D.C. | Yes | 40,000 | |||||||||||||||||||||||||||||
| One Loudoun Downtown – future phases (d) | Washington, D.C. | Yes | 62,000 – 95,000 | |||||||||||||||||||||||||||||
| Main Street Promenade | Chicago | Yes | 62,000 | 47 | ||||||||||||||||||||||||||||
| Downtown Crown | Washington, D.C. | Yes | 42,000 | |||||||||||||||||||||||||||||
| Reisterstown Road Plaza | Baltimore | Yes | 8,000 – 12,000 | |||||||||||||||||||||||||||||
| Gateway Plaza | Dallas | Yes | 8,000 | |||||||||||||||||||||||||||||
| Edwards Multiplex – Ontario, CA | Riverside-San Bernardino | Yes | 3,000 | |||||||||||||||||||||||||||||
| Property Name | MSA | Included in Same store portfolio (a) | Estimated Project Commercial GLA | Estimated Project MFR | ||||||||||||||||||||||
| Development, Redevelopment, Expansion and Pad Development Opportunities | ||||||||||||||||||||||||||
| Southlake Town Square | Dallas | Yes | 271,000 | |||||||||||||||||||||||
| Merrifield Town Center II (e) | Washington, D.C. | Yes | 80,000 – 100,000 | 350 – 400 | ||||||||||||||||||||||
| Tysons Corner (e) | Washington, D.C. | Yes | 50,000 – 75,000 | 350 – 450 | ||||||||||||||||||||||
| Plaza del Lago – future phase | Chicago | Yes | 20,600 | |||||||||||||||||||||||
| Lakewood Towne Center | Seattle | Yes | 10,500 | |||||||||||||||||||||||
| Humblewood Shopping Center | Houston | Yes | 5,000 | |||||||||||||||||||||||
| Watauga Pavilion | Dallas | Yes | 5,000 | |||||||||||||||||||||||
(a)See footnote (d) on page 9 regarding the Company’s same store portfolio.
(b)Project may require additional discretionary design or other approvals in certain jurisdictions.
(c)During the three months ended March 31, 2020, in response to current macroeconomic conditions due to the impact of the COVID-19 pandemic, the Company halted plans for vertical construction at Carillon and terminated the joint venture related to the multi-family rental portion of phase one of the redevelopment. In addition, during the three months ended June 30, 2020, the Company terminated the joint venture related to the medical office building portion of phase one of the redevelopment. As of September 30, 2020, the Company had completed the current scope of site work preparation at the property in anticipation of future vertical development at the site.
(d)One Loudoun Downtown – future phases include three vacant parcels that have been identified as future pad development opportunities of up to 95,000 square feet of commercial GLA.
(e)Project may require demolition of a portion of the property’s existing GLA.
| 3rd Quarter 2020 Supplemental Information | 10 | |||||||
Retail Properties of America, Inc.
Development Projects as of September 30, 2020 (continued)
(dollar amounts in thousands)
| Property Name and MSA | Project Commercial GLA | Project MFR | Estimated Net RPAI Project Investment (a) | Net RPAI Project Investment Inception to Date | Estimated Incremental Return on Investment (a) | Stabilization (a) | Property Included in Same Store Portfolio (a) | Project Description | ||||||||||||||||||||||||||||||||||||||||||
| Completed Redevelopment Projects | ||||||||||||||||||||||||||||||||||||||||||||||||||
Reisterstown Road Plaza (Baltimore MSA) | 40,500 | — | $ | 10,500 | $ | 10,294 | 10.5%–11.0% | Q4 2018 | Yes | Reconfigured existing space and facade renovation; redevelopment GLA is 100% leased and 100% occupied | ||||||||||||||||||||||||||||||||||||||||
Plaza del Lago – MFR (Chicago MSA) | — | 18 | $1,350–$1,400 | $ | 1,395 | 8.5%–9.0% | Q2 2020 | No (b) | Reconfiguration of 18 MFR, which are 89% leased; major construction was completed in Q2 2019 | |||||||||||||||||||||||||||||||||||||||||
| Property Name and MSA | Project Commercial GLA | Net RPAI Investment (a) | Incremental Return on Investment (a) | Completion | Property Included in Same Store Portfolio (a) | Project Description | ||||||||||||||||||||||||||||||||
| Completed Expansions and Pad Developments | ||||||||||||||||||||||||||||||||||||||
Lake Worth Towne Crossing – Parcel (Dallas MSA) | 15,030 | $ | 2,872 | 11.3% | Q4 2015 | Yes | 15,030 sq. ft. multi-tenant retail | |||||||||||||||||||||||||||||||
Parkway Towne Crossing (Dallas MSA) | 21,000 | $ | 3,468 | 9.9% | Q3 2016 | Yes | 21,000 sq. ft. multi-tenant retail | |||||||||||||||||||||||||||||||
Heritage Square (Seattle MSA) | 4,200 | $ | 1,507 | 11.2% | Q3 2016 | Yes | 4,200 sq. ft. redevelopment of outparcel for new tenant, Corner Bakery | |||||||||||||||||||||||||||||||
Pavilion at King’s Grant (Charlotte MSA) | 32,500 | $ | 2,470 | 14.7% | Q2 2017 | Yes | 32,500 sq. ft. multi-tenant retail | |||||||||||||||||||||||||||||||
Shops at Park Place (Dallas MSA) | 25,040 | $ | 3,956 | 9.1% | Q2 2017 | Yes | 25,040 sq. ft. pad development | |||||||||||||||||||||||||||||||
Lakewood Towne Center (Seattle MSA) | 4,500 | $ | 1,900 | 7.3% | Q3 2017 | Yes | 4,500 sq. ft. pad development | |||||||||||||||||||||||||||||||
(a)See footnote (a), (b), (c) and (d) on page 9 regarding the net RPAI project investment, incremental return on investment, stabilization and same store portfolio, respectively.
(b)The property is comprised of the multi-family rental units, which were placed in service during the three months ended September 30, 2019 and are excluded from the Company’s same store portfolio, and the remaining retail operating portion of the property, which is included in the Company’s same store portfolio as of September 30, 2020.
| 3rd Quarter 2020 Supplemental Information | 11 | |||||||
Retail Properties of America, Inc.
Development Projects as of September 30, 2020 (continued)
One Loudoun Downtown Site Plan
| 3rd Quarter 2020 Supplemental Information | 12 | |||||||
Retail Properties of America, Inc.
Acquisitions and Dispositions for the Nine Months Ended September 30, 2020
(amounts in thousands, except square footage amounts)
Acquisitions
| Property Name | Acquisition Date | MSA | Property Type | GLA | Purchase Price | |||||||||||||||||||||||||||
| Fullerton Metrocenter | February 6, 2020 | Los Angeles | Fee interest (a) | 154,700 | $ | 55,000 | ||||||||||||||||||||||||||
| Total 2020 acquisitions (through September 30, 2020) | 154,700 | $ | 55,000 | |||||||||||||||||||||||||||||
(a)The Company acquired the fee interest in an existing multi-tenant retail operating property. In connection with this acquisition, the Company also assumed the lessor position in a ground lease with a shadow anchor. The total number of properties in the Company's portfolio was not affected by this transaction.
Property Dispositions
| Property Name | Disposition Date | Property Type | GLA | Consideration | Debt Repaid | Prepayment Premium | ||||||||||||||||||||||||||||||||
| King Philip’s Crossing | February 13, 2020 | Multi-tenant retail | 105,900 | $ | 13,900 | $ | — | $ | — | |||||||||||||||||||||||||||||
| Total 2020 property dispositions (through September 30, 2020) | 105,900 | $ | 13,900 | $ | — | $ | — | |||||||||||||||||||||||||||||||
There have been no acquisitions or dispositions subsequent to September 30, 2020.
| 3rd Quarter 2020 Supplemental Information | 13 | |||||||
Retail Properties of America, Inc.
Retail Market Summary as of September 30, 2020
| Property Type/Market | Number of Properties | ABR (a) (in thousands) | % of Total Multi-Tenant Retail ABR (a) | ABR per Occupied Sq. Ft. | GLA (a) (in thousands) | % of Total Multi-Tenant Retail GLA (a) | Occupancy | % Leased Including Signed | ||||||||||||||||||||||||||||||||||||||||||
| Multi-Tenant Retail: | ||||||||||||||||||||||||||||||||||||||||||||||||||
| Top 25 MSAs | ||||||||||||||||||||||||||||||||||||||||||||||||||
| Dallas | 19 | $ | 83,733 | 23.8 | % | $ | 23.04 | 3,943 | 20.0 | % | 92.2 | % | 92.7 | % | ||||||||||||||||||||||||||||||||||||
| Washington, D.C. | 8 | 36,310 | 10.3 | % | 28.66 | 1,388 | 7.0 | % | 91.3 | % | 91.7 | % | ||||||||||||||||||||||||||||||||||||||
| New York | 9 | 36,028 | 10.2 | % | 29.64 | 1,294 | 6.6 | % | 94.0 | % | 97.0 | % | ||||||||||||||||||||||||||||||||||||||
| Chicago | 8 | 27,927 | 7.9 | % | 24.11 | 1,358 | 6.9 | % | 85.3 | % | 87.9 | % | ||||||||||||||||||||||||||||||||||||||
| Seattle | 9 | 24,121 | 6.8 | % | 16.77 | 1,548 | 7.9 | % | 93.0 | % | 96.1 | % | ||||||||||||||||||||||||||||||||||||||
| Baltimore | 4 | 21,778 | 6.2 | % | 16.09 | 1,542 | 7.8 | % | 87.7 | % | 92.2 | % | ||||||||||||||||||||||||||||||||||||||
| Atlanta | 9 | 20,799 | 5.9 | % | 14.04 | 1,513 | 7.7 | % | 98.0 | % | 98.0 | % | ||||||||||||||||||||||||||||||||||||||
| Houston | 9 | 16,287 | 4.6 | % | 15.05 | 1,141 | 5.8 | % | 94.9 | % | 95.1 | % | ||||||||||||||||||||||||||||||||||||||
| San Antonio | 3 | 12,676 | 3.6 | % | 17.97 | 722 | 3.7 | % | 97.7 | % | 97.7 | % | ||||||||||||||||||||||||||||||||||||||
| Phoenix | 3 | 10,757 | 3.1 | % | 17.77 | 632 | 3.2 | % | 95.8 | % | 96.5 | % | ||||||||||||||||||||||||||||||||||||||
| Los Angeles | 1 | 6,881 | 2.0 | % | 17.98 | 396 | 2.0 | % | 96.6 | % | 100.0 | % | ||||||||||||||||||||||||||||||||||||||
| Riverside | 1 | 4,485 | 1.3 | % | 15.78 | 292 | 1.5 | % | 97.2 | % | 98.1 | % | ||||||||||||||||||||||||||||||||||||||
| St. Louis | 1 | 3,903 | 1.1 | % | 9.51 | 453 | 2.3 | % | 90.6 | % | 90.6 | % | ||||||||||||||||||||||||||||||||||||||
| Charlotte | 1 | 3,845 | 1.1 | % | 14.11 | 320 | 1.6 | % | 85.2 | % | 93.8 | % | ||||||||||||||||||||||||||||||||||||||
| Tampa | 1 | 2,401 | 0.7 | % | 19.69 | 126 | 0.6 | % | 97.0 | % | 97.0 | % | ||||||||||||||||||||||||||||||||||||||
| Subtotal | 86 | 311,931 | 88.6 | % | 20.24 | 16,668 | 84.6 | % | 92.5 | % | 94.1 | % | ||||||||||||||||||||||||||||||||||||||
| Non-Top 25 MSAs by State | ||||||||||||||||||||||||||||||||||||||||||||||||||
| Texas | 7 | 13,314 | 3.8 | % | 14.99 | 1,002 | 5.1 | % | 88.6 | % | 90.6 | % | ||||||||||||||||||||||||||||||||||||||
| Michigan | 1 | 6,685 | 1.9 | % | 24.31 | 332 | 1.7 | % | 82.7 | % | 82.7 | % | ||||||||||||||||||||||||||||||||||||||
| Massachusetts | 1 | 5,060 | 1.4 | % | 9.66 | 536 | 2.7 | % | 97.7 | % | 98.4 | % | ||||||||||||||||||||||||||||||||||||||
| Washington | 1 | 4,401 | 1.3 | % | 12.45 | 378 | 1.9 | % | 93.6 | % | 93.6 | % | ||||||||||||||||||||||||||||||||||||||
| Virginia | 1 | 4,305 | 1.2 | % | 18.11 | 308 | 1.6 | % | 77.3 | % | 84.2 | % | ||||||||||||||||||||||||||||||||||||||
| Tennessee | 2 | 4,304 | 1.2 | % | 11.93 | 364 | 1.8 | % | 99.0 | % | 99.0 | % | ||||||||||||||||||||||||||||||||||||||
| Maryland | 1 | 2,081 | 0.6 | % | 20.95 | 113 | 0.6 | % | 87.9 | % | 87.9 | % | ||||||||||||||||||||||||||||||||||||||
| Subtotal | 14 | 40,150 | 11.4 | % | 14.66 | 3,033 | 15.4 | % | 90.3 | % | 91.7 | % | ||||||||||||||||||||||||||||||||||||||
| Total Multi-Tenant Retail | 100 | 352,081 | 100.0 | % | 19.40 | 19,701 | 100.0 | % | 92.1 | % | 93.7 | % | ||||||||||||||||||||||||||||||||||||||
| Single-User Retail | 2 | 5,864 | 22.49 | 261 | 100.0 | % | 100.0 | % | ||||||||||||||||||||||||||||||||||||||||||
Total Retail Operating Portfolio (b) | 102 | $ | 357,945 | $ | 19.44 | 19,962 | 92.2 | % | 93.8 | % | ||||||||||||||||||||||||||||||||||||||||
(a)Excludes $2,041 of multi-tenant retail ABR and 167 square feet of multi-tenant retail GLA attributable to Circle East and The Shoppes at Quarterfield, located in the Baltimore MSA, and Carillon, located in the Washington, D.C. MSA, all three of which are in redevelopment. Including these amounts, 88.7% of the Company’s multi-tenant retail ABR and 84.7% of the Company’s multi-tenant retail GLA is located in the top 25 MSAs.
(b)Excludes the 18 multi-family rental units at Plaza del Lago, which were placed in service during 2019. As of September 30, 2020, 16 multi-family rental units were leased at an average monthly rental rate per unit of $1,324.
| 3rd Quarter 2020 Supplemental Information | 14 | |||||||
Retail Properties of America, Inc.
Retail Operating Portfolio Occupancy Breakdown as of September 30, 2020
(square footage in thousands)
| Total Retail Operating Portfolio | |||||||||||||||||||||||||||||||||||||||||||||||||||||||||||||||||
| Top 25 MSAs | Non-Top 25 MSAs | Total Multi-Tenant Retail | Single-User Retail | Total Retail | |||||||||||||||||||||||||||||||||||||||||||||||||||||||||||||
| Number of Properties | 86 | 14 | 100 | 2 | 102 | ||||||||||||||||||||||||||||||||||||||||||||||||||||||||||||
| GLA | Occupancy | GLA | Occupancy | GLA | Occupancy | GLA | Occupancy | GLA | Occupancy | % Leased Including Signed | |||||||||||||||||||||||||||||||||||||||||||||||||||||||
| 25,000+ sq ft | 7,688 | 96.1 | % | 1,424 | 97.9 | % | 9,112 | 96.3 | % | 261 | 100.0 | % | 9,373 | 96.4 | % | 98.7 | % | ||||||||||||||||||||||||||||||||||||||||||||||||
| 10,000-24,999 sq ft | 3,349 | 94.0 | % | 568 | 79.2 | % | 3,917 | 91.9 | % | — | 0.0 | % | 3,917 | 91.9 | % | 92.9 | % | ||||||||||||||||||||||||||||||||||||||||||||||||
| Anchor | 11,037 | 95.4 | % | 1,992 | 92.6 | % | 13,029 | 95.0 | % | 261 | 100.0 | % | 13,290 | 95.1 | % | 97.0 | % | ||||||||||||||||||||||||||||||||||||||||||||||||
| 5,000-9,999 sq ft | 2,215 | 87.9 | % | 387 | 89.0 | % | 2,602 | 88.1 | % | — | — | 2,602 | 88.1 | % | 89.1 | % | |||||||||||||||||||||||||||||||||||||||||||||||||
| 0-4,999 sq ft | 3,416 | 85.8 | % | 654 | 84.0 | % | 4,070 | 85.5 | % | — | — | 4,070 | 85.5 | % | 86.5 | % | |||||||||||||||||||||||||||||||||||||||||||||||||
| Non-Anchor | 5,631 | 86.7 | % | 1,041 | 85.8 | % | 6,672 | 86.5 | % | — | — | 6,672 | 86.5 | % | 87.5 | % | |||||||||||||||||||||||||||||||||||||||||||||||||
| Total | 16,668 | 92.5 | % | 3,033 | 90.3 | % | 19,701 | 92.1 | % | 261 | 100.0 | % | 19,962 | 92.2 | % | 93.8 | % | ||||||||||||||||||||||||||||||||||||||||||||||||
| 3rd Quarter 2020 Supplemental Information | 15 | |||||||
Retail Properties of America, Inc.
Top Retail Tenants as of September 30, 2020
(dollar amounts and square footage in thousands)
The following table sets forth information regarding the 25 largest tenants in the Company’s retail operating portfolio based on ABR as of September 30, 2020. Dollars (other than per square foot information) and square feet of GLA are presented in thousands.
| Tenant | Primary DBA/Number of Locations | Number of Locations | ABR | % of Total ABR | ABR per Occupied Sq. Ft. | Occupied GLA | % of Occupied GLA | |||||||||||||||||||||||||||||||||||||
| Best Buy Co., Inc. | Best Buy (11), Pacific Sales (1) | 12 | $ | 8,587 | 2.4 | % | $ | 17.49 | 491 | 2.7 | % | |||||||||||||||||||||||||||||||||
| The TJX Companies, Inc. | T.J. Maxx (11), Marshalls (7), HomeGoods (6), Homesense (1) | 25 | 8,022 | 2.2 | % | 10.90 | 736 | 4.0 | % | |||||||||||||||||||||||||||||||||||
| Albertsons Companies, Inc. | Safeway (4), Jewel-Osco (3), Tom Thumb (2) | 9 | 6,674 | 1.9 | % | 13.73 | 486 | 2.6 | % | |||||||||||||||||||||||||||||||||||
| Bed Bath & Beyond Inc. | Bed Bath & Beyond (12), Cost Plus World Market (3), buybuy BABY (3) | 18 | 6,517 | 1.8 | % | 13.87 | 470 | 2.5 | % | |||||||||||||||||||||||||||||||||||
| Ross Stores, Inc. | Ross Dress for Less | 18 | 6,172 | 1.7 | % | 11.69 | 528 | 2.9 | % | |||||||||||||||||||||||||||||||||||
| PetSmart, Inc. | 17 | 5,784 | 1.6 | % | 16.72 | 346 | 1.9 | % | ||||||||||||||||||||||||||||||||||||
| Gap Inc. | Old Navy (13), The Gap (4), Banana Republic (3), Janie & Jack (1), Athleta (1), Gap Factory Store (1) | 23 | 5,514 | 1.5 | % | 20.73 | 266 | 1.4 | % | |||||||||||||||||||||||||||||||||||
| Ahold U.S.A. Inc. | Stop & Shop (3), Giant Eagle (1) | 4 | 5,468 | 1.5 | % | 22.60 | 242 | 1.3 | % | |||||||||||||||||||||||||||||||||||
| BJ’s Wholesale Club, Inc. | 2 | 4,939 | 1.4 | % | 20.16 | 245 | 1.3 | % | ||||||||||||||||||||||||||||||||||||
| Michaels Stores, Inc. | Michaels | 16 | 4,723 | 1.3 | % | 12.73 | 371 | 2.0 | % | |||||||||||||||||||||||||||||||||||
| Lowe’s Companies, Inc. | 4 | 3,944 | 1.1 | % | 6.47 | 610 | 3.3 | % | ||||||||||||||||||||||||||||||||||||
| Regal Entertainment Group | Edwards Cinema | 1 | 3,882 | 1.1 | % | 31.06 | 125 | 0.7 | % | |||||||||||||||||||||||||||||||||||
| The Kroger Co. | Kroger (5), Harris Teeter (1), QFC (1) | 7 | 3,639 | 1.0 | % | 10.43 | 349 | 1.9 | % | |||||||||||||||||||||||||||||||||||
| The Home Depot, Inc. | 3 | 3,404 | 1.0 | % | 9.38 | 363 | 2.0 | % | ||||||||||||||||||||||||||||||||||||
| Office Depot, Inc. | Office Depot (8), OfficeMax (2) | 10 | 3,397 | 1.0 | % | 14.71 | 231 | 1.3 | % | |||||||||||||||||||||||||||||||||||
| Petco Animal Supplies, Inc. | 13 | 3,223 | 0.9 | % | 18.01 | 179 | 1.0 | % | ||||||||||||||||||||||||||||||||||||
| Ulta Beauty, Inc. | 14 | 3,174 | 0.9 | % | 21.30 | 149 | 0.8 | % | ||||||||||||||||||||||||||||||||||||
| Party City Holdings Inc. | 14 | 3,148 | 0.9 | % | 14.51 | 217 | 1.2 | % | ||||||||||||||||||||||||||||||||||||
| American Multi-Cinema, Inc. | AMC (1), Carmike Cinema (1) | 2 | 3,076 | 0.9 | % | 25.01 | 123 | 0.7 | % | |||||||||||||||||||||||||||||||||||
| Barnes & Noble, Inc. | 7 | 3,066 | 0.9 | % | 17.83 | 172 | 0.9 | % | ||||||||||||||||||||||||||||||||||||
| State of Maryland | 6 | 3,018 | 0.8 | % | 14.24 | 212 | 1.1 | % | ||||||||||||||||||||||||||||||||||||
| Staples, Inc. | 8 | 2,999 | 0.8 | % | 18.18 | 165 | 0.9 | % | ||||||||||||||||||||||||||||||||||||
| Total Wine and More | 9 | 2,976 | 0.8 | % | 14.88 | 200 | 1.1 | % | ||||||||||||||||||||||||||||||||||||
| Designer Brands Inc. | DSW Shoe Warehouse | 9 | 2,798 | 0.8 | % | 15.54 | 180 | 1.0 | % | |||||||||||||||||||||||||||||||||||
| Trader Joe’s | 6 | 2,505 | 0.7 | % | 32.53 | 77 | 0.4 | % | ||||||||||||||||||||||||||||||||||||
| Total Top Retail Tenants | 257 | $ | 110,649 | 30.9 | % | $ | 14.69 | 7,533 | 40.9 | % | ||||||||||||||||||||||||||||||||||
| 3rd Quarter 2020 Supplemental Information | 16 | |||||||
Retail Properties of America, Inc.
Retail Leasing Activity Summary
(square footage amounts in thousands)
The following table summarizes the leasing activity in the Company’s retail operating portfolio as of September 30, 2020 and for the preceding four quarters. New leases with terms of less than 12 months and renewal leases that extend the lease term by less than 12 months have been excluded.
| Total Leases | ||||||||||||||||||||||||||||||||||||||||||||
| Number of Leases Signed | GLA Signed | New Contractual Rent per Square Foot (PSF) (a) | Prior Contractual Rent PSF (a) | % Change over Prior ABR (a) | WA Lease Term | Tenant Allowances PSF | ||||||||||||||||||||||||||||||||||||||
| Q3 2020 (b) | 105 | 810 | $ | 19.42 | $ | 18.93 | 2.6 | % | (c) | 7.4 | (c) | $ | 12.11 | (c) | ||||||||||||||||||||||||||||||
| Q2 2020 | 66 | 323 | $ | 23.03 | $ | 22.88 | 0.7 | % | 7.5 | $ | 8.89 | |||||||||||||||||||||||||||||||||
| Q1 2020 (b) | 82 | 285 | $ | 22.39 | $ | 21.35 | 4.9 | % | 6.2 | $ | 18.51 | |||||||||||||||||||||||||||||||||
| Q4 2019 (b) | 132 | 773 | $ | 20.28 | $ | 18.97 | 6.9 | % | 6.8 | $ | 20.01 | |||||||||||||||||||||||||||||||||
| Total – 12 months (b) | 385 | 2,191 | $ | 20.58 | $ | 19.80 | 3.9 | % | 7.1 | $ | 15.09 | |||||||||||||||||||||||||||||||||
| Comparable Renewal Leases | ||||||||||||||||||||||||||||||||||||||||||||
| Number of Leases Signed | GLA Signed | New Contractual Rent PSF | Prior Contractual Rent PSF | % Change over Prior ABR | WA Lease Term | Tenant Allowances PSF | ||||||||||||||||||||||||||||||||||||||
| Q3 2020 | 69 | 664 | $ | 18.82 | $ | 18.24 | 3.2 | % | (d) | 7.3 | (d) | $ | 6.38 | (d) | ||||||||||||||||||||||||||||||
| Q2 2020 | 45 | 194 | $ | 24.22 | $ | 22.93 | 5.6 | % | 4.9 | $ | 0.70 | |||||||||||||||||||||||||||||||||
| Q1 2020 (b) | 62 | 195 | $ | 22.29 | $ | 21.25 | 4.9 | % | 4.8 | $ | 8.73 | |||||||||||||||||||||||||||||||||
| Q4 2019 | 80 | 388 | $ | 20.53 | $ | 19.70 | 4.2 | % | 4.3 | $ | 1.89 | |||||||||||||||||||||||||||||||||
| Total – 12 months (b) | 256 | 1,441 | $ | 20.48 | $ | 19.67 | 4.1 | % | 5.8 | $ | 4.68 | |||||||||||||||||||||||||||||||||
| Comparable New Leases | ||||||||||||||||||||||||||||||||||||||||||||
| Number of Leases Signed | GLA Signed | New Contractual Rent PSF | Prior Contractual Rent PSF | % Change over Prior ABR | WA Lease Term | Tenant Allowances PSF | ||||||||||||||||||||||||||||||||||||||
| Q3 2020 | 17 | 73 | $ | 24.84 | $ | 25.15 | (1.2) | % | 9.1 | $ | 46.34 | |||||||||||||||||||||||||||||||||
| Q2 2020 | 8 | 52 | $ | 18.64 | $ | 22.71 | (17.9) | % | 9.6 | $ | 33.23 | |||||||||||||||||||||||||||||||||
| Q1 2020 (b) | 5 | 33 | $ | 23.01 | $ | 21.95 | 4.8 | % | 9.4 | $ | 41.30 | |||||||||||||||||||||||||||||||||
| Q4 2019 (b) | 17 | 168 | $ | 19.71 | $ | 17.27 | 14.1 | % | 10.6 | $ | 50.34 | |||||||||||||||||||||||||||||||||
| Total – 12 months (b) | 47 | 326 | $ | 21.03 | $ | 20.39 | 3.1 | % | 10.0 | $ | 45.53 | |||||||||||||||||||||||||||||||||
| Non-Comparable New and Renewal Leases (e) | ||||||||||||||||||||||||||||||||||||||||||||
| Number of Leases Signed | GLA Signed | New Contractual Rent PSF | Prior Contractual Rent PSF | % Change over Prior ABR | WA Lease Term | Tenant Allowances PSF | ||||||||||||||||||||||||||||||||||||||
| Q3 2020 (b) | 19 | 73 | $ | 25.61 | n/a | n/a | 6.2 | $ | 30.10 | |||||||||||||||||||||||||||||||||||
| Q2 2020 | 13 | 77 | $ | 32.45 | n/a | n/a | 11.7 | $ | 13.01 | |||||||||||||||||||||||||||||||||||
| Q1 2020 (b) | 15 | 57 | $ | 26.62 | n/a | n/a | 8.7 | $ | 47.57 | |||||||||||||||||||||||||||||||||||
| Q4 2019 (b) | 35 | 217 | $ | 14.96 | n/a | n/a | 9.1 | $ | 34.51 | |||||||||||||||||||||||||||||||||||
| Total – 12 months (b) | 82 | 424 | $ | 21.54 | n/a | n/a | 9.1 | $ | 31.33 | |||||||||||||||||||||||||||||||||||
(a)Excludes the impact of Non-Comparable New and Renewal Leases.
(b)All columns include leasing activity and related information pertaining to the Company’s active and near-term expansion and redevelopment projects except the “Tenant Allowances PSF” column, which excludes tenant allowances and related square foot amounts related to leasing activity at these projects. Such tenant allowances, if any, are included in the estimated net RPAI project investment amounts shown on page 9.
(c)One significant comparable renewal lease, which extended the term of an existing tenant by 14 years, materially weighted the Q3 2020 statistics. Excluding this one comparable renewal lease, Total Leases Q3 2020 % Change over Prior ABR, WA Lease Term and Tenant Allowances PSF would have been 3.5%, 5.6 years and $8.47, respectively.
(d)Excluding the significant comparable renewal lease described in footnote (c), Comparable Renewal Leases Q3 2020 % Change over Prior ABR, WA Lease Term and Tenant Allowances PSF would have been 4.4%, 4.7 years and $0.44, respectively.
(e)Includes (i) leases signed on units that were vacant for over 12 months, (ii) leases signed with variable lease payment terms and (iii) leases signed where the previous and current lease do not have a consistent lease structure.
| 3rd Quarter 2020 Supplemental Information | 17 | |||||||
Retail Properties of America, Inc.
Retail Lease Expirations as of September 30, 2020
(dollar amounts and square footage in thousands)
The following tables set forth a summary, as of September 30, 2020, of lease expirations scheduled to occur during the remainder of 2020 and each of the nine calendar years from 2021 to 2029 and thereafter, assuming no exercise of renewal options or early termination rights for all leases in the Company’s retail operating portfolio. The following tables are based on leases commenced as of September 30, 2020. Dollars (other than per square foot information) and square feet of GLA are presented in thousands in the table.
| Lease Expiration Year | Lease Count | ABR | % of Total ABR | ABR per Occupied Sq. Ft. | ABR at Exp. (a) | ABR per Occupied Sq. Ft. at Exp. | GLA | % of Occupied GLA | % of Total GLA | |||||||||||||||||||||||||||||||||||||||||||||||
| 2020 | 83 | $ | 6,451 | 1.8 | % | $ | 25.10 | $ | 6,452 | $ | 25.11 | 257 | 1.4 | % | 1.3 | % | ||||||||||||||||||||||||||||||||||||||||
| 2021 | 282 | 37,292 | 10.4 | % | 21.78 | 37,459 | 21.88 | 1,712 | 9.2 | % | 8.6 | % | ||||||||||||||||||||||||||||||||||||||||||||
| 2022 | 347 | 51,115 | 14.3 | % | 16.90 | 51,866 | 17.15 | 3,024 | 16.5 | % | 15.2 | % | ||||||||||||||||||||||||||||||||||||||||||||
| 2023 | 361 | 50,363 | 14.1 | % | 19.63 | 51,465 | 20.06 | 2,566 | 14.0 | % | 12.9 | % | ||||||||||||||||||||||||||||||||||||||||||||
| 2024 | 421 | 57,191 | 16.0 | % | 19.93 | 59,268 | 20.66 | 2,869 | 15.6 | % | 14.4 | % | ||||||||||||||||||||||||||||||||||||||||||||
| 2025 | 249 | 38,970 | 10.9 | % | 18.52 | 41,355 | 19.66 | 2,104 | 11.4 | % | 10.5 | % | ||||||||||||||||||||||||||||||||||||||||||||
| 2026 | 133 | 26,358 | 7.4 | % | 17.17 | 29,234 | 19.04 | 1,535 | 8.3 | % | 7.7 | % | ||||||||||||||||||||||||||||||||||||||||||||
| 2027 | 83 | 13,160 | 3.6 | % | 15.82 | 14,649 | 17.61 | 832 | 4.6 | % | 4.1 | % | ||||||||||||||||||||||||||||||||||||||||||||
| 2028 | 84 | 16,732 | 4.7 | % | 22.67 | 19,155 | 25.96 | 738 | 4.0 | % | 3.7 | % | ||||||||||||||||||||||||||||||||||||||||||||
| 2029 | 98 | 23,704 | 6.6 | % | 21.69 | 26,458 | 24.21 | 1,093 | 6.0 | % | 5.5 | % | ||||||||||||||||||||||||||||||||||||||||||||
| Thereafter | 126 | 35,443 | 9.9 | % | 21.99 | 42,100 | 26.12 | 1,612 | 8.7 | % | 8.0 | % | ||||||||||||||||||||||||||||||||||||||||||||
| Month-to-month | 23 | 1,166 | 0.3 | % | 16.42 | 1,166 | 16.42 | 71 | 0.3 | % | 0.3 | % | ||||||||||||||||||||||||||||||||||||||||||||
| Leased Total | 2,290 | $ | 357,945 | 100.0 | % | $ | 19.44 | $ | 380,627 | $ | 20.67 | 18,413 | 100.0 | % | 92.2 | % | ||||||||||||||||||||||||||||||||||||||||
| Leases signed but not commenced | 25 | $ | 5,978 | — | $ | 19.04 | $ | 6,626 | $ | 21.10 | 314 | — | 1.6 | % | ||||||||||||||||||||||||||||||||||||||||||
| Available | 1,235 | — | 6.2 | % | ||||||||||||||||||||||||||||||||||||||||||||||||||||
The following tables break down the above information into anchor (10,000 sf and above) and non-anchor (under 10,000 sf) details for the Company’s retail operating portfolio. Dollars (other than per square foot information) and square feet of GLA are presented in thousands in the tables. | ||||||||||||||||||||||||||||||||||||||||||||||||||||||||
| Anchor | ||||||||||||||||||||||||||||||||||||||||||||||||||||||||
| Lease Expiration Year | Lease Count | ABR | % of Total ABR | ABR per Occupied Sq. Ft. | ABR at Exp. (a) | ABR per Occupied Sq. Ft. at Exp. | GLA | % of Occupied GLA | % of Total GLA | |||||||||||||||||||||||||||||||||||||||||||||||
| 2020 | 2 | $ | 479 | 0.1 | % | $ | 10.64 | $ | 479 | $ | 10.64 | 45 | 0.2 | % | 0.2 | % | ||||||||||||||||||||||||||||||||||||||||
| 2021 | 36 | 18,010 | 5.0 | % | 17.62 | 18,073 | 17.68 | 1,022 | 5.5 | % | 5.1 | % | ||||||||||||||||||||||||||||||||||||||||||||
| 2022 | 62 | 27,362 | 7.7 | % | 12.41 | 27,558 | 12.50 | 2,204 | 12.0 | % | 11.1 | % | ||||||||||||||||||||||||||||||||||||||||||||
| 2023 | 59 | 22,808 | 6.4 | % | 13.83 | 22,890 | 13.88 | 1,649 | 9.0 | % | 8.3 | % | ||||||||||||||||||||||||||||||||||||||||||||
| 2024 | 65 | 23,271 | 6.5 | % | 12.82 | 23,430 | 12.91 | 1,815 | 9.9 | % | 9.1 | % | ||||||||||||||||||||||||||||||||||||||||||||
| 2025 | 45 | 19,115 | 5.4 | % | 13.51 | 19,773 | 13.97 | 1,415 | 7.7 | % | 7.1 | % | ||||||||||||||||||||||||||||||||||||||||||||
| 2026 | 39 | 15,741 | 4.4 | % | 13.14 | 16,903 | 14.11 | 1,198 | 6.5 | % | 6.0 | % | ||||||||||||||||||||||||||||||||||||||||||||
| 2027 | 16 | 6,191 | 1.7 | % | 10.30 | 6,723 | 11.19 | 601 | 3.3 | % | 3.0 | % | ||||||||||||||||||||||||||||||||||||||||||||
| 2028 | 18 | 8,582 | 2.4 | % | 16.99 | 9,433 | 18.68 | 505 | 2.7 | % | 2.5 | % | ||||||||||||||||||||||||||||||||||||||||||||
| 2029 | 30 | 17,156 | 4.8 | % | 19.10 | 18,443 | 20.54 | 898 | 4.9 | % | 4.5 | % | ||||||||||||||||||||||||||||||||||||||||||||
| Thereafter | 39 | 24,804 | 6.9 | % | 19.65 | 29,278 | 23.20 | 1,262 | 6.8 | % | 6.3 | % | ||||||||||||||||||||||||||||||||||||||||||||
| Month-to-month | 1 | — | — | % | — | — | — | 25 | 0.1 | % | 0.1 | % | ||||||||||||||||||||||||||||||||||||||||||||
| Leased Total | 412 | $ | 183,519 | 51.3 | % | $ | 14.52 | $ | 192,983 | $ | 15.27 | 12,639 | 68.6 | % | 63.3 | % | ||||||||||||||||||||||||||||||||||||||||
| Leases signed but not commenced | 7 | $ | 4,243 | — | $ | 17.04 | $ | 4,678 | $ | 18.79 | 249 | — | 1.3 | % | ||||||||||||||||||||||||||||||||||||||||||
| Available | 402 | — | 2.0 | % | ||||||||||||||||||||||||||||||||||||||||||||||||||||
| Non-Anchor | ||||||||||||||||||||||||||||||||||||||||||||||||||||||||
| Lease Expiration Year | Lease Count | ABR | % of Total ABR | ABR per Occupied Sq. Ft. | ABR at Exp. (a) | ABR per Occupied Sq. Ft. at Exp. | GLA | % of Occupied GLA | % of Total GLA | |||||||||||||||||||||||||||||||||||||||||||||||
| 2020 | 81 | $ | 5,972 | 1.7 | % | $ | 28.17 | $ | 5,973 | $ | 28.17 | 212 | 1.2 | % | 1.1 | % | ||||||||||||||||||||||||||||||||||||||||
| 2021 | 246 | 19,282 | 5.4 | % | 27.94 | 19,386 | 28.10 | 690 | 3.7 | % | 3.5 | % | ||||||||||||||||||||||||||||||||||||||||||||
| 2022 | 285 | 23,753 | 6.6 | % | 28.97 | 24,308 | 29.64 | 820 | 4.5 | % | 4.1 | % | ||||||||||||||||||||||||||||||||||||||||||||
| 2023 | 302 | 27,555 | 7.7 | % | 30.05 | 28,575 | 31.16 | 917 | 5.0 | % | 4.6 | % | ||||||||||||||||||||||||||||||||||||||||||||
| 2024 | 356 | 33,920 | 9.5 | % | 32.18 | 35,838 | 34.00 | 1,054 | 5.7 | % | 5.3 | % | ||||||||||||||||||||||||||||||||||||||||||||
| 2025 | 204 | 19,855 | 5.5 | % | 28.82 | 21,582 | 31.32 | 689 | 3.7 | % | 3.4 | % | ||||||||||||||||||||||||||||||||||||||||||||
| 2026 | 94 | 10,617 | 3.0 | % | 31.50 | 12,331 | 36.59 | 337 | 1.8 | % | 1.7 | % | ||||||||||||||||||||||||||||||||||||||||||||
| 2027 | 67 | 6,969 | 1.9 | % | 30.17 | 7,926 | 34.31 | 231 | 1.3 | % | 1.1 | % | ||||||||||||||||||||||||||||||||||||||||||||
| 2028 | 66 | 8,150 | 2.3 | % | 34.98 | 9,722 | 41.73 | 233 | 1.3 | % | 1.2 | % | ||||||||||||||||||||||||||||||||||||||||||||
| 2029 | 68 | 6,548 | 1.8 | % | 33.58 | 8,015 | 41.10 | 195 | 1.1 | % | 1.0 | % | ||||||||||||||||||||||||||||||||||||||||||||
| Thereafter | 87 | 10,639 | 3.0 | % | 30.40 | 12,822 | 36.63 | 350 | 1.9 | % | 1.7 | % | ||||||||||||||||||||||||||||||||||||||||||||
| Month-to-month | 22 | 1,166 | 0.3 | % | 25.35 | 1,166 | 25.35 | 46 | 0.2 | % | 0.2 | % | ||||||||||||||||||||||||||||||||||||||||||||
| Leased Total | 1,878 | $ | 174,426 | 48.7 | % | $ | 30.21 | $ | 187,644 | $ | 32.50 | 5,774 | 31.4 | % | 28.9 | % | ||||||||||||||||||||||||||||||||||||||||
| Leases signed but not commenced | 18 | $ | 1,735 | — | $ | 26.69 | $ | 1,948 | $ | 29.97 | 65 | — | 0.3 | % | ||||||||||||||||||||||||||||||||||||||||||
| Available | 833 | — | 4.2 | % | ||||||||||||||||||||||||||||||||||||||||||||||||||||
(a)Represents annualized base rent at the scheduled expiration of the lease giving effect to fixed contractual increases in base rent.
| 3rd Quarter 2020 Supplemental Information | 18 | |||||||
Retail Properties of America, Inc.
COVID-19 Disclosure – Tenant Resiliency and Rent Collections as of October 26, 2020
(dollar amounts in thousands)
The following information is based on ABR of leases in our retail operating portfolio that were in effect as of June 30, 2020 in relation to information as of the second quarter of 2020 and as of September 30, 2020 in relation to information as of the third quarter of 2020 and October 2020 and is being provided to assist with analysis of the potential impact of COVID-19. The information may not be indicative of collection and lease concession activity in future periods. The classification of tenant type, including the classification between essential and non-essential, is based on management’s understanding of the tenant operations and may not be comparative to similarly titled classifications by other companies. Dollars are presented in thousands.
| % of 9/30/2020 ABR | % of Rent Collected | |||||||||||||||||||||||||||||||||||||||||||||||||
| Resiliency Category/ Tenant Type | 9/30/2020 ABR | Q2 2020 | July 2020 | August 2020 | September 2020 | Q3 2020 | October 2020 | |||||||||||||||||||||||||||||||||||||||||||
| Essential | ||||||||||||||||||||||||||||||||||||||||||||||||||
| Grocery/Warehouse Clubs | $ | 30,338 | 8.5 | % | 99.9 | % | 99.9 | % | 99.9 | % | 99.9 | % | 99.9 | % | 99.4 | % | ||||||||||||||||||||||||||||||||||
| Financial Services/Banks | 13,328 | 3.7 | % | 99.5 | % | 98.5 | % | 98.0 | % | 99.8 | % | 98.8 | % | 98.7 | % | |||||||||||||||||||||||||||||||||||
| Medical | 12,605 | 3.5 | % | 88.8 | % | 89.9 | % | 85.5 | % | 84.3 | % | 86.5 | % | 87.8 | % | |||||||||||||||||||||||||||||||||||
| Hardware | 10,136 | 2.9 | % | 90.6 | % | 91.0 | % | 91.0 | % | 99.0 | % | 93.7 | % | 97.5 | % | |||||||||||||||||||||||||||||||||||
| Electronics | 10,067 | 2.8 | % | 99.1 | % | 99.7 | % | 99.7 | % | 99.2 | % | 99.5 | % | 99.2 | % | |||||||||||||||||||||||||||||||||||
| Auto and Other Essentials | 10,027 | 2.8 | % | 95.8 | % | 96.8 | % | 97.4 | % | 96.6 | % | 96.9 | % | 92.7 | % | |||||||||||||||||||||||||||||||||||
| Pet/Animal Supplies | 9,757 | 2.7 | % | 99.4 | % | 66.9 | % | 64.4 | % | 92.0 | % | 74.5 | % | 99.6 | % | |||||||||||||||||||||||||||||||||||
| Wireless Communications | 6,445 | 1.8 | % | 93.4 | % | 94.5 | % | 97.1 | % | 95.3 | % | 95.7 | % | 87.2 | % | |||||||||||||||||||||||||||||||||||
| Office Supplies | 6,396 | 1.8 | % | 100.0 | % | 100.0 | % | 100.0 | % | 100.0 | % | 100.0 | % | 93.7 | % | |||||||||||||||||||||||||||||||||||
| Drug Stores | 3,191 | 0.9 | % | 99.3 | % | 98.3 | % | 98.3 | % | 98.3 | % | 98.3 | % | 99.0 | % | |||||||||||||||||||||||||||||||||||
| Total Essential | 112,290 | 31.4 | % | 96.9 | % | 94.3 | % | 93.8 | % | 96.7 | % | 94.9 | % | 96.2 | % | |||||||||||||||||||||||||||||||||||
| Office | 23,922 | 6.7 | % | 94.0 | % | 96.3 | % | 95.0 | % | 90.2 | % | 93.8 | % | 91.3 | % | |||||||||||||||||||||||||||||||||||
| Non-Essential | ||||||||||||||||||||||||||||||||||||||||||||||||||
| Apparel | 34,672 | 9.7 | % | 45.6 | % | 73.8 | % | 85.9 | % | 86.8 | % | 82.2 | % | 83.0 | % | |||||||||||||||||||||||||||||||||||
| Soft Goods/Discount Stores | 25,410 | 7.1 | % | 65.3 | % | 48.9 | % | 49.7 | % | 98.2 | % | 65.6 | % | 98.5 | % | |||||||||||||||||||||||||||||||||||
| Housewares | 24,242 | 6.8 | % | 73.7 | % | 80.5 | % | 85.5 | % | 93.9 | % | 86.6 | % | 92.9 | % | |||||||||||||||||||||||||||||||||||
| Services | 21,863 | 6.1 | % | 65.1 | % | 84.0 | % | 83.2 | % | 88.3 | % | 85.2 | % | 84.2 | % | |||||||||||||||||||||||||||||||||||
| Sporting Goods/Hobby | 13,659 | 3.8 | % | 72.9 | % | 92.3 | % | 84.1 | % | 94.1 | % | 90.2 | % | 88.5 | % | |||||||||||||||||||||||||||||||||||
| Specialty | 10,362 | 2.9 | % | 81.8 | % | 94.4 | % | 96.4 | % | 90.5 | % | 93.8 | % | 89.9 | % | |||||||||||||||||||||||||||||||||||
| Movie Theaters | 10,294 | 2.9 | % | 9.0 | % | 24.0 | % | 33.6 | % | 33.6 | % | 30.4 | % | 33.6 | % | |||||||||||||||||||||||||||||||||||
| Health Clubs | 9,439 | 2.6 | % | 30.1 | % | 63.2 | % | 55.6 | % | 68.5 | % | 62.4 | % | 59.4 | % | |||||||||||||||||||||||||||||||||||
| Other | 7,492 | 2.1 | % | 58.2 | % | 65.3 | % | 98.8 | % | 96.6 | % | 86.9 | % | 91.8 | % | |||||||||||||||||||||||||||||||||||
| Book Stores | 3,945 | 1.1 | % | 59.0 | % | 100.0 | % | 99.8 | % | 100.0 | % | 99.9 | % | 92.1 | % | |||||||||||||||||||||||||||||||||||
| Amusement/Play Centers | 2,116 | 0.6 | % | 10.6 | % | 5.9 | % | 19.4 | % | 36.4 | % | 20.6 | % | 49.1 | % | |||||||||||||||||||||||||||||||||||
| Total Non-Essential | 163,494 | 45.7 | % | 57.6 | % | 70.6 | % | 75.3 | % | 86.4 | % | 77.5 | % | 83.7 | % | |||||||||||||||||||||||||||||||||||
| Restaurants | ||||||||||||||||||||||||||||||||||||||||||||||||||
| Restaurants – Full Service | 30,699 | 8.5 | % | 63.1 | % | 68.5 | % | 72.5 | % | 73.4 | % | 71.5 | % | 73.4 | % | |||||||||||||||||||||||||||||||||||
| Restaurants – Quick Service | 27,540 | 7.7 | % | 72.4 | % | 82.1 | % | 87.1 | % | 87.9 | % | 85.7 | % | 82.6 | % | |||||||||||||||||||||||||||||||||||
| Total Restaurants | 58,239 | 16.2 | % | 67.4 | % | 74.9 | % | 79.3 | % | 80.1 | % | 78.1 | % | 77.7 | % | |||||||||||||||||||||||||||||||||||
| Total Retail Operating Portfolio | $ | 357,945 | 100.0 | % | 73.6 | % | 80.5 | % | 83.1 | % | 88.9 | % | 84.2 | % | 87.2 | % | ||||||||||||||||||||||||||||||||||
| Billed Base Rent Addressed as of October 26, 2020 | Q2 2020 | Q3 2020 | |||||||||
| Billed base rent collected | 73.6 | % | 84.2 | % | |||||||
| Security deposits applied | 2.7 | % | 0.1 | % | |||||||
| Executed lease amendments: | |||||||||||
| Deferral accounting treatment | 6.9 | % | 5.0 | % | |||||||
| Abatements, combinations, modifications | 5.0 | % | 2.4 | % | |||||||
| In-process lease amendments: (a) | |||||||||||
| Deferral accounting treatment | 2.0 | % | 0.5 | % | |||||||
| Abatements, combinations, modifications | 3.3 | % | 1.1 | % | |||||||
| Total billed base rent addressed | 93.5 | % | 93.3 | % | |||||||
(a)The Company can make no assurances that the in-process lease amendments will ultimately be executed in the lease concession type being actively negotiated, or at all.
| 3rd Quarter 2020 Supplemental Information | 19 | |||||||
Retail Properties of America, Inc.
COVID-19 Disclosure – Supplemental Base Rent Reconciliations
(amounts in thousands)
(unaudited)
Reconciliation of Base Rent – Total Portfolio
| Three Months Ended | % of Billed Base Rent | ||||||||||
| September 30, 2020 | |||||||||||
| Billed base rent – Q3 2020 | $ | 89,922 | |||||||||
| Adjustments to billed base rent (abatement, combinations, modifications) pertaining to Q3 2020 amounts (a) | (2,006) | 2.2 | % | ||||||||
| Adjustments to billed base rent (abatement, combinations, modifications) pertaining to Q2 2020 and prior amounts (b) | (4,045) | ||||||||||
| Base rent | 83,871 | ||||||||||
| Adjustments to billed base rent (abatement, combinations, modifications) pertaining to Q2 2020 and prior amounts (b) | 4,045 | ||||||||||
| Adjusted base rent – Q3 2020 | 87,916 | ||||||||||
| Billed base rent – Q3 2020 collected through September 30, 2020 (c) | (72,953) | 81.1 | % | ||||||||
| Uncollected adjusted base rent – Q3 2020 as of September 30, 2020 | 14,963 | ||||||||||
| Billed base rent – Q3 2020 deferred – executed or agreed in principle through September 30, 2020 (d) | (4,878) | 5.4 | % | ||||||||
| Uncollected adjusted base rent – Q3 2020, net of deferrals as of September 30, 2020 | $ | 10,085 | 11.2 | % | |||||||
| Billed base rent – Q3 2020 collected subsequent to September 30, 2020 (through October 26, 2020) | $ | 1,917 | 2.1 | % | |||||||
| Uncollectible lease income, net components: | |||||||||||
| Uncollected amounts related to tenants accounted for on the cash basis of accounting, net | $ | 3,869 | |||||||||
| Estimated impact of lease concession agreements that have not yet been executed | 4,517 | ||||||||||
Reclassification of the impact of lease concession agreements executed during the current period, however were agreed in principle in the prior quarter | (4,381) | ||||||||||
| Other general reserve | 1,034 | ||||||||||
| Uncollectible lease income, net (e) | $ | 5,039 | |||||||||
Reconciliation of Base Rent – Same Store Portfolio
| Three Months Ended | % of Billed Base Rent | ||||||||||
| September 30, 2020 | |||||||||||
| Billed base rent – Q3 2020 – same store | $ | 88,621 | |||||||||
| Adjustments to billed base rent (abatement, combinations, modifications) pertaining to Q3 2020 amounts – same store (a) | (2,006) | 2.3 | % | ||||||||
Adjustments to billed base rent (abatement, combinations, modifications) pertaining to Q2 2020 and prior amounts – same store (b) | (4,045) | ||||||||||
| Base rent – same store | 82,570 | ||||||||||
Adjustments to billed base rent (abatement, combinations, modifications) pertaining to Q2 2020 and prior amounts – same store (b) | 4,045 | ||||||||||
| Adjusted base rent – Q3 2020 – same store | 86,615 | ||||||||||
| Billed base rent – Q3 2020 collected through September 30, 2020 – same store (c) | (71,960) | 81.2 | % | ||||||||
| Uncollected adjusted base rent – Q3 2020 as of September 30, 2020 – same store | 14,655 | ||||||||||
| Billed base rent – Q3 2020 deferred – executed or agreed in principle through September 30, 2020 – same store (d) | (4,871) | 5.5 | % | ||||||||
| Uncollected adjusted base rent – Q3 2020, net of deferrals as of September 30, 2020 – same store | $ | 9,784 | 11.0 | % | |||||||
| Billed base rent – Q3 2020 collected subsequent to September 30, 2020 (through October 26, 2020) – same store | $ | 1,768 | 2.0 | % | |||||||
| Uncollectible lease income, net components: | |||||||||||
| Uncollected amounts related to tenants accounted for on the cash basis of accounting, net – same store | $ | 3,847 | |||||||||
| Estimated impact of lease concession agreements that have not yet been executed – same store | 4,112 | ||||||||||
Reclassification of the impact of lease concession agreements executed during the current period, however were agreed in principle in the prior quarter – same store | (4,381) | ||||||||||
| Other general reserve – same store | 989 | ||||||||||
| Uncollectible lease income, net – same store (e) | $ | 4,567 | |||||||||
(a)Amount represents aggregate impact on base rent from lease concession agreements that were executed during the three months ended September 30, 2020, and relate to base rent from the three months ended September 30, 2020, that do not meet deferral accounting treatment such as those that (i) include any amount of abated rent, including agreements that include both abated and deferred rent, (ii) are deferrals with modest extension of lease term or (iii) are accounted for as lease modifications. Refer to page 22 for the Company’s accounting treatment for lease concessions related to the impact from COVID-19.
(b)Amount represents aggregate impact on base rent from lease concession agreements that were executed during the three months ended September 30, 2020, but relate to base rent from the three months ended June 30, 2020 and prior periods, that do not meet deferral accounting treatment. As such amounts represent out-of-period adjustments to base rent and, for purposes of this presentation, such adjustments are added back to arrive at “Adjusted base rent – Q3 2020.” Amounts were recorded within “Uncollectible lease income, net” during the three months ended June 30, 2020, resulting in a neutral impact to lease income in the three months ended September 30, 2020. Refer to page 22 for the Company’s accounting treatment for lease concessions related to the impact from COVID-19.
(c)Amount includes (i) cash collected through September 30, 2020 that was applied to third quarter billed base rent amounts and (ii) the application of pre-existing tenant security deposits in the amount of $104 for both the total portfolio and the same store portfolio. Amount excludes cash collected that pertains to other periods and other types of charges.
(d)Amount includes lease concession agreements executed or agreed in principle as of September 30, 2020, representing deferrals for which the Company elected to recognize revenue during the deferral period. The Company can provide no assurances that the in-process lease deferral agreements will ultimately be executed in the manner of concession intended, or at all. Refer to page 22 for the Company’s accounting treatment for lease concessions related to the impact from COVID-19.
(e)Uncollectible lease income, net relates to uncollected amounts pertaining primarily to base rent, but also to tenant recoveries and other lease-related income.
| 3rd Quarter 2020 Supplemental Information | 20 | |||||||
Retail Properties of America, Inc.
Non-GAAP Financial Measures and Other Definitions
Gross Leasable Area (GLA)
Gross Leasable Area (GLA) is defined as the aggregate number of square feet available for lease. GLA excludes square footage attributable to third-party managed storage units and multi-family rental units, of which the Company owned 62,000 square feet of managed storage space and 18 multi-family rental units as of September 30, 2020.
Occupancy
Occupancy is defined, for a property or group of properties, as the ratio, expressed as a percentage, of (a) the number of square feet of such property economically occupied by tenants under leases with an initial term of greater than one year, to (b) the aggregate number of square feet for such property.
Percent Leased Including Signed
Percent Leased Including Signed is defined, for a property or group of properties, as the ratio, expressed as a percentage, of (a) the sum of occupied square feet (pursuant to the definition above) of such property and vacant square feet for which a lease with an initial term of greater than one year has been signed, but rent has not yet commenced, to (b) the aggregate number of square feet for such property.
Metropolitan Statistical Area (MSA)
Metropolitan Statistical Area (MSA) information is sourced from the United States Census Bureau and rank is determined based on the most recently available population estimates.
Funds From Operations (FFO) Attributable to Common Shareholders
As defined by the National Association of Real Estate Investment Trusts (NAREIT), an industry trade group, Funds From Operations (FFO) means net income computed in accordance with generally accepted accounting principles (GAAP), excluding (i) depreciation and amortization related to real estate, (ii) gains from sales of real estate assets, (iii) gains and losses from change in control and (iv) impairment write-downs of real estate assets and investments in entities directly attributable to decreases in the value of real estate held by the entity. The Company has adopted the NAREIT definition in its computation of FFO attributable to common shareholders. The Company believes that, subject to the following limitations, FFO attributable to common shareholders provides a basis for comparing its performance and operations to those of other real estate investment trusts (REITs). The Company believes that FFO attributable to common shareholders, which is a supplemental non-GAAP financial measure, provides an additional and useful means to assess the operating performance of REITs. FFO attributable to common shareholders does not represent an alternative to (i) “Net income” or “Net income attributable to common shareholders” as an indicator of the Company’s financial performance, or (ii) “Cash flows from operating activities” in accordance with GAAP as a measure of the Company’s capacity to fund cash needs, including the payment of dividends.
Operating FFO Attributable to Common Shareholders
Operating FFO attributable to common shareholders is defined as FFO attributable to common shareholders excluding the impact of discrete non-operating transactions and other events which the Company does not consider representative of the comparable operating results of its real estate operating portfolio, which is its core business platform. Specific examples of discrete non-operating transactions and other events include, but are not limited to, the impact on earnings from gains or losses associated with the early extinguishment of debt or other liabilities, litigation involving the Company, including gains recognized as a result of settlement and costs to engage outside counsel related to litigation with former tenants, the impact on earnings from executive separation and the excess of redemption value over carrying value of preferred stock redemption, which are not otherwise adjusted in the Company’s calculation of FFO attributable to common shareholders. The Company believes that Operating FFO attributable to common shareholders, which is a supplemental non-GAAP financial measure, provides an additional and useful means to assess the operating performance of REITs. Operating FFO attributable to common shareholders does not represent an alternative to (i) "Net income" or "Net income attributable to common shareholders" as an indicator of the Company’s financial performance, or (ii) "Cash flows from operating activities" in accordance with GAAP as a measure of the Company’s capacity to fund cash needs, including the payment of dividends. Comparison of the Company’s presentation of Operating FFO attributable to common shareholders to similarly titled measures for other REITs may not necessarily be meaningful due to possible differences in definition and application by such REITs.
Net Operating Income (NOI)
The Company defines Net Operating Income (NOI) as all revenues other than (i) straight-line rental income (non-cash), (ii) amortization of lease inducements, (iii) amortization of acquired above and below market lease intangibles and (iv) lease termination fee income, less real estate taxes and all operating expenses other than lease termination fee expense and non-cash ground rent expense, which is comprised of amortization of right-of-use lease assets and amortization of lease liabilities. NOI consists of Same Store NOI and NOI from Other Investment Properties. The Company believes that NOI, which is a supplemental non-GAAP financial measure, provides an additional and useful operating perspective not immediately apparent from “Net income” or “Net income attributable to common shareholders” in accordance with GAAP. The Company uses NOI to evaluate its performance on a property-by-property basis because this measure allows management to evaluate the impact that factors such as lease structure, lease rates and tenant base have on the Company’s operating results. NOI does not represent an alternative to “Net income” or “Net income attributable to common shareholders” in accordance with GAAP as an indicator of the Company’s financial performance. Comparison of the Company’s presentation of NOI to similarly titled measures for other REITs may not necessarily be meaningful due to possible differences in definition and application by such REITs.
| 3rd Quarter 2020 Supplemental Information | 21 | |||||||
Retail Properties of America, Inc.
Non-GAAP Financial Measures and Other Definitions (continued)
Same Store NOI and NOI from Other Investment Properties
Same Store NOI represents NOI from the Company’s same store portfolio consisting of 101 retail operating properties acquired or placed in service and stabilized prior to January 1, 2019. NOI from Other Investment Properties represents NOI primarily from (i) properties acquired or placed in service during 2019 and 2020, (ii) the multi-family rental units at Plaza del Lago, a redevelopment project that was placed in service during 2019, (iii) Circle East, which is in active redevelopment, (iv) One Loudoun Downtown – Pads G & H, which are in active development, (v) Carillon, a redevelopment project where the Company halted plans for vertical construction during the three months ended March 31, 2020 in response to current macroeconomic conditions due to the impact of the COVID-19 pandemic. As of September 30, 2020, the Company had completed the current scope of site work preparation at the property in anticipation of future vertical development at the site, (vi) The Shoppes at Quarterfield, which is in active redevelopment, (vii) investment properties that were sold or classified as held for sale during 2019 and 2020, and (viii) the net income from the Company’s wholly owned captive insurance company.
The Company believes that Same Store NOI and NOI from Other Investment Properties, which are supplemental non-GAAP financial measures, provide an additional and useful operating perspective not immediately apparent from “Net income” or “Net income attributable to common shareholders” in accordance with GAAP. The Company uses these measures to evaluate its performance on a property-by-property basis because they allow management to evaluate the impact that factors such as lease structure, lease rates and tenant base have on the Company’s operating results. Same Store NOI and NOI from Other Investment Properties do not represent alternatives to “Net income” or “Net income attributable to common shareholders” in accordance with GAAP as indicators of the Company’s financial performance. Comparison of the Company’s presentation of Same Store NOI and NOI from Other Investment Properties to similarly titled measures for other REITs may not necessarily be meaningful due to possible differences in definition and application by such REITs.
EBITDAre and Adjusted EBITDAre
As defined by NAREIT, EBITDA for real estate (EBITDAre) means net income (loss) computed in accordance with GAAP, plus (i) interest expense, (ii) income tax expense, (iii) depreciation and amortization, (iv) impairment charges on investment property and (v) impairment charges on investments in unconsolidated affiliates if caused by a decrease in the value of depreciable property in the affiliate, plus or minus (i) gains from sales of investment property, including gains (or losses) on change in control, and (ii) adjustments to reflect the entity’s share of EBITDAre of unconsolidated affiliates. The Company has adopted the NAREIT definition in its computation of EBITDAre as it believes it provides a basis for comparing the Company’s performance to that of other REITs. The Company also reports Adjusted EBITDAre, which excludes the impact of certain discrete non-operating transactions and other events such as gain on litigation settlement. The Company believes that Adjusted EBITDAre is useful because it allows investors and management to evaluate and compare the Company’s performance from period to period in a meaningful and consistent manner in addition to standard financial measurements under GAAP. EBITDAre and Adjusted EBITDAre are supplemental non-GAAP financial measures and should not be considered alternatives to “Net income” or “Net income attributable to common shareholders” as indicators of the Company’s financial performance. Comparison of the Company’s presentation of EBITDAre and Adjusted EBITDAre to similarly titled measures for other REITs may not necessarily be meaningful due to possible differences in definition and application by such REITs.
Net Debt to Adjusted EBITDAre
Net Debt to Adjusted EBITDAre is a supplemental non-GAAP financial measure and represents (i) the Company’s total debt principal, which excludes unamortized discount and capitalized loan fees, less (ii) cash and cash equivalents divided by (iii) Adjusted EBITDAre for either the prior three months, annualized or the trailing twelve months (Annualized Adjusted EBITDAre). The Company believes that this ratio is useful because it provides investors with information regarding its total debt principal net of cash and cash equivalents, which could be used to repay debt, compared to its performance as measured using Annualized Adjusted EBITDAre. Comparison of the Company’s presentation of Net Debt to Adjusted EBITDAre to similarly titled measures for other REITs may not necessarily be meaningful due to possible differences in definition and application by such REITs.
COVID-19 Lease Concessions – Accounting Treatment
The Company has accounted for executed lease concessions as follows:
| Lease Concession | Accounting Treatment of Concession | |||||||
| (i) Deferral of payment to a future period, with no change in lease term | Treated as if there are no changes to the existing lease contract; no change to lease income recognized, including straight-line rental income. | |||||||
(ii) Deferral of payment to a future period, with a modest extension of lease term (iii) Abatement (iv) Combination of abatement and deferral | Treated as a variable lease adjustment; reduction in lease income for the abated and deferred amounts; however, no change in straight-line rental income. Any deferred amounts will be recognized as lease income if and when payment is received. | |||||||
| (v) Significant lease extension resulting in an increase in cash flows | Existing lease modification guidance under ASC 842 is followed. | |||||||
We have reserved for within uncollectible lease income lease concessions related to the second and third quarters of 2020 that are agreed in principle with the tenant, however, not executed as of September 30, 2020, which are anticipated to provide a concession other than deferral of payment to a future period, with no change in lease term.
Cash-Basis Tenants
For those tenants where the collection of rent over the remaining lease life is not probable, lease income is adjusted such that it is recognized on the cash basis. As a result, all accounts receivable related to these tenants have been reserved in full, including straight-line rental income, and lease income will only be recognized to the extent amounts are paid. The Company will remove the cash-basis designation and resume recording lease income from such tenants on an accrual basis when the Company believes collection of rent over the remaining lease term is probable and, generally, based upon a demonstrated payment history.
| 3rd Quarter 2020 Supplemental Information | 22 | |||||||
Retail Properties of America, Inc.
Reconciliation of Non-GAAP Financial Measures
(amounts in thousands)
(unaudited)
Reconciliation of Net (Loss) Income Attributable to Common Shareholders to Same Store NOI
| Three Months Ended September 30, | Nine Months Ended September 30, | ||||||||||||||||||||||
| 2020 | 2019 | 2020 | 2019 | ||||||||||||||||||||
| Net (loss) income attributable to common shareholders | $ | (2,288) | $ | (28,153) | $ | 12,722 | $ | 16,225 | |||||||||||||||
| Adjustments to reconcile to Same Store NOI: | |||||||||||||||||||||||
| Gain on sales of investment properties | — | (1,969) | — | (18,872) | |||||||||||||||||||
| Gain on litigation settlement | — | — | (6,100) | — | |||||||||||||||||||
| Depreciation and amortization | 41,741 | 67,460 | 125,669 | 153,609 | |||||||||||||||||||
| Provision for impairment of investment properties | 2,279 | 11,177 | 2,625 | 11,177 | |||||||||||||||||||
| General and administrative expenses | 8,514 | 10,334 | 26,170 | 30,186 | |||||||||||||||||||
| Interest expense | 21,941 | 25,084 | 58,347 | 59,877 | |||||||||||||||||||
| Straight-line rental income, net | 269 | (581) | 1,212 | (2,697) | |||||||||||||||||||
| Amortization of acquired above and below market lease intangibles, net | (1,196) | (1,470) | (3,968) | (4,515) | |||||||||||||||||||
| Amortization of lease inducements | 773 | 343 | 1,645 | 958 | |||||||||||||||||||
| Lease termination fees, net | (223) | (331) | (599) | (1,751) | |||||||||||||||||||
| Non-cash ground rent expense, net | 212 | 333 | 757 | 1,023 | |||||||||||||||||||
| Other (income) expense, net | (169) | 1,113 | 377 | 2,244 | |||||||||||||||||||
| NOI | 71,853 | 83,340 | 218,857 | 247,464 | |||||||||||||||||||
| NOI from Other Investment Properties | (719) | (2,105) | (3,278) | (4,869) | |||||||||||||||||||
| Same Store NOI | $ | 71,134 | $ | 81,235 | $ | 215,579 | $ | 242,595 | |||||||||||||||
| 3rd Quarter 2020 Supplemental Information | 23 | |||||||
Retail Properties of America, Inc.
Reconciliation of Non-GAAP Financial Measures (continued)
(amounts in thousands)
(unaudited)
Reconciliation of Mortgages Payable, Net, Unsecured Notes Payable, Net,
Unsecured Term Loans, Net and Unsecured Revolving Line of Credit to Total Net Debt
| September 30, 2020 | December 31, 2019 | ||||||||||
| Mortgages payable, net | $ | 92,075 | $ | 94,155 | |||||||
| Unsecured notes payable, net | 1,185,479 | 796,247 | |||||||||
| Unsecured term loans, net | 467,391 | 716,523 | |||||||||
| Unsecured revolving line of credit | — | 18,000 | |||||||||
| Total | 1,744,945 | 1,624,925 | |||||||||
| Mortgage discount, net of accumulated amortization | 461 | 493 | |||||||||
| Unsecured notes payable discount, net of accumulated amortization | 6,687 | 616 | |||||||||
| Capitalized loan fees, net of accumulated amortization | 10,651 | 6,870 | |||||||||
| Total debt principal | 1,762,744 | 1,632,904 | |||||||||
| Less: consolidated cash and cash equivalents | (27,371) | (9,989) | |||||||||
| Total net debt | $ | 1,735,373 | $ | 1,622,915 | |||||||
Reconciliation of Net (Loss) Income to Adjusted EBITDAre
| Three Months Ended | Nine Months Ended | ||||||||||||||||||||||||||||
| September 30, 2020 | September 30, 2019 | December 31, 2019 | September 30, 2020 | September 30, 2019 | |||||||||||||||||||||||||
| Net (loss) income | $ | (2,288) | $ | (28,153) | $ | 16,172 | $ | 12,722 | $ | 16,225 | |||||||||||||||||||
| Interest expense | 21,941 | 25,084 | 16,694 | 58,347 | 59,877 | ||||||||||||||||||||||||
| Depreciation and amortization | 41,741 | 67,460 | 40,964 | 125,669 | 153,609 | ||||||||||||||||||||||||
| Gain on sales of investment properties | — | (1,969) | — | — | (18,872) | ||||||||||||||||||||||||
| Provision for impairment of investment properties | 2,279 | 11,177 | 1,121 | 2,625 | 11,177 | ||||||||||||||||||||||||
EBITDAre | $ | 63,673 | $ | 73,599 | $ | 74,951 | $ | 199,363 | $ | 222,016 | |||||||||||||||||||
| Gain on litigation settlement | — | — | — | (6,100) | — | ||||||||||||||||||||||||
Adjusted EBITDAre | $ | 63,673 | $ | 73,599 | $ | 74,951 | $ | 193,263 | $ | 222,016 | |||||||||||||||||||
Annualized Adjusted EBITDAre | $ | 254,692 | $ | 294,396 | $ | 299,804 | $ | 257,684 | $ | 296,021 | |||||||||||||||||||
| Trailing Twelve Months Ended September 30, 2020 | Three Months Ended | ||||||||||||||||||||||||||||
| September 30, 2020 | June 30, 2020 | March 31, 2020 | December 31, 2019 | ||||||||||||||||||||||||||
| Net income (loss) | $ | 28,894 | $ | (2,288) | $ | (7,347) | $ | 22,357 | $ | 16,172 | |||||||||||||||||||
| Interest expense | 75,041 | 21,941 | 19,360 | 17,046 | 16,694 | ||||||||||||||||||||||||
| Depreciation and amortization | 166,633 | 41,741 | 43,755 | 40,173 | 40,964 | ||||||||||||||||||||||||
| Provision for impairment of investment properties | 3,746 | 2,279 | — | 346 | 1,121 | ||||||||||||||||||||||||
EBITDAre | $ | 274,314 | $ | 63,673 | $ | 55,768 | $ | 79,922 | $ | 74,951 | |||||||||||||||||||
| Gain on litigation settlement | (6,100) | — | — | (6,100) | — | ||||||||||||||||||||||||
Adjusted EBITDAre | $ | 268,214 | $ | 63,673 | $ | 55,768 | $ | 73,822 | $ | 74,951 | |||||||||||||||||||
| 3rd Quarter 2020 Supplemental Information | 24 | |||||||