Attached files
| file | filename |
|---|---|
| EX-99.1 - EX-99.1 - Matson, Inc. | matx-20201102xex99d1.htm |
| 8-K - 8-K - Matson, Inc. | matx-20201102x8k.htm |
Exhibit 99.2
| 1 Third Quarter 2020 Earnings Conference Call Third Quarter 2020 Earnings Conference Call November 2, 2020 |

| 2 Third Quarter 2020 Earnings Conference Call Forward-Looking Statements Statements made during this presentation that set forth expectations, predictions, projections or are about future events are based on facts and situations that are known to us as of November 2, 2020. We believe that our expectations and assumptions are reasonable. Actual results may differ materially, due to risks and uncertainties, such as those described on pages 24-34 of our Form 10-Q filed on November 2, 2020 and other subsequent filings by Matson with the SEC. Statements made during this presentation are not guarantees of future performance. We do not undertake any obligation to update our forward-looking statements. |
| 3 Third Quarter 2020 Earnings Conference Call Recap of Third Quarter 2020 Results • Recap of Matson’s 3Q20 results: – Matson’s lines of business continued to perform well in 3Q20 despite the ongoing challenges from the COVID-19 pandemic and related economic effects – Ocean Transportation: • China strength – CLX+ voyages and increased capacity in the CLX service • Hawaii, Alaska and Guam volumes improved from levels achieved in 2Q20 as freight demand improved with reopening of local economies – Alaska and Guam volume higher YoY, and Hawaii volume approached 3Q19 level – Logistics: • Continued reopening of the U.S. economy led to improved performance in all of the business lines • In 4Q20, expect our businesses to continue to perform well and to generate strong financial results |
| 4 Third Quarter 2020 Earnings Conference Call Confident CLX+ Can Be a Permanent Service • Why are we confident that we can make the CLX+ service permanent? – 15-year track record of operating the industry leading expedited CLX service – Introduction of AAX helps lower the long-term breakeven economics – Demand and supply dynamics have been favorable and we expect them to continue • Demand fundamentals – seismic shift in e-commerce as a result of pandemic – Increasing demand for e-commerce goods •E-commerce growth accelerated in the pandemic and is expected to remain robust even as COVID restrictions lessen over time • Consumer spending on services shifted to home improvement, electronics and other discretionary and non-discretionary items – this trend is unlikely to revert anytime soon • Inventory restocking coupled with elevated consumption expected to drive demand for goods – Migration of inventory management to a more resilient model – End of the pandemic may be gradual and could potentially take several years until it “ends” – may require further government support |
| 5 Third Quarter 2020 Earnings Conference Call Confident CLX+ Can Be a Permanent Service (continued) • Supply fundamentals – constraints in transpacific air and ocean markets expected to remain for some time – Continued dislocation in transpacific air freight markets • Although some transpacific passenger service routes reinstated, global passenger traffic (and belly space capacity) unlikely to see pre-COVID-19 levels for several years • COVID-19 vaccine and related materials distribution expected to use air cargo services, further restricting air cargo capacity – Constraints in transpacific ocean capacity • Several transpacific ocean carriers have fully deployed capacity, and new ship orderbooks at multi-decade lows • Industry consolidation and alliances should lead to better alignment of capacity to avoid over-tonnage – Significant equipment demand and West Coast port congestion • Our competitive advantages in the CLX service are also in the CLX+ service – Own our chassis – Combination of SSAT terminal operations and Shippers Transport off-dock facility lead to industry low turn times and next day container availability • Allows us to avoid the congestion issues during peak periods |
| 6 Third Quarter 2020 Earnings Conference Call Current Priorities • Safeguard employee health and safety • Ensure consistency of Ocean Transportation services and continue to deliver for our Matson Logistics customers • Drive organic opportunities – Making CLX+ permanent – Introduced AAX service in August as part of CLX+ back-haul • Maintain cost and capital discipline during period of economic uncertainty – Focused on cash flow and reducing leverage – Will meaningfully exceed high end of $40 to $50 million range of operating results improvement from operational changes and cost management initiatives • Complete Hawaii new build program – Expect Matsonia to be delivered by end of 4Q20 • Complete Sand Island phase I – Last of the major items is complete; remain on track for completion this quarter • Complete scrubber program – Last vessel in the scrubber program is in dry-dock and is expected to be back in service early next year |
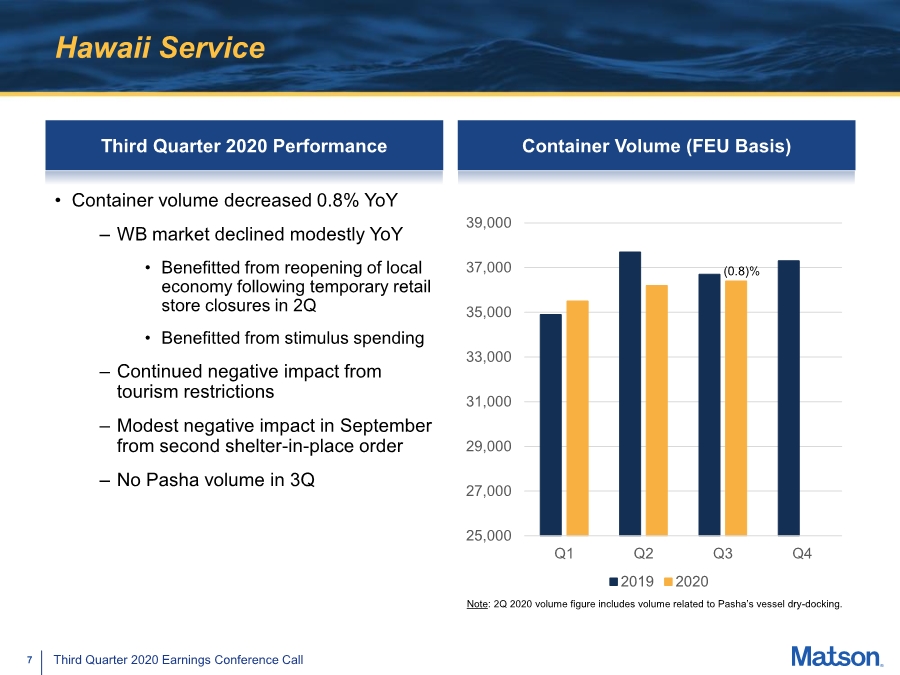
| 7 Third Quarter 2020 Earnings Conference Call Hawaii Service Third Quarter 2020 Performance • Container volume decreased 0.8% YoY – WB market declined modestly YoY • Benefitted from reopening of local economy following temporary retail store closures in 2Q • Benefitted from stimulus spending – Continued negative impact from tourism restrictions – Modest negative impact in September from second shelter-in-place order – No Pasha volume in 3Q Container Volume (FEU Basis) 25,000 27,000 29,000 31,000 33,000 35,000 37,000 39,000 Q1 Q2 Q3 Q4 2019 2020 Note: 2Q 2020 volume figure includes volume related to Pasha’s vessel dry-docking. (0.8)% |
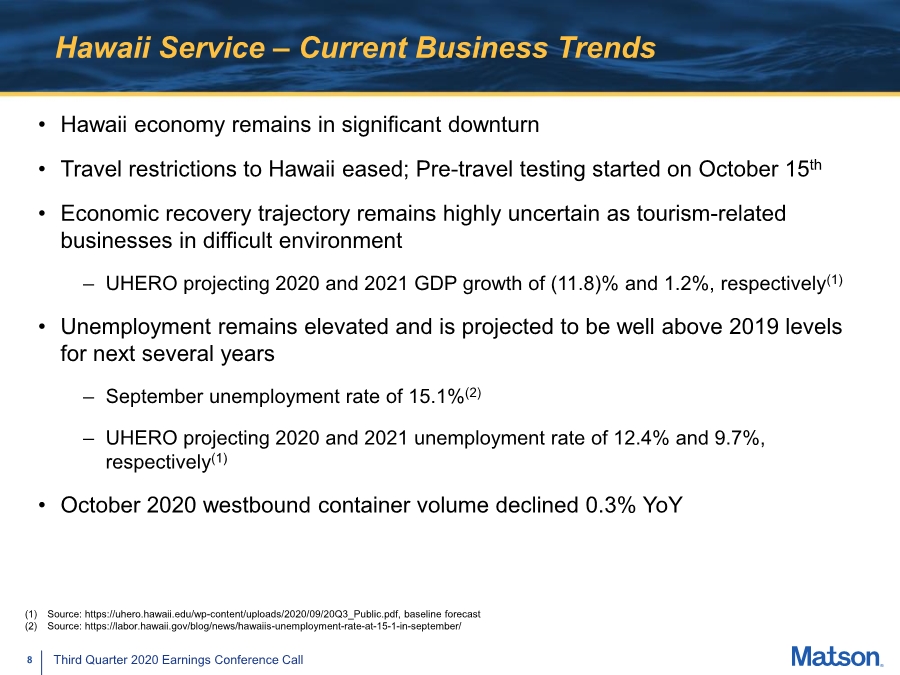
| 8 Third Quarter 2020 Earnings Conference Call Hawaii Service – Current Business Trends • Hawaii economy remains in significant downturn • Travel restrictions to Hawaii eased; Pre-travel testing started on October 15th • Economic recovery trajectory remains highly uncertain as tourism-related businesses in difficult environment – UHERO projecting 2020 and 2021 GDP growth of (11.8)% and 1.2%, respectively(1) • Unemployment remains elevated and is projected to be well above 2019 levels for next several years – September unemployment rate of 15.1%(2) – UHERO projecting 2020 and 2021 unemployment rate of 12.4% and 9.7%, respectively(1) • October 2020 westbound container volume declined 0.3% YoY (1) Source: https://uhero.hawaii.edu/wp-content/uploads/2020/09/20Q3_Public.pdf, baseline forecast (2) Source: https://labor.hawaii.gov/blog/news/hawaiis-unemployment-rate-at-15-1-in-september/ |
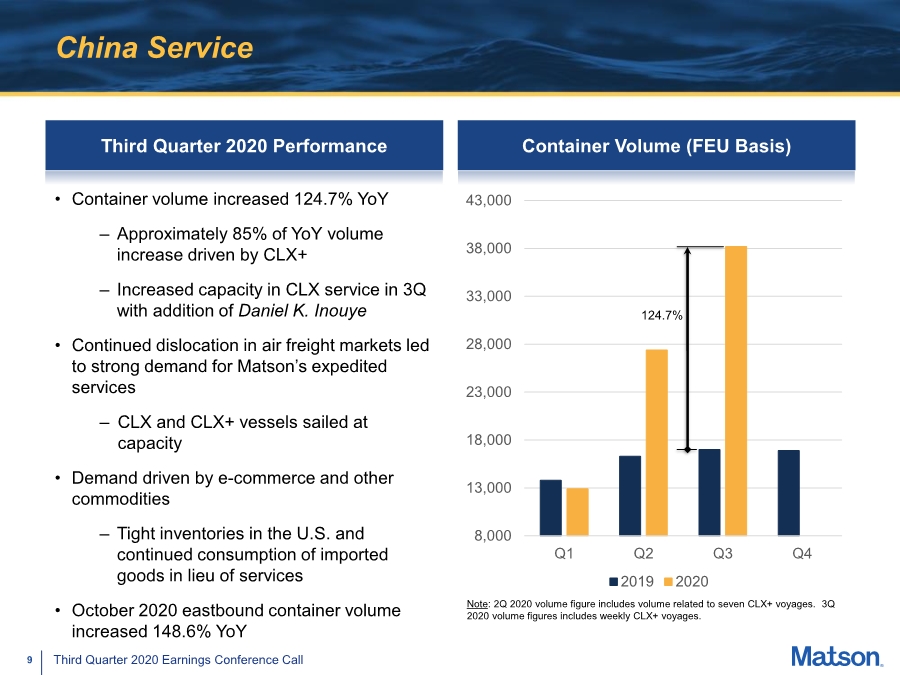
| 9 Third Quarter 2020 Earnings Conference Call China Service Third Quarter 2020 Performance • Container volume increased 124.7% YoY – Approximately 85% of YoY volume increase driven by CLX+ – Increased capacity in CLX service in 3Q with addition of Daniel K. Inouye • Continued dislocation in air freight markets led to strong demand for Matson’s expedited services – CLX and CLX+ vessels sailed at capacity • Demand driven by e-commerce and other commodities – Tight inventories in the U.S. and continued consumption of imported goods in lieu of services • October 2020 eastbound container volume increased 148.6% YoY Container Volume (FEU Basis) 8,000 13,000 18,000 23,000 28,000 33,000 38,000 43,000 Q1 Q2 Q3 Q4 2019 2020 Note: 2Q 2020 volume figure includes volume related to seven CLX+ voyages. 3Q 2020 volume figures includes weekly CLX+ voyages. 124.7% |
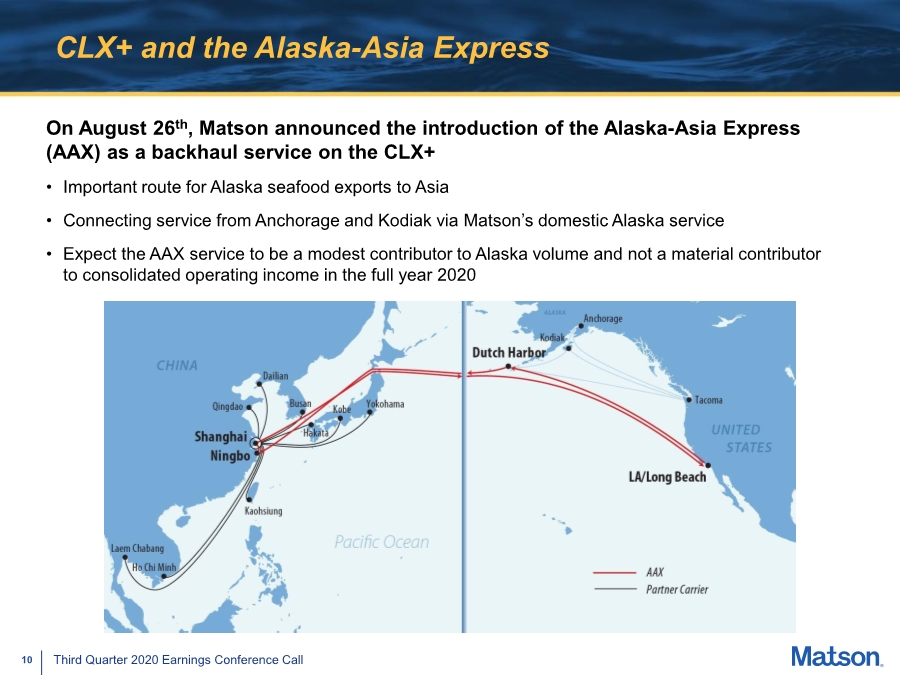
| 10 Third Quarter 2020 Earnings Conference Call CLX+ and the Alaska-Asia Express On August 26th, Matson announced the introduction of the Alaska-Asia Express (AAX) as a backhaul service on the CLX+ • Important route for Alaska seafood exports to Asia • Connecting service from Anchorage and Kodiak via Matson’s domestic Alaska service • Expect the AAX service to be a modest contributor to Alaska volume and not a material contributor to consolidated operating income in the full year 2020 |
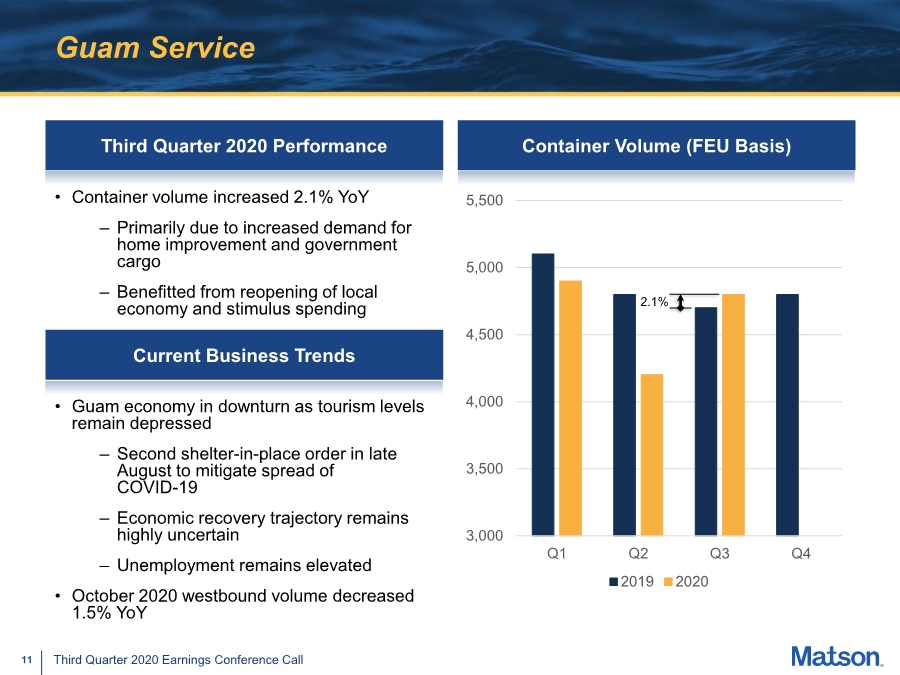
| 11 Third Quarter 2020 Earnings Conference Call Guam Service Third Quarter 2020 Performance Container Volume (FEU Basis) 3,000 3,500 4,000 4,500 5,000 5,500 Q1 Q2 Q3 Q4 2019 2020 2.1% Current Business Trends • Guam economy in downturn as tourism levels remain depressed – Second shelter-in-place order in late August to mitigate spread of COVID-19 – Economic recovery trajectory remains highly uncertain – Unemployment remains elevated • October 2020 westbound volume decreased 1.5% YoY • Container volume increased 2.1% YoY – Primarily due to increased demand for home improvement and government cargo – Benefitted from reopening of local economy and stimulus spending |
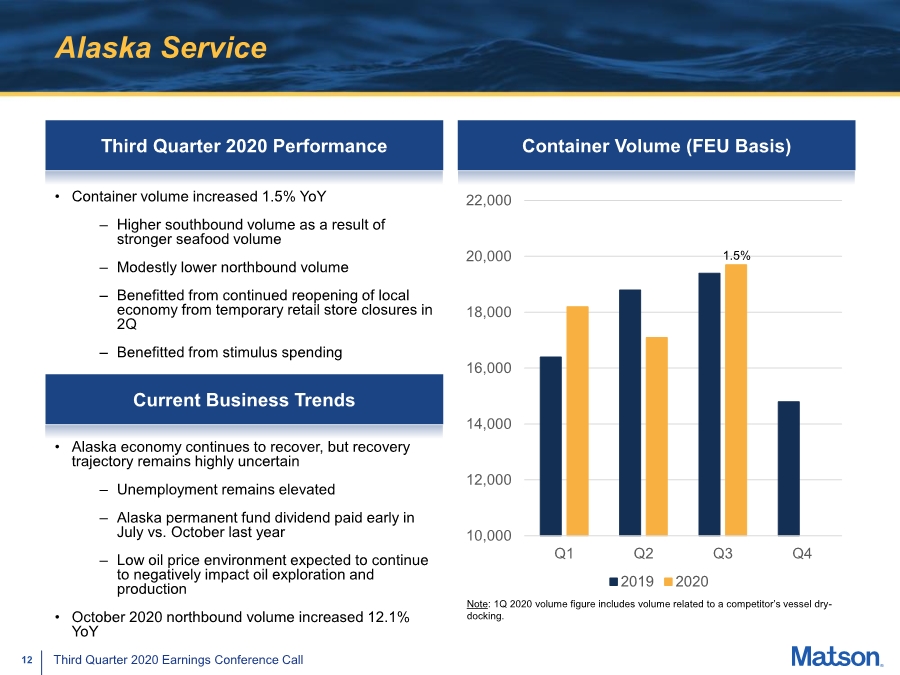
| 12 Third Quarter 2020 Earnings Conference Call Alaska Service Third Quarter 2020 Performance • Container volume increased 1.5% YoY – Higher southbound volume as a result of stronger seafood volume – Modestly lower northbound volume – Benefitted from continued reopening of local economy from temporary retail store closures in 2Q – Benefitted from stimulus spending Container Volume (FEU Basis) Note: 1Q 2020 volume figure includes volume related to a competitor’s vessel dry- docking. 10,000 12,000 14,000 16,000 18,000 20,000 22,000 Q1 Q2 Q3 Q4 2019 2020 1.5% • Alaska economy continues to recover, but recovery trajectory remains highly uncertain – Unemployment remains elevated – Alaska permanent fund dividend paid early in July vs. October last year – Low oil price environment expected to continue to negatively impact oil exploration and production • October 2020 northbound volume increased 12.1% YoY Current Business Trends |
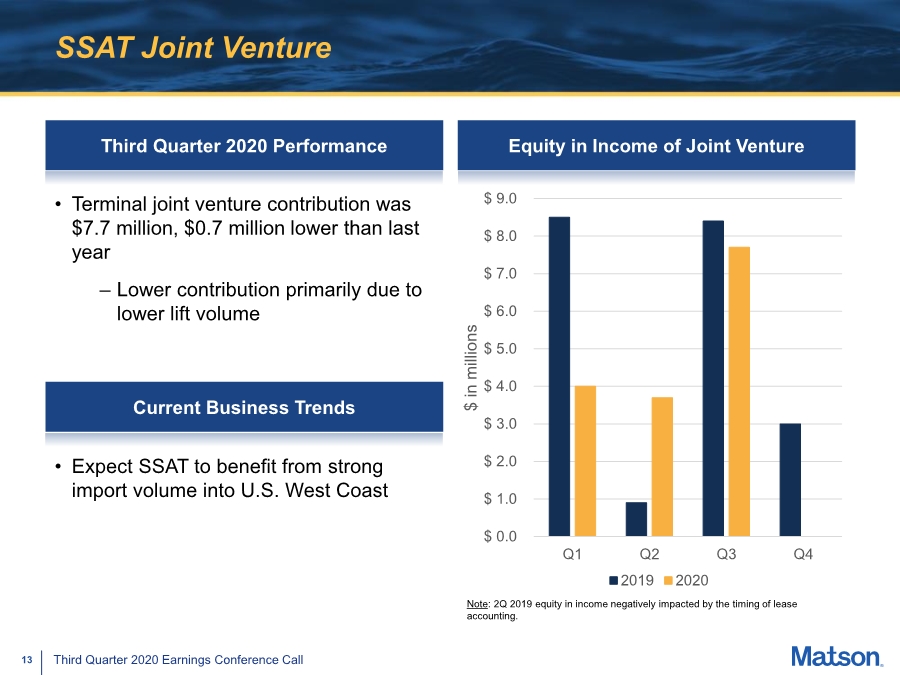
| 13 Third Quarter 2020 Earnings Conference Call SSAT Joint Venture Third Quarter 2020 Performance Equity in Income of Joint Venture Note: 2Q 2019 equity in income negatively impacted by the timing of lease accounting. $ 0.0 $ 1.0 $ 2.0 $ 3.0 $ 4.0 $ 5.0 $ 6.0 $ 7.0 $ 8.0 $ 9.0 Q1 Q2 Q3 Q4 $ in millions 2019 2020 Current Business Trends • Expect SSAT to benefit from strong import volume into U.S. West Coast • Terminal joint venture contribution was $7.7 million, $0.7 million lower than last year – Lower contribution primarily due to lower lift volume |
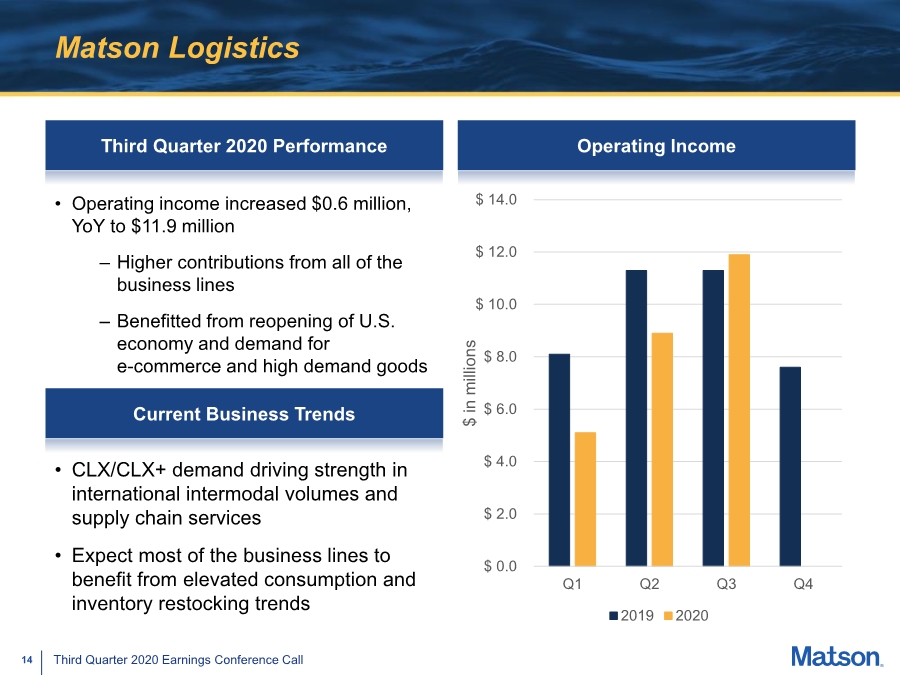
| 14 Third Quarter 2020 Earnings Conference Call Matson Logistics Third Quarter 2020 Performance Operating Income $ 0.0 $ 2.0 $ 4.0 $ 6.0 $ 8.0 $ 10.0 $ 12.0 $ 14.0 Q1 Q2 Q3 Q4 $ in millions 2019 2020 • Operating income increased $0.6 million, YoY to $11.9 million – Higher contributions from all of the business lines – Benefitted from reopening of U.S. economy and demand for e-commerce and high demand goods Current Business Trends • CLX/CLX+ demand driving strength in international intermodal volumes and supply chain services • Expect most of the business lines to benefit from elevated consumption and inventory restocking trends |
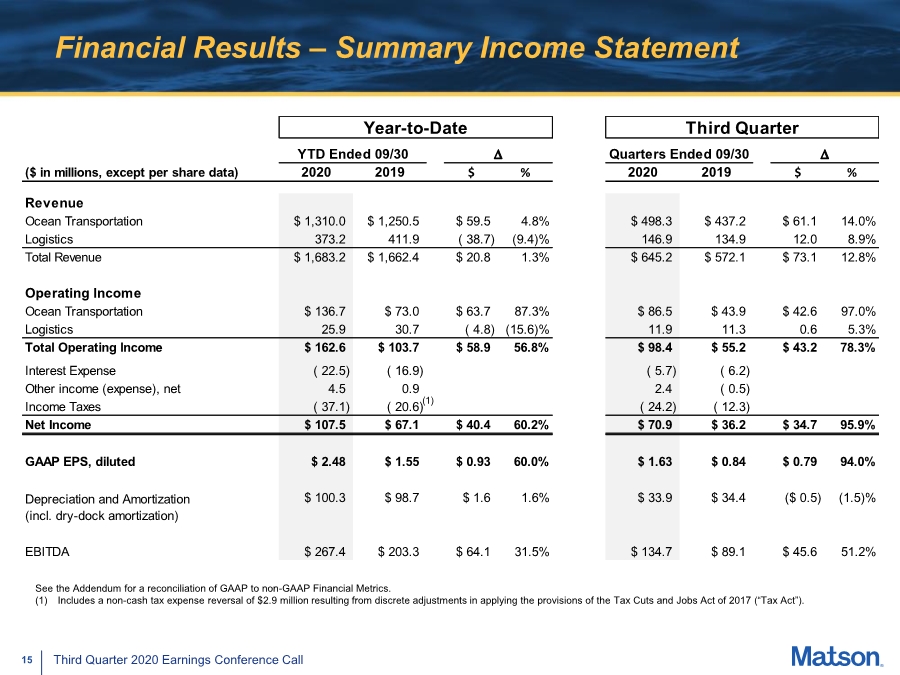
| 15 Third Quarter 2020 Earnings Conference Call Financial Results – Summary Income Statement See the Addendum for a reconciliation of GAAP to non-GAAP Financial Metrics. (1) Includes a non-cash tax expense reversal of $2.9 million resulting from discrete adjustments in applying the provisions of the Tax Cuts and Jobs Act of 2017 (“Tax Act”). Year-to-Date Third Quarter YTD Ended 09/30 D Quarters Ended 09/30 D ($ in millions, except per share data) 2020 2019 $ % 2020 2019 $ % Revenue Ocean Transportation $ 1,310.0 $ 1,250.5 $ 59.5 4.8% $ 498.3 $ 437.2 $ 61.1 14.0% Logistics 373.2 411.9 ( 38.7) (9.4)% 146.9 134.9 12.0 8.9% Total Revenue $ 1,683.2 $ 1,662.4 $ 20.8 1.3% $ 645.2 $ 572.1 $ 73.1 12.8% Operating Income Ocean Transportation $ 136.7 $ 73.0 $ 63.7 87.3% $ 86.5 $ 43.9 $ 42.6 97.0% Logistics 25.9 30.7 ( 4.8) (15.6)% 11.9 11.3 0.6 5.3% Total Operating Income $ 162.6 $ 103.7 $ 58.9 56.8% $ 98.4 $ 55.2 $ 43.2 78.3% Interest Expense ( 22.5) ( 16.9) ( 5.7) ( 6.2) Other income (expense), net 4.5 0.9 2.4 ( 0.5) Income Taxes ( 37.1) ( 20.6) ( 24.2) ( 12.3) Net Income $ 107.5 $ 67.1 $ 40.4 60.2% $ 70.9 $ 36.2 $ 34.7 95.9% GAAP EPS, diluted $ 2.48 $ 1.55 $ 0.93 60.0% $ 1.63 $ 0.84 $ 0.79 94.0% $ 100.3 $ 98.7 $ 1.6 1.6% $ 33.9 $ 34.4 ($ 0.5) (1.5)% EBITDA $ 267.4 $ 203.3 $ 64.1 31.5% $ 134.7 $ 89.1 $ 45.6 51.2% Depreciation and Amortization (incl. dry-dock amortization) (1) |
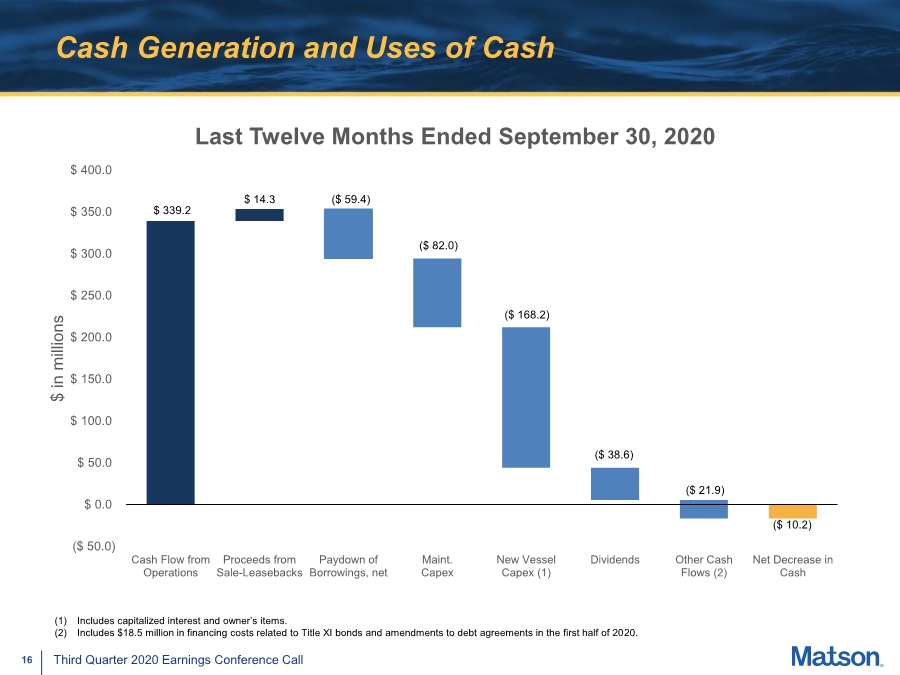
| 16 Third Quarter 2020 Earnings Conference Call Cash Generation and Uses of Cash ($ 50.0) $ 0.0 $ 50.0 $ 100.0 $ 150.0 $ 200.0 $ 250.0 $ 300.0 $ 350.0 $ 400.0 Cash Flow from Operations Proceeds from Sale-Leasebacks Paydown of Borrowings, net Maint. Capex New Vessel Capex (1) Dividends Other Cash Flows (2) Net Decrease in Cash $ in millions Last Twelve Months Ended September 30, 2020 $ 339.2 $ 14.3 ($ 59.4) ($ 82.0) ($ 168.2) ($ 38.6) ($ 10.2) ($ 21.9) (1) Includes capitalized interest and owner’s items. (2) Includes $18.5 million in financing costs related to Title XI bonds and amendments to debt agreements in the first half of 2020. |
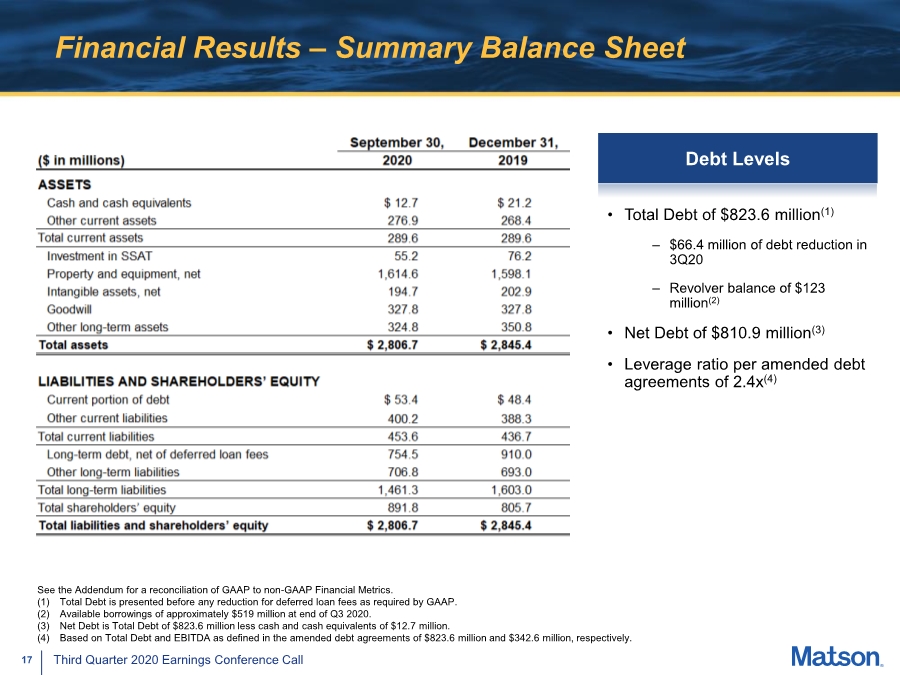
| 17 Third Quarter 2020 Earnings Conference Call Financial Results – Summary Balance Sheet • Total Debt of $823.6 million(1) – $66.4 million of debt reduction in 3Q20 – Revolver balance of $123 million(2) • Net Debt of $810.9 million(3) • Leverage ratio per amended debt agreements of 2.4x(4) See the Addendum for a reconciliation of GAAP to non-GAAP Financial Metrics. (1) Total Debt is presented before any reduction for deferred loan fees as required by GAAP. (2) Available borrowings of approximately $519 million at end of Q3 2020. (3) Net Debt is Total Debt of $823.6 million less cash and cash equivalents of $12.7 million. (4) Based on Total Debt and EBITDA as defined in the amended debt agreements of $823.6 million and $342.6 million, respectively. Debt Levels |
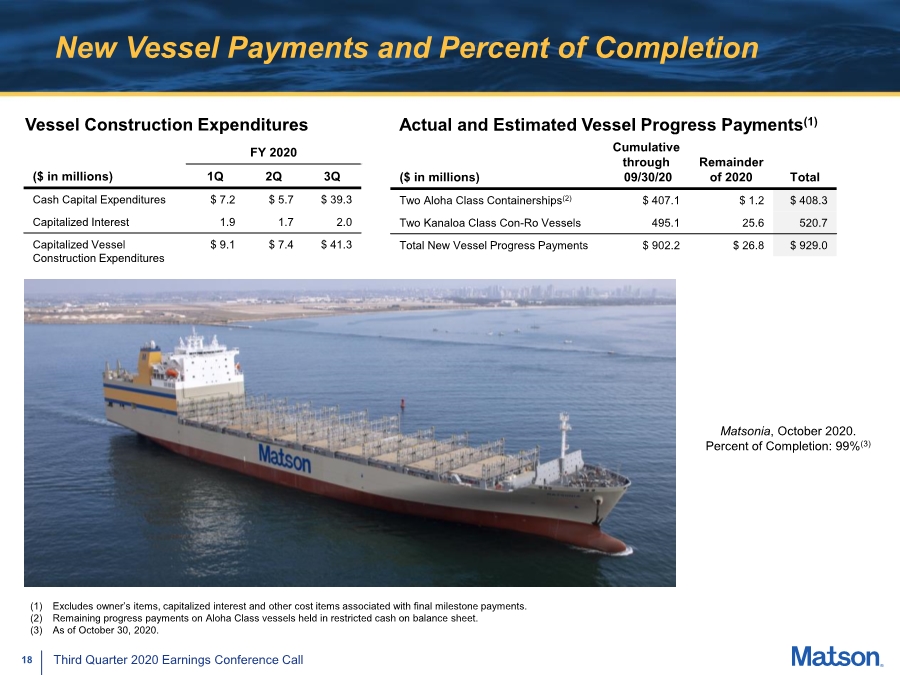
| 18 Third Quarter 2020 Earnings Conference Call New Vessel Payments and Percent of Completion Actual and Estimated Vessel Progress Payments(1) FY 2020 ($ in millions) 1Q 2Q 3Q Cash Capital Expenditures $ 7.2 $ 5.7 $ 39.3 Capitalized Interest 1.9 1.7 2.0 Capitalized Vessel Construction Expenditures $ 9.1 $ 7.4 $ 41.3 ($ in millions) Cumulative through 09/30/20 Remainder of 2020 Total Two Aloha Class Containerships(2) $ 407.1 $ 1.2 $ 408.3 Two Kanaloa Class Con-Ro Vessels 495.1 25.6 520.7 Total New Vessel Progress Payments $ 902.2 $ 26.8 $ 929.0 Matsonia, October 2020. Percent of Completion: 99%(3) Vessel Construction Expenditures (1) Excludes owner’s items, capitalized interest and other cost items associated with final milestone payments. (2) Remaining progress payments on Aloha Class vessels held in restricted cash on balance sheet. (3) As of October 30, 2020. |
| 19 Third Quarter 2020 Earnings Conference Call Appendix |
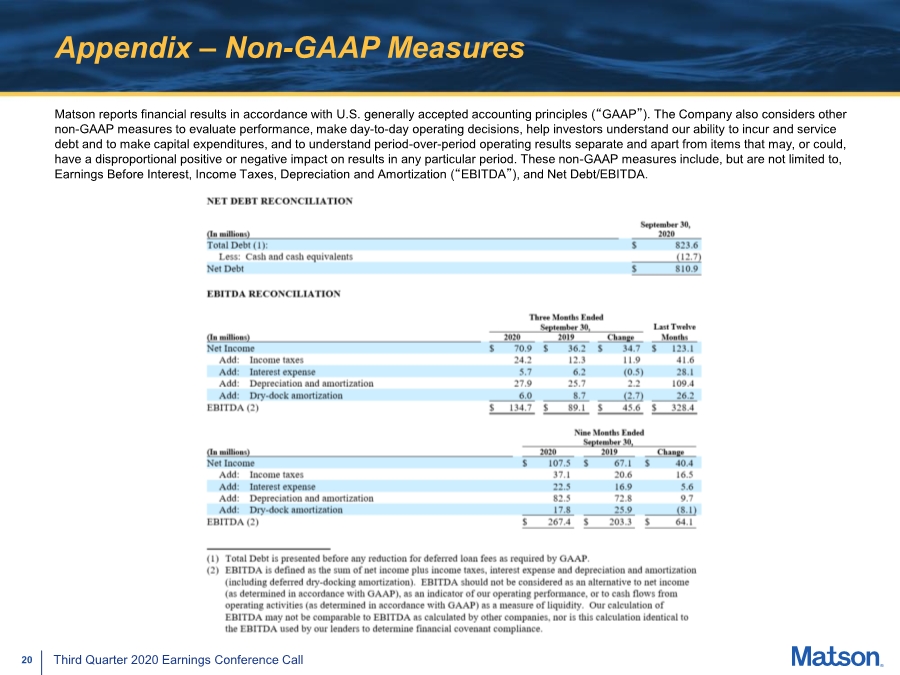
| 20 Third Quarter 2020 Earnings Conference Call Appendix – Non-GAAP Measures Matson reports financial results in accordance with U.S. generally accepted accounting principles (“GAAP”). The Company also considers other non-GAAP measures to evaluate performance, make day-to-day operating decisions, help investors understand our ability to incur and service debt and to make capital expenditures, and to understand period-over-period operating results separate and apart from items that may, or could, have a disproportional positive or negative impact on results in any particular period. These non-GAAP measures include, but are not limited to, Earnings Before Interest, Income Taxes, Depreciation and Amortization (“EBITDA”), and Net Debt/EBITDA. |