Attached files
| file | filename |
|---|---|
| EX-31.1 - CEO CERTIFICATION UNDER SECTION 302 OF SARBANES -OXLEY ACT. - FEDERAL SIGNAL CORP /DE/ | fss-20200930x10qexx311.htm |
| 10-Q - 10-Q - FEDERAL SIGNAL CORP /DE/ | fss-20200930.htm |
| EX-99.1 - THIRD QUARTER FINANCIAL RESULTS PRESS RELEASE - FEDERAL SIGNAL CORP /DE/ | fss-20200930x10qexhx991.htm |
| EX-32.2 - CFO CERTIFICATION OF PERIODIC REPORT UNDER SECTION 906 OF SARBANES-OXLEY ACT. - FEDERAL SIGNAL CORP /DE/ | fss-20200930xx10qexx322.htm |
| EX-32.1 - CEO CERTIFICATION OF PERIODIC REPORT UNDER SECTION 906 OF SARBANES-OXLEY ACT. - FEDERAL SIGNAL CORP /DE/ | fss-20200930xx10qexx321.htm |
| EX-31.2 - CFO CERTIFICATION UNDER SECTION 302 OF SARBANES-OXLEY ACT. - FEDERAL SIGNAL CORP /DE/ | fss-20200930x10qexx312.htm |

Federal Signal Q3 2020 Earnings Call October 29, 2020 Jennifer Sherman, President & Chief Executive Officer Ian Hudson, SVP, Chief Financial Officer
Safe Harbor This presentation contains unaudited financial information and various forward-looking statements as of the date hereof and we undertake no obligation to update these forward- looking statements regardless of new developments or otherwise. Statements in this presentation that are not historical are forward-looking statements. Such statements are subject to various risks and uncertainties that could cause actual results to vary materially from those stated. Such risks and uncertainties include but are not limited to: direct and indirect impacts of the coronavirus pandemic and the associated government response, economic conditions in various regions, product and price competition, supply chain disruptions, work stoppages, availability and pricing of raw materials, risks associated with acquisitions such as integration of operations and achieving anticipated revenue and cost benefits, foreign currency exchange rate changes, interest rate changes, increased legal expenses and litigation results, legal and regulatory developments and other risks and uncertainties described in filings with the Securities and Exchange Commission. This presentation also contains references to certain non-GAAP financial information. Such items are reconciled herein and in our earnings news release provided as of the date of this presentation. 2
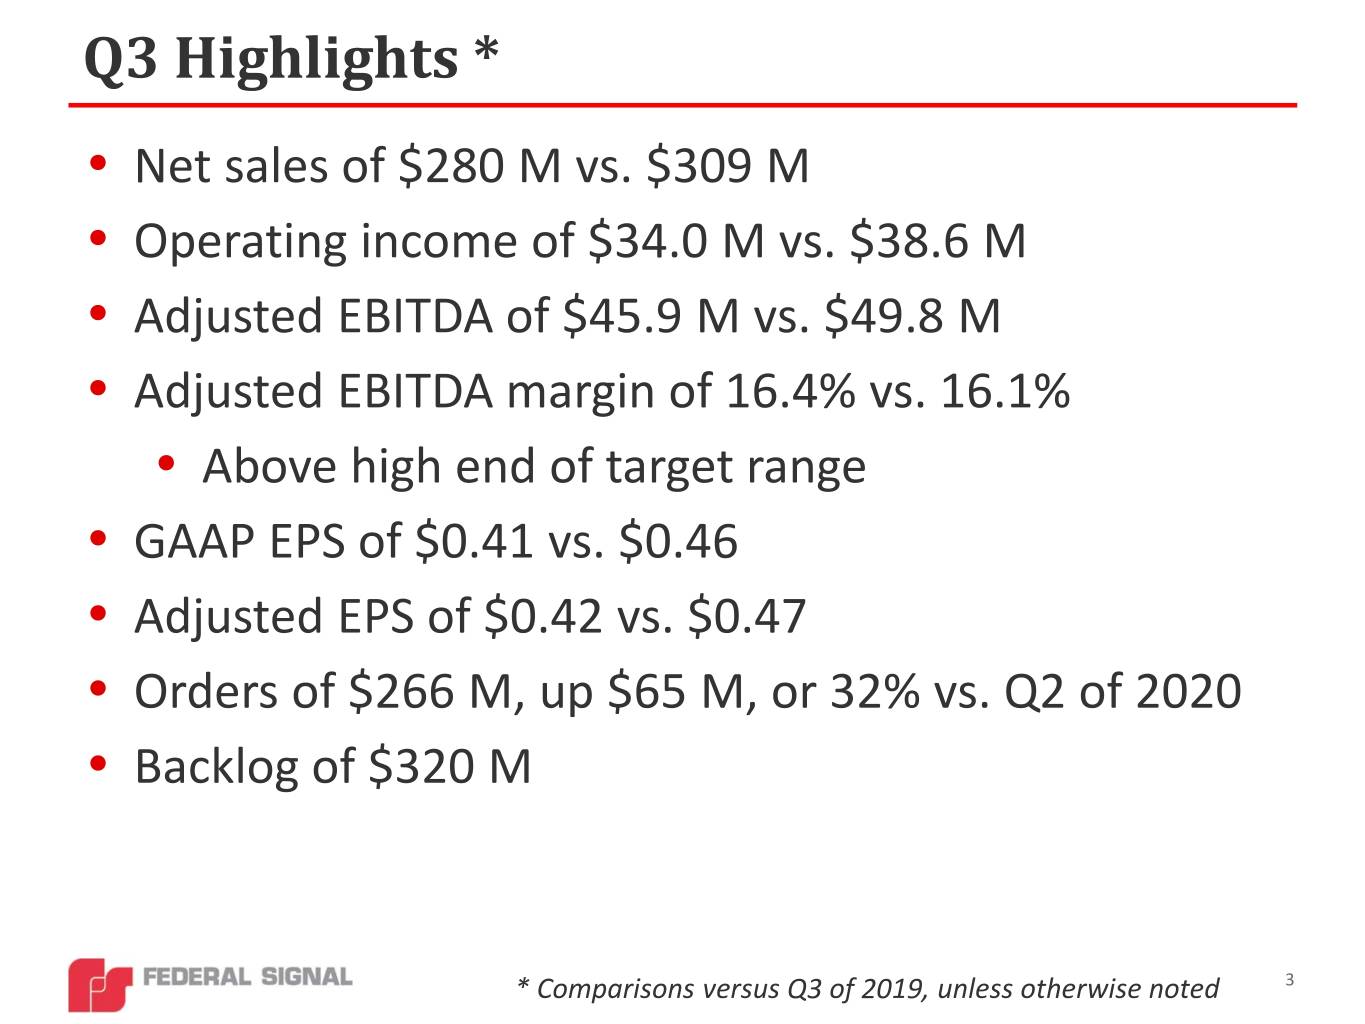
Q3 Highlights * • Net sales of $280 M vs. $309 M • Operating income of $34.0 M vs. $38.6 M • Adjusted EBITDA of $45.9 M vs. $49.8 M • Adjusted EBITDA margin of 16.4% vs. 16.1% • Above high end of target range • GAAP EPS of $0.41 vs. $0.46 • Adjusted EPS of $0.42 vs. $0.47 • Orders of $266 M, up $65 M, or 32% vs. Q2 of 2020 • Backlog of $320 M * Comparisons versus Q3 of 2019, unless otherwise noted 3
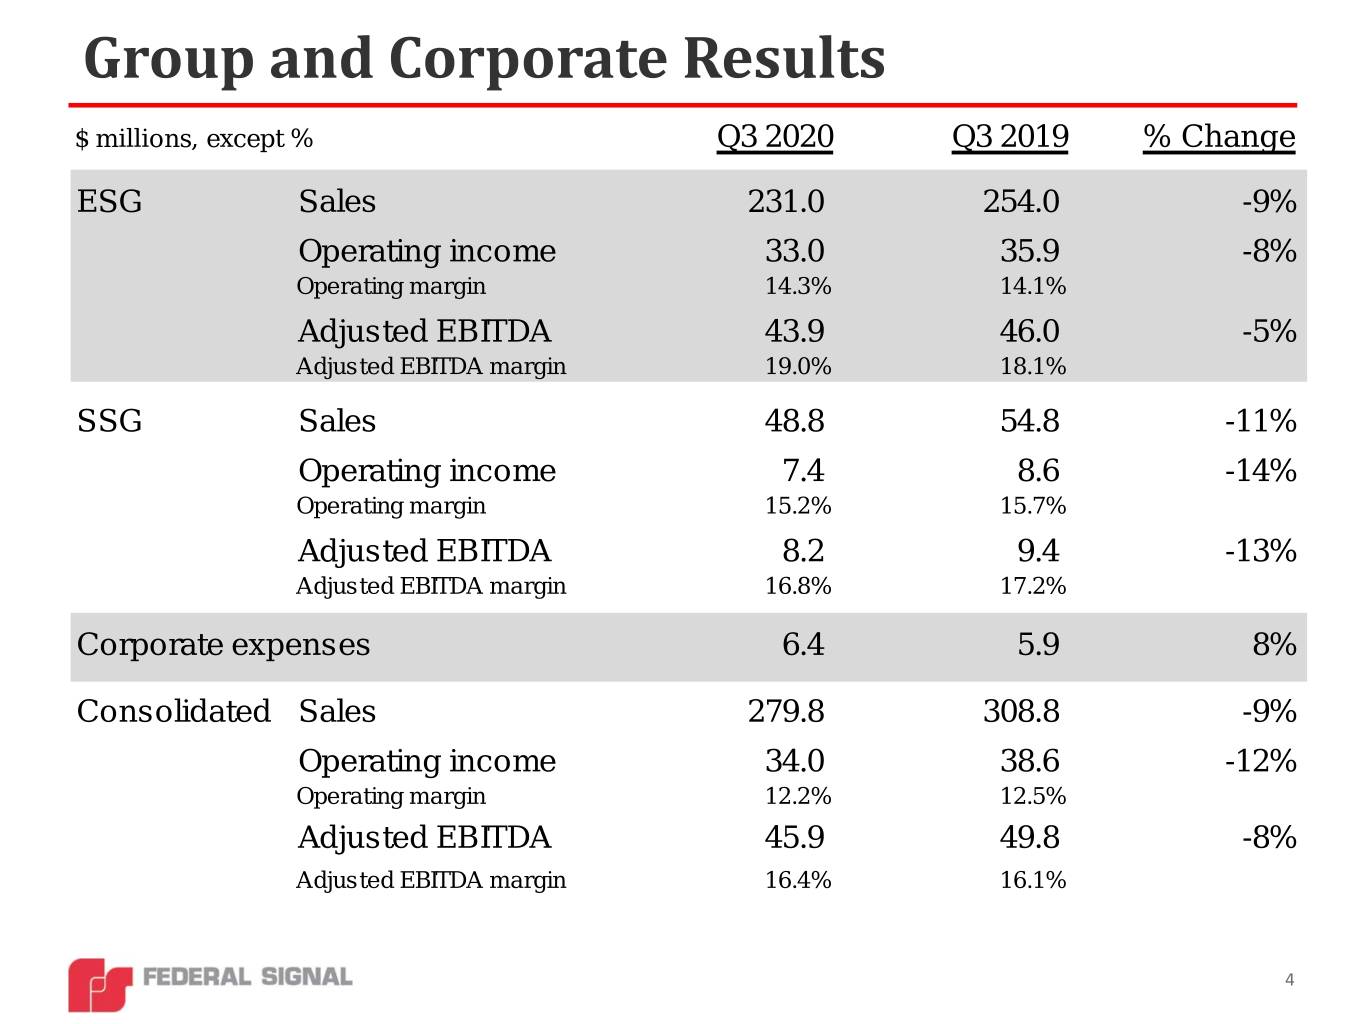
Group and Corporate Results $ millions, except % Q3 2020 Q3 2019 % Change ESG Sales 231.0 254.0 -9% Operating income 33.0 35.9 -8% Operating margin 14.3% 14.1% Adjusted EBITDA 43.9 46.0 -5% Adjusted EBITDA margin 19.0% 18.1% SSG Sales 48.8 54.8 -11% Operating income 7.4 8.6 -14% Operating margin 15.2% 15.7% Adjusted EBITDA 8.2 9.4 -13% Adjusted EBITDA margin 16.8% 17.2% Corporate expenses 6.4 5.9 8% Consolidated Sales 279.8 308.8 -9% Operating income 34.0 38.6 -12% Operating margin 12.2% 12.5% Adjusted EBITDA 45.9 49.8 -8% Adjusted EBITDA margin 16.4% 16.1% 4
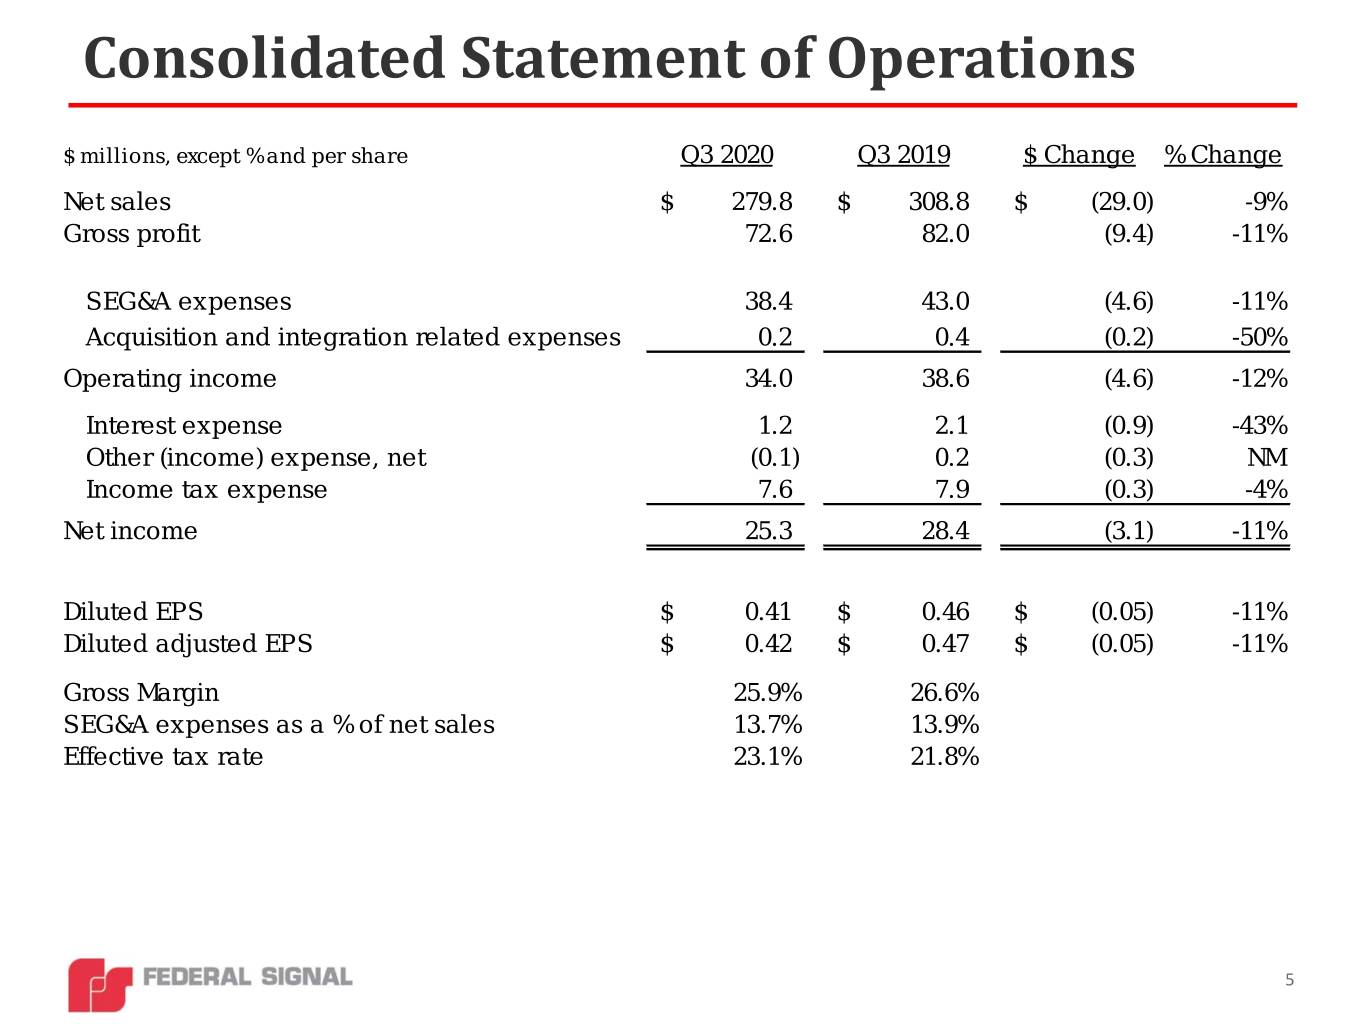
Consolidated Statement of Operations $ millions, except % and per share Q3 2020 Q3 2019 $ Change % Change Net sales $ 279.8 $ 308.8 $ (29.0) -9% Gross profit 72.6 82.0 (9.4) -11% SEG&A expenses 38.4 43.0 (4.6) -11% Acquisition and integration related expenses 0.2 0.4 (0.2) -50% Operating income 34.0 38.6 (4.6) -12% Interest expense 1.2 2.1 (0.9) -43% Other (income) expense, net (0.1) 0.2 (0.3) NM Income tax expense 7.6 7.9 (0.3) -4% Net income 25.3 28.4 (3.1) -11% Diluted EPS $ 0.41 $ 0.46 $ (0.05) -11% Diluted adjusted EPS $ 0.42 $ 0.47 $ (0.05) -11% Gross Ma rgin 25.9% 26.6% SEG&A expenses as a % of net sales 13.7% 13.9% Effective tax rate 23.1% 21.8% 5
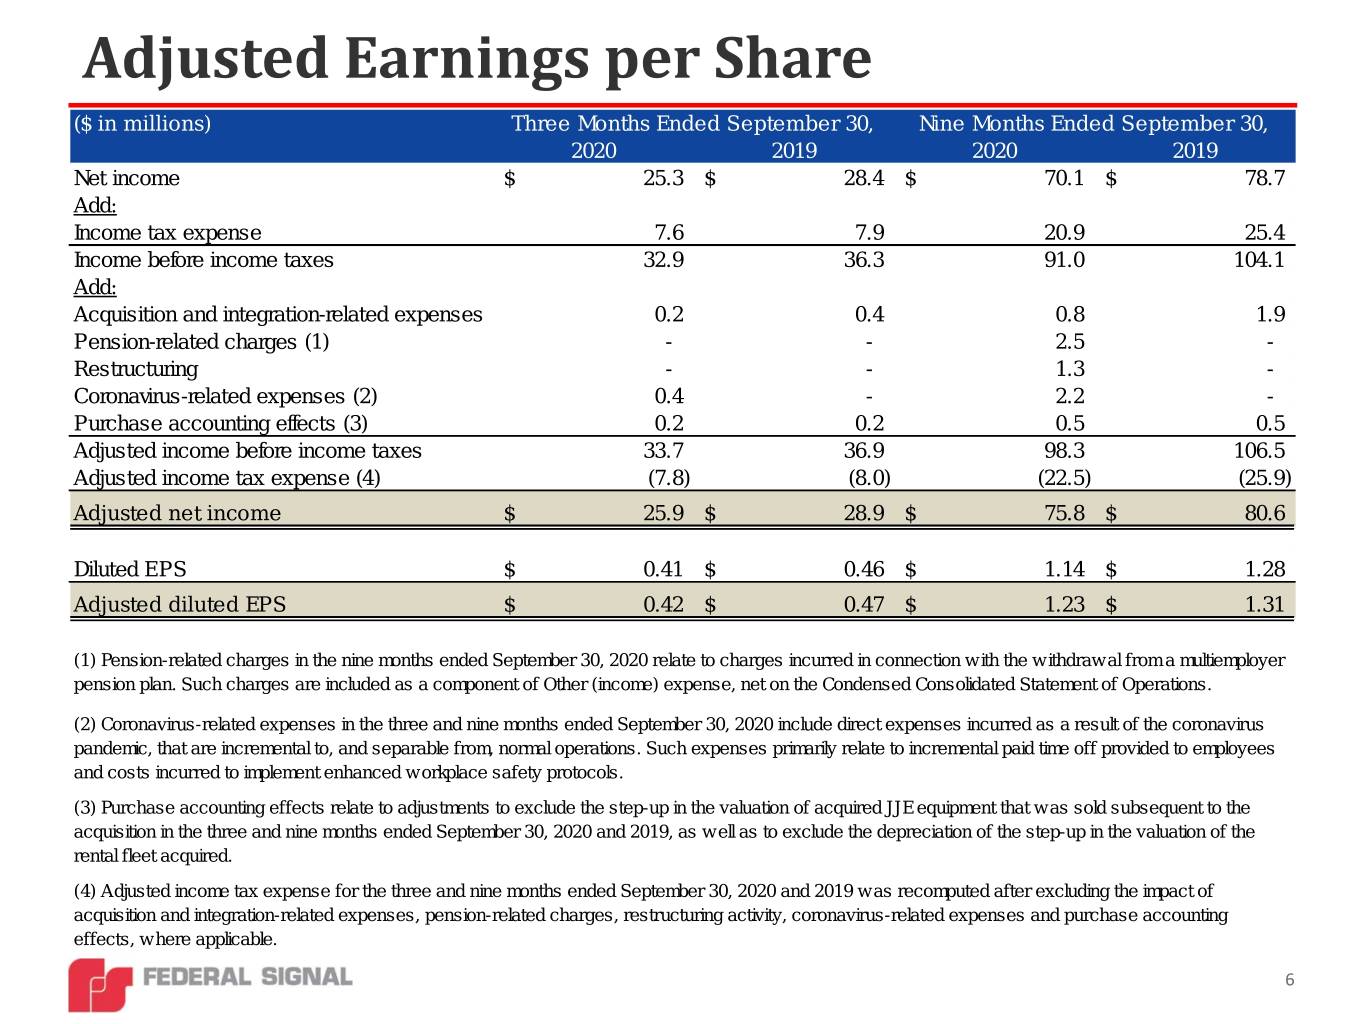
Adjusted Earnings per Share ($ in millions) Three Months Ended September 30, Nine Months Ended September 30, 2020 2019 2020 2019 Net income $ 25.3 $ 28.4 $ 70.1 $ 78.7 Add: Income tax expense 7.6 7.9 20.9 25.4 Income before income taxes 32.9 36.3 91.0 104.1 Add: Acquisition and integration-related expenses 0.2 0.4 0.8 1.9 Pension-related charges (1) - - 2.5 - Restructuring - - 1.3 - Coronavirus-related expenses (2) 0.4 - 2.2 - Purchase accounting effects (3) 0.2 0.2 0.5 0.5 Adjusted income before income taxes 33.7 36.9 98.3 106.5 Adjusted income tax expense (4) (7.8) (8.0) (22.5) (25.9) Adjusted net income $ 25.9 $ 28.9 $ 75.8 $ 80.6 Diluted EPS $ 0.41 $ 0.46 $ 1.14 $ 1.28 Adjusted diluted EPS $ 0.42 $ 0.47 $ 1.23 $ 1.31 (1) Pension-related charges in the nine months ended September 30, 2020 relate to charges incurred in connection w ith the w ithdraw al from a multiemployer pension plan. Such charges are included as a component of Other (income) expense, net on the Condensed Consolidated Statement of Operations. (2) Coronavirus-related expenses in the three and nine months ended September 30, 2020 include direct expenses incurred as a result of the coronavirus pandemic, that are incremental to, and separable from, normal operations. Such expenses primarily relate to incremental paid time off provided to employees and costs incurred to implement enhanced w orkplace safety protocols. (3) Purchase accounting effects relate to adjustments to exclude the step-up in the valuation of acquired JJE equipment that w as sold subsequent to the acquisition in the three and nine months ended September 30, 2020 and 2019, as w ell as to exclude the depreciation of the step-up in the valuation of the rental fleet acquired. (4) Adjusted income tax expense for the three and nine months ended September 30, 2020 and 2019 w as recomputed after excluding the impact of acquisition and integration-related expenses, pension-related charges, restructuring activity, coronavirus-related expenses and purchase accounting effects, w here applicable. 6
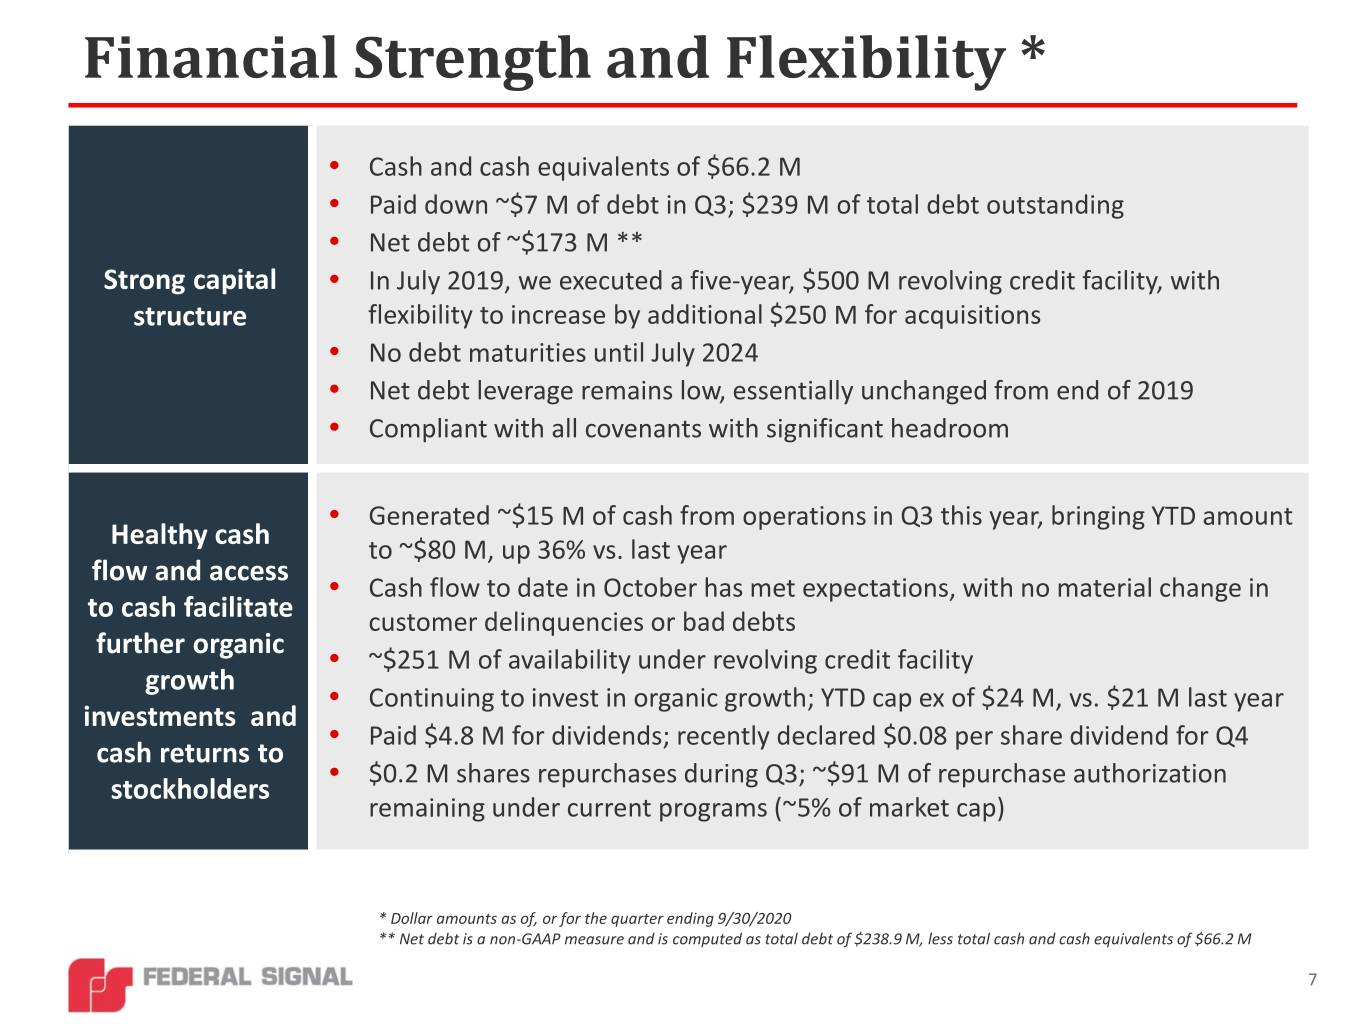
Financial Strength and Flexibility * • Cash and cash equivalents of $66.2 M • Paid down ~$7 M of debt in Q3; $239 M of total debt outstanding • Net debt of ~$173 M ** Strong capital • In July 2019, we executed a five-year, $500 M revolving credit facility, with structure flexibility to increase by additional $250 M for acquisitions • No debt maturities until July 2024 • Net debt leverage remains low, essentially unchanged from end of 2019 • Compliant with all covenants with significant headroom • Generated ~$15 M of cash from operations in Q3 this year, bringing YTD amount Healthy cash to ~$80 M, up 36% vs. last year flow and access • Cash flow to date in October has met expectations, with no material change in to cash facilitate customer delinquencies or bad debts further organic • ~$251 M of availability under revolving credit facility growth • Continuing to invest in organic growth; YTD cap ex of $24 M, vs. $21 M last year investments and • Paid $4.8 M for dividends; recently declared $0.08 per share dividend for Q4 cash returns to • $0.2 M shares repurchases during Q3; ~$91 M of repurchase authorization stockholders remaining under current programs (~5% of market cap) * Dollar amounts as of, or for the quarter ending 9/30/2020 ** Net debt is a non-GAAP measure and is computed as total debt of $238.9 M, less total cash and cash equivalents of $66.2 M 7
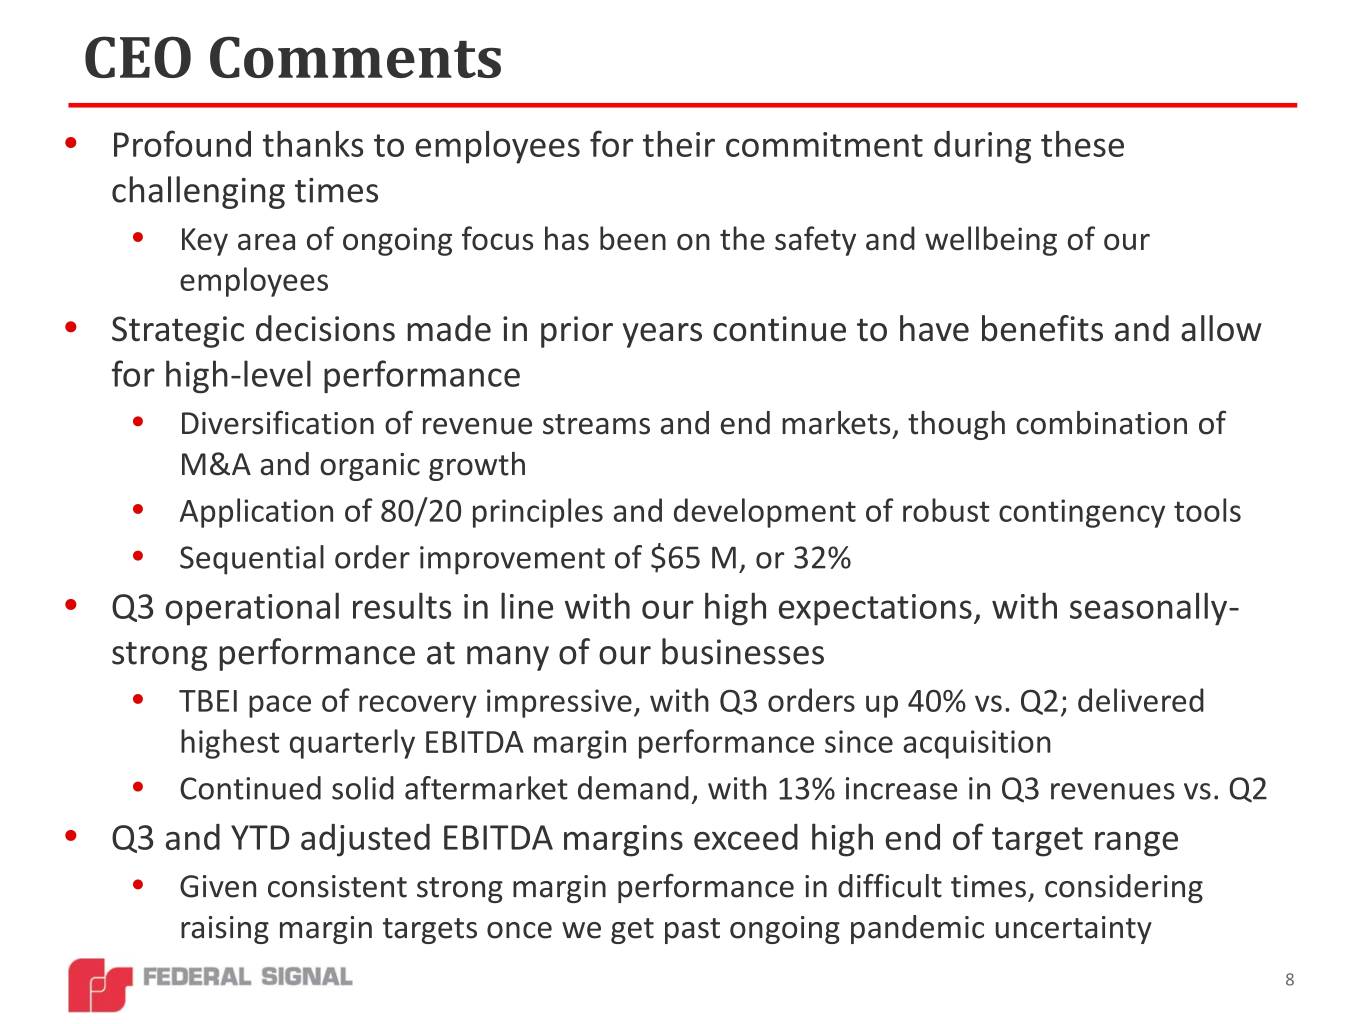
CEO Comments • Profound thanks to employees for their commitment during these challenging times • Key area of ongoing focus has been on the safety and wellbeing of our employees • Strategic decisions made in prior years continue to have benefits and allow for high-level performance • Diversification of revenue streams and end markets, though combination of M&A and organic growth • Application of 80/20 principles and development of robust contingency tools • Sequential order improvement of $65 M, or 32% • Q3 operational results in line with our high expectations, with seasonally- strong performance at many of our businesses • TBEI pace of recovery impressive, with Q3 orders up 40% vs. Q2; delivered highest quarterly EBITDA margin performance since acquisition • Continued solid aftermarket demand, with 13% increase in Q3 revenues vs. Q2 • Q3 and YTD adjusted EBITDA margins exceed high end of target range • Given consistent strong margin performance in difficult times, considering raising margin targets once we get past ongoing pandemic uncertainty 8
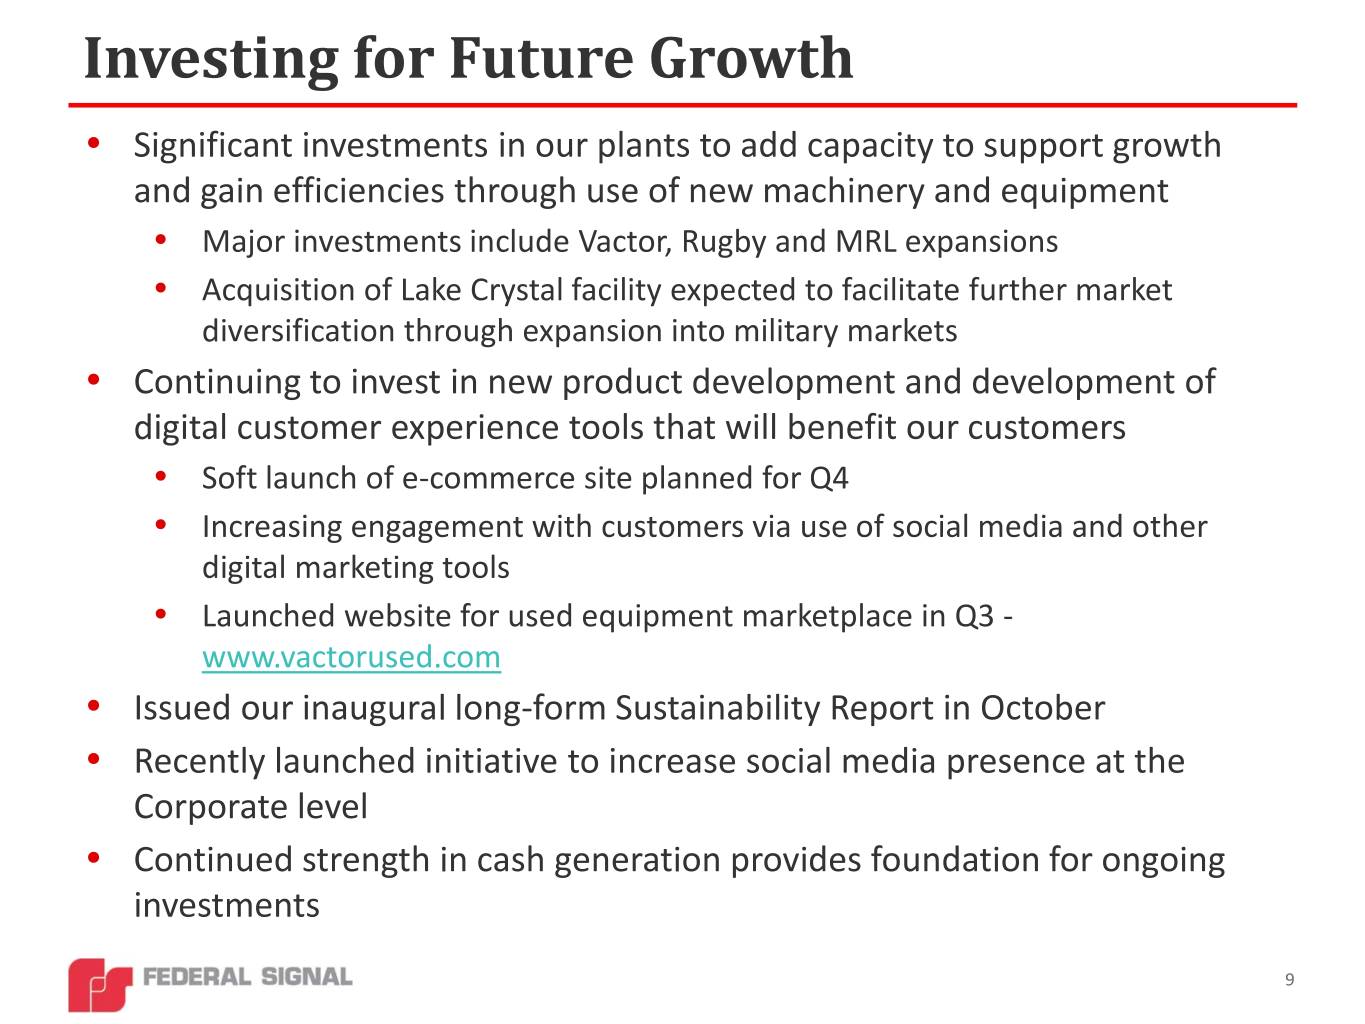
Investing for Future Growth • Significant investments in our plants to add capacity to support growth and gain efficiencies through use of new machinery and equipment • Major investments include Vactor, Rugby and MRL expansions • Acquisition of Lake Crystal facility expected to facilitate further market diversification through expansion into military markets • Continuing to invest in new product development and development of digital customer experience tools that will benefit our customers • Soft launch of e-commerce site planned for Q4 • Increasing engagement with customers via use of social media and other digital marketing tools • Launched website for used equipment marketplace in Q3 - www.vactorused.com • Issued our inaugural long-form Sustainability Report in October • Recently launched initiative to increase social media presence at the Corporate level • Continued strength in cash generation provides foundation for ongoing investments 9
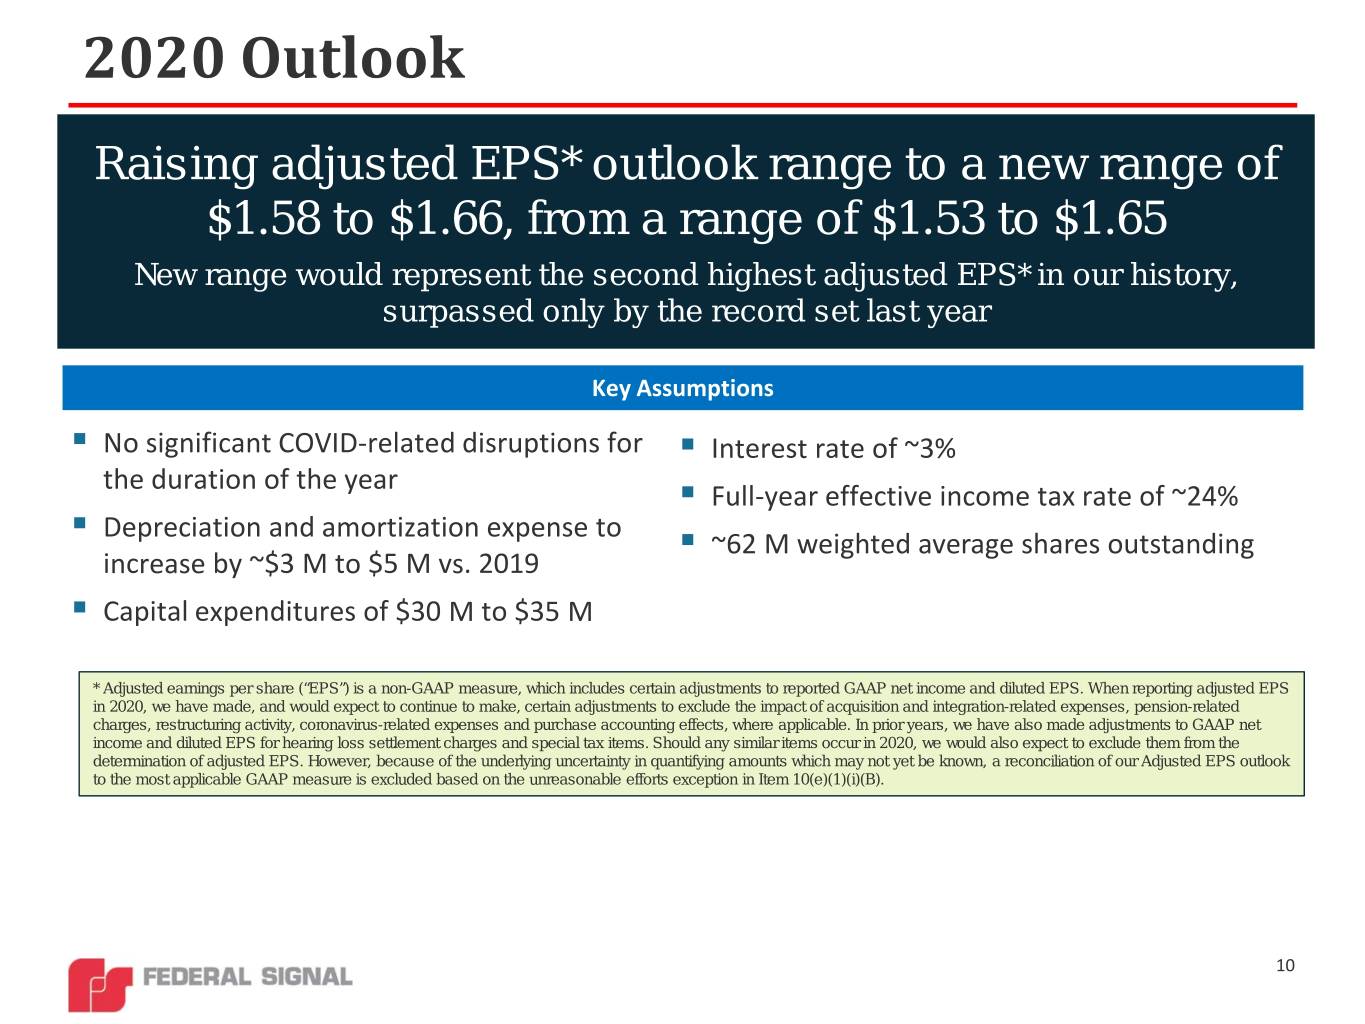
2020 Outlook Raising adjusted EPS* outlook range to a new range of $1.58 to $1.66, from a range of $1.53 to $1.65 New range would represent the second highest adjusted EPS* in our history, surpassed only by the record set last year Key Assumptions . No significant COVID-related disruptions for . Interest rate of ~3% the duration of the year . Full-year effective income tax rate of ~24% . Depreciation and amortization expense to . ~62 M weighted average shares outstanding increase by ~$3 M to $5 M vs. 2019 . Capital expenditures of $30 M to $35 M * Adjusted earnings per share (“EPS”) is a non-GAAP measure, which includes certain adjustments to reported GAAP net income and diluted EPS. When reporting adjusted EPS in 2020, we have made, and would expect to continue to make, certain adjustments to exclude the impact of acquisition and integration-related expenses, pension-related charges, restructuring activity, coronavirus-related expenses and purchase accounting effects, where applicable. In prior years, we have also made adjustments to GAAP net income and diluted EPS for hearing loss settlement charges and special tax items. Should any similar items occur in 2020, we would also expect to exclude them from the determination of adjusted EPS. However, because of the underlying uncertainty in quantifying amounts which may not yet be known, a reconciliation of our Adjusted EPS outlook to the most applicable GAAP measure is excluded based on the unreasonable efforts exception in Item 10(e)(1)(i)(B). 10
Looking Ahead • Remain focused on delivering strong results, while continuing to execute our long-term strategy • We are positioning Federal Signal so that we will fully participate in the post-pandemic recovery and gain market share by: • Increasing capacity within our facilities • Reducing lead times to a level where we can better respond to customer needs • Investing in new product development • Monitoring outcome of election for actions that either side may take to stimulate economy • Potential infrastructure bill • Potential federal stimulus packages that may be provided at the state or local level to aid municipalities whose budgets have been impacted by the pandemic • Continue to be bullish about prospects for safe-digging; monitoring further developments on the regulatory front • Strong financial position and history of robust cash generation will allow us to pursue strategic acquisitions 11
Federal Signal Q3 2020 Earnings Call Q&A October 29, 2020 Jennifer Sherman, President & Chief Executive Officer Ian Hudson, SVP, Chief Financial Officer 12
Investor Information Stock Ticker - NYSE:FSS Company website: federalsignal.com/investors HEADQUARTERS 1415 West 22nd Street, Suite 1100 Oak Brook, IL 60523 INVESTOR RELATIONS CONTACTS 630-954-2000 Ian Hudson Svetlana Vinokur SVP, Chief Financial Officer VP, Treasurer and Corporate Development IHudson@federalsignal.com SVinokur@federalsignal.com 13
Federal Signal Q3 2020 Earnings Call Appendix 14
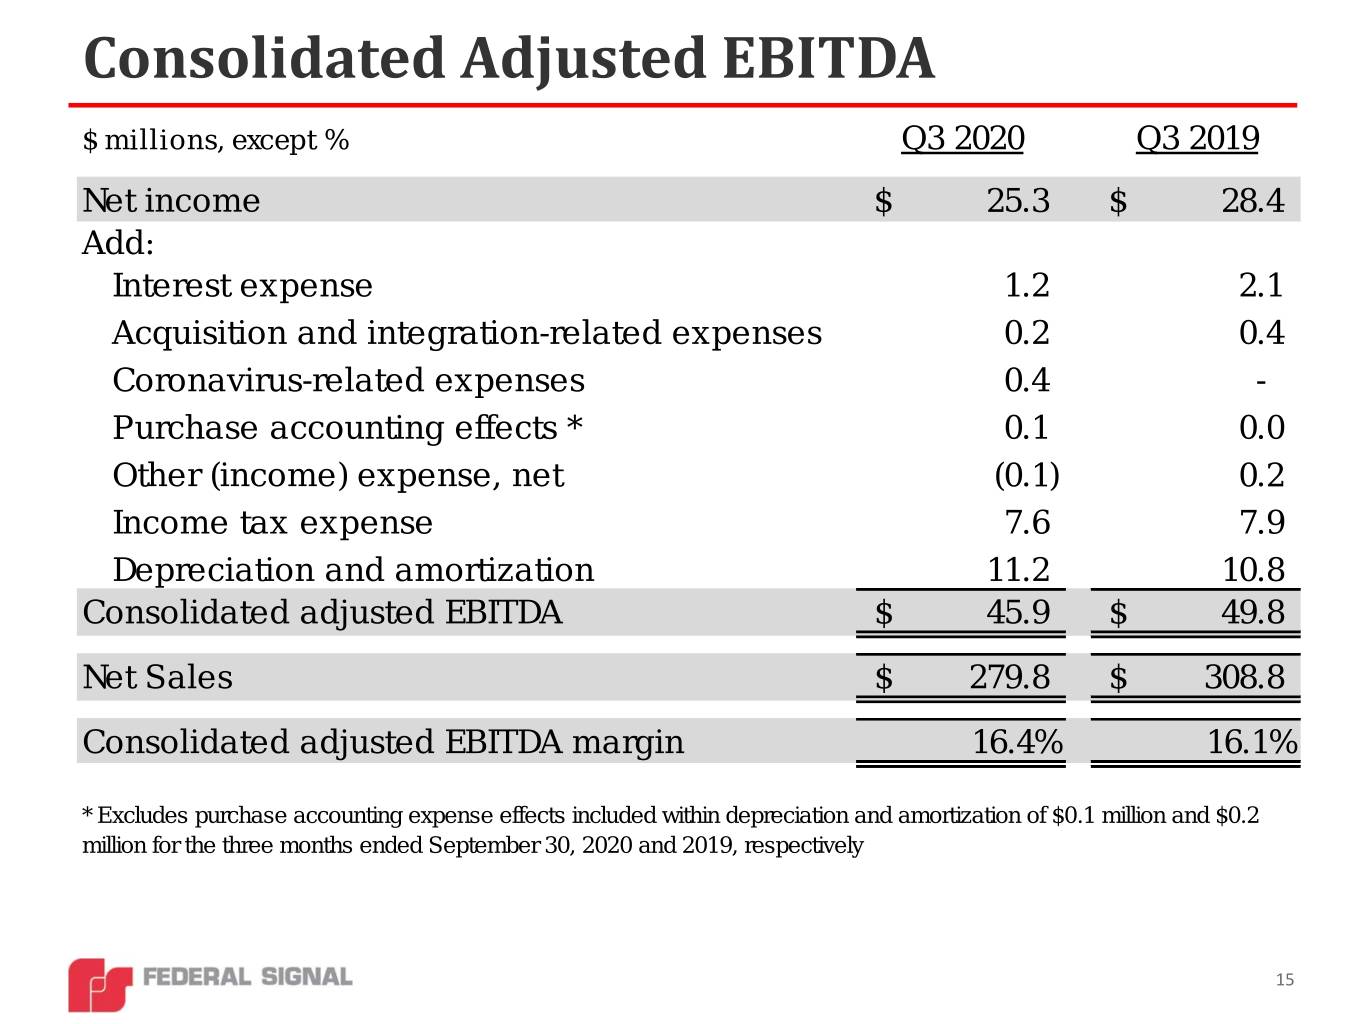
Consolidated Adjusted EBITDA $ millions, except % Q3 2020 Q3 2019 Net income $ 25.3 $ 28.4 Add: Interest expense 1.2 2.1 Acquisition and integration-related expenses 0.2 0.4 Coronavirus-related expenses 0.4 - Purchase accounting effects * 0.1 0.0 Other (income) expense, net (0.1) 0.2 Income tax expense 7.6 7.9 Depreciation and amortization 11.2 10.8 Consolidated adjusted EBITDA $ 45.9 $ 49.8 Net Sales $ 279.8 $ 308.8 Consolidated adjusted EBITDA margin 16.4% 16.1% * Excludes purchase accounting expense effects included within depreciation and amortization of $0.1 million and $0.2 million for the three months ended September 30, 2020 and 2019, respectively 15
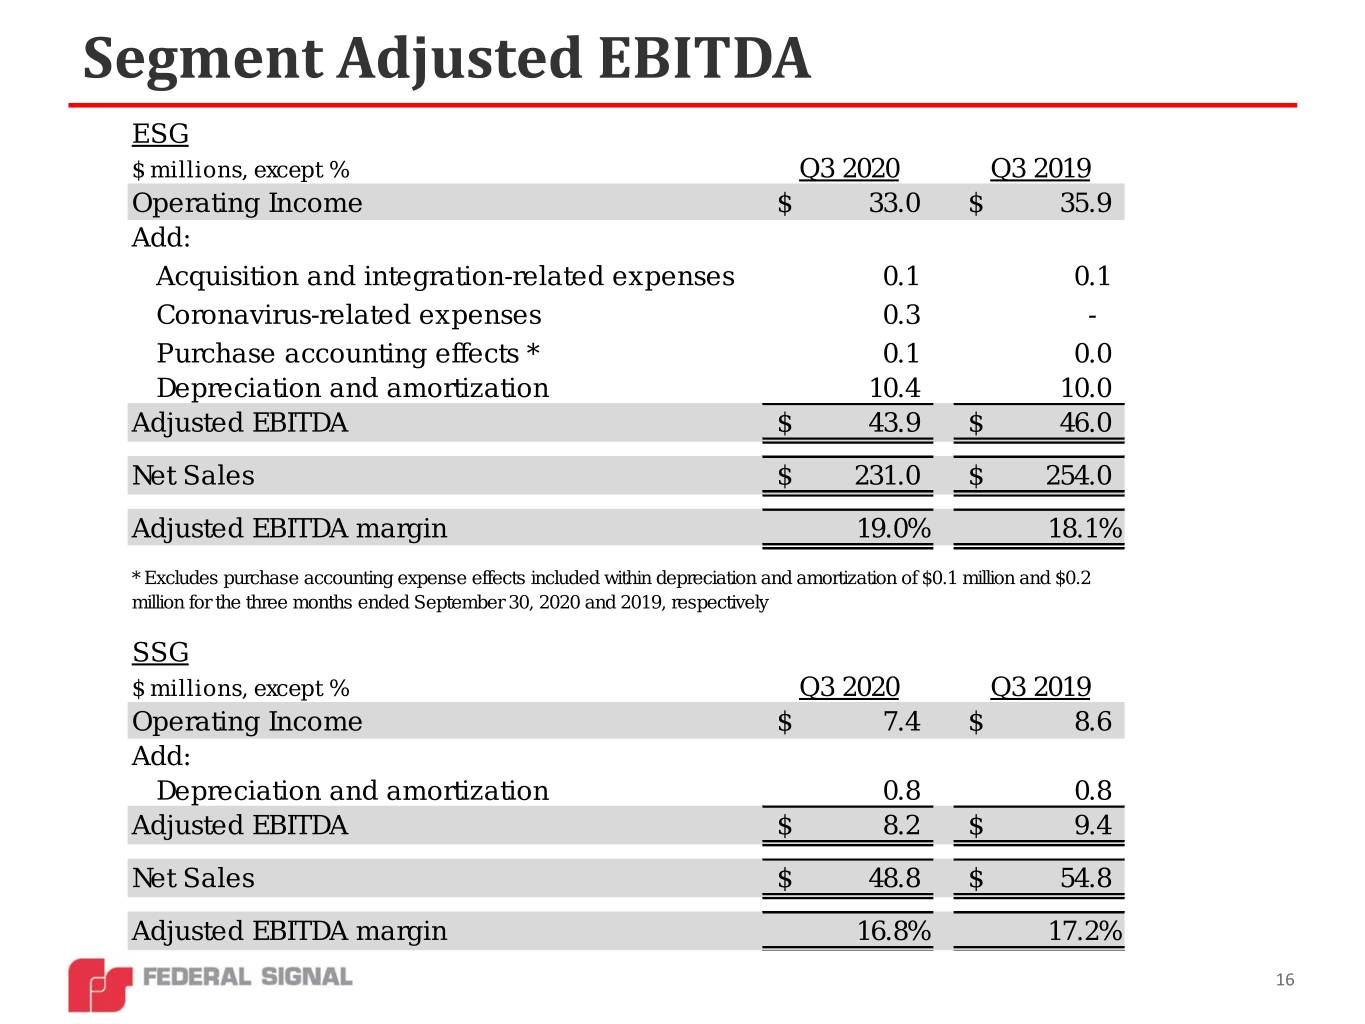
Segment Adjusted EBITDA ESG $ millions, except % Q3 2020 Q3 2019 Operating Income $ 33.0 $ 35.9 Add: Acquisition and integration-related expenses 0.1 0.1 Coronavirus-related expenses 0.3 - Purchase accounting effects * 0.1 0.0 Depreciation and amortization 10.4 10.0 Adjusted EBITDA $ 43.9 $ 46.0 Net Sales $ 231.0 $ 254.0 Adjusted EBITDA margin 19.0% 18.1% * Excludes purchase accounting expense effects included within depreciation and amortization of $0.1 million and $0.2 million for the three months ended September 30, 2020 and 2019, respectively SSG $ millions, except % Q3 2020 Q3 2019 Operating Income $ 7.4 $ 8.6 Add: Depreciation and amortization 0.8 0.8 Adjusted EBITDA $ 8.2 $ 9.4 Net Sales $ 48.8 $ 54.8 Adjusted EBITDA margin 16.8% 17.2% 16
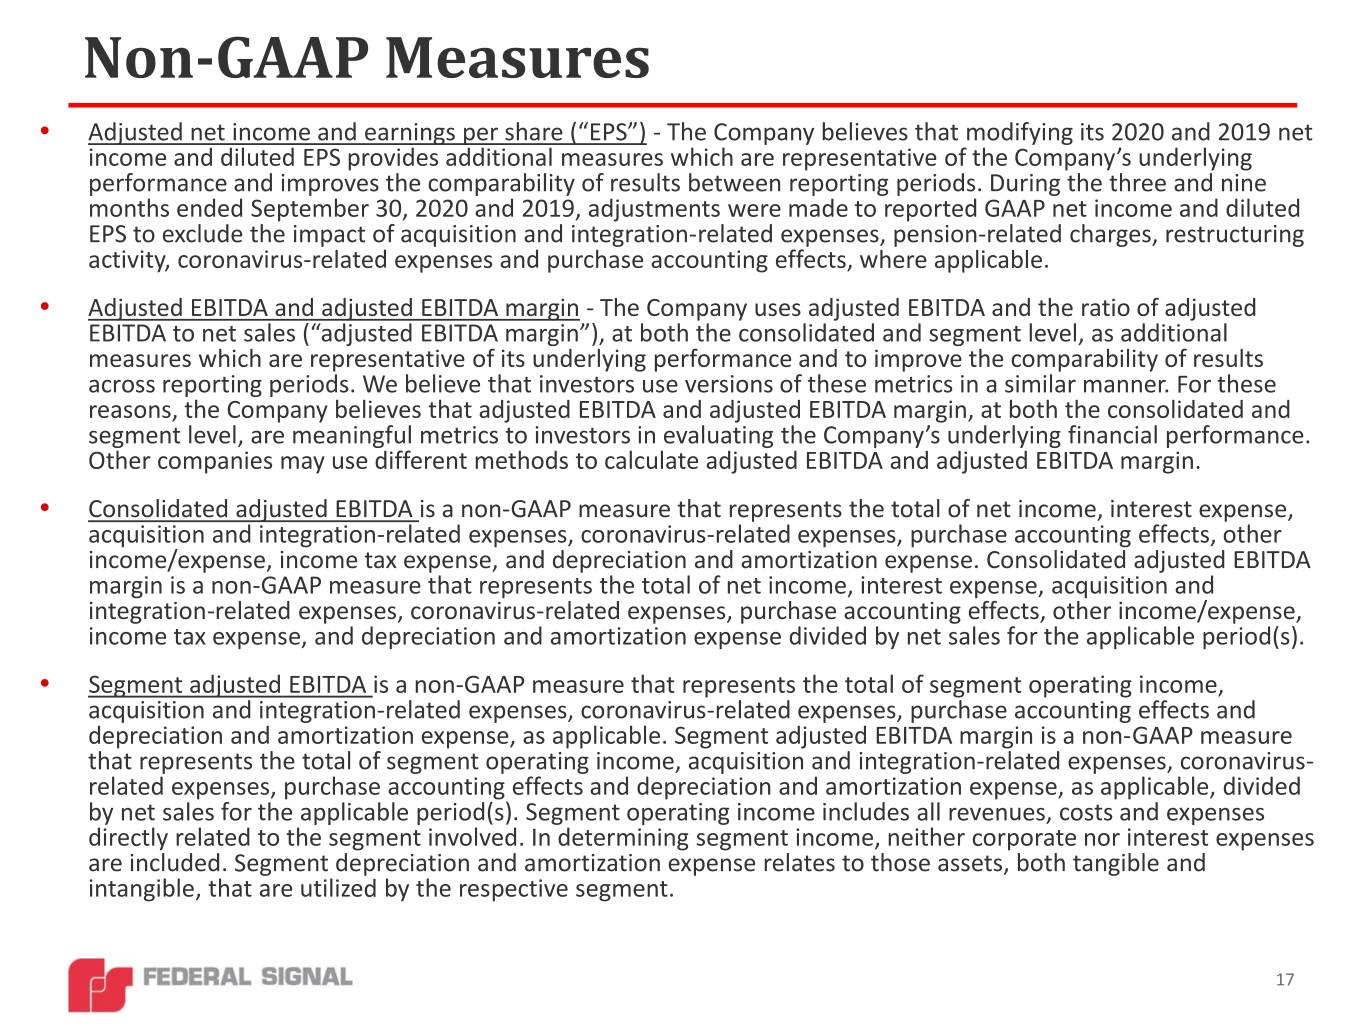
Non-GAAP Measures • Adjusted net income and earnings per share (“EPS”) - The Company believes that modifying its 2020 and 2019 net income and diluted EPS provides additional measures which are representative of the Company’s underlying performance and improves the comparability of results between reporting periods. During the three and nine months ended September 30, 2020 and 2019, adjustments were made to reported GAAP net income and diluted EPS to exclude the impact of acquisition and integration-related expenses, pension-related charges, restructuring activity, coronavirus-related expenses and purchase accounting effects, where applicable. • Adjusted EBITDA and adjusted EBITDA margin - The Company uses adjusted EBITDA and the ratio of adjusted EBITDA to net sales (“adjusted EBITDA margin”), at both the consolidated and segment level, as additional measures which are representative of its underlying performance and to improve the comparability of results across reporting periods. We believe that investors use versions of these metrics in a similar manner. For these reasons, the Company believes that adjusted EBITDA and adjusted EBITDA margin, at both the consolidated and segment level, are meaningful metrics to investors in evaluating the Company’s underlying financial performance. Other companies may use different methods to calculate adjusted EBITDA and adjusted EBITDA margin. • Consolidated adjusted EBITDA is a non-GAAP measure that represents the total of net income, interest expense, acquisition and integration-related expenses, coronavirus-related expenses, purchase accounting effects, other income/expense, income tax expense, and depreciation and amortization expense. Consolidated adjusted EBITDA margin is a non-GAAP measure that represents the total of net income, interest expense, acquisition and integration-related expenses, coronavirus-related expenses, purchase accounting effects, other income/expense, income tax expense, and depreciation and amortization expense divided by net sales for the applicable period(s). • Segment adjusted EBITDA is a non-GAAP measure that represents the total of segment operating income, acquisition and integration-related expenses, coronavirus-related expenses, purchase accounting effects and depreciation and amortization expense, as applicable. Segment adjusted EBITDA margin is a non-GAAP measure that represents the total of segment operating income, acquisition and integration-related expenses, coronavirus- related expenses, purchase accounting effects and depreciation and amortization expense, as applicable, divided by net sales for the applicable period(s). Segment operating income includes all revenues, costs and expenses directly related to the segment involved. In determining segment income, neither corporate nor interest expenses are included. Segment depreciation and amortization expense relates to those assets, both tangible and intangible, that are utilized by the respective segment. 17

