Attached files
| file | filename |
|---|---|
| EX-99.1 - EXHIBIT 99.1 - CMS ENERGY CORP | tm2034552d1_ex99-1.htm |
| 8-K - FORM 8-K - CMS ENERGY CORP | tm2034552d1_8k.htm |
Exhibit 99.2
Third Quarter 2020 Results and Outlook October 29, 2020

2 Enter “so what” if necessary – Century Gothic, Bold, Size 18 or smaller This presentation is made as of the date hereof and contains “forward - looking statements” as defined in Rule 3b - 6 of the Securit ies Exchange Act of 1934, Rule 175 of the Securities Act of 1933, and relevant legal decisions. The forward - looking statements are subject to risks and un certainties. All forward - looking statements should be considered in the context of the risk and other factors detailed from time to time in CMS Energy’s and C ons umers Energy’s Securities and Exchange Commission filings. Forward - looking statements should be read in conjunction with “FORWARD - LOOKING STATEMENTS AND I NFORMATION” and “RISK FACTORS” sections of CMS Energy’s and Consumers Energy’s most recent Form 10 - K and as updated in reports CMS Energy an d Consumers Energy file with the Securities and Exchange Commission. CMS Energy’s and Consumers Energy’s “FORWARD - LOOKING STATEMENTS AND INFORMATIO N” and “RISK FACTORS” sections are incorporated herein by reference and discuss important factors that could cause CMS Energy’s and Consum ers Energy’s results to differ materially from those anticipated in such statements. CMS Energy and Consumers Energy undertake no obligation to updat e a ny of the information presented herein to reflect facts, events or circumstances after the date hereof. The presentation also includes non - GAAP measures when describing CMS Energy’s results of operations and financial performance. A reconciliation of each of these measures to the most directly comparable GAAP measure is included in the appendix and posted on our website at www.c mse nergy.com. CMS Energy provides historical financial results on both a reported (GAAP) and adjusted (non - GAAP) basis and provides forward - lo oking guidance on an adjusted basis. During an oral presentation, references to “earnings” are on an adjusted basis. All references to net income ref er to net income available to common stockholders and references to earnings per share are on a diluted basis. Adjustments could include items such as disc ont inued operations, asset sales, impairments, restructuring costs, regulatory items from prior years, or other items. Management views adjusted earning s a s a key measure of the company’s present operating financial performance and uses adjusted earnings for external communications with analysts and in ves tors. Internally, the company uses adjusted earnings to measure and assess performance. Because the company is not able to estimate the impact of s pec ific line items, which have the potential to significantly impact, favorably or unfavorably, the company's reported earnings in future periods, the com pany is not providing reported earnings guidance nor is it providing a reconciliation for the comparable future period earnings. The adjusted earni ngs should be considered supplemental information to assist in understanding our business results, rather than as a substitute for the reported earnin gs. Investors and others should note that CMS Energy routinely posts important information on its website and considers the Inves tor Relations section, www.cmsenergy.com/investor - relations, a channel of distribution. 2

3 Agenda Enter “so what” if necessary – Century Gothic, Bold, Size 18 or smaller Business Update and Long - Term Outlook 3 Financial Results Patti Poppe President & CEO Rejji Hayes Executive VP & CFO PROFIT PLANET PEOPLE

4 a Adjusted (non - GAAP) 2020 On Track and 2021 Outlook Strong . . . . . . w ith consistent industry - leading financial performance. Results Amount Commentary • YTD 2020 EPS a $2.11 Demonstrating best - in - class cost management Guidance • 2020 Full - year EPS a $2.64 - $2.68 Focusing on reinvestment with three months to go • 2021 Full - year EPS a $2.82 - $2.86 Up 6% to 8% from midpoint of 2020 guidance range Long - term Outlook • EPS a and DPS growth 6% to 8% Long - term investment thesis remains strong
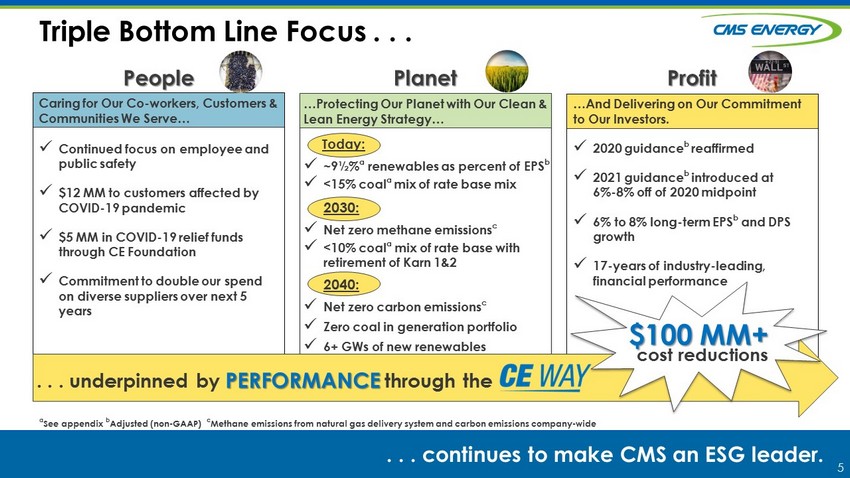
5 Caring for Our Co - workers, Customers & Communities We Serve… x Continued focus on employee and public safety x $12 MM to customers affected by COVID - 19 pandemic x $5 MM in COVID - 19 relief funds through CE Foundation x Commitment to double our spend on diverse suppliers over next 5 years a See appendix b Adjusted (non - GAAP) c Methane emissions from natural gas delivery system and carbon emissions company - wide People Profit Planet Triple Bottom Line Focus . . . . . . c ontinues to make CMS an ESG leader. …And Delivering on Our Commitment to Our Investors. x 2020 guidance b reaffirmed x 2021 guidance b introduced at 6% - 8% off of 2020 midpoint x 6% to 8% long - term EPS b and DPS growth x 17 - years of industry - leading, financial performance …Protecting Our Planet with Our Clean & Lean Energy Strategy… Today: x ~9½% a renewables as percent of EPS b x <15% coal a mix of rate base mix 2030: x Net zero methane emissions c x <10% coal a mix of rate base with retirement of Karn 1&2 2040: x Net zero carbon emissions c x Zero coal in generation portfolio x 6+ GWs of new renewables . . . underpinned by PERFORMANCE through the cost reductions $100 MM+
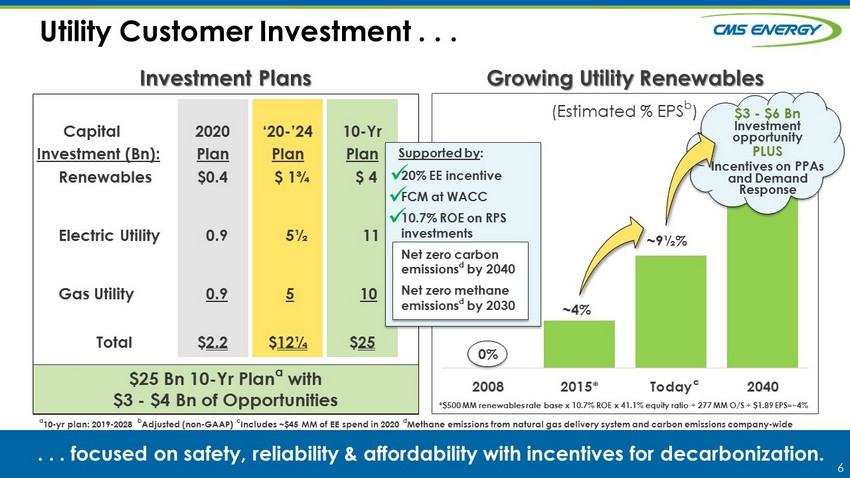
6 $25 Bn 10 - Yr Plan a with $3 - $4 Bn of Opportunities a 10 - yr plan: 2019 - 2028 b Adjusted (non - GAAP) c Includes ~$45 MM of EE spend in 2020 d Methane emissions from natural gas delivery system and carbon emissions company - wide Growing Utility Renewables Investment Plans Utility Customer Investment . . . 2020 Plan $0.4 0.9 0.9 $ 2.2 ‘20 - ’24 Plan $ 1¾ 5½ 5 $ 12¼ . . . focused on safety, reliability & affordability with incentives for decarbonization. 0% ~4% ~9½% 2008 2015* Today 2040 (Estimated % EPS b ) $3 - $6 Bn Investment opportunity PLUS Incentives on PPAs and Demand Response *$500 MM renewables rate base x 10.7% ROE x 41.1% equity ratio ÷ 277 MM O/S ÷ $1.89 EPS=~4% c Capital Investment (Bn): Renewables Electric Utility Gas Utility Total 10 - Yr Plan $ 4 11 10 $ 25 x x Supported by : x 20% EE incentive FCM at WACC 10.7% ROE on RPS investments Net zero carbon emissions d by 2040 Net zero methane emissions d by 2030

7 Our Commitment to ESG . . . . . . is recognized nationwide. a New or expanding load since 2015 Named Gold - Level Veteran Friendly Employer by the Michigan Veterans Affairs Agency (MVAA) Named the #1 Michigan Company for Diversity in 2019 by Forbes® Magazine Received 2019 Energy Star® Partner of the Year Sustained Excellence Award Ranked #1 overall in the Midwest Large Segment for the 2019 Gas Residential Customer Satisfaction Study, J.D. Power and Associates Named 2020 Barron’s 100 Most Sustainable Companies Top 100 #3 globally for Association for Talent Development 2019 Best Award Ranked Top 50 globally in Military Times Best for Vets : Employers 2019 #1 company in Michigan and Top 50 Best Employers for Diversity 2020 by Forbes® Magazine #1 utility for Best Employers for Women 2020 by Forbes® Magazine Talent Development Named a Top U.S. utility for economic development by Business Facilities and Site Selection magazines PLANET PROFIT PEOPLE PERFORMANCE Ranked Top Quartile by EEI Utility Standards in Safety Performance 0 300 2016 2017 2018 2019 ~300 MW a

8 a Including $36 MM of Calc. C DFIT amortization b Includes ~$84.5 MM acceleration of amortization of tax liabilities Oct. 2021 through Sept. 2022 Regulatory Outlook . . . Gas Gas 2020 2/27: U - 20697 Filed $244 MM a Updated $230 MM a 10.5% ROE Dec. Expected final order 4/15: U - 20757 COVID - 19 order for deferred accounting . . . o ffers limited economic exposure in 2021 . 8/10 Settlement Approved U - 20650 b $144 MM 9.9% ROE, 52.05% Equity Ratio Stay - out until Dec. 2021 2021 9/18: Filed for securitization of Karn 1&2 coal plants ~$703 MM Regulatory / Policy Stay - out Q1: File next rate case Electric

9 a Adjusted (non - GAAP) Managing Work Every Year . . . 2012 2013 2014 2015 EPS a 2016 2017 +7% +7% +7% +7% +7% 2018 2019 Mild winter Hot summer Cost productivity above plan Reinvestment Cost productivity above plan Mild summer Record warm Offsets Storms Cost productivity above plan Weather & storms Cost productivity Hot summer Reinvestment Cold January Storms . . . maximizes benefits for customers and investors year - in and year - out. +7% +7% +7% Significant reinvestment at the Utility since 2013 (13)¢ +13¢ +7¢ (10)¢ +18¢ +17¢ (13)¢ +23¢ (16)¢ (9)¢ 2020 Actively being reinvested $100 MM+ savings

10 a See appendix b Adjusted (non - GAAP) By Business Segment Utility Enterprises EnerBank Parent & other CMS Energy EPS - (GAAP) Adjustments a Adjusted (non - GAAP) Year to Date Results 2020 YTD Performance . . . EPS - (GAAP) Adjustments a Adjusted (non - GAAP) $1.81 -- $ 1.81 73 ¢ -- 73 ¢ $2.09 0.02 $ 2.11 76¢ 1 77 ¢ YTD EPS b $2.24 0 .11 0.12 ( 0. 36 ) $ 2 .11 2019 2020 2019 2020 Third Quarter . . . tracking well through company - wide cost reduction efforts.

11 Residential Electric 39% Residential Gas 23% Commercial 23% Other Industrial 11% Auto 2% Other 2% 2019 Electric & Gas Rate Mix b a 2020 year over year change in GWh, excludes ROA and other b Tariff net of PSCR and GCR c Excludes one large, low margin industrial customer Utility Sales Continue to Recover . . . Combined Residential >60% . . . a nd are supported by favorable mix. Weather - Normalized Electric Deliveries a (3Q20 vs. 3Q19) Res. Com. Ind. Total 6% (4)% (3½)% c ~ ½ % c

12 a Adjusted (non - GAAP) 2020 EPS a on Track . . . 2019 Weather Absence of Storms Rates & Investment Cost Savings, Usage & Other Absence of 2019 Weather Rates & Investment Reinvestments, Usage & Other 2020 First Nine Months 30¢ Three Months To Go (11)¢ - (15) ¢ . . . managing through COVID - 19 risks. YTD $1.81 YTD $2.11 (4) ¢ 5¢ 13¢ 16¢ (2) ¢ 7¢ (16) ¢ - (20) ¢ $2.49 $2.64 - $2.68 6% to 8% . . . with emphasis on reinvestment to the benefit of all stakeholders . Cost Savings Benefits Operations Other Total COVID - 19 expense Net cost savings 4 ¢ 14 10 28 ¢ (4) 24 ¢ Reinvestment opportunity to benefit customers and de - risk 2021 beyond

13 Cost of Capital Capital Investments Taxes O&M Costs Fuel and Power Costs 0% 100% Residential Bills as % of Wallet a Housing 30% Housing 26 % Other 30% Other 29 % Transportation 15 % Transportation 17 % Food 12 % Food 13 % Healthcare 5 % Healthcare 8 % TV & Phone 4 % TV & Phone 4 % 2007 2019 (Electric & Gas) a Consumers Energy bill as % of Michigan household income, in current dollars. Source: Fred.stlouisfed.org, Bls.gov, Consumers internal b il ls; percentages may not total 100% due to rounding . Our Entire Cost Structure . . . Cost Components ~$19 Bn Customer investment (2007 - 2019) Utility Bill ~4% Utility Bill ~3% Down 100 bps ~70% Non - capital related . . . offers cost reduction opportunities to maintain customer affordability.

14 2003 2004 2005 2006 2007 2008 2009 2010 2011 2012 2013 2014 2015 2016 2017 2018 2019 2020 Recession Recession EPS a Dividend +7% +6% to +8% a Adjusted (non - GAAP) Consistent Growth Through . . . Cold winter Mild summer Warm winter Warm winter Mild summer Cold winter Summer - less Hot summer Hot summer Warm winter Mild summer Polar vortex Cold Feb Warm Dec Warm winter Warm winter Hot summer Storms Governor (D) Governor (R) (D) Commission (D) Commission (D) Commission (R) Commission (I) Weather Help Hurt 7% CAGR a . . . changing circumstances. (D)
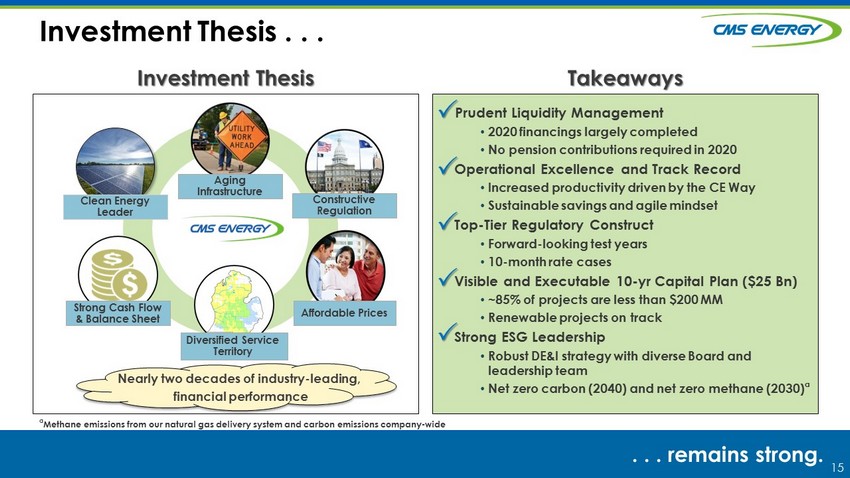
15 Investment Thesis Takeaways Prudent Liquidity Management • 2020 financings largely completed • No pension contributions required in 2020 Operational Excellence and Track Record • Increased productivity driven by the CE Way • Sustainable savings and agile mindset Top - Tier Regulatory Construct • Forward - looking test years • 10 - month rate cases Visible and Executable 10 - yr Capital Plan ($25 Bn) • ~85% of projects are less than $200 MM • Renewable projects on track Strong ESG Leadership • Robust DE&I strategy with diverse Board and leadership team • Net zero carbon (2040) and net zero methane (2030) a a Methane emissions from our natural gas delivery system and carbon emissions company - wide Investment Thesis . . . Aging Infrastructure Constructive Regulation Strong Cash Flow & Balance Sheet Affordable Prices Clean Energy Leader Diversified Service Territory Nearly two decades of industry - leading, financial performance . . . remains strong.

16 16 Q&A Thank You

17 17 Appendix
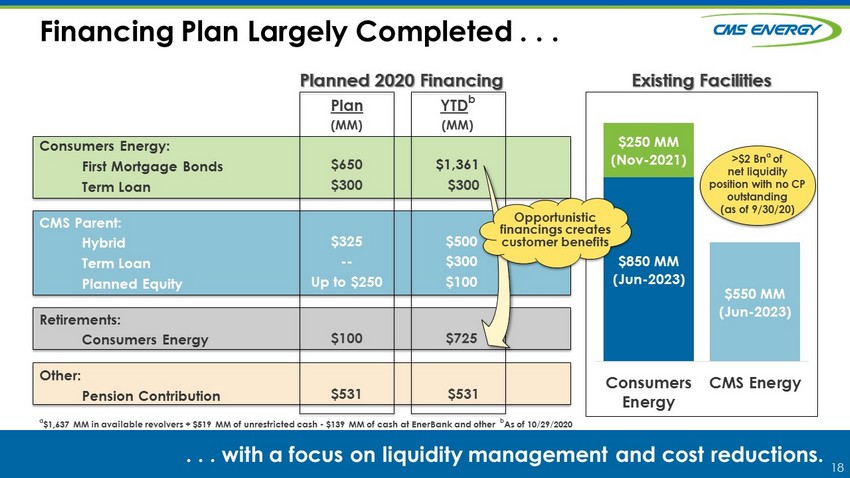
18 Consumers Energy: First Mortgage Bonds Term Loan CMS Parent: Hybrid Term Loan Planned Equity Retirements: Consumers Energy Other: Pension Contribution a $1,637 MM in available revolvers + $519 MM of unrestricted cash - $139 MM of cash at EnerBank and other b As of 10/29/2020 Existing Facilities $850 MM (Jun - 2023) $550 MM (Jun - 2023) $250 MM (Nov - 2021) Consumers Energy CMS Energy Planned 2020 Financing Financing Plan Largely Completed . . . Plan (MM) $650 $300 $325 -- Up to $250 $100 $531 YTD b (MM) $1,361 $300 $500 $300 $100 $725 $531 >$2 Bn a of net liquidity position with no CP outstanding (as of 9/30/20) . . . with a focus on liquidity management and cost reductions. Opportunistic financings creates customer benefits
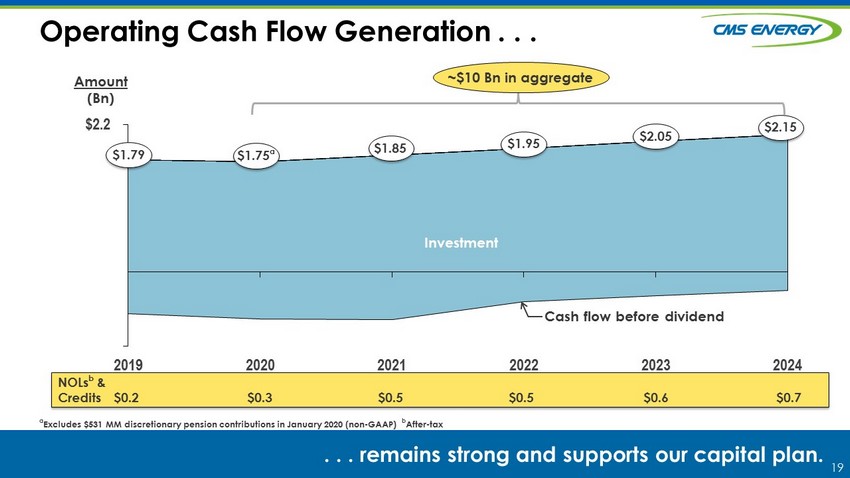
19 a Excludes $531 MM discretionary pension contributions in January 2020 (non - GAAP) b After - tax Operating Cash Flow Generation . . . (1.1) $2.2 2019 2020 2021 2022 2023 2024 $1.75 a $1.85 $1.95 $2.05 $2.15 Amount (Bn) Cash flow before dividend Investment NOLs b & Credits $0.2 $0.3 $0.5 $0.5 $0.6 $0.7 ~$10 Bn in aggregate . . . remains strong and supports our capital plan. $1.79

20 . Ratings Drivers Credit Metrics Maintained . . . Consumers Energy CMS Energy • Strong financial position • Growing operating cash flow • Return on regulated investment • Supportive regulatory environment Senior Secured Commercial Paper Outlook Senior Unsecured Junior Subordinated Outlook Last Review A A - 2 Stable BBB BBB - Stable Jan. 2020 Aa3 P - 1 Negative Baa1 Baa2 Negative Jul. 2020 A+ F - 2 Stable BBB BB+ Stable Sep . 2020 S&P Moody’s Fitch . . . at solid investment - grade levels.

21 $ 45 $ 38 $38 ~$35/ yr ~$90 $0 $10 $20 $30 $40 $50 $60 $70 $80 $90 $100 2017 2018 2019 2020-2023 2024+ a Assumes 100% capacity available at $3.00 and $7.50/kw - month b $/kw - month DIG (750 MW) & Peakers (200 MW) . . . ~$45 Pre - Tax Income (MM) Opportunities a (MM) Planning Year (MISO) 2020 Through 2023 Capacity (~$2.00/kw - month ) Energy Contracted 100% >95% • LCR upheld by MI Supreme Court • MISO Zone 7 PY ’20/’21 cleared at CONE $7.50 b $3.00 b . . . offers risk mitigation to plan with future upside opportunities. ~30 MW contracted at $4.25 b
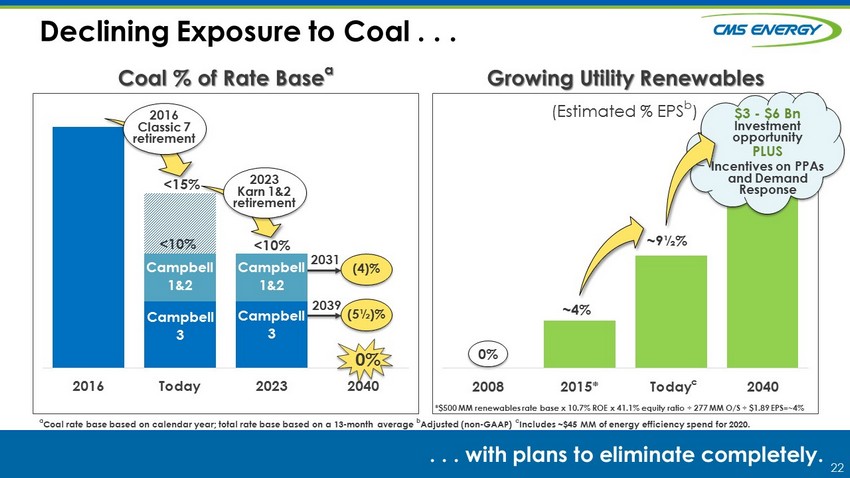
22 Declining Exposure to Coal . . . . . . with plans to eliminate completely. Campbell 3 Campbell 3 20% Campbell 1&2 Campbell 1&2 <10% 2016 Today 2023 2040 0% ~4% ~9½% 2008 2015* Today 2040 (Estimated % EPS b ) a Coal rate base based on calendar year; total rate base based on a 13 - month average b Adjusted (non - GAAP) c Includes ~$45 MM of energy efficiency spend for 2020. 2016 Classic 7 retirement 2031 2039 (4)% (5½)% $3 - $6 Bn Investment opportunity PLUS Incentives on PPAs and Demand Response 0% Coal % of Rate Base a Growing Utility Renewables 2023 Karn 1&2 retirement <15% <10% *$500 MM renewables rate base x 10.7% ROE x 41.1% equity ratio ÷ 277 MM O/S ÷ $1.89 EPS=~4% c
23 GAAP Reconciliation

24 CMS ENERGY CORPORATION Reconciliation of GAAP EPS to Non - GAAP Adjusted EPS by Segment (Unaudited) Electric Utility Reported net income per share $ 0.79 $ 0.78 $ 1.62 $ 1.47 Reconciling items: Other exclusions from adjusted earnings 0.01 - 0.03 - Tax impact (*) - (0.01) - Voluntary separation program * - 0.03 - Tax impact (*) - (0.01) - Adjusted net income per share – non-GAAP $ 0.80 $ 0.78 $ 1.66 $ 1.47 Gas Utility Reported net income (loss) per share $ 0.02 $ (0.03) $ 0.57 $ 0.42 Reconciling items: Other exclusions from adjusted earnings * - * - Tax impact (*) - (*) - Voluntary separation program * - 0.01 - Tax impact (*) - (*) - Adjusted net income (loss) per share – non-GAAP $ 0.02 $ (0.03) $ 0.58 $ 0.42 Enterprises Reported net income per share $ 0.04 $ 0.03 $ 0.12 $ 0.11 Reconciling items: Other exclusions from adjusted earnings (*) * * * Tax impact * (*) (*) (*) Tax reform - - (0.01) - Voluntary separation program * - * - Tax impact (*) - (*) - Adjusted net income per share – non-GAAP $ 0.04 $ 0.03 $ 0.11 $ 0.11 EnerBank Reported net income per share $ 0.04 $ 0.04 $ 0.12 $ 0.11 Reconciling items: Other exclusions from adjusted earnings - - - - Adjusted net income per share – non-GAAP $ 0.04 $ 0.04 $ 0.12 $ 0.11 Corporate Interest and Other Reported net loss per share $ (0.13) $ (0.09) $ (0.34) $ (0.30) Reconciling items: Other exclusions from adjusted earnings (*) * (*) * Tax impact * (*) * (*) Tax reform - - (0.02) - Adjusted net loss per share – non-GAAP $ (0.13) $ (0.09) $ (0.36) $ (0.30) Consolidated Reported net income per share $ 0.76 $ 0.73 $ 2.09 $ 1.81 Reconciling items: Other exclusions from adjusted earnings 0.01 * 0.03 * Tax impact (*) (*) (0.01) (*) Tax reform - - (0.03) - Voluntary separation program * - 0.04 - Tax impact (*) - (0.01) - Adjusted net income per share – non-GAAP $ 0.77 $ 0.73 $ 2.11 $ 1.81 Average Common Shares Outstanding – Diluted 286.9 284.6 286.3 284.2 * Less than $0.01 per share. In Millions, Except Per Share Amounts Three Months Ended Nine Months Ended 9/30/20 9/30/19 9/30/20 9/30/19
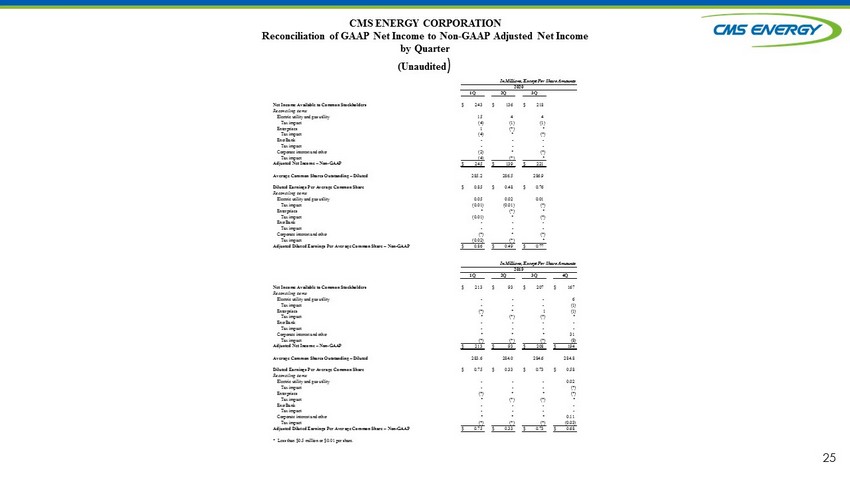
25 CMS ENERGY CORPORATION Reconciliation of GAAP Net Income to Non - GAAP Adjusted Net Income by Quarter (Unaudited ) Net Income Available to Common Stockholders $ 243 $ 136 $ 218 Reconciling items: Electric utility and gas utility 15 4 4 Tax impact (4) (1) (1) Enterprises 1 (*) * Tax impact (4) * (*) EnerBank - - - Tax impact - - - Corporate interest and other (2) * (*) Tax impact (4) (*) * Adjusted Net Income – Non-GAAP $ 245 $ 139 $ 221 Average Common Shares Outstanding – Diluted 285.2 286.5 286.9 Diluted Earnings Per Average Common Share $ 0.85 $ 0.48 $ 0.76 Reconciling items: Electric utility and gas utility 0.05 0.02 0.01 Tax impact (0.01) (0.01) (*) Enterprises * (*) * Tax impact (0.01) * (*) EnerBank - - - Tax impact - - - Corporate interest and other (*) * (*) Tax impact (0.02) (*) * Adjusted Diluted Earnings Per Average Common Share – Non-GAAP $ 0.86 $ 0.49 $ 0.77 Net Income Available to Common Stockholders $ 213 $ 93 $ 207 $ 167 Reconciling items: Electric utility and gas utility - - - 6 Tax impact - - - (1) Enterprises (*) * 1 (1) Tax impact * (*) (*) * EnerBank - - - - Tax impact - - - - Corporate interest and other * * * 31 Tax impact (*) (*) (*) (8) Adjusted Net Income – Non-GAAP $ 213 $ 93 $ 208 $ 194 Average Common Shares Outstanding – Diluted 283.6 284.0 284.6 284.8 Diluted Earnings Per Average Common Share $ 0.75 $ 0.33 $ 0.73 $ 0.58 Reconciling items: Electric utility and gas utility - - - 0.02 Tax impact - - - (*) Enterprises (*) * * (*) Tax impact * (*) (*) * EnerBank - - - - Tax impact - - - - Corporate interest and other * * * 0.11 Tax impact (*) (*) (*) (0.03) Adjusted Diluted Earnings Per Average Common Share – Non-GAAP $ 0.75 $ 0.33 $ 0.73 $ 0.68 * Less than $0.5 million or $0.01 per share. In Millions, Except Per Share Amounts 2019 1Q 2Q 3Q 4Q In Millions, Except Per Share Amounts 2020 1Q 2Q 3Q

26 CMS ENERGY CORPORATION Reconciliation of GAAP Net Income to Non - GAAP Adjusted Net Income (Unaudited) Net Income Available to Common Stockholders $ 218 $ 207 $ 597 $ 513 Reconciling items: Other exclusions from adjusted earnings 4 1 11 1 Tax impact (1) (*) (2) (*) Tax reform - - (9) - Voluntary separation program * - 11 - Tax impact (*) - (3) - Adjusted net income – non-GAAP $ 221 $ 208 $ 605 $ 514 Average Common Shares Outstanding Basic 285.6 283.0 284.8 282.9 Diluted 286.9 284.6 286.3 284.2 Basic Earnings Per Average Common Share Reported net income per share $ 0.76 $ 0.73 $ 2.10 $ 1.81 Reconciling items: Other exclusions from adjusted earnings 0.01 * 0.03 * Tax impact (*) (*) (0.01) (*) Tax reform - - (0.03) - Voluntary separation program * - 0.04 - Tax impact (*) - (0.01) - Adjusted net income per share – non-GAAP $ 0.77 $ 0.73 $ 2.12 $ 1.81 Diluted Earnings Per Average Common Share Reported net income per share $ 0.76 $ 0.73 $ 2.09 $ 1.81 Reconciling items: Other exclusions from adjusted earnings 0.01 * 0.03 * Tax impact (*) (*) (0.01) (*) Tax reform - - (0.03) - Voluntary separation program * - 0.04 - Tax impact (*) - (0.01) - Adjusted net income per share – non-GAAP $ 0.77 $ 0.73 $ 2.11 $ 1.81 * Less than $0.5 million or $0.01 per share. In Millions, Except Per Share Amounts Management views adjusted (non-Generally Accepted Accounting Principles) earnings as a key measure of the Company's present operating financial performance and uses adjusted earnings for external communications with analysts and investors. Internally, the Company uses adjusted earnings to measure and assess performance. Adjustments could include items such as discontinued operations, asset sales, impairments, restructuring costs, regulatory items from prior years, or other items detailed in these summary financial statements. Adjusted earnings should be considered supplemental information to assist in understanding our business results, rather than as a substitute for reported earnings. Three Months Ended Nine Months Ended 9/30/20 9/30/19 9/30/20 9/30/19
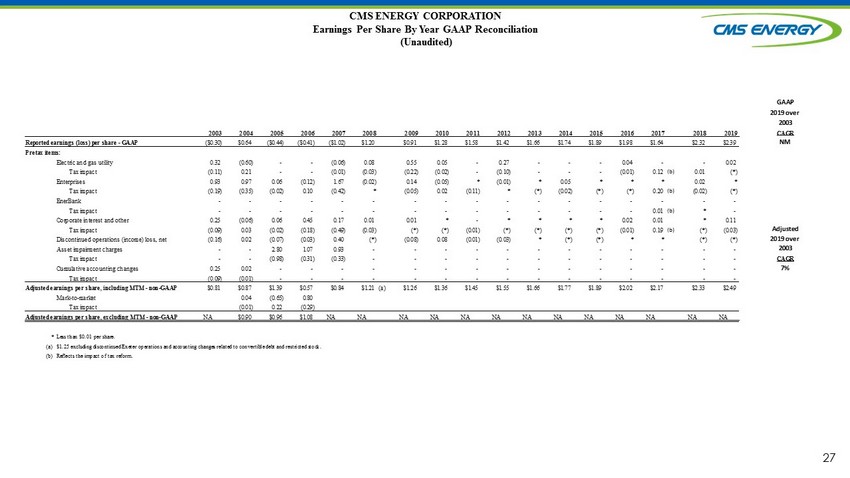
27 GAAP GAAP 2019 over 2019 over 2003 2018 2003 2004 2005 2006 2007 2008 2009 2010 2011 2012 2013 2014 2015 2016 2017 2018 2019 CAGR Growth Reported earnings (loss) per share - GAAP ($0.30) $0.64 ($0.44) ($0.41) ($1.02) $1.20 $0.91 $1.28 $1.58 $1.42 $1.66 $1.74 $1.89 $1.98 $1.64 $2.32 $2.39 NM 3% Pretax items: Electric and gas utility 0.32 (0.60) - - (0.06) 0.08 0.55 0.05 - 0.27 - - - 0.04 - - 0.02 Tax impact (0.11) 0.21 - - (0.01) (0.03) (0.22) (0.02) - (0.10) - - - (0.01) 0.12 (b) 0.01 (*) Enterprises 0.93 0.97 0.06 (0.12) 1.67 (0.02) 0.14 (0.05) * (0.01) * 0.05 * * * 0.02 * Tax impact (0.19) (0.35) (0.02) 0.10 (0.42) * (0.05) 0.02 (0.11) * (*) (0.02) (*) (*) 0.20 (b) (0.02) (*) EnerBank - - - - - - - - - - - - - - - - - Tax impact - - - - - - - - - - - - - - 0.01 (b) * - Corporate interest and other 0.25 (0.06) 0.06 0.45 0.17 0.01 0.01 * - * * * * 0.02 0.01 * 0.11 Tax impact (0.09) 0.03 (0.02) (0.18) (0.49) (0.03) (*) (*) (0.01) (*) (*) (*) (*) (0.01) 0.19 (b) (*) (0.03) Adjusted Adjusted Discontinued operations (income) loss, net (0.16) 0.02 (0.07) (0.03) 0.40 (*) (0.08) 0.08 (0.01) (0.03) * (*) (*) * * (*) (*) 2019 over 2019 over Asset impairment charges - - 2.80 1.07 0.93 - - - - - - - - - - - - 2003 2018 Tax impact - - (0.98) (0.31) (0.33) - - - - - - - - - - - - CAGR Growth Cumulative accounting changes 0.25 0.02 - - - - - - - - - - - - - - - 7% 7% Tax impact (0.09) (0.01) - - - - - - - - - - - - - - - Adjusted earnings per share, including MTM - non-GAAP $0.81 $0.87 $1.39 $0.57 $0.84 $1.21 (a) $1.26 $1.36 $1.45 $1.55 $1.66 $1.77 $1.89 $2.02 $2.17 $2.33 $2.49 Mark-to-market 0.04 (0.65) 0.80 Tax impact (0.01) 0.22 (0.29) Adjusted earnings per share, excluding MTM - non-GAAP NA $0.90 $0.96 $1.08 NA NA NA NA NA NA NA NA NA NA NA NA NA * Less than $0.01 per share. (a) $1.25 excluding discontinued Exeter operations and accounting changes related to convertible debt and restricted stock. (b) Reflects the impact of tax reform. CMS ENERGY CORPORATION Earnings Per Share By Year GAAP Reconciliation (Unaudited)

28 CMS ENERGY CORPORATION Reconciliation of GAAP Operating Activities to Non - GAAP Operating Activities (Unaudited) (mils) 2020 GAAP Net cash provided by operating activities 1,219$ 531 Non-GAAP Net cash provided by operating activities 1,750$ Add back discretionary pension contribution