Attached files
| file | filename |
|---|---|
| EX-99.1 - EX-99.1 - S&T BANCORP INC | stba-2q20investorsheetfi.htm |
| 8-K - 8-K - S&T BANCORP INC | stba-20200909.htm |
Second Quarter 2020 Todd Brice Chief Executive Officer Dave Antolik President Mark Kochvar Chief Financial Officer MEMBERMEMBER FDIC FDIC
Forward Looking Statements and Risk Factors This information contains certain forward-looking statements within the meaning of the Private Securities Litigation Reform Act of 1995. Forward-looking statements generally relate to our financial condition, results of operations, plans, objectives, outlook for earnings, revenues, expenses, capital and liquidity levels and ratios, asset levels, asset quality, financial position, and other matters regarding or affecting S&T and its future business and operations. Forward-looking statements are typically identified by words or phrases such as “will likely result”, “expect”, “anticipate”, “estimate”, “forecast”, “project”, “intend”, “ believe”, “assume”, “strategy”, “trend”, “plan”, “outlook”, “outcome”, “continue”, “remain”, “potential”, “opportunity”, “believe”, “comfortable”, “current”, “position”, “maintain”, “sustain”, “seek”, “achieve” and variations of such words and similar expressions, or future or conditional verbs such as will, would, should, could or may. Although we believe the assumptions upon which these forward-looking statements are based are reasonable, any of these assumptions could prove to be inaccurate and the forward-looking statements based on these assumptions could be incorrect. The matters discussed in these forward-looking statements are subject to various risks, uncertainties and other factors that could cause actual results and trends to differ materially from those made, projected, or implied in or by the forward-looking statements depending on a variety of uncertainties or other factors including, but not limited to: credit losses and the credit risk of our commercial and consumer loan products; changes in the level of charge-offs and changes in estimates of the adequacy of the allowance for credit losses; cyber-security concerns; rapid technological developments and changes; operational risks or risk management failures by us or critical third parties, including fraud risk; our ability to manage our reputational risks; sensitivity to the interest rate environment including a prolonged period of low interest rates, a rapid increase in interest rates or a change in the shape of the yield curve; a change in spreads on interest-earning assets and interest-bearing liabilities; regulatory supervision and oversight, including changes in regulatory capital requirements and our ability to address those requirements; unanticipated changes in our liquidity position; changes in accounting policies, practices, or guidance, for example, our adoption of CECL; legislation affecting the financial services industry as a whole, and S&T, in particular; the outcome of pending and future litigation and governmental proceedings; increasing price and product/service competition; the ability to continue to introduce competitive new products and services on a timely, cost-effective basis; managing our internal growth and acquisitions; the possibility that the anticipated benefits from acquisitions, including DNB, cannot be fully realized in a timely manner or at all, or that integrating the acquired operations will be more difficult, disruptive or costly than anticipated; containing costs and expenses; reliance on significant customer relationships; an interruption or cessation of an important service by a third-party provider; our ability to attract and retain talented executives and employees; general economic or business conditions, including the strength of regional economic conditions in our market area; the duration and severity of the corona virus (“COVID-19”) pandemic, both in our principal area of operations and nationally, including the ultimate impact of the pandemic on the economy generally and on our operations; deterioration of the housing market and reduced demand for mortgages; deterioration in the overall macroeconomic conditions or the state of the banking industry that could warrant further analysis of the carrying value of goodwill and could result in an adjustment to its carrying value resulting in a non- cash charge to net income; the stability of our core deposit base and access to contingency funding; re-emergence of turbulence in significant portions of the global financial and real estate markets that could impact our performance, both directly, by affecting our revenues and the value of our assets and liabilities, and indirectly, by affecting the economy generally and access to capital in the amounts, at the times and on the terms required to support our future businesses. Many of these factors, as well as other factors, are described in our filings with the SEC. Forward-looking statements are based on beliefs and assumptions using information available at the time the statements are made. We caution you not to unduly rely on forward-looking statements because the assumptions, beliefs, expectations and projections about future events may, and often do, differ materially from actual results. Any forward-looking statement speaks only as to the date on which it is made, and we undertake no obligation to update any forward- looking statement to reflect developments occurring after the statement is made. Non-GAAP Financial Measures In addition to the results of operations presented in accordance with Generally Accepted Accounting Principles (GAAP), S&T management uses and this presentation contains or references certain non-GAAP financial measures, such as net interest income on a fully taxable equivalent basis. S&T believes these financial measures provide information useful to investors in understanding our operational performance and business and performance trends which facilitate comparisons with the performance of others in the financial services industry. Although S&T believes that these non-GAAP financial measures enhance investors’ understanding of S&T’s business and performance, these non- GAAP financial measures should not be considered an alternative to GAAP. The non-GAAP financial measures contained therein should be read in conjunction with the audited financial statements and analysis as presented in the Annual Report on Form 10-K as well as the unaudited financial statements and analyses as presented in the respective Quarterly Reports in Exhibit 99.1 of Form 8-K for S&T Bancorp, Inc. and subsidiaries. MEMBER FDIC 2
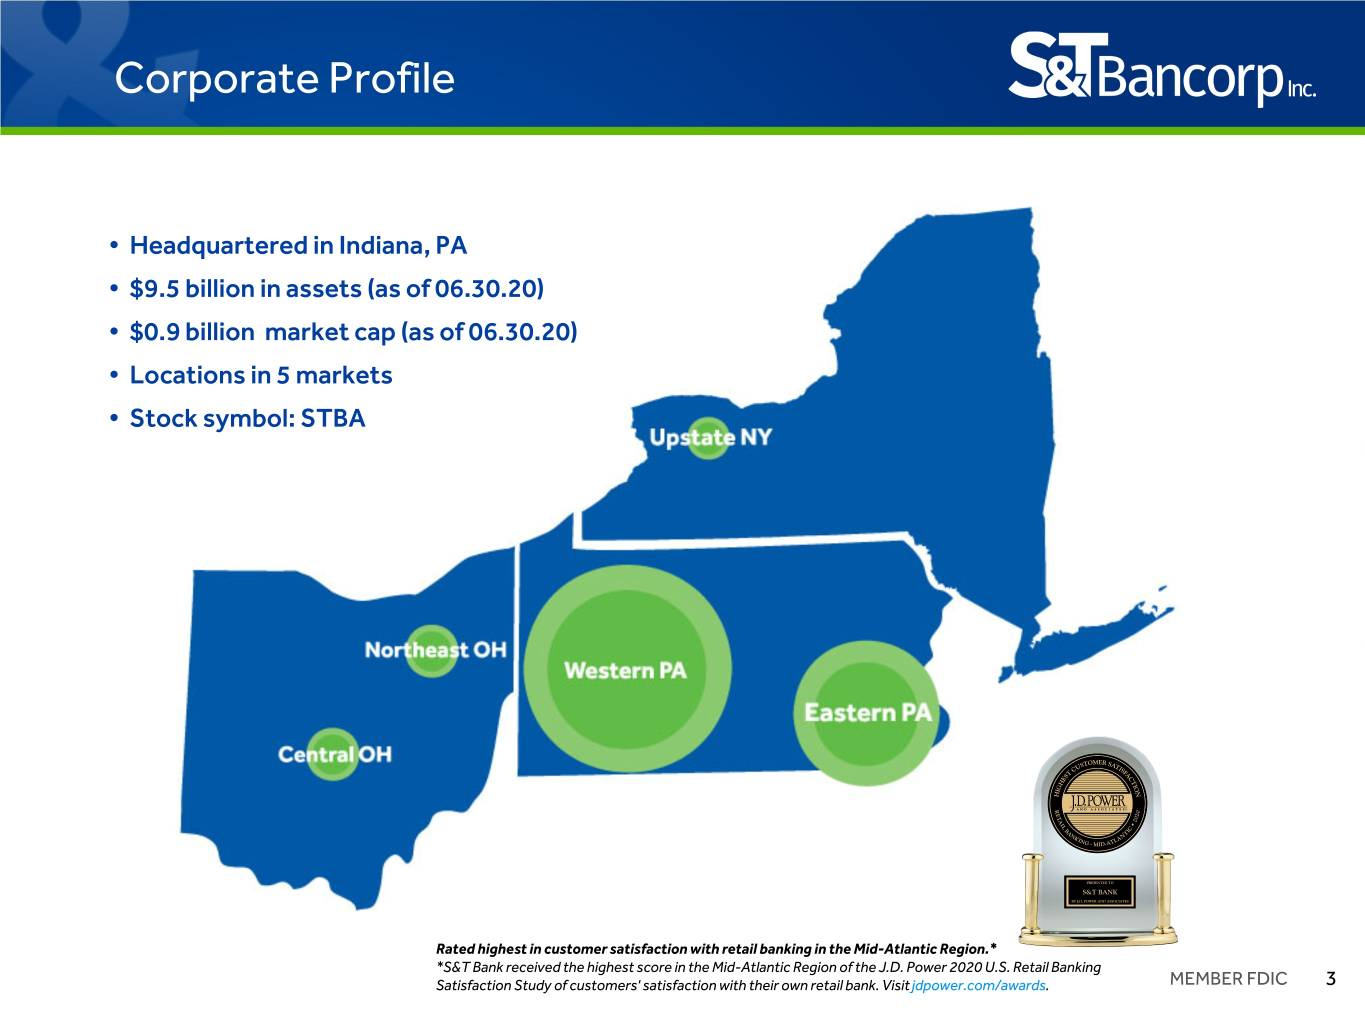
Corporate Profile • Headquartered in Indiana, PA • $9.5 billion in assets (as of 06.30.20) • $0.9 billion market cap (as of 06.30.20) • Locations in 5 markets • Stock symbol: STBA Rated highest in customer satisfaction with retail banking in the Mid-Atlantic Region.* *S&T Bank received the highest score in the Mid-Atlantic Region of the J.D. Power 2020 U.S. Retail Banking Satisfaction Study of customers' satisfaction with their own retail bank. Visit jdpower.com/awards. MEMBER FDIC 3
STBA Investment Thesis STBA Investment Thesis The Right Size • Above peer performance • Big enough to: • Demonstrated expense – Provide full complement of discipline and efficiency products and services • Organic growth – Access technology • Strategic and effective mergers – Access capital markets and expansion – Attract talent • Exposure to five regional – Expand - mergers and markets acquisitions/de novo • Small enough to: – Stay close to our customers – Understand our markets – Be responsive MEMBER FDIC 4
Strategic Goals Strategic Goals • Remain a high performing, independent, regional community bank • Follow a disciplined approach focused on organic growth • Continue to enhance our market-based growth platform focused on the unique opportunities in our 5 distinct markets • Continue to improve the effectiveness and efficiency of our lines of business • Build on the S&T brand strength, drive demand, and enhance our digital capabilities • Pursue and integrate M&A opportunities that align with our strategic objectives MEMBER FDIC 5
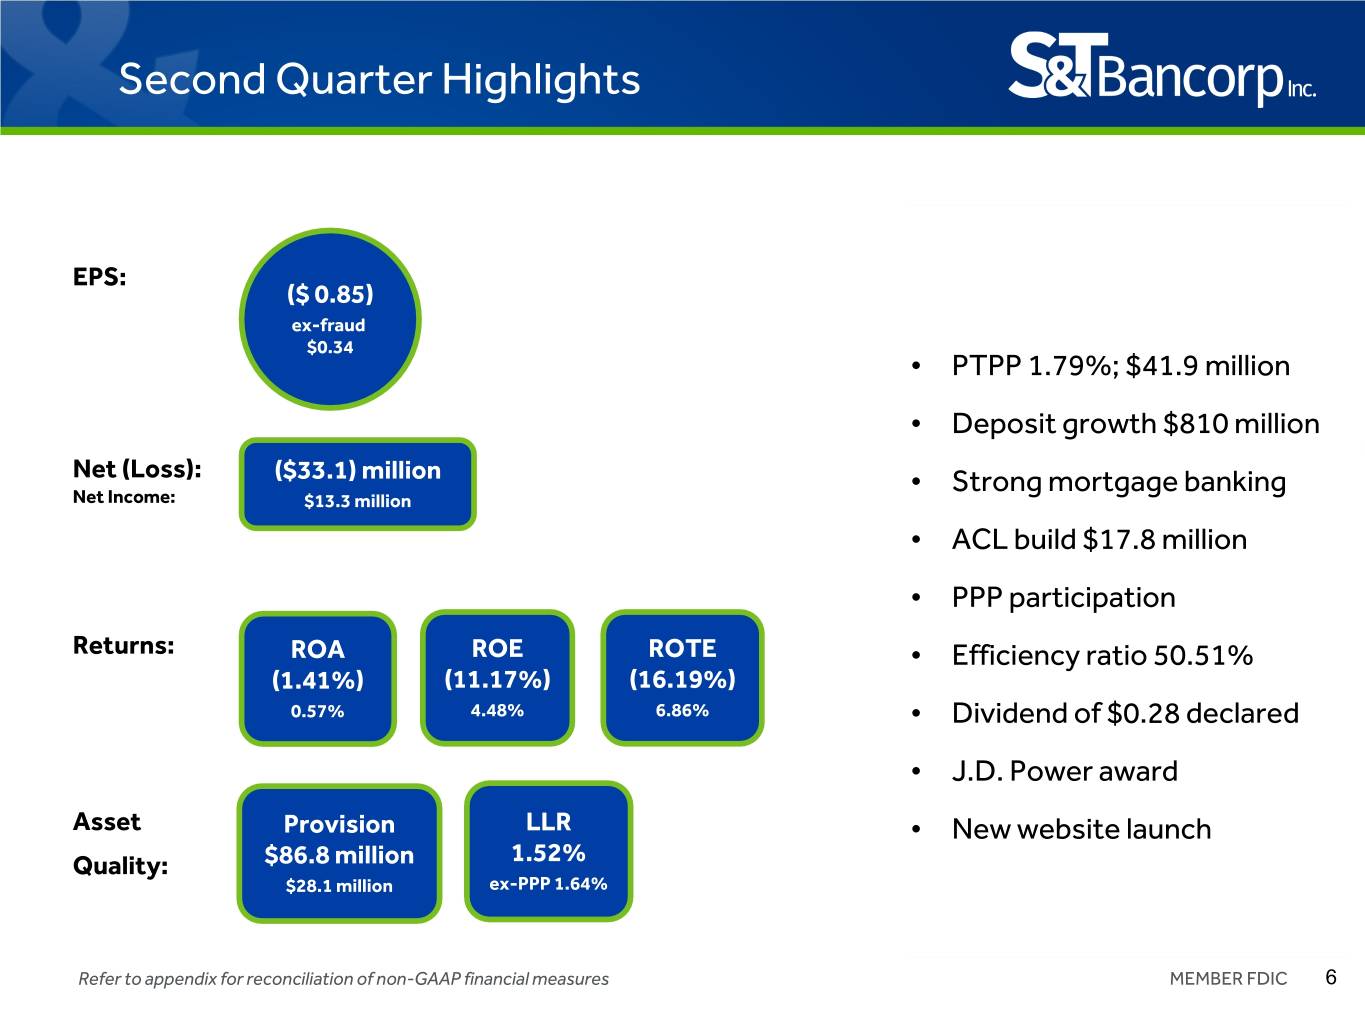
Second Quarter Highlights EPS: ($ 0.85) ex-fraud $0.34 • PTPP 1.79%; $41.9 million • Deposit growth $810 million Net (Loss): ($33.1) million • Strong mortgage banking Net Income: $13.3 million • ACL build $17.8 million • PPP participation Returns: ROA ROE ROTE • Efficiency ratio 50.51% (11.17%) (16.19%) (1.41%) 0.57% 4.48% 6.86% • Dividend of $0.28 declared • J.D. Power award Asset Provision LLR • New website launch $86.8 million 1.52% Quality: $28.1 million ex-PPP 1.64% Refer to appendix for reconciliation of non-GAAP financial measures MEMBER FDIC 6
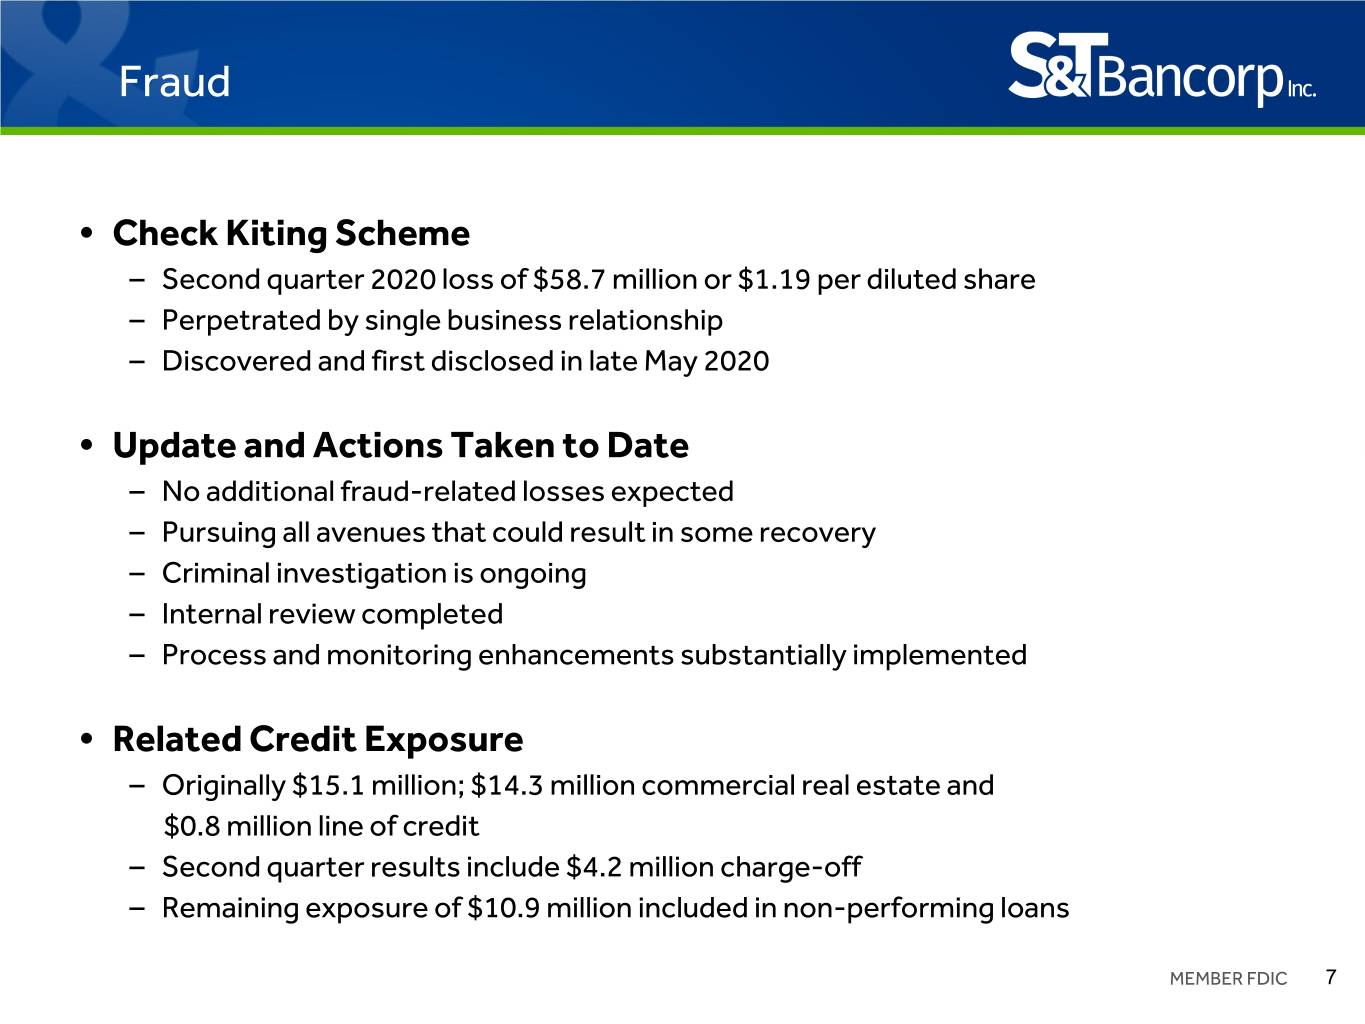
Fraud • Check Kiting Scheme – Second quarter 2020 loss of $58.7 million or $1.19 per diluted share – Perpetrated by single business relationship – Discovered and first disclosed in late May 2020 • Update and Actions Taken to Date – No additional fraud-related losses expected – Pursuing all avenues that could result in some recovery – Criminal investigation is ongoing – Internal review completed – Process and monitoring enhancements substantially implemented • Related Credit Exposure – Originally $15.1 million; $14.3 million commercial real estate and $0.8 million line of credit – Second quarter results include $4.2 million charge-off – Remaining exposure of $10.9 million included in non-performing loans MEMBER FDIC 7
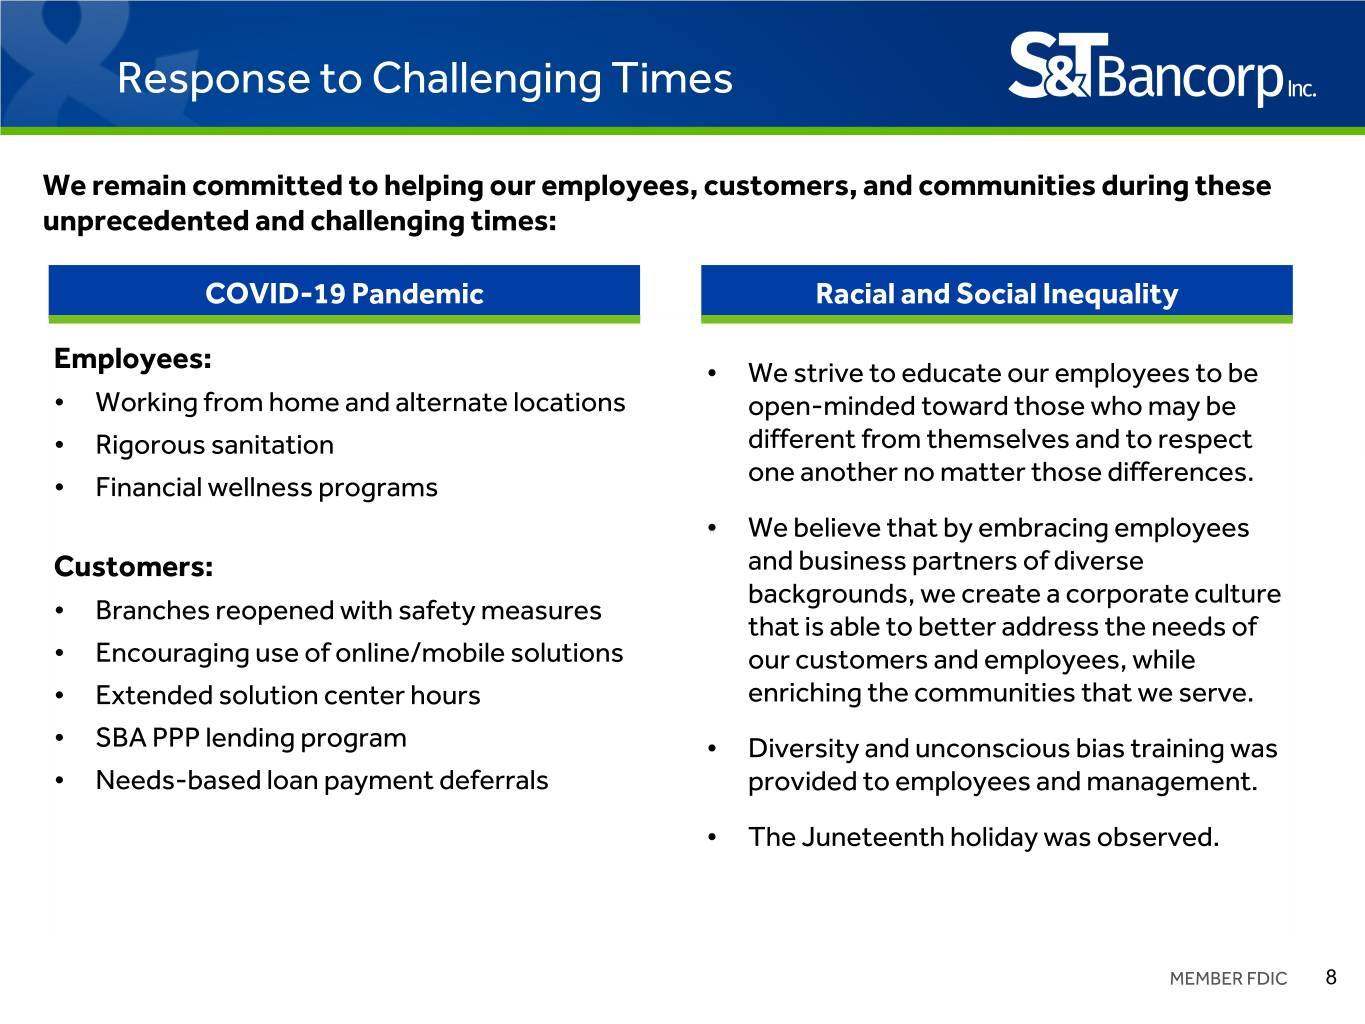
Response to Challenging Times We remain committed to helping our employees, customers, and communities during these unprecedented and challenging times: COVID-19 Pandemic Racial and Social Inequality Employees: • We strive to educate our employees to be • Working from home and alternate locations open-minded toward those who may be • Rigorous sanitation different from themselves and to respect one another no matter those differences. • Financial wellness programs • We believe that by embracing employees Customers: and business partners of diverse backgrounds, we create a corporate culture • Branches reopened with safety measures that is able to better address the needs of • Encouraging use of online/mobile solutions our customers and employees, while • Extended solution center hours enriching the communities that we serve. • SBA PPP lending program • Diversity and unconscious bias training was • Needs-based loan payment deferrals provided to employees and management. • The Juneteenth holiday was observed. MEMBER FDIC 8
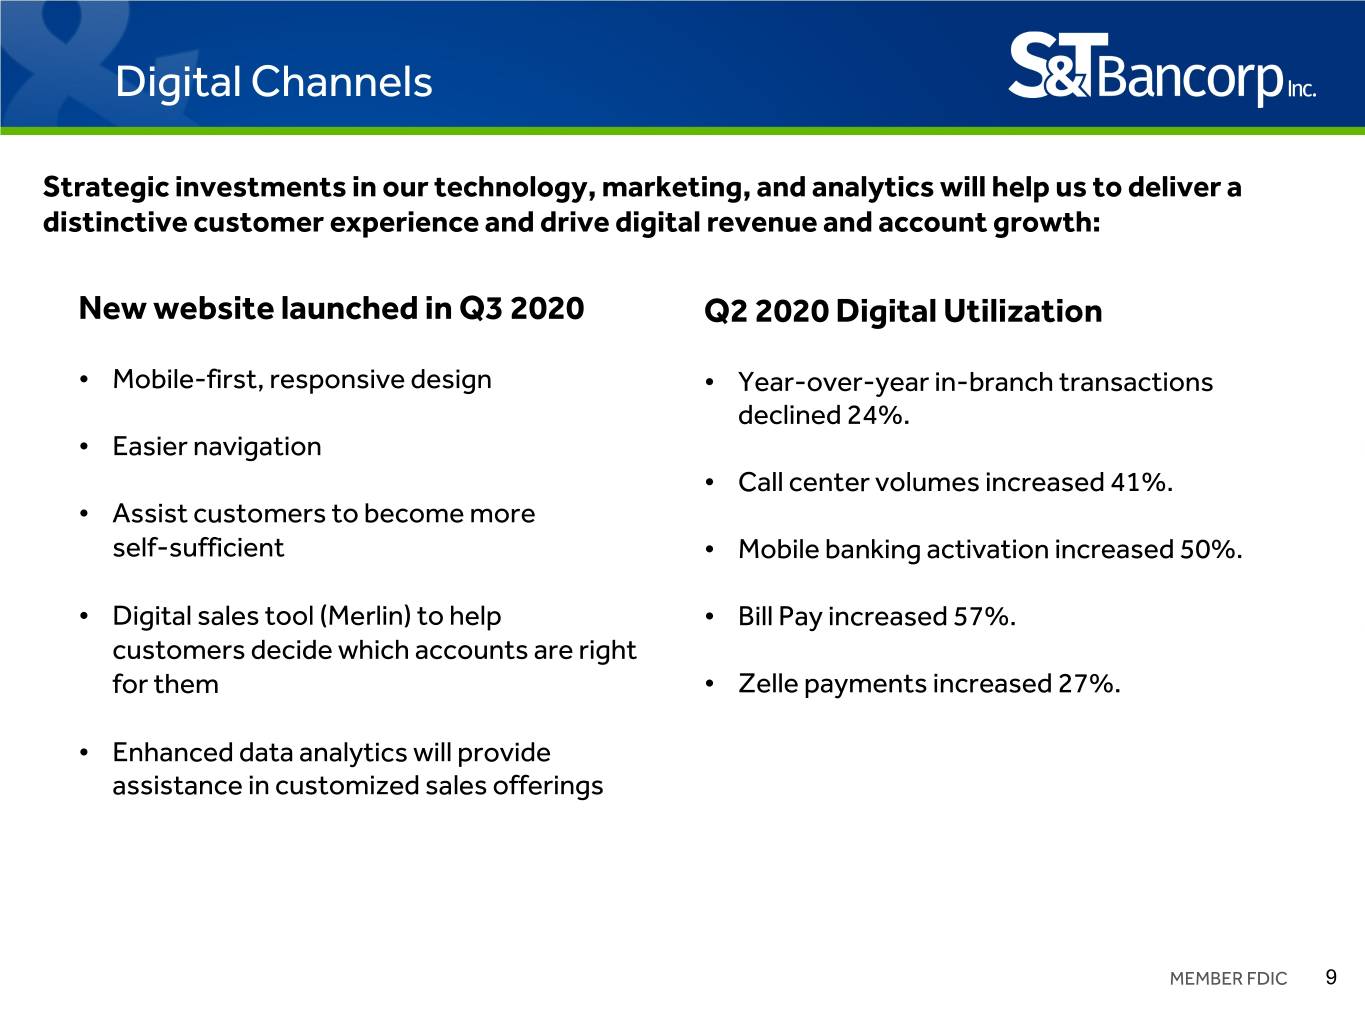
Digital Channels Strategic investments in our technology, marketing, and analytics will help us to deliver a distinctive customer experience and drive digital revenue and account growth: New website launched in Q3 2020 Q2 2020 Digital Utilization • Mobile-first, responsive design • Year-over-year in-branch transactions declined 24%. • Easier navigation • Call center volumes increased 41%. • Assist customers to become more self-sufficient • Mobile banking activation increased 50%. • Digital sales tool (Merlin) to help • Bill Pay increased 57%. customers decide which accounts are right for them • Zelle payments increased 27%. • Enhanced data analytics will provide assistance in customized sales offerings MEMBER FDIC 9

J.D. Power Award • S&T ranked highest in customer satisfaction with retail banking in the Mid-Atlantic by J.D. Power in the 2020 U.S. Retail Banking Satisfaction Study. • We ranked #1 in the following factors: – Communication and Advice – Convenience – Product and Fees – Channel Activities • For J.D. Power 2020 award information, visit jdpower.com/awards. MEMBER FDIC 10
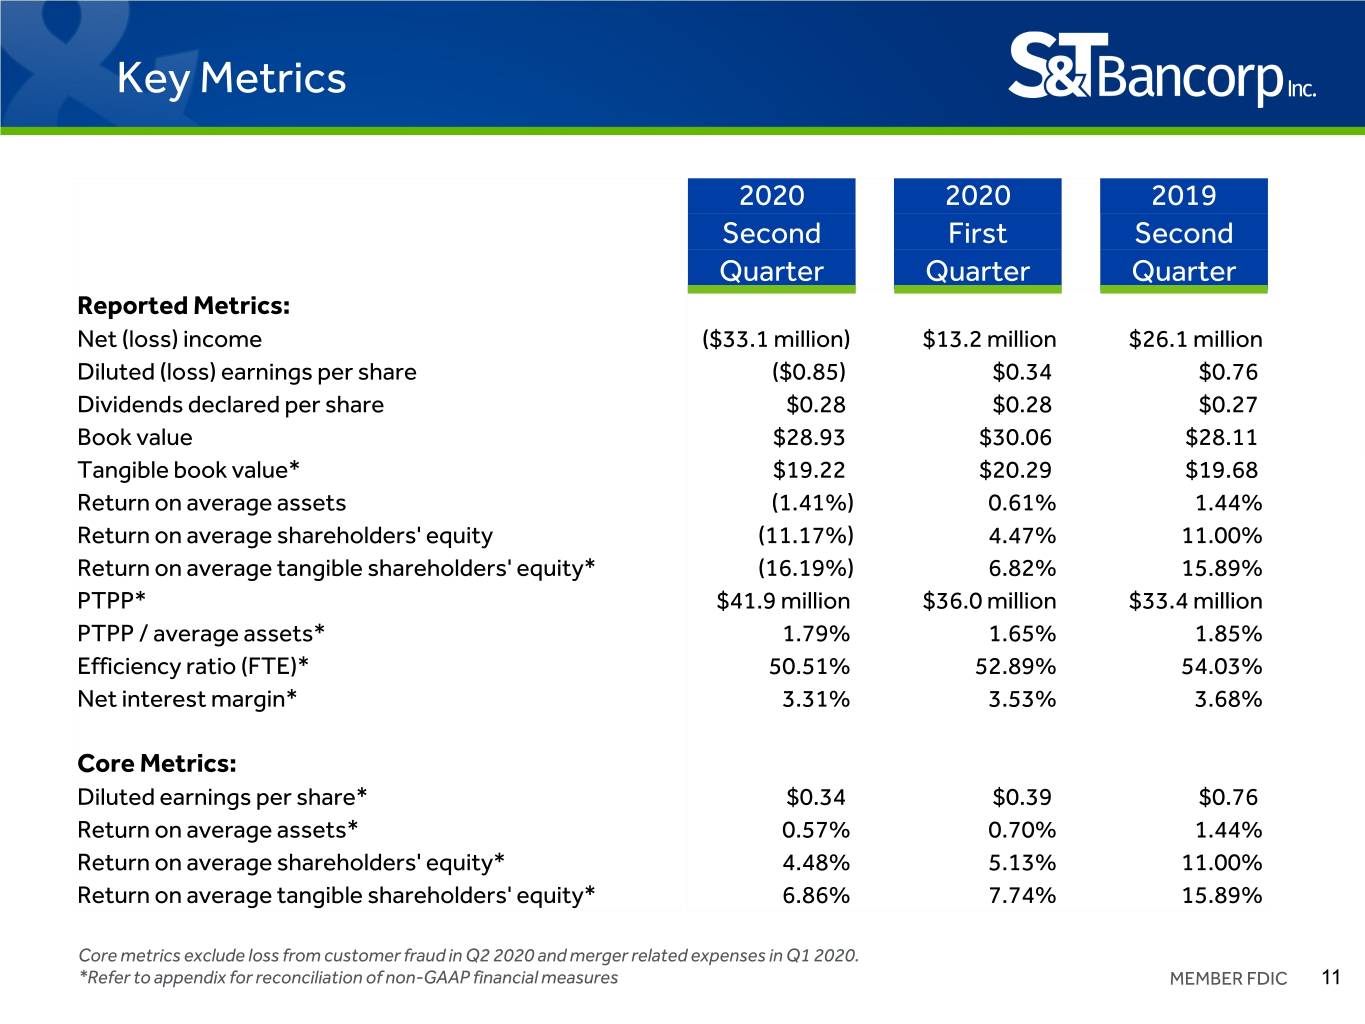
Key Metrics 2020 2020 2019 Second First Second Quarter Quarter Quarter Reported Metrics: Net (loss) income ($33.1 million) $13.2 million $26.1 million Diluted (loss) earnings per share ($0.85) $0.34 $0.76 Dividends declared per share $0.28 $0.28 $0.27 Book value $28.93 $30.06 $28.11 Tangible book value* $19.22 $20.29 $19.68 Return on average assets (1.41%) 0.61% 1.44% Return on average shareholders' equity (11.17%) 4.47% 11.00% Return on average tangible shareholders' equity* (16.19%) 6.82% 15.89% PTPP* $41.9 million $36.0 million $33.4 million PTPP / average assets* 1.79% 1.65% 1.85% Efficiency ratio (FTE)* 50.51% 52.89% 54.03% Net interest margin* 3.31% 3.53% 3.68% Core Metrics: Diluted earnings per share* $0.34 $0.39 $0.76 Return on average assets* 0.57% 0.70% 1.44% Return on average shareholders' equity* 4.48% 5.13% 11.00% Return on average tangible shareholders' equity* 6.86% 7.74% 15.89% Core metrics exclude loss from customer fraud in Q2 2020 and merger related expenses in Q1 2020. *Refer to appendix for reconciliation of non-GAAP financial measures MEMBER FDIC 11
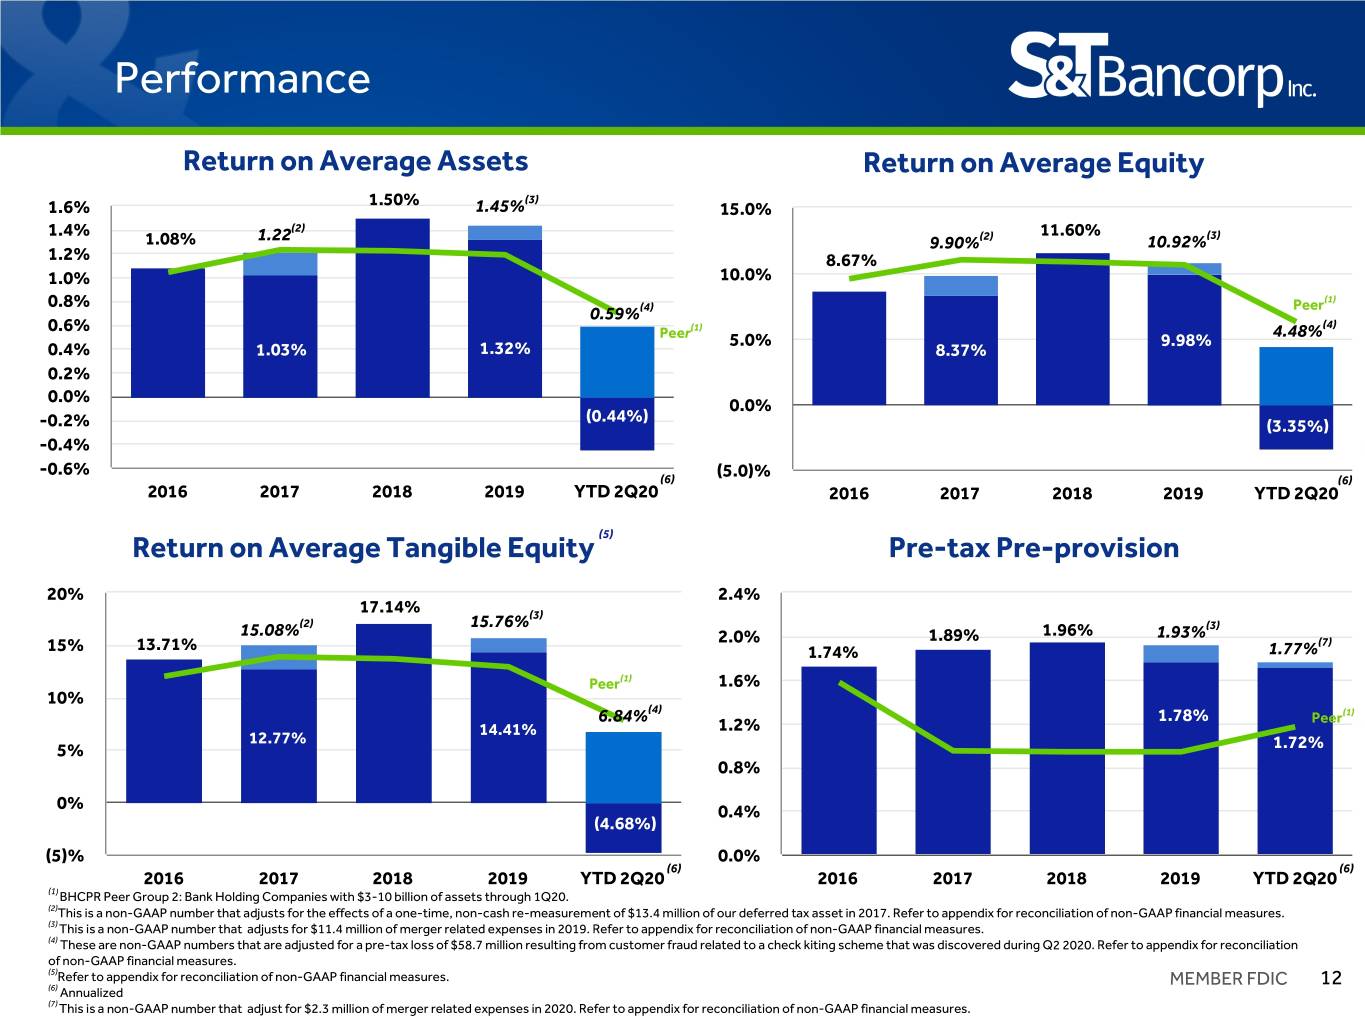
Performance Return on Average Assets Return on Average Equity 1.50% (3) 1.6% 1.45% 15.0% 1.4% (2) 11.60% 1.08% 1.22 9.90%(2) 10.92%(3) 1.2% 8.67% 1.0% 10.0% 0.8% (1) 0.59%(4) Peer 0.6% (1) 4.48%(4) Peer 5.0% 9.98% 0.4% 1.03% 1.32% 8.37% 0.2% 0.0% 0.0% (0.44%) -0.2% (3.35%) -0.4% -0.6% (6) (5.0)% (6) 2016 2017 2018 2019 YTD 2Q20 2016 2017 2018 2019 YTD 2Q20 Return on Average Tangible Equity (5) Pre-tax Pre-provision 20% 2.4% 17.14% (3) (2) 15.76% 15.08% 1.96% 1.93%(3) 2.0% 1.89% (7) 15% 13.71% 1.74% 1.77% Peer(1) 1.6% 10% (4) 6.84% 1.78% Peer(1) 14.41% 1.2% 12.77% 1.72% 5% 0.8% 0% 0.4% (4.68%) (5)% 0.0% (6) (6) 2016 2017 2018 2019 YTD 2Q20 2016 2017 2018 2019 YTD 2Q20 (1) BHCPR Peer Group 2: Bank Holding Companies with $3-10 billion of assets through 1Q20. (2)This is a non-GAAP number that adjusts for the effects of a one-time, non-cash re-measurement of $13.4 million of our deferred tax asset in 2017. Refer to appendix for reconciliation of non-GAAP financial measures. (3) This is a non-GAAP number that adjusts for $11.4 million of merger related expenses in 2019. Refer to appendix for reconciliation of non-GAAP financial measures. (4) These are non-GAAP numbers that are adjusted for a pre-tax loss of $58.7 million resulting from customer fraud related to a check kiting scheme that was discovered during Q2 2020. Refer to appendix for reconciliation of non-GAAP financial measures. (5)Refer to appendix for reconciliation of non-GAAP financial measures. MEMBER FDIC 12 (6) Annualized (7) This is a non-GAAP number that adjust for $2.3 million of merger related expenses in 2020. Refer to appendix for reconciliation of non-GAAP financial measures.
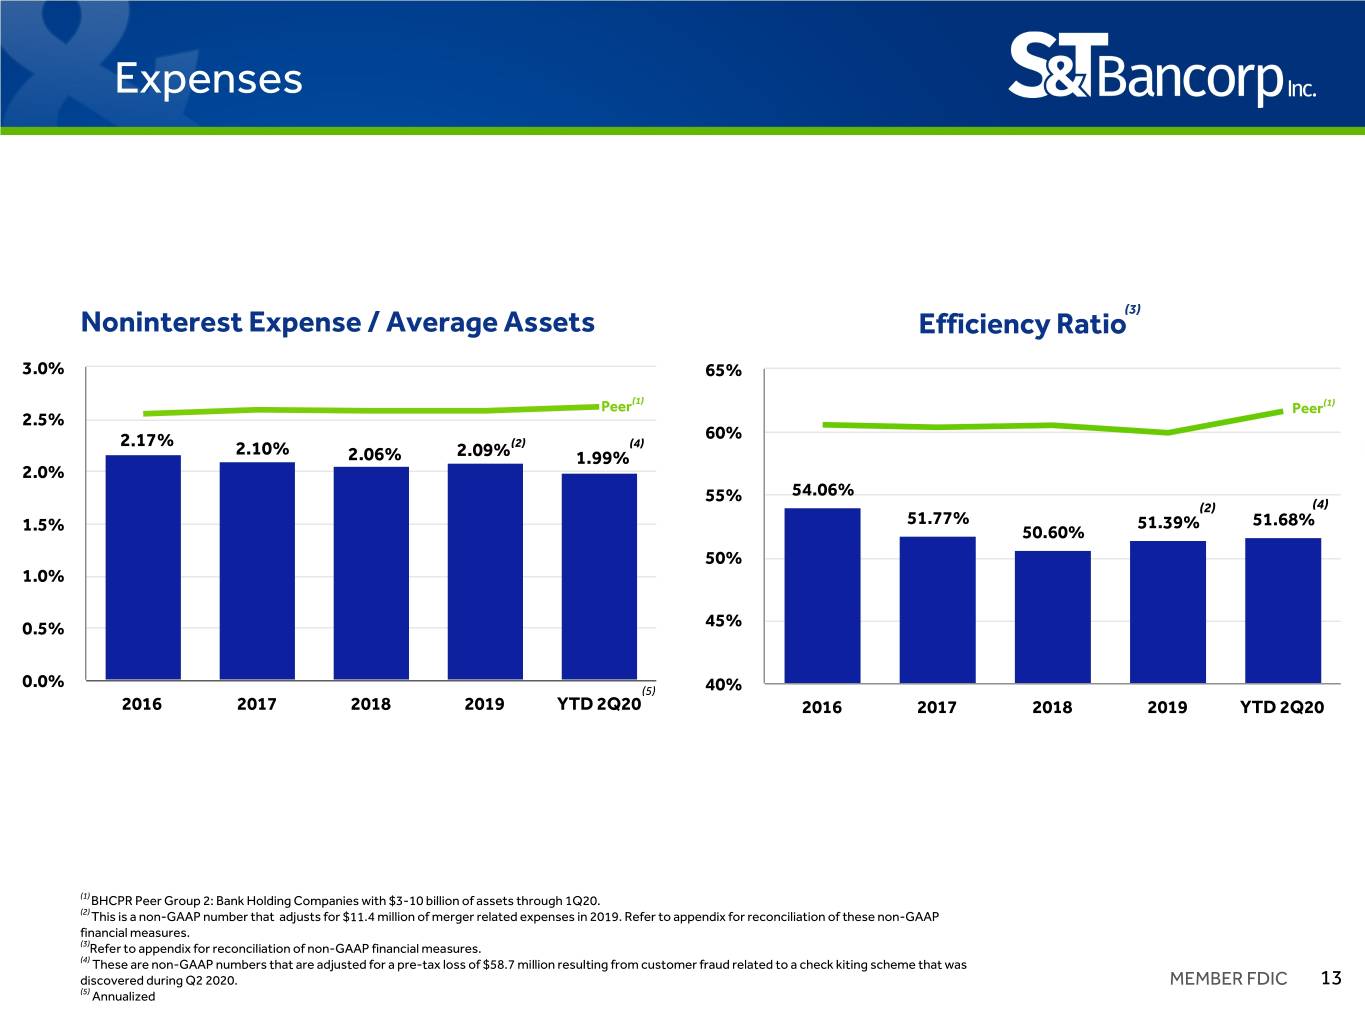
Expenses (3) Noninterest Expense / Average Assets Efficiency Ratio 3.0% 65% (1) Peer Peer(1) 2.5% 60% 2.17% (2) (4) 2.10% 2.06% 2.09% 1.99% 2.0% 55% 54.06% (2) (4) 51.77% 51.39% 51.68% 1.5% 50.60% 50% 1.0% 0.5% 45% 0.0% (5) 40% 2016 2017 2018 2019 YTD 2Q20 2016 2017 2018 2019 YTD 2Q20 (1) BHCPR Peer Group 2: Bank Holding Companies with $3-10 billion of assets through 1Q20. (2) This is a non-GAAP number that adjusts for $11.4 million of merger related expenses in 2019. Refer to appendix for reconciliation of these non-GAAP financial measures. (3)Refer to appendix for reconciliation of non-GAAP financial measures. (4) These are non-GAAP numbers that are adjusted for a pre-tax loss of $58.7 million resulting from customer fraud related to a check kiting scheme that was discovered during Q2 2020. MEMBER FDIC 13 (5) Annualized
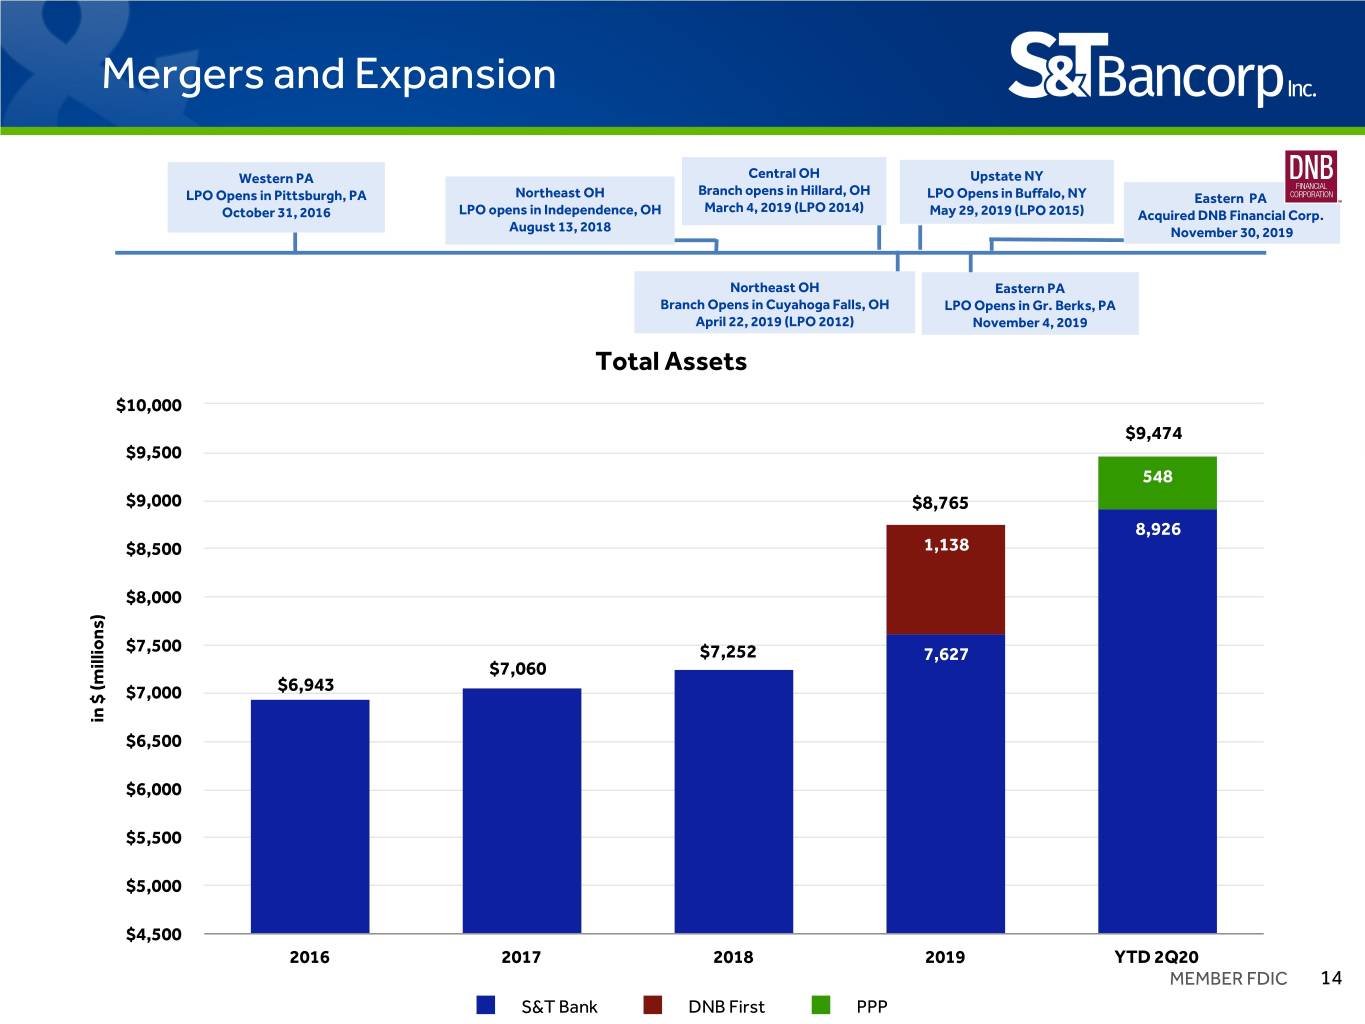
Mergers and Expansion Western PA Central OH Upstate NY Branch opens in Hillard, OH LPO Opens in Pittsburgh, PA Northeast OH LPO Opens in Buffalo, NY Eastern PA March 4, 2019 (LPO 2014) October 31, 2016 LPO opens in Independence, OH May 29, 2019 (LPO 2015) Acquired DNB Financial Corp. August 13, 2018 November 30, 2019 Northeast OH Eastern PA Branch Opens in Cuyahoga Falls, OH LPO Opens in Gr. Berks, PA April 22, 2019 (LPO 2012) November 4, 2019 Total Assets $10,000 $9,474 $9,500 548 $9,000 $8,765 8,926 $8,500 1,138 $8,000 $7,500 $7,252 7,627 $7,060 $7,000 $6,943 in $ (millions) $6,500 $6,000 $5,500 $5,000 $4,500 2016 2017 2018 2019 YTD 2Q20 MEMBER FDIC 14 S&T Bank DNB First PPP
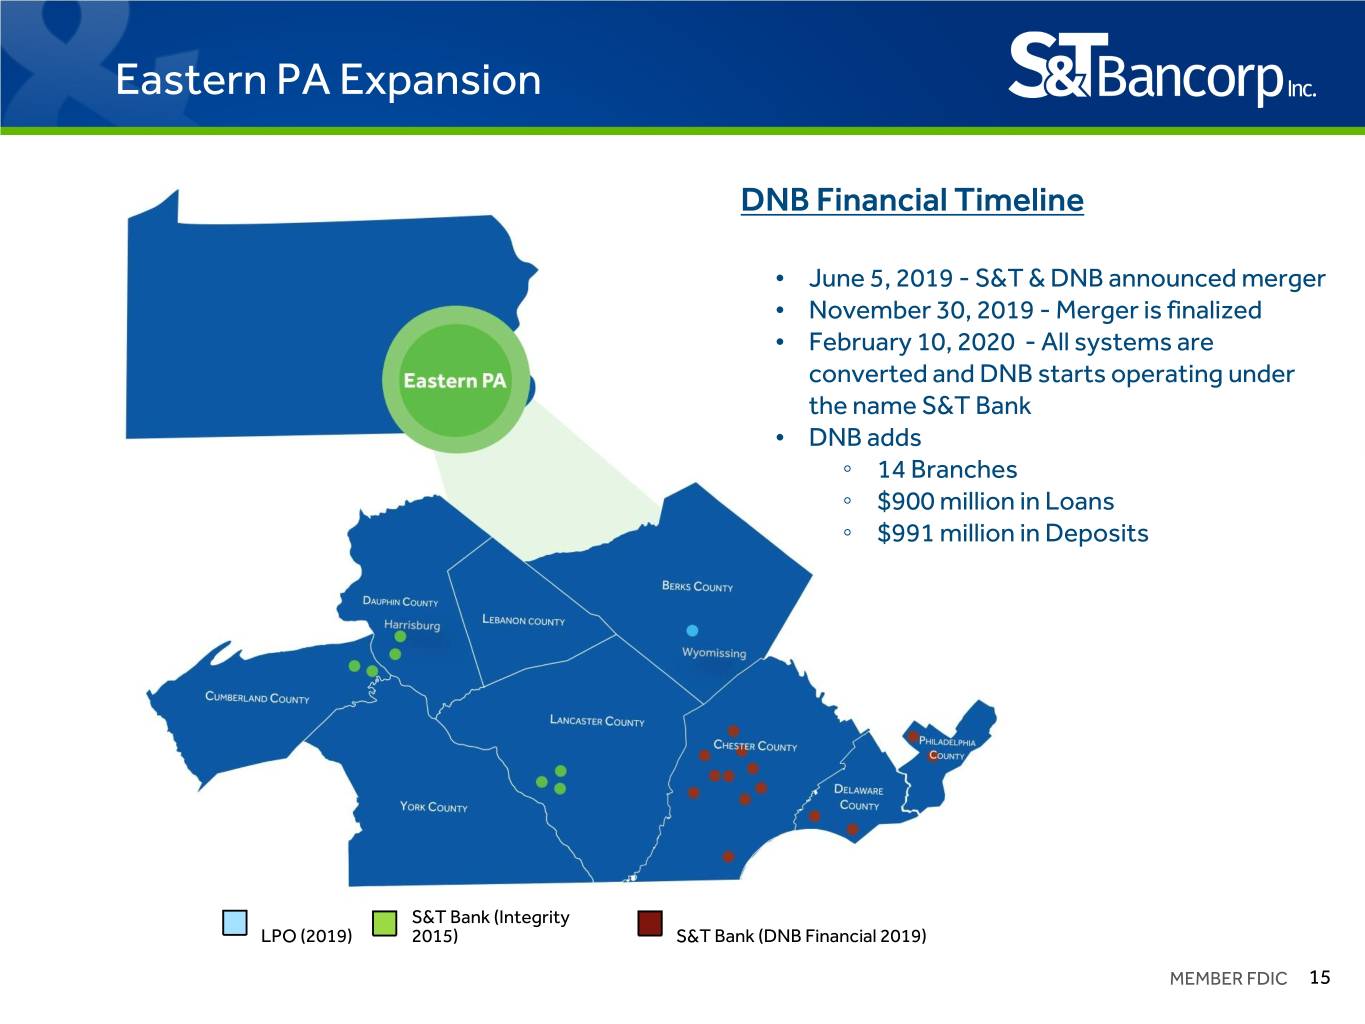
Eastern PA Expansion DNB Financial Timeline • June 5, 2019 - S&T & DNB announced merger • November 30, 2019 - Merger is finalized • February 10, 2020 - All systems are converted and DNB starts operating under the name S&T Bank • DNB adds ◦ 14 Branches ◦ $900 million in Loans ◦ $991 million in Deposits S&T Bank (Integrity LPO (2019) 2015) S&T Bank (DNB Financial 2019) MEMBER FDIC 15
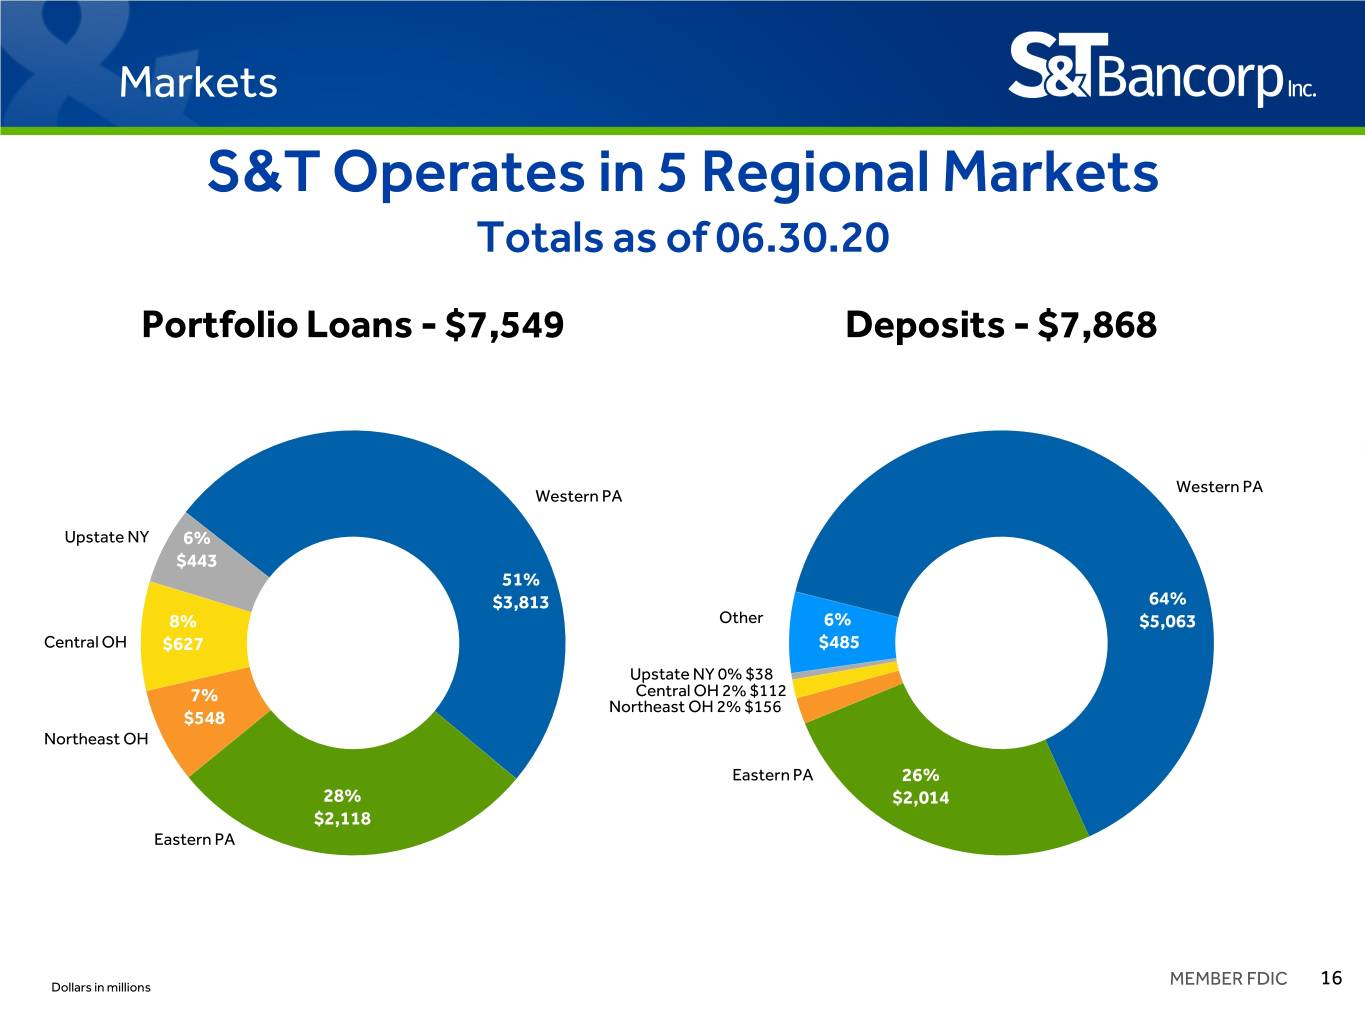
Markets S&T Operates in 5 Regional Markets Totals as of 06.30.20 Portfolio Loans - $7,549 Deposits - $7,868 Western PA Western PA Upstate NY 6% $443 51% $3,813 64% 8% Other 6% $5,063 Central OH $627 $485 Upstate NY 0% $38 7% Central OH 2% $112 Northeast OH 2% $156 $548 Northeast OH Eastern PA 26% 28% $2,014 $2,118 Eastern PA Dollars in millions MEMBER FDIC 16
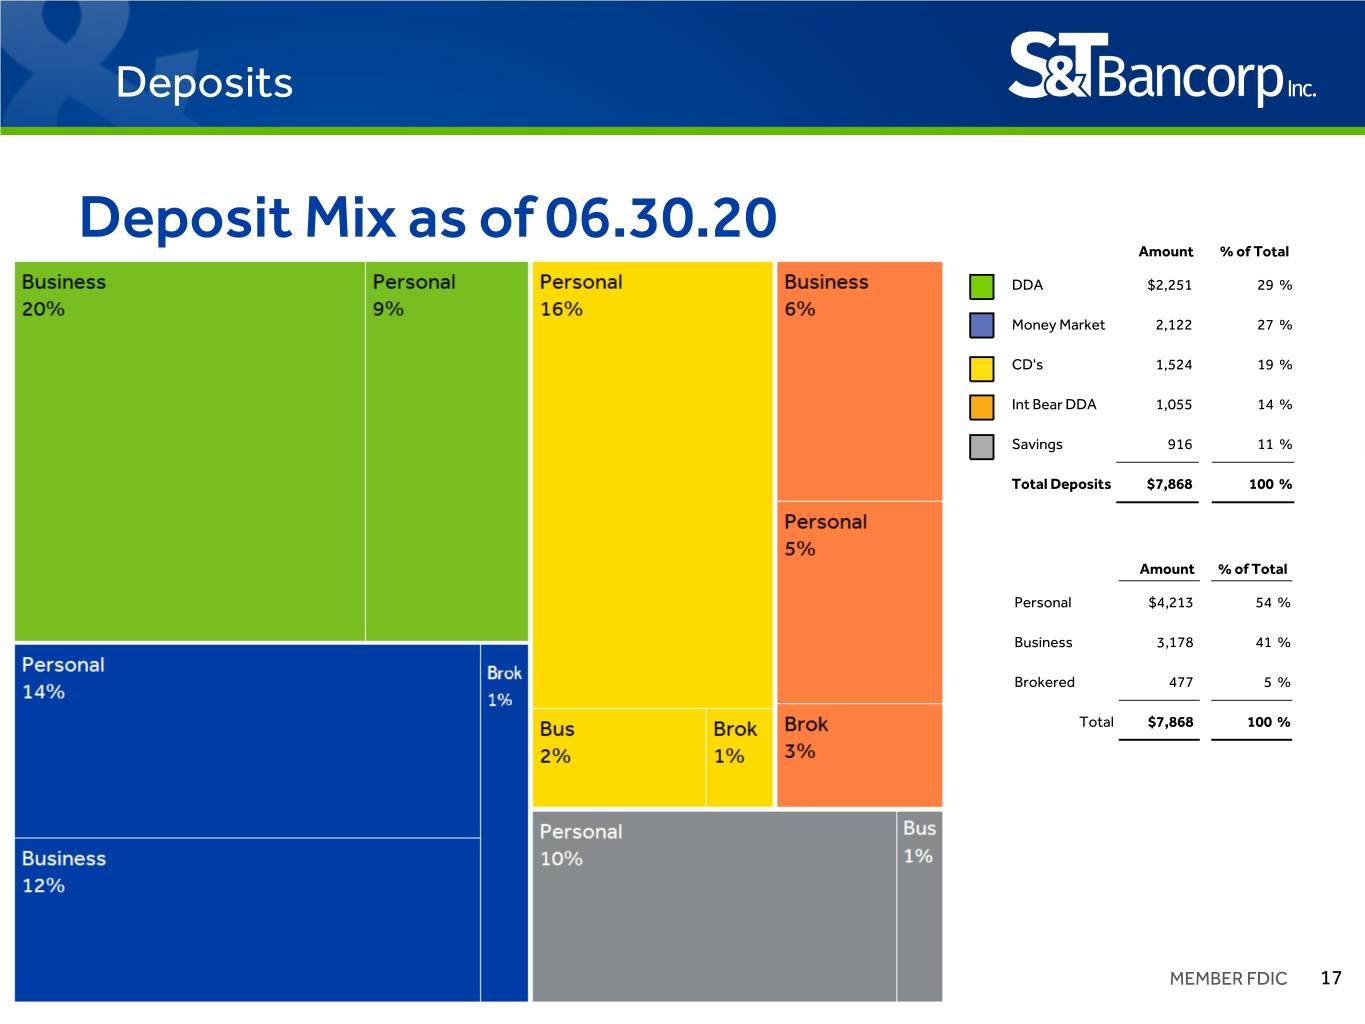
Deposits Deposit Mix as of 06.30.20 Amount % of Total DDA $2,251 29 % Money Market 2,122 27 % CD's 1,524 19 % Int Bear DDA 1,055 14 % Savings 916 11 % Total Deposits $7,868 100 % Amount % of Total Personal $4,213 54 % Business 3,178 41 % Brokered 477 5 % Total $7,868 100 % MEMBER FDIC 17 Dollars in millions
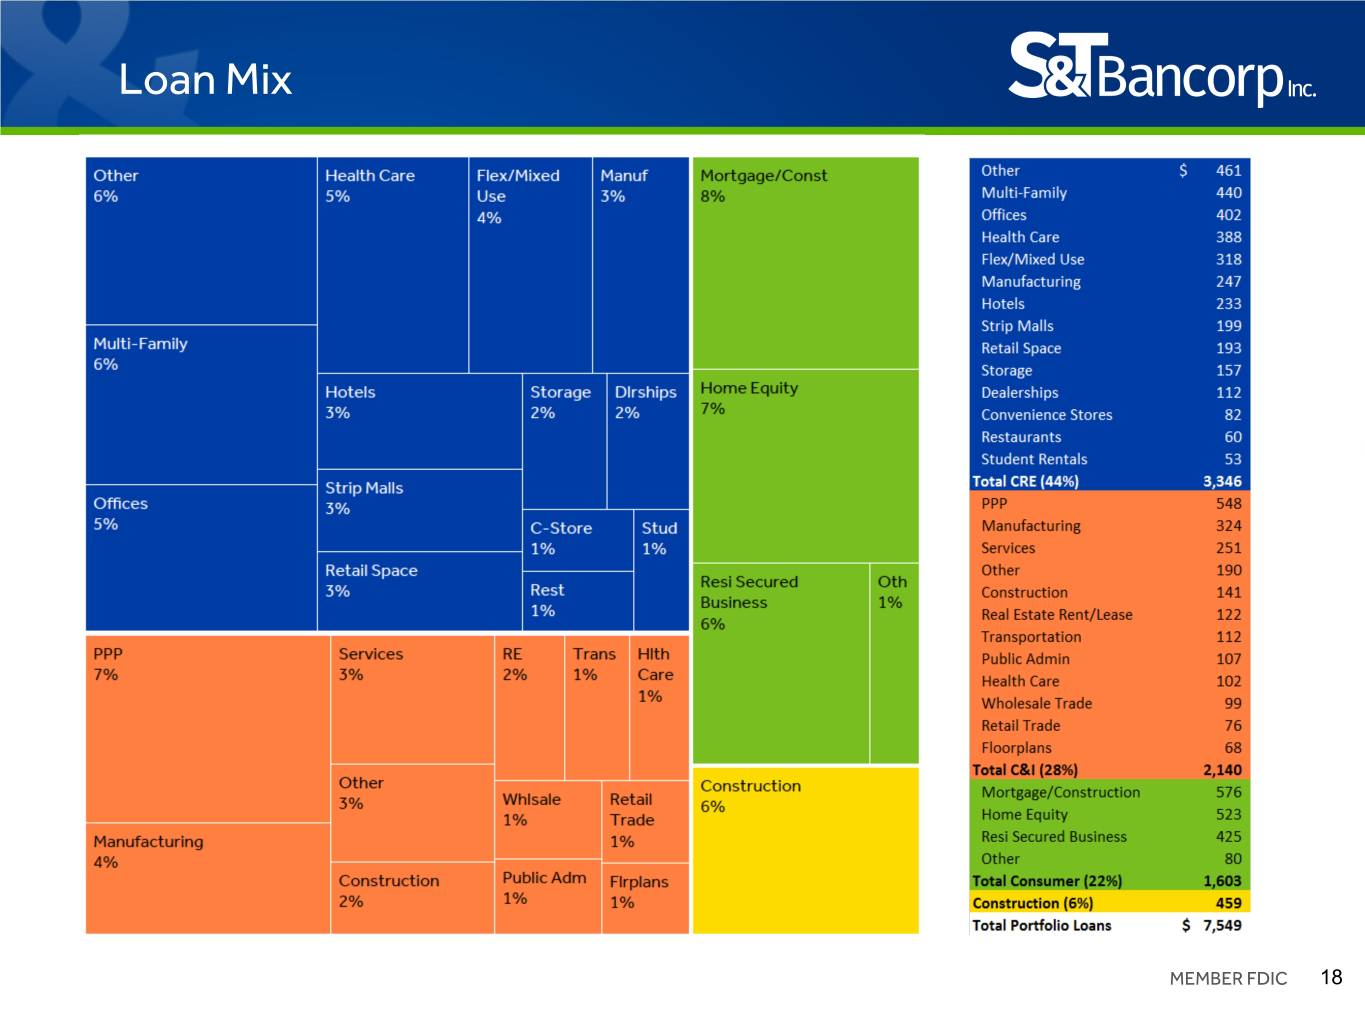
Loan Mix MEMBER FDIC 18
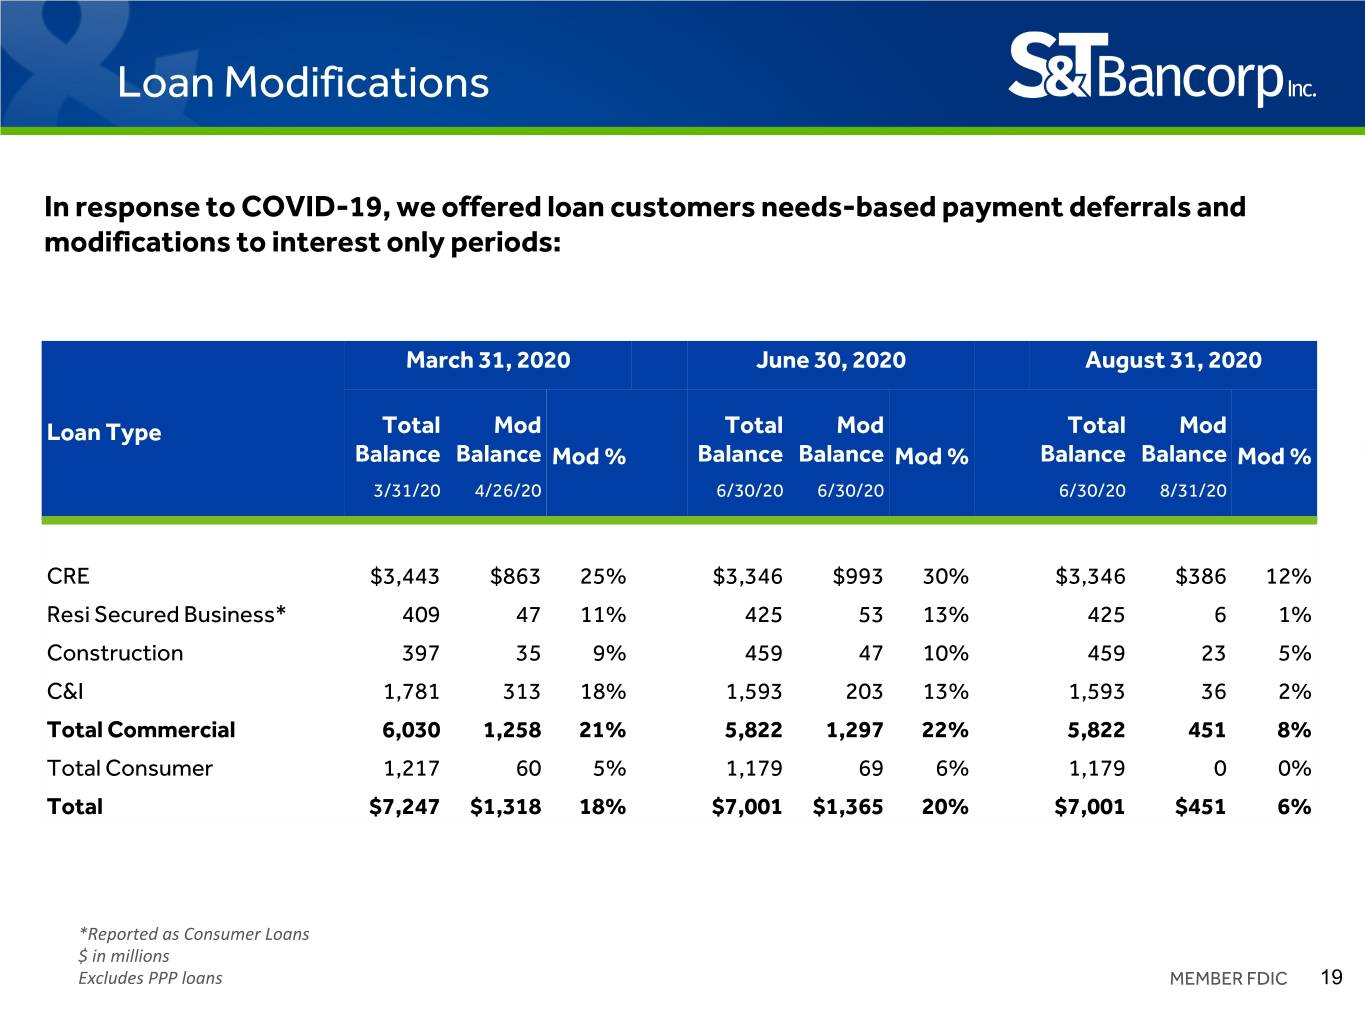
Loan Modifications In response to COVID-19, we offered loan customers needs-based payment deferrals and modifications to interest only periods: March 31, 2020 June 30, 2020 August 31, 2020 Loan Type Total Mod Total Mod Total Mod Balance Balance Mod % Balance Balance Mod % Balance Balance Mod % 3/31/20 4/26/20 6/30/20 6/30/20 6/30/20 8/31/20 CRE $3,443 $863 25% $3,346 $993 30% $3,346 $386 12% Resi Secured Business* 409 47 11% 425 53 13% 425 6 1% Construction 397 35 9% 459 47 10% 459 23 5% C&I 1,781 313 18% 1,593 203 13% 1,593 36 2% Total Commercial 6,030 1,258 21% 5,822 1,297 22% 5,822 451 8% Total Consumer 1,217 60 5% 1,179 69 6% 1,179 0 0% Total $7,247 $1,318 18% $7,001 $1,365 20% $7,001 $451 6% *Reported as Consumer Loans $ in millions Excludes PPP loans MEMBER FDIC 19
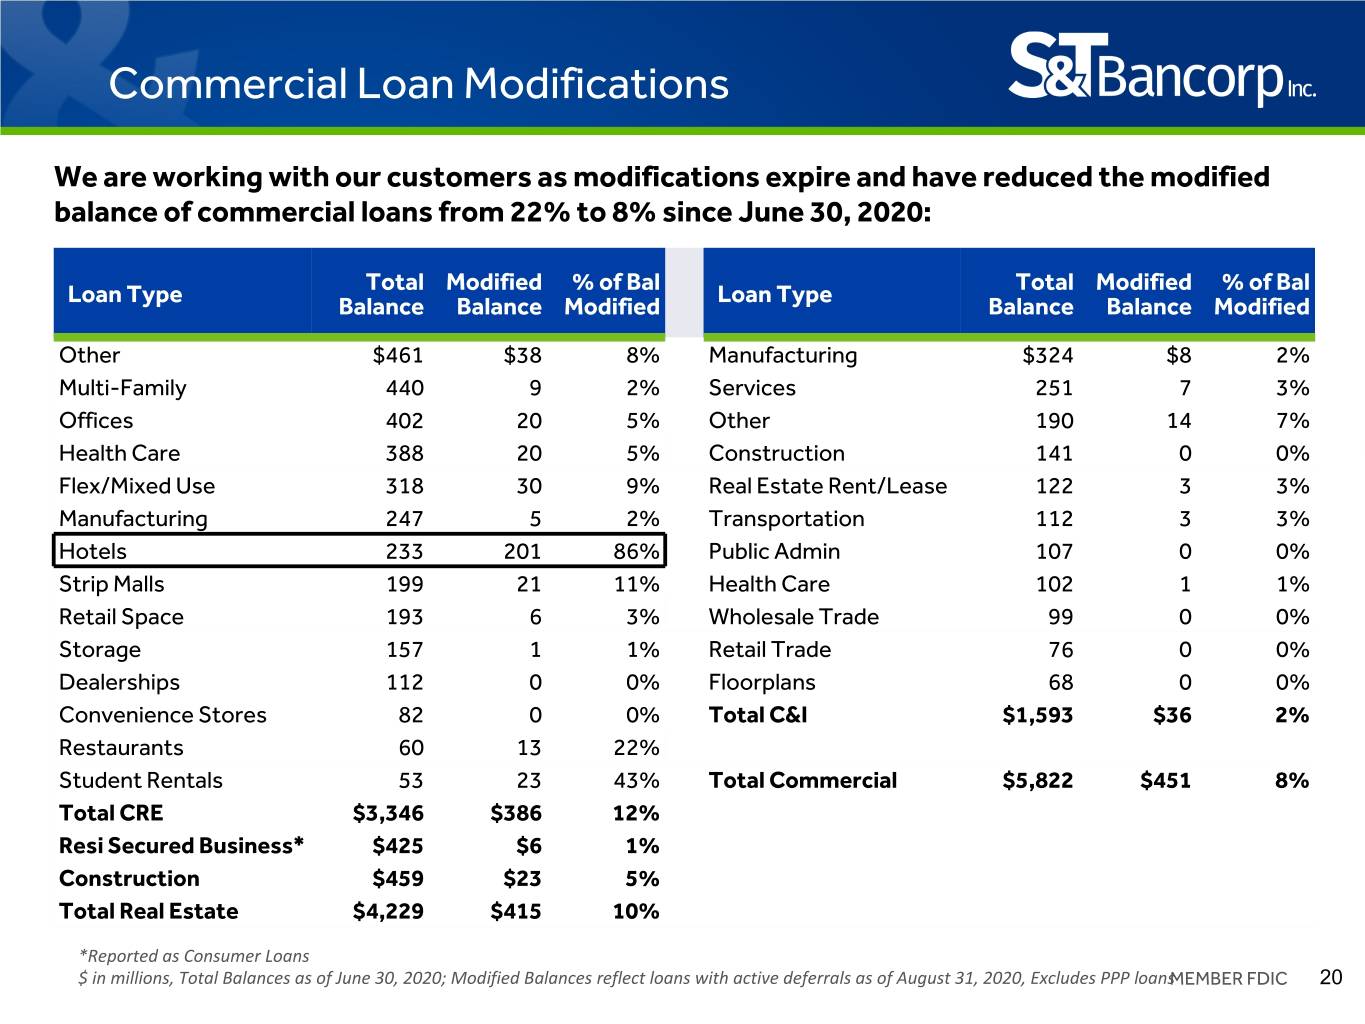
Commercial Loan Modifications We are working with our customers as modifications expire and have reduced the modified balance of commercial loans from 22% to 8% since June 30, 2020: Total Modified % of Bal Total Modified % of Bal Loan Type Balance Balance Modified Loan Type Balance Balance Modified Other $461 $38 8% Manufacturing $324 $8 2% Multi-Family 440 9 2% Services 251 7 3% Offices 402 20 5% Other 190 14 7% Health Care 388 20 5% Construction 141 0 0% Flex/Mixed Use 318 30 9% Real Estate Rent/Lease 122 3 3% Manufacturing 247 5 2% Transportation 112 3 3% Hotels 233 201 86% Public Admin 107 0 0% Strip Malls 199 21 11% Health Care 102 1 1% Retail Space 193 6 3% Wholesale Trade 99 0 0% Storage 157 1 1% Retail Trade 76 0 0% Dealerships 112 0 0% Floorplans 68 0 0% Convenience Stores 82 0 0% Total C&I $1,593 $36 2% Restaurants 60 13 22% Student Rentals 53 23 43% Total Commercial $5,822 $451 8% Total CRE $3,346 $386 12% Resi Secured Business* $425 $6 1% Construction $459 $23 5% Total Real Estate $4,229 $415 10% *Reported as Consumer Loans $ in millions, Total Balances as of June 30, 2020; Modified Balances reflect loans with active deferrals as of August 31, 2020, Excludes PPP loansMEMBER FDIC 20
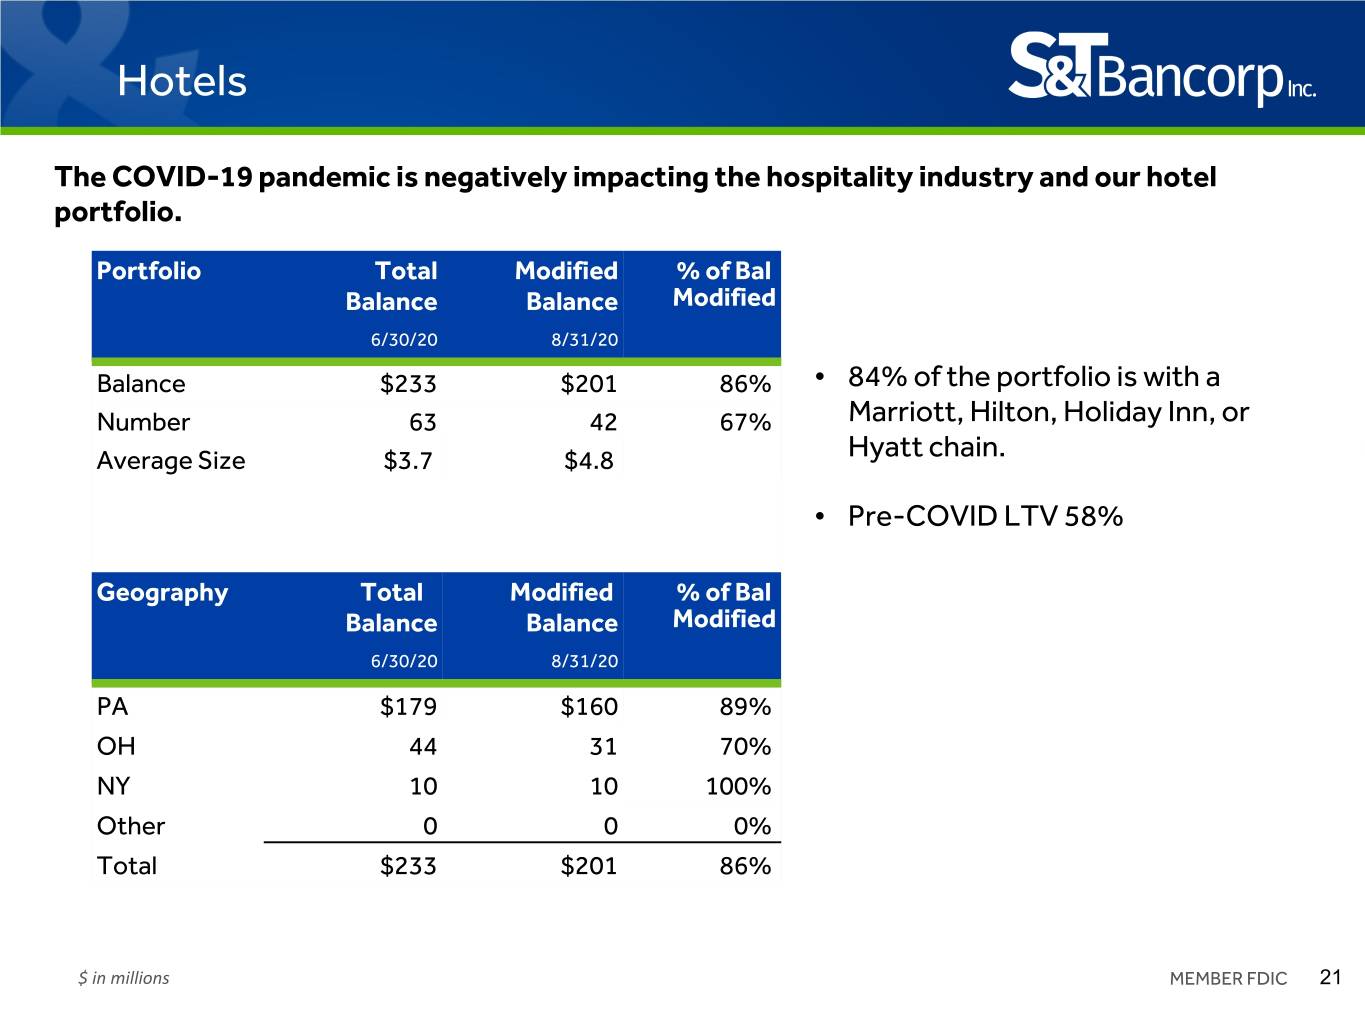
Hotels The COVID-19 pandemic is negatively impacting the hospitality industry and our hotel portfolio. Portfolio Total Modified % of Bal Balance Balance Modified 6/30/20 8/31/20 Balance $233 $201 86% • 84% of the portfolio is with a Number 63 42 67% Marriott, Hilton, Holiday Inn, or Average Size $3.7 $4.8 Hyatt chain. • Pre-COVID LTV 58% Geography Total Modified % of Bal Balance Balance Modified 6/30/20 8/31/20 PA $179 $160 89% OH 44 31 70% NY 10 10 100% Other 0 0 0% Total $233 $201 86% $ in millions MEMBER FDIC 21
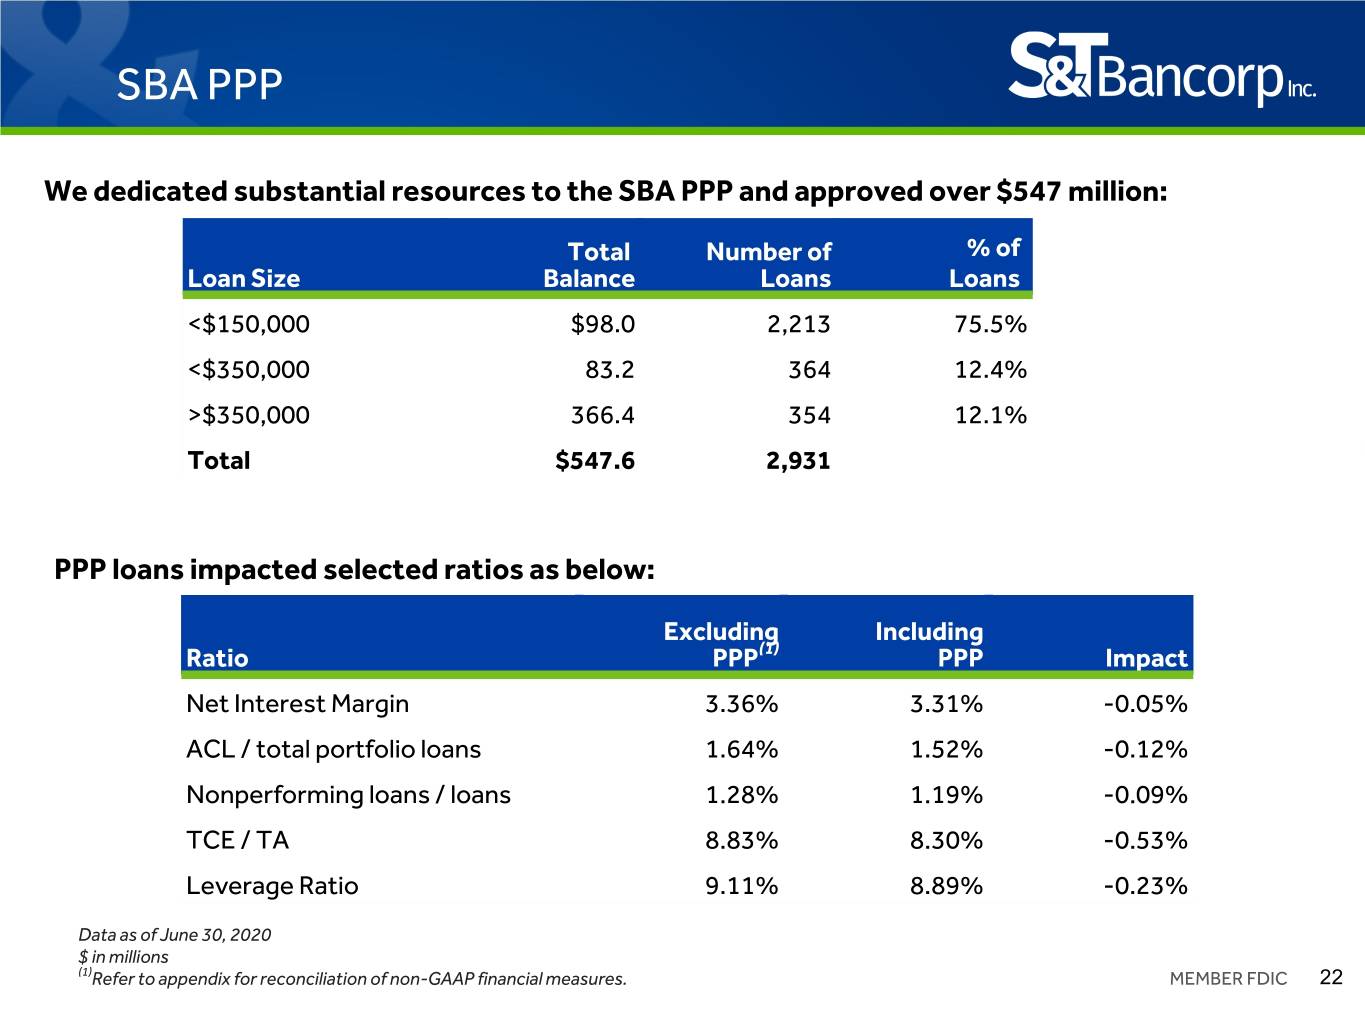
SBA PPP We dedicated substantial resources to the SBA PPP and approved over $547 million: Total Number of % of. Loan Size Balance Loans Loans. <$150,000 $98.0 2,213 75.5% <$350,000 83.2 364 12.4% >$350,000 366.4 354 12.1% Total $547.6 2,931 PPP loans impacted selected ratios as below: Excluding Including Ratio PPP(1) PPP Impact Net Interest Margin 3.36% 3.31% -0.05% ACL / total portfolio loans 1.64% 1.52% -0.12% Nonperforming loans / loans 1.28% 1.19% -0.09% TCE / TA 8.83% 8.30% -0.53% Leverage Ratio 9.11% 8.89% -0.23% Data as of June 30, 2020 $ in millions (1)Refer to appendix for reconciliation of non-GAAP financial measures. MEMBER FDIC 22
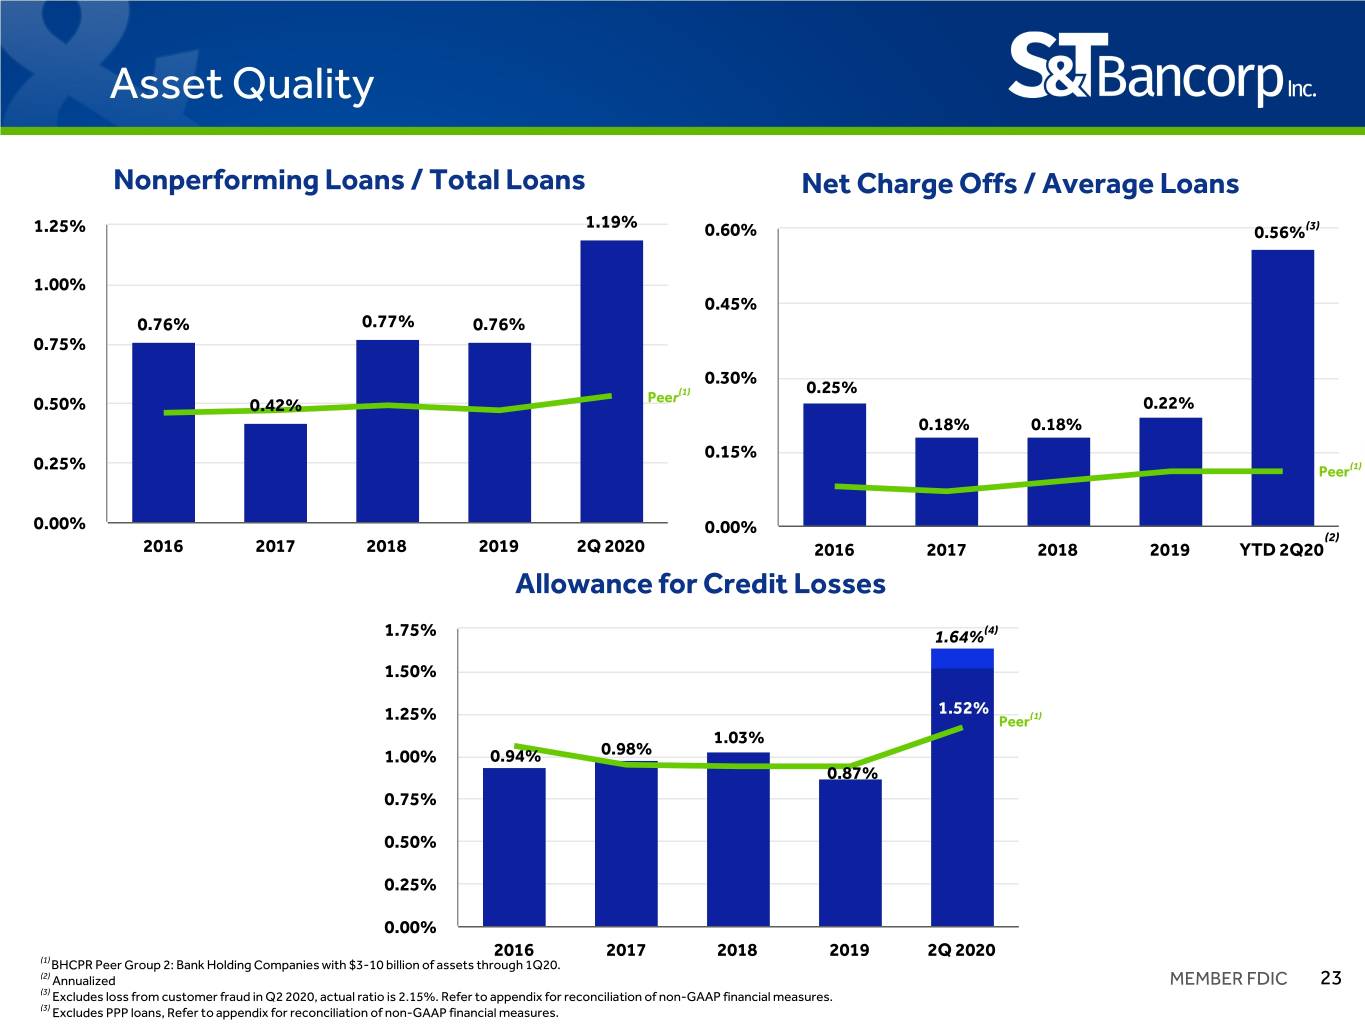
Asset Quality Nonperforming Loans / Total Loans Net Charge Offs / Average Loans 1.19% 1.25% 0.60% 0.56%(3) 1.00% 0.45% 0.76% 0.77% 0.76% 0.75% 0.30% (1) 0.25% 0.50% 0.42% Peer 0.22% 0.18% 0.18% 0.15% 0.25% Peer(1) 0.00% 0.00% (2) 2016 2017 2018 2019 2Q 2020 2016 2017 2018 2019 YTD 2Q20 Allowance for Credit Losses 1.75% 1.64%(4) 1.50% 1.52% 1.25% Peer(1) 1.03% 1.00% 0.94% 0.98% 0.87% 0.75% 0.50% 0.25% 0.00% 2016 2017 2018 2019 2Q 2020 (1) BHCPR Peer Group 2: Bank Holding Companies with $3-10 billion of assets through 1Q20. (2) Annualized MEMBER FDIC 23 (3) Excludes loss from customer fraud in Q2 2020, actual ratio is 2.15%. Refer to appendix for reconciliation of non-GAAP financial measures. (3) Excludes PPP loans, Refer to appendix for reconciliation of non-GAAP financial measures.
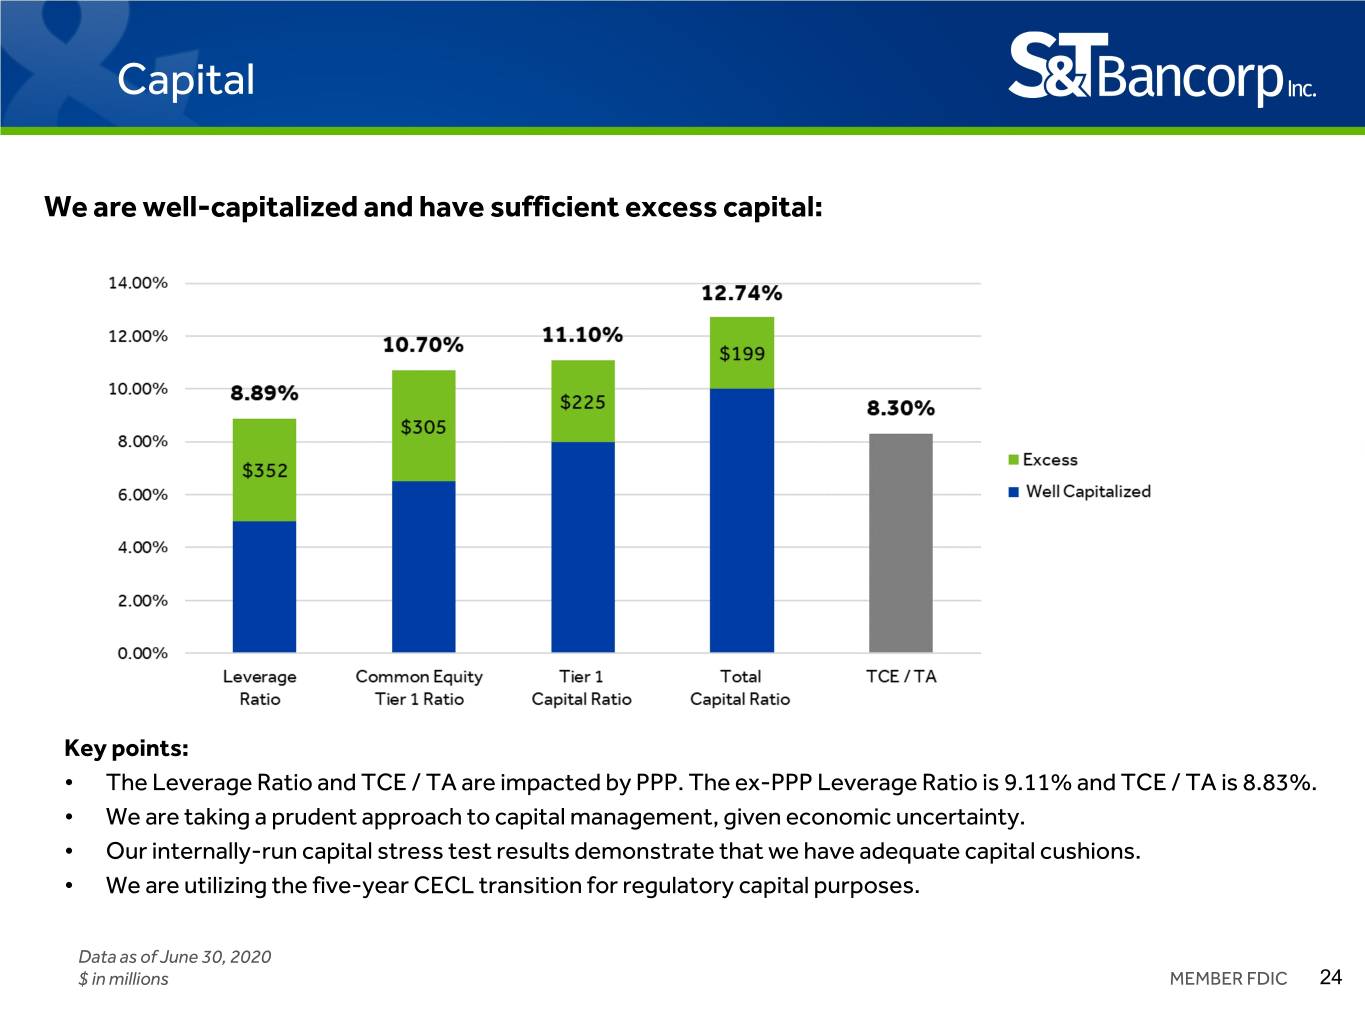
Capital We are well-capitalized and have sufficient excess capital: Key points: • The Leverage Ratio and TCE / TA are impacted by PPP. The ex-PPP Leverage Ratio is 9.11% and TCE / TA is 8.83%. • We are taking a prudent approach to capital management, given economic uncertainty. • Our internally-run capital stress test results demonstrate that we have adequate capital cushions. • We are utilizing the five-year CECL transition for regulatory capital purposes. Data as of June 30, 2020 $ in millions MEMBER FDIC 24
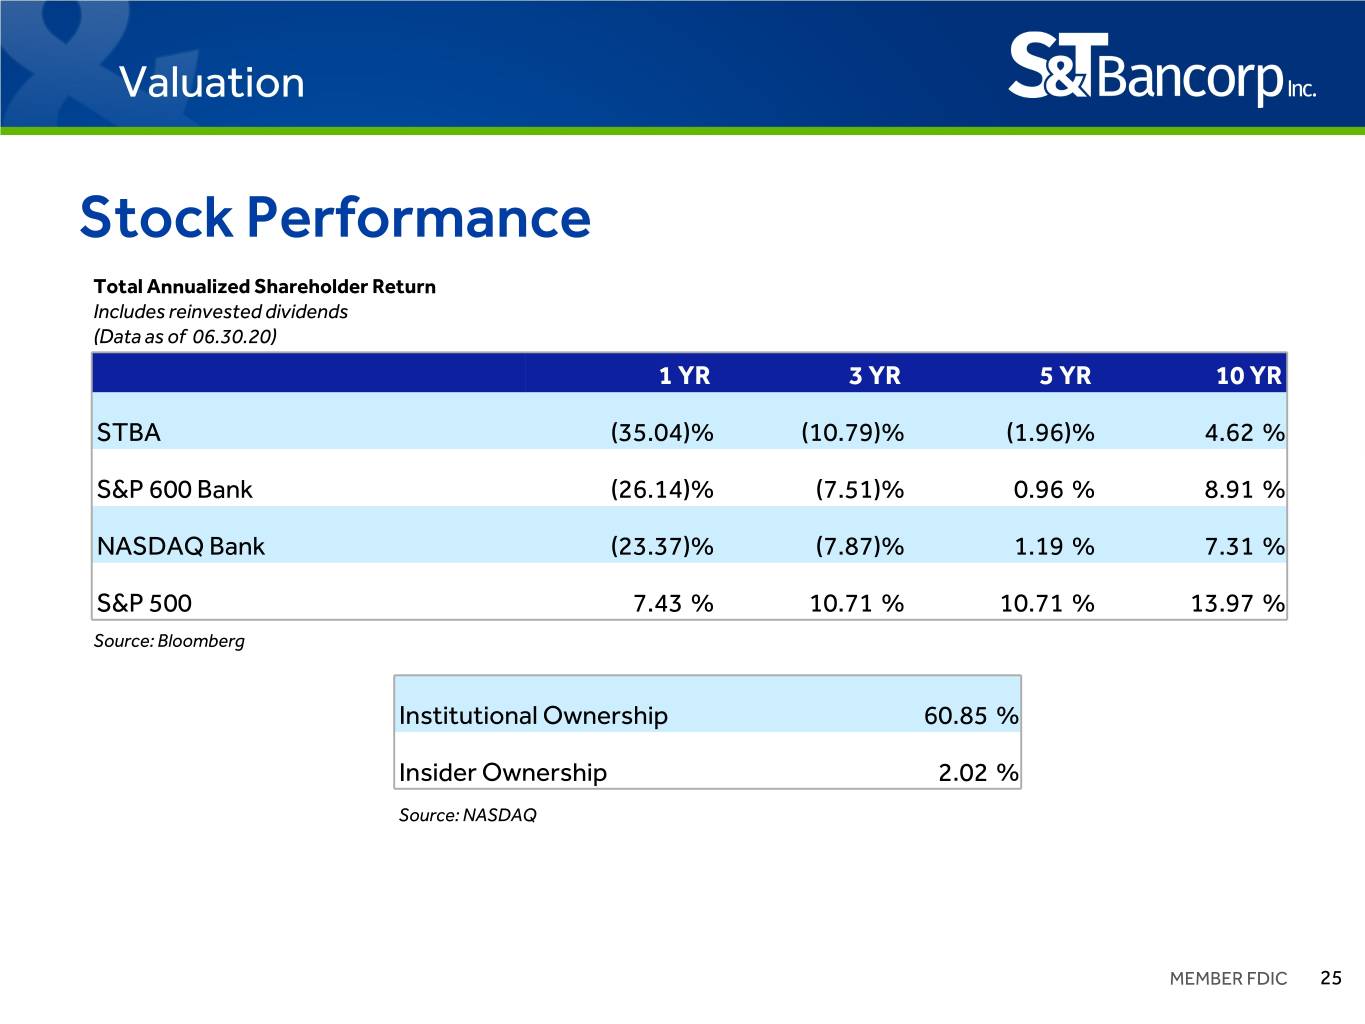
Valuation Stock Performance Total Annualized Shareholder Return Includes reinvested dividends (Data as of 06.30.20) 1 YR 3 YR 5 YR 10 YR STBA (35.04) % (10.79) % (1.96) % 4.62 % S&P 600 Bank (26.14) % (7.51) % 0.96 % 8.91 % NASDAQ Bank (23.37) % (7.87) % 1.19 % 7.31 % S&P 500 7.43 % 10.71 % 10.71 % 13.97 % Source: Bloomberg Institutional Ownership 60.85 % Insider Ownership 2.02 % Source: NASDAQ MEMBER FDIC 25
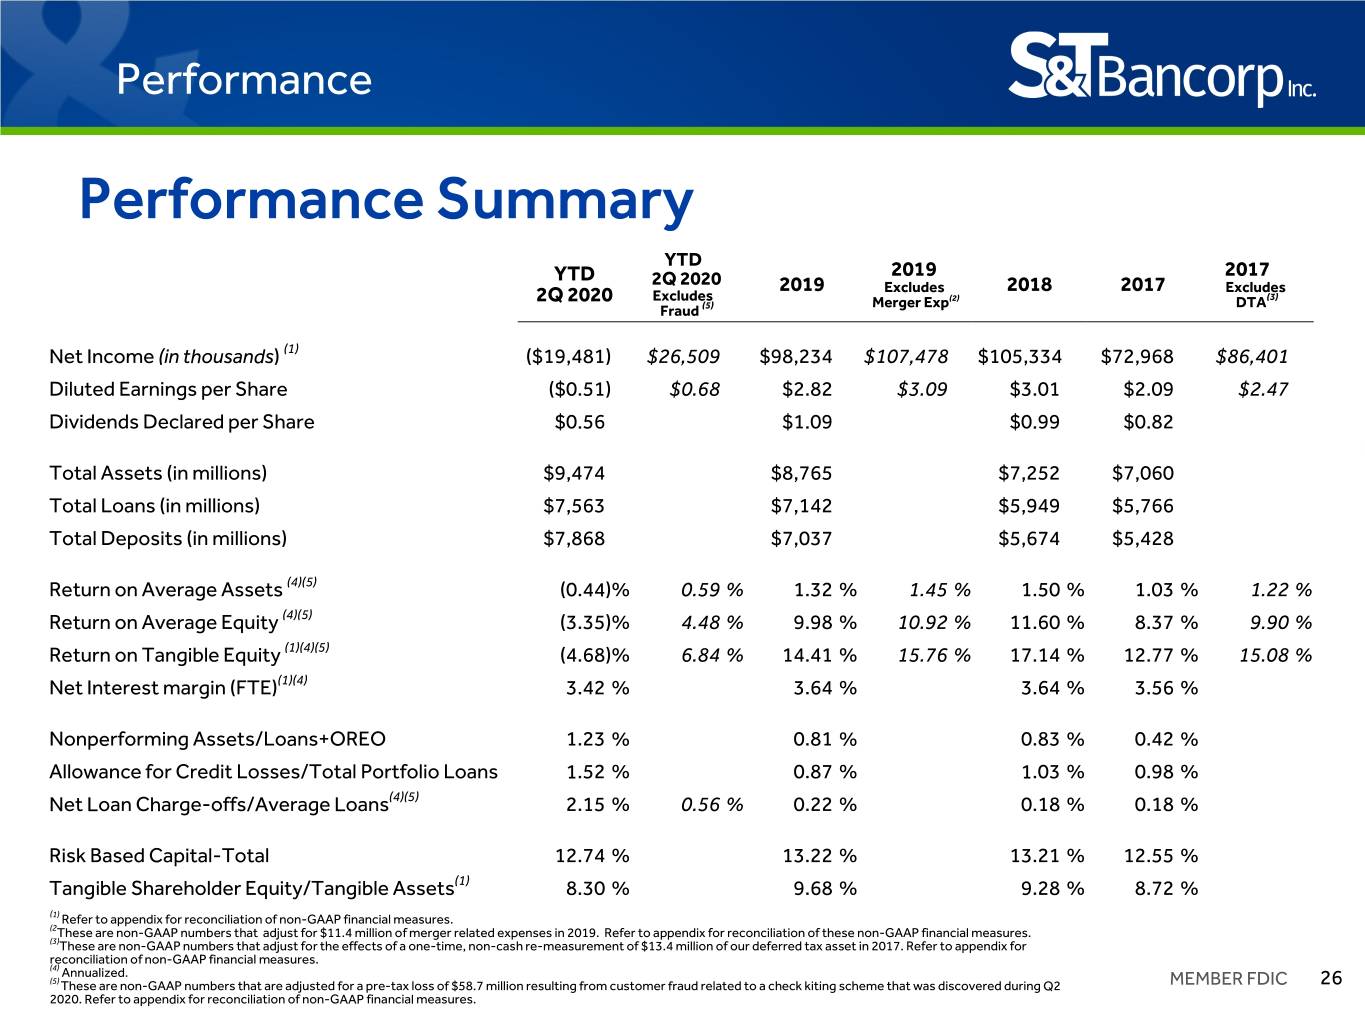
Performance Performance Summary YTD YTD 2019 2017 2Q 2020 2019 Excludes 2018 2017 Excludes Excludes (2) (3) 2Q 2020 (5) Merger Exp DTA Fraud Net Income (in thousands) (1) ($19,481) $26,509 $98,234 $107,478 $105,334 $72,968 $86,401 Diluted Earnings per Share ($0.51) $0.68 $2.82 $3.09 $3.01 $2.09 $2.47 Dividends Declared per Share $0.56 $1.09 $0.99 $0.82 Total Assets (in millions) $9,474 $8,765 $7,252 $7,060 Total Loans (in millions) $7,563 $7,142 $5,949 $5,766 Total Deposits (in millions) $7,868 $7,037 $5,674 $5,428 Return on Average Assets (4)(5) (0.44) % 0.59 % 1.32 % 1.45 % 1.50 % 1.03 % 1.22 % Return on Average Equity (4)(5) (3.35) % 4.48 % 9.98 % 10.92 % 11.60 % 8.37 % 9.90 % Return on Tangible Equity (1)(4)(5) (4.68) % 6.84 % 14.41 % 15.76 % 17.14 % 12.77 % 15.08 % Net Interest margin (FTE)(1)(4) 3.42 % 3.64 % 3.64 % 3.56 % Nonperforming Assets/Loans+OREO 1.23 % 0.81 % 0.83 % 0.42 % Allowance for Credit Losses/Total Portfolio Loans 1.52 % 0.87 % 1.03 % 0.98 % Net Loan Charge-offs/Average Loans(4)(5) 2.15 % 0.56 % 0.22 % 0.18 % 0.18 % Risk Based Capital-Total 12.74 % 13.22 % 13.21 % 12.55 % Tangible Shareholder Equity/Tangible Assets(1) 8.30 % 9.68 % 9.28 % 8.72 % (1) Refer to appendix for reconciliation of non-GAAP financial measures. (2These are non-GAAP numbers that adjust for $11.4 million of merger related expenses in 2019. Refer to appendix for reconciliation of these non-GAAP financial measures. (3)These are non-GAAP numbers that adjust for the effects of a one-time, non-cash re-measurement of $13.4 million of our deferred tax asset in 2017. Refer to appendix for reconciliation of non-GAAP financial measures. (4) Annualized. (5) These are non-GAAP numbers that are adjusted for a pre-tax loss of $58.7 million resulting from customer fraud related to a check kiting scheme that was discovered during Q2 MEMBER FDIC 26 2020. Refer to appendix for reconciliation of non-GAAP financial measures.
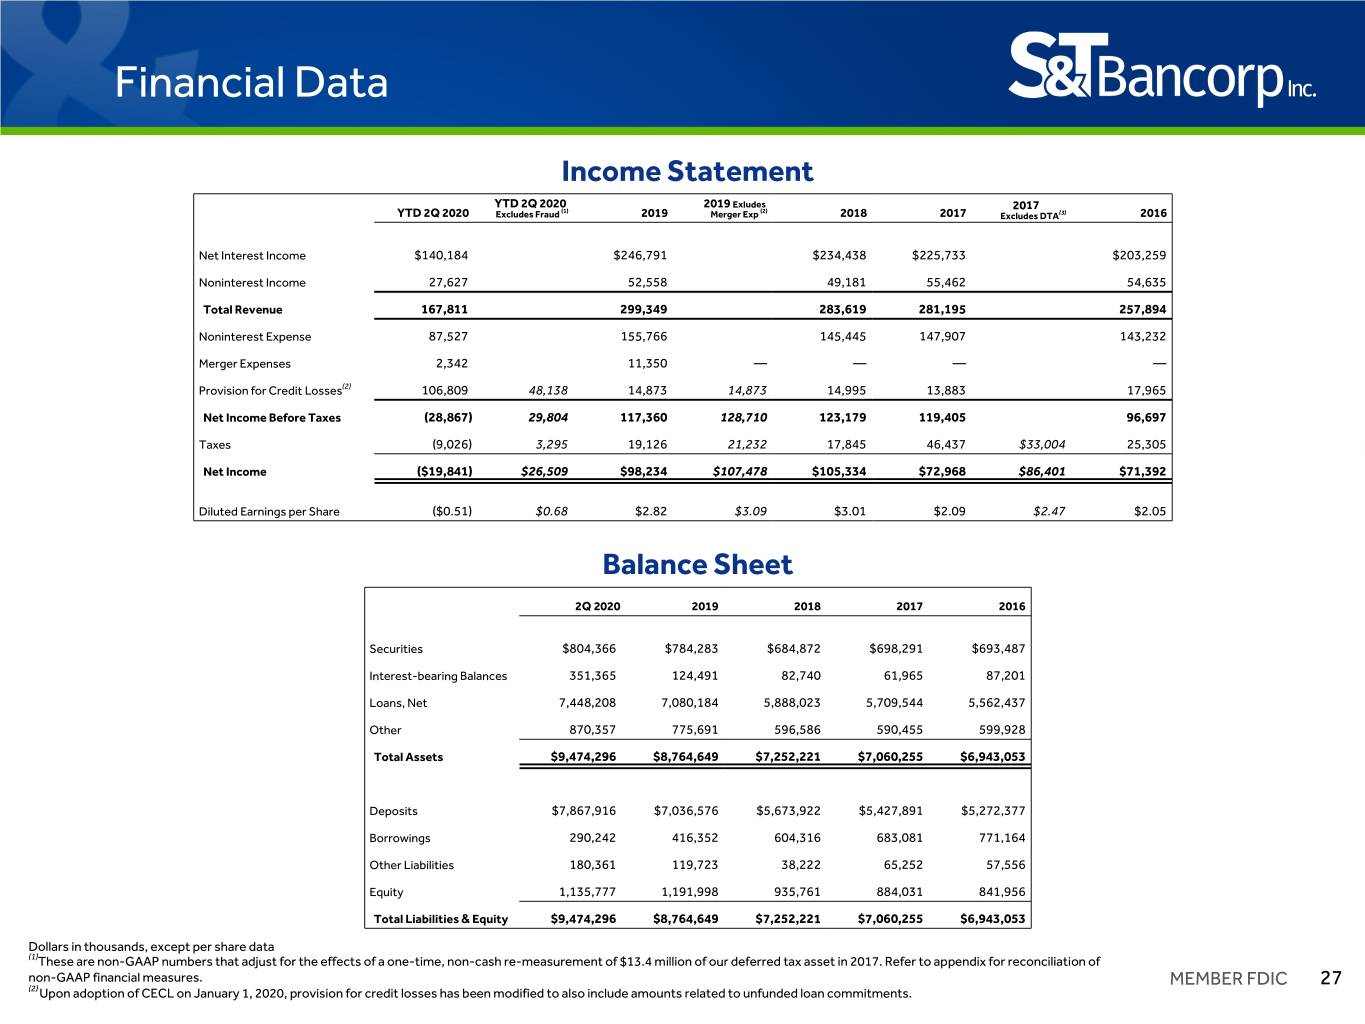
Financial Data Income Statement YTD 2Q 2020 2019 Exludes (1) (2) 2017 YTD 2Q 2020 Excludes Fraud 2019 Merger Exp 2018 2017 Excludes DTA(3) 2016 Net Interest Income $140,184 $246,791 $234,438 $225,733 $203,259 Noninterest Income 27,627 52,558 49,181 55,462 54,635 Total Revenue 167,811 299,349 283,619 281,195 257,894 Noninterest Expense 87,527 155,766 145,445 147,907 143,232 Merger Expenses 2,342 11,350 — — — — Provision for Credit Losses(2) 106,809 48,138 14,873 14,873 14,995 13,883 17,965 Net Income Before Taxes (28,867) 29,804 117,360 128,710 123,179 119,405 96,697 Taxes (9,026) 3,295 19,126 21,232 17,845 46,437 $33,004 25,305 Net Income ($19,841) $26,509 $98,234 $107,478 $105,334 $72,968 $86,401 $71,392 Diluted Earnings per Share ($0.51) $0.68 $2.82 $3.09 $3.01 $2.09 $2.47 $2.05 Balance Sheet 2Q 2020 2019 2018 2017 2016 Securities $804,366 $784,283 $684,872 $698,291 $693,487 Interest-bearing Balances 351,365 124,491 82,740 61,965 87,201 Loans, Net 7,448,208 7,080,184 5,888,023 5,709,544 5,562,437 Other 870,357 775,691 596,586 590,455 599,928 Total Assets $9,474,296 $8,764,649 $7,252,221 $7,060,255 $6,943,053 Deposits $7,867,916 $7,036,576 $5,673,922 $5,427,891 $5,272,377 Borrowings 290,242 416,352 604,316 683,081 771,164 Other Liabilities 180,361 119,723 38,222 65,252 57,556 Equity 1,135,777 1,191,998 935,761 884,031 841,956 Total Liabilities & Equity $9,474,296 $8,764,649 $7,252,221 $7,060,255 $6,943,053 Dollars in thousands, except per share data (1)These are non-GAAP numbers that adjust for the effects of a one-time, non-cash re-measurement of $13.4 million of our deferred tax asset in 2017. Refer to appendix for reconciliation of non-GAAP financial measures. MEMBER FDIC 27 (2) Upon adoption of CECL on January 1, 2020, provision for credit losses has been modified to also include amounts related to unfunded loan commitments.
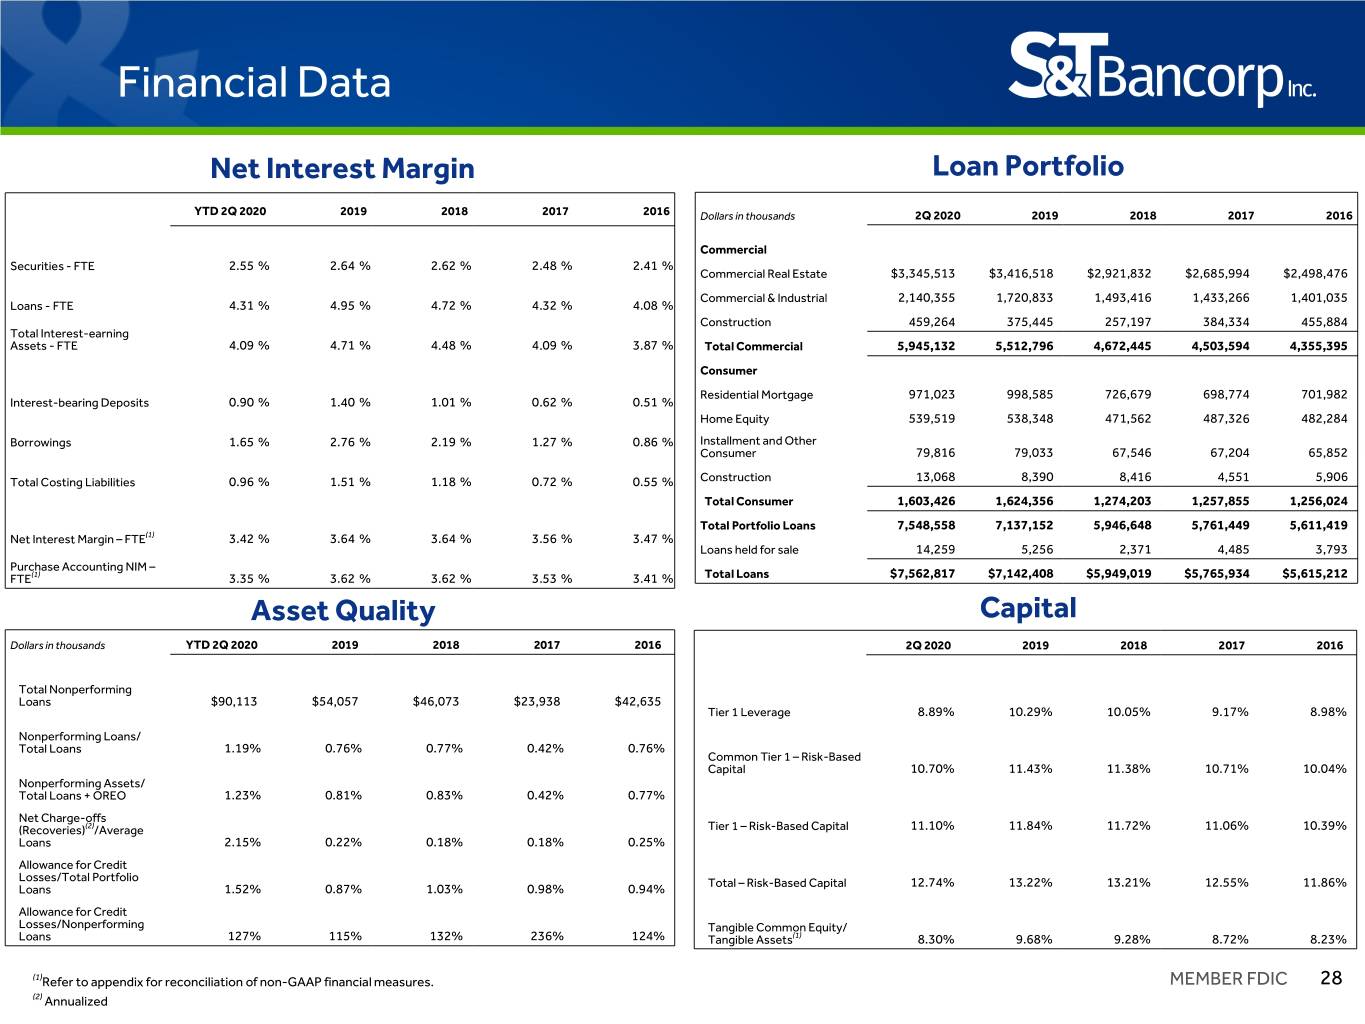
Financial Data Net Interest Margin Loan Portfolio YTD 2Q 2020 2019 2018 2017 2016 Dollars in thousands 2Q 2020 2019 2018 2017 2016 Commercial Securities - FTE 2.55 % 2.64 % 2.62 % 2.48 % 2.41 % Commercial Real Estate $3,345,513 $3,416,518 $2,921,832 $2,685,994 $2,498,476 Commercial & Industrial 2,140,355 1,720,833 1,493,416 1,433,266 1,401,035 Loans - FTE 4.31 % 4.95 % 4.72 % 4.32 % 4.08 % Construction 459,264 375,445 257,197 384,334 455,884 Total Interest-earning Assets - FTE 4.09 % 4.71 % 4.48 % 4.09 % 3.87 % Total Commercial 5,945,132 5,512,796 4,672,445 4,503,594 4,355,395 Consumer Residential Mortgage 971,023 998,585 726,679 698,774 701,982 Interest-bearing Deposits 0.90 % 1.40 % 1.01 % 0.62 % 0.51 % Home Equity 539,519 538,348 471,562 487,326 482,284 Borrowings 1.65 % 2.76 % 2.19 % 1.27 % 0.86 % Installment and Other Consumer 79,816 79,033 67,546 67,204 65,852 Total Costing Liabilities 0.96 % 1.51 % 1.18 % 0.72 % 0.55 % Construction 13,068 8,390 8,416 4,551 5,906 Total Consumer 1,603,426 1,624,356 1,274,203 1,257,855 1,256,024 Total Portfolio Loans 7,548,558 7,137,152 5,946,648 5,761,449 5,611,419 Net Interest Margin – FTE(1) 3.42 % 3.64 % 3.64 % 3.56 % 3.47 % Loans held for sale 14,259 5,256 2,371 4,485 3,793 Purchase Accounting NIM – FTE(1) 3.35 % 3.62 % 3.62 % 3.53 % 3.41 % Total Loans $7,562,817 $7,142,408 $5,949,019 $5,765,934 $5,615,212 Asset Quality Capital Dollars in thousands YTD 2Q 2020 2019 2018 2017 2016 2Q 2020 2019 2018 2017 2016 Total Nonperforming Loans $90,113 $54,057 $46,073 $23,938 $42,635 Tier 1 Leverage 8.89 % 10.29 % 10.05 % 9.17 % 8.98 % Nonperforming Loans/ Total Loans 1.19 % 0.76 % 0.77 % 0.42 % 0.76 % Common Tier 1 – Risk-Based Capital 10.70 % 11.43 % 11.38 % 10.71 % 10.04 % Nonperforming Assets/ Total Loans + OREO 1.23 % 0.81 % 0.83 % 0.42 % 0.77 % Net Charge-offs (Recoveries)(2)/Average Tier 1 – Risk-Based Capital 11.10 % 11.84 % 11.72 % 11.06 % 10.39 % Loans 2.15 % 0.22 % 0.18 % 0.18 % 0.25 % Allowance for Credit Losses/Total Portfolio Total – Risk-Based Capital 12.74 % 13.22 % 13.21 % 12.55 % 11.86 % Loans 1.52 % 0.87 % 1.03 % 0.98 % 0.94 % Allowance for Credit Losses/Nonperforming Tangible Common Equity/ Loans 127 % 115 % 132 % 236 % 124 % Tangible Assets(1) 8.30 % 9.68 % 9.28 % 8.72 % 8.23 % (1)Refer to appendix for reconciliation of non-GAAP financial measures. MEMBER FDIC 28 (2) Annualized
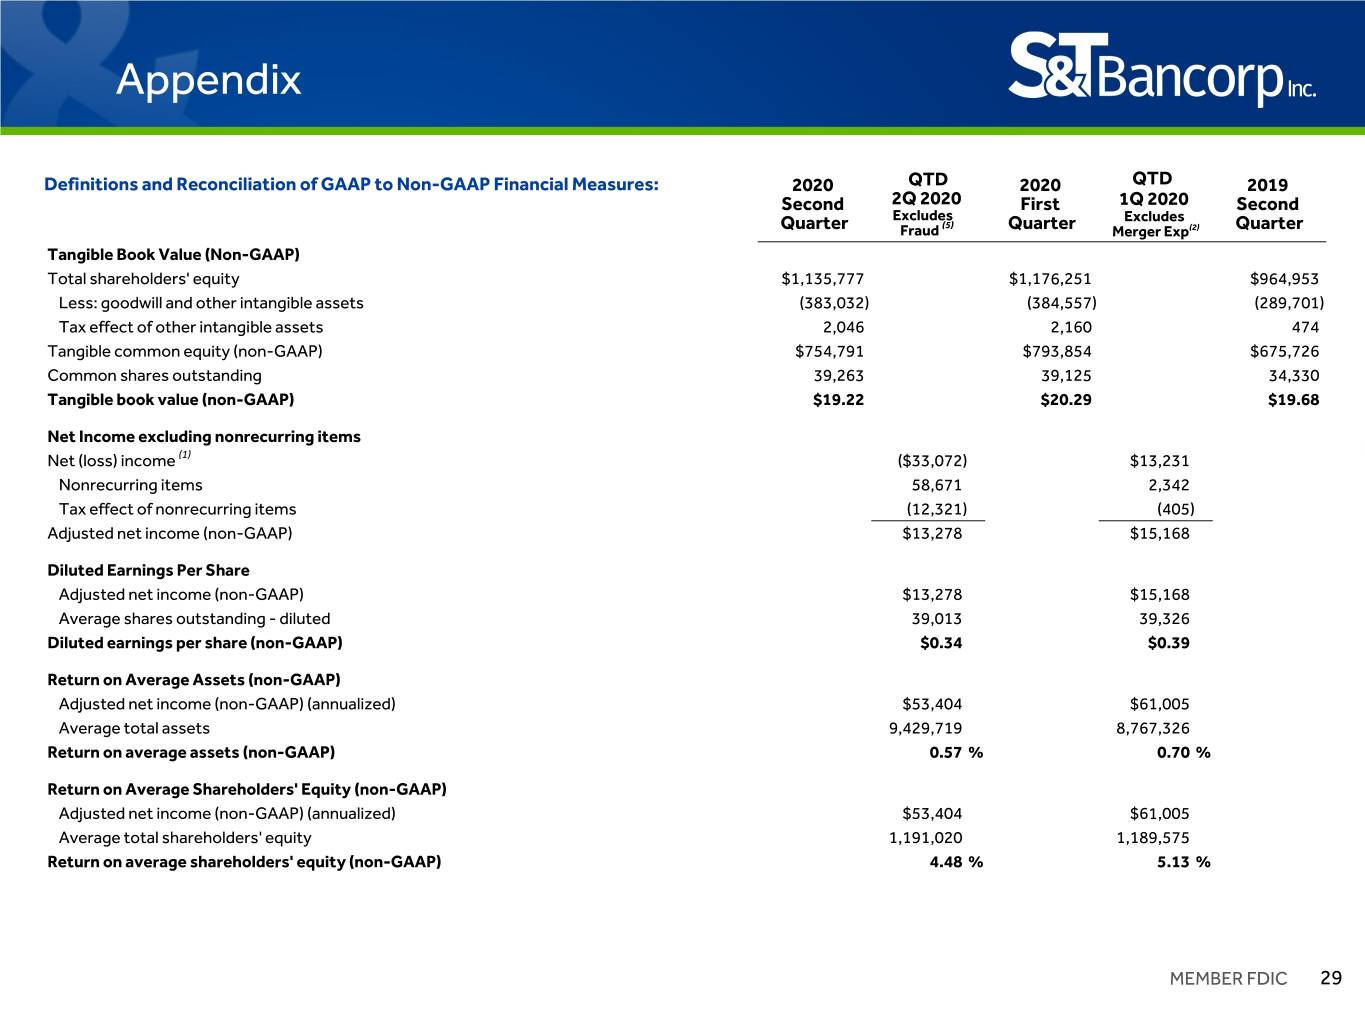
Appendix Definitions and Reconciliation of GAAP to Non-GAAP Financial Measures: 2020 QTD 2020 QTD 2019 Second 2Q 2020 First 1Q 2020 Second Excludes Excludes Quarter Fraud (5) Quarter Merger Exp(2) Quarter Tangible Book Value (Non-GAAP) Total shareholders' equity $1,135,777 $1,176,251 $964,953 Less: goodwill and other intangible assets (383,032) (384,557) (289,701) Tax effect of other intangible assets 2,046 2,160 474 Tangible common equity (non-GAAP) $754,791 $793,854 $675,726 Common shares outstanding 39,263 39,125 34,330 Tangible book value (non-GAAP) $19.22 $20.29 $19.68 Net Income excluding nonrecurring items Net (loss) income (1) ($33,072) $13,231 Nonrecurring items 58,671 2,342 Tax effect of nonrecurring items (12,321) (405) Adjusted net income (non-GAAP) $13,278 $15,168 Diluted Earnings Per Share Adjusted net income (non-GAAP) $13,278 $15,168 Average shares outstanding - diluted 39,013 39,326 Diluted earnings per share (non-GAAP) $0.34 $0.39 Return on Average Assets (non-GAAP) Adjusted net income (non-GAAP) (annualized) $53,404 $61,005 Average total assets 9,429,719 8,767,326 Return on average assets (non-GAAP) 0.57 % 0.70 % Return on Average Shareholders' Equity (non-GAAP) Adjusted net income (non-GAAP) (annualized) $53,404 $61,005 Average total shareholders' equity 1,191,020 1,189,575 Return on average shareholders' equity (non-GAAP) 4.48 % 5.13 % MEMBER FDIC 29
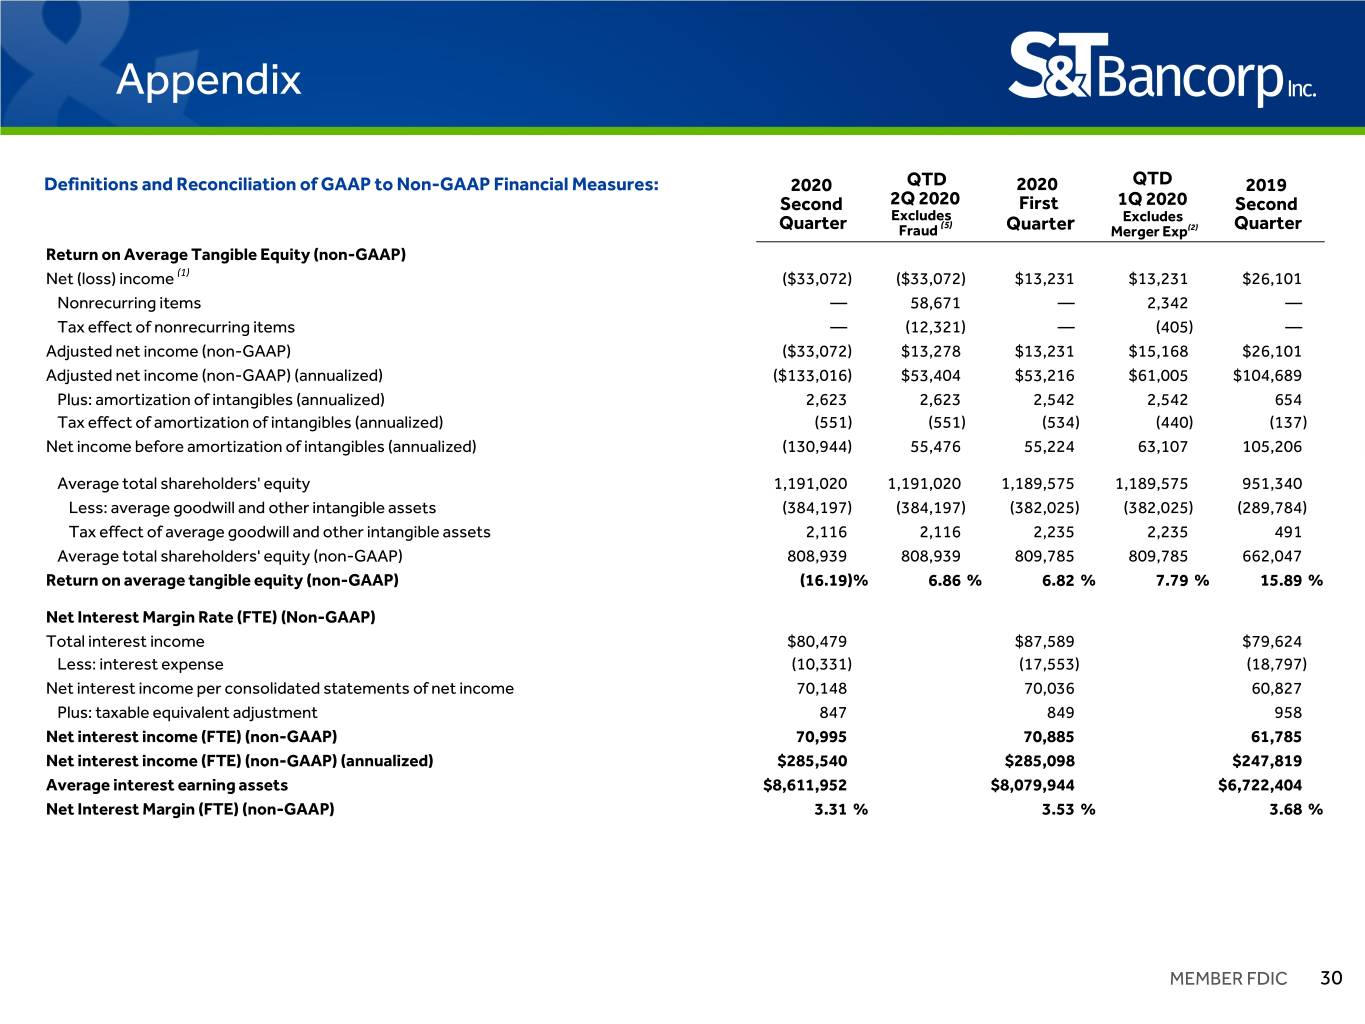
Appendix Definitions and Reconciliation of GAAP to Non-GAAP Financial Measures: 2020 QTD 2020 QTD 2019 Second 2Q 2020 First 1Q 2020 Second Excludes Excludes Quarter Fraud (5) Quarter Merger Exp(2) Quarter Return on Average Tangible Equity (non-GAAP) Net (loss) income (1) ($33,072) ($33,072) $13,231 $13,231 $26,101 Nonrecurring items — 58,671 — 2,342 — Tax effect of nonrecurring items — (12,321) — (405) — Adjusted net income (non-GAAP) ($33,072) $13,278 $13,231 $15,168 $26,101 Adjusted net income (non-GAAP) (annualized) ($133,016) $53,404 $53,216 $61,005 $104,689 Plus: amortization of intangibles (annualized) 2,623 2,623 2,542 2,542 654 Tax effect of amortization of intangibles (annualized) (551) (551) (534) (440) (137) Net income before amortization of intangibles (annualized) (130,944) 55,476 55,224 63,107 105,206 Average total shareholders' equity 1,191,020 1,191,020 1,189,575 1,189,575 951,340 Less: average goodwill and other intangible assets (384,197) (384,197) (382,025) (382,025) (289,784) Tax effect of average goodwill and other intangible assets 2,116 2,116 2,235 2,235 491 Average total shareholders' equity (non-GAAP) 808,939 808,939 809,785 809,785 662,047 Return on average tangible equity (non-GAAP) (16.19) % 6.86 % 6.82 % 7.79 % 15.89 % Net Interest Margin Rate (FTE) (Non-GAAP) Total interest income $80,479 $87,589 $79,624 Less: interest expense (10,331) (17,553) (18,797) Net interest income per consolidated statements of net income 70,148 70,036 60,827 Plus: taxable equivalent adjustment 847 849 958 Net interest income (FTE) (non-GAAP) 70,995 70,885 61,785 Net interest income (FTE) (non-GAAP) (annualized) $285,540 $285,098 $247,819 Average interest earning assets $8,611,952 $8,079,944 $6,722,404 Net Interest Margin (FTE) (non-GAAP) 3.31 % 3.53 % 3.68 % MEMBER FDIC 30
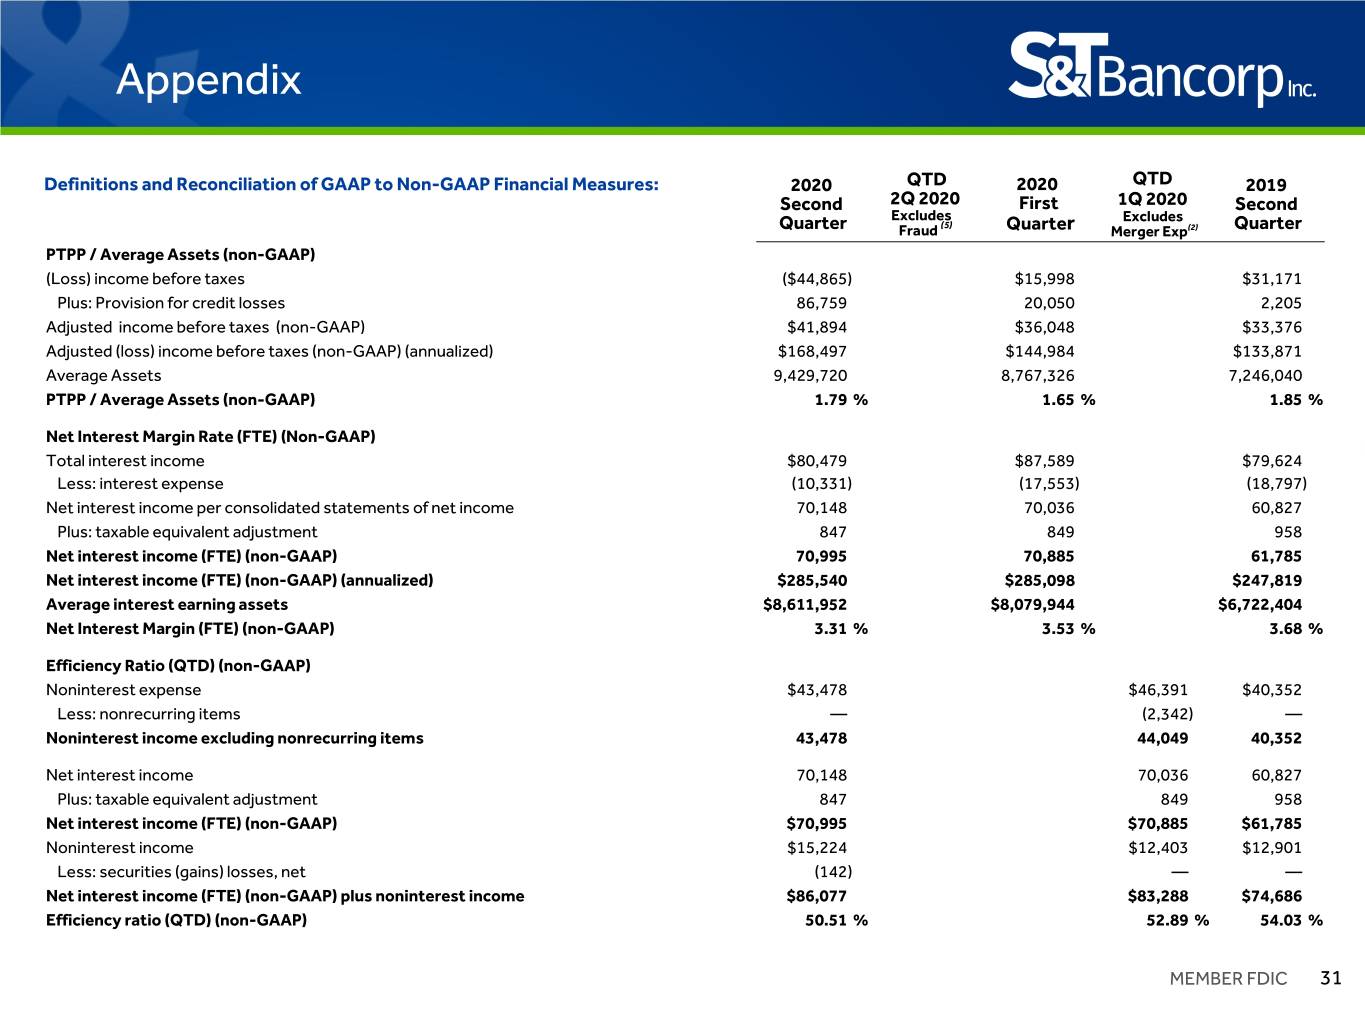
Appendix Definitions and Reconciliation of GAAP to Non-GAAP Financial Measures: 2020 QTD 2020 QTD 2019 Second 2Q 2020 First 1Q 2020 Second Excludes Excludes Quarter Fraud (5) Quarter Merger Exp(2) Quarter PTPP / Average Assets (non-GAAP) (Loss) income before taxes ($44,865) $15,998 $31,171 Plus: Provision for credit losses 86,759 20,050 2,205 Adjusted income before taxes (non-GAAP) $41,894 $36,048 $33,376 Adjusted (loss) income before taxes (non-GAAP) (annualized) $168,497 $144,984 $133,871 Average Assets 9,429,720 8,767,326 7,246,040 PTPP / Average Assets (non-GAAP) 1.79 % 1.65 % 1.85 % Net Interest Margin Rate (FTE) (Non-GAAP) Total interest income $80,479 $87,589 $79,624 Less: interest expense (10,331) (17,553) (18,797) Net interest income per consolidated statements of net income 70,148 70,036 60,827 Plus: taxable equivalent adjustment 847 849 958 Net interest income (FTE) (non-GAAP) 70,995 70,885 61,785 Net interest income (FTE) (non-GAAP) (annualized) $285,540 $285,098 $247,819 Average interest earning assets $8,611,952 $8,079,944 $6,722,404 Net Interest Margin (FTE) (non-GAAP) 3.31 % 3.53 % 3.68 % Efficiency Ratio (QTD) (non-GAAP) Noninterest expense $43,478 $46,391 $40,352 Less: nonrecurring items — (2,342) — Noninterest income excluding nonrecurring items 43,478 44,049 40,352 Net interest income 70,148 70,036 60,827 Plus: taxable equivalent adjustment 847 849 958 Net interest income (FTE) (non-GAAP) $70,995 $70,885 $61,785 Noninterest income $15,224 $12,403 $12,901 Less: securities (gains) losses, net (142) — — Net interest income (FTE) (non-GAAP) plus noninterest income $86,077 $83,288 $74,686 Efficiency ratio (QTD) (non-GAAP) 50.51 % 52.89 % 54.03 % MEMBER FDIC 31
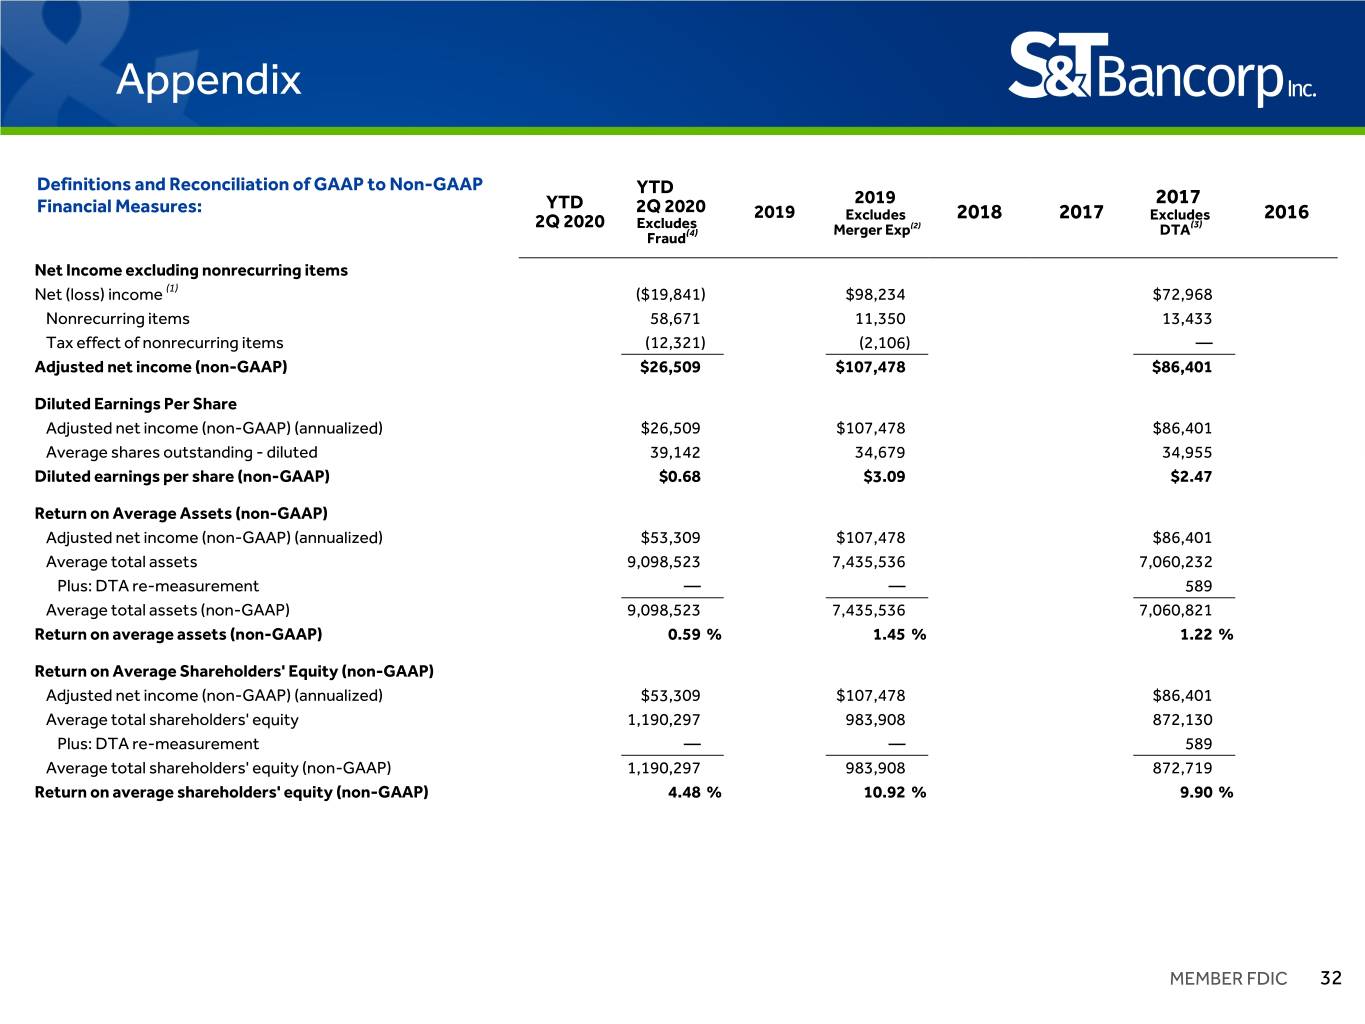
Appendix Definitions and Reconciliation of GAAP to Non-GAAP YTD YTD 2019 2017 Financial Measures: 2Q 2020 2019 Excludes 2018 2017 Excludes 2016 2Q 2020 Excludes (2) (3) (4) Merger Exp DTA Fraud Net Income excluding nonrecurring items Net (loss) income (1) ($19,841) $98,234 $72,968 Nonrecurring items 58,671 11,350 13,433 Tax effect of nonrecurring items (12,321) (2,106) — Adjusted net income (non-GAAP) $26,509 $107,478 $86,401 Diluted Earnings Per Share Adjusted net income (non-GAAP) (annualized) $26,509 $107,478 $86,401 Average shares outstanding - diluted 39,142 34,679 34,955 Diluted earnings per share (non-GAAP) $0.68 $3.09 $2.47 Return on Average Assets (non-GAAP) Adjusted net income (non-GAAP) (annualized) $53,309 $107,478 $86,401 Average total assets 9,098,523 7,435,536 7,060,232 Plus: DTA re-measurement — — 589 Average total assets (non-GAAP) 9,098,523 7,435,536 7,060,821 Return on average assets (non-GAAP) 0.59 % 1.45 % 1.22 % Return on Average Shareholders' Equity (non-GAAP) Adjusted net income (non-GAAP) (annualized) $53,309 $107,478 $86,401 Average total shareholders' equity 1,190,297 983,908 872,130 Plus: DTA re-measurement — — 589 Average total shareholders' equity (non-GAAP) 1,190,297 983,908 872,719 Return on average shareholders' equity (non-GAAP) 4.48 % 10.92 % 9.90 % MEMBER FDIC 32
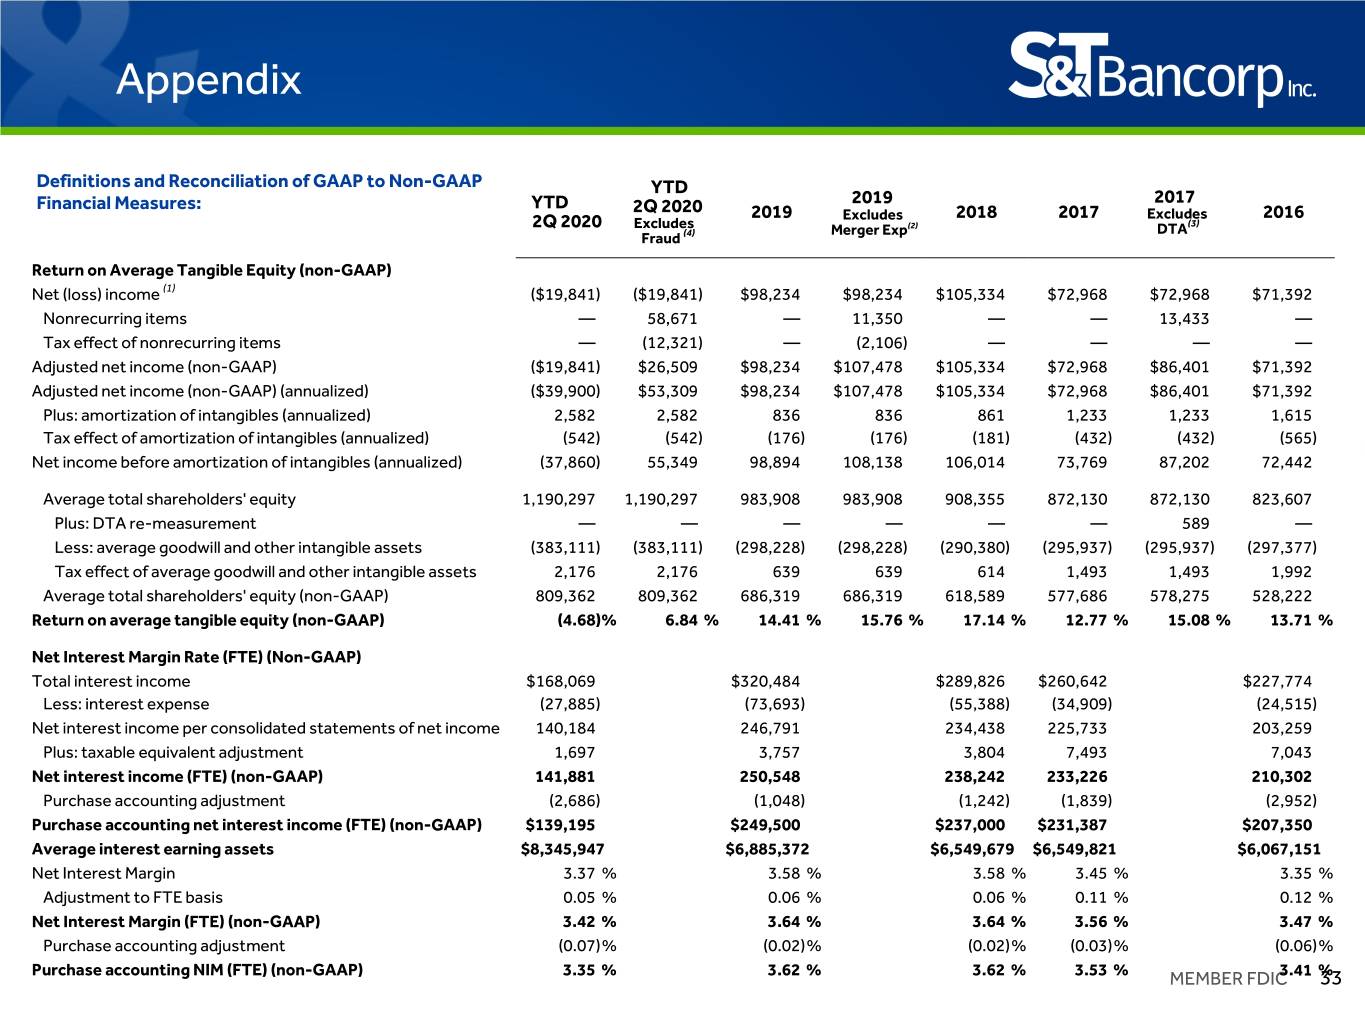
Appendix Definitions and Reconciliation of GAAP to Non-GAAP YTD Financial Measures: YTD 2019 2017 2Q 2020 2019 Excludes 2018 2017 Excludes 2016 2Q 2020 Excludes (2) (3) (4) Merger Exp DTA Fraud Return on Average Tangible Equity (non-GAAP) Net (loss) income (1) ($19,841) ($19,841) $98,234 $98,234 $105,334 $72,968 $72,968 $71,392 Nonrecurring items — 58,671 — 11,350 — — 13,433 — Tax effect of nonrecurring items — (12,321) — (2,106) — — — — Adjusted net income (non-GAAP) ($19,841) $26,509 $98,234 $107,478 $105,334 $72,968 $86,401 $71,392 Adjusted net income (non-GAAP) (annualized) ($39,900) $53,309 $98,234 $107,478 $105,334 $72,968 $86,401 $71,392 Plus: amortization of intangibles (annualized) 2,582 2,582 836 836 861 1,233 1,233 1,615 Tax effect of amortization of intangibles (annualized) (542) (542) (176) (176) (181) (432) (432) (565) Net income before amortization of intangibles (annualized) (37,860) 55,349 98,894 108,138 106,014 73,769 87,202 72,442 Average total shareholders' equity 1,190,297 1,190,297 983,908 983,908 908,355 872,130 872,130 823,607 Plus: DTA re-measurement — — — — — — 589 — Less: average goodwill and other intangible assets (383,111) (383,111) (298,228) (298,228) (290,380) (295,937) (295,937) (297,377) Tax effect of average goodwill and other intangible assets 2,176 2,176 639 639 614 1,493 1,493 1,992 Average total shareholders' equity (non-GAAP) 809,362 809,362 686,319 686,319 618,589 577,686 578,275 528,222 Return on average tangible equity (non-GAAP) (4.68) % 6.84 % 14.41 % 15.76 % 17.14 % 12.77 % 15.08 % 13.71 % Net Interest Margin Rate (FTE) (Non-GAAP) Total interest income $168,069 $320,484 $289,826 $260,642 $227,774 Less: interest expense (27,885) (73,693) (55,388) (34,909) (24,515) Net interest income per consolidated statements of net income 140,184 246,791 234,438 225,733 203,259 Plus: taxable equivalent adjustment 1,697 3,757 3,804 7,493 7,043 Net interest income (FTE) (non-GAAP) 141,881 250,548 238,242 233,226 210,302 Purchase accounting adjustment (2,686) (1,048) (1,242) (1,839) (2,952) Purchase accounting net interest income (FTE) (non-GAAP) $139,195 $249,500 $237,000 $231,387 $207,350 Average interest earning assets $8,345,947 $6,885,372 $6,549,679 $6,549,821 $6,067,151 Net Interest Margin 3.37 % 3.58 % 3.58 % 3.45 % 3.35 % Adjustment to FTE basis 0.05 % 0.06 % 0.06 % 0.11 % 0.12 % Net Interest Margin (FTE) (non-GAAP) 3.42 % 3.64 % 3.64 % 3.56 % 3.47 % Purchase accounting adjustment (0.07) % (0.02) % (0.02) % (0.03) % (0.06) % Purchase accounting NIM (FTE) (non-GAAP) 3.35 % 3.62 % 3.62 % 3.53 % MEMBER FDIC 3.41 %33
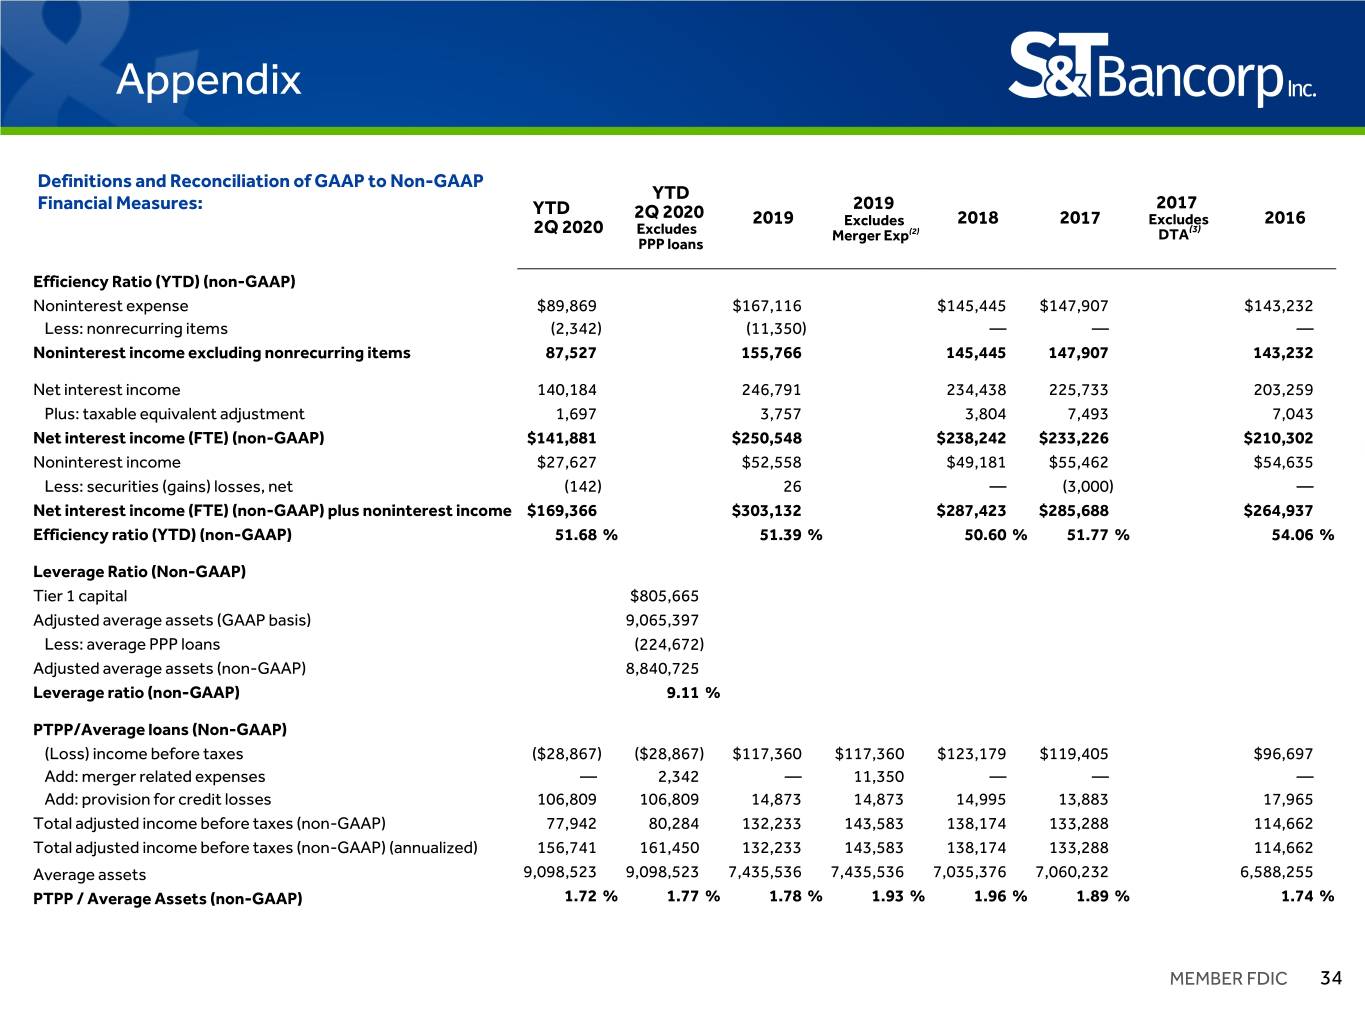
Appendix Definitions and Reconciliation of GAAP to Non-GAAP YTD Financial Measures: YTD 2019 2017 2Q 2020 2019 Excludes 2018 2017 Excludes 2016 2Q 2020 Excludes Merger Exp(2) DTA(3) PPP loans Efficiency Ratio (YTD) (non-GAAP) Noninterest expense $89,869 $167,116 $145,445 $147,907 $143,232 Less: nonrecurring items (2,342) (11,350) — — — Noninterest income excluding nonrecurring items 87,527 155,766 145,445 147,907 143,232 Net interest income 140,184 246,791 234,438 225,733 203,259 Plus: taxable equivalent adjustment 1,697 3,757 3,804 7,493 7,043 Net interest income (FTE) (non-GAAP) $141,881 $250,548 $238,242 $233,226 $210,302 Noninterest income $27,627 $52,558 $49,181 $55,462 $54,635 Less: securities (gains) losses, net (142) 26 — (3,000) — Net interest income (FTE) (non-GAAP) plus noninterest income $169,366 $303,132 $287,423 $285,688 $264,937 Efficiency ratio (YTD) (non-GAAP) 51.68 % 51.39 % 50.60 % 51.77 % 54.06 % Leverage Ratio (Non-GAAP) Tier 1 capital $805,665 Adjusted average assets (GAAP basis) 9,065,397 Less: average PPP loans (224,672) Adjusted average assets (non-GAAP) 8,840,725 Leverage ratio (non-GAAP) 9.11 % PTPP/Average loans (Non-GAAP) (Loss) income before taxes ($28,867) ($28,867) $117,360 $117,360 $123,179 $119,405 $96,697 Add: merger related expenses — 2,342 — 11,350 — — — Add: provision for credit losses 106,809 106,809 14,873 14,873 14,995 13,883 17,965 Total adjusted income before taxes (non-GAAP) 77,942 80,284 132,233 143,583 138,174 133,288 114,662 Total adjusted income before taxes (non-GAAP) (annualized) 156,741 161,450 132,233 143,583 138,174 133,288 114,662 Average assets 9,098,523 9,098,523 7,435,536 7,435,536 7,035,376 7,060,232 6,588,255 PTPP / Average Assets (non-GAAP) 1.72 % 1.77 % 1.78 % 1.93 % 1.96 % 1.89 % 1.74 % MEMBER FDIC 34
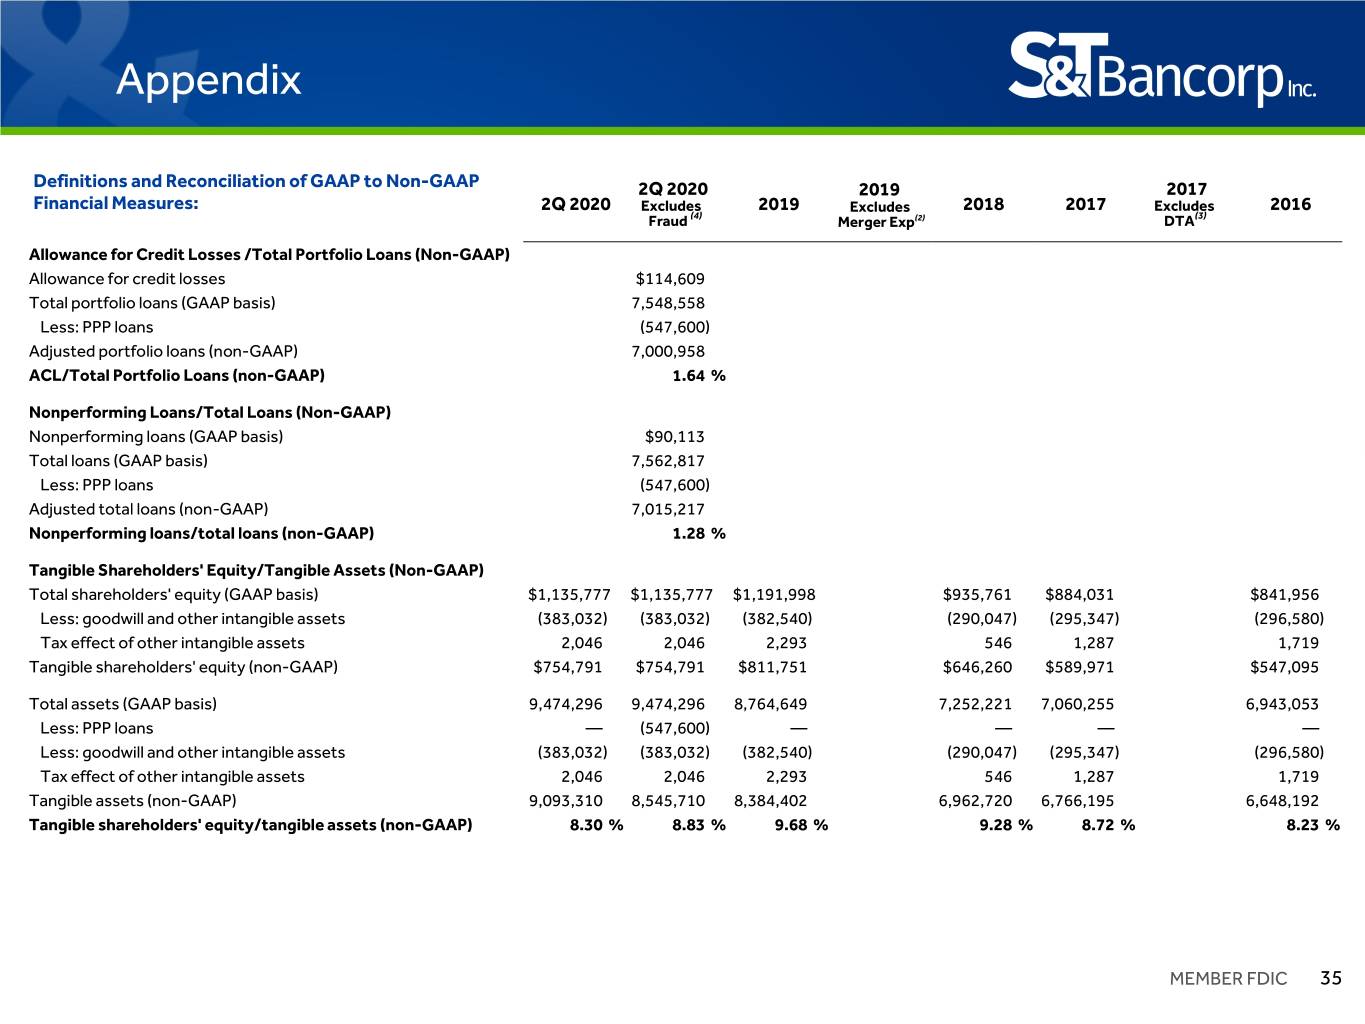
Appendix Definitions and Reconciliation of GAAP to Non-GAAP 2Q 2020 2019 2017 Financial Measures: 2Q 2020 Excludes 2019 Excludes 2018 2017 Excludes 2016 Fraud (4) Merger Exp(2) DTA(3) Allowance for Credit Losses /Total Portfolio Loans (Non-GAAP) Allowance for credit losses $114,609 Total portfolio loans (GAAP basis) 7,548,558 Less: PPP loans (547,600) Adjusted portfolio loans (non-GAAP) 7,000,958 ACL/Total Portfolio Loans (non-GAAP) 1.64 % Nonperforming Loans/Total Loans (Non-GAAP) Nonperforming loans (GAAP basis) $90,113 Total loans (GAAP basis) 7,562,817 Less: PPP loans (547,600) Adjusted total loans (non-GAAP) 7,015,217 Nonperforming loans/total loans (non-GAAP) 1.28 % Tangible Shareholders' Equity/Tangible Assets (Non-GAAP) Total shareholders' equity (GAAP basis) $1,135,777 $1,135,777 $1,191,998 $935,761 $884,031 $841,956 Less: goodwill and other intangible assets (383,032) (383,032) (382,540) (290,047) (295,347) (296,580) Tax effect of other intangible assets 2,046 2,046 2,293 546 1,287 1,719 Tangible shareholders' equity (non-GAAP) $754,791 $754,791 $811,751 $646,260 $589,971 $547,095 Total assets (GAAP basis) 9,474,296 9,474,296 8,764,649 7,252,221 7,060,255 6,943,053 Less: PPP loans — (547,600) — — — — Less: goodwill and other intangible assets (383,032) (383,032) (382,540) (290,047) (295,347) (296,580) Tax effect of other intangible assets 2,046 2,046 2,293 546 1,287 1,719 Tangible assets (non-GAAP) 9,093,310 8,545,710 8,384,402 6,962,720 6,766,195 6,648,192 Tangible shareholders' equity/tangible assets (non-GAAP) 8.30 % 8.83 % 9.68 % 9.28 % 8.72 % 8.23 % MEMBER FDIC 35

Second Quarter 2020 MEMBERMEMBER FDIC FDIC
